


Abstract
Objective: Depressive symptoms exist on a continuum in the general population, yet the underlying neurobiological mechanisms, particularly the interplay between resting-state networks and task-evoked social cognitive responses, remain elusive. Methods: Leveraging the Human Connectome Project (HCP) dataset, we included 867 participants. With depression scores as the independent variable and age/sex as covariates, we systematically examined associations with sleep quality, negative emotions, sensory scores, gray matter volume (GMV), fractional amplitude of low-frequency fluctuations (fALFF), multi-seed resting-state functional connectivity (rsFC), as well as brain activation and behavioral performance during working memory, emotion recognition, social cognition, relational reasoning, language comprehension, and gambling tasks. The statistical threshold was set at voxel-level p < 0.001 (uncorrected) combined with cluster-level FWE correction at p < 0.05. Results: (1) Depression scores were positively correlated with sleep disturbances, negative emotions (anger/fear), and pain. (2) In resting-state, depression scores negatively correlated with ventral striatum (VS)–cerebellum/parahippocampal gyrus/fusiform rsFC, yet positively correlated with pregenual anterior cingulate cortex (preACC)–supplementary motor area (SMA) rsFC. (3) In task-fMRI, only the social task showed a positive association with task accuracy and regional activation in bilateral pre/postcentral gyri, superior temporal gyri, left middle frontal gyrus, and SMA/paracentral lobule. Conclusions: Elevated depression scores are linked to a pattern that may reflect relative decoupling between reward and perceptual systems, along with enhanced connectivity in cognitive control circuits. Socially, high scorers exhibit a pattern suggestive of compensatory hypervigilance, accompanied by enhanced behavioral performance. This study provides multidimensional evidence for the dimensional neural representation of depressive symptoms.
1. Introduction
1.1. Background
Major depressive disorder (MDD) is one of the most prevalent psychiatric disorders worldwide, with a lifetime prevalence of approximately 6.4–10.4% [1]. Depression has been conceptualized as a categorical diagnostic entity—individuals either meet the Diagnostic and Statistical Manual of Mental Disorders (DSM) criteria or they do not. However, accumulating evidence suggests that depressive symptoms are continuously distributed in the general population, and even subclinical depressive symptoms below the diagnostic threshold are associated with significant functional impairment and reduced quality of life [2,3,4]. The neurobiological underpinnings of depression may vary gradually along the continuum of symptom severity, rather than exhibiting “all-or-none” brain network abnormalities only in the disease state [5]. Therefore, examining the correlation between depression scores and neuroimaging metrics in healthy populations can help reveal early neurobiological markers of depressive symptoms, free from confounding factors such as medication and disease course, thereby providing a unique dimensional perspective for understanding the pathogenesis of depression.
1.2. Resting-State Functional Connectivity: The Brain Network Basis of Depression
Resting-state functional magnetic resonance imaging (rs-fMRI) measures the temporal synchronization of low-frequency blood oxygen level-dependent signals in the absence of explicit tasks, reflecting intrinsic functional connectivity between different brain regions [6,7,8,9]. In recent years, functional connectomics has provided a quantitative theoretical framework and analytical tools for parsing variations in the organization and function of brain networks in depression [10,11]. A large-scale meta-analysis exhibited significant alterations in resting-state network connectivity (rsFC), including both increased and decreased connectivity within the default mode network (DMN), increased connectivity in the frontoparietal network (FPN), and increased cross-network connectivity between DMN-FPN and limbic network-DMN; however, the direction and regional specificity of resting-state network disruptions remain highly inconsistent across the existing literature [10]. The review by Sun et al. similarly emphasized the substantial heterogeneity in findings from rsFC studies of depression [12]. This inconsistency may stem from clinical heterogeneity (e.g., depression subtype differences), insufficient sample sizes, and variability in analytical methods.
In non-clinical populations with subclinical depressive symptoms, structural alterations have been reported in the hippocampus, anterior cingulate cortex, and anterior insula—regions similarly affected in MDD [13]. A multimodal meta-analysis of subthreshold depression found spatially convergent structural and functional abnormalities primarily in the left insula, along with structural atrophy and decreased functional activity in the right pallidum and thalamus [14]. For spontaneous brain activity, alterations in the fractional amplitude of low-frequency fluctuations (fALFF) have been documented in MDD across frontal–parietal regions [15], but whether fALFF changes are detectable along the dimensional continuum of depressive symptoms in non-clinical populations remains largely unexplored.
1.3. Task-Fmri: The Act of Depression on Multiple Cognitive Abilities
Beyond resting-state abnormalities, patients with depression also exhibit altered neural responses across multiple cognitive tasks. The Human Connectome Project (HCP) database includes seven task-fMRI paradigms, and these tasks provide an opportunity to systematically evaluate the neural correlates of depression scores across different cognitive domains.
Studies have demonstrated that depression impairs processing speed, attention, executive function [16,17,18] and social perception [1]. A recent review of task-fMRI in MDD has summarized functional abnormalities across three domains: executive function, negative bias, and reward processing. Deficits in executive function manifest as inefficiency in the FPN and failure to suppress the DMN during n-back and Stroop tasks; negative bias is characterized by hyperactivity in bottom-up emotional responses and failure of top-down regulation; and reward processing abnormalities are consistently associated with blunted reward prediction error signals and hypoactivation of thalamo–striatal–prefrontal circuitry [19]. However, existing studies have primarily focused on group comparisons between clinically depressed patients and healthy controls, with less attention paid to the relationship between the continuous dimension of depressive symptoms and neural responses during cognitive tasks in non-clinical samples. Moreover, no study to date has systematically compared the sensitivity of multiple cognitive task paradigms to depression scores within the same large-scale cohort, leaving unanswered which cognitive domain is most closely tied to subclinical depressive symptomatology at the neural level.
1.4. The Present Study
In summary, the research gaps remain in the current literature: (1) the association patterns between depression scores and multi-seed rsFC in non-clinical samples remain unclear (seed regions chosen based on their roles in reward processing, emotion regulation, and the neurocircuitry of depression); (2) existing task-fMRI studies have rarely compared the sensitivity of different cognitive tasks to depression scores.
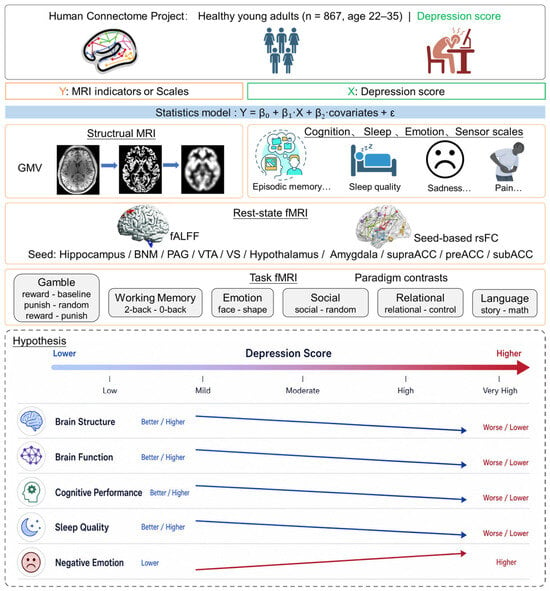
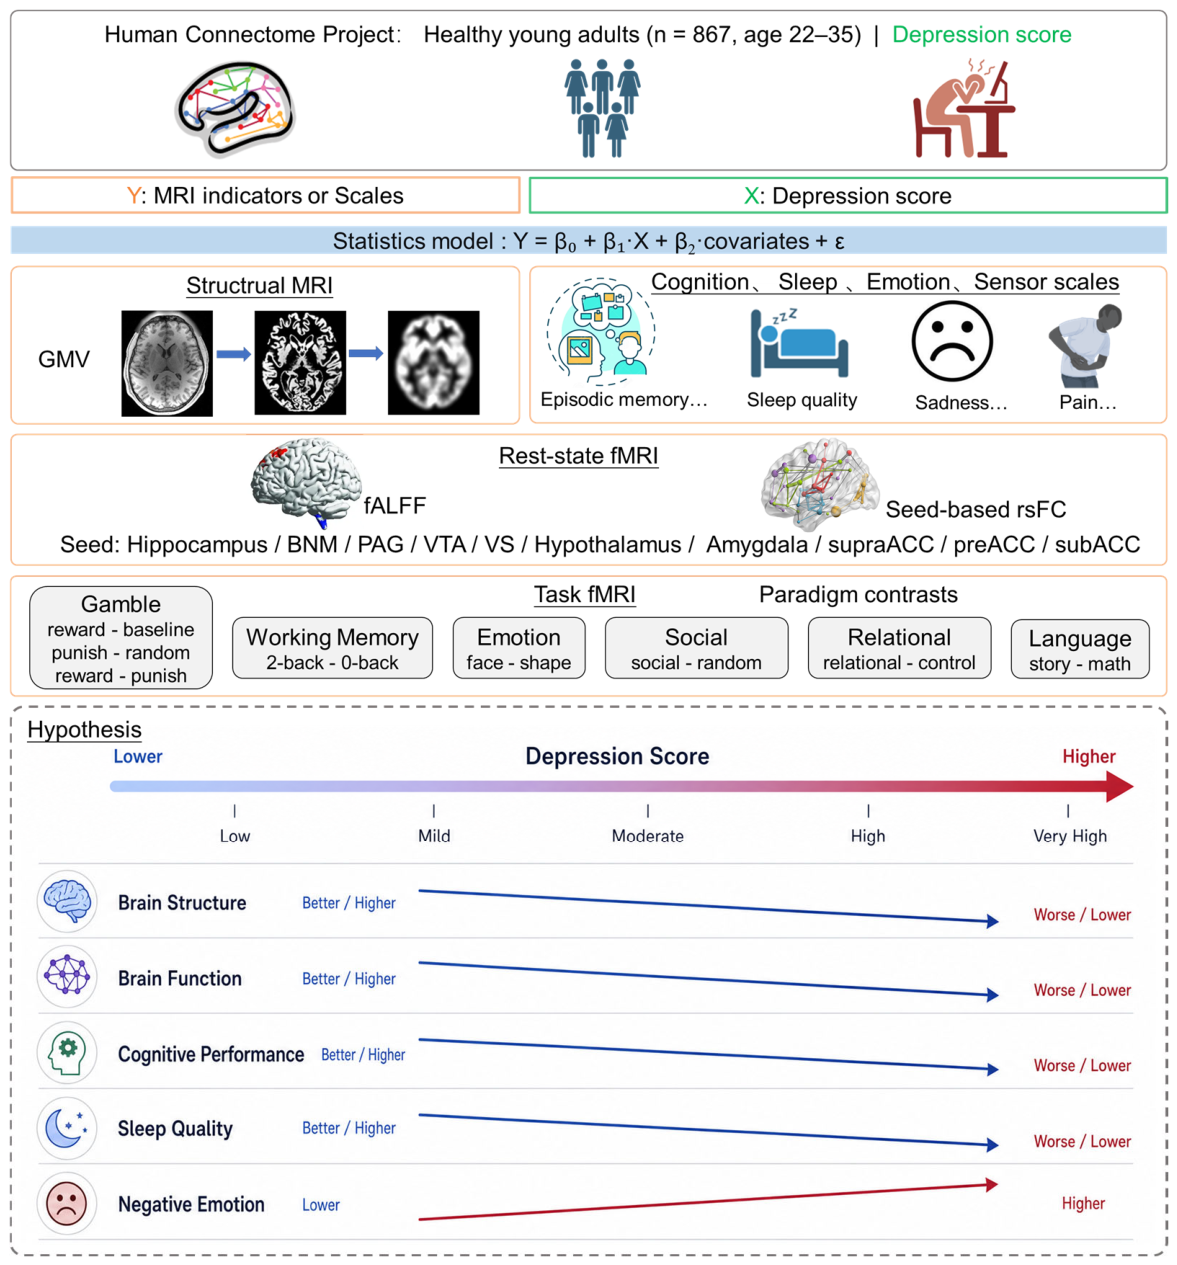
Several prior studies have leveraged the HCP dataset to examine depressive symptoms in relation to brain imaging measures. Cheng et al. identified functional connectivities that mediate the association between depressive problems and sleep quality using resting-state data [20]. Jackson and Bernard examined cerebellum–basal ganglia motor network integration in relation to trait depression and hyperactivity [21]. Yuan et al. explored the neural correlation between emotion recognition ability and depressive symptoms using the emotion recognition task [22]. However, these studies were limited to single modalities (resting-state only or single-task only) and focused on specific brain systems or isolated cognitive domains. The present study leverages the HCP database to systematically investigate associations between depression scores and multidimensional behavioral phenotypes (sleep, cognition, emotion, sensor), rsFC (multi-seed based), and activation patterns across several task-fMRI paradigms. We hypothesize that: (1) depression scores are positively correlated with sleep disturbances and negative emotions; (2) negatively correlated with rsFC in reward-related pathways and positively correlated with rsFC in cognitive control-related pathways; and (3) among task-fMRI paradigms, social perception may be more sensitive to depression scores than other tasks (Figure 1).
Figure 1.
Overall research approach and hypotheses.
2. Materials and Methods
2.1. Dataset and Demographics
We employed the HCP 1200 Subjects Release data in the current study. A total of 1096 young adults completed a resting state fMRI scan and, after exclusion of subjects missing physiological data (n = 80) or clinical measures (n = 3), or not meeting the scrubbing criteria (n = 146; details in Section 2.3), 867 were retained. A total of 998 participants completed fMRI scans of the seven behavioral tasks [23] and 833 of them showed good image quality across all scans. The intersection of the samples of 867 and 833 participants resulted in a pool of 687 participants (345 men) for inclusion in this study. All subjects were physically healthy with no severe neurodevelopmental, neuropsychiatric or neurological disorders. The HCP study was approved by the Washington University Institutional Review Board (IRB #201204036).
All participants were assessed with the Achenbach Adult DSM-Oriented Scales. The DSM-Oriented depression problems subscale comprises 14 items, each scored from 0 to 2, so the total score ranges from 0 to 28, with a higher score indicating more severe depression.
Participants were evaluated with the Pittsburgh Sleep Quality Index [24], which contains 19 self-rated questions. The 19 self-rated items are combined into 7 component scores, each of which ranges from 0 to 3, with “0” and “3” each indicating no and severe difficulty with sleep. Thus, individuals range from 0 to 21 in PSQI score, with a higher score representing worse sleep quality.
Table 1 shows sex differences in demographics and clinical measures.
Table 1.
Demographics and clinical measures of the participants.
2.2. Cognition, Emotion and Sensory Measures
HCP collected cognition, emotion and sensory scales for each participant [25]. To assess future planning, a delay discounting task measured how quickly individuals devalue future money compared to immediate money, using amounts of $200 and $40,000. Sustained attention was evaluated with the Short Penn Continuous Performance Test, where participants viewed sequences of line arrangements and pressed a button when the lines formed a letter or a number. Verbal episodic memory was tested using Form A of the Penn Word Memory Test: participants were shown 20 words to remember, then later presented with 40 words (including the original 20) and asked if they had seen each word before. Fluid intelligence was measured with Form A of an abbreviated version of Raven’s Progressive Matrices. Spatial orientation was examined using the Variable Short Penn Line Orientation Test, in which participants saw two lines at different angles and had to rotate one line to become parallel with the other. Additionally, the NIH Toolbox was employed to assess episodic memory, cognitive flexibility, inhibition, vocabulary, processing speed, working memory, and reading.
To evaluate emotion recognition, the Penn Emotion Recognition Test was used. Participants viewed 40 faces and had to decide whether the facial expression shown was happy, sad, angry, scared, or neutral (no feeling). Emotional state was measured using the NIH Toolbox for the Assessment of Neurological and Behavioral Function (NIH Toolbox V.2; www.nihtoolbox.org, accessed on 9 October 2019), which included questionnaires assessing negative affect, positive affect, life satisfaction, meaning and purpose, friendship, social support, stress, and self-efficacy.
All participants were assessed for audition (words in noise), olfaction (odor identification test), pain (pain intensity and interference surveys), taste (taste intensity test), vision (EVA scores and Farnsworth test) and contrast sensitivity (Mars contrast sensitivity) using the NIH Toolbox.
2.3. Imaging Protocol and Preprocessing
MRI data were acquired on a customized 3T Siemens Connectome Skyra scanner (Siemens Healthcare GmbH, Erlangen, Germany) with a standard 32-channel head coil. Resting-state fMRI data were collected using a gradient-echo EPI sequence with TR = 720 ms, TE = 33.1 ms, flip angle = 52°, 2.0 mm isotropic voxels, multi-band factor = 8, and 72 slices. T1-weighted structural images were acquired using a 3D MPRAGE sequence with 0.7 mm isotropic resolution. Preprocessing followed standard HCP pipelines and included motion correction, co-registration, normalization to MNI152 space, smoothing (4 mm FWHM for fMRI; 8 mm FWHM for VBM), nuisance regression (white matter, CSF, whole-brain, and physiological signals), temporal band-pass filtering (0.009–0.08 Hz), and scrubbing for motion artifact removal (FD > 0.2 mm or DVARS > 75). For complete step-by-step details, please refer to the Supplementary Methods.
2.4. Structural Brain Analysis
Voxel-based morphometry (VBM) was used to compute gray matter volume (GMV) with the CAT12 toolbox (1700) (http://dbm.neuro.uni-jena.de/vbm, accessed on 8 January 2021), as detailed in the Supplementary Methods [26,27,28,29].
2.5. Resting State Functional Connectivity (Rsfc) and Falff
The masks of the hippocampus, basal nucleus of Meynert (BNM), periaqueductal gray (PAG), ventral tegmental area (VTA), ventral striatum (VS), hypothalamus, supragenual anterior cingulate cortex (supraACC), pregenual ACC (preACC), subgenual ACC (subACC), and amygdala were obtained from the WFU Pick Atlas (v3.0.5) (http://fmri.wfubmc.edu/software/Pickatlas, accessed on 9 October 2019) [30] or the Automated Anatomic Labeling atlas [31] and were used as the seed regions. Whole-brain voxel-wise analyses were conducted to compute the rsFCs of these seeds. The BOLD time courses of each voxel were averaged within the seed, and the correlation coefficient was computed between the time courses of the seed and all other voxels of the brain for individual participants.
Fractional amplitude of low-frequency fluctuations (fALFF) was calculated to measure spontaneous brain activity during rest. For each voxel, the time series was transformed to the frequency domain using a fast Fourier transform. fALFF was computed as the ratio of the power within the low-frequency band (0.009–0.08 Hz) to that of the entire frequency range.
2.6. Task Fmri Analysis
Please note that 687 participants (345 men) of the retained 867 participants were included in this study. First-level individual contrast maps were generated for working memory (2-back–0-back), emotion recognition (negative–neutral), social perception (social interaction–random motion), relational reasoning (relational–control), language comprehension (story–math), and gambling (reward–punishment, reward–baseline, punishment–baseline). For these tasks, reaction times (RT) and accuracy rate were extracted as behavioral measures.
2.7. Statistics
At each voxel (and for behavioral measures), a general linear model was fitted: Y = β0 + β1·depression score + β2·covariates + ε. In group analyses, a whole-brain regression of brain features (i.e., GMV, rsFC and contrasts of task) against depression score was conducted, with age, sex and total intracranial volume (TIV, only for GMV analysis) as covariates.
Given the multimodal and multitask nature of this study, all analyses were treated as exploratory and hypothesis-generating. Whole-brain imaging results were evaluated using a voxel-level threshold of p < 0.001 (uncorrected), combined with cluster-level FWE correction at p < 0.05 within each individual brain map. This within-map correction did not control for comparisons across seeds, behavioral outcomes, task contrasts, or imaging modalities. We did not apply a single unified correction across these analytical families; accordingly, all reported findings require independent replication.
Sensitivity analyses were employed to address potential non-independence due to familial relatedness (twins and siblings) as well as to assess the impact of additional covariates (BMI, education, race, and substance use).
2.8. Generative Artificial Intelligence (GenAI) Disclosure
In preparing the hypothesis schematic presented in Figure 1, we used the generative AI tool Lovart (1.0.20) to create the initial layout and visual components of the conceptual framework. The AI-generated draft served as a starting point; all resulting graphical elements were carefully reviewed, manually refined, and fact-checked by the authors to ensure that the final illustration accurately reflects the study’s underlying hypothesis and conforms to scientific standards. Apart from this specified use for Figure 1, no generative AI was employed for data collection, statistical analysis, result interpretation, or manuscript composition.
3. Results
3.1. Clinical Measures
In this study, all behavioral correlation analyses, GMV, fALFF, and seed-based rsFC analyses were performed on the full sample of 867 participants (414 men). Task-fMRI analyses were conducted on the subset of 687 participants (345 men) who had passed quality control for both resting-state and task-fMRI scans.
To test Hypothesis 1 (depression scores are positively correlated with sleep disturbances and negative emotions), we first examined the behavioral correlates of depression scores. Table 1 shows group differences in demographics and clinical measures; significant threshold was set at p < 0.001. There were no sex differences in depression score (Table 1). Significant sex differences were found for age, cognition and emotion scales, e.g., men showed higher fluid intelligence and more anger than women, and women showed higher episodic memory and more fear than men. Based on the results above, sex and age (TIV for GMV analyses) were used as covariates.
Depression score was not related to any cognition scale (all p’s > 0.070). Higher depression score was associated with worse sleep quality (r = 0.37, p < 0.001) and more pain intensity (r = 0.23, p < 0.001), but was not associated with other sensory scales (all p’s > 0.011).
Higher depression score was associated with more negative emotion (anger affect: r = 0.47, anger hostility: r = 0.44, anger physical aggression: r = 0.18, fear affect: r = 0.56, fear somatic: r = 0.35, sadness: r = 0.61, loneliness: r = 0.48, perceived hostility: r = 0.30, perceived rejection: r = 0.35, perceived stress: r = 0.56. all p’s < 0.001) and less positive emotion (life satisfaction: r = −0.40, mean purpose: r = −0.40, positive affect: r = −0.42, friendship: r = −0.32, emotional support: r = −0.33, instrumental support: r = −0.19, self-efficacy: r = −0.33, all p’s < 0.001).
3.2. Structural Results
No significant association was found for GMV in whole-brain linear regression against depression score.
3.3. Resting-State Functional Connectivity and Falff Results
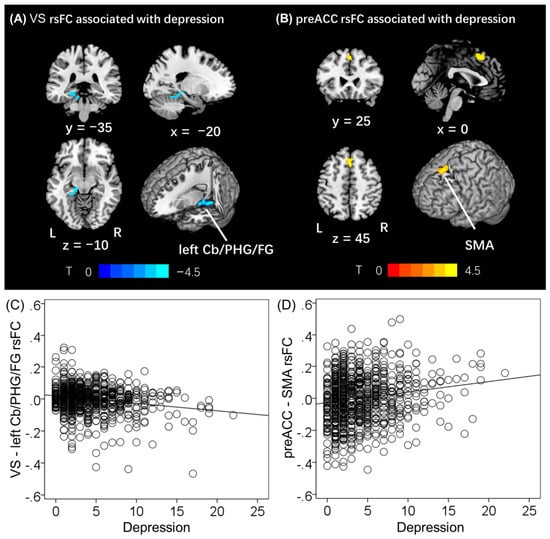
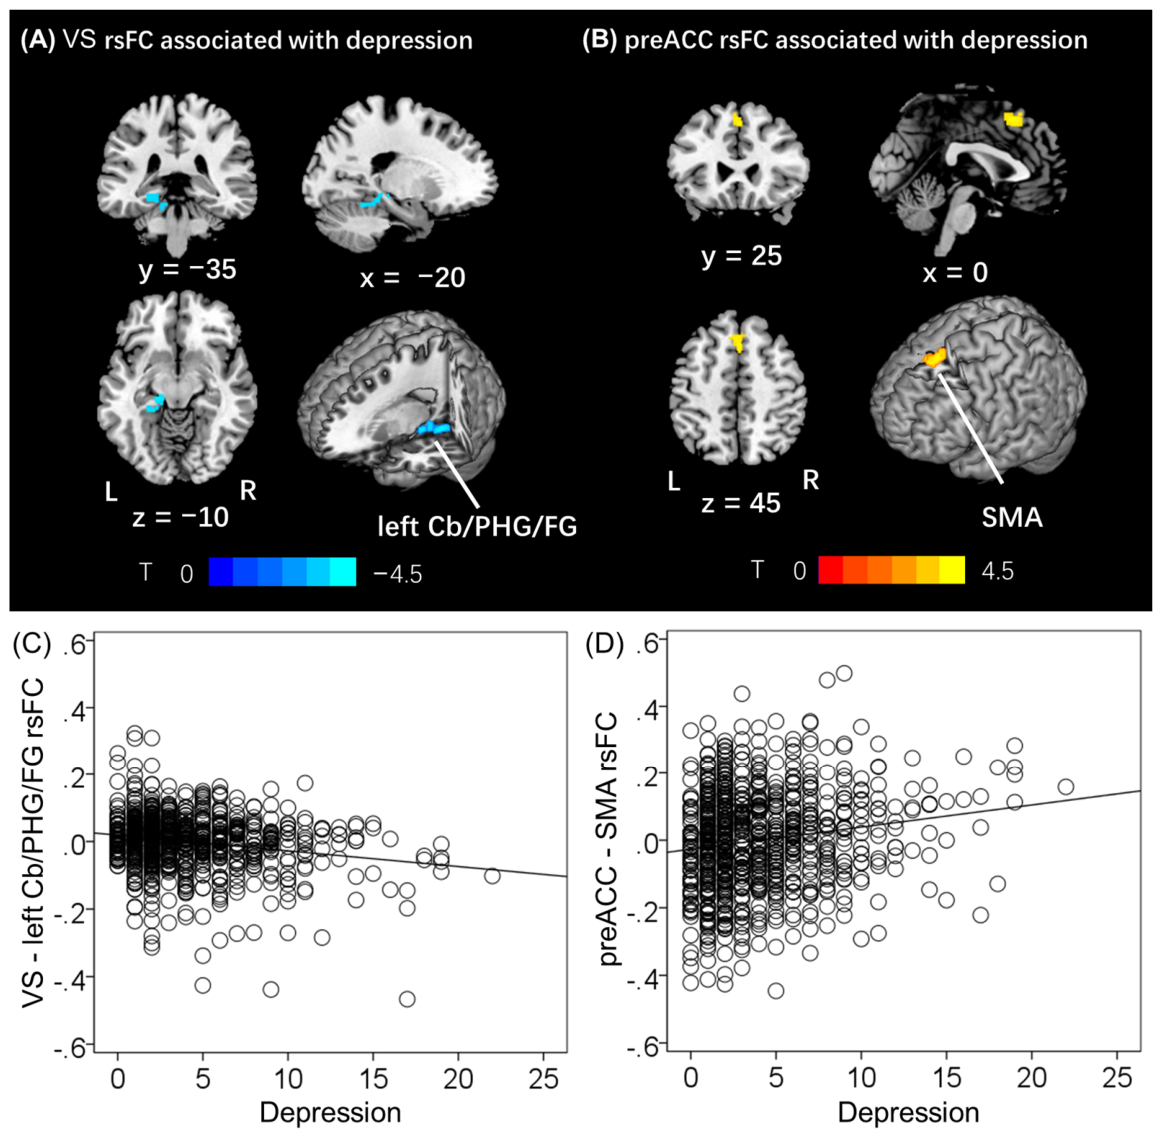
To test Hypothesis 2 (in the resting state, depression scores are negatively correlated with rsFC in reward-related pathways and positively correlated with rsFC in cognitive control-related pathways), we performed whole-brain regression analyses for each seed region. The rsFC between VS and a cluster involving the left cerebellum, parahippocampal gyrus and fusiform gyrus (left Cb/PHG/FG, x, y, z = −16, −46, −16; T = −4.56, 1328 mm3; Figure 2A) was significantly negatively correlated with depression score (r = −0.20, p < 0.001). The rsFC between preACC and supplementary motor area (SMA, x, y, z = 0, 20, 52; T = 4.22, 1120 mm3; Figure 2B) was significantly positively correlated with depression score (r = 0.16, p < 0.001). We drew the scatter plot for VS-left Cb/PHG/FG rsFC and preACC-SMA rsFC against depression score (Figure 2C,D).
Figure 2.
Depression score linearly modulates resting-state functional connectivity (rsFC) of the VS and preACC. (A) VS-left Cb/PHG/FG rsFC and (B) PreACC-SMA rsFC shows a negative (r = −0.20, p < 0.001) and positive (r = 0.16, p < 0.001) association with depression score with age and sex as covariates. (C,D) plotted the scatter plot of VS-left Cb/PHG/FG rsFC and PreACC-SMA rsFC. Threshold: voxel p < 0.001, uncorrected combined with cluster p < 0.05, FWE corrected. Color bars show voxel t values; warm: positive, cool: negative. L: left, R: right, VS: ventral striatum, periaqueductal gray, PHG: parahippocampal gyrus, FG: fusiform gyrus, Cb: cerebellum, preACC: pregenual anterior cingulate cortex, SMA: supplementary motor area, rsFC: resting state functional connectivity. Note that the residuals are plotted here with age and sex accounted for in all regressions.
No significant cluster was found for the other seed-based rsFC analyses (hippocampus, BNM, PAG, VTA, hypothalamus, supraACC, subACC, amygdala) or fALFF in whole-brain linear regression against depression score.
The correlation coefficient between VS-left Cb/PHG/FG rsFC and PreACC-SMA rsFC and clinical measures was summarized in Supplementary Table S1. Only VS-left Cb/PHG/FG rsFC showed a significant negative association with PSQI.
In the unrelated-participant rsFC subsample (n = 409), the two reported rsFC associations remained directionally consistent with the main analyses: VS-left Cb/PHG/FG rsFC (r = −0.17, p < 0.001) and preACC-SMA rsFC (r = 0.17, p = 0.001). Similar effect directions were also observed after including BMI, education, race, and substance use as additional covariates (Supplementary Tables S2 and S3).
3.4. Task Fmri Results
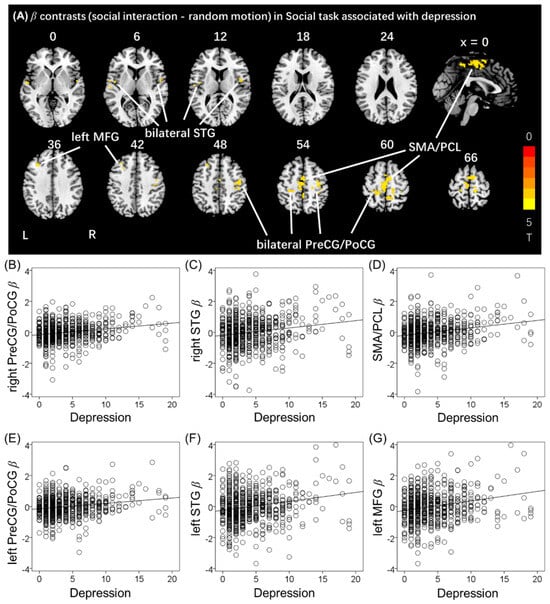
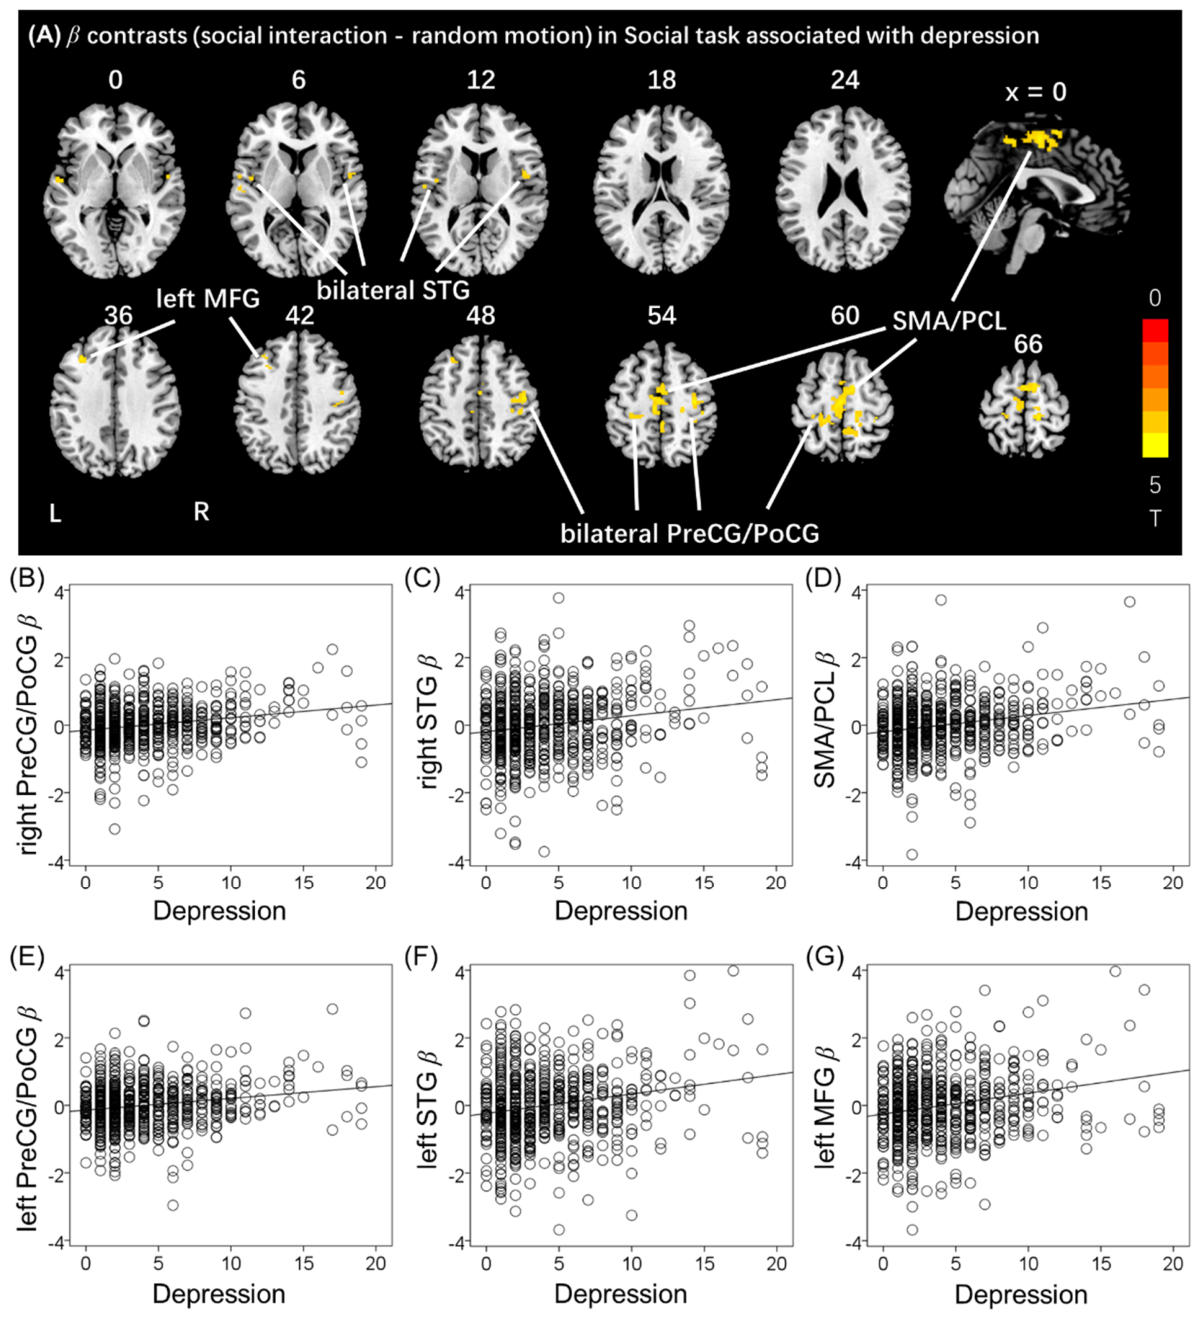
To test Hypothesis 3 (among task-fMRI paradigms, social perception may be more sensitive to depression scores than other tasks), we examined the association between depression scores and brain activation across six HCP task paradigms, as well as task performance. For the social perception task, activation (contrast: social interaction–random motion) in the bilateral precentral/postcentral gyrus (PreCG/PoCG; right: r = 0.21, p < 0.001; left: r = 0.19, p < 0.001; Figure 3A and Table 2), bilateral superior temporal gyrus (STG; right: r = 0.18, p < 0.001; left: r = 0.16, p < 0.001), SMA/paracentral lobule (PCL; r = 0.22, p < 0.001), and left middle frontal gyrus (MFG; r = 0.19, p < 0.001) showed a significant positive relationship with depression score. Concurrently, the accuracy rate difference (social interaction–random motion) also showed a positive relationship (r = 0.12, p = 0.003) with depression score.
Figure 3.
Depression score modulates activation (contrast: social interaction–random motion) of the social cognition task. (A) bilateral PreCG/PoCG, bilateral STG, SMA/PCL and left MFG showed positive relationship with depression score. (B–G) plotted the scatter plot of right PreCG/PoCG (r = 0.21, p < 0.001), right STG (r = 0.18, p < 0.001), SMA/PCL (r = 0.22, p < 0.001), left PreCG/PoCG (r = 0.19, p < 0.001), left STG (r = 0.16, p < 0.001) and left MFG (r = 0.19, p < 0.001) activation against depression score, respectively. Threshold: voxel p < 0.001, uncorrected combined with cluster p < 0.05, FWE corrected. Color bars show voxel t values, warm: positive. L: left, R: right. Note that the residuals are plotted here with age and sex accounted for in all regressions. PreCG/PoCG: precentral/postcentral gyrus; SMA/PCL: supplementary motor area/paracentral lobule; MFG: middle frontal gyrus; STG: superior temporal gyrus.
Table 2.
Clusters of positive activation (social interaction–random motion) during social task in whole-brain linear regression against depression score.
No significant associations with depression score were detected for other contrasts in working memory (2-back–0-back), emotion recognition (negative–neutral), relational reasoning (relational–control), language comprehension (story–math), and gambling (reward–punishment, reward–baseline, punishment–baseline) tasks.
The correlation coefficient between regional activation during the social task and clinical measures was summarized in Table S4. Briefly, social task activation showed significant associations with negative emotion, e.g., fear and sadness scores. In addition, the relationship between social task activation and rsFC measures was not formally tested, as the study was designed to characterize modality-specific associations with depression scores rather than to model cross-modal interactions.
In the unrelated-participant task-fMRI subsample (n = 294), the six reported social-task activation associations remained directionally consistent with the main analyses (r = 0.16–0.21, all p ≤ 0.006). Similar effect directions were also observed after including BMI, education, race, and substance use as additional covariates (Supplementary Tables S2 and S3).
4. Discussion
4.1. Summary of Main Findings
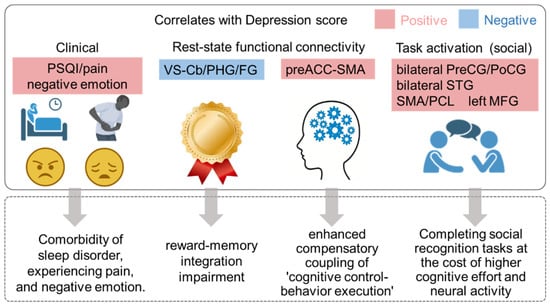
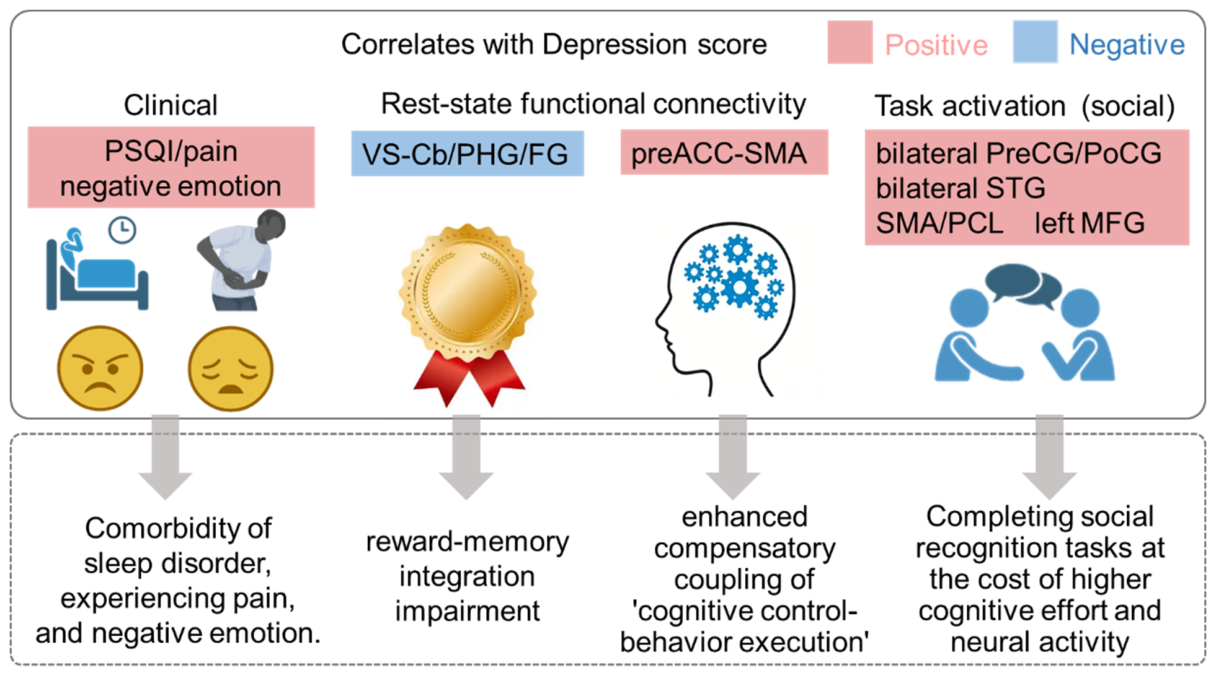
The core findings are summarized below (Figure 4). First, at the behavioral level, depression scores were positively correlated with sleep disturbances (PSQI), negative emotions (anger, fear, etc.), and pain ratings. Second, at the resting-state level, depression scores were negatively correlated with VS-Cb/PHG/FG rsFC, yet positively correlated with preACC-SMA rsFC. Third, at the task-fMRI level, only in the social perception task were positive correlations observed between depression scores and regional activations (bilateral PreCG/PoCG, bilateral STG, left MFG, and SMA/PCL), accompanied by a positive correlation between depression scores and task accuracy.
Figure 4.
Schematic summary of the main findings and interpretive framework. Solid boxes indicate empirical findings from this study: (1) behavioral: depression scores were positively correlated with sleep disturbances, negative emotions, and pain; (2) rsFC: depression scores were negatively correlated with VS-left Cb/PHG/FG rsFC and positively correlated with preACC-SMA rsFC; (3) task-fMRI: depression scores were positively correlated with social task activation (bilateral PreCG/PoCG, bilateral STG, left MFG, SMA/PCL) and social task accuracy. Solid arrows denote associations observed in the present sample. Dashed boxes represent our interpretive hypotheses—namely, “reward–perception decoupling,” “hyper-connected cognitive control,” and “compensatory hypervigilance”—which are speculative interpretations of the correlational findings rather than empirically demonstrated mechanisms (see discussion). VS: ventral striatum, periaqueductal gray, PHG: parahippocampal gyrus, FG: fusiform gyrus, Cb: cerebellum, preACC: pregenual anterior cingulate cortex, SMA: supplementary motor area, rsFC: resting state functional connectivity. PreCG/PoCG: precentral/postcentral gyrus; SMA/PCL: supplementary motor area/paracentral lobule; MFG: middle frontal gyrus; STG: superior temporal gyrus.
4.2. Behavioral Comorbidity: Depression, Sleep, Negative Emotion, and Pain
This study found that, in a non-clinical sample, depression scores were significantly positively correlated with sleep quality, negative emotions (anger, fear, etc.), and pain scores. This finding is highly consistent with a substantial body of existing literature and further extends these associations to the subclinical dimensional level.
The relationship between depression and sleep disturbances has been extensively documented [32,33]. Moyses-Oliveira et al. found that PSQI scores were significantly correlated with Beck Depression Inventory scores, and the polygenic scores for both measures showed significant overlap, suggesting that sleep quality and depressive symptoms share a genetic basis, with implicated genes converging on common neural pathways [34]. Sleep disturbance significantly mediates the relationship between chronotype and depressive symptoms in young adults [35]. Among university students, poor sleep quality and short sleep duration are significantly associated with a higher prevalence of depressive symptoms [36,37].
Chronic pain is closely related to MDD and anxiety disorders, with high comorbidity rates and shared risk factors. A meta-analysis reviewed how depression can alter pain processing and increase pain sensitivity [38]. The present findings suggest that even in non-clinical populations, elevated depression scores are closely associated with enhanced pain perception, potentially reflecting the possibility that the shared neural substrates of depression and pain—such as thalamic structural and functional alterations [39]—are already operational at the subclinical level.
The relationship between negative emotions and depression also has a robust neurobiological foundation. The amygdala and nucleus accumbens are brain regions closely associated with emotion regulation in humans and play critical roles in depression [40]. Studies have found that depressed patients exhibit negative biases toward negatively valenced emotional stimuli [41]. Both fear and anger, whether excessive or deficient, increase the risk of mental disorders and should be considered in genetic, neurobiological, and neuroimaging studies [42].
In summary, the behavioral finding demonstrates that these comorbidity features—specifically characterized by sleep disturbances, heightened negative emotions, and enhanced pain perception—associated with depression already manifest at the subclinical level, providing a phenotypic foundation for the subsequent neuroimaging findings.
4.3. Rsfc: Reward-Perception Decoupling and Hyper-Cognitive Control Coupling
The VS is a core region for reward and motivational processing [43,44]. Individuals with a history of depression exhibit significant alterations in functional connectivity between the VS and regions including the parahippocampal gyrus and inferior temporal gyrus [42]. A recent study found that a history of depression in adolescents was associated with decreased VS-PHG rsFC [45]. The present study further extends this finding to the subclinical dimensional level: VS-Cb/PHG/FG rsFC decreases with increasing depression scores. The PHG and FG are involved in scene construction and visual object/facial recognition, while the cerebellum participates in cognitive prediction and emotional regulation. One possible interpretation is that this pattern represents a form of “reward-perception decoupling”, which could be a network-level correlate of anhedonia. However, alternative explanations are equally plausible—for instance, decreased VS-Cb connectivity could reflect reduced integration of reward signals with cognitive or motor preparation systems, rather than a specific perceptual decoupling. Moreover, because rsFC does not distinguish the direction or excitatory/inhibitory nature of the connections, we cannot determine whether this reduction reflects weaker feed-forward reward signaling or stronger feedback inhibition from visual regions to the VS.
The preACC is a core hub for cognitive control and conflict monitoring, while the SMA is responsible for motor planning and execution. The present study found a positive correlation between depression scores and preACC-SMA rsFC, suggesting that higher depressive tendencies are associated with stronger connectivity between the cognitive “monitoring system” and the “motor system” in the resting state. A meta-analysis reported that MDD patients showed hyperconnectivity between preACC and superior and inferior parietal lobule [46]. Another study found higher preACC-SMA rsFC in MDD patients [47]. The present study found that higher preACC-SMA connectivity is not merely present in clinically depressed patients but is already observable along the continuous dimension of depression scores.
This “cognitive control–motor overcoupling” may reflect excessive rumination or an over-prepared state prior to motor inhibition in depressive traits—that is, the brain remains in a state of high tension characterized by “self-monitoring” and “prepared action” even in the resting state. This overcoupling may reflect a misallocation of cognitive control resources toward the motor preparation system, and this “mismatch” of neural resources may be the neural basis for the rigidity or slowness observed in depressed individuals when they need to flexibly switch cognitive states. Nevertheless, alternative interpretations should be considered. For example, this increased connectivity could simply reflect a general state of heightened arousal or anxiety, which often co-occurs with depressive symptoms, rather than a depression-specific cognitive control aberration. It is also possible that this connectivity pattern represents an adaptive upregulation of cognitive control to compensate for perceived difficulty in regulating emotions, rather than a maladaptive “overcoupling”.
4.4. Social Task: The Compensatory Hypervigilance Hypothesis
Among the several task-fMRI paradigms, only the social task was specifically associated with depression scores. One of the core features of depression is precisely impairment in interpersonal functioning and biases in social cognition [1]. Therefore, the fact that only social task showed significant results may be because it is most directly related to the core social dysfunction domain of depression—namely, the ways in which social information is encoded, interpreted, and responded to.
PreCG/PoCG are involved in action observation, imitation, and somatosensory representation. STG is a key region for language comprehension and social perception. SMA involved in cognitive control and motor planning, potentially reflecting conscious monitoring of social rules and response preparation in social contexts. A previous meta-analysis found that MDD patients exhibited hyperactivation in bilateral superior/middle frontal gyri during social processing tasks [1]. In a reasoning task study, the subclinical depressed group exhibited greater superior parietal/prefrontal cortex activation during both learning and test phases, which represented a compensatory mechanism to achieve the same behavioral performance as the non-depressed group [48]. A recent meta-analysis also reported that individuals with subclinical depression exhibit increased regional activation during emotion, reward, and decision-making tasks [49].
In socio-affective processing, depressed patients show enhanced neural responses to social feedback. A study of depressed women found that the depressed group exhibited emotional and neural hyperresponsivity to both romantic social rejection and acceptance [50]. Another study of female adolescents at risk for depression found that high-risk individuals exhibited heightened neural activity and functional connectivity responses following social rejection [51]. In social comparison tasks, patients with depression and social anxiety showed greater default mode network activation during upward social comparisons [52]. These findings are consistent with the present study—individuals with higher depressive tendencies indeed mobilize greater neural resources when confronted with socially relevant information.
The depression scores were also positively correlated with task accuracy. In socio-affective processing, depressed patients showed enhanced amygdala responses to both positive and negative social feedback [53]. In social exclusion paradigms, adolescents at risk of depression exhibited atypical recruitment of emotional salience and regulation networks during social exclusion [54]. In non-clinical samples, individuals with higher depression scores do not simply exhibit “hypofunction” in social cognitive tasks; rather, they mobilize greater neural resources for “over-encoding” and “analytical processing.” They are not “naturally perceiving” social information but rather “effortfully computing” social rules and intentions. This additional cognitive investment may stem from hypervigilance toward potential threats in social contexts (such as rejection, criticism, or misunderstanding). While this hypervigilance consumes more neural resources, it unexpectedly yields improved behavioral performance—i.e., higher accuracy. In more severe clinical depression, this compensatory mechanism may fail, and instead manifest as a comprehensive impairment of social function. Alternative explanations should also be considered: (1) the enhanced activation could reflect greater task engagement or motivation in higher-scoring individuals rather than a “compensatory” mechanism per se; (2) the positive correlation with accuracy might be driven by the specific nature of the HCP social task (identifying social vs. random motion), which may not directly generalize to more complex social cognitive processes such as mentalizing or empathy; and (3) it is also possible that this pattern is specific to the non-clinical range of depression scores and may not extrapolate to clinical depression, where such compensatory mechanisms may fail and manifest as social function impairment.
4.5. Interpretation of Null Findings
This study found no significant associations between depression scores and GMV, fALFF, other seed-based rsFCs or task-fMRI paradigms. The null results for GMV and fALFF suggest that, at the subclinical stage, depressive symptoms may manifest primarily as functional integration deficits across brain networks (i.e., “disconnection” at the network level) rather than as structural atrophy or altered spontaneous activity in local regions. The absence of findings in other tasks does not statistically demonstrate that social cognition is more sensitive to depressive symptoms than other cognitive domains. We therefore interpret this finding tentatively: social cognitive processing may be a particularly relevant domain to examine in relation to dimensional depressive symptoms, and the null findings in other tasks should be interpreted with caution, as they may reflect task design characteristics, statistical power limitations, or the specific nature of the non-clinical sample.
4.6. Limitations
This study has several limitations. First, the sample was drawn from the healthy adult population of the HCP, with depression scores overall in the subclinical range; generalization of the findings to clinically depressed patients requires caution. Second, this study employed a cross-sectional design and cannot infer causality—that is, whether the observed brain connectivity abnormalities are causes or consequences of depressive tendencies remains unclear. Third, the social task design in the HCP may not fully cover all dimensions of social cognition (such as empathy, theory of mind, etc.). Fourth, our study involved multiple analytical streams, and we did not apply a single unified correction across all analyses. While cluster-level FWE correction was applied within each brain map, this does not control the family-wise error rate for the entire study—a major limitation of multimodal exploratory work. All findings should therefore be considered hypothesis-generating and require independent replication in pre-registered studies. Lastly, we did not perform formal cross-task statistical comparisons (e.g., task × depression score interaction) to test whether social perception is significantly more sensitive to depressive symptoms than other domains. Our inference is based solely on the observation that only the social task yielded significant results in our sample. Direct comparative analyses in future studies are needed to confirm the specificity of this association.
4.7. Conclusions
This multimodal HCP-based study demonstrates that dimensional depressive symptoms are associated with distinct patterns of rsFC and social-task-evoked neural responses in non-clinical populations. These findings support a dimensional perspective on depression and provide preliminary neuroimaging evidence for subclinical symptom manifestations. However, given the correlational design, these interpretations require independent replication and causal validation through future longitudinal or experimental studies.
Supplementary Materials
The following supporting information can be downloaded at: https://www.mdpi.com/article/10.3390/brainsci16080884/s1, Table S1: The correlation coefficient between VS—left Cb/PHG/FG rsFC and PreACC—SMA rsFC and clinical measures with age and sex as covariates; Table S2: The sensitivity analyses results of unrelated participants (unique family IDs, i.e., only one participant per family); Table S3: The sensitivity analyses results of additional covariates (BMI, years of education, race, substance use), Table S4: The correlation coefficient between regional activation during social task and clinical measures with age and sex as covariates.
Author Contributions
G.L. and F.Z. contributed to the study conception and design. G.L. and X.T. supervised the project and managed administration. G.L. participated in data collection. F.Z., G.L., S.Z., X.T. contributed to the methodology and wrote the first draft of the manuscript. All authors participated in the review and editing process. All authors have read and agreed to the published version of the manuscript.
Funding
The current study was supported by National Natural Science Foundation of China (12402350), Beijing Natural Science Foundation (1262001) and Noncommunicable Chronic Diseases-National Science and Technology Major Project (2023ZD0503800, 2023ZD0503803). Data were provided by the Human Connec-tome Project, WU-Minn Consortium (Principal Investigators: David Van Essen and Kamil Ugurbil; 1U54MH091657) funded by the National Institutes of Health Institutes and Centers that support the National Institutes of Health Blueprint for Neuroscience Research; and by the McDonnell Center for Systems Neuroscience at Washington University.
Institutional Review Board Statement
The present study was a secondary analysis of de-identified data from the Human Connectome Project 1200 Subjects Release and did not involve new participant recruitment, data collection, intervention, or direct participant contact by the authors. The original HCP study was conducted in accordance with the Declaration of Helsinki and was approved by the Washington University Institutional Review Board (IRB #201204036; 1 June 2012).
Informed Consent Statement
No identifiable participant information was included in this study, and therefore it is not applicable to this statement. And informed consent was obtained from all participants in the original HCP study.
Data Availability Statement
All data needed to evaluate the conclusions in the paper are shown in the paper and the supplement. All raw data supporting the analyses and findings of this study are available from the Human Connectome Project, at https://www.humanconnectome.org/. accessed on 9 October 2019.
Conflicts of Interest
Song Zhang is employed by Beijing Yes Medical Devices Co., Ltd. The company did not provide funding, data, software, equipment, or other support for this study and had no role in the study design, data acquisition, data analysis, interpretation of the results, manuscript preparation, or decision to submit the work for publication.
References
- Yuan, C.; Mi, S.; Yang, C.; Yuan, L.; Chang, F.; Chen, J.; Shi, R.; Su, Y.; He, Y.; Wang, Z.; et al. Neural correlates of social processing in major depressive disorder: A coordinate-based Meta-analysis of task-related functional magnetic resonance imaging studies. J. Affect. Disord. 2026, 394, 120477. [Google Scholar] [CrossRef] [Scilit] [PubMed]
- Chen, Y.; Chaudhary, S.; Li, G.; Fucito, L.M.; Bi, J.; Li, C.S.R. Deficient sleep, altered hypothalamic functional connectivity, depression and anxiety in cigarette smokers. Neuroimage Rep. 2024, 4, 100200. [Google Scholar] [CrossRef] [Scilit] [PubMed]
- Chen, Y.; Li, H.T.; Luo, X.; Li, G.; Ide, J.S.; Li, C.S. Polygenic risk for depression and resting-state functional connectivity of subgenual anterior cingulate cortex in young adults. J. Psychiatry Neurosci. 2025, 50, 31–44. [Google Scholar] [CrossRef] [Scilit] [PubMed]
- Chen, Y.; Li, H.T.; Luo, X.; Li, G.; Ide, J.S.; Li, C.S.R. Polygenic Risks for Depression and Neural Responses to Reward and Punishment in Young Adults. Biol. Psychiatry Cogn. Neurosci. Neuroimaging 2025, 10, 1155–1165. [Google Scholar] [CrossRef] [Scilit] [PubMed]
- Zhang, M.; Yang, Y.; Zhao, Y.; Sui, C.; Sui, Y.; Jiang, Y.; Liu, K.; Yang, S.; Wang, L.; Chen, B.; et al. The application of integrating electroencephalograph-based emotion recognition technology into brain–computer interface systems for the treatment of depression: A narrative review. Adv. Technol. Neurosci. 2024, 1, 188–200. [Google Scholar] [CrossRef] [Scilit]
- Li, G.; Dong, Y.; Chen, Y.; Li, B.; Chaudhary, S.; Bi, J.; Sun, H.; Yang, C.; Liu, Y.; Li, C.S.R. Drinking severity mediates the relationship between hypothalamic connectivity and rule-breaking/intrusive behavior differently in young women and men: An exploratory study. Quant. Imaging Med. Surg. 2024, 14, 6669–6683. [Google Scholar] [CrossRef] [Scilit] [PubMed]
- Li, G.; Zhong, D.; Li, B.; Chen, Y.; Yang, L.; Li, C.S.R. Sleep Deficits Inter-Link Lower Basal Forebrain-Posterior Cingulate Connectivity and Perceived Stress and Anxiety Bidirectionally in Young Men. Int. J. Neuropsychopharmacol. 2023, 26, 879–889. [Google Scholar] [CrossRef] [Scilit] [PubMed]
- Li, G.; Chen, Y.; Chaudhary, S.; Li, C.S.; Hao, D.; Yang, L.; Li, C.S.R. Sleep dysfunction mediates the relationship between hypothalamic-insula connectivity and anxiety-depression symptom severity bidirectionally in young adults. Neuroimage 2023, 279, 120340. [Google Scholar] [CrossRef] [Scilit] [PubMed]
- Wang, S.; Hao, D.; Su, Y.; Wang, X.; Yan, Y.; Chen, Y.; Li, G.; Li, C.S.R. GABAergic bases of connectivity alterations in the ventral tegmental area of young drinkers: An analysis using the combined technologies of JuSpace toolbox and resting-state functional magnetic resonance imaging. Adv. Technol. Neurosci. 2026, 3, 49–56. [Google Scholar] [CrossRef] [Scilit]
- Zhang, Z.; Zhang, Y.; Wang, H.; Lei, M.; Jiang, Y.; Xiong, D.; Chen, Y.; Zhang, Y.; Zhao, G.; Wang, Y.; et al. Resting-state network alterations in depression: A comprehensive meta-analysis of functional connectivity. Psychol. Med. 2025, 55, e63. [Google Scholar] [CrossRef] [Scilit] [PubMed]
- Li, J.; Chen, H.; Liao, W. Biologically Annotated Heterogeneity of Depression Through Neuroimaging Normative Modeling. Biol. Psychiatry 2026, 99, 627–638. [Google Scholar] [CrossRef] [Scilit] [PubMed]
- Sun, S.; Yan, C.; Qu, S.; Luo, G.; Liu, X.; Tian, F.; Dong, Q.; Li, X.; Hu, B. Resting-state dynamic functional connectivity in major depressive disorder: A systematic review. Prog. Neuropsychopharmacol. Biol. Psychiatry 2024, 135, 111076. [Google Scholar] [CrossRef] [Scilit] [PubMed]
- Besteher, B.; Gaser, C.; Nenadić, I. Brain Structure and Subclinical Symptoms: A Dimensional Perspective of Psychopathology in the Depression and Anxiety Spectrum. Neuropsychobiology 2020, 79, 270–283. [Google Scholar] [CrossRef] [Scilit] [PubMed]
- Li, J.; Kuang, S.; Liu, Y.; Wu, Y.; Li, H. Structural and functional brain alterations in subthreshold depression: A multimodal coordinate-based meta-analysis. Hum. Brain Mapp. 2024, 45, e26702. [Google Scholar] [CrossRef] [Scilit] [PubMed]
- Lai, C.H.; Wu, Y.T. The patterns of fractional amplitude of low-frequency fluctuations in depression patients: The dissociation between temporal regions and fronto-parietal regions. J. Affect. Disord. 2015, 175, 441–445. [Google Scholar] [CrossRef] [Scilit] [PubMed]
- Kriesche, D.; Woll, C.F.J.; Tschentscher, N.; Engel, R.R.; Karch, S. Neurocognitive deficits in depression: A systematic review of cognitive impairment in the acute and remitted state. Eur. Arch. Psychiatry Clin. Neurosci. 2023, 273, 1105–1128. [Google Scholar] [CrossRef] [Scilit] [PubMed]
- Varghese, S.; Frey, B.N.; Schneider, M.A.; Kapczinski, F.; de Azevedo Cardoso, T. Functional and cognitive impairment in the first episode of depression: A systematic review. Acta Psychiatr. Scand. 2022, 145, 156–185. [Google Scholar] [CrossRef] [Scilit] [PubMed]
- Zacková, L.; Jáni, M.; Brázdil, M.; Nikolova, Y.S.; Marečková, K. Cognitive impairment and depression: Meta-analysis of structural magnetic resonance imaging studies. Neuroimage Clin. 2021, 32, 102830. [Google Scholar] [CrossRef] [Scilit] [PubMed]
- Kim, Y.E.; Lim, H.R.; Lee, T. A Review of Task-Based Functional Magnetic Resonance Imaging Paradigms in Major Depressive Disorder: Probing Executive Function, Negative Bias, and Reward Processing. Investig. Magn. Reson. Imaging 2026, 30, 1–10. [Google Scholar] [CrossRef] [Scilit]
- Cheng, W.; Rolls, E.T.; Ruan, H.; Feng, J. Functional Connectivities in the Brain That Mediate the Association Between Depressive Problems and Sleep Quality. JAMA Psychiatry 2018, 75, 1052–1061. [Google Scholar] [CrossRef] [Scilit] [PubMed]
- Jackson, T.B.; Bernard, J.A. Cerebellar and basal ganglia motor network predicts trait depression and hyperactivity. Front. Behav. Neurosci. 2022, 16, 953303. [Google Scholar] [CrossRef] [Scilit] [PubMed]
- Yuan, Z.; Lin, X.; Li, P.; Gao, Y.J.; Yuan, K.; Yan, W.; Zhang, Y.X.; Liu, L.; Zhu, X.M.; Zhang, Y.J.; et al. The neural correlation of emotion recognition ability and depressive symptoms-evidence from the HCP database. Front. Psychiatry 2022, 13, 1090369. [Google Scholar] [CrossRef] [Scilit] [PubMed]
- Barch, D.M.; Burgess, G.C.; Harms, M.P.; Petersen, S.E.; Schlaggar, B.L.; Corbetta, M.; Glasser, M.F.; Curtiss, S.; Dixit, S.; Feldt, C.; et al. Function in the human connectome: Task-fMRI and individual differences in behavior. Neuroimage 2013, 80, 169–189. [Google Scholar] [CrossRef] [Scilit] [PubMed]
- Buysse, D.J.; Reynolds, C.F.; Monk, T.H.; Berman, S.R.; Kupfer, D.J. The Pittsburgh sleep quality index: A new instrument for psychiatric practice and research. Psychiatry Res. 1989, 28, 193–213. [Google Scholar] [CrossRef] [Scilit] [PubMed]
- Hodge, M.R.; Horton, W.; Brown, T.; Herrick, R.; Olsen, T.; Hileman, M.E.; McKay, M.; Archie, K.A.; Cler, E.; Harms, M.P.; et al. ConnectomeDB--Sharing human brain connectivity data. Neuroimage 2016, 124, 1102–1107. [Google Scholar] [CrossRef] [Scilit] [PubMed]
- Zhang, S.; Li, C.R. Ventral striatal dysfunction in cocaine dependence—difference mapping for subregional resting state functional connectivity. Transl. Psychiatry 2018, 8, 119. [Google Scholar] [CrossRef] [Scilit] [PubMed]
- Power, J.D.; Barnes, K.A.; Snyder, A.Z.; Schlaggar, B.L.; Petersen, S.E. Spurious but systematic correlations in functional connectivity MRI networks arise from subject motion. Neuroimage 2012, 59, 2142–2154. [Google Scholar] [CrossRef] [Scilit] [PubMed]
- Li, J.; Kong, R.; Liégeois, R.; Orban, C.; Tan, Y.; Sun, N.; Holmes, A.J.; Sabuncu, M.R.; Ge, T.; Yeo, B.T. Global signal regression strengthens association between resting-state functional connectivity and behavior. Neuroimage 2019, 196, 126–141. [Google Scholar] [CrossRef] [Scilit] [PubMed]
- Ashburner, J. A fast diffeomorphic image registration algorithm. NeuroImage 2007, 38, 95–113. [Google Scholar] [CrossRef] [Scilit] [PubMed]
- Breen, D.P.; Nombela, C.; Vuono, R.; Jones, P.S.; Fisher, K.; Burn, D.J.; Brooks, D.J.; Reddy, A.B.; Rowe, J.B.; Barker, R.A. Hypothalamic volume loss is associated with reduced melatonin output in Parkinson’s disease. Mov. Disord. 2016, 31, 1062–1066. [Google Scholar] [CrossRef] [Scilit] [PubMed]
- Tzourio-Mazoyer, N.; Landeau, B.; Papathanassiou, D.; Crivello, F.; Etard, O.; Delcroix, N.; Mazoyer, B.; Joliot, M. Automated anatomical labeling of activations in SPM using a macroscopic anatomical parcellation of the MNI MRI single-subject brain. Neuroimage 2002, 15, 273–289. [Google Scholar] [CrossRef] [Scilit] [PubMed]
- Sun, Y.-S.; Wang, F.; Zhong, Q.-T.; Wang, S.-B.; Jia, F.-J.; Hou, C.-L. Obstructive sleep apnea and major depressive disorder: Shared transcriptional signatures and candidate pathways identified via bioinformatics analysis. Sleep Res. 2026, 3, 242–250. [Google Scholar] [CrossRef] [Scilit]
- Song, G.; Wu, H.; Duan, Y.; Hu, G. Depression as a causal factor in obstructive sleep apnea: An analysis based on the NHANES 2005–2008. Sleep Res. 2025, 2, 219–227. [Google Scholar] [CrossRef] [Scilit]
- Moyses-Oliveira, M.; Zamariolli, M.; Tempaku, P.F.; Fernandes Galduroz, J.C.; Andersen, M.L.; Tufik, S. Shared genetic mechanisms underlying association between sleep disturbances and depressive symptoms. Sleep Med. 2024, 119, 44–52. [Google Scholar] [CrossRef] [Scilit] [PubMed]
- Weiss, C.; Woods, K.; Filipowicz, A.; Ingram, K.K. Sleep Quality, Sleep Structure, and PER3 Genotype Mediate Chronotype Effects on Depressive Symptoms in Young Adults. Front. Psychol. 2020, 11, 2028. [Google Scholar] [CrossRef] [Scilit] [PubMed]
- Li, W.; Yin, J.; Cai, X.; Cheng, X.; Wang, Y. Association between sleep duration and quality and depressive symptoms among university students: A cross-sectional study. PLoS ONE 2020, 15, e0238811. [Google Scholar] [CrossRef] [Scilit] [PubMed]
- Ramos, J.N.; Muraro, A.P.; Nogueira, P.S.; Ferreira, M.G.; Rodrigues, P.R.M. Poor sleep quality, excessive daytime sleepiness and association with mental health in college students. Ann. Hum. Biol. 2021, 48, 382–388. [Google Scholar] [CrossRef] [Scilit] [PubMed]
- Yu, W.; Tao, B.; Zhu, F.; Gao, Z.; Xiao, Y.; Gong, Q.; Lui, S. Shared cortical characteristics in major depressive disorder, anxiety disorder, and chronic pain: A structural MRI meta-analysis study. Transl. Psychiatry 2025, 15, 430. [Google Scholar] [CrossRef] [Scilit] [PubMed]
- Ye, J.; Xu, C.; Guo, H.; Huang, W.; Xie, G.; Liang, J. Structural and functional thalamic alterations in major depressive disorder with comorbid chronic pain. Sci. Rep. 2025, 15, 16854. [Google Scholar] [CrossRef] [Scilit] [PubMed]
- Lee, D.Y.; Lee, S.; Son, S.J.; Park, R.W.; Park, B. Identifying affective state via clustering of temporal variability in limbic activity and mediating role of negative emotion. Mol. Psychiatry 2026, 31, 1546–1555. [Google Scholar] [CrossRef] [Scilit] [PubMed]
- Braak, S.; Bakker, G.; Su, T.; Osinga, C.; Nawijn, L.; van Tol, M.J.; Van der Wee, N.J.A.; Pijnenburg, Y.; Penninx, B.W.J.H. Social Dysfunction and Neural Processing of Emotional Valence Across Depressive and Anxiety Disorders. Depress. Anxiety 2024, 2024, 8564344. [Google Scholar] [CrossRef] [Scilit] [PubMed]
- DelDonno, S.R.; Jenkins, L.M.; Crane, N.A.; Nusslock, R.; Ryan, K.A.; Shankman, S.A.; Phan, K.L.; Langenecker, S.A. Affective traits and history of depression are related to ventral striatum connectivity. J. Affect. Disord. 2017, 221, 72–80. [Google Scholar] [CrossRef] [Scilit] [PubMed]
- Li, G.; Chen, Y.; Chaudhary, S.; Tang, X.; Li, C.S.R. Loss and Frontal Striatal Reactivities Characterize Alcohol Use Severity and Rule-Breaking Behavior in Young Adult Drinkers. Biol. Psychiatry Cogn. Neurosci. Neuroimaging 2022, 7, 1007–1016. [Google Scholar] [CrossRef] [Scilit] [PubMed]
- Li, G.; Li, Y.; Zhang, Z.; Chen, Y.; Li, B.; Hao, D.; Yang, L.; Yang, Y.; Li, X.; Li, C.S.R. Sex differences in externalizing and internalizing traits and ventral striatal responses to monetary loss. J. Psychiatr. Res. 2023, 162, 11–20. [Google Scholar] [CrossRef] [Scilit] [PubMed]
- Liang, N.; Xue, Z.; Yu, W.; Yang, X.; Ma, Y.; Xu, J.; Sun, Y.; Shen, Y.; Li, H.; Lu, J.; et al. The mediating effect of the striatum-based connectivity on the association between high-sensitivity C-reactive protein and anhedonia in adolescents with depressive disorder. J. Affect. Disord. 2025, 376, 497–506. [Google Scholar] [CrossRef] [Scilit] [PubMed]
- Zhou, Z.; Gao, Y.; Bao, W.; Liang, K.; Cao, L.; Tang, M.; Li, H.; Hu, X.; Zhang, L.; Sun, H.; et al. Distinctive intrinsic functional connectivity alterations of anterior cingulate cortex subdivisions in major depressive disorder: A systematic review and meta-analysis. Neurosci. Biobehav. Rev. 2024, 159, 105583. [Google Scholar] [CrossRef] [Scilit] [PubMed]
- Sambataro, F.; Doerig, N.; Hänggi, J.; Wolf, R.C.; Brakowski, J.; Holtforth, M.G.; Seifritz, E.; Spinelli, S. Anterior cingulate volume predicts response to psychotherapy and functional connectivity with the inferior parietal cortex in major depressive disorder. Eur. Neuropsychopharmacol. 2018, 28, 138–148. [Google Scholar] [CrossRef] [Scilit] [PubMed]
- Hinton, E.C.; Wise, R.G.; Singh, K.D.; von Hecker, U. Reasoning with linear orders: Differential parietal cortex activation in sub-clinical depression. An FMRI investigation in sub-clinical depression and controls. Front. Hum. Neurosci. 2014, 8, 1061. [Google Scholar] [CrossRef] [Scilit] [PubMed]
- Lyu, C.; Lyu, X.; Gong, Q.; Gao, B.; Wang, Y. Neural activation signatures in individuals with subclinical depression: A task-fMRI meta-analysis. J. Affect. Disord. 2024, 362, 104–113. [Google Scholar] [CrossRef] [Scilit] [PubMed]
- Shields, G.S.; Vinograd, M.; Bui, T.; Sichko, S.; Irwin, M.R.; Slavich, G.M. Heightened neural activity and functional connectivity responses to social rejection in female adolescents at risk for depression: Testing the Social Signal Transduction Theory of Depression. J. Affect. Disord. 2024, 345, 467–476. [Google Scholar] [CrossRef] [Scilit] [PubMed]
- Yttredahl, A.A.; McRobert, E.; Sheler, B.; Mickey, B.J.; Love, T.M.; Langenecker, S.A.; Zubieta, J.K.; Hsu, D.T. Abnormal emotional and neural responses to romantic rejection and acceptance in depressed women. J. Affect. Disord. 2018, 234, 231–238. [Google Scholar] [CrossRef] [Scilit] [PubMed]
- Acuña, A.; Morales, S.; Uriarte-Gaspari, L.; Aguirre, N.; Brandani, A.; Huart, N.; Mattos, J.; Pérez, A.; Cuña, E.; Waiter, G.; et al. Increased default mode network activation in depression and social anxiety during upward social comparison. Soc. Cogn. Affect. Neurosci. 2025, 20, nsaf012. [Google Scholar] [CrossRef] [Scilit] [PubMed]
- Davey, C.G.; Allen, N.B.; Harrison, B.J.; Yücel, M. Increased amygdala response to positive social feedback in young people with major depressive disorder. Biol. Psychiatry 2011, 69, 734–741. [Google Scholar] [CrossRef] [Scilit] [PubMed]
- Jankowski, K.F.; Batres, J.; Scott, H.; Smyda, G.; Pfeifer, J.H.; Quevedo, K. Feeling left out: Depressed adolescents may atypically recruit emotional salience and regulation networks during social exclusion. Soc. Cogn. Affect. Neurosci. 2018, 13, 863–876. [Google Scholar] [CrossRef] [Scilit] [PubMed]

Disclaimer/Publisher’s Note: The statements, opinions and data contained in all publications are solely those of the individual author(s) and contributor(s) and not of MDPI and/or the editor(s). MDPI and/or the editor(s) disclaim responsibility for any injury to people or property resulting from any ideas, methods, instructions or products referred to in the content. |
© 2026 by the authors. Licensee MDPI, Basel, Switzerland. This article is an open access article distributed under the terms and conditions of the Creative Commons Attribution (CC BY) license.