


Abstract
Objective: To compare resting-state prefrontal mean baseline-referenced oxygenated hemoglobin concentration change (ΔHbO2) signals among patients with Parkinson’s disease with depression (PD-D), patients with PD without depression (PD-nD), and healthy controls (HCs). Methods: This cross-sectional study included 120 patients with PD, comprising 60 patients with depression and 60 without depression, as well as 60 healthy controls matched for age, sex, and years of education. Resting-state prefrontal hemodynamic signals were acquired using functional near-infrared spectroscopy. The mean baseline-referenced ΔHbO2 signal was calculated for each channel. Results: After correction for multiple comparisons, the mean baseline-referenced ΔHbO2 signal in CH13 (S8–D8) was significantly lower in the PD-D group than in the PD-nD and HC groups. After adjustment for Hamilton Anxiety Rating Scale (HAMA) and Unified Parkinson’s Disease Rating Scale Part III (UPDRS-III) scores and Hoehn–Yahr stage, S8–D8 channel mean baseline-referenced ΔHbO2 signal remained associated with comorbid depression. Each 0.01 μM increase in the mean baseline-referenced CH13 ΔHbO2 signal was associated with lower odds of comorbid depression (OR, 0.570; 95% CI, 0.434–0.747). In an exploratory internal validation analysis that repeated channel screening within 5000 bootstrap resamples, the optimism-corrected AUC was 0.779. Conclusions: The processed ΔHbO2 signal in CH13 differed between the PD-D and PD-nD groups and remained associated with depression-group status after adjustment for measured clinical covariates. This exploratory channel-level finding requires confirmation in independent cohorts.
1. Introduction
Parkinson’s disease (PD) is one of the most common neurodegenerative disorders, presenting with a broad and heterogeneous clinical spectrum that predominantly encompasses both motor and non-motor symptoms [1]. Depression, one of the most frequently reported non-motor manifestations of PD, substantially compromises patients’ quality of life, adversely affects disease prognosis, and imposes a considerable burden on families and society [2]. Accordingly, early screening and effective intervention for PD patients with depression are of critical importance in improving their quality of life and long-term outcomes.
Neuroimaging plays a pivotal role in the study of depression in PD. Traditional neuroimaging modalities, including functional magnetic resonance imaging (fMRI) and positron emission tomography (PET), have provided valuable insights into the neuropathological mechanisms underlying PD [3]. However, these techniques are subject to certain limitations, including contraindications in patients with claustrophobia, acoustic noise interference, susceptibility to motion artifacts, and poor portability, which restrict their applicability in PD patients with depression [4]. Functional near-infrared spectroscopy (fNIRS) is a non-invasive optical imaging technique that measures relative changes in oxygenated and deoxygenated hemoglobin. These signals are sensitive to task- or state-related hemodynamic changes associated with neural activity, but they may also contain superficial and systemic physiological contributions [5]. Compared with the aforementioned conventional modalities, fNIRS offers distinct advantages, such as robustness against motion artifacts and portability, making it particularly well suited to the assessment of brain function in PD patients with depression [6,7]. Previous fNIRS studies in PD have reported altered task-related prefrontal hemodynamic responses during gait, upper-limb movement, and other motor or cognitive paradigms [7,8,9]. However, evidence regarding resting-state regional ΔHbO2 signal differences associated specifically with depression in PD remains limited. However, research on fNIRS-based regional alterations in PD patients with depression remains limited [7]. Moreover, previous studies have predominantly focused on prefrontal functional connectivity and network-level topological properties [10]. Evidence regarding resting-state regional fNIRS signal differences and their relationship to depression status in PD remains limited. Accordingly, the present study aimed to investigate fNIRS-based regional alterations in PD patients with depression and the relationships among these findings.
2. Participants and Methods
2.1. Participants
A total of 120 patients with primary PD who visited the inpatient or outpatient departments of the Affiliated Huai’an Hospital of Xuzhou Medical University between January 2025 and January 2026 were enrolled, comprising 60 patients with PD with depression (PD-D) and 60 PD patients without depression (PD-nD). The inclusion criteria for the PD-D group were as follows: (1) a diagnosis of idiopathic PD established according to the clinical diagnostic criteria for PD of the Movement Disorder Society (MDS) [11]; (2) meeting the criteria for depression defined in the Diagnostic and Statistical Manual of Mental Disorders, Fifth Edition (DSM-5; American Psychiatric Association, 2013) [12], with a Hamilton Depression Rating Scale (HAMD) score ≥ 8 [13]; (3) stable anti-parkinsonian medication for at least 1 month before enrollment; (4) age 40–80 years; and (5) willingness to provide written informed consent. The inclusion criteria for the PD-nD group were as follows: (1) a diagnosis of idiopathic PD according to the MDS clinical diagnostic criteria [11]; (2) a HAMD score < 8 and failure to meet the DSM-5 criteria for depression (American Psychiatric Association, 2013) [12,13]; (3) stable anti-parkinsonian medication for at least 1 month before enrollment; (4) age 40–80 years; and (5) willingness to provide written informed consent. DSM-5 depressive-disorder diagnoses were established by a trained psychiatrist through face-to-face structured clinical interviews. The HAMD-17 was used to quantify depressive symptom severity and was not the sole basis for the DSM-5 diagnosis. The PD-D group included patients who met the DSM-5 criteria for either major depressive disorder or persistent depressive disorder and had a HAMD-17 score ≥ 8. The PD-nD group did not meet the DSM-5 criteria for a depressive disorder and had a HAMD-17 score < 8. The same exclusion criteria were applied to both PD groups: (1) atypical or secondary parkinsonism, including multiple system atrophy, progressive supranuclear palsy, dementia with Lewy bodies, drug-induced parkinsonism, or vascular parkinsonism; (2) a history of cerebrovascular disease that could affect cerebral hemodynamics, including cerebral infarction, intracerebral hemorrhage, transient ischemic attack, vascular dementia, or another clinically significant cerebrovascular disorder; (3) evidence in previous clinical records or available cranial computed tomography or magnetic resonance imaging examinations of an intracranial space-occupying lesion, a clinically significant structural cerebrovascular lesion, or another major structural brain abnormality likely to affect cerebral hemodynamics; (4) cognitive impairment, defined as a Montreal Cognitive Assessment score below 23 [14]; (5) current use of antidepressant medication; (6) another severe neurological or psychiatric disorder; (7) severe or unstable cardiovascular disease, including decompensated heart failure, recent myocardial infarction, a hemodynamically significant arrhythmia, or uncontrolled severe hypertension; (8) severe renal, hepatic, or other systemic disease likely to substantially affect systemic hemodynamics or hemoglobin levels; and (9) inability to complete the clinical assessments or resting-state fNIRS acquisition.
A total of 60 healthy volunteers matched to the PD groups for age, sex, and years of education were recruited from the Physical Examination Center of the Affiliated Huai’an Hospital of Xuzhou Medical University. Healthy controls were screened through a structured clinical interview and standardized neuropsychological assessments. Individuals with a history of neurological disease, psychiatric disorder, cognitive impairment, severe systemic disease, or substance abuse were excluded.
The study protocol was approved before study commencement by the Ethics Committee of the Affiliated Huai’an Hospital of Xuzhou Medical University (approval no. HEYLL202692). All procedures involving human participants were conducted in accordance with the Declaration of Helsinki. Written informed consent was obtained from all participants before enrollment.
2.2. Methods
2.2.1. General Clinical Data Collection
Basic clinical information, including sex, age, educational level, and medical history, was collected by specialist physicians. Disease severity was evaluated using the Hoehn and Yahr (H-Y) stage [15], motor function was assessed using Part III of the Unified Parkinson’s Disease Rating Scale (UPDRS-III) [16], and cognitive function was evaluated using the Montreal Cognitive Assessment (MoCA). Anxiety symptoms were assessed using the Hamilton Anxiety Rating Scale (HAMA). All scale assessments were administered by uniformly trained psychiatrists, and all clinical evaluations were performed in the “on” medication state. All participants with PD continued their usual antiparkinsonian medications on the day of assessment. To standardize medication-related conditions, all clinical assessments and fNIRS recordings were performed approximately 4 h after the most recent levodopa dose, during the clinically assessed “on” medication state. All recordings were conducted between 9:00 and 11:30 a.m. Participants were instructed to abstain from caffeine, smoking, and other nicotine-containing products for at least 2 h before the recording. This outcome was treated as a study-specific temporal summary of the processed baseline-referenced ΔHbO2 signal. It does not represent an absolute hemoglobin concentration, regional cerebral perfusion, or a direct measure of neuronal activity or neurovascular coupling.
2.2.2. Depression Assessment
Depressive symptoms were screened and their severity evaluated using the 17-item Hamilton Rating Scale for Depression (HAMD-17). The scale comprises 17 items covering depressed mood, feelings of guilt, suicide, sleep disturbance (including difficulty falling asleep, middle-of-the-night awakening, and early morning awakening), work and interests, retardation, agitation, psychic anxiety, somatic anxiety, gastrointestinal symptoms, general somatic symptoms, genital symptoms, hypochondriasis, weight loss, and insight. The items for sleep disturbance, gastrointestinal symptoms, general somatic symptoms, genital symptoms, and weight loss are scored as 0 (absent), 1 (mild), or 2 (severe); the remaining items are scored on a 5-point scale from 0 (absent) to 4 (very severe). The total score ranges from 0 to 54, with higher scores indicating more severe depression [17]. In line with previous reports [18], a HAMD-17 score ≥ 8 was used as the cutoff for the presence of depression, which optimally discriminated between patients with and without depressive symptoms. Accordingly, patients were classified as PD-D only when they met the DSM-5 diagnostic criteria for depression and had a HAMD-17 score of 8 or higher. Patients were classified as PD-nD when they did not meet the DSM-5 criteria and had a HAMD-17 score below 8. The HAMD-17 assessment was also performed in the “on” medication state.
2.2.3. fNIRS Data Acquisition and Preprocessing
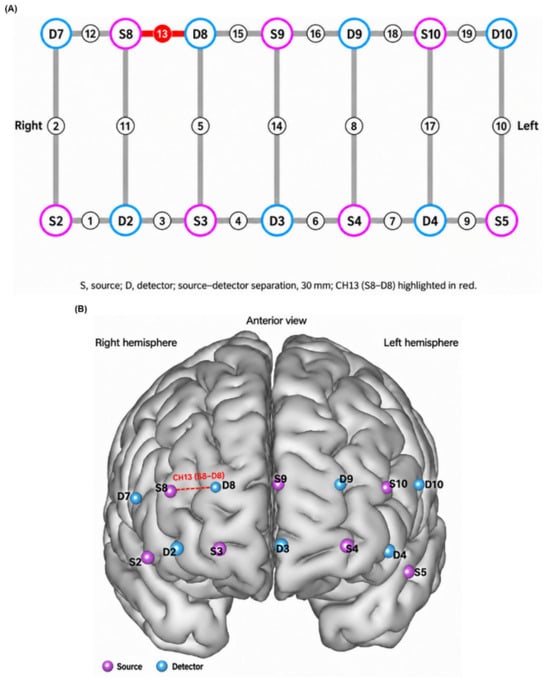
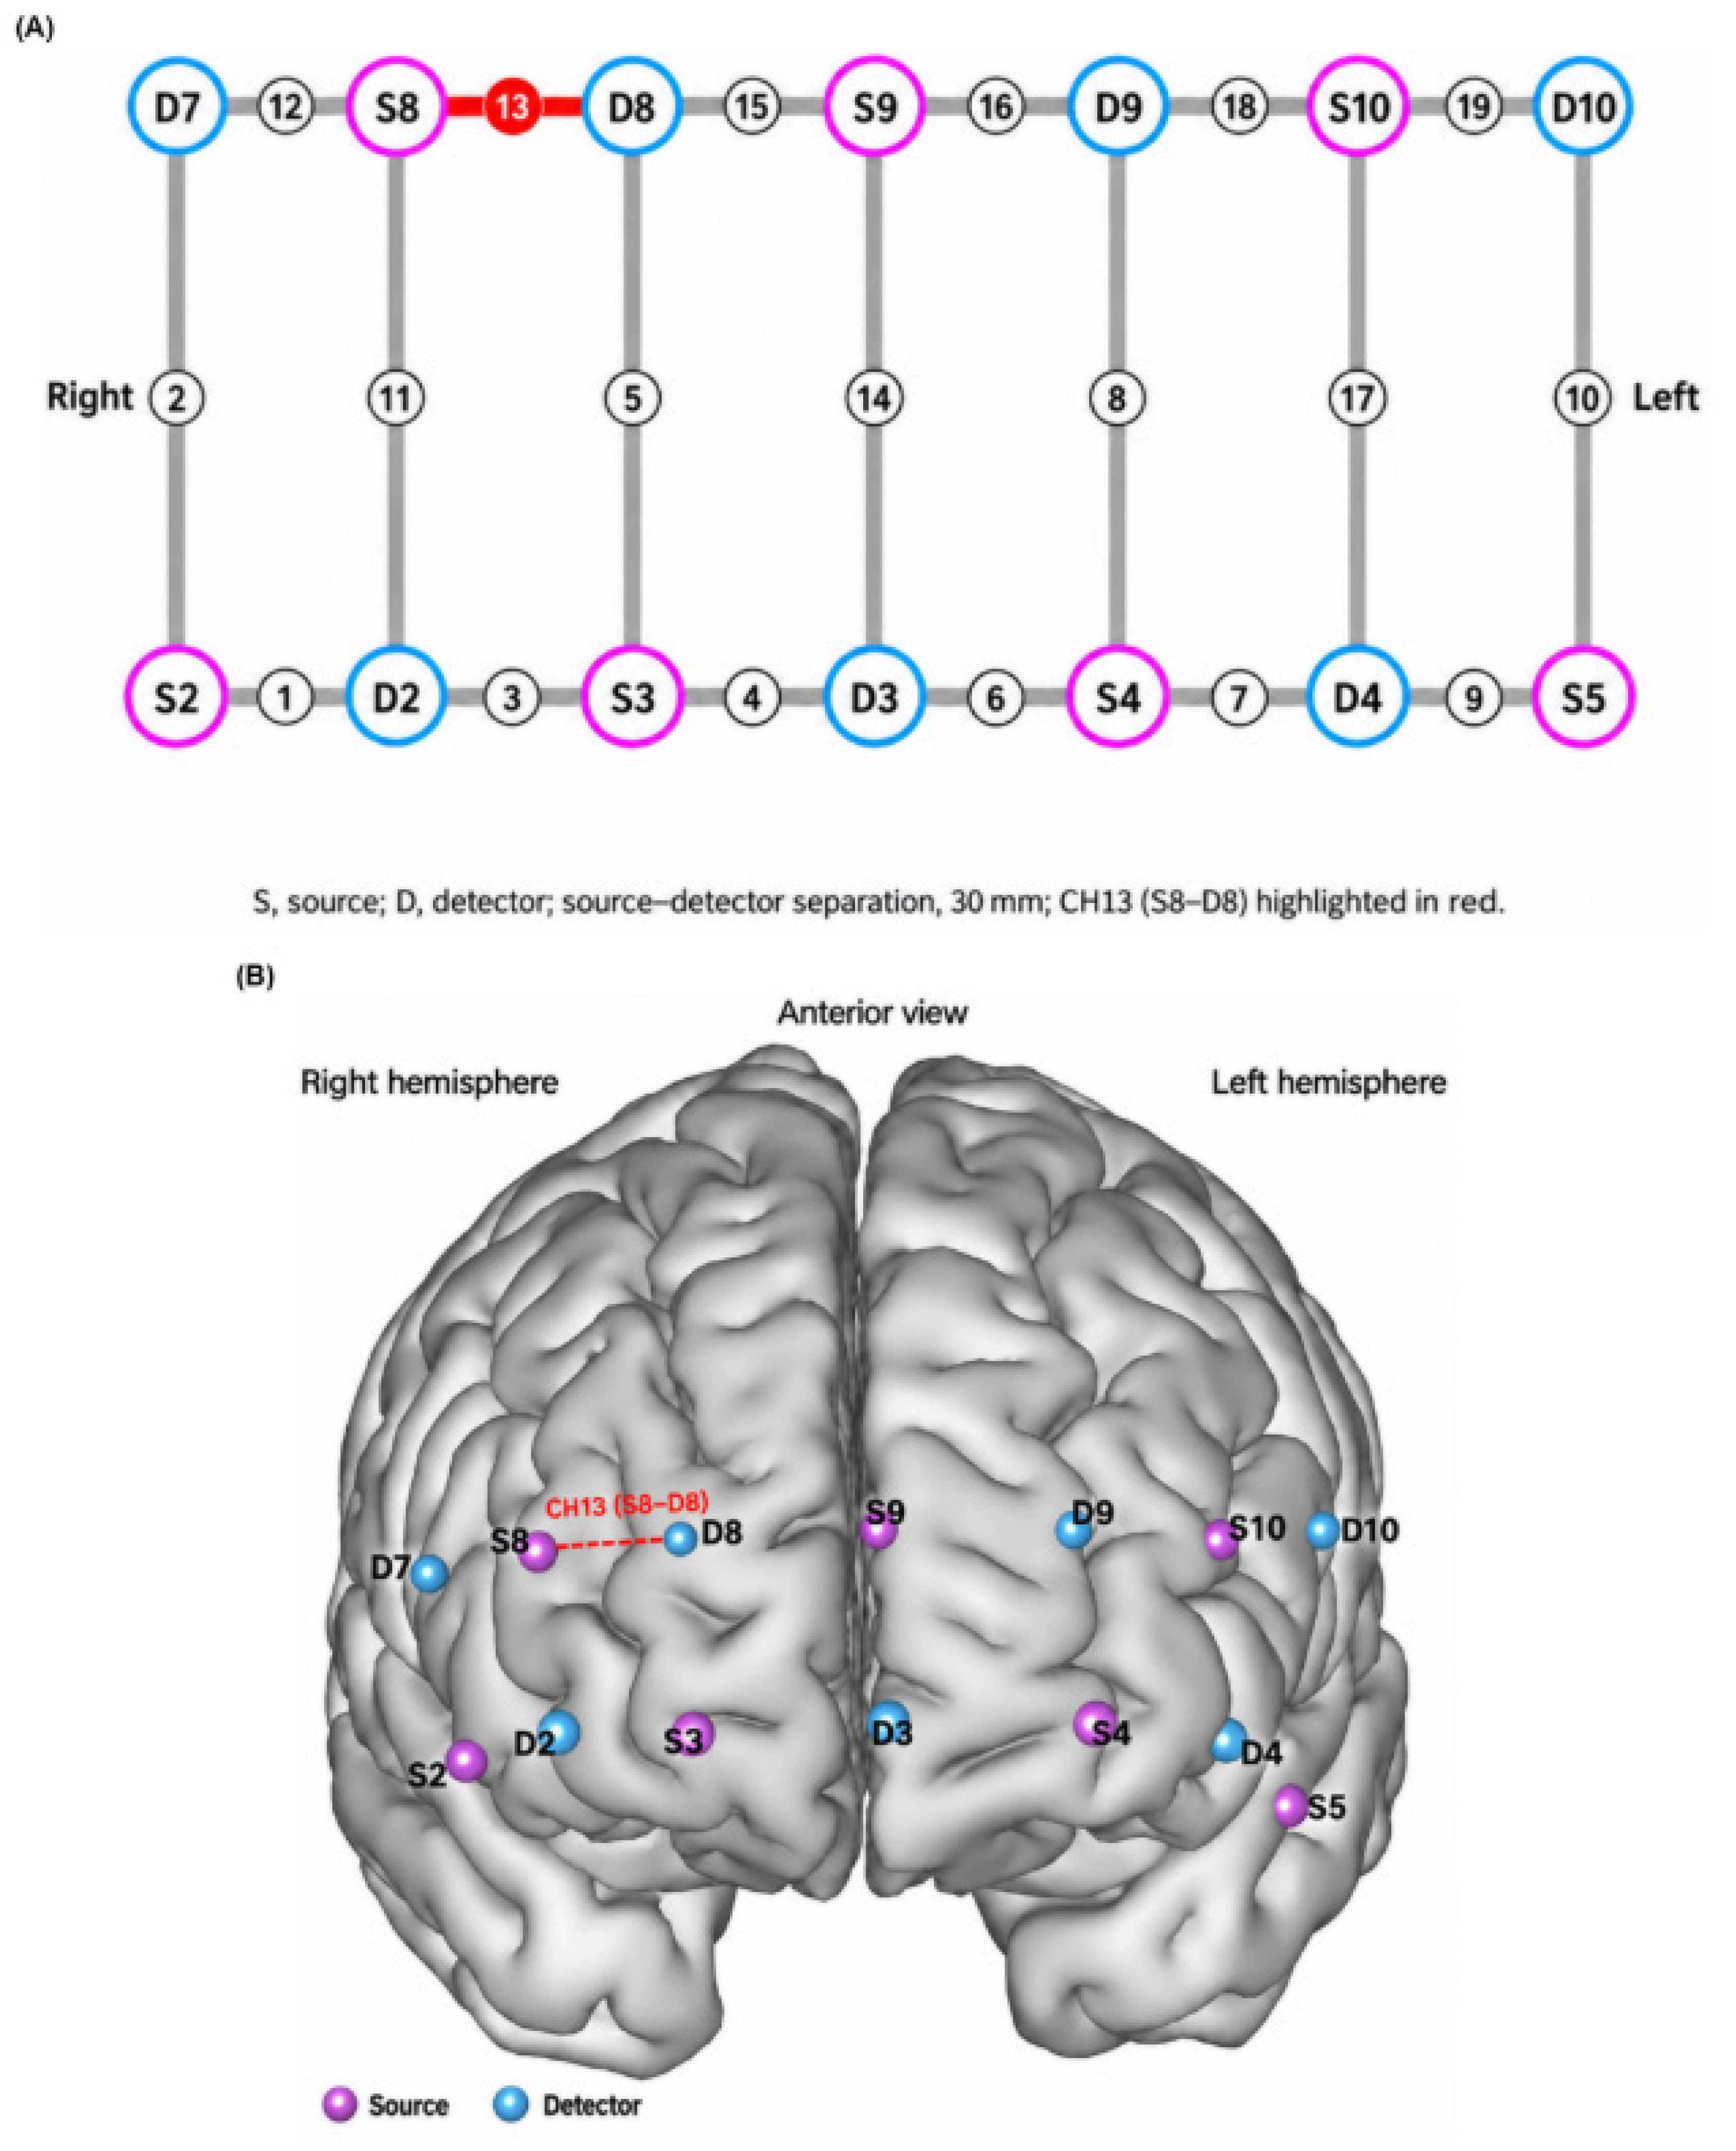
Data were acquired using a NirSmartII-3000A multichannel portable functional near-infrared spectroscopy system (HuiChuang Medical, Danyang, China). The device was equipped with dual-wavelength near-infrared light sources at 730 nm and 850 nm, with a sampling rate of 11 Hz and a standard source–detector separation of 30 mm. The montage consisted of standard-distance measurement channels and did not include short-separation channels. Concurrent systemic physiological variables, including heart rate, respiration, blood pressure, and orthostatic blood-pressure changes, were not recorded. Therefore, short-separation regression and physiological-signal regression were not performed. The NirSpark (1.8.1) research analysis software was used to record relative changes in oxygenated hemoglobin concentration (ΔHbO2) in real time, while raw light intensity data were simultaneously stored for subsequent offline correction. Measurements were performed in a sound-attenuated, dimly lit, and temperature-controlled environment to avoid external interference such as strong light and acoustic stimuli. Before testing, all participants rested quietly in a seated position for 5 min to maintain emotional stability. A flexible elastic head cap of appropriate size was selected according to each participant’s head circumference, and optode placement strictly followed the international 10–20 electroencephalography positioning system. In line with the study aim of assessing prefrontal hemodynamic characteristics, a prefrontal-specific optode configuration was adopted, generating 19 effective measurement channels that predominantly covered the bilateral dorsolateral prefrontal cortex, orbitofrontal cortex, medial prefrontal cortex, and frontopolar regions [19]. The complete source–detector arrangement and the corresponding anterior-view cortical projection are shown in Figure 1A,B, respectively. CH13, formed by source S8 and detector D8 with a source–detector separation of 30 mm, is highlighted in red. After fitting, adequate optode–scalp contact was confirmed to ensure stable signals and a favorable signal-to-noise ratio across all channels. To minimize interference from tremor and head movement in patients with PD, a head support device was used to help stabilize posture during measurement. Participants sat comfortably with their eyes open, gazing at a fixed marker placed in front of them, and remained quiet, awake, and relaxed at rest, avoiding deliberate thinking, emotional activity, and superfluous head or limb movements. Recording began once the baseline signal had stabilized, and resting-state data were continuously acquired for 6 min. During acquisition, a designated investigator monitored each participant’s status; if obvious motion artifacts, drowsiness, or agitation occurred, recording was interrupted and restarted after a rest period [20].
Figure 1.
Optode configuration and approximate cortical localization of the prefrontal measurement channels. (A) Source–detector arrangement generating the 19 prefrontal measurement channels. Sources are shown in magenta, detectors in blue, and CH13, formed by source S8 and detector D8, is highlighted in red. The source–detector separation was 30 mm. (B) Anterior view of the cortical projection of the optode configuration. CH13 is highlighted in red and is approximately positioned over the right dorsolateral prefrontal cortex. Image left corresponds to the participant’s right hemisphere.
Offline preprocessing of the raw data was performed using NirSpark software. Continuous-wave fNIRS measures changes in hemoglobin concentration relative to a reference level rather than absolute hemoglobin concentrations. For each participant, wavelength, and channel, the mean light intensity during the first 30 s of the six-minute recording was used solely as the reference for calculating changes in optical density. The recorded light-intensity signals were converted into changes in optical density relative to this reference.
Signal quality was evaluated for each channel using the coefficient of variation (CV) of the raw light-intensity signal, calculated as the standard deviation divided by the mean and expressed as a percentage. Channels with a CV greater than 20% were classified as poor-quality channels and excluded from subsequent analysis. A participant was excluded from the fNIRS analysis when poor-quality channels accounted for more than 25% of the 19 measurement channels, corresponding to five or more channels. This quality-control procedure was applied before group comparisons and all subsequent statistical analyses.
Motion artifacts in the optical-density signals were corrected using spline interpolation with the following parameters: STDEVthresh = 6, AMPThresh = 0.5, tMotion = 0.5 s, and tMask = 1 s. Following motion correction, a fourth-order zero-phase Butterworth band-pass filter between 0.01 and 0.1 Hz was applied. The 0.01 Hz high-pass component was used to attenuate very slow baseline drift, whereas the 0.1 Hz low-pass component attenuated higher-frequency physiological fluctuations and instrumental noise. No additional polynomial detrending was performed. The filtered optical-density signals were converted to relative concentration changes in oxygenated hemoglobin (ΔHbO2) and deoxygenated hemoglobin (ΔHbR) using the modified Beer-Lambert law, with a differential pathlength factor of 6.0 [21]. After motion correction and band-pass filtering, the first and last 30 s were excluded from the analytical window to reduce initial signal instability and filtering-related boundary effects. Thus, the initial 30 s reference interval was not included in the final 300 s temporal mean, and only the middle 300 s were retained for analysis. For each channel, the mean processed ΔHbO2 signal over the retained 300 s interval was calculated as a simple channel-level summary. This study-specific, baseline-referenced measure does not represent absolute hemoglobin concentration, cerebral perfusion, neuronal activity, or neurovascular coupling. Other signal features, including spectral power and functional connectivity, were outside the scope of this exploratory analysis.
2.3. Statistical Analysis
Statistical analyses were performed using SPSS version 25.0. Normally distributed continuous variables were expressed as the mean ± standard deviation (SD). Comparisons between two groups were performed using the independent-samples t test, whereas comparisons among three groups were performed using one-way analysis of variance (ANOVA). When an overall group difference was statistically significant, post hoc pairwise comparisons were conducted using the Bonferroni method. When the assumption of homogeneity of variance was violated, Welch’s ANOVA was used, followed by Games–Howell pairwise comparisons. Non-normally distributed continuous variables were expressed as the median and interquartile range (IQR). Comparisons between two groups were performed using the Mann–Whitney U test, whereas comparisons among three groups were performed using the Kruskal–Wallis test. Following a statistically significant overall difference, pairwise comparisons were conducted using the Dunn–Bonferroni method. Categorical variables were expressed as counts and percentages and compared using the chi-square (χ2) test. The mean baseline-referenced ΔHbO2 signal was compared among the three groups separately for each of the 19 prefrontal measurement channels. These channel-wise comparisons constituted the primary analysis. The Benjamini–Hochberg procedure was used to control the false discovery rate across the 19 channels, and FDR-adjusted p values (q values) were reported. A q value below 0.05 was considered statistically significant. As a sensitivity analysis, the channel-wise analyses were repeated in the 120 patients with PD using separate multivariable linear regression models for all 19 channels. Each model included depression-group status, HAMA score, UPDRS-III score, and Hoehn–Yahr stage. Heteroscedasticity-consistent HC3 standard errors were used. Because depression-group status and HAMA score were included simultaneously as predictors, multicollinearity was assessed using variance inflation factors (VIFs) and tolerance values. The same predictor set was used for all 19 channel-wise models; therefore, the VIF and tolerance values were identical across these models. The p values for the adjusted depression-group effects were corrected across the 19 channels using the Benjamini–Hochberg procedure. CH13 (S8–D8) was selected for subsequent post hoc analyses because it showed a significant group difference after FDR correction. The subsequent multivariable logistic regression and receiver operating characteristic analyses involving CH13 were data-driven post hoc analyses conducted in the same dataset. Because of the small numerical scale of the CH13 ΔHbO2 values, the original values were multiplied by 100 before inclusion in the logistic regression model. Consequently, the corresponding odds ratio represented the change in the odds of depression associated with a 0.01 μM increase in the original CH13 ΔHbO2 value. Multivariable logistic regression was used to examine the association between the CH13 ΔHbO2 signal and depression status after adjustment for HAMA score, UPDRS-III score, and Hoehn–Yahr stage. For the logistic regression model, VIFs were calculated among the predictor variables. Depression status was the dependent variable and was therefore not included in the VIF calculation. An exploratory ROC curve analysis was performed to assess the apparent ability of the CH13 ΔHbO2 signal to distinguish patients with PD-D from those with PD-nD. The area under the curve (AUC) and its 95% confidence interval (CI) were calculated. The sample-specific cutoff was determined by maximizing the Youden index, and the corresponding apparent sensitivity and specificity were reported. Because channel selection and the subsequent association and discrimination analyses involved the same participants, these secondary analyses were considered exploratory. No independent external validation cohort was available; therefore, bootstrap internal validation with 5000 resamples was performed to estimate the optimism-corrected AUC and its 95% confidence interval. Therefore, the ROC-derived AUC, sensitivity, specificity, and cutoff were regarded as apparent, sample-specific estimates rather than validated diagnostic performance. To account for optimism arising from data-driven channel selection and performance estimation in the same sample, an internal validation analysis was performed using 5000 stratified bootstrap resamples. The bootstrap procedure preserved the original group sizes. Within each bootstrap resample, channel screening was repeated across all 19 channels using the same group-comparison framework, and the channel with the largest omnibus group-separation statistic was selected. The apparent AUC was calculated in the bootstrap resample, and test performance was evaluated in the original sample. Optimism was defined as the difference between the bootstrap-sample AUC and the corresponding test AUC. The mean optimism across the 5000 resamples was subtracted from the original apparent AUC to obtain the optimism-corrected AUC. This analysis was considered internal validation and not a substitute for external validation in an independent cohort. All statistical tests were two-sided, and p < 0.05 was considered statistically significant.
3. Results
3.1. Comparison of General Clinical Data
The clinical characteristics of the three groups are summarized in Table 1. One-way ANOVA revealed no significant differences among the three groups in age or MoCA scores (p > 0.05), whereas HAMA scores were significantly higher in the PD-D group than in the PD-nD and HC groups (p < 0.05). The chi-square test showed no significant difference in sex distribution among the groups (p > 0.05). The KruskalWallis H test demonstrated no significant differences among the three groups in years of education (p > 0.05), whereas HAMD-17 scores were significantly higher in the PD-D group than in the PD-nD and HC groups (p < 0.05). Independent-samples t tests showed no significant differences between the PD-D and PD-nD groups in age at onset or levodopa equivalent daily dose (LEDD) (p > 0.05). The MannWhitney U test revealed no significant difference in disease duration between the two groups (p > 0.05), whereas UPDRS-III scores and HoehnYahr stage were significantly higher in the PD-D group than in the PD-nD group (p < 0.05).
Table 1.
Demographic and Clinical Characteristics of the PD-D, PD-nD, and HC Groups.
3.2. Comparison of Mean Baseline-Referenced ΔHbO2 Signals Across the PD-D, PD-nD, and HC Groups
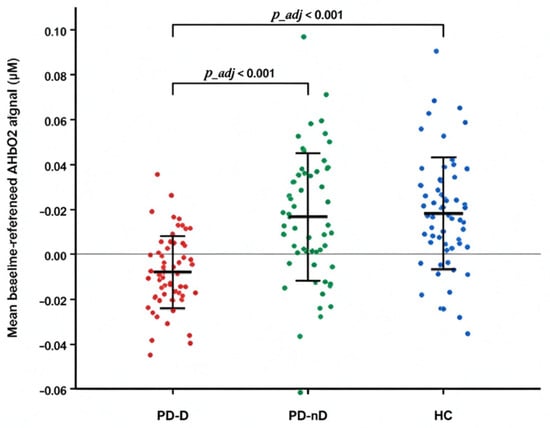
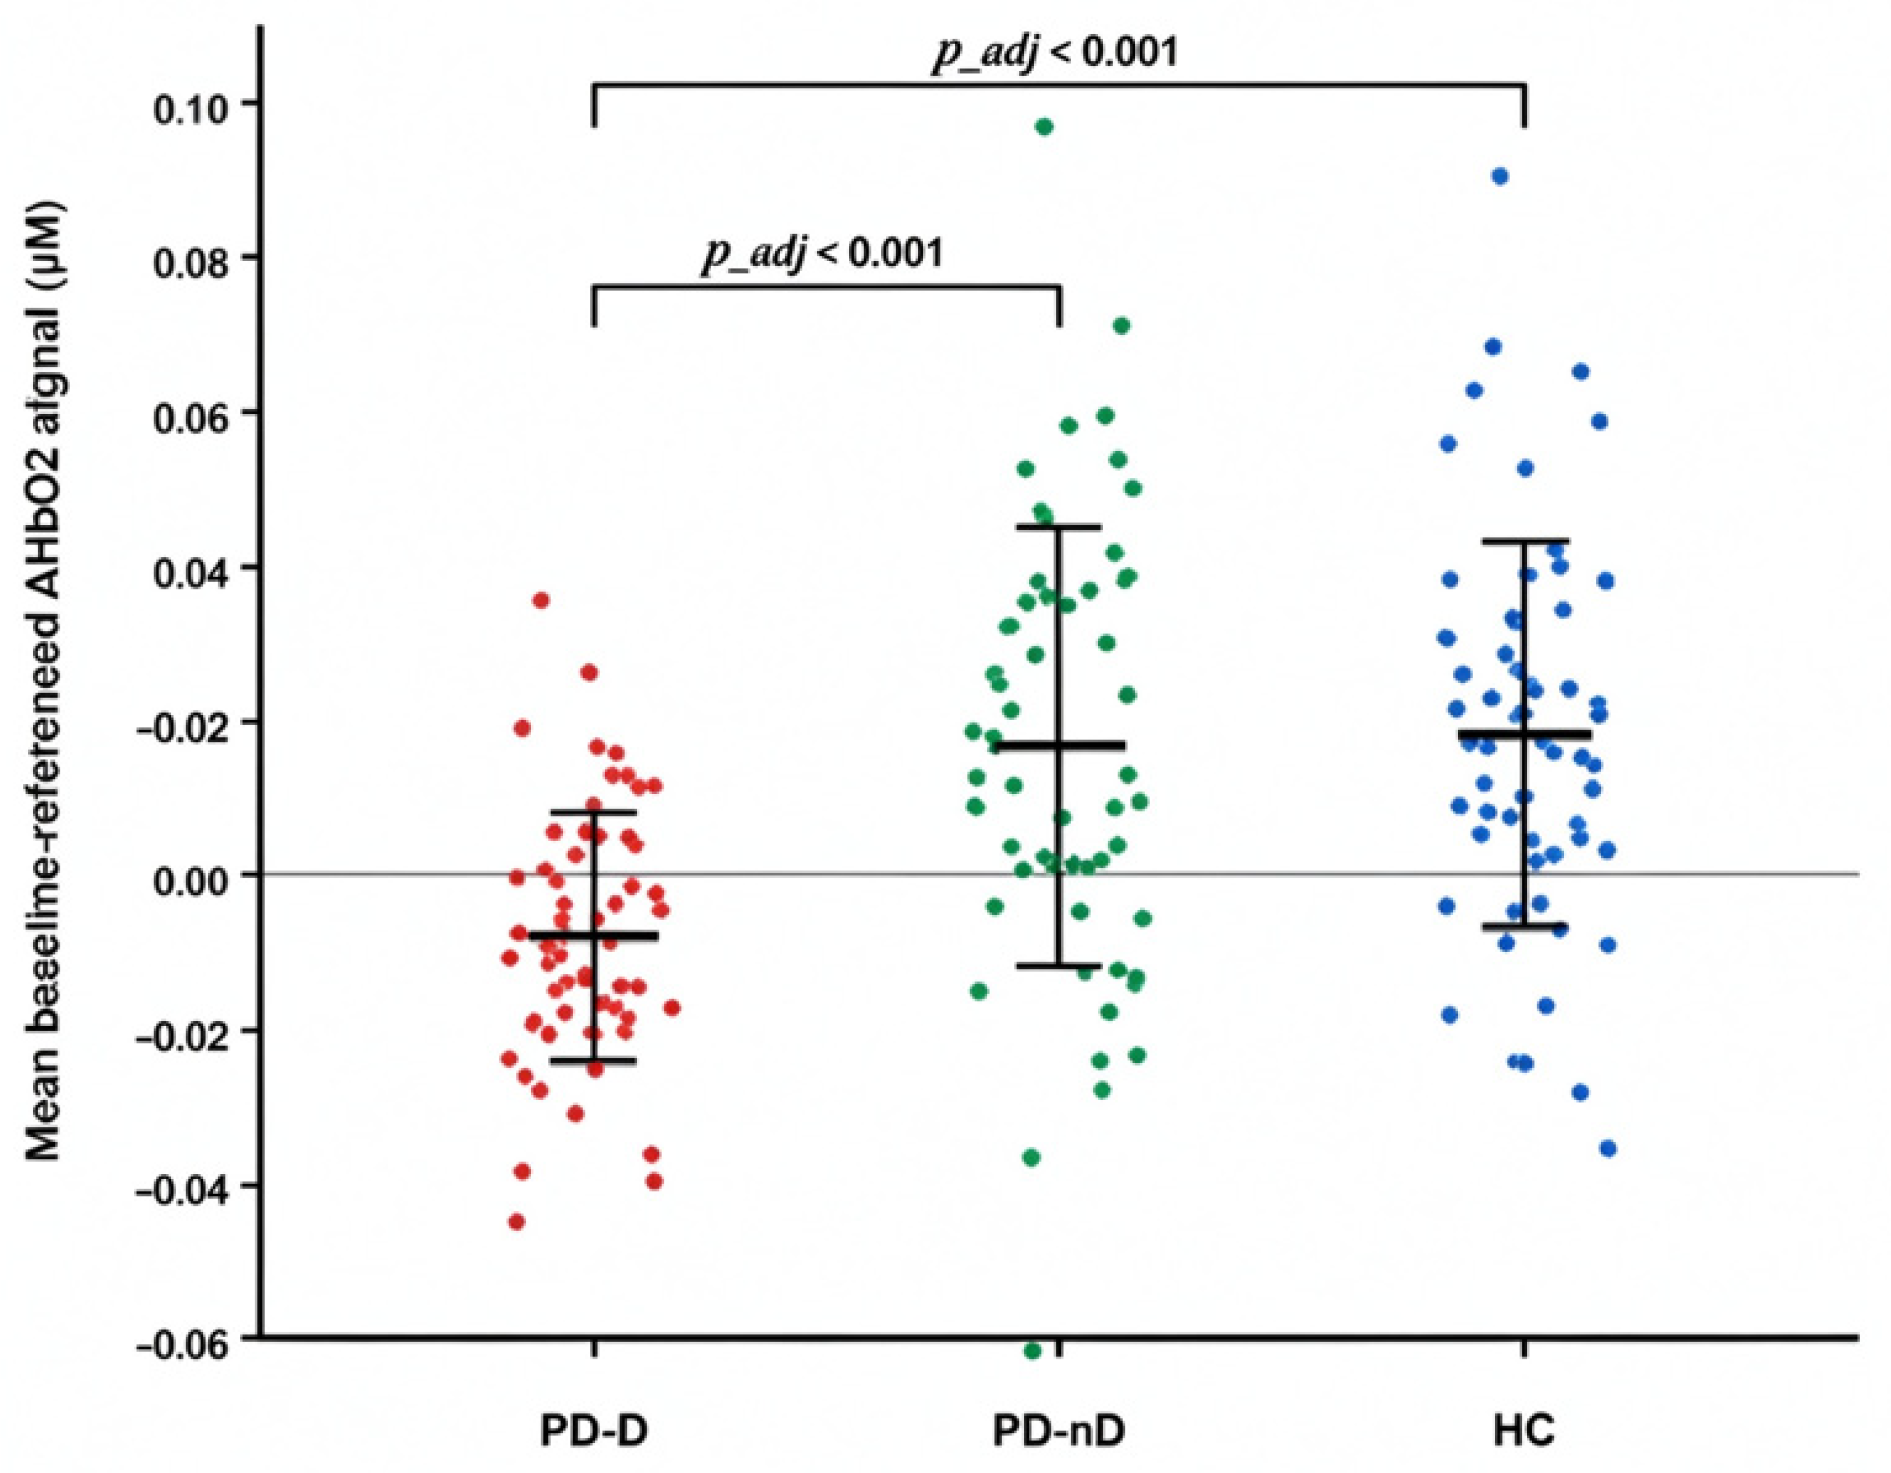
Comparisons of Mean Baseline-Referenced ΔHbO2 Signals across the 19 channels are presented in Table 2. After false discovery rate correction, CH13 (S8–D8) showed a significant overall group difference (q < 0.001). Post hoc comparisons indicated lower Mean Baseline-Referenced ΔHbO2 Signals in the PD-D group than in both the PD-nD and HC groups (p < 0.05). No other channel showed a significant group difference after false discovery rate correction. In the adjusted channel-wise sensitivity analysis restricted to patients with PD, CH13 remained associated with depression-group status after adjustment for HAMA score, UPDRS-III score, and Hoehn–Yahr stage and application of HC3 standard errors. The adjusted depression-group effect was significant for CH13 (B = −0.0283 μM, HC3 95% CI −0.0383 to −0.0183, p < 0.001, FDR-adjusted p < 0.001). The VIF values were 1.362 for depression-group status, 1.254 for HAMA score, 1.215 for UPDRS-III score, and 1.194 for Hoehn–Yahr stage. The corresponding tolerance values were 0.734, 0.797, 0.823, and 0.838, respectively. These values did not indicate severe multicollinearity in the specified models. The complete channel-wise regression results are presented in Table S2, and the corresponding multicollinearity diagnostics are presented in Table S3. Individual-level signal distributions for CH13 across the three groups are illustrated in Figure 2.
Table 2.
Comparison of Mean Baseline-Referenced ΔHbO2 Signals Across 19 Channels Among the PD-D, PD-nD, and HC Groups.
Figure 2.
Comparison of the ΔHbO2 in CH13 (S8−D8s. ndividual observations are shown as jittered points. red points represent the PD-D group, green points represent the PD-nD group, and blue points represent the HC group. Horizontal lines and error bars indicate the mean and standard deviation, respectively.
3.3. Post Hoc Multivariable Logistic Regression Analysis of Depression Status in Patients with PD
The results of the post hoc multivariable logistic regression analysis are presented in Table 3. Depression status was entered as the dependent variable (PD-D = 1 and PD-nD = 0). The mean baseline-referenced ΔHbO2 signal in CH13, HAMA score, UPDRS-III score, and Hoehn–Yahr stage were entered as independent variables. After adjustment for HAMA score, UPDRS-III score, and Hoehn–Yahr stage, the mean baseline-referenced ΔHbO2 signal in CH13 remained associated with depression status. In this logistic regression model, the VIF values were 1.033 for the mean baseline-referenced CH13 ΔHbO2 signal, 1.119 for HAMA score, 1.185 for UPDRS-III score, and 1.145 for Hoehn–Yahr stage. In the supplementary multiple linear regression analysis, the association between depression-group status and the mean baseline-referenced CH13 ΔHbO2 signal also remained significant after adjustment for HAMA score and other demographic and clinical covariates (B = −0.0267, 95% CI −0.0365 to −0.0170, p < 0.001; Supplementary Table S1). Each 0.01 μM increase in the original CH13 ΔHbO2 value was associated with lower odds of PD-D versus PD-nD (OR, 0.570; 95% CI, 0.434–0.747; p < 0.001). We further performed multiple linear regression analyses with the mean baseline-referenced CH13 ΔHbO2 signal as the dependent variable and depression-group status as the primary independent variable. Depression-group status remained associated with the CH13 ΔHbO2 signal after adjustment for age, sex, years of education, disease duration, levodopa equivalent daily dose, and UPDRS-III score (B = −0.0249, 95% CI −0.0340 to −0.0158, p < 0.001; adjusted R2 = 0.197). The association remained significant after additional adjustment for HAMA score (B = −0.0267, 95% CI −0.0365 to −0.0170, p < 0.001; adjusted R2 = 0.197). A sensitivity model replacing UPDRS-III score with Hoehn–Yahr stage produced a comparable result (B = −0.0292, 95% CI −0.0394 to −0.0190, p < 0.001; adjusted R2 = 0.220). No severe multicollinearity was detected. Detailed results are provided in Supplementary Table S1.
Table 3.
Multivariable Logistic Regression Analysis of Factors Associated with Depression in tgPatients with PD.
3.4. Exploratory ROC Analysis of the CH13 ΔHbO2 Signal
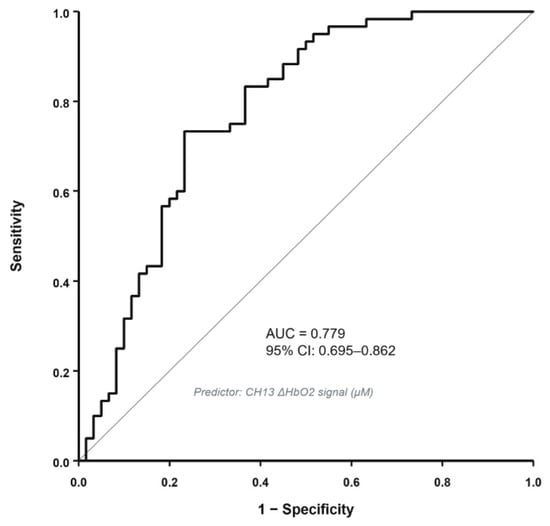
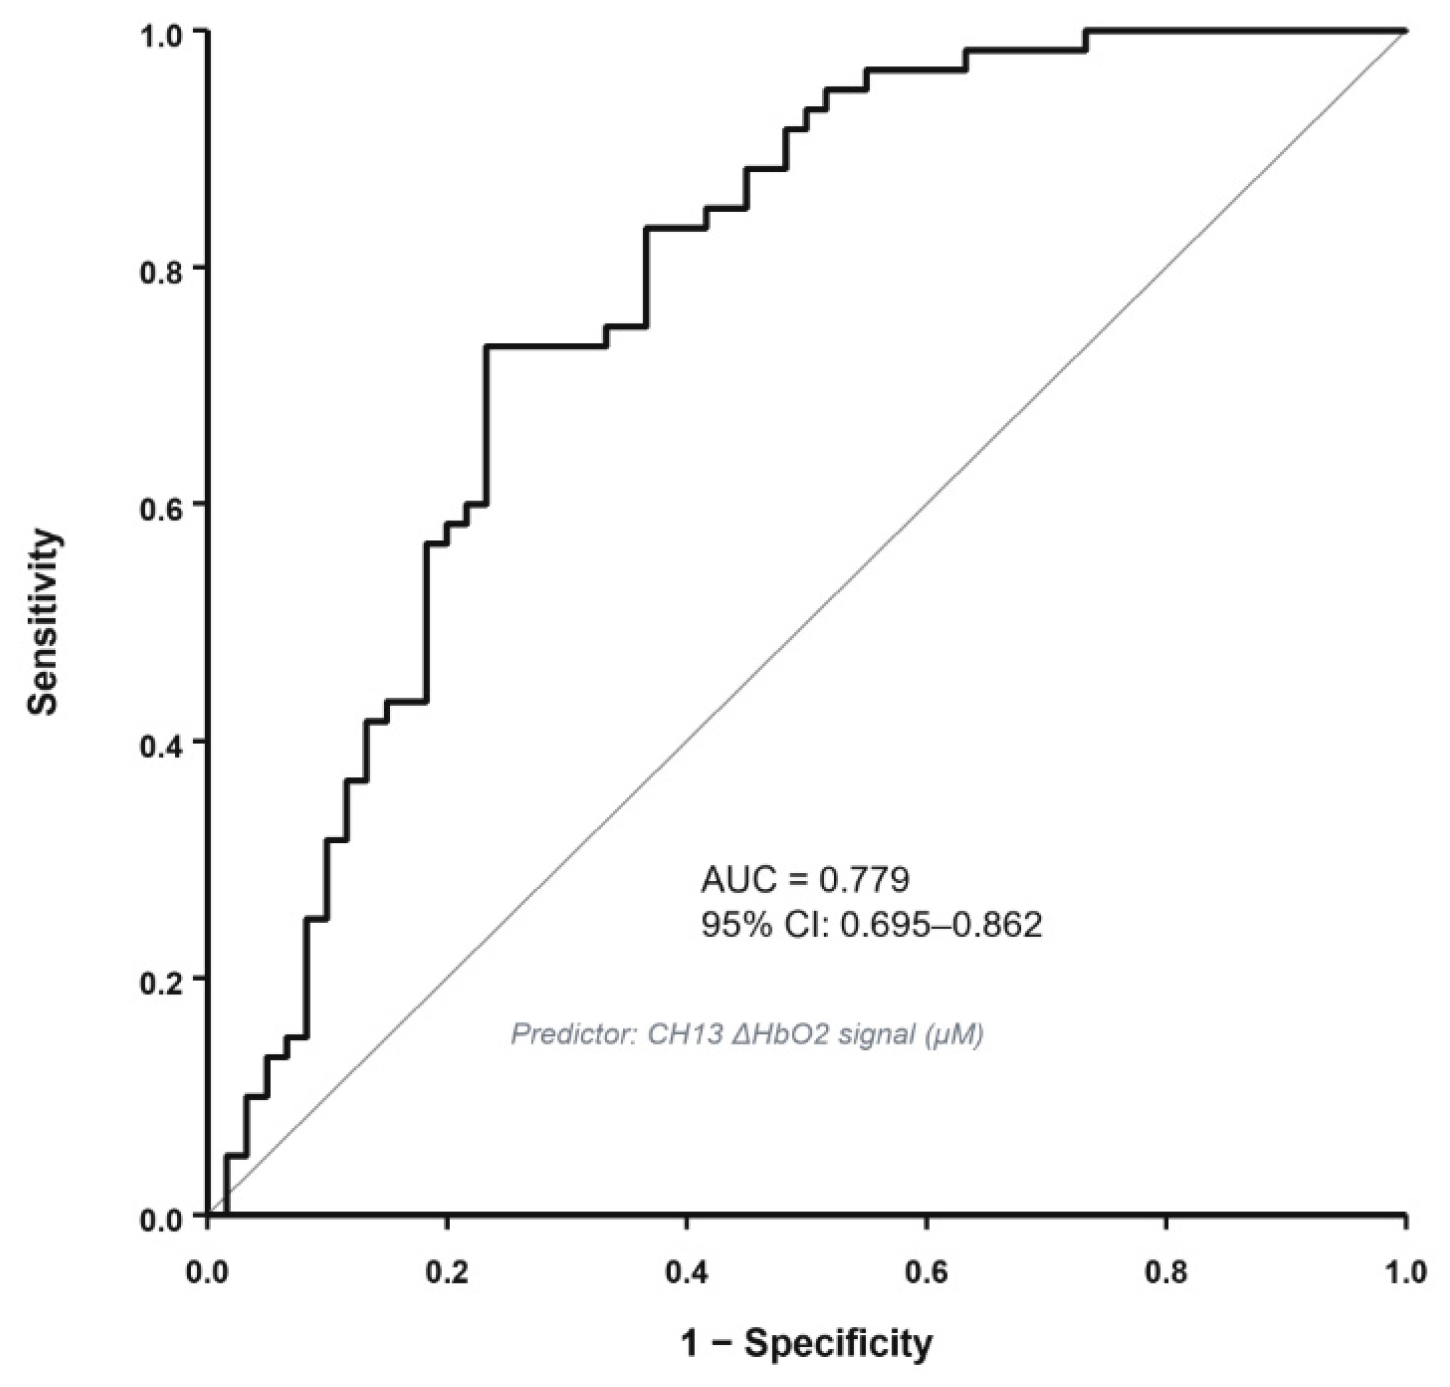
In the exploratory ROC analysis, the apparent AUC of the CH13 mean baseline-referenced ΔHbO2 signal for separating the PD-D and PD-nD groups was 0.779 (95% CI, 0.695–0.862). The sample-derived cutoff was approximately 0.0005 μM, with an apparent sensitivity of 73.3% and specificity of 76.7%. The corresponding Youden index was 0.500. The ROC curve is shown in Figure 3. In the 5000-resample bootstrap analysis that repeated channel screening within each resample, the estimated mean optimism was 0.0006, resulting in an optimism-corrected AUC of 0.779. CH13 was selected as the strongest group-separating channel in 4975 of the 5000 bootstrap resamples. These findings indicate internal stability of the observed group separation, but the cutoff, sensitivity, and specificity remain sample-derived estimates and should not be interpreted as externally validated diagnostic performance.
Figure 3.
Exploratory ROC curve based on the mean baseline-referenced CH13 ΔHbO2 signal.
4. Discussion
In this study, we enrolled 120 patients with PD and 60 healthy controls and used functional near-infrared spectroscopy to examine resting-state prefrontal hemodynamic differences associated with depression in PD. Compared with the PD-nD and healthy control groups, the PD-D group showed a lower mean baseline-referenced CH13 ΔHbO2 signal. Compared with the PD-nD and healthy control groups, the PD-D group showed a lower mean baseline-referenced CH13 ΔHbO2 signal. In a post hoc multivariable logistic regression analysis, the mean baseline-referenced ΔHbO2 signal in CH13 remained associated with depression-group status after adjustment for HAMA score, UPDRS-III score, and Hoehn–Yahr stage. In a post hoc multivariable logistic regression analysis, the mean baseline-referenced ΔHbO2 signal in S8–D8 remained associated with depression status after adjustment for HAMA score, UPDRS-III score, and Hoehn–Yahr stage. The revised analyses therefore support only an exploratory between-group difference in the CH13 summary measure and do not establish the CH13 signal as a continuous marker of depressive symptom severity within either PD group.
Based on the optode configuration used in this study and spatial localization data from previous studies employing comparable configurations, channel CH13, formed by source S8 and detector D8, primarily corresponded to the right dorsolateral prefrontal cortex (DLPFC) [22]. Based on the optode configuration and spatial localization information from previous studies using comparable montages, CH13, formed by source S8 and detector D8, was approximately positioned over the right dorsolateral prefrontal cortex. However, fNIRS channels represent measurement paths between sources and detectors rather than anatomically exclusive cortical regions. In addition, because short-separation measurements were not available, the CH13 signal may contain both cerebral and superficial hemodynamic contributions. The anatomical interpretation of this channel should therefore be considered approximate.
In the present study, the mean baseline-referenced ΔHbO2 signal in S8–D8 channel was significantly lower in the PD-D group than in both the PD-nD and healthy control groups. This finding represents an exploratory between-group difference in a study-specific, reference-based fNIRS summary measure obtained from CH13, which was approximately positioned over the right prefrontal region. The outcome may be influenced by the preprocessing pipeline, reference definition, filtering parameters, and temporal analysis window. Although superficial blood flow and systemic physiological contributions cannot be completely excluded, the persistence of the group difference after standardized acquisition and statistical adjustment supports its potential relevance to the neurobiological differences associated with depression in PD. Previous neuroimaging studies have similarly implicated the DLPFC in PD-related depression. Tian et al. [10] reported reduced prefrontal functional connectivity in patients with PD-D, suggesting that prefrontal dysfunction may play an important role in the pathophysiology of depression in PD. A resting-state fMRI study [23] showed that patients with PD-D exhibited a lower amplitude of low-frequency fluctuations in the DLPFC than PD patients without depression, indicating attenuated spontaneous neural activity in this region. Another study [24] identified reduced interhemispheric synchronization between the bilateral DLPFC regions in patients with PD-D, further supporting the involvement of DLPFC network dysfunction in the pathophysiology of depression in PD. A lower resting-state relative ΔHbO2 signal cannot by itself indicate neuronal hypoactivity, reduced cerebral perfusion, or impaired neurovascular coupling because fNIRS measures baseline-referenced concentration changes that may contain cerebral, superficial, systemic, and methodological contributions. Although CH13 was approximately positioned over the right DLPFC, this single-channel finding does not directly conform to the classical left-prefrontal-hypoactivity model, which was developed largely in depression without neurodegenerative disease. Moreover, depression in neurodegenerative disorders is increasingly understood as a distributed network phenomenon [25]. The CH13 result should therefore be regarded as a localized observation within a potentially broader network alteration. Inter-channel functional connectivity analysis is an important next step, while the present finding does not identify a neuromodulation target or establish treatment relevance.
The DLPFC is a major cortical node involved in executive control, working memory, attentional allocation, cognitive reappraisal, and emotion regulation [26,27,28]. Through prefrontal–striatal and prefrontal–limbic circuits, it is closely connected to the anterior cingulate cortex, orbitofrontal cortex, striatum, and amygdala, enabling it to modulate emotional processing [10,29]. DLPFC dysfunction may impair cognitive control over negative emotional information, thereby increasing susceptibility to depressive symptoms and potentially contributing to greater symptom severity [30]. After adjustment for HAMA and UPDRS-III scores and Hoehn–Yahr stage, mean baseline-referenced CH13 ΔHbO2 signal remained statistically associated with depression in patients with PD. For every 0.01 μM increase in the mean baseline-referenced CH13 ΔHbO2 signal, the odds of depression were 0.570 times as high (OR = 0.570), corresponding to a 43.0% reduction in the odds. These adjusted analyses indicate that the association between the CH13 ΔHbO2 signal and depression-group status was not explained solely by measured differences in anxiety severity, motor impairment, or overall disease severity. However, adjustment for HAMA score cannot substitute for direct measurement of heart rate, respiration, or superficial blood flow and therefore does not establish the cerebral specificity of the CH13 signal. An exploratory ROC analysis yielded an apparent AUC of 0.779 for separating the PD-D and PD-nD groups. Because CH13 was selected and evaluated within the same dataset, this apparent performance was susceptible to selection-related optimism. We therefore performed a 5000-resample stratified bootstrap internal validation in which channel screening was repeated across all 19 channels within each resample. The estimated mean optimism was 0.0006, resulting in an optimism-corrected AUC of 0.779. Bootstrap optimism correction addresses sampling-related optimism but cannot correct systematic artifacts related to superficial blood flow, systemic physiology, or preprocessing. Therefore, the apparent and optimism-corrected AUC values are sample-specific and should not be interpreted as validated diagnostic performance. CH13 was retained as the strongest group-separating channel in 4975 of the 5000 bootstrap resamples, indicating internal stability of the observed group difference; however, this selection frequency reflects resampling behavior within the same dataset and does not establish physiological validity or external reproducibility. Sensitivity analyses further supported the robustness of the observed association between CH13 signal and depression status in PD patients. Multiple linear regression confirmed lower mean baseline-referenced CH13 ΔHbO2 values in the PD-D group after adjustment for demographic and clinical covariates. The association remained significant after additional adjustment for HAMA score and in the sensitivity model in which Hoehn–Yahr stage replaced UPDRS-III score. Although the reported VIF and tolerance values did not indicate severe coefficient instability in the channel-wise models, adjustment for HAMA score cannot completely separate anxiety from depression because the two constructs contain overlapping psychic and somatic symptom domains. These supplementary analyses supported the robustness of the observed group difference, although they could not establish a causal relationship. These consistency analyses strengthen confidence in our primary findings, although they cannot resolve the cross-sectional uncertainty regarding causal direction.
Using resting-state functional near-infrared spectroscopy, this study characterized mean baseline-referenced prefrontal ΔHbO2 signals in patients with PD. Our findings identify an exploratory prefrontal channel-level ΔHbO2 difference associated with depression-group status in PD. They also extend the limited evidence concerning cortical functional differences associated with this neuropsychiatric comorbidity. Several limitations should be acknowledged. First, the fNIRS montage used standard 30 mm source–detector channels without short-separation measurements or concurrent monitoring of heart rate and respiration. Therefore, superficial hemodynamic and systemic physiological contributions could not be independently separated from the measured signals. This limitation is particularly relevant because the PD-D group had higher HAMA scores, and anxiety-related autonomic activity may influence scalp blood flow. Although the association between depression-group status and the CH13 ΔHbO2 signal remained significant after adjustment for HAMA score, statistical adjustment for anxiety severity cannot substitute for direct measurement and removal of systemic physiological signals. The primary fNIRS outcome was a study-specific temporal mean of the processed, reference-based ΔHbO2 signal rather than an established resting-state measure of temporal variability, spectral amplitude, or functional connectivity. Its numerical value may depend on the preprocessing pipeline, reference-period definition, filtering parameters, and temporal analysis window. Signal variance, ALFF, and functional connectivity were not evaluated in the present study; therefore, the CH13 finding should be interpreted as an exploratory between-group difference in a study-specific fNIRS summary measure rather than evidence of a confirmed regional physiological abnormality. The fNIRS montage did not include short-separation channels, and systemic physiological variables were not recorded concurrently. Consequently, cortical contributions could not be separated from superficial scalp blood flow or systemic physiological fluctuations, and the physiological source of the CH13 difference cannot be determined from the present data. This is a major limitation of the acquisition design and requires future validation using short-separation regression and concurrent systemic physiological monitoring. In conclusion, the processed, reference-based ΔHbO2 signal in CH13 differed between the PD-D and PD-nD groups and remained associated with depression-group status after adjustment for the measured clinical covariates. This finding should be regarded as an exploratory between-group difference in a study-specific fNIRS summary measure. It does not establish a continuous association between the CH13 signal and depressive symptom severity, nor does it establish neuronal hypoactivity, reduced cerebral perfusion, impaired neurovascular coupling, cortex-specific physiological abnormality, diagnostic utility, or treatment relevance. Validation using established resting-state metrics, short-separation channels, concurrent systemic physiological monitoring, broader cortical coverage, and independent cohorts is required before the physiological or clinical significance of this finding can be determined.
5. Conclusions
This cross-sectional resting-state fNIRS study identified a lower mean baseline-referenced ΔHbO2 signal in CH13, overlying the right dorsolateral prefrontal cortex, among patients with Parkinson’s disease and comorbid depression relative to patients with Parkinson’s disease without depression and healthy controls. This association persisted following adjustment for relevant demographic and clinical covariates and remained robust to additional adjustment for anxiety symptoms in the sensitivity analysis. These findings suggest that altered resting-state prefrontal hemodynamic signals may be associated with depressive status in Parkinson’s disease. This observation should be interpreted only as an exploratory between-group difference derived from a study-specific fNIRS summary measure. However, given that continuous-wave fNIRS quantifies only relative hemoglobin concentration changes and the present investigation adopts a single-center cross-sectional design, these results cannot be taken as evidence of reduced cerebral perfusion, impaired neuronal activity, or a causal mechanism. Longitudinal, multicenter studies incorporating wider cortical coverage and multimodal neuroimaging are warranted to establish the reproducibility, temporal stability, and clinical relevance of this finding.
Supplementary Materials
The following supporting information can be downloaded at: https://www.mdpi.com/article/10.3390/brainsci16111233/s1, Table S1: Multiple linear regression analyses of the association between depression-group status and the mean baseline-referenced CH13 ΔHbO2 signal in patients with Parkinson’s disease; Table S2: Adjusted channel-wise analysis in patients with Parkinson’s disease; Table S3: Multicollinearity Diagnostics for the Multivariable Models.
Author Contributions
Conceptualization, Z.W., J.S. and K.Z.; methodology, Z.W. and K.Z.; software, Z.W. and J.S.; validation, Z.W. and J.S.; formal analysis, Z.W. and J.S.; investigation, Z.W., J.S., Y.Z., X.Z. and Z.Z.; resources, K.Z.; data curation, Z.W. and J.S.; writing—original draft preparation, Z.W. and J.S.; writing—review and editing, K.Z.; visualization, Z.W. and J.S.; supervision, K.Z. All authors have read and agreed to the published version of the manuscript.
Funding
This research received no external funding.
Institutional Review Board Statement
The study was conducted in accordance with the Declaration of Helsinki, and approved by the Ethics Committee of the Affiliated Huai’an Hospital of Xuzhou Medical University (protocol code HEYLL202692).
Informed Consent Statement
The study was conducted in accordance with the Declaration of Helsinki, and approved by the Ethics Committee of the Affiliated Huai’an Hospital of Xuzhou Medical University (protocol code HEYLL202692). Informed consent was obtained from all subjects involved in the study. This research received no external funding. The APC was funded by the Affiliated Huai’an Hospital of Xuzhou Medical University.
Data Availability Statement
The raw data are not publicly available due to restrictions involving patient privacy and ethical requirements.
Acknowledgments
During the preparation of this manuscript, the authors used artificial intelligence (AI) to assist with English translation and linguistic polishing. No generative AI tool was used for participant recruitment, data acquisition, fNIRS recording, statistical analysis, or scientific interpretation. All AI-assisted content was thoroughly reviewed, revised, and verified by the authors against the raw data. The authors take full responsibility for the final manuscript and its scientific content.
Conflicts of Interest
The authors declare no conflicts of interest.
References
- Poewe, W.; Seppi, K.; Tanner, C.M.; Halliday, G.M.; Brundin, P.; Volkmann, J.; Schrag, A.E.; Lang, A.E. Parkinson disease. Nat. Rev. Dis. Primers 2017, 3, 17013. [Google Scholar] [PubMed]
- Angelopoulou, E.; Stanitsa, E.; Karpodini, C.C.; Bougea, A.; Kontaxopoulou, D.; Fragkiadaki, S.; Koros, C.; Georgakopoulou, V.E.; Fotakopoulos, G.; Koutedakis, Y.; et al. Pharmacological and non-pharmacological treatments for depression in parkinson’s disease: An updated review. Medicina 2023, 59, 1454. [Google Scholar] [CrossRef] [Scilit] [PubMed]
- Jellinger, K.A. The pathobiological basis of depression in Parkinson disease: Challenges and outlooks. J. Neural Transm. 2022, 129, 1401–1424. [Google Scholar] [CrossRef] [Scilit] [PubMed]
- Scarapicchia, V.; Brown, C.; Mayo, C.; Gawryluk, J.R. Functional Magnetic Resonance Imaging and Functional Near-Infrared Spectroscopy: Insights from Combined Recording Studies. Front. Hum. Neurosci. 2017, 11, 419. [Google Scholar] [CrossRef] [Scilit] [PubMed]
- Xie, L.; Liu, Y.; Gao, Y. Functional near-infrared spectroscopy in neurodegenerative disease: A review. Front. Neurosci. 2024, 18, 1469903. [Google Scholar] [CrossRef] [Scilit] [PubMed]
- Chen, W.-L.; Wagner, J.; Heugel, N.; Sugar, J.; Lee, Y.-W.; Conant, L.; Malloy, M.; Heffernan, J.; Quirk, B.; Zinos, A.; et al. Functional near-infrared spectroscopy and its clinical application in the field of neuroscience: Advances and future directions. Front Neurosci. 2020, 14, 724. [Google Scholar] [CrossRef] [Scilit] [PubMed]
- Bonilauri, A.; Sangiuliano Intra, F.; Pugnetti, L.; Baselli, G.; Baglio, F. A systematic review of cerebral functional near-infrared spectroscopy in chronic neurological diseases—Actual applications and future perspectives. Diagnostics 2020, 10, 581. [Google Scholar] [CrossRef] [Scilit] [PubMed]
- Lin, J.P.; Feng, H.S.; Zhai, H.; Shen, X. Cerebral hemodynamic responses to the difficulty level of ambulatory tasks in patients with Parkinson’s disease: A systematic review and meta-analysis. Neurorehabilit. Neural Repair. 2021, 35, 755–768. [Google Scholar] [CrossRef] [Scilit] [PubMed]
- Wang, J.; Li, Y.; Wang, Y.; Wang, C.; Qie, S.; Jin, Z.; Du, W. Comparison of different rhythmic auditory stimuli on prefrontal cortex cortical activation during upper limb movement in patients with Parkinson’s disease: A functional near-infrared spectroscopy study. Front. Neurol. 2024, 15, 1336268. [Google Scholar] [CrossRef] [Scilit] [PubMed]
- Tian, B.; Chen, Q.; Zou, M.; Xu, X.; Liang, Y.; Liu, Y.; Hou, M.; Zhao, J.; Liu, Z.; Jiang, L. Decreased resting-state functional connectivity and brain network abnormalities in the prefrontal cortex of elderly patients with Parkinson’s disease accompanied by depressive symptoms. Glob. Health Med. 2024, 6, 132–140. [Google Scholar] [CrossRef] [Scilit] [PubMed]
- Postuma, R.B.; Berg, D.; Stern, M.; Poewe, W.; Olanow, C.W.; Oertel, W.; Obeso, J.; Marek, K.; Litvan, I.; Lang, A.E.; et al. MDS clinical diagnostic criteria for Parkinson’s disease. Mov. Disord. 2015, 30, 1591–1601. [Google Scholar] [CrossRef] [Scilit] [PubMed]
- American Psychiatric Association. Diagnostic and Statistical Manual of Mental Disorders, 5th ed.; American Psychiatric Publishing: Arlington, VA, USA, 2013. [Google Scholar]
- Leentjens, A.F.; Verhey, F.R.; Lousberg, R.; Spitsbergen, H.; Wilmink, F.W. The validity of the Hamilton and Montgomery-Asberg depression rating scales as screening and diagnostic tools for depression in Parkinson’s disease. Int. J. Geriatr. Psychiatry 2000, 15, 644–649. [Google Scholar] [CrossRef] [Scilit] [PubMed]
- Hoops, S.; Nazem, S.; Siderowf, A.D.; Duda, J.E.; Xie, S.X.; Stern, M.B.; Weintraub, D. Validity of the MoCA and MMSE in the detection of MCI and dementia in Parkinson disease. Neurology 2009, 73, 1738–1745. [Google Scholar] [CrossRef] [Scilit] [PubMed]
- Goetz, C.G.; Poewe, W.; Rascol, O.; Sampaio, C.; Stebbins, G.T.; Counsell, C.; Giladi, N.; Holloway, R.G.; Moore, C.G.; Wenning, G.K.; et al. Movement Disorder Society Task Force report on the Hoehn and Yahr staging scale: Status and recommendations. Mov. Disord. 2004, 19, 1020–1028. [Google Scholar] [CrossRef] [Scilit] [PubMed]
- Goetz, C.G.; Fahn, S.; Martinez-Martin, P.; Poewe, W.; Sampaio, C.; Stebbins, G.T.; Stern, M.B.; Tilley, B.C.; Dodel, R.; Dubois, B.; et al. Movement Disorder Society-sponsored revision of the Unified Parkinson’s Disease Rating Scale (MDS-UPDRS): Process, format, and clinimetric testing plan. Mov. Disord. 2007, 22, 41–47. [Google Scholar] [CrossRef] [Scilit] [PubMed]
- Zimmerman, M.; Martinez, J.H.; Young, D.; Chelminski, I.; Dalrymple, K. Severity classification on the Hamilton Depression Rating Scale. J. Affect. Disord. 2013, 150, 384–388. [Google Scholar] [CrossRef] [Scilit] [PubMed]
- Weintraub, D.; Oehlberg, K.A.; Katz, I.R.; Stern, M.B. Test characteristics of the 15-item Geriatric Depression Scale and Hamilton Depression Rating Scale in Parkinson disease. Am. J. Geriatr. Psychiatry 2006, 14, 169–175. [Google Scholar] [CrossRef] [Scilit] [PubMed]
- Jurcak, V.; Tsuzuki, D.; Dan, I. 10/20, 10/10, and 10/5 systems revisited: Their validity as relative head-surface-based positioning systems. NeuroImage 2007, 34, 1600–1611. [Google Scholar] [CrossRef] [Scilit] [PubMed]
- Yücel, M.A.; von Lühmann, A.; Scholkmann, F.; Gervain, J.; Dan, I.; Ayaz, H.; Boas, D.; Cooper, R.J.; Culver, J.; Elwell, C.E.; et al. Best Practices for fNIRS Publications. Neurophotonics 2021, 8, 012101. [Google Scholar] [CrossRef] [Scilit] [PubMed]
- Scholkmann, F.; Kleiser, S.; Metz, A.J.; Zimmermann, R.; Pavia, J.M.; Wolf, U.; Wolf, M. A review on continuous wave functional near-infrared spectroscopy and imaging instrumentation and methodology. NeuroImage 2014, 85, 6–27. [Google Scholar] [CrossRef] [Scilit] [PubMed]
- Gier, N.R.; Strelow, E.; Krampe, C. Measuring dlPFC Signals to Predict the Success of Merchandising Elements at the Point-of-Sale—A fNIRS Approach. Front. Neurosci. 2020, 14, 575494. [Google Scholar] [CrossRef] [Scilit] [PubMed]
- Luo, C.; Chen, Q.; Song, W.; Chen, K.; Guo, X.; Yang, J.; Huang, X.; Gong, Q.; Shang, H.-F. Resting-state fMRI study on drug-naive patients with Parkinson’s disease and with depression. J. Neurol. Neurosurg. Psychiatry 2014, 85, 675–683. [Google Scholar] [CrossRef] [Scilit] [PubMed]
- Liao, H.; Fan, J.; Shen, Q.; Cai, S.; Wang, M.; Wang, C.; Zhang, H.; Liu, J.; Zhu, X.; Tan, C. Alterations of Interhemispheric Functional Connectivity in Parkinson’s Disease With Depression: A Resting-State Functional MRI Study. Front. Hum. Neurosci. 2020, 14, 193. [Google Scholar] [CrossRef] [Scilit] [PubMed]
- Alfano, V.; Federico, G.; Mele, G.; Garramone, F.; Esposito, M.; Aiello, M.; Salvatore, M.; Cavaliere, C. Brain Networks Involved in Depression in Patients with Frontotemporal Dementia and Parkinson’s Disease: An Exploratory Resting-State Functional Connectivity MRI Study. Diagnostics 2022, 12, 959. [Google Scholar] [CrossRef] [Scilit] [PubMed]
- Phillips, M.L.; Ladouceur, C.D.; Drevets, W.C. A neural model of voluntary and automatic emotion regulation: Implications for understanding the pathophysiology and neurodevelopment of bipolar disorder. Mol. Psychiatry 2008, 13, 833–857. [Google Scholar] [CrossRef] [Scilit] [PubMed]
- Friedman, N.P.; Robbins, T.W. The role of prefrontal cortex in cognitive control and executive function. Neuropsychopharmacology 2022, 47, 72–89. [Google Scholar] [CrossRef] [Scilit] [PubMed]
- Nejati, V.; Majdi, R.; Salehinejad, M.A. The role of dorsolateral and ventromedial prefrontal cortex in emotion regulation. Front. Psychol. 2021, 12, 720401. [Google Scholar]
- Lynch, C.J.; Elbau, I.G.; Ng, T.; Ayaz, A.; Zhu, S.; Wolk, D.; Manfredi, N.; Johnson, M.; Chang, M.; Chou, J.; et al. Frontostriatal salience network expansion in individuals in depression. Nature 2024, 633, 624–633. [Google Scholar] [CrossRef] [Scilit] [PubMed]
- Gao, W.; Yan, X.; Yuan, J. Neural correlations between cognitive deficits and emotion regulation strategies: Understanding emotion dysregulation in depression from the perspective of cognitive control and cognitive biases. Psychoradiology 2022, 2, 86–99. [Google Scholar] [CrossRef] [Scilit] [PubMed]

Disclaimer/Publisher’s Note: The statements, opinions and data contained in all publications are solely those of the individual author(s) and contributor(s) and not of MDPI and/or the editor(s). MDPI and/or the editor(s) disclaim responsibility for any injury to people or property resulting from any ideas, methods, instructions or products referred to in the content. |
© 2026 by the authors. Licensee MDPI, Basel, Switzerland. This article is an open access article distributed under the terms and conditions of the Creative Commons Attribution (CC BY) license.