


Abstract
Objectives: This study aims to investigate the characteristics of event-related potentials (ERP) in patients with traumatic subarachnoid hemorrhage (tSAH) during the clinical stable phase, with the aim of obtaining neuroelectrophysiological indicators that can objectively assess cognitive dysfunction caused by this injury. Methods: A total of 16 healthy volunteers and 33 tSAH patients in the stable phase were recruited. Demographic and clinical data were collected, MMSE assessments were completed, and EEG data for P300, mismatch negativity (MMN), and contingent negative variation (CNV) were recorded using a 32-lead ERP system. ERP analysis was performed by comparing the tSAH group with the healthy control (HC) group and by further dividing the tSAH group into a cognitive impairment subgroup (CI, n = 18) and a normal cognition subgroup (NC, n = 15) based on MMSE scores, with a focus on the mean amplitude and peak latency within specific time windows and their correlation with cognitive behavioral measures. Results: The results showed no significant differences in demographic characteristics between the two groups, while the MMSE scores of the tSAH group were significantly lower than those of the HC group. Compared with HC, the mean amplitude of P300 in response to the target stimuli was significantly reduced in multiple brain regions in the tSAH group and attenuated the negativity of mean CNV amplitudes across multiple brain regions, while no significant differences in mean MMN amplitudes were detected across electrodes and no significant differences were observed in peak latencies of P300 and MMN. The CI group was slightly older than the NC group; after controlling for the effect of age, the Mini-Mental State Examination (MMSE) scores of the CI group were significantly lower than those of the NC group, but no significant differences were found between the two groups in mean amplitudes and peak latencies of P300 and MMN or in mean CNV amplitudes. Conclusions: This study indicates that tSAH may be one of the relevant risk factors for post-traumatic cognitive dysfunction. ERP findings suggest that the allocation of relevant cognitive resources is attenuated in this population, but no differences were detected in the temporal sequence of neural processing. No significant abnormalities were observed during auditory deviance detection corresponding to the MMN time window, and no significant differences in ERP characteristics were found among the subgroups. This study found that tSAH can cause selective cognitive electrophysiological impairment, but ERP electrophysiological changes do not fully match cognitive impairment classified based on clinical scales.
1. Introduction
Traumatic subarachnoid hemorrhage (tSAH) is a series of injurious manifestations caused by blood entering the subarachnoid space after external force to the head. Epidemiological surveys show that approximately 69 million people suffer from traumatic brain injury (TBI) each year, among which tSAH is one of the most common complications of craniocerebral trauma [1]. Cognitive dysfunction is one of the common complications during the clinically stable phase in patients with traumatic subarachnoid hemorrhage (tSAH), and the causes of cognitive dysfunction include early brain injury, delayed cerebral ischemia, neuroinflammation, and superficial siderosis, among others [2]. Cognitive dysfunction in tSAH patients can affect early capacity for daily living and also impact their long-term prognosis [3]. The types of trauma leading to tSAH are also diverse, such as traffic accidents, accidental falls, or other violent events, among which head injury caused by falls in traffic accidents is the most common cause [4]. Currently, clinical cognitive screening mainly relies on neuropsychological tools such as the Mini-Mental State Examination (MMSE) and the Montreal Cognitive Assessment (MoCA) [5], but scale-based assessment is highly dependent on the subject’s cooperation and subjective motivation, with limited sensitivity to mild and subclinical cognitive deficits. Therefore, relying solely on behavioral scales is insufficient to determine the severity of cognitive impairment.
Event-related potential (ERP), unlike behavioral scales, possesses high temporal resolution, and the amplitude and latency of its characteristic waves can determine the functional integrity of cognitive processes, and thus it is widely used in the assessment of attention, memory, and executive functions [6]. It can compensate for the strong subjectivity of behavioral scales, offering unique application value in the clinical evaluation of post-traumatic cognitive impairment. Among them, N170 is associated with face recognition and often appears abnormal in patients with mental disorders [7,8]. The P300 component serves as a neuroelectrophysiological indicator of working memory updating and attentional resource allocation [9,10]; its prolonged latency suggests slowed cognitive processing speed, commonly seen in mild cognitive impairment and early dementia populations. Studies have found P300 amplitude suppression in patients with tSAH [11], confirming the feasibility of this indicator for post-traumatic cognitive assessment. Mismatch negativity (MMN) has two main theoretical explanations for its generation mechanism: one is the adaptation mechanism, which posits that repeated stimulation leads to reduced neuronal response adaptation and deviant stimuli release this adaptation state, thereby inducing MMN; the other is the prediction error mechanism, emphasizing that the brain forms a predictive model based on past auditory input and when actual stimuli deviate from predictions, a prediction error signal is generated, manifested as MMN [12,13]. In the field of TBI, early MMN changes may correlate with the cognitive functional status and prognosis of injured individuals [13], but current research remains limited, and the application value of MMN in cognitive assessment after traumatic brain injury requires further validation. Contingent negative variation (CNV) is an endogenous component of event-related potentials; its amplitude is positively correlated with the individual’s degree of attentional investment and anticipatory response to the task, while its latency reflects the speed of stimulus estimation and preparation [14,15]. Common symptoms in TBI patients include inattention, memory decline, executive dysfunction, and slowed information processing speed, all manifestations of cognitive dysfunction [16,17,18]. In TBI patients, CNV often exhibits abnormalities in amplitude and latency; reduced amplitude indicates insufficient allocation of attentional resources, while prolonged latency reflects decreased efficiency in information processing and response preparation, both closely related to executive function impairment [15,19,20]. Traumatic subarachnoid hemorrhage (tSAH) also falls within the category of mTBI. Because CNV is sensitive to attention and executive function and previous studies have confirmed the association between CNV-related parameters and post-traumatic capacity for daily living and social functioning [15], incorporating CNV into the assessment framework for cognitive dysfunction after tSAH can provide new neuroelectrophysiological indicators for objective evaluation of such patients.
Given the inherent limitations of a single behavioral scale and the lack of multi-paradigm ERP combining evidence for tSAH, this study focused on patients with isolated traumatic subarachnoid hemorrhage (tSAH) in the clinically stable phase. Based on neuropsychological test results, their cognitive dysfunction status was determined, and the temporal EEG characteristics of different ERP components were analyzed, aiming to obtain characteristic neuroelectrophysiological indicators and provide objective evidence for the assessment of post-tSAH cognitive dysfunction.
2. Materials and Methods
2.1. Participants
This cross-sectional exploratory study was conducted without a priori sample size calculation. The sample size was determined based on clinical availability and recruitment feasibility within the study period. All research subjects were patients who underwent cognitive assessment during follow-up at Changzhou De’an Hospital between June 2025 and April 2026, as well as normal volunteers recruited during the same period.
Inclusion criteria for the healthy control (HC) group: (1) willingness to participate in this research study; (2) no history of mental disorders or neurological diseases; (3) no history of traumatic brain injury or head surgery; (4) no history of drug or alcohol abuse; (5) no recent use of psychotropic medications or related treatments; (6) no severe physical diseases; and (7) no visual or hearing disorders.
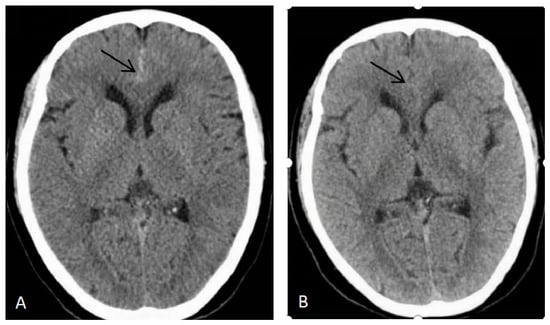
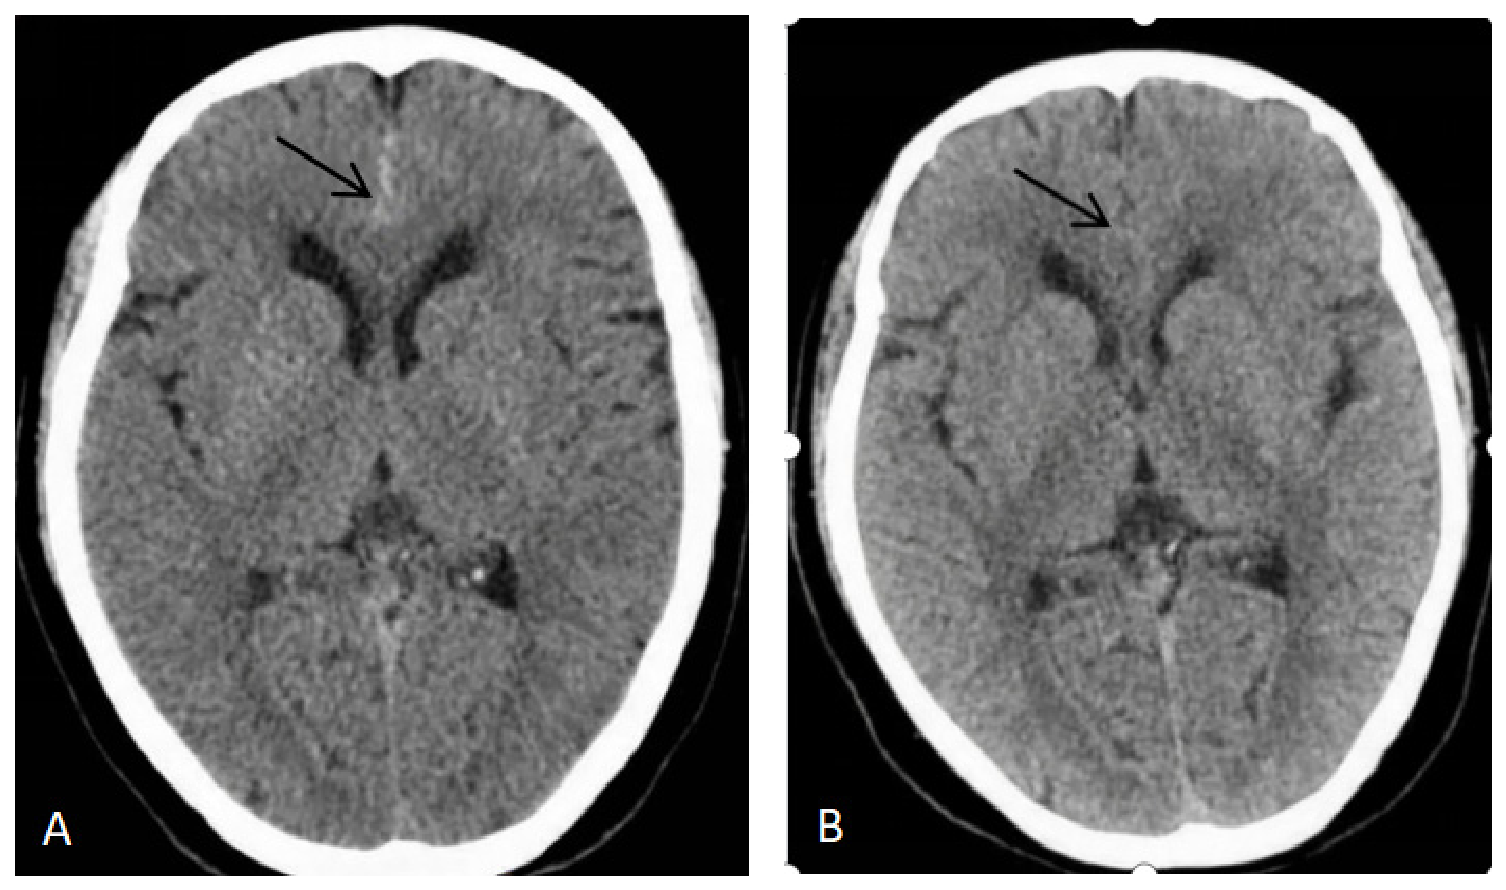
Inclusion criteria for tSAH patients: (1) voluntary participation in this research study, with the ability to cooperate with examiners; (2) clear history of head trauma, confirmed by imaging as tSAH, as detailed in Figure 1; (3) all patients were patients with simple traumatic subarachnoid hemorrhage, combined with trauma history, clinical manifestations, and the distribution of hemorrhage on plain CT scan, patients with aneurysmal subarachnoid hemorrhage and those with other concomitant craniocerebral injuries were excluded; (4) no surgical treatment; (5) medical treatment completed, condition stable, with injury occurring more than 6 months ago; (6) no visual or auditory dysfunction; and (8) no prior history of mental disorders, neurological diseases, traumatic brain injury, head surgery, drug or alcohol abuse, no history of severe physical diseases, and no recent use of psychotropic medications or related treatments.
Figure 1.
Imaging identification of simple traumatic subarachnoid hemorrhage (determined through pre- and post-comparison). (A) Head CT at the time of injury, the arrow indicates the site of hemorrhage. (B) Head CT four days after injury, the arrow indicates absorption of the hemorrhage.
Initially, 20 normal volunteers and 40 patients with traumatic subarachnoid hemorrhage (tSAH) were planned for enrollment. Four volunteers voluntarily withdrew because they were unable to complete the entire experimental procedure, and seven tSAH patients were excluded, among whom four research subjects were excluded due to P300 counting accuracy < 90%, and another four subjects were excluded due to poor cooperation, excessive electroencephalogram (EEG) artifacts, and insufficient number of valid trials. After artifact rejection, a standardized minimum valid trial threshold was implemented: no fewer than 40 P300 target stimulus trials, no fewer than 60 MMN deviant stimulus trials, and no fewer than 100 CNV trials. All final datasets included in the statistical analysis met the minimum trial requirements. Ultimately, data from 16 normal volunteers and 33 patients with tSAH were included in the analysis. The summary statistics of the number of retained trials in each group and the results of between-group comparisons are detailed in Tables S1 and S2.
2.2. Experimental Design
2.2.1. General Information Collection and MMSE Scoring
All subjects were right-handed. Sex, age, and education level were collected for all subjects. For the traumatic subarachnoid hemorrhage (tSAH) group, the mode of injury, GCS score on emergency admission, imaging findings, and time since injury were collected. The MMSE score includes assessment of multiple aspects of cognitive function, encompassing orientation, memory, attention, language ability, and visuospatial ability, among others. All subjects were tested in a quiet environment to ensure focused attention and to avoid external interference. During the assessment process, after collecting basic information from subjects, the MMSE was scored in a quiet environment, with each item rated by a researcher (a fixed psychological assessment physician) according to standardized scoring guidelines to ensure consistency and accuracy of the scores. Among them, healthy volunteers all showed normal cognition without cognitive impairment, and tSAH patients were divided into a cognitive impairment (CI) group and a normal cognition (NC) group based on MMSE scores (MMSE criteria for cognitive dysfunction: illiterate group ≤ 17 points, primary school group ≤ 20 points, middle school and above group ≤ 24 points).
2.2.2. EEG Recording and Analysis
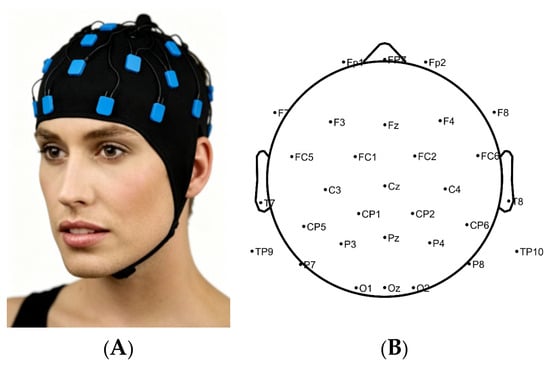
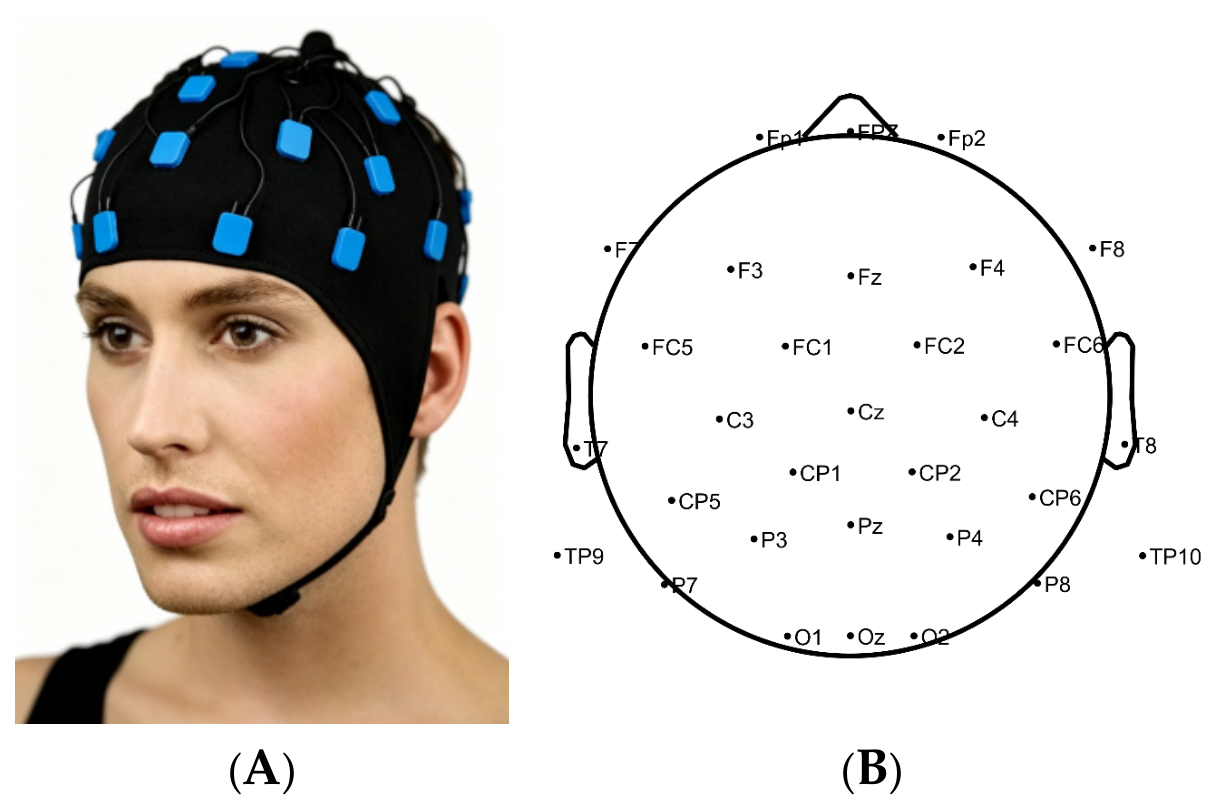
This study used the BrainAmp MR32 EEG analyzer for ERP data acquisition, with basic acquisition of 32 channels, Ag/AgCl electrode caps, and a 17-inch Dell CRT monitor with a splitter, along with the E-prime3 stimulus generation system as the EEG stimulus presentation system. The basic experimental procedure includes three steps: stimulus presentation, online EEG data acquisition, and offline analysis. Stimulus presentation includes event marking, online acquisition includes EEG signal amplification, analog filtering, and analog to digital conversion, and offline analysis includes data extraction, component identification, and measurement. ERP experiments were conducted in a soundproof and shielded environment, requiring research subjects to sit on a chair 100 cm away from the computer screen looking straight ahead, maintaining a fixed posture, and avoiding body movements as much as possible. Then, according to the stimulus parameters set for each experiment, EEG acquisition for P300, MMN, and CNV was performed sequentially. After each paradigm, participants were provided a rest period. The subsequent paradigm was initiated only after the subject reported feeling no obvious fatigue. The ground electrode was placed at CPz, and the reference electrode was FCz. The electrode scalp impedance for all electrodes was kept below 20 kΩ. Horizontal and vertical electrooculogram (EOG) were recorded simultaneously for ocular artifact correction. The schematic diagram of the EEG acquisition system and the recording distribution are shown below (Figure 2).
Figure 2.
Schematic diagram of the BrainAmp MR32 EEG acquisition system (A) and the distribution of the recording system (B).
(1) P300 detection and analysis: The visual Oddball paradigm was used for stimulation with a sampling rate of 1000 Hz. Blue images were used as non-target stimuli, with a size of 10 cm × 8 cm, a presentation probability of 80%, and a total of 200 trials; red images were used as target stimuli, with a size of 10 cm × 8 cm, a presentation probability of 20%, and a total of 50 trials. The presentation time of each image was 500 ms, and the inter-stimulus interval was 1000 ms. The two types of images were presented randomly, and participants were required to count the red images. Participants with ≥45 correct identifications of target stimuli (accuracy ≥ 90%) were included in the final analysis. Subjects with accuracy < 90% were excluded from further analysis. For the P300 component, the 300 ms to 500 ms time window was selected as the analysis range for both the target stimuli and the non-target stimuli, and two indicators, mean amplitude and peak latency, were calculated. According to the grand average waveform of P300 in this study, the visual stimulation paradigm, and related literature [21], the frontal region, parietal region, central region, and occipital region, including F3, Fz, F4, C3, Cz, C4, P3, Pz, P4, and Oz, were selected as regions of interest for analysis.
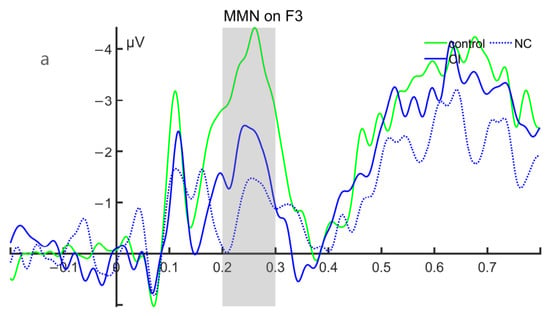
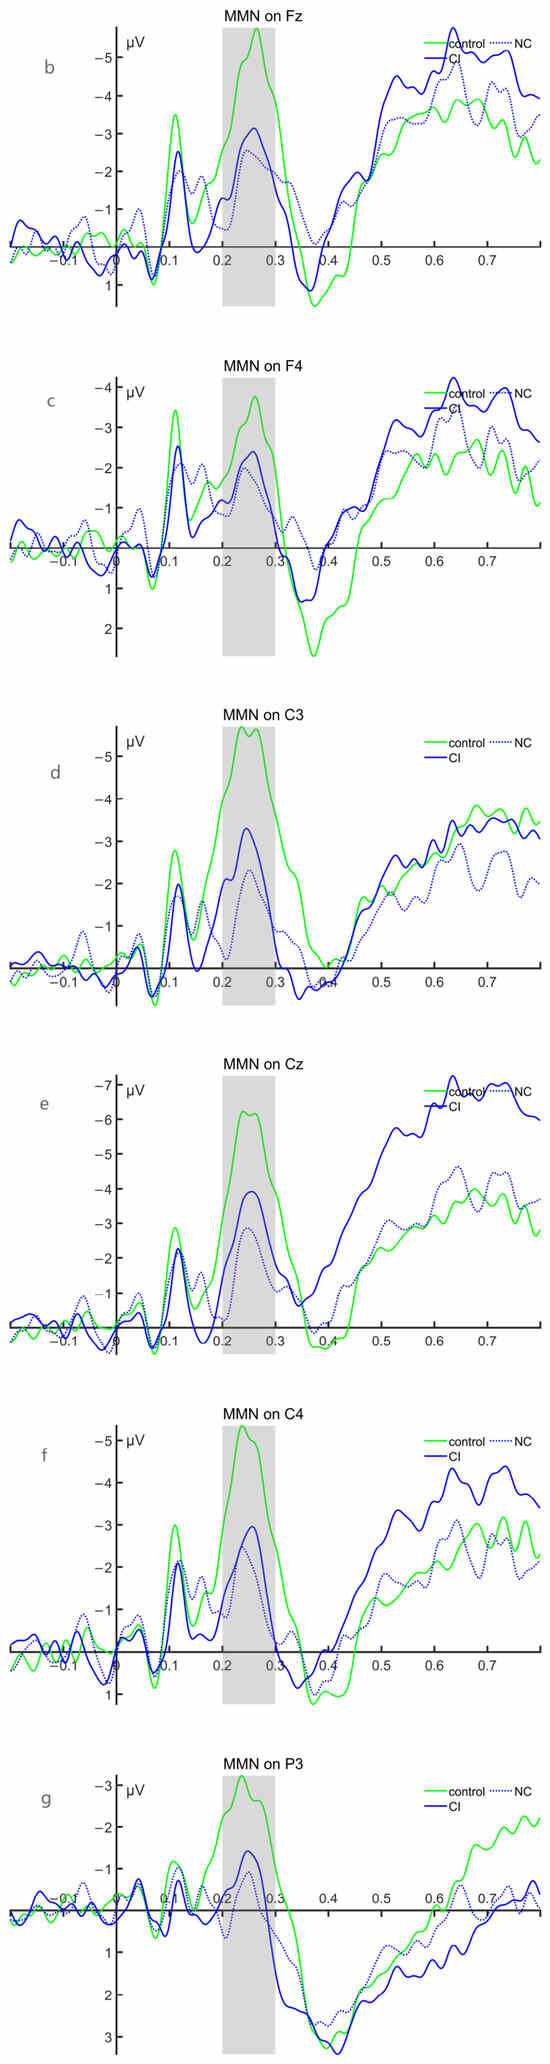
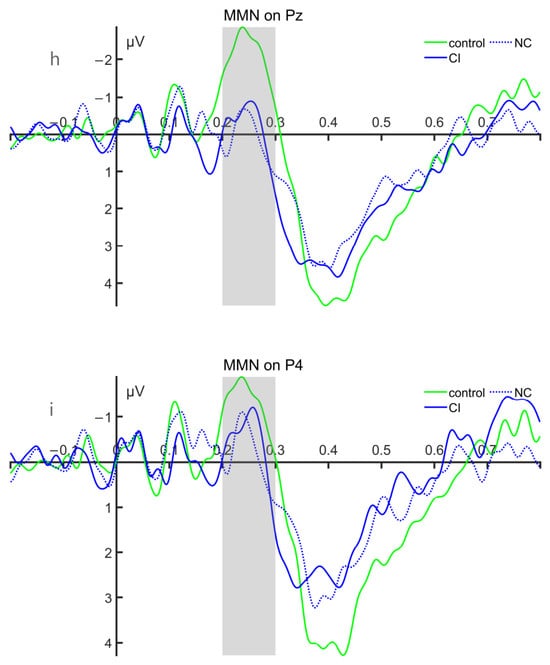
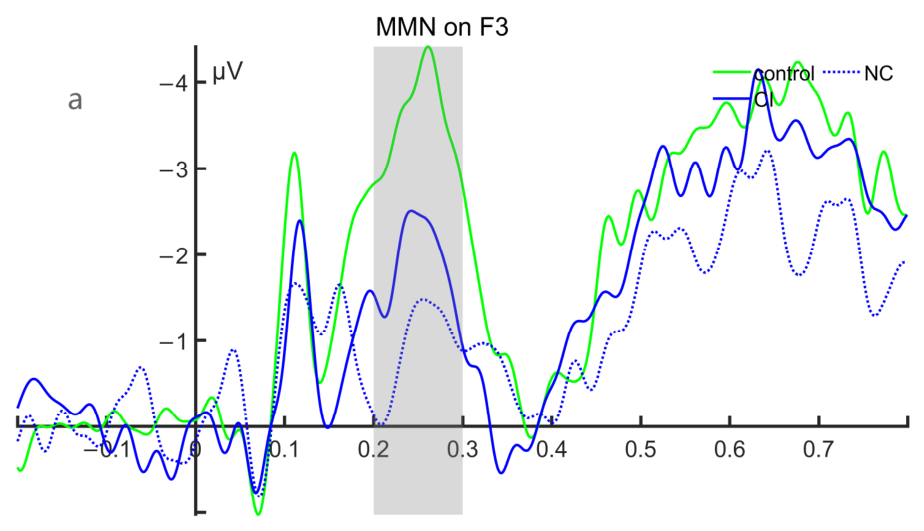
(2) MMN detection and analysis: A two-channel auditory Oddball paradigm was employed with a sampling rate of 1000 Hz. The auditory stimulation paradigm included two types of stimuli: standard stimuli and deviant stimuli. The standard stimuli consisted of pure tones at 550 Hz, while the deviant stimuli consisted of pure tones at 1072 Hz. A total of 400 trials of standard stimuli and deviant stimuli were presented, with probabilities of occurrence of 80% and 20%, respectively. The duration of auditory stimuli was 500 ms, and the inter-stimulus interval (ISI) was 700 ms. Participants were required to make a button response to the high-frequency deviant stimuli. For the MMN component, the difference wave was obtained by subtracting the amplitude of the standard stimulus from that of the deviant stimulus. Then, the 200–300 ms time window was selected as the analysis range for the component, and two indicators—mean amplitude and peak latency—were calculated. Based on the grand average waveform of MMN and the relevant literature [22], the frontal, parietal, and central regions, including F3, Fz, F4, C3, Cz, C4, P3, Pz, and P4, were selected as regions of interest for analysis.
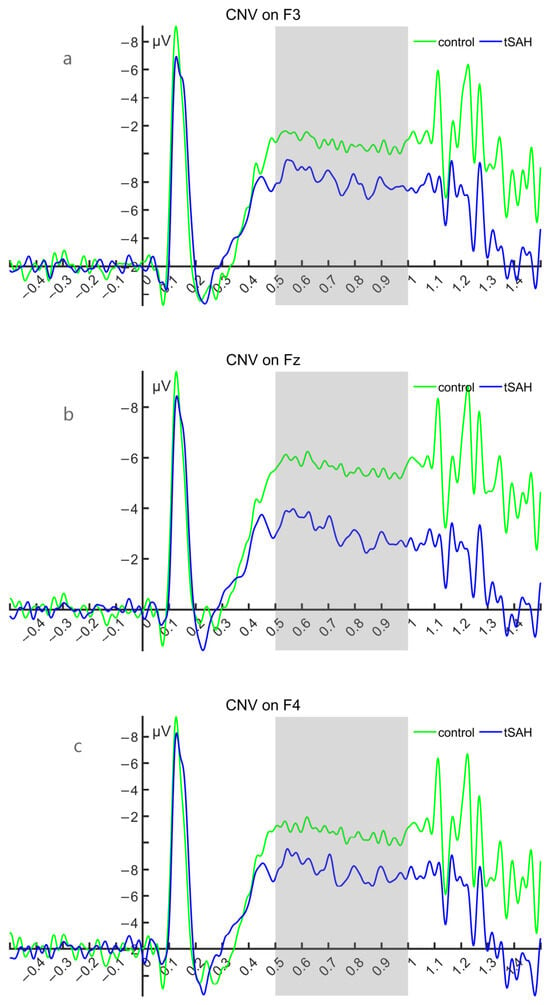
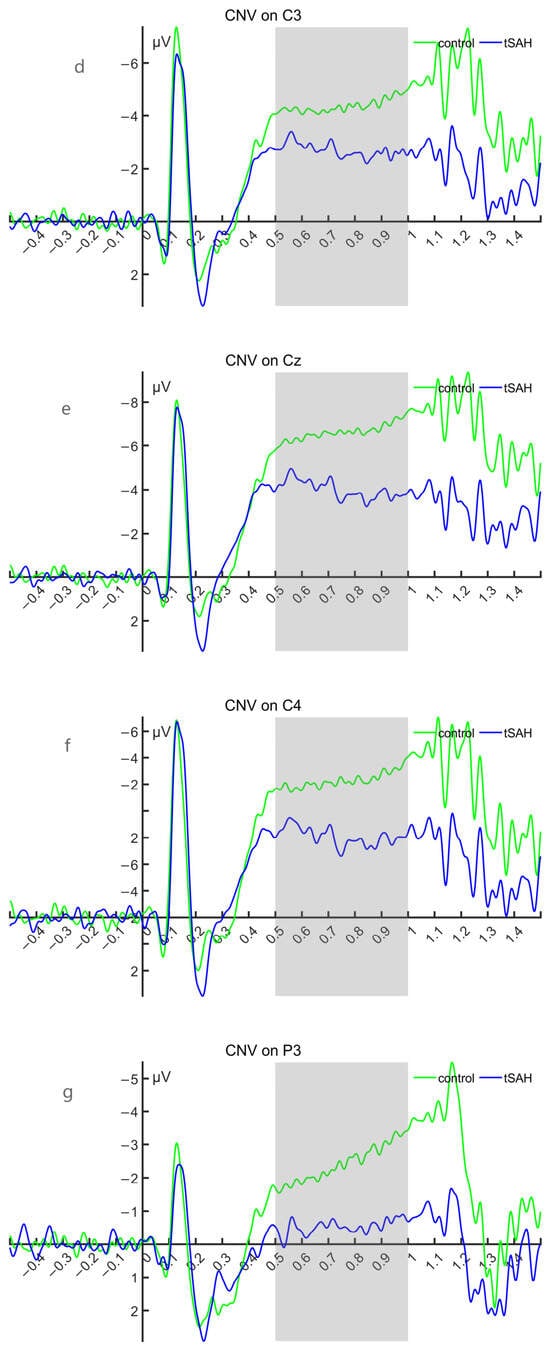
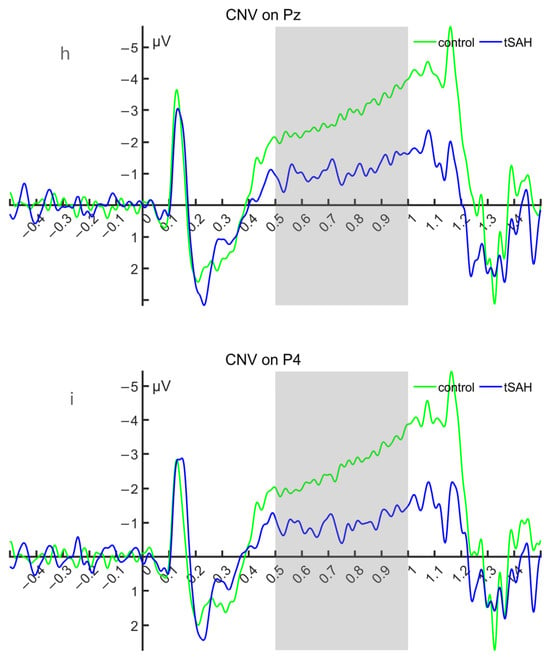
(3) CNV Detection and Analysis: The stimulus type adopts the S1-S2 response warning paradigm, with a sampling rate of 1000 Hz. S1 is a ‘beep’ warning stimulus, and S2 is a flash command stimulus. The S1-S2 interval is set to 1000 milliseconds, and the response requirement emphasizes a quick button press to S2. There are a total of 150 trials, with an interval of 5000 ms between each trial. For the CNV component, the 500 ms to 1000 ms time window is selected as the analysis range for the component to calculate the mean amplitude index. Based on the grand average waveform of CNV and the relevant literature [15,23,24], the frontal, parietal, and central regions F3, Fz, F4, C3, Cz, C4, P3, Pz, and P4 are selected as regions of interest for the study.
(4) EEG data processing: EEG data were processed using MATLAB 2024b. Channel localization was performed using the international standard 10-10 system. Useless electrodes were removed, and filtering was applied (P300 filtering range: high-pass filter 1 Hz, low-pass filter 25 Hz; MMN filtering range: high-pass filter 0.1 Hz, low-pass filter 30 Hz; CNV filtering range: high-pass filter 0.01 Hz, low-pass filter 30 Hz). Segmentation and baseline correction were performed (P300 segmentation according to marker from −200 ms to 600 ms, baseline correction using −200 ms to 0 ms before the marker; MMN segmentation according to marker from −200 ms to 800 ms, baseline correction using −200 ms to 0 ms before the marker; CNV segmentation according to S1 marker from −500 ms to 1500 ms, baseline correction using −500 ms to 0 ms before the marker). Interpolation was performed for electrodes with overall poor signal quality; the interpolation results for each group are detailed in Supplementary Table S3. Independent component analysis (ICA) was used for artifact correction to remove artifact components such as electrooculogram (EOG), electromyography (EMG), and electrocardiogram (ECG). The extreme value rejection range for P300, MMN, and CNV was ±100 microvolts. Data were re-referenced to the bilateral mastoids using TP9 and TP10 electrodes. After re-referencing, 29 electrodes remained. The preprocessed data were saved.
(5) Selection and quality control of event-related potential (ERP) components: The analysis time windows and electrodes for each component were first predetermined based on the previous literature and confirmed using the grand-average waveforms collapsed across all participants and groups without selection based on between-group differences or statistical results. All ERP indices were extracted from each participant’s individual average waveform under the corresponding condition. Mean amplitude was defined as the average of the voltage values across all sampling points within the predefined time window; peak latency was defined as the time at which the corresponding maximum positive peak or minimum negative peak occurred within that time window. When no clear peak was detected, the latency was recorded as a missing value (NaN); when multiple candidate peaks were present, the peak with the largest amplitude is selected.
2.3. Statistical Analysis
Demographic and baseline clinical data were compared between groups using independent-sample t-tests and chi-square tests. Experimental data were processed and statistically analyzed using MATLAB2024b for ERP electroencephalogram data analysis, Between-group comparisons (HC/tSAH & CI/NC) were performed using analysis of covariance (ANCOVA) with age as a covariate, and multiple comparisons were corrected using the Benjamini–Hochberg false discovery rate (FDR) correction. All ERP statistical inferences were based on FDR-corrected p values. All p-value < 0.05 was considered statistically significant.
A schematic diagram of EEG acquisition (Figure 2A) was generated with the assistance of artificial intelligence (AI) tools. The conceptual design, layout, and key elements of the diagram were determined by the authors. All scientific interpretations and experimental settings were reviewed and verified by the authors.
3. Results
3.1. Demographic Characteristics and Clinical Manifestations
There were no significant differences in gender, age, or education level between the HC group and the tSAH group (all p > 0.05). Within the tSAH group, there was a statistically significant difference in age between the CI group and the NC group (p < 0.05); specifically, the CI group was older than the NC group, with no differences in gender or education level (all p > 0.05). The bleeding sites in the two groups were diverse and scattered; due to the limited sample size and excessive categories, no statistical conclusions could be drawn. There were no statistically significant differences between the two groups in terms of time since injury or Glasgow Coma Scale (GCS) score (all p > 0.05). There were no differences in gender, age, or education level between the HC group and the CI group (all p > 0.05). There was a difference in age between the HC group and the NC group, with the HC group being older than the NC group (p < 0.05), while no differences were found in gender or education level between the two groups (all p > 0.05). See Table 1 for details.
Table 1.
Basic demographic statistics of all subjects.
3.2. MMSE Scores and Comparisons Among Different Groups
There was a statistically significant difference in MMSE scores between the HC group and the tSAH group (the HC group had higher scores than the tSAH group); due to a statistically significant difference in age between the CI group and the NC group, using age as a covariate, analysis of covariance (ANCOVA) was used for intergroup comparison of MMSE scores. The difference in MMSE scores between the two groups remained statistically significant (the NC group had significantly higher scores than the CI group); there was a highly statistically significant difference in MMSE scores between the HC group and the CI group (the HC group had higher scores than the CI group). Due to a statistically significant difference in age between the HC group and the NC group, using age as a covariate, analysis of covariance (ANCOVA) was used for intergroup comparison of MMSE scores, and the difference in MMSE scores between the two groups remained statistically significant (the HC group had higher scores than the NC group). See Table 2 for details (all p < 0.001).
Table 2.
MMSE scores and comparison between different groups.
3.3. Statistical Results of Waveform Analysis of Different ERP Components
3.3.1. P300 Results
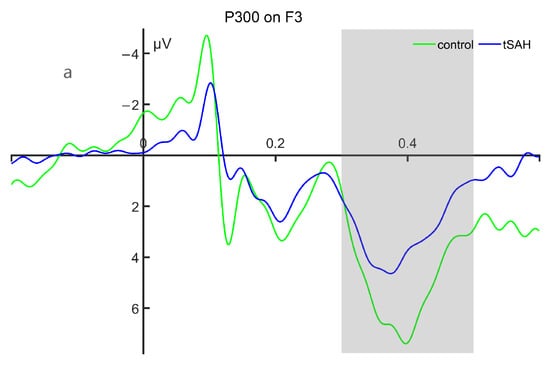
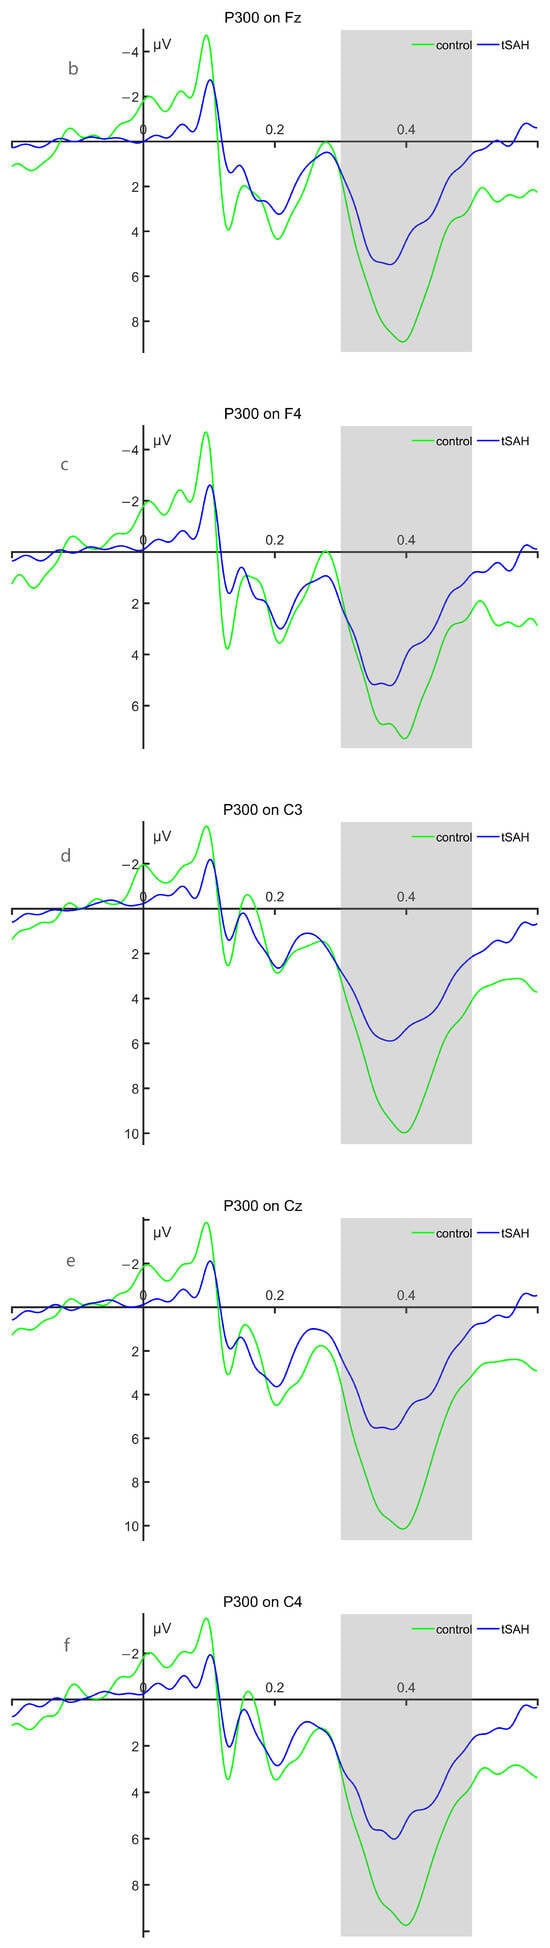
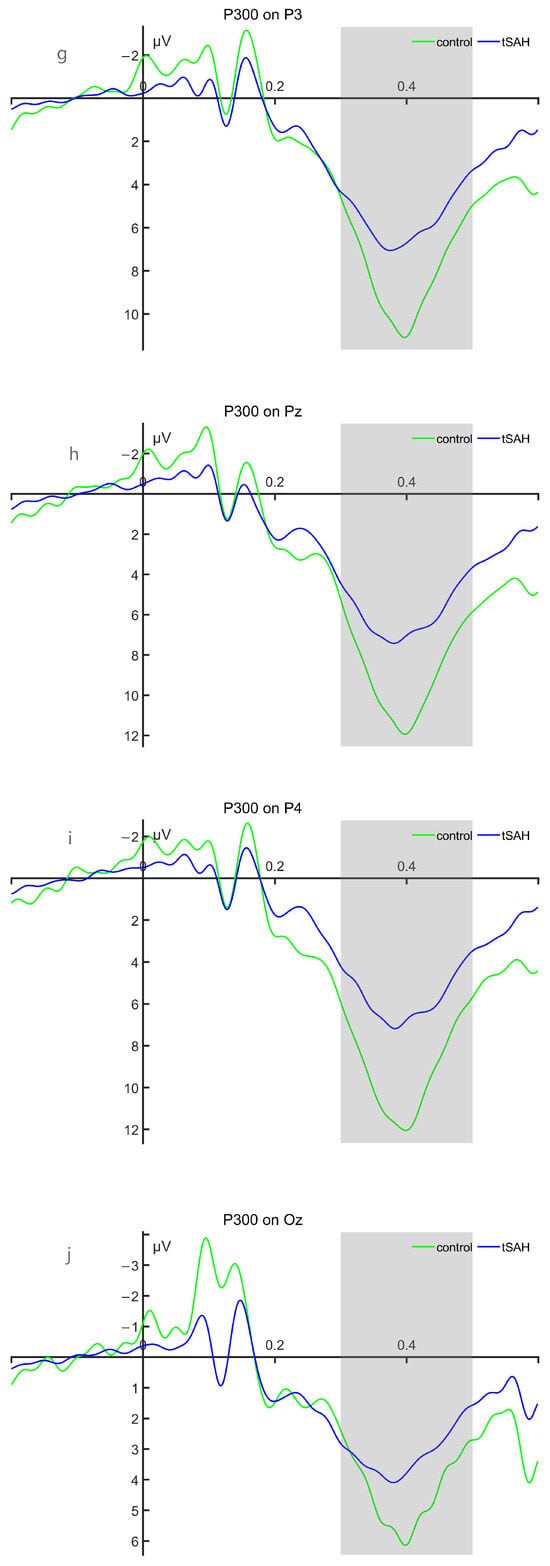
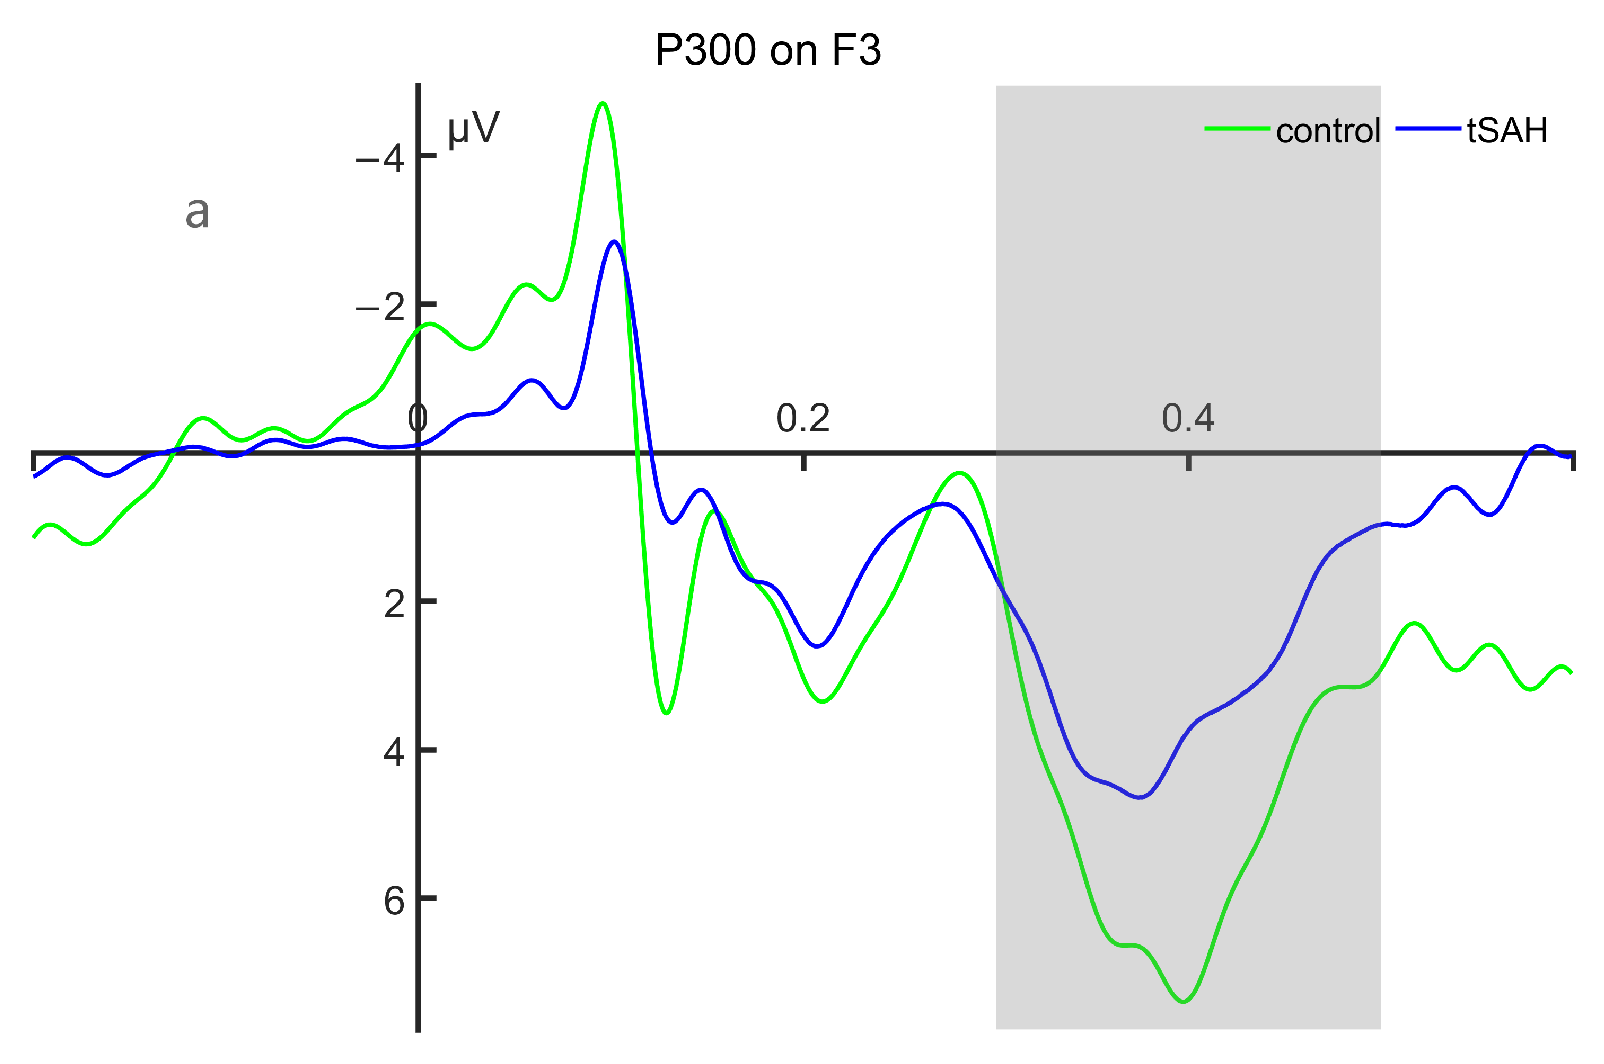
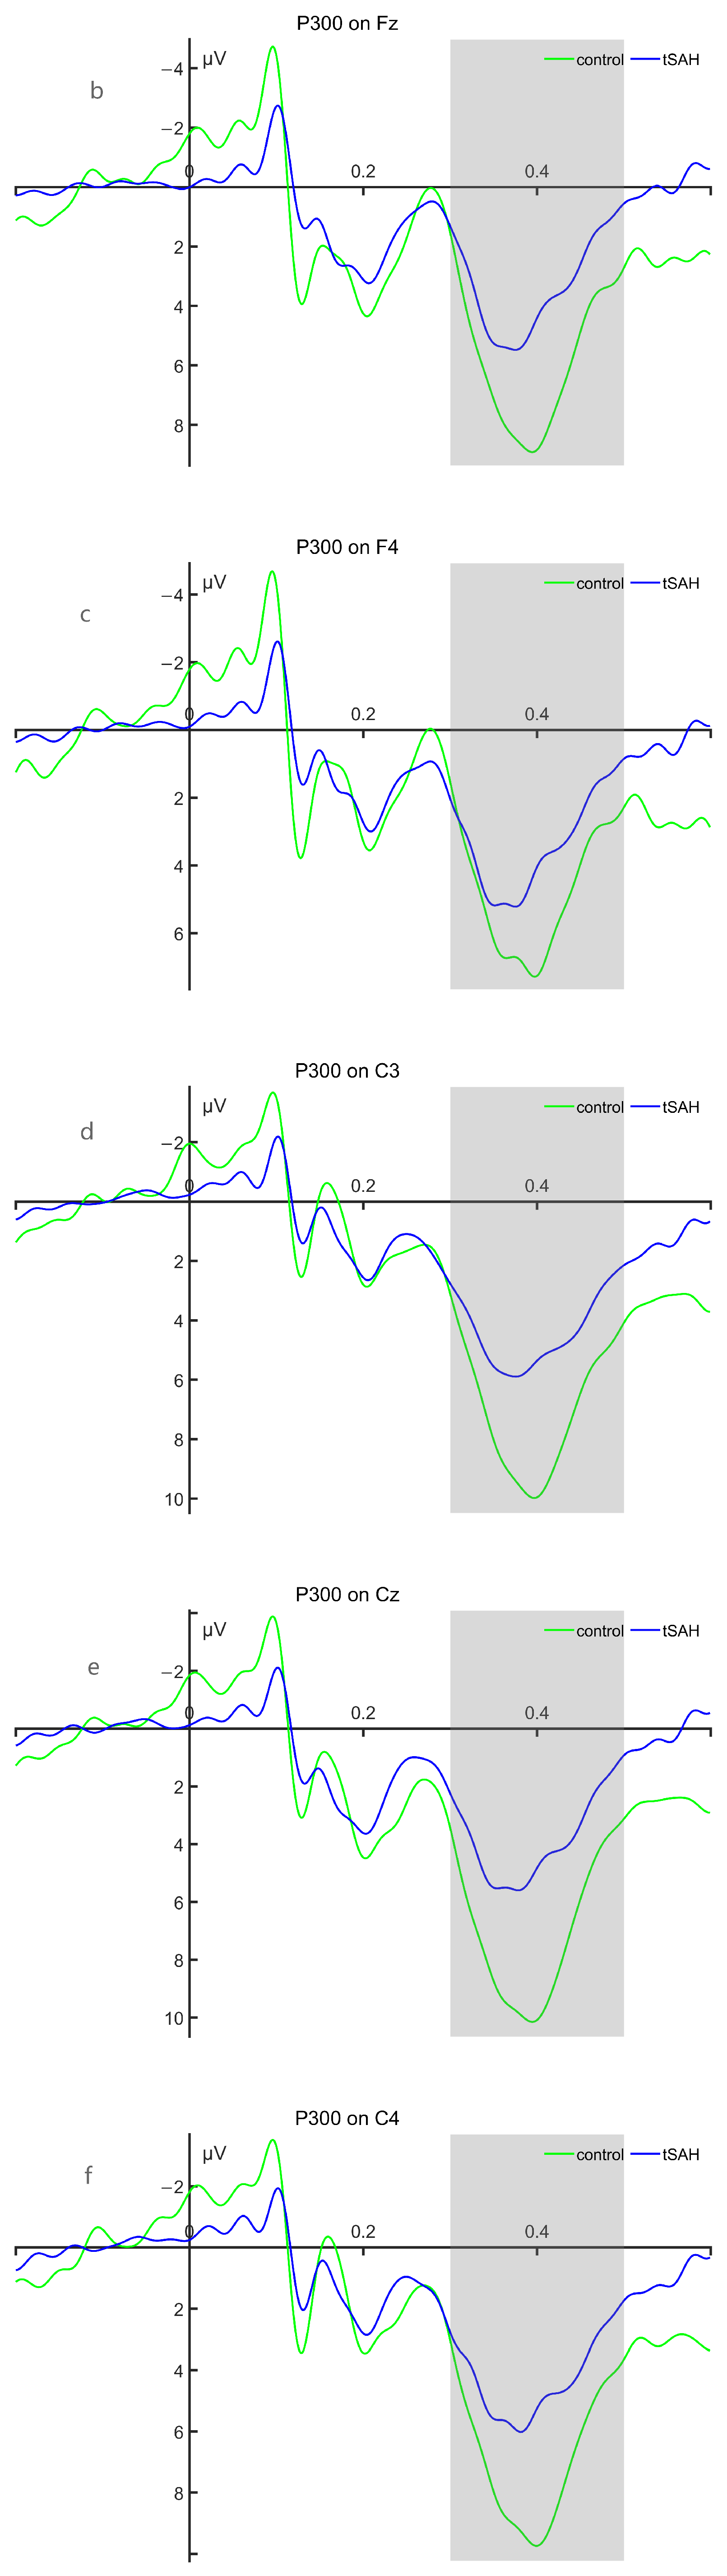
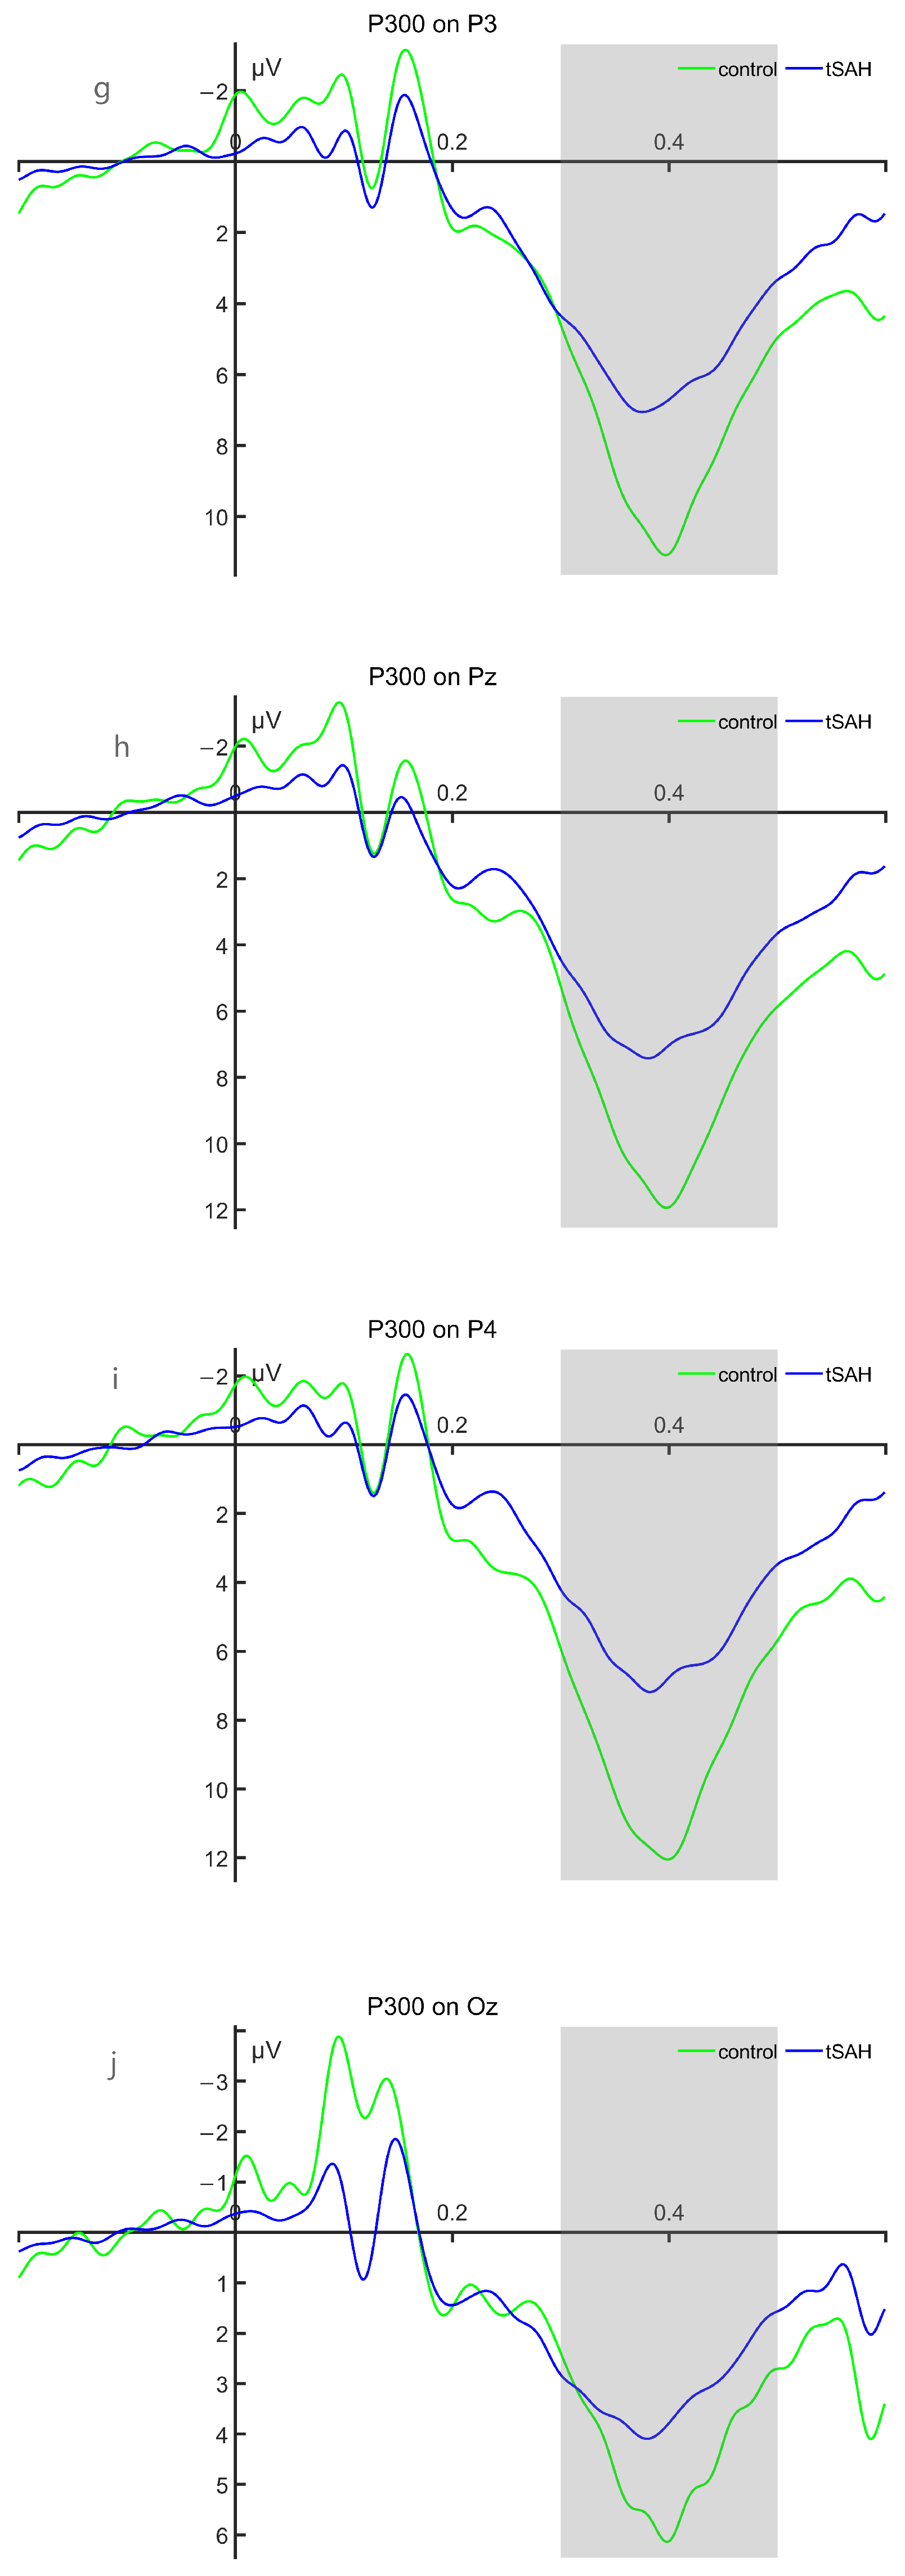
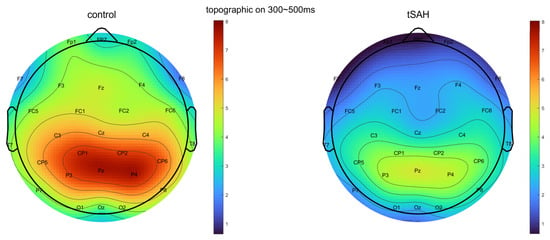
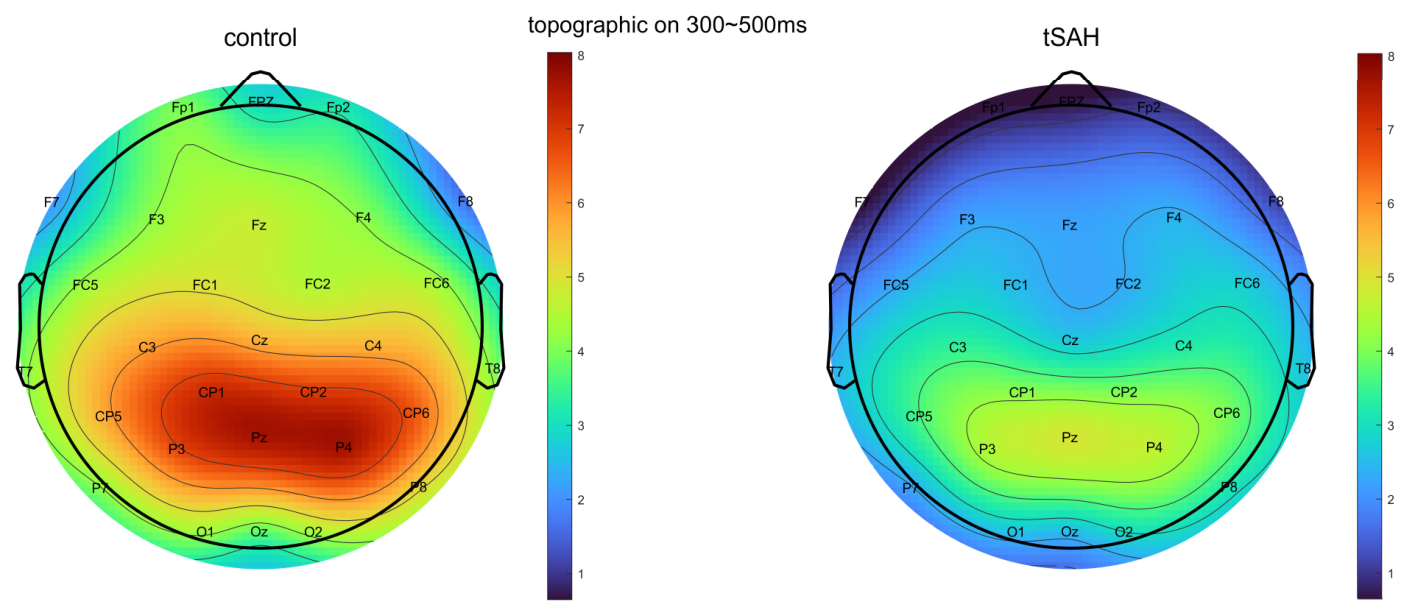
(1) Under target stimuli, significant between-group differences in the mean P300 amplitude between the HC group and the tSAH group were observed at Cz, C3, C4, Pz, and P4 electrodes after FDR correction, and the significant amplitude in the HC group was greater than that in the tSAH group; there were no significant differences in the peak latency of P300 under target stimulation at the 10 electrodes between the two groups; Figure 3 and Figure 4 shows the waveform and topographic maps of P300 in the HC group and tSAH group, and detailed statistical results are presented in Table 3 and Table 4.
Figure 3.
Waveform of P300 in the HC group and tSAH group. (a–j) show the P300 waveforms at F3, Fz, F4, C3, Cz, C4, P3, Pz, P4, and Oz, respectively. The green waveform represents the HC group, and the blue waveform represents the tSAH group; the time window of the P300 component is 300 ms to 500 ms, as indicated by the light gray shaded area. In all waveforms, negative deflections are plotted upwards.
Figure 4.
The topographic map of the target stimulus in the healthy control group versus the tSAH group within the time window of 300–500 ms. The colored bar represents voltage in microvolts (μV).
Table 3.
Comparison of mean amplitude between the HC group and the tSAH group under p300 target stimulation.
Table 4.
Comparison of peak latency between the HC group and the tSAH group for p300 target stimuli.
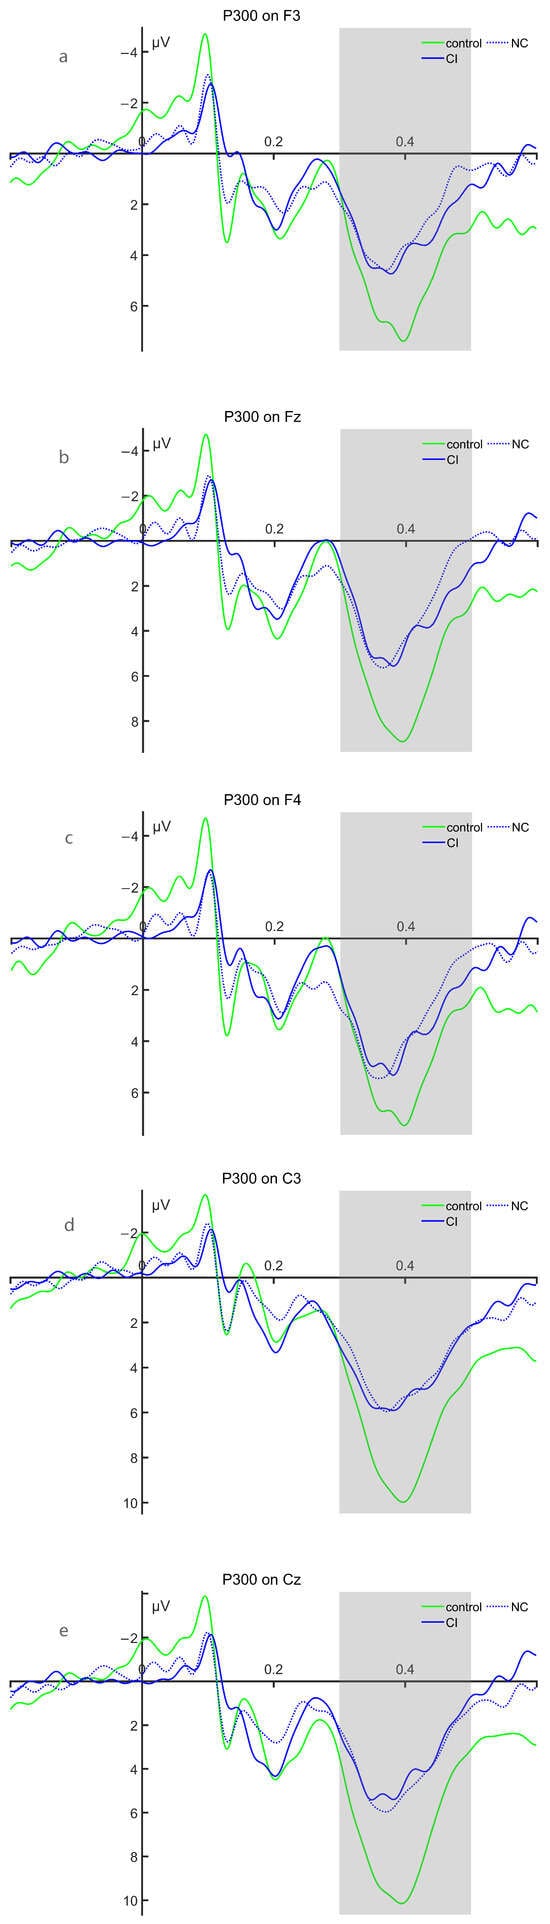
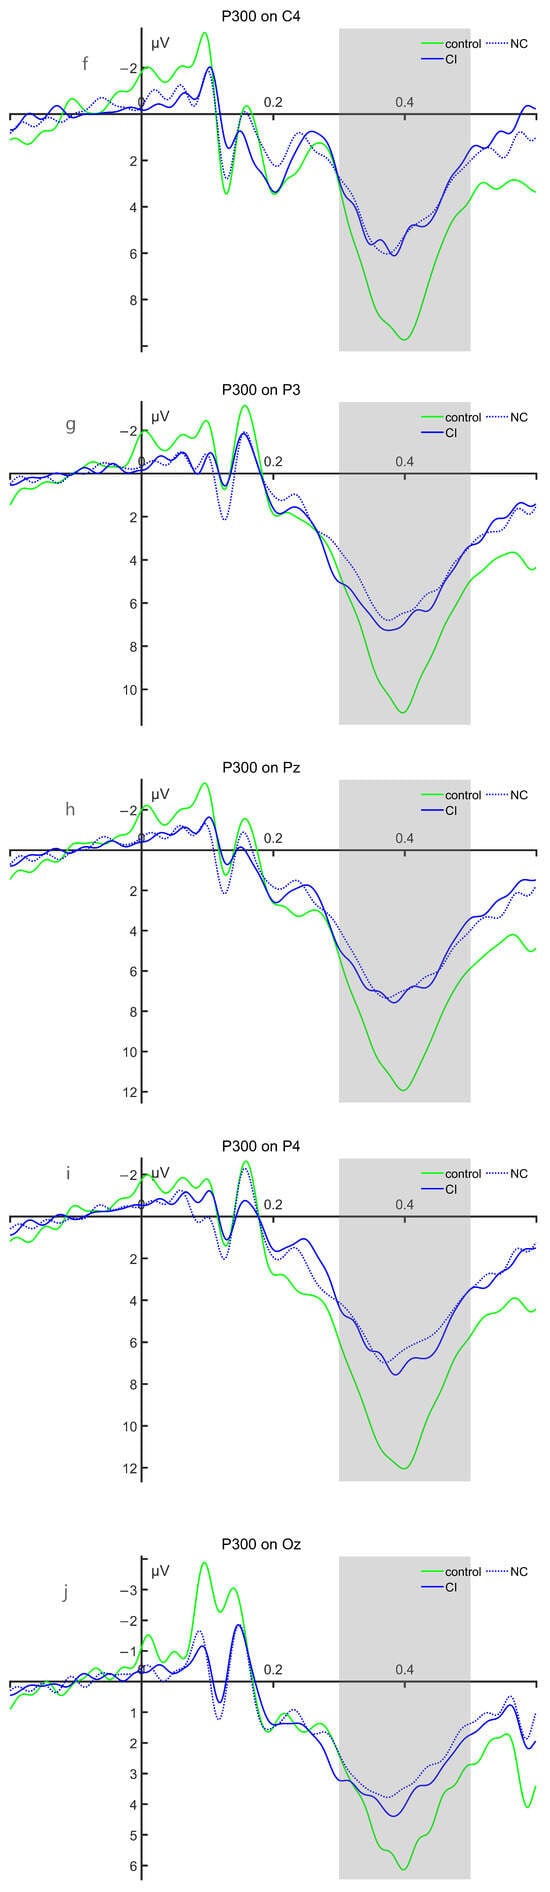
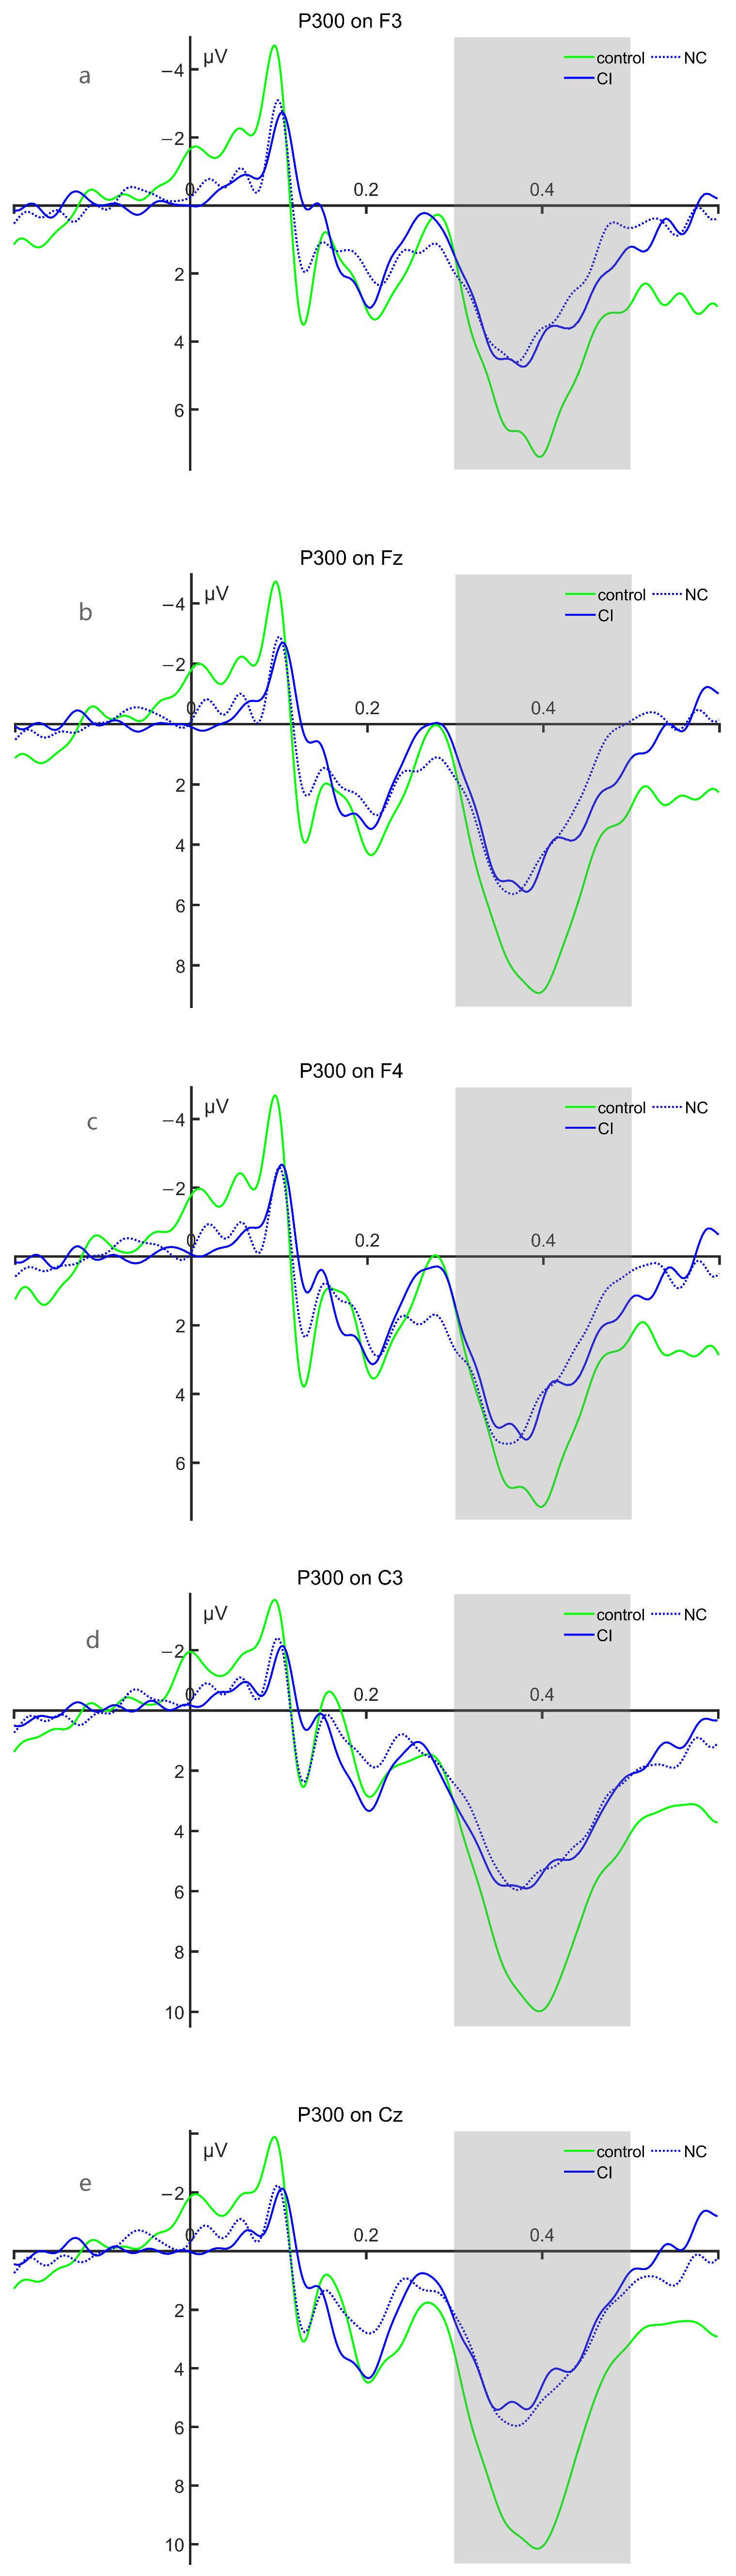
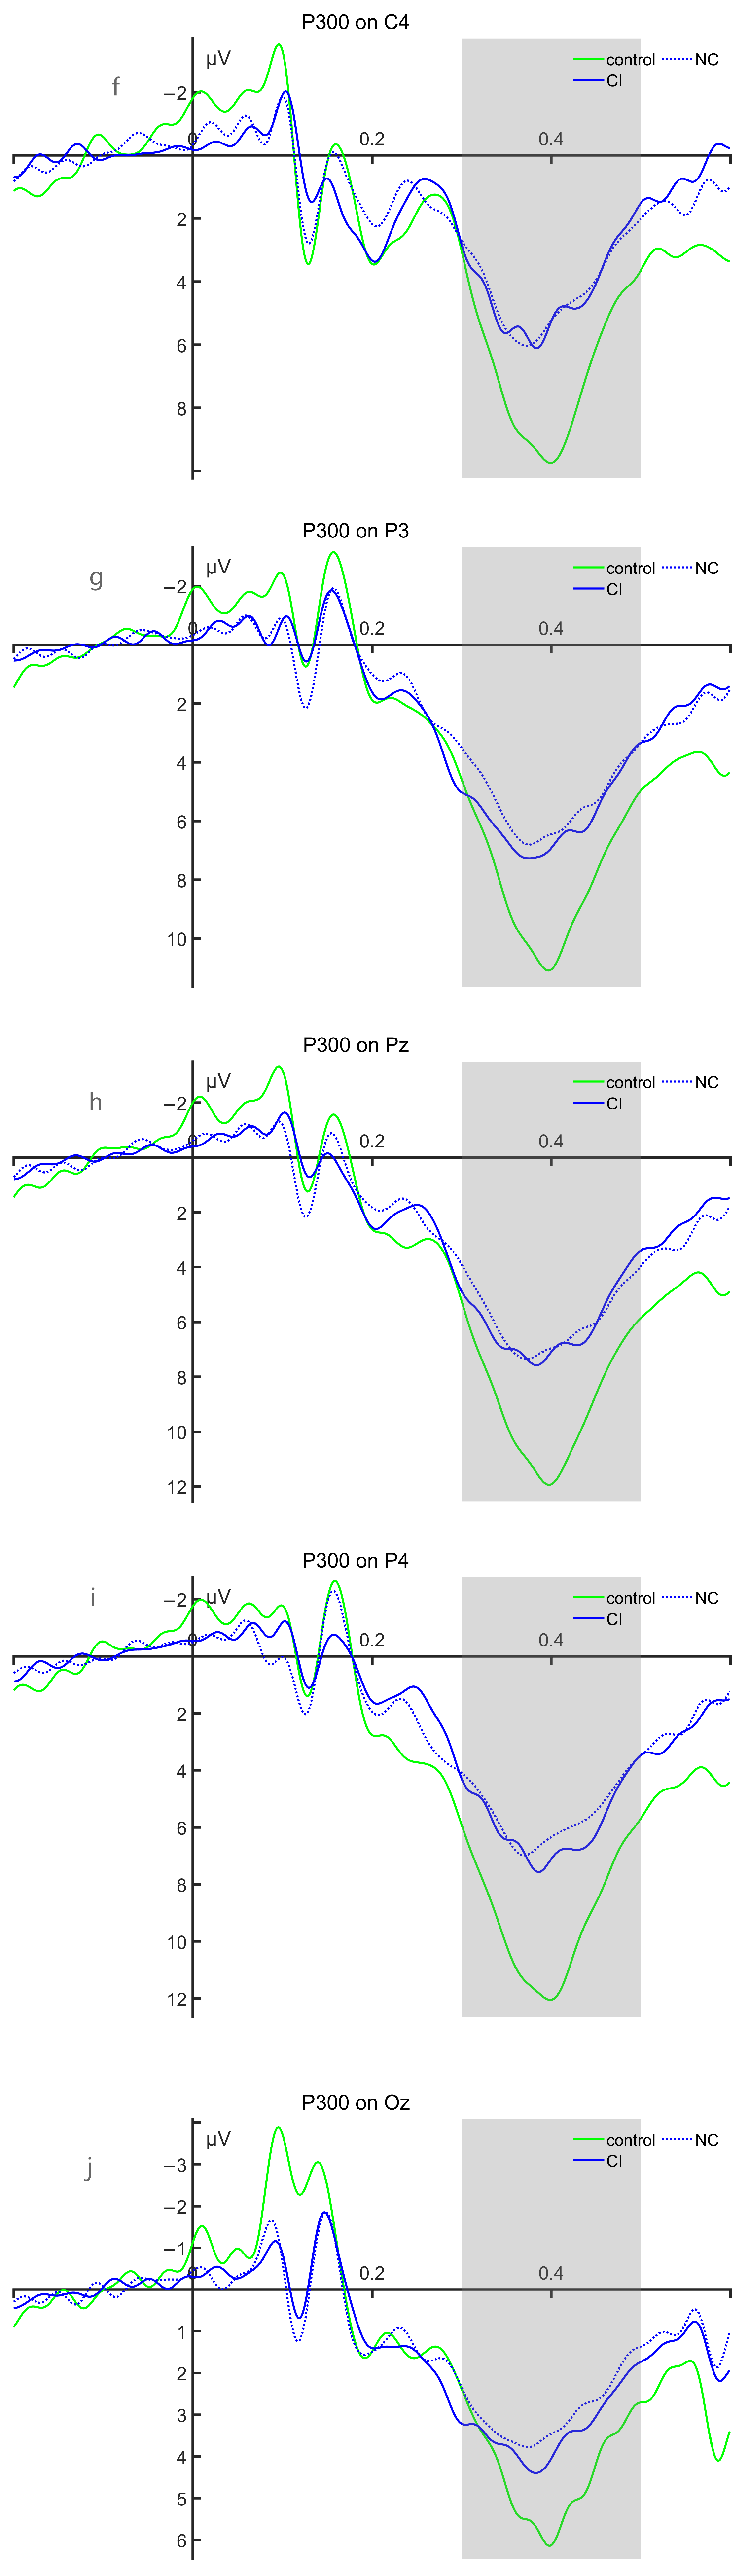
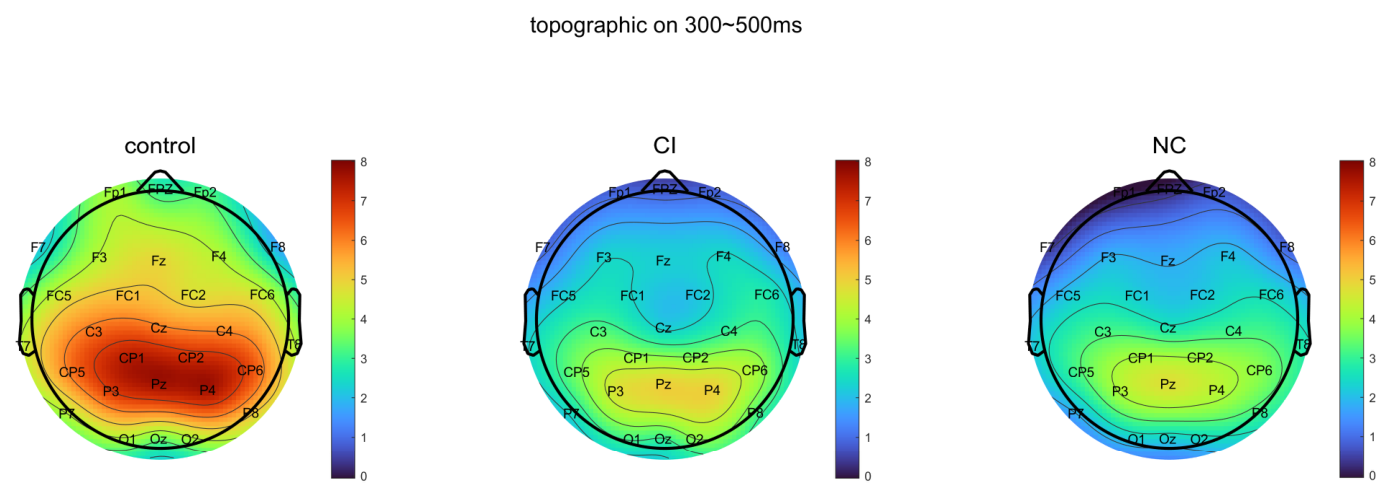
(2) There were no significant differences in mean amplitude and peak latency between the CI group and NC group under 10 electrode target stimuli; Figure 5 and Figure 6 shows the waveforms and topographic maps of P300 for the HC group, CI group, and NC group, and the detailed statistical results are presented in Table 5 and Table 6.
Figure 5.
Waveform maps of P300 in the HC group, CI group, and NC group. (a–j) show the P300 waveforms at F3, Fz, F4, C3, Cz, C4, P3, Pz, P4, and Oz, respectively. The green waveform represents the HC group, the blue dashed waveform represents the NC group of tSAH, the blue solid waveform represents the CI group of tSAH, and the time window of the P300 component is 300 ms to 500 ms, as indicated by the light gray shaded area. In all waveforms, negative deflections are plotted upwards.
Figure 6.
The topographic maps of the target stimulus for the HC group, the CI group of tSAH, and the NC group within the time window of 300–500 ms. The colored bar represents voltage in microvolts (μV).
Table 5.
Comparison of mean amplitude between CI group and NC group under P300 target stimulation.
Table 6.
Comparison of peak latency of P300 target stimulus between CI group and NC group during the incubation period.
3.3.2. MMN Results
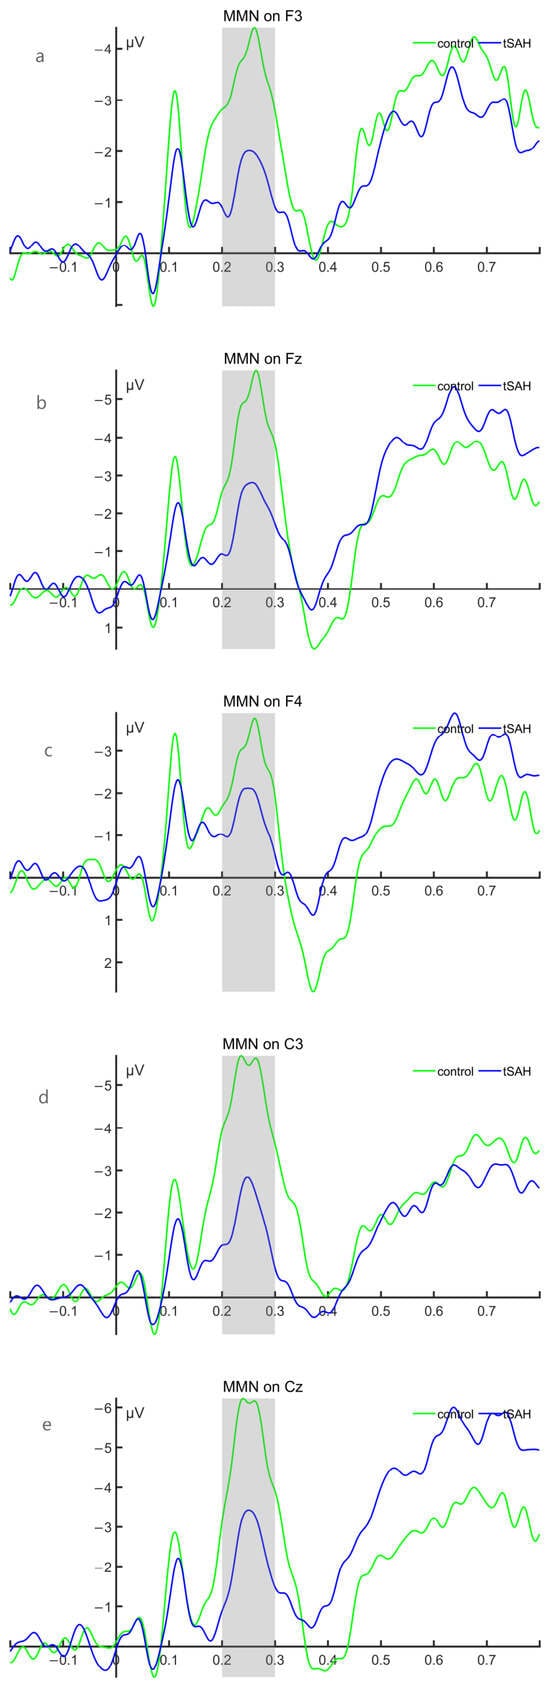
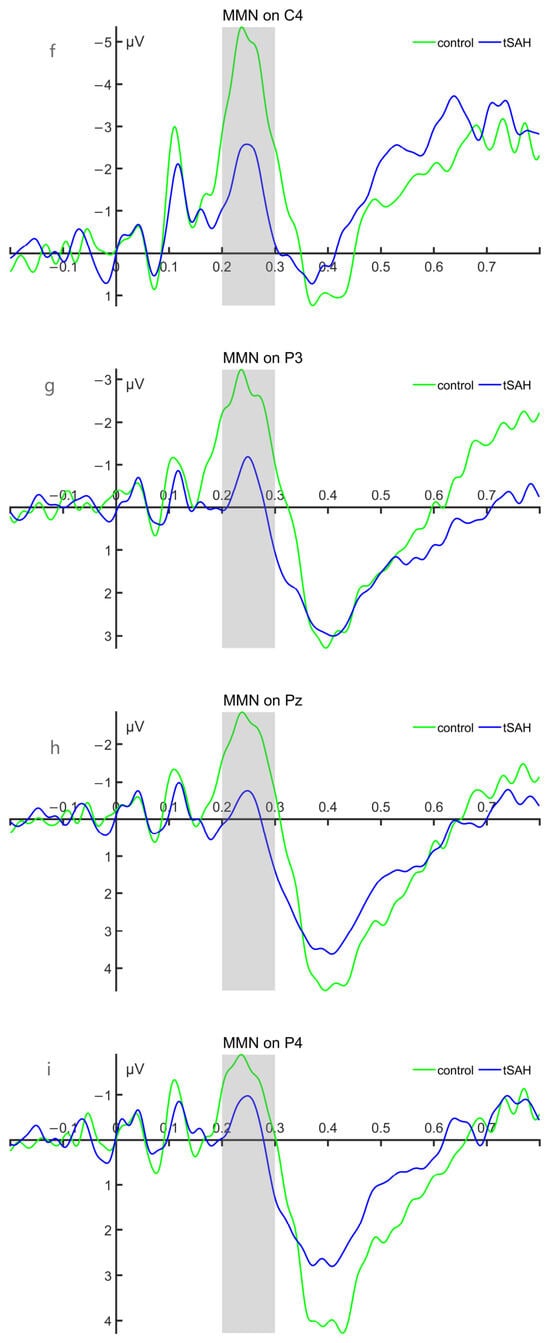
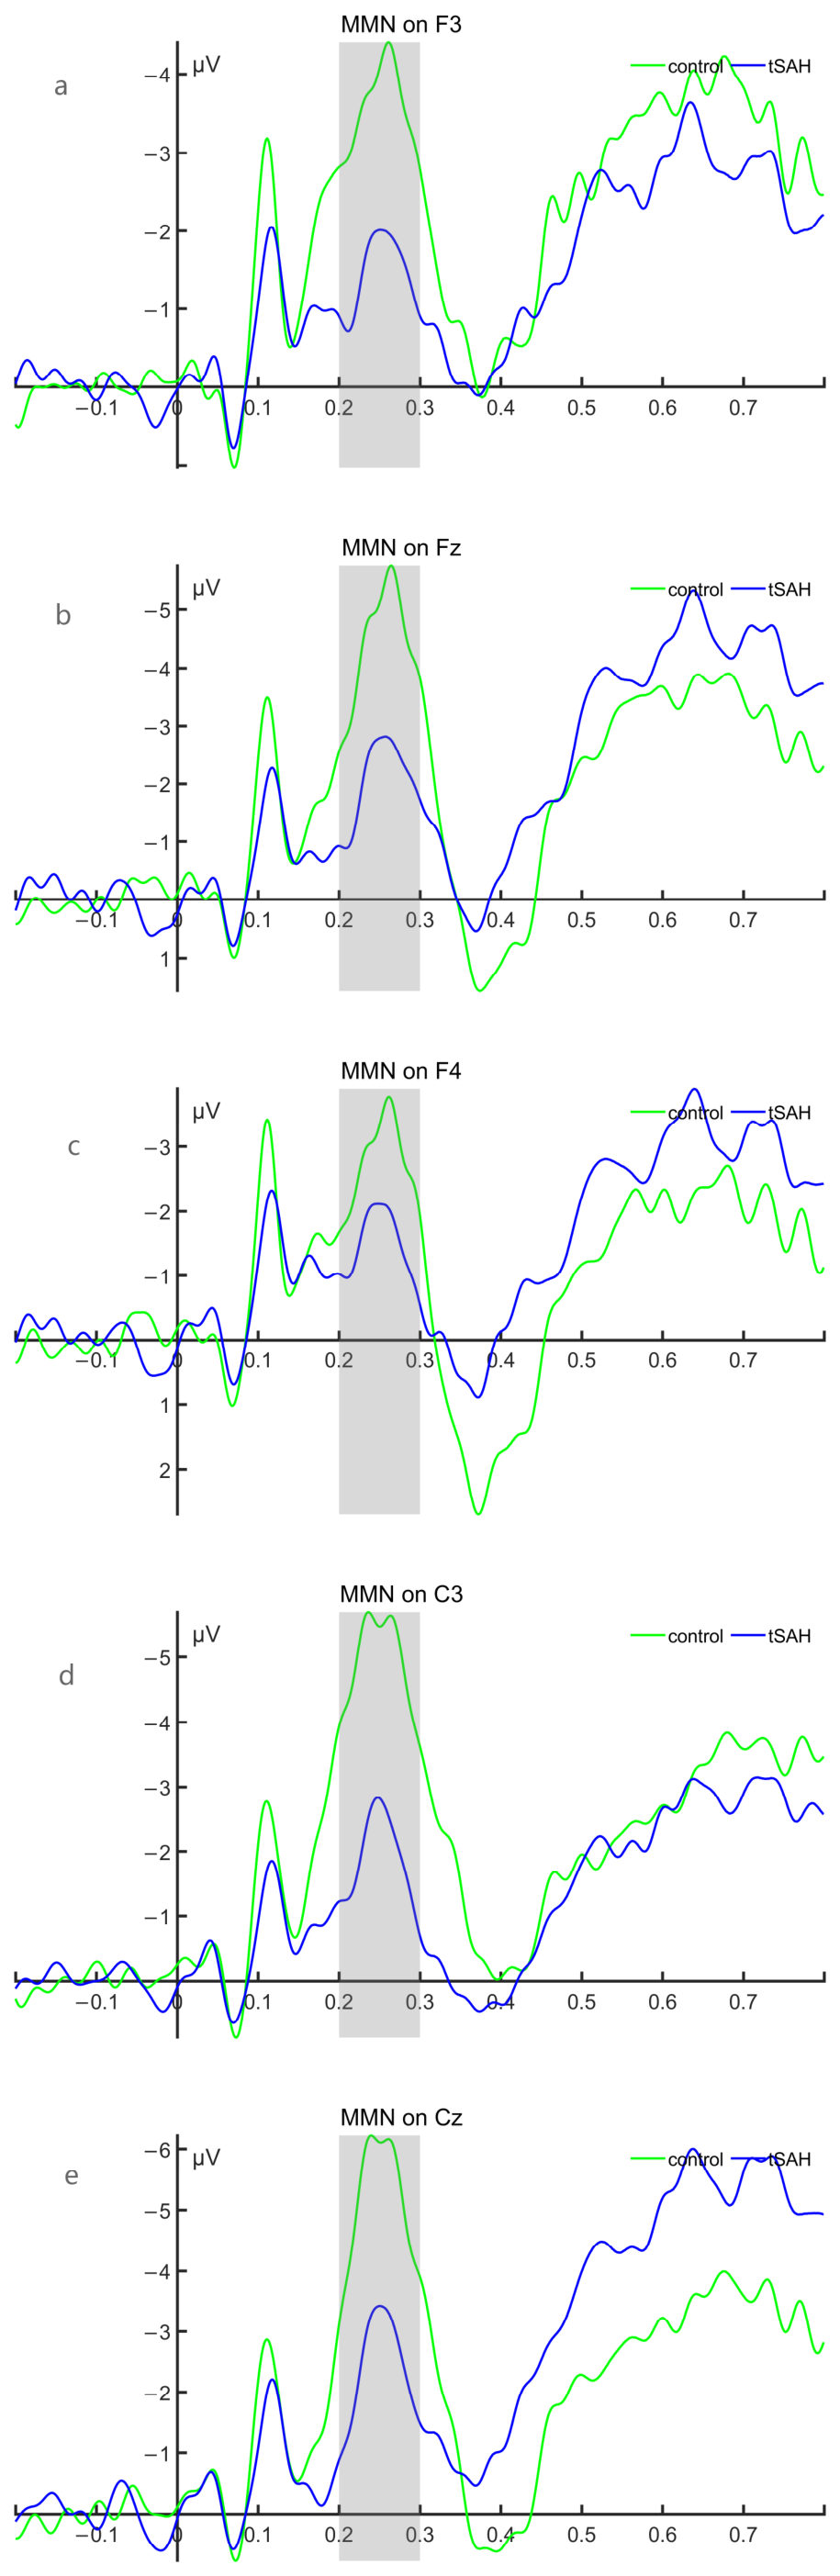
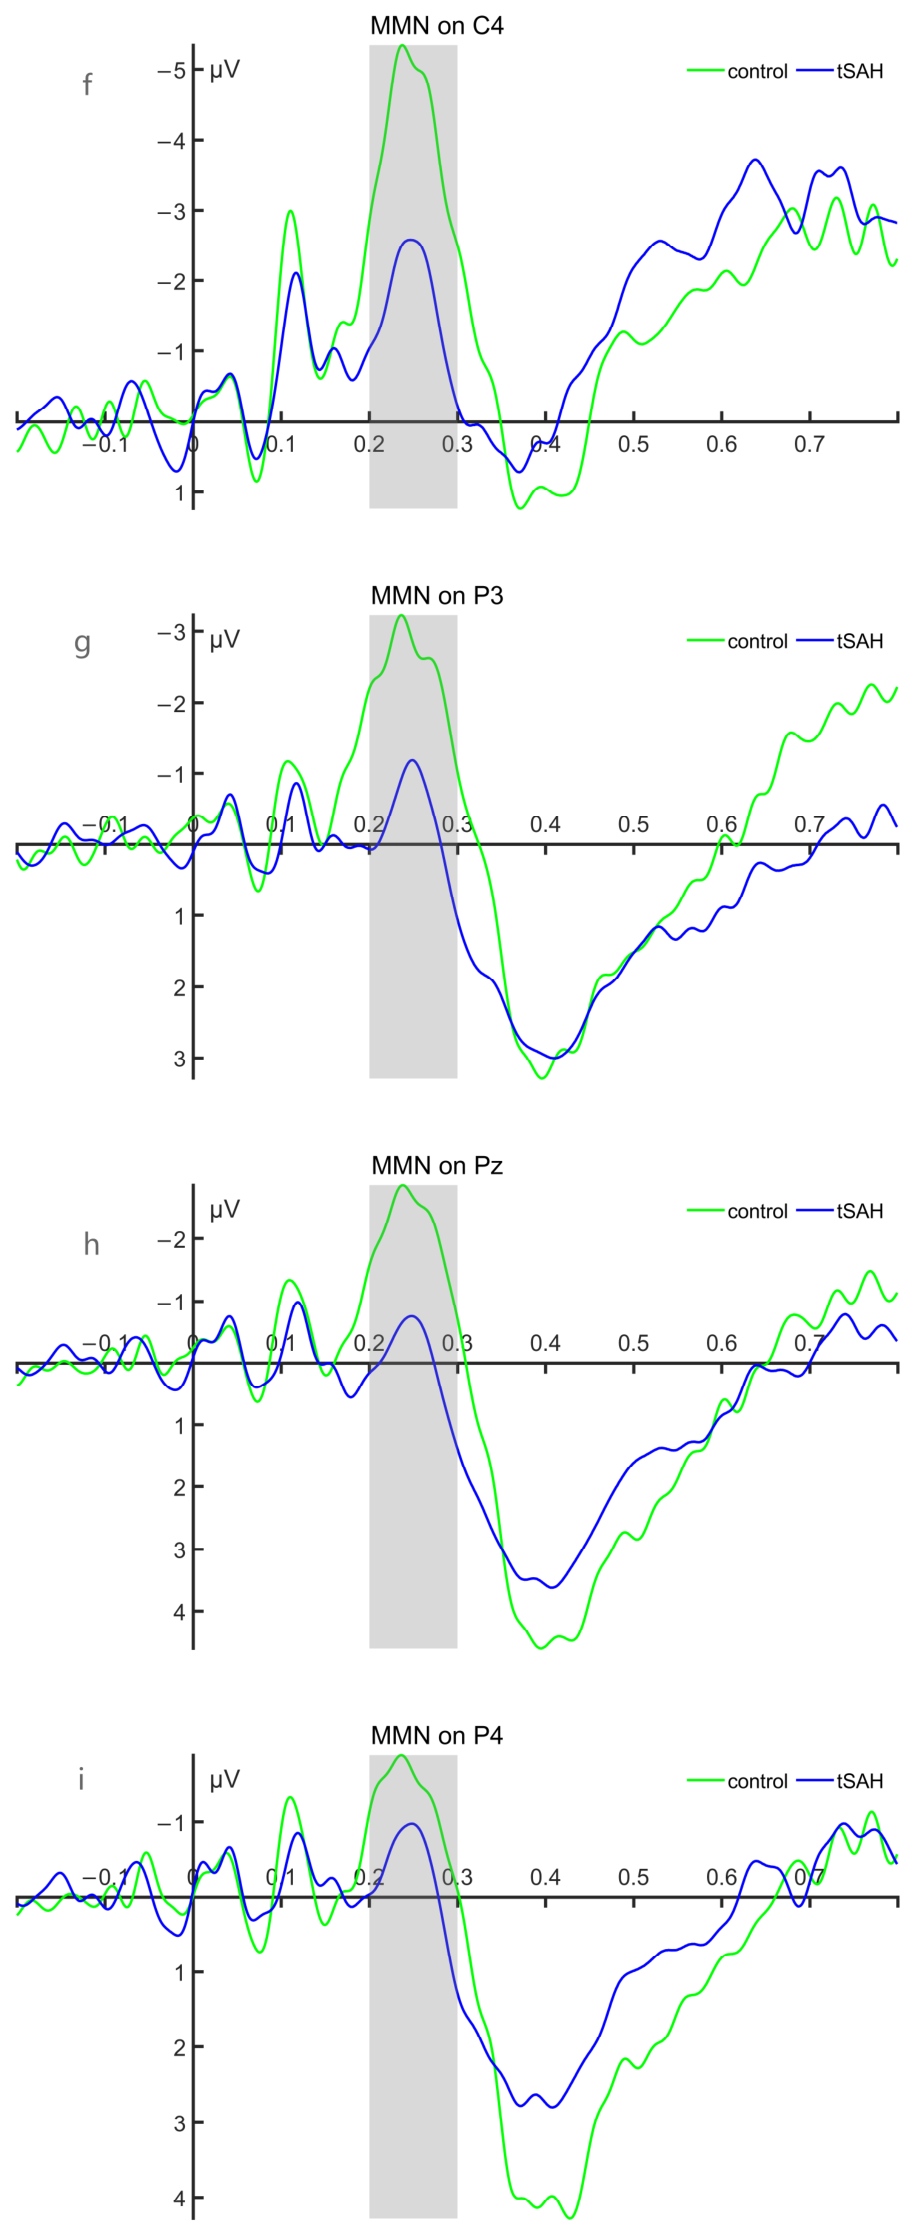
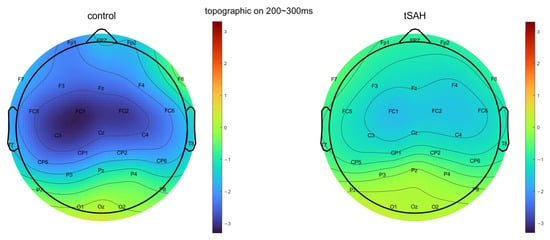
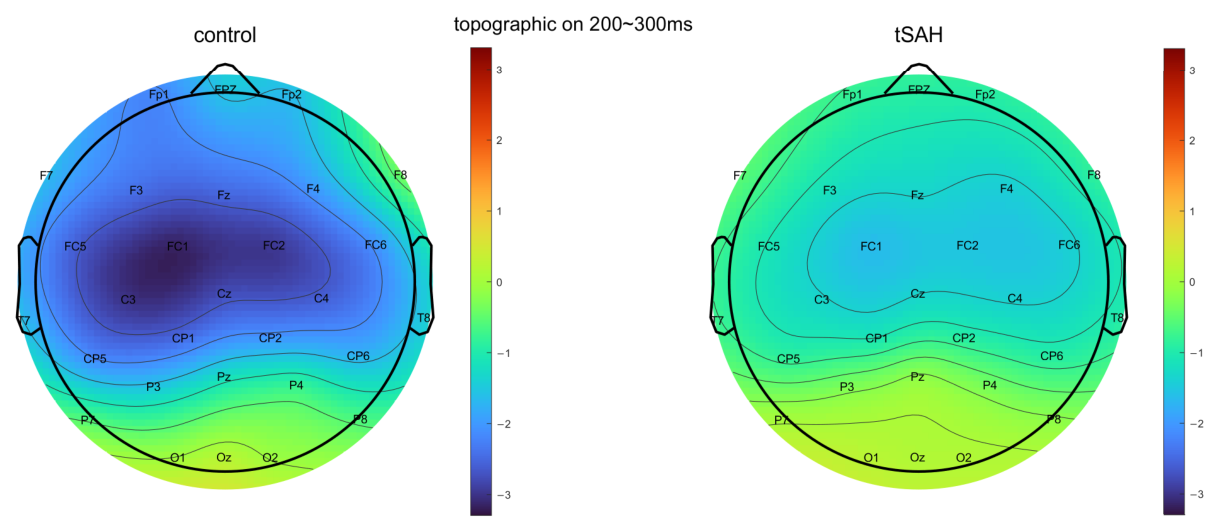
(1) For the mean amplitudes of the MMN difference wave between the HC group and the tSAH group, under FDR correction, there were no electrodes with significant differences between the two groups; for the peak latency of the MMN difference wave, there were no electrodes with significant differences in any inter-group comparisons. Figure 7 and Figure 8 shows the waveform and topographic maps of the MMN difference wave for the HC group and the tSAH group, and the statistical results are detailed in Table 7 and Table 8.
Figure 7.
Waveform of MMN difference waves in the HC group and the tSAH group. (a–i) show the waveform diagrams of MMN difference waves at F3, Fz, F4, C3, Cz, C4, P3, Pz, and P4, respectively; the green waveform represents the HC group, while the blue waveform represents the tSAH group. The time window of the MMN component is 200 ms to 300 ms, as indicated by the light gray shaded area. In all waveforms, negative deflections are plotted upwards.
Figure 8.
The topographic map of the MMN difference wave between the HC group and the tSAH group within the time window of 200–300 ms. The colored bar represents voltage in microvolts (μV).
Table 7.
Comparison of MMN difference wave mean amplitudes between the HC group and the tSAH group.
Table 8.
Comparison of MMN difference wave peak latency between HC group and tSAH group.
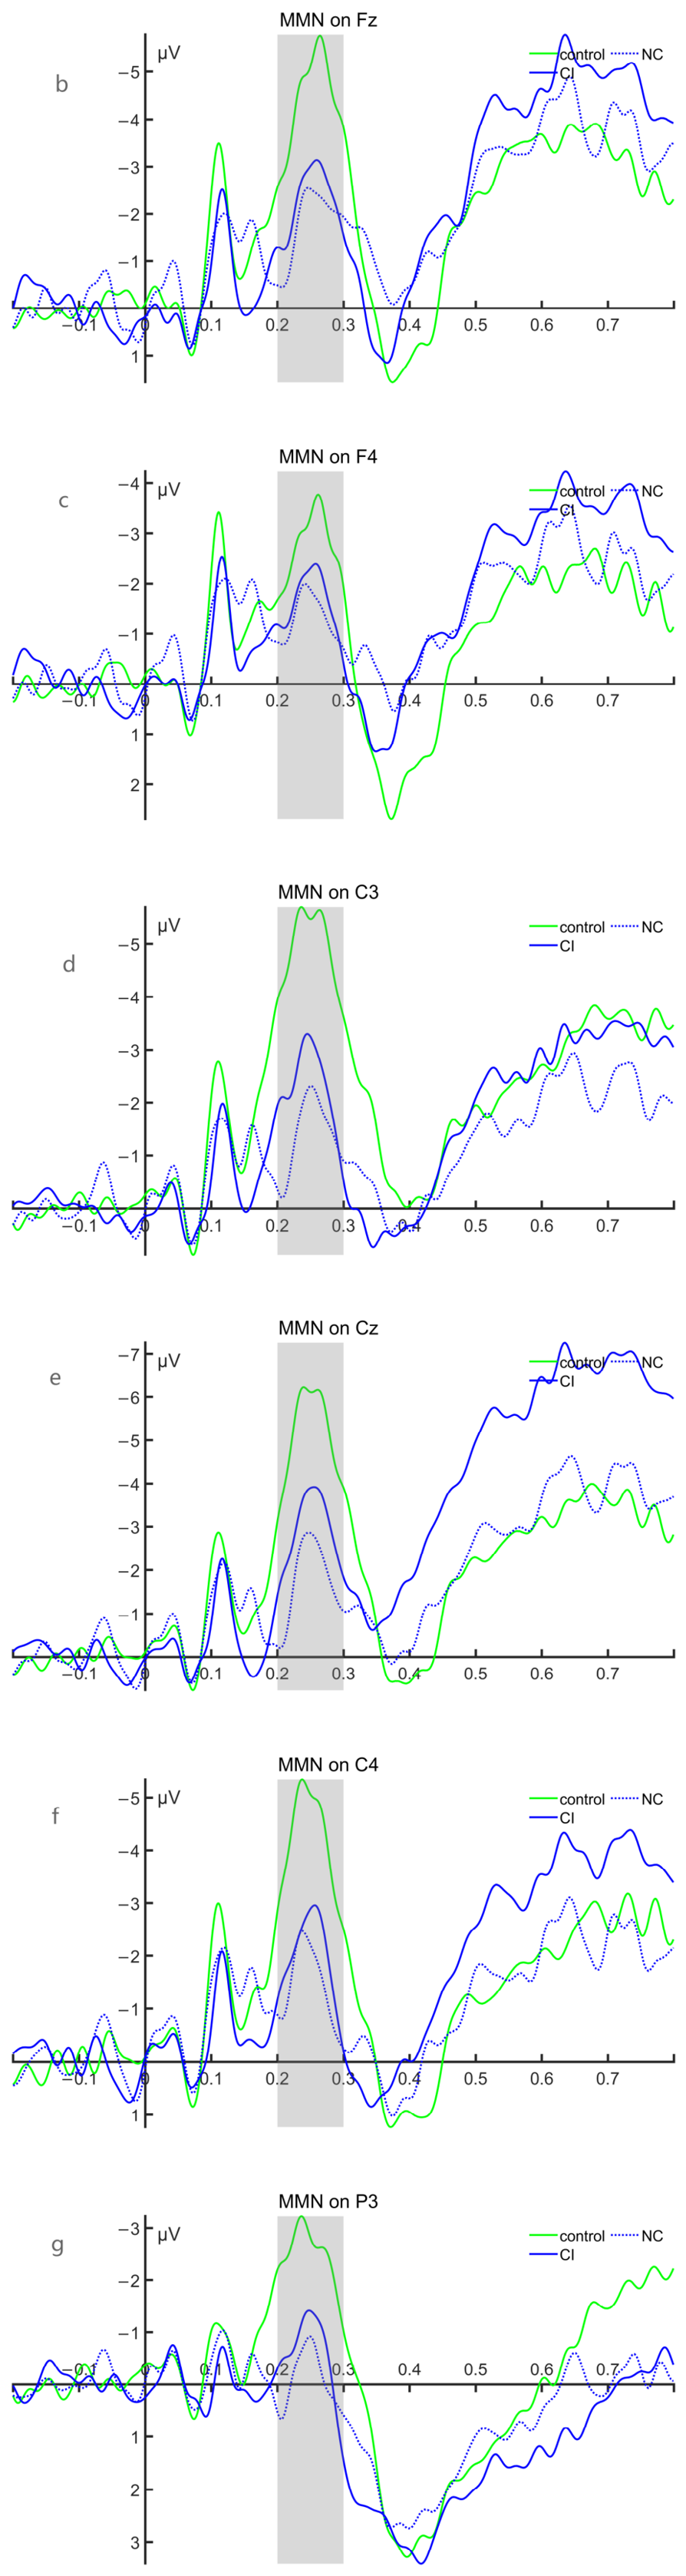
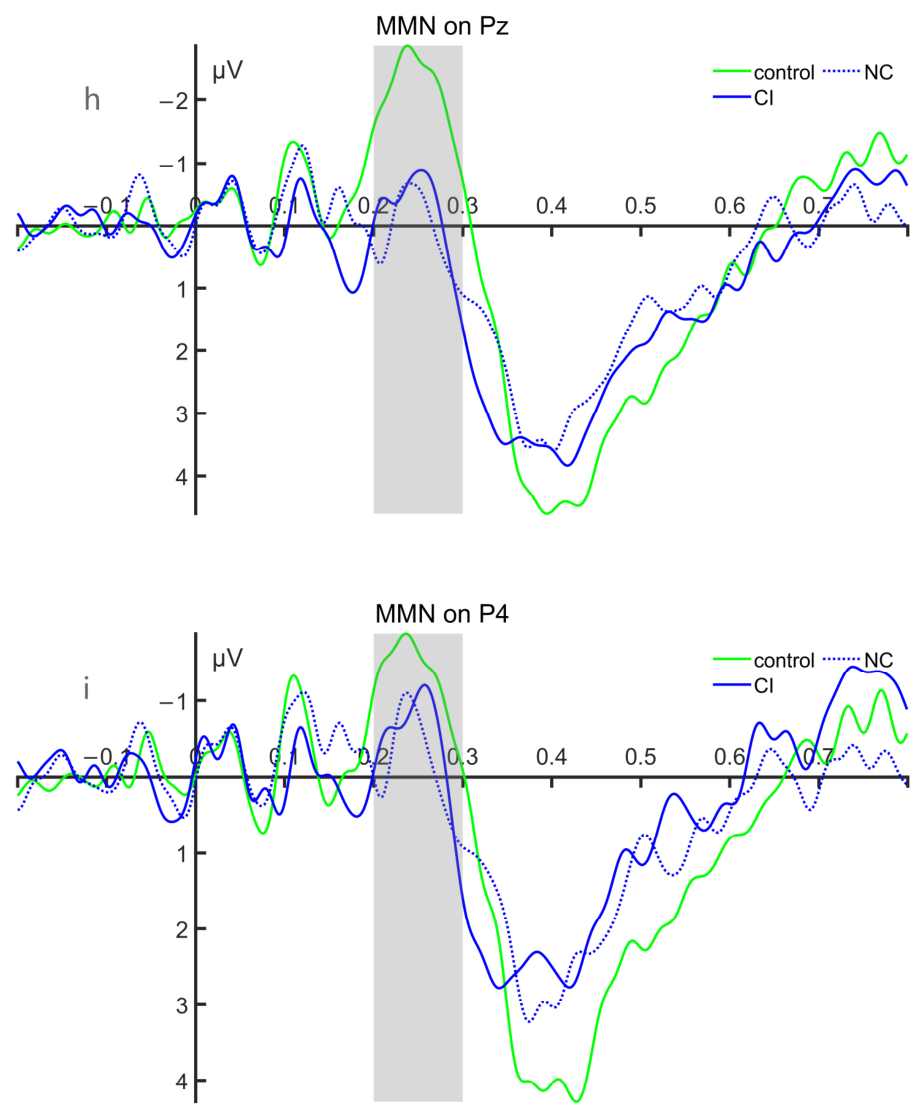
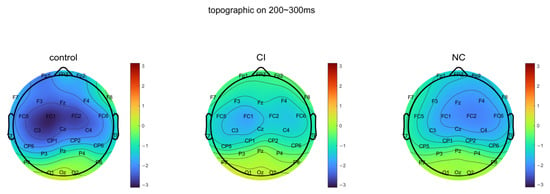
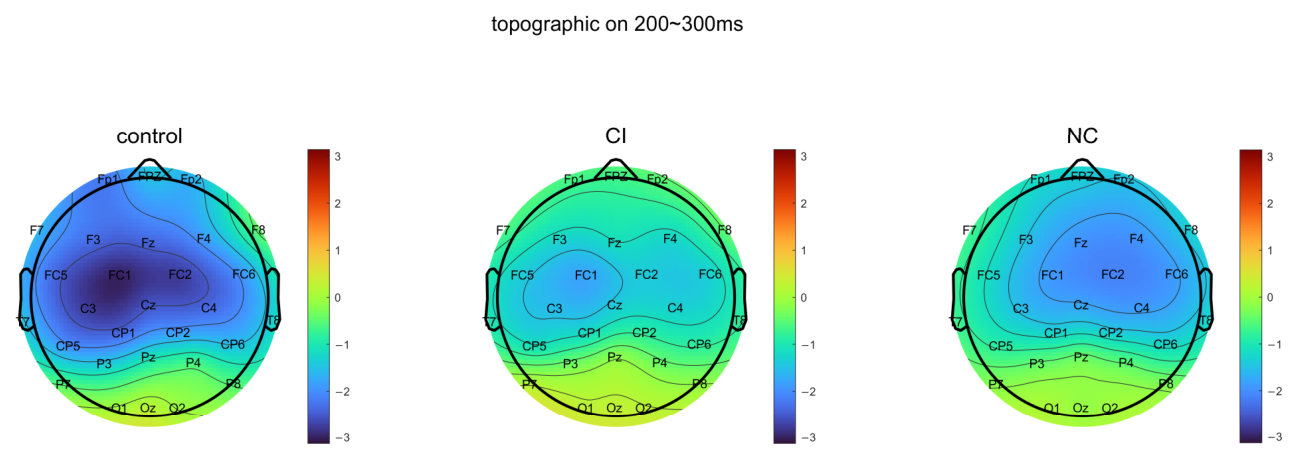
(2) There was no significant difference in the mean amplitude of the MMN difference wave between the CI group and the NC group electrodes; the peak latency of the difference wave showed no significant difference across all group comparisons. Figure 9 and Figure 10 shows the average waveform and topographic maps of the MMN difference wave for the HC group, CI group, and NC group, with statistical results detailed in Table 9 and Table 10.
Figure 9.
Waveforms of MMN difference waves in the HC, CI, and NC groups. (a–i) show the waveform diagrams of MMN difference waves at F3, Fz, F4, C3, Cz, C4, P3, Pz, and P4, respectively; the green waveform represents the HC group, the blue solid line waveform represents the CI group of tSAH, and the blue dashed line waveform represents the NC group of tSAH. The time window of the MMN component is 200 ms~300 ms, as indicated by the light gray shaded area. In all waveforms, negative deflections are plotted upwards.
Figure 10.
The topographic map of the MMN difference waves for the HC group, the CI group of tSAH, and the NC group within the time window of 200–300 ms. The colored bar represents voltage in microvolts (μV).
Table 9.
Comparison of mean amplitude of MMN difference wave between CI group and NC group.
Table 10.
Comparison of MMN difference wave peak latency between CI group and NC group during the incubation period.
3.3.3. CNV Results
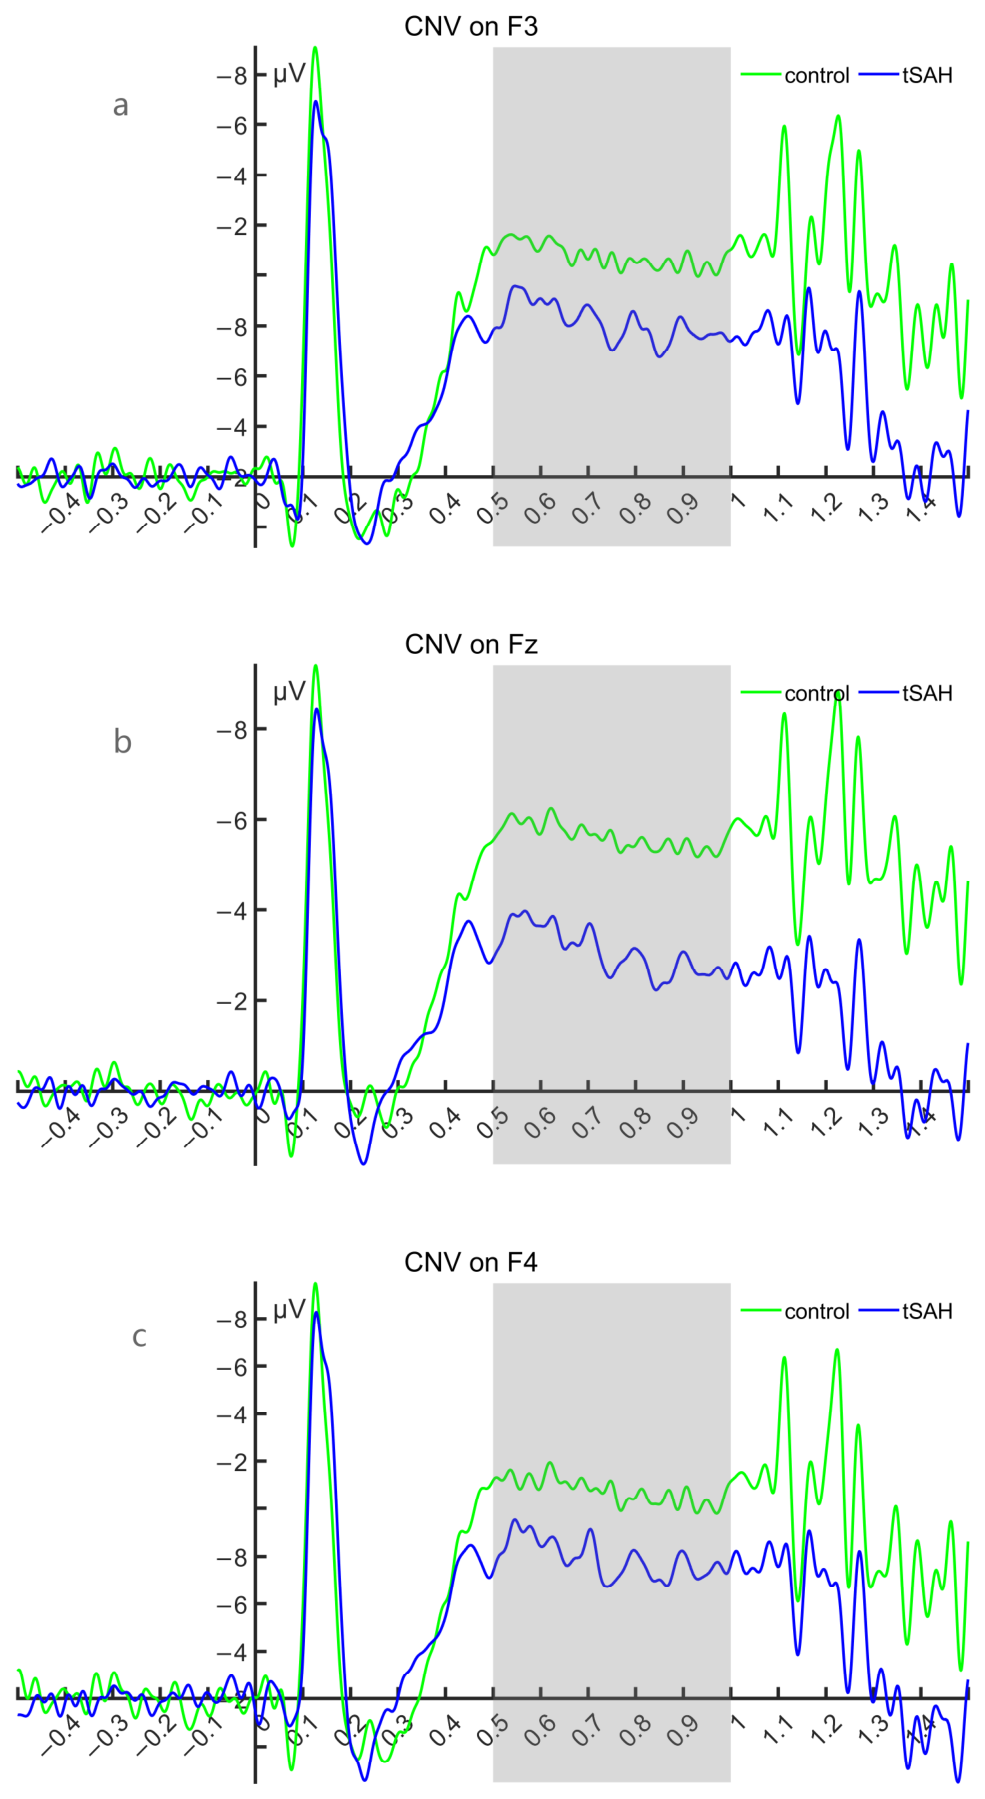
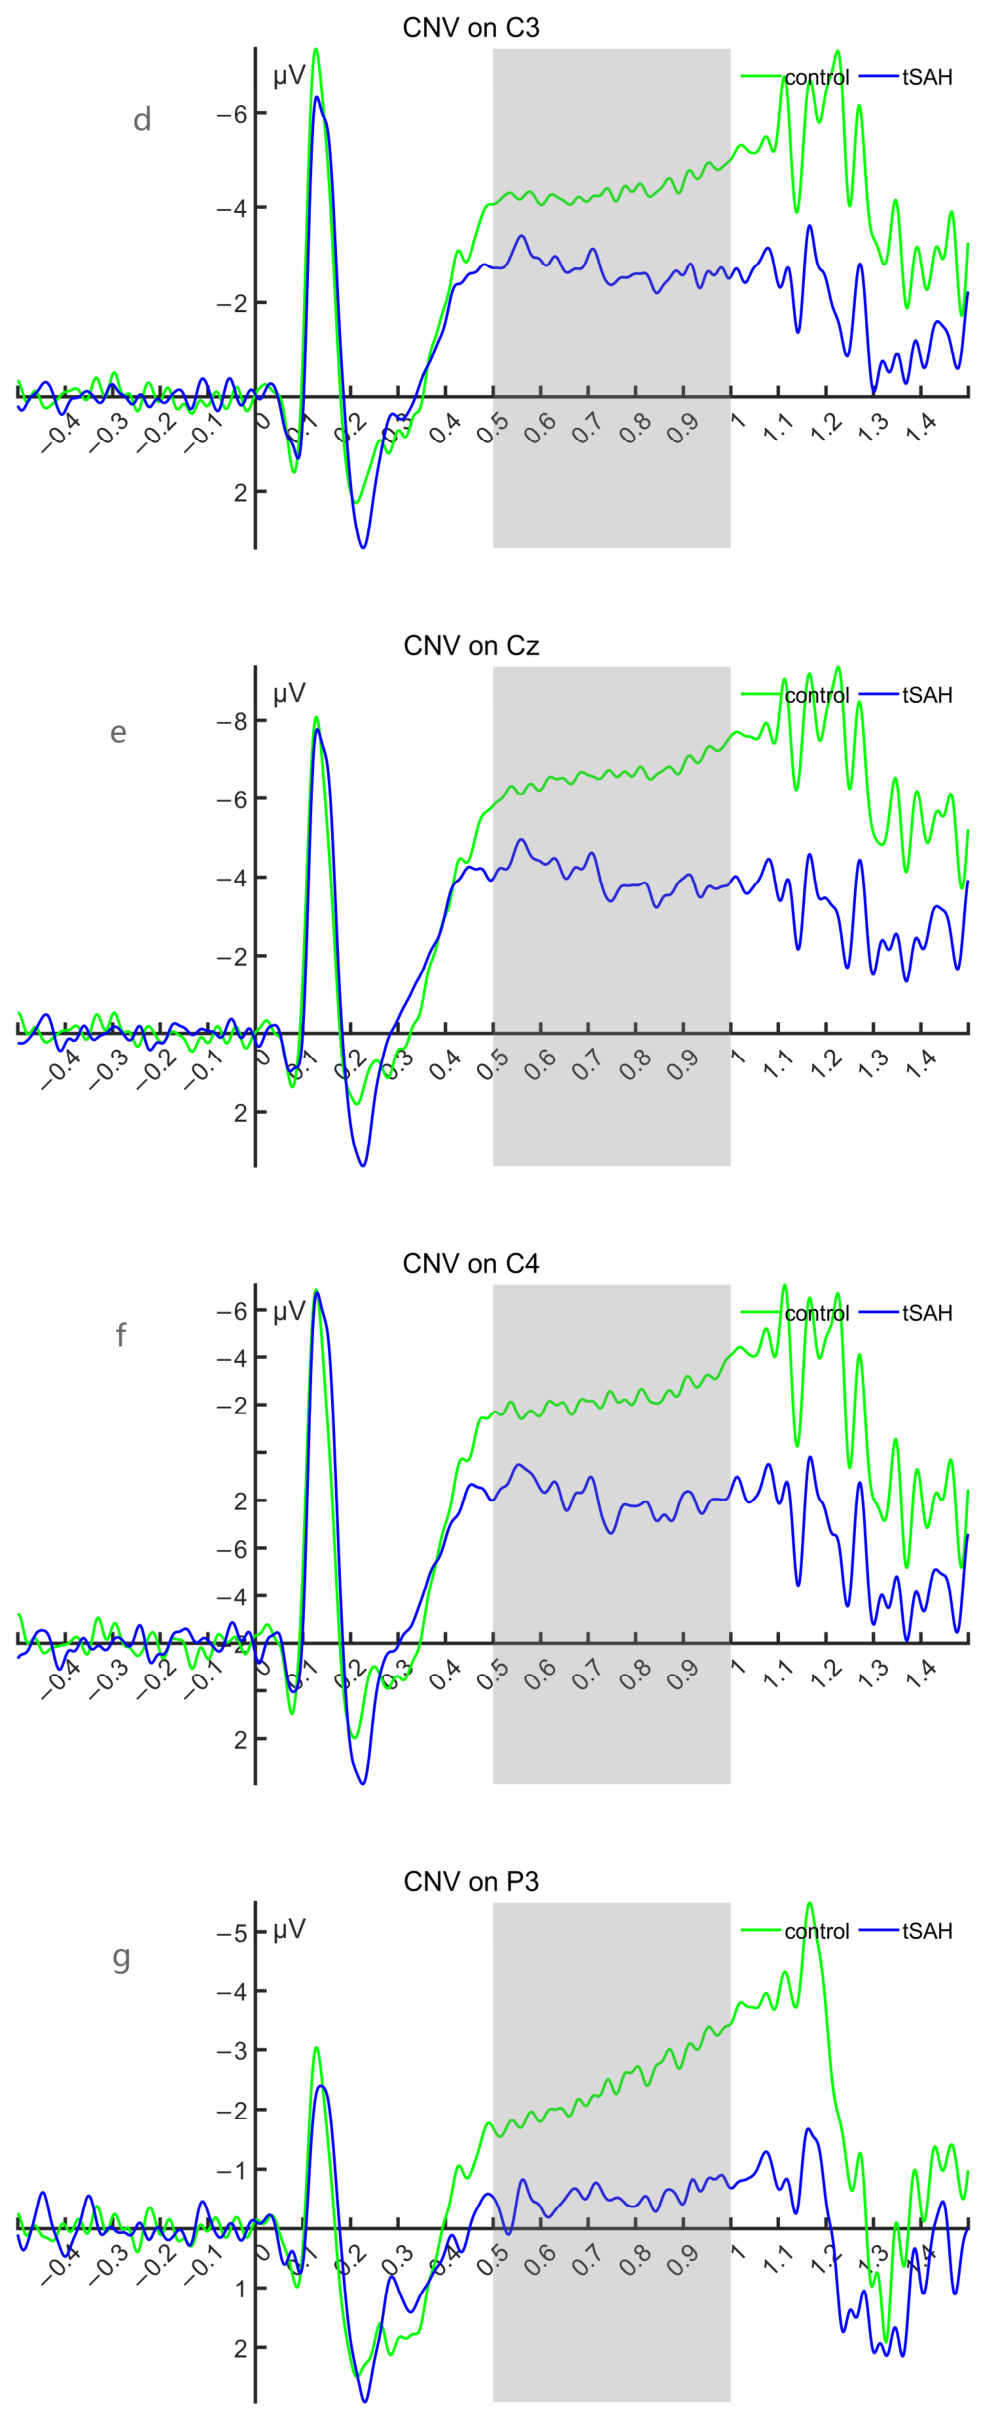
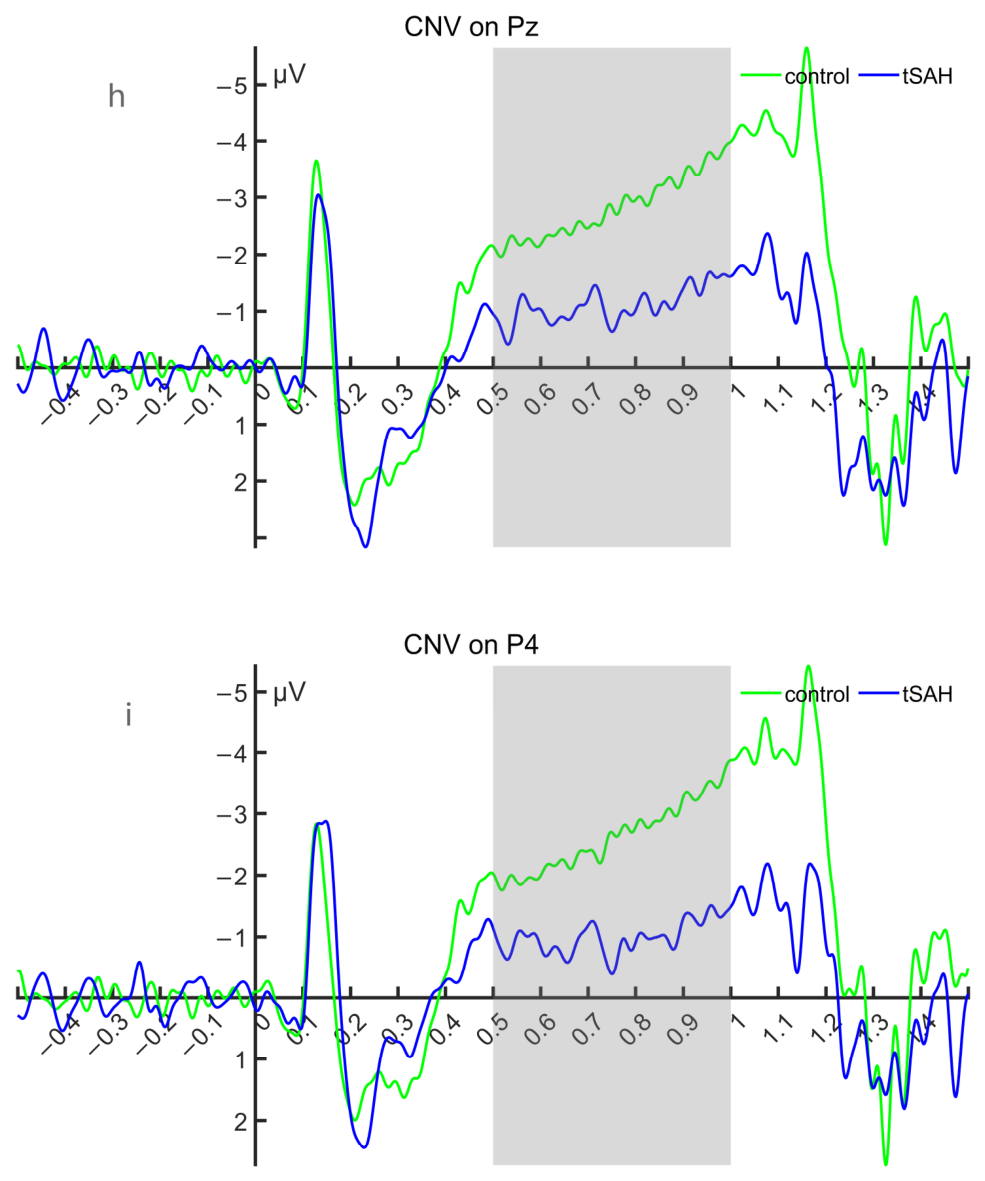
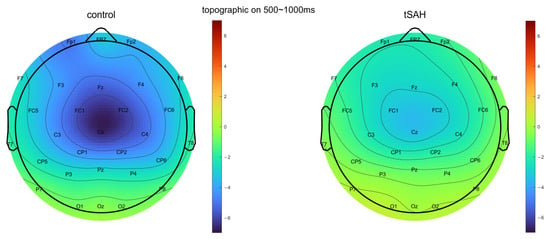
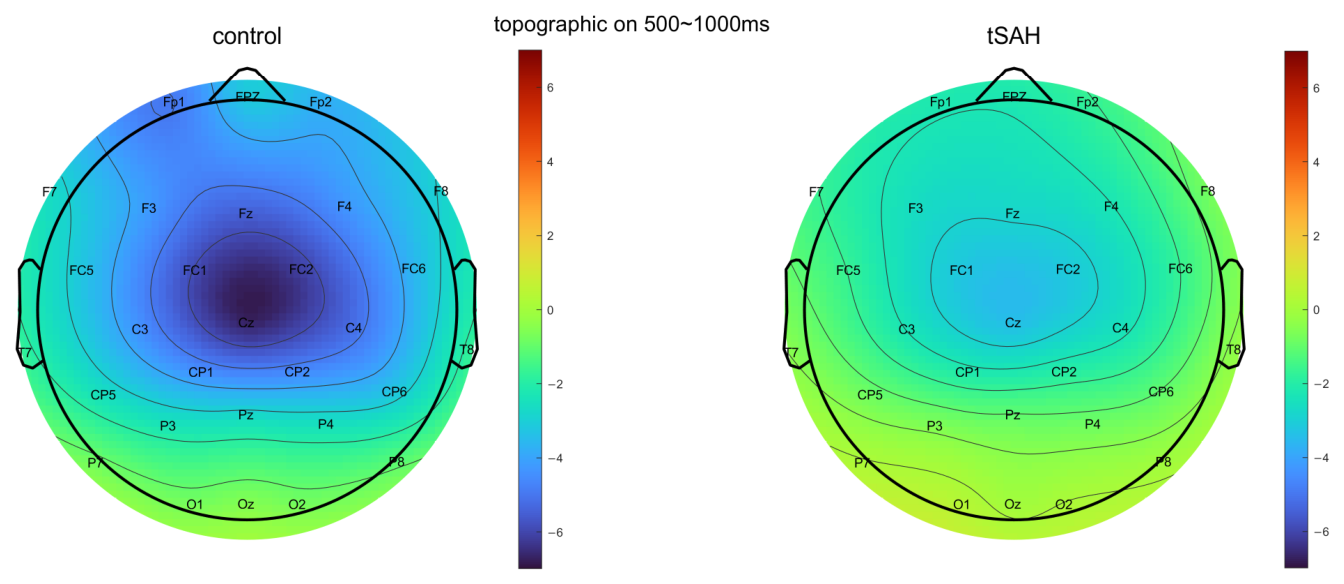
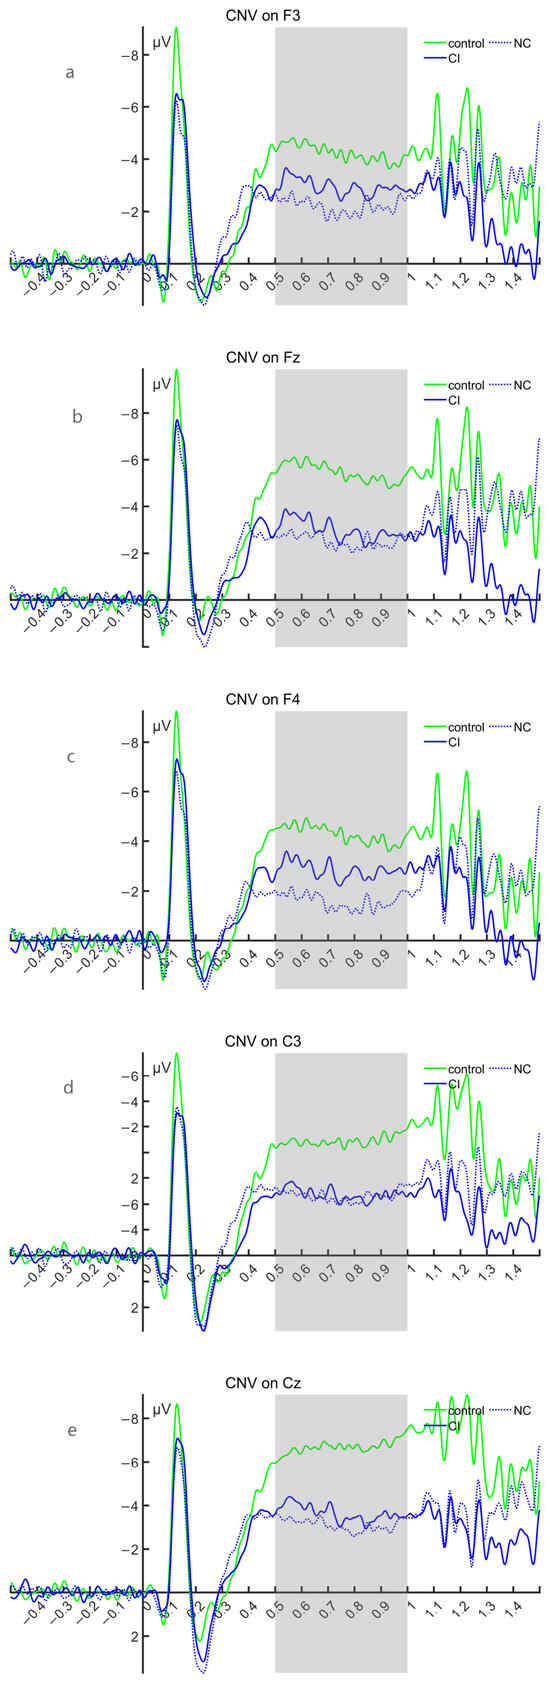
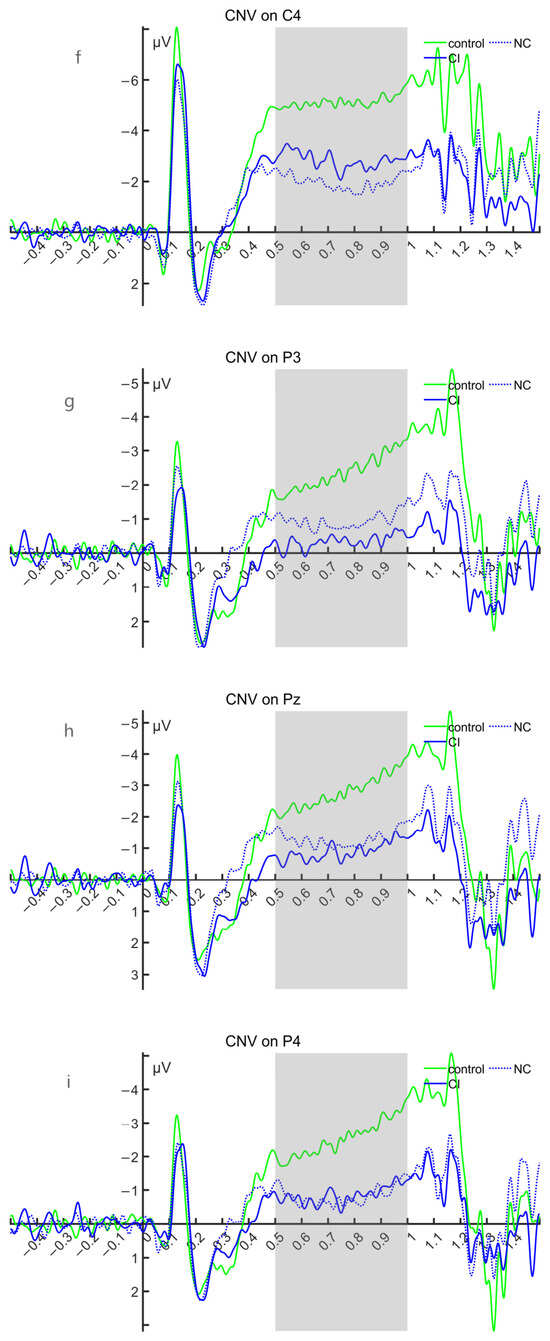
(1) Under FDR correction, the mean amplitudes of CNV showed significant differences between the HC group and the tSAH group at eight electrodes, F3, Fz, C3, Cz, C4, P3, Pz, and P4, with the HC group exhibiting greater negativity. Figure 11 and Figure 12 shows the waveforms and topographic maps of CNV for the HC and tSAH groups, and the statistical results are detailed in Table 11.
Figure 11.
Waveform of CNV in the HC group and tSAH group. (a–i) show the average waveform diagrams of CNV at F3, Fz, F4, C3, Cz, C4, P3, Pz, and P4, respectively. The green waveform represents the HC group, the blue waveform represents the tSAH group, and the time window of the CNV component is 500 ms to 1000 ms, as indicated by the light gray shaded area. In all waveforms, negative deflections are plotted upwards.
Figure 12.
The topographic maps of CNV for the HC group and the tSAH group within the time window of 500–1000 ms. The colored bar represents voltage in microvolts (μV).
Table 11.
Intergroup comparison of mean amplitudes of CNV expectation waves between the HC group and the tSAH group.
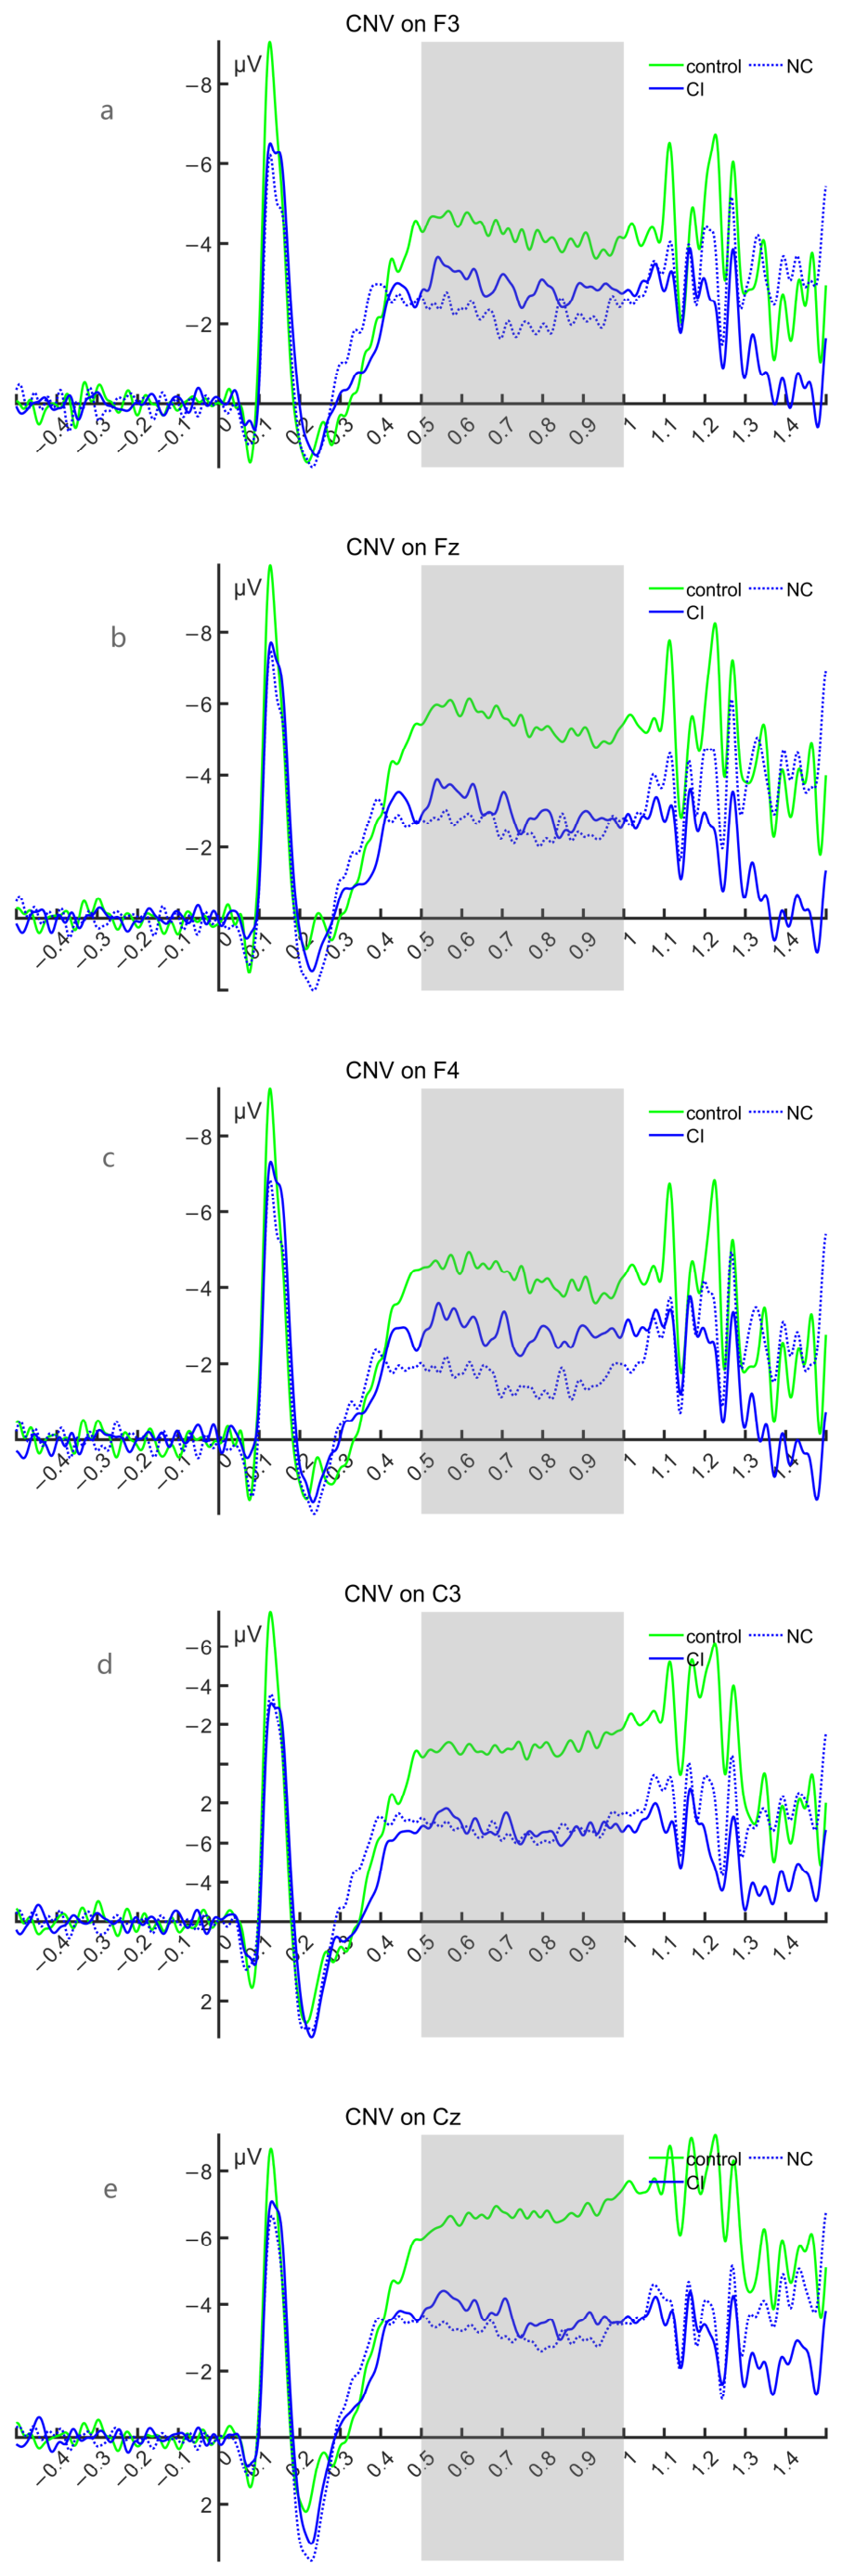
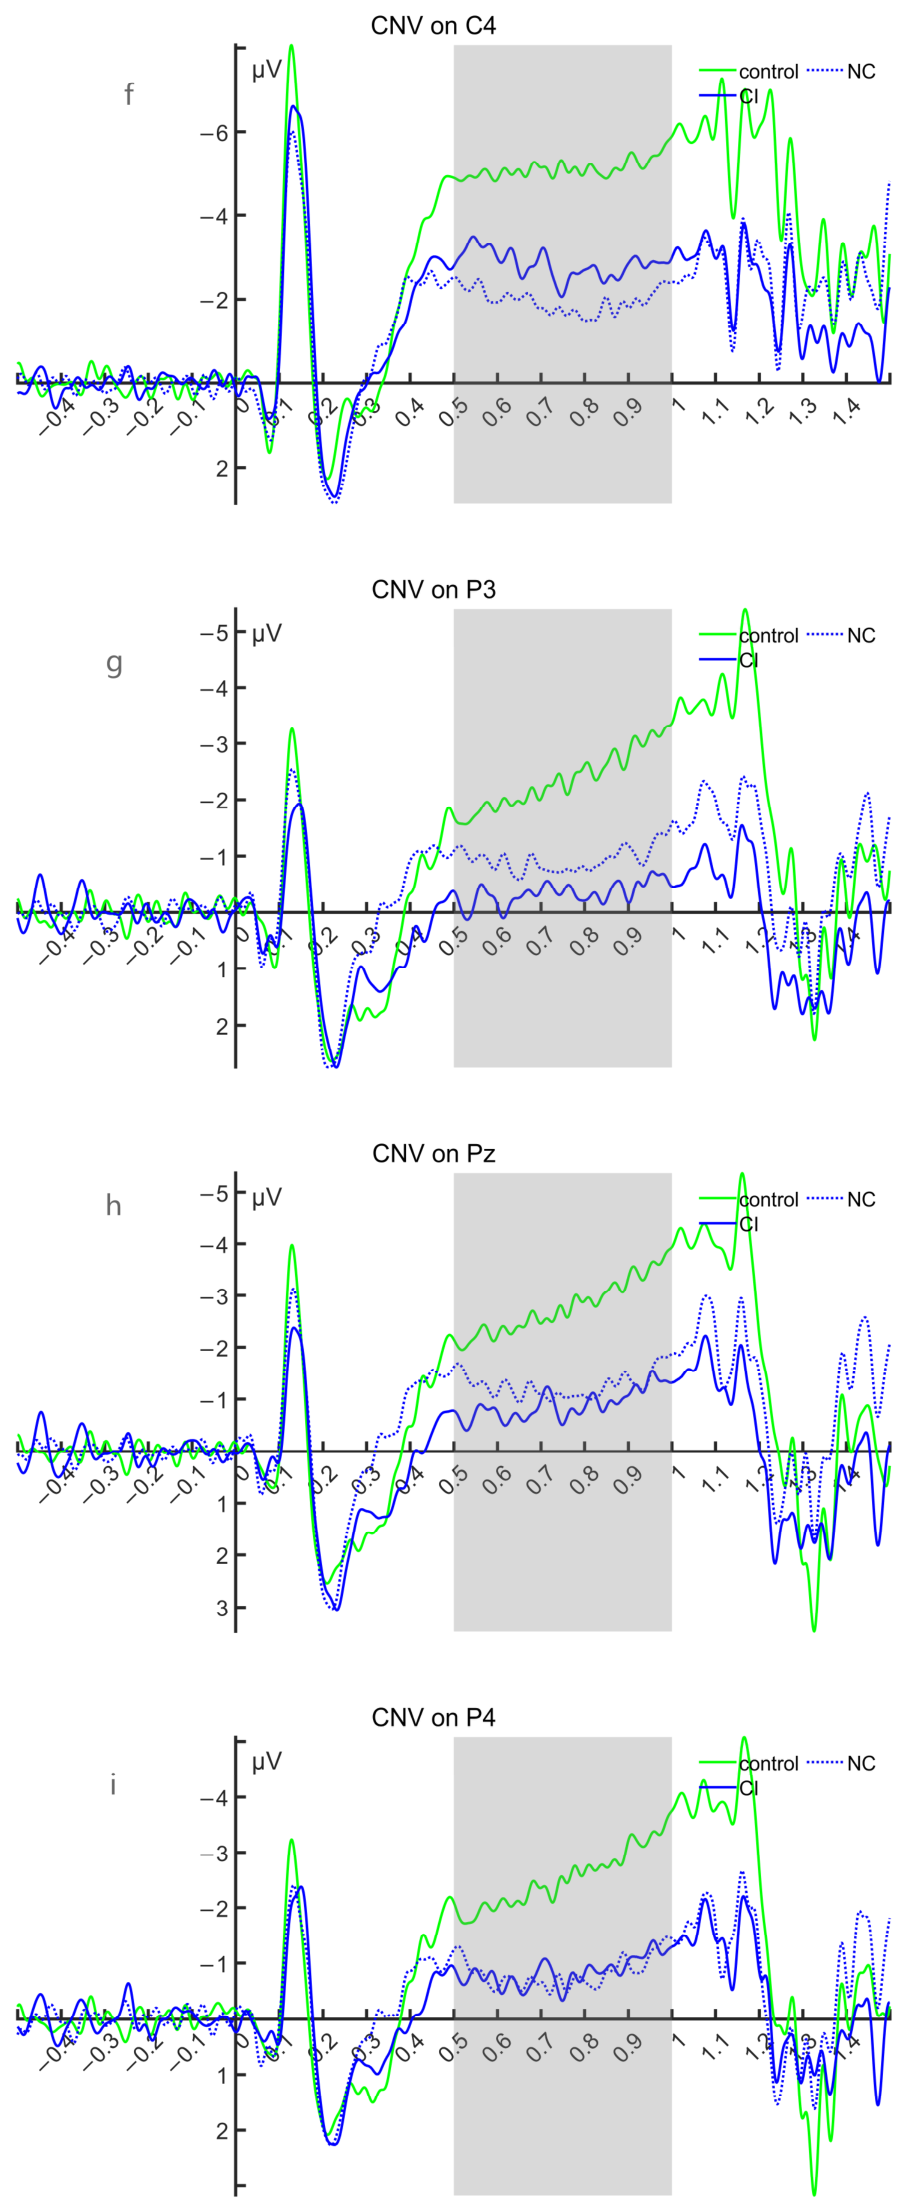
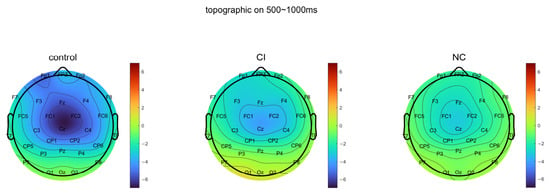
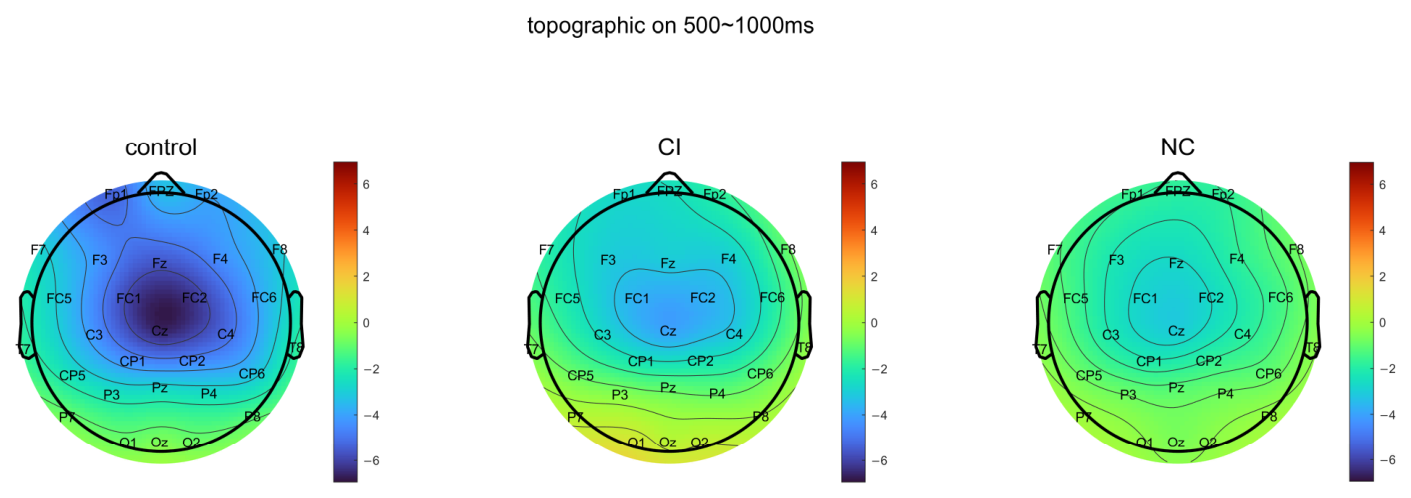
(2) There was no significant electrode difference in the mean amplitude of CNV among the groups. Figure 13 and Figure 14 show the waveform and topographic maps of CNV in the HC group, CI group, and NC group. Statistical results are detailed in Table 12.
Figure 13.
Waveform of CNV in the HC group, CI group, and NC group. (a–i) show the waveform diagrams of CNV at F3, Fz, F4, C3, Cz, C4, P3, Pz, and P4, respectively. The green waveform represents the HC group, the blue solid line waveform represents the CI group of tSAH, the blue dashed line waveform represents the NC group of tSAH, and the time window of the CNV component is 500 ms to 1000 ms, as indicated by the light gray area. In all waveforms, negative deflections are plotted upwards.
Figure 14.
The topographic maps of CNV for the HC group, the CI group of tSAH, and the NC group within the time window of 500–1000 ms. The colored bar represents voltage in microvolts (μV).
Table 12.
Intergroup comparison of mean amplitudes of CNV expectancy wave between the CI group and the NC group.
4. Discussion
4.1. Analysis of Behavioral Research Results
Cognitive dysfunction is one of the most common sequelae after tSAH, and it can involve multiple domains, including memory, attention, executive function, and information processing speed. In this study, under the condition that there were no differences in age, sex, or education level, the MMSE scores of the tSAH group were significantly lower than those of the normal control group. In addition, it is well known that cognitive function in normal adults gradually declines with increasing age [25,26]. In this study, further comparison between the normal control group and the tSAH group without cognitive dysfunction found that the latter was significantly younger than the former. When age was used as a covariate in analysis of covariance, the MMSE scores of the tSAH group without cognitive dysfunction were still significantly lower than those of the normal control group, indicating that their decline in cognitive function was not caused by age-related factors and may be closely related to tSAH. In summary, tSAH may be one of the relevant risk factors for post-traumatic cognitive dysfunction [3].
4.2. Analysis of ERP Research Results
This study conducted P300, MMN, and CNV event-related potential (ERP) assessments in patients with traumatic subarachnoid hemorrhage (tSAH) and healthy controls, respectively. Meanwhile, subgroup comparisons were performed within the tSAH patient group to analyze the association between ERP indicators and clinical cognitive status. Comparison between the normal control group and the tSAH group revealed that in the absence of differences in age, sex, and education level, the mean amplitudes of P300 and CNV in the tSAH group were significantly lower than those in the healthy control group, while no between-group difference was observed in the mean amplitude of MMN; there were no significant differences in the peak latencies of P300 and MMN between the two groups. Within the tSAH group, comparison between the subgroup with cognitive impairment and the subgroup without cognitive impairment revealed no between-group differences in sex, education level, Glasgow Coma Scale (GCS) score at the time of injury, and time since injury, but a statistically significant difference in age was present between the two groups, with the age of the group without cognitive impairment being younger than that of the group with cognitive impairment. After controlling for age-related variation using age as a covariate, no significant differences were observed in any ERP indicators. These results suggest that tSAH can cause selective cognitive electrophysiological impairment.
4.2.1. Analysis of Results in the HC Group and tSAH Group
As an endogenous component of ERP, P300’s amplitude reflects the amount of resources invested by the brain when receiving incoming stimulus information and the degree of attention to target stimuli, while latency assesses the speed of neural conduction when the brain responds to target stimuli, reflecting the speed of the brain’s classification, encoding, and recognition of external stimuli [27,28,29,30]. Previous similar studies [11] found that the amplitudes at Fz, Cz, CPz, and Pz in the subarachnoid hemorrhage group were significantly lower than those in the healthy control group, which is basically consistent with the results of this study. Under target stimulation, the mean P300 amplitude in the clinically stable phase of the tSAH group was lower than that of the normal control group at multiple electrodes including Cz, C3, C4, Pz, and P4, suggesting that tSAH patients have a decreased level of attention when receiving information.
MMN is generally considered to reflect pre-attentive automatic deviance detection that occurs without the involvement of active attention [31]. In this study, the paradigm used to record MMN included an active attention task, and the recorded waveform may have contained both the classic MMN and the N2b component. The classic auditory oddball paradigm uses pure tones or speech stimuli as standard and deviant stimuli and can reliably elicit the N2b component [32], and this component often overlaps with MMN in the time domain, making complete separation difficult. Therefore, in this study, no statistically significant difference was found in the mean amplitude of MMN between the two groups. On the one hand, this may be because the MMN waveform in this study was a composite component rather than a purely passive pre-attentive MMN, with a high degree of waveform variability. On the other hand, we observed that most electrodes in this between-group comparison showed medium to large effect sizes, but the differences were not significant, which may have been due to insufficient sample size. This result suggests that under the current task conditions, this composite electrophysiological response induced by stimulus deviance in patients with tSAH did not show obvious abnormalities overall. Future studies could use a pure passive auditory oddball paradigm to eliminate the superimposed interference of N2b and increase the sample size to separately assess the pure pre-attentive MMN.
This study found that unlike previous studies [11], no electrodes with intergroup differences were identified in the peak latency of P300, and no electrodes with differences were found in the peak latency of MMN either. In this study, the effect sizes observed for the peak latencies of the two ERPs were relatively small. Considering that the enrolled patients had milder craniocerebral injury and that the individual variability of P300 and MMN latencies is itself relatively large [33,34], it was difficult to detect small differences between groups.
Currently, research on the application of CNV in the assessment of cognitive function after tSAH remains very limited. The existing literature has mainly focused on the analysis of cognitive outcomes after aneurysmal subarachnoid hemorrhage (aSAH), while studies on CNV characteristics in the specific subgroup of tSAH are almost absent. This study employed the classic CNV paradigm of event-related potential (ERP) technology, focusing on extracting and analyzing the mean amplitude characteristics of clinically stable tSAH patients within the 500–1000 ms time window. Between-group comparisons revealed that within the 500–1000 ms time window, compared with normal controls, clinically stable tSAH patients exhibited a smaller negative degree of CNV mean amplitude, and the differences in CNV expectancy wave mean amplitude between the two groups in the vast majority of electrodes sites in the frontal, parietal, and central regions were statistically significant. After tSAH, cerebral vasospasm and microcirculatory disturbance caused by subarachnoid hemorrhage can lead to insufficient blood perfusion and metabolic abnormalities, thereby affecting the synchronized firing activity of neurons in these regions, resulting in neurological dysfunction and affecting the generation of late CNV components, manifested as decreased amplitude. Based on previous studies, from the perspective of injury mechanism, the reduced CNV amplitude may reflect dysfunction of the frontal subcortical circuits related to anticipation and preparation functions. In the CNV task, the generation of late components depends on the collaborative work of multiple functional networks, including the frontoparietal network, frontal-basal ganglia circuits, and thalamocortical circuits [35,36]. In addition, the parietal cortex is also crucial for spatial attention and sensorimotor integration [37,38,39], and its functional impairment can lead to abnormal CNV amplitude.
4.2.2. Analysis of Results in tSAH Groups with and Without Cognitive Impairment
In this study, patients in the tSAH group were divided into a cognitive impairment group and a subgroup without cognitive impairment based on the Mini-Mental State Examination (MMSE) scores. There was a significant difference in Mini-Mental State Examination (MMSE) scores between the two groups, but no between-group differences were observed in the analysis of all event-related potential (ERP) indicators between the subgroups, and the corresponding effect sizes were small, indicating that ERP electrophysiological changes are not completely consistent with cognitive impairment classified based on clinical scales. The reasons for this inconsistency can be analyzed from the following aspects. First, differences in measurement dimensions and sensitivity. MMSE is a behavioral scale that focuses on rough screening of the overall level of cognitive function. Its total score reflects the comprehensive performance of multiple cognitive domains, and its score is affected by various non-cognitive factors such as participant motivation, educational background, and testing environment, while ERP components correspond to different neuroelectrophysiological processes, and the two reflect different levels of cognitive processing [40]; second are insufficient sample size and statistical power. Both groups were tSAH patients, and the individual variability of ERP amplitude and latency was relatively large. The sample size of this study was relatively small, and even if real electrophysiological differences existed, they might not be detected due to insufficient test power. These factors may all dilute between-group differences, making them statistically non-significant. In summary, the presence of differences in MMSE scores between groups while there were no differences in ERP components may reflect the essential differences between the two assessment tools in measurement dimensions, sensitivity, statistical power, and neural mechanisms. As an overall cognitive tool, the positive results of MMSE suggest that the tSAH cognitive impairment group shows changes at the clinical level of cognitive function, while the negative results of ERP suggest that there were no significant differences between subgroups in the specific neuroelectrophysiological processes measured in this study.
5. Conclusions, Limitations, and Future Perspectives
5.1. Conclusions
In summary, this study employed three event-related potential (ERP) paradigms (P300, MMN, CNV), analyzed latency and mean amplitude indices, and combined them with Mini-Mental State Examination (MMSE) scores to investigate the neuroelectrophysiological characteristics of patients with tSAH. The study found that tSAH may be one of the risk factors associated with post-traumatic cognitive dysfunction, and the mean amplitudes of P300 and CNV within specific event windows may serve as potential electrophysiological indicators of cognitive frailty after tSAH. Furthermore, a dissociation phenomenon was observed between cognitive grouping based on the Mini-Mental State Examination (MMSE) and event-related potential (ERP) results, which may suggest that behavioral cognitive screening and electrophysiological testing do not fully overlap in the cognitive dimensions they reflect.
5.2. Limitations
Although this study achieved certain research findings, it still has some limitations. First, although all participants completed the three ERP tasks in the same order with rest periods between, because patients with brain injuries are more sensitive to fatigue than healthy controls, fatigue may be a potential confounding factor in the between-group differences detected above. Second, because MMN and CNV did not record the accuracy of button presses, the influence of effort or task engagement on amplitude differences cannot be ruled out. In addition, some poorly cooperative participants were excluded, and it is possible that participants with more severe injuries were excluded. At the same time, the cognitive dimensions assessed by the MMSE and ERP do not overlap, and the small sample size of the subgroups leading to insufficient statistical power may be potential factors explaining why no differences were detected among the tSAH subgroups. Meanwhile, this study used a cross-sectional design and provided data only from the clinically stable period (more than 6 months after injury), so it cannot clarify the differences in ERP amplitude reduction at different time points and traumatic subarachnoid hemorrhage (tSAH).
5.3. Future Perspectives
Future studies should expand the sample size, refine the design of event-related potential (ERP) tasks, conduct longitudinal follow-up, and integrate brain network and time–frequency analyses to elucidate the neuroanatomical basis and dynamic evolution of ERP abnormalities in patients with traumatic subarachnoid hemorrhage (tSAH), thereby identifying characteristic neuroelectrophysiological indicators capable of assessing cognitive dysfunction after isolated traumatic subarachnoid hemorrhage and establishing a comprehensive ERP assessment system to provide objective and scientific technical support for clinical diagnosis.
Supplementary Materials
The following supporting information can be downloaded at https://www.mdpi.com/article/10.3390/brainsci16111205/s1. Table S1: The number of valid ERP trials for P300, MMN and CNV waveforms across groups; Table S2: Between-group comparisons of the number of valid ERP trials; Table S3: Statistics of interpolated EEG channels of participants.
Author Contributions
Conceptualization, H.C., Y.Z. and L.T.; methodology, H.C., X.L. and R.Z.; investigation, H.C., X.L. and R.Z.; validation, H.C. and R.Z.; formal analysis, H.C. and R.Z.; data curation, H.C. and X.L.; writing—original draft preparation, H.C.; writing—review and editing, Y.Z. and L.T.; visualization, H.C. and X.L.; supervision, Y.Z. and L.T.; project administration, H.C., Y.Z. and L.T.; funding acquisition, H.C., Y.Z. and L.T. All authors have read and agreed to the published version of the manuscript.
Funding
This research was funded by the Major Project of Changzhou Municipal Health Commission (ZD202451) and the Shanghai Key Laboratory of Forensic Medicine and the Key Laboratory of Forensic Medicine of the Ministry of Justice (KF202516).
Institutional Review Board Statement
This study was conducted in accordance with the Declaration of Helsinki and was approved by the Ethics Committee of Changzhou De’an Hospital (CZDALL-2024-001).
Informed Consent Statement
Informed consent was obtained from all subjects involved in the study.
Data Availability Statement
The processed extracted ERP-related numerical values supporting the findings of this study are available from the corresponding author upon reasonable request. The original raw EEG waveform recordings cannot be shared publicly due to patient-related privacy and ethical constraints.
Acknowledgments
The authors acknowledge the use of artificial intelligence (AI) tools in the preparation of this manuscript. AI was applied for generating the schematic diagram of EEG acquisition (Figure 2A) as well as for language polishing and grammar revision. The conceptual design of the figure, all experimental data, data interpretation, and scientific conclusions were completed and verified by the authors. The authors take full responsibility for the final content of the manuscript.
Conflicts of Interest
The authors declare no conflicts of interest.
Abbreviations
The following abbreviations are used in this manuscript:
| tSAH | Traumatic subarachnoid hemorrhage |
| ERP | Event-related potential |
| P300 | P300 component of event-related potential |
| MMN | Mismatch negativity |
| CNV | Contingent negative variation |
| TBI | Traumatic brain injury |
| MMSE | Mini-Mental State Examination |
| HC | Healthy control |
| CI | Cognitive impairment |
| NC | Normal cognition |
References
- Griswold, D.P.; Fernandez, L.; Rubiano, A.M. Traumatic Subarachnoid Hemorrhage: A Scoping Review. J. Neurotrauma 2022, 39, 35–48. [Google Scholar] [CrossRef] [Scilit] [PubMed]
- Wong, G.K.; Ngai, K.; Wong, A.; Lam, S.W.; Mok, V.C.T.; Yeung, J.; Rainer, T.; Wong, R.; Poon, W.S. Long-term cognitive dysfunction in patients with traumatic subarachnoid hemorrhage: Prevalence and risk factors. Acta Neurochir. 2012, 154, 105–111; discussion 111. [Google Scholar] [CrossRef] [Scilit] [PubMed]
- Wang, X.; Hui, X.; Wang, X.; Huang, B.; Gan, X.; Liu, X.; Shen, Z.; Sun, Y.; Li, L. Utilization of clinical and radiological parameters to predict cognitive prognosis in patients with mild-to-moderate traumatic brain injury. Front. Neurosci. 2023, 17, 1222541. [Google Scholar] [CrossRef] [Scilit] [PubMed]
- Nawabi, N.L.A.; Kilgallon, J.L.; McNulty, J.J.; Stopa, B.M.; Gerstl, J.V.; Smith, T.R. Evaluating the Utility of Repeat Computed Tomography Scans in Patients with Isolated Mild Traumatic Subarachnoid Hemorrhage. World Neurosurg. 2024, 185, e640–e647. [Google Scholar] [CrossRef] [Scilit] [PubMed]
- Zabyhian, S.; Mousavi-Bayegi, S.J.; Baharvahdat, H.; Faridhosseini, F.; Sasannejad, P.; Salehi, M.; Boroumand, M.; Hatefipour, Z. Cognitive function, depression, and quality of life in patients with ruptured cerebral aneurysms. Iran. J. Neurol. 2018, 17, 117–122. [Google Scholar] [CrossRef] [Scilit]
- Idiazabal, M.A.; Palau, M.; Fernandez, E.; Fierro, G. Neurophysiological studies in neurodevelopmental disorders: Event related potentials. Medicina 2023, 83, 12–16. [Google Scholar] [PubMed]
- Begum, T.; Reza, F.; Ahmed, I.; Abdullah, J.M. Influence of education level on design-induced N170 and P300 components of event related potentials in the human brain. J. Integr. Neurosci. 2014, 13, 71–88. [Google Scholar] [CrossRef] [Scilit] [PubMed]
- Cassidy, S.M.; Robertson, I.H.; O’Connell, R.G. Retest reliability of event-related potentials: Evidence from a variety of paradigms. Psychophysiology 2012, 49, 659–664. [Google Scholar] [CrossRef] [Scilit] [PubMed]
- Dalbokova, D.; Gille, H.G.; Ullsperger, P. Amplitude variations in P300 component due to unpredictable stepwise change of stimulus probability. Int. J. Psychophysiol. 1990, 10, 33–38. [Google Scholar] [CrossRef] [Scilit] [PubMed]
- Spencer, K.M.; Polich, J. Poststimulus EEG spectral analysis and P300: Attention, task, and probability. Psychophysiology 1999, 36, 220–232. [Google Scholar] [CrossRef] [Scilit]
- Zhang, S.; Wang, S.; Li, H. P300 in Psychiatric Impairment Assessment during Psychiatric Disorders Caused by Traumatic Subarachnoid Hemorrhage. Chin. J. Forensic Sci. 2024, 6, 58–62. [Google Scholar]
- Schröger, E.; Roeber, U.; Coy, N. Markov chains as a proxy for the predictive memory representations underlying mismatch negativity. Front Hum. Neurosci. 2023, 17, 1249413. [Google Scholar] [CrossRef] [Scilit] [PubMed]
- Grundei, M.; von der Behrens, W.; Astikainen, P.; Wetzel, N.; Blankenburg, F. The Somatosensory Mismatch Negativity. Eur. J. Neurosci. 2025, 62, e70301. [Google Scholar] [CrossRef] [Scilit] [PubMed]
- Wang, C.; Wang, X.; Jing, X.; Yokoi, H.; Huang, W.; Zhu, M.; Chen, S.; Li, G. Towards high-accuracy classifying attention-deficit/hyperactivity disorders using CNN-LSTM model. J. Neural Eng. 2022, 19, 046018. [Google Scholar] [CrossRef] [Scilit] [PubMed]
- Ling, X.; Wang, S.; Zhang, S.; Li, W.; Zhang, Q.; Cai, W.; Li, H. Contingent negative variation as an evaluation indicator of neurocognitive disorder after traumatic brain injury. Front. Psychiatry 2023, 14, 1255608. [Google Scholar] [CrossRef] [Scilit] [PubMed]
- Nelson, L.D.; Simons, M.U.; Jain, S.; Sun, X.; Choi, K.; Temkin, N.; Diaz-Arrastia, R.; Gardner, R.; Taylor, S.; Manley, G.T.; et al. Role of Polygenic Risk Scores in Predicting Cognitive Functioning after Mild Traumatic Brain Injury: A TRACK-TBI Study. J. Neurotrauma 2026, 43, 1589–1597. [Google Scholar] [CrossRef] [Scilit] [PubMed]
- Greene, C.; Brennan, D.; Mirloo, S.; Connolly, R.; O’CAllaghan, J.; Reddy, A.; Henderson, J.; Porkoláb, G.; McGlinchey, A.; Hanley, N.; et al. Blood-brain barrier disruption, traumatic encephalopathy, and cognitive decline in retired athletes. Sci. Transl. Med. 2026, 18, adu6037. [Google Scholar] [CrossRef] [Scilit] [PubMed]
- Lim, T.E.; Fitzpatrick, E.; Sharma, S.; Norman-Nott, N.; Hesam-Shariati, N.; McAuley, J.H.; Cashin, A.G.; Gustin, S.M.; Quidé, Y. Brain correlates of psychological trauma in chronic pain: A systematic review. Neurosci. Biobehav. Rev. 2026, 183, 106576. [Google Scholar] [CrossRef] [Scilit] [PubMed]
- Thaploo, D.; Zelder, S.; Hummel, T. Olfactory Modulation of the Contingent Negative Variation to Auditory Stimuli. Neuroscience 2021, 470, 16–22. [Google Scholar] [CrossRef] [Scilit] [PubMed]
- Prillinger, K.; Radev, S.T.; Doganay, K.; Poustka, L.; Konicar, L. Impulsivity Moderates the Effect of Neurofeedback Training on the Contingent Negative Variation in Autism Spectrum Disorder. Front. Hum. Neurosci. 2022, 16, 838080. [Google Scholar] [CrossRef] [Scilit] [PubMed]
- Kirsch, F.; Kirschner, H.; Fischer, A.G.; Klein, T.A.; Ullsperger, M. Disentangling performance-monitoring signals encoded in feedback-related EEG dynamics. Neuroimage 2022, 257, 119322. [Google Scholar] [CrossRef] [Scilit] [PubMed]
- Paris, M.; Mahajan, Y.; Kim, J.; Meade, T. Emotional speech processing deficits in bipolar disorder: The role of mismatch negativity and P3a. J. Affect. Disord. 2018, 234, 261–269. [Google Scholar] [CrossRef] [Scilit] [PubMed]
- Beyraghi, Z.; Khanmohammadi, R.; Hadian, M.R. Reduction in preparatory brain activity preceding gait initiation in individuals with chronic ankle instability: A movement-related cortical potential study. Eur. J. Neurosci. 2024, 60, 5284–5299. [Google Scholar] [CrossRef] [Scilit] [PubMed]
- Shibasaki, M.; Nakata, H.; Ogoh, S. Differences in Movement Preparation under Hyperthermic Conditions: Self-Initiated Versus Externally Cued Movements. Med. Sci. Sports Exerc. 2025, 57, 2001–2008. [Google Scholar] [CrossRef] [Scilit] [PubMed]
- Pessoa, B.; Hayashide, L.S.; Dias, G.; Pontes, B.; Pinto, R.S.; Diniz, L.P. Senescent Astrocytes: A New Player in Brain Aging and Cognitive Decline. Brain Sci. 2026, 16, 76. [Google Scholar] [CrossRef] [Scilit] [PubMed]
- Zhang, Y.; Ma, R.; He, J.; Ran, L.; Yang, X.; Xi, Y.; Wu, Y. Adipose-Specific GHR Deletion Attenuates Brain Aging and Cognitive Decline in Aged Mice. Aging Cell 2026, 25, e70407. [Google Scholar] [CrossRef] [Scilit] [PubMed]
- Ren, H.; Zhou, S.; Liu, X.; Wang, Q.; Yang, G.; Feng, Y.; Wang, R. Event-related potentials in first-degree relatives of patients with schizophrenia and their correlation with neurocognitive function. Chin. Ment. Health J. 2023, 37, 227–232. [Google Scholar] [CrossRef]
- Li, D.; Liu, C.; Wang, M.; Xiao, L.; Zhang, G. Correlation analysis between violent behavior and event-related potential P300 in patients with schizophrenia. Chin. J. Behav. Med. Brain Sci. 2021, 30, 722–727. [Google Scholar] [CrossRef]
- Polich, J. Updating P300: An integrative theory of P3a and P3b. Clin. Neurophysiol. 2007, 118, 2128–2148. [Google Scholar] [CrossRef] [Scilit] [PubMed]
- Lepock, J.R.; Mizrahi, R.; Korostil, M.; Bagby, R.M.; Pang, E.W.; Kiang, M. Event related potentials in the clinical high-risk (CHR) state for psychosis: A systematic review. Clin. EEG Neuro-Sci. 2018, 49, 215–225. [Google Scholar] [CrossRef] [Scilit] [PubMed]
- Hilger, K.; Euler, M.J. Intelligence and Visual Mismatch Negativity: Is Pre-Attentive Visual Discrimination Related to General Cognitive Ability? J. Cogn. Neurosci. 2023, 35, 331–347. [Google Scholar] [CrossRef] [Scilit] [PubMed]
- Van Yper, L.N.; Dhooge, I.J.M.; Vermeire, K.; De Vel, E.F.J.; Beynon, A.J. The P300 auditory event-related potential as a method to assess the benefit of contralateral hearing aid use in bimodal listeners: A proof-of-concept. Int. J. Audiol. 2020, 59, 73–80. [Google Scholar] [CrossRef] [Scilit] [PubMed]
- Yun, D.H.; Sohn, M.K.; Choi, J.E.; Jee, S. Reliability of electroencephalogram indicator and event related potential in subacute stroke. Medicine 2022, 101, e31766. [Google Scholar] [CrossRef] [Scilit] [PubMed]
- Gupta, S.; Bhardwaj, A. Mismatch Negativity Responses to Different Auditory Attributes in Normally Developing Infants and Children. Cureus 2022, 14, e33163. [Google Scholar] [CrossRef] [Scilit] [PubMed]
- Davis, M.C.; Hill, A.T.; Fitzgerald, P.B.; Bailey, N.W.; Sullivan, C.; Stout, J.C.; Hoy, K.E. Medial prefrontal transcranial alternating current stimulation for apathy in Huntington’s disease. Prog. Neuropsychopharmacol. Biol. Psychiatry 2023, 126, 110776. [Google Scholar] [CrossRef] [Scilit] [PubMed]
- Aydin, M.; Carpenelli, A.L.; Lucia, S.; Di Russo, F. The Dominance of Anticipatory Prefrontal Activity in Uncued Sensory-Motor Tasks. Sensors 2022, 22, 6559. [Google Scholar] [CrossRef] [Scilit] [PubMed]
- Gilissen, S.R.J.; Farrow, K.; Bonin, V.; Arckens, L. Reconsidering the Border between the Visual and Posterior Parietal Cortex of Mice. Cereb. Cortex 2021, 31, 1675–1692. [Google Scholar] [CrossRef] [Scilit] [PubMed]
- Souza-Couto, D.; Bretas, R.; Aversi-Ferreira, T.A. Neuropsychology of the parietal lobe: Luria’s and contemporary conceptions. Front. Neurosci. 2023, 17, 1226226. [Google Scholar] [CrossRef] [Scilit] [PubMed]
- Oh, S.W.; Son, S.J.; Morris, J.A.; Choi, J.H.; Lee, C.; Rah, J.-C. Comprehensive Analysis of Long-Range Connectivity from and to the Posterior Parietal Cortex of the Mouse. Cereb. Cortex 2021, 31, 356–378. [Google Scholar] [CrossRef] [Scilit] [PubMed]
- Han, J.S.; Ryu, S.M.; Lim, Y.H.; Kim, A.-R.; Jung, T.-D. Is the Korean Mini-Mental State Examination (K-MMSE) Useful in Evaluating the Cognitive Function of Brain Injury Patients?: Through Correlation Analysis with Computerized Neurocognitive Test (CNT). Brain Neurorehabilit. 2024, 17, e13. [Google Scholar] [CrossRef] [Scilit] [PubMed]

Disclaimer/Publisher’s Note: The statements, opinions and data contained in all publications are solely those of the individual author(s) and contributor(s) and not of MDPI and/or the editor(s). MDPI and/or the editor(s) disclaim responsibility for any injury to people or property resulting from any ideas, methods, instructions or products referred to in the content. |
© 2026 by the authors. Licensee MDPI, Basel, Switzerland. This article is an open access article distributed under the terms and conditions of the Creative Commons Attribution (CC BY) license.