


Highlights
What are the main findings?
- A proposed seven-step framework integrates tumor–brain networks, patient priorities, and available resources in diffuse glioma surgical planning.
- A graph model separates tumor removal from functional cost, structural network disruption, and residual connectivity when comparing candidate resections.
- An exploratory edge classification and a spatial injury model distinguish eligibility for consideration from the effects of a complete resection plan.
What are the implications of the main findings?
- Explicit patient priorities and resource limitations may support shared decisions, including restricted surgical objectives or referral.
- Fibers of passage can be evaluated even when their endpoints lie outside the proposed resection. Partial bundle interruption changes the modeled capacity of the remaining network.
- Prospective studies should test whether these measures improve prediction of postoperative function beyond clinical, anatomical, and molecular information.
Abstract
Background/Objectives: Diffuse glioma surgery requires balancing tumor removal, brain function, and the patient’s priorities. We propose a patient-oriented, resource-adaptive framework and a testable hypothesis about postoperative functional recovery. Methods: A targeted narrative synthesis informed three domains: network characterization, patient priorities, and therapeutic decision. A graph model compares connected resections within clinically selected corridors. It separates modeled tumor-target volume, direct functional cost, structural disruption, and residual connectivity. Results: The framework relates the lesion and baseline function to activities valued by the patient, the consequences of losing them, and acceptable operative boundaries. An exploratory classification combines functional importance with radiological evidence of tract involvement. Indispensable connections remain protected. Trajectory intersections with the proposed resection or access corridor determine connection loss, including fibers of passage and partial bundle interruption. Maximum flow then audits the remaining structural capacity between protected pairs. A fully specified synthetic example shows how spatial injury, patient priorities, and connectivity requirements change the selected plan. We hypothesize that the resulting measures add prognostic information beyond conventional predictors. Topological compensation is a possible mechanism, and IDH status is an exploratory modifier. Conclusions: The framework provides a transparent way to document priorities and compare plans under uncertainty. Its classification, input estimates, and clinical predictions require validation. Services without the necessary individual network data can use the clinical framework to document uncertainty and adapt objectives or referrals.
1. Introduction
The fifth edition of the World Health Organization Classification of Tumours of the Central Nervous System (WHO CNS5) distinguishes adult diffuse gliomas by integrated molecular diagnosis [1]. These tumors share a surgical challenge: obtaining oncological benefit while preserving the functions needed for autonomy, quality of life, and subsequent treatment [2,3]. The clinical meaning of a given deficit also depends on the patient’s language, occupation, responsibilities, and personal goals.
Extent of resection and residual tumor volume are associated with outcomes, but their interpretation depends on diagnosis, location, baseline status, imaging, and surgical selection [3,4,5]. Maximum safe resection therefore requires an individualized assessment of the expected benefit of further removal and the consequences of functional injury. Outcomes should include cognition, seizures, daily activities, health-related quality of life, and the neurological examination [6].
Connectomics describes the brain as interacting networks [7,8,9,10,11,12]. This perspective helps explain why similar lesions can produce different deficits and why the effects of surgery may extend beyond the tissue removed. Its use in planning remains difficult because networks vary between patients and can be altered by the tumor. Population atlases provide useful anatomical hypotheses, while tractography, functional imaging, and intraoperative mapping provide different forms of individual information.
This article organizes these considerations into seven steps. The conceptual core is a glioma-related pathological subgraph embedded within the patient’s brain graph. Tumor-bearing tissue and affected connection segments are represented within the same system, without assuming that the tumor follows a single fascicle or that infiltrated tissue has lost its function. Connectomic surgical planning and maximum-flow models already have precedents [12,13]. Disconnectome methods also estimate effects beyond a focal lesion and relate them to behavior [14,15]. Our proposed contribution is an explicit comparison of candidate resections that combines patient priorities, spatial connection injury, anatomical restrictions, and resource-dependent uncertainty. Its added clinical value remains to be tested.
2. Synthesis Method and Scope
This Hypothesis article uses a targeted narrative synthesis. Sources were selected for their relevance to glioma classification and resection, network organization, tumor–brain interaction, functional mapping, patient outcomes, and graph optimization. The selection is purposive rather than exhaustive. During revision, directly relevant work on disconnection mapping, outcome measurement, and prediction-model reporting was incorporated to clarify the proposed contribution. We do not claim a systematic search or an estimate of pooled treatment effects.
The framework focuses on adult diffuse gliomas because infiltration intermingles tumor and functioning brain, complicating both the target of removal and the interpretation of network injury. Growth dynamics, molecular subtype, and ongoing treatment may also affect postoperative reorganization. Other tumors can disrupt networks and may benefit from a related framework, but applying the present assumptions to displaced rather than infiltrated tissue would require separate evaluation.
Four premises guide the proposal. Function arises from interacting, partly overlapping networks. Anatomical and population information must be interpreted in the individual patient. The consequences of a deficit must be discussed with that patient. Finally, available resources determine which uncertainties can be reduced. The clinical framework and the quantitative model are related but separately testable components. The exploratory classification introduced below is a planning hypothesis, not a calibrated estimate of neurological risk.
3. Anatomobiological Foundation
3.1. Networks and the Limits of Compensation
Brain graphs represent regions or tissue units as nodes and structural connections as edges. Their measures depend on the parcellation, imaging, and reconstruction method [7,8,9,10]. The meta-network account further emphasizes that cognition, conation, emotion, and behavior depend on interactions among systems [11,12]. A single connection may contribute to several tasks, and a task may require several complementary connections.
Direct electrical stimulation has identified cortical and subcortical components whose interruption affects specific functions [16,17]. Functional resectability maps show both variability and limits to compensation, including components with relatively low plastic potential [18,19,20]. Surviving pathways may provide a substrate for reorganization, but this depends on their functional roles and their structural presence. Plasticity involves processes that a static graph cannot directly represent [21,22].
3.2. Glioma–Brain Coupling and Molecular Context
Gliomas interact with neural circuits. Neuronal activity can promote proliferation through paracrine signaling and synaptic integration, while tumor cells form interconnected networks associated with invasion and resistance [23,24,25,26]. Tumors can also alter excitability, cognition, and circuit organization [27,28]. Mutant IDH1 and its metabolite D-2-hydroxyglutarate have been linked to seizure-related mechanisms [29]. These findings support considering the tumor and brain as a coupled system. A macroscopic tractography edge, however, does not directly represent a neuron–glioma synapse or a tumor microtube.
IDH status remains an exploratory effect modifier. A preoperative diffusion study of 20 patients, including 12 with IDH-mutant tumors, reported differences in normal-appearing white matter between molecular groups [30]. This offers an indirect rationale for investigating differences in network vulnerability. It does not establish postoperative compensation or a causal interaction with resection. Any future interaction analysis should account for integrated diagnosis, growth history, location, baseline function, and treatment. Studies of glioma connectivity further support investigation of effects beyond the visible lesion [31,32,33].
4. Seven Steps Across Three Domains
The framework is completed before surgery and updated when additional information changes the plan. Table 1 summarizes the outputs.
Table 1.
Outputs of the seven-step framework.
4.1. Domain I Network Characterization
Step 1. Lesion topography and exposed networks. Review the probable diagnosis, enhancing and nonenhancing components, edema, mass effect, vascular relationships, and possible corridors. Identify connections that traverse candidate tissue and connections ending within it. Specify the image-defined tumor target and the uncertainties that could change the approach.
Step 2. Baseline phenotype. Relate symptoms, examination, laterality, seizures, and cognitive performance to the anatomical hypotheses. Choose assessments relevant to the location and the patient’s activities. Disagreement between the clinical findings and an atlas is a reason to investigate uncertainty. It should not be resolved by assuming that the atlas is correct.
4.2. Domain II Patient Priorities
Step 3. Prioritized functions and activities. Ask which activities the patient considers essential, important but potentially adaptable, or of lower personal importance. Examples include communication, reading, work, caring for relatives, mobility, music, and social interaction. Use a structured interview with concrete deficit scenarios. Record the patient’s explanations and check understanding rather than assigning importance from social productivity. Decision-making capacity requires understanding, appreciation, reasoning, and communication [34]. Communication support or an appropriate representative may be needed when these abilities are impaired.
Step 4. Consequences of loss and adaptation. Discuss the likely severity, reversibility, timing, and practical consequences of each relevant deficit. Record rehabilitation options and available support. The patient, clinical team, and relevant functional specialists then relate these priorities to the networks that may be exposed. Repeat the discussion when new mapping information changes that interpretation. Agreement between assessors and stability of these judgments require prospective study.
4.3. Domain III Therapeutic Decision
Step 5. Benefit, cost and uncertainty. Compare expected cytoreduction with direct tissue injury, connection loss, and the patient’s priorities. Apply the exploratory edge classification only to connections potentially affected by the candidate plan. Keep its functional and radiological components visible. An eligible connection still requires evaluation within the whole plan. Unknown function or uncertain tract involvement should be recorded as uncertainty rather than assigned the least protective category.
Step 6. Corridor technique and boundaries. Identify clinically plausible access corridors, stopping points, and alternatives. Include connections exposed during access and during tumor removal. Select imaging, navigation, monitoring, and stimulation methods according to the information needed [12,16,17,35]. Intraoperative findings can require restriction of the planned resection or a different strategy.
Step 7. Shared decision and documentation. Explain objectives, alternatives, uncertainties, and plausible temporary or permanent deficits in language the patient can understand. Document the agreed priorities, the reasons for accepting or rejecting a borderline connection, and conditions that would change the plan. Biopsy, limited resection, treatment without cytoreduction, and referral remain clinical alternatives.
5. Formal Core and Computational Hypothesis
5.1. A Fixed Brain Graph with Spatially Mapped Connections
The structural graph represents the patient’s preoperative brain. A fixed parcellation defines spatially disjoint tissue units. A subset within a clinically selected corridor contains the units considered for removal. A separate anatomical graph records physical adjacency between those units. Structural connectivity and anatomical continuity serve different purposes: a long connection does not make two tissue units surgically contiguous.
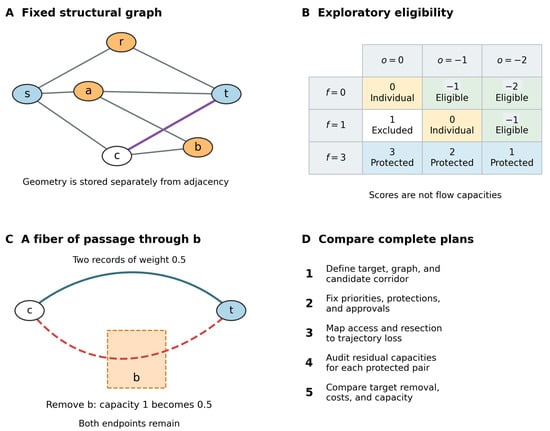
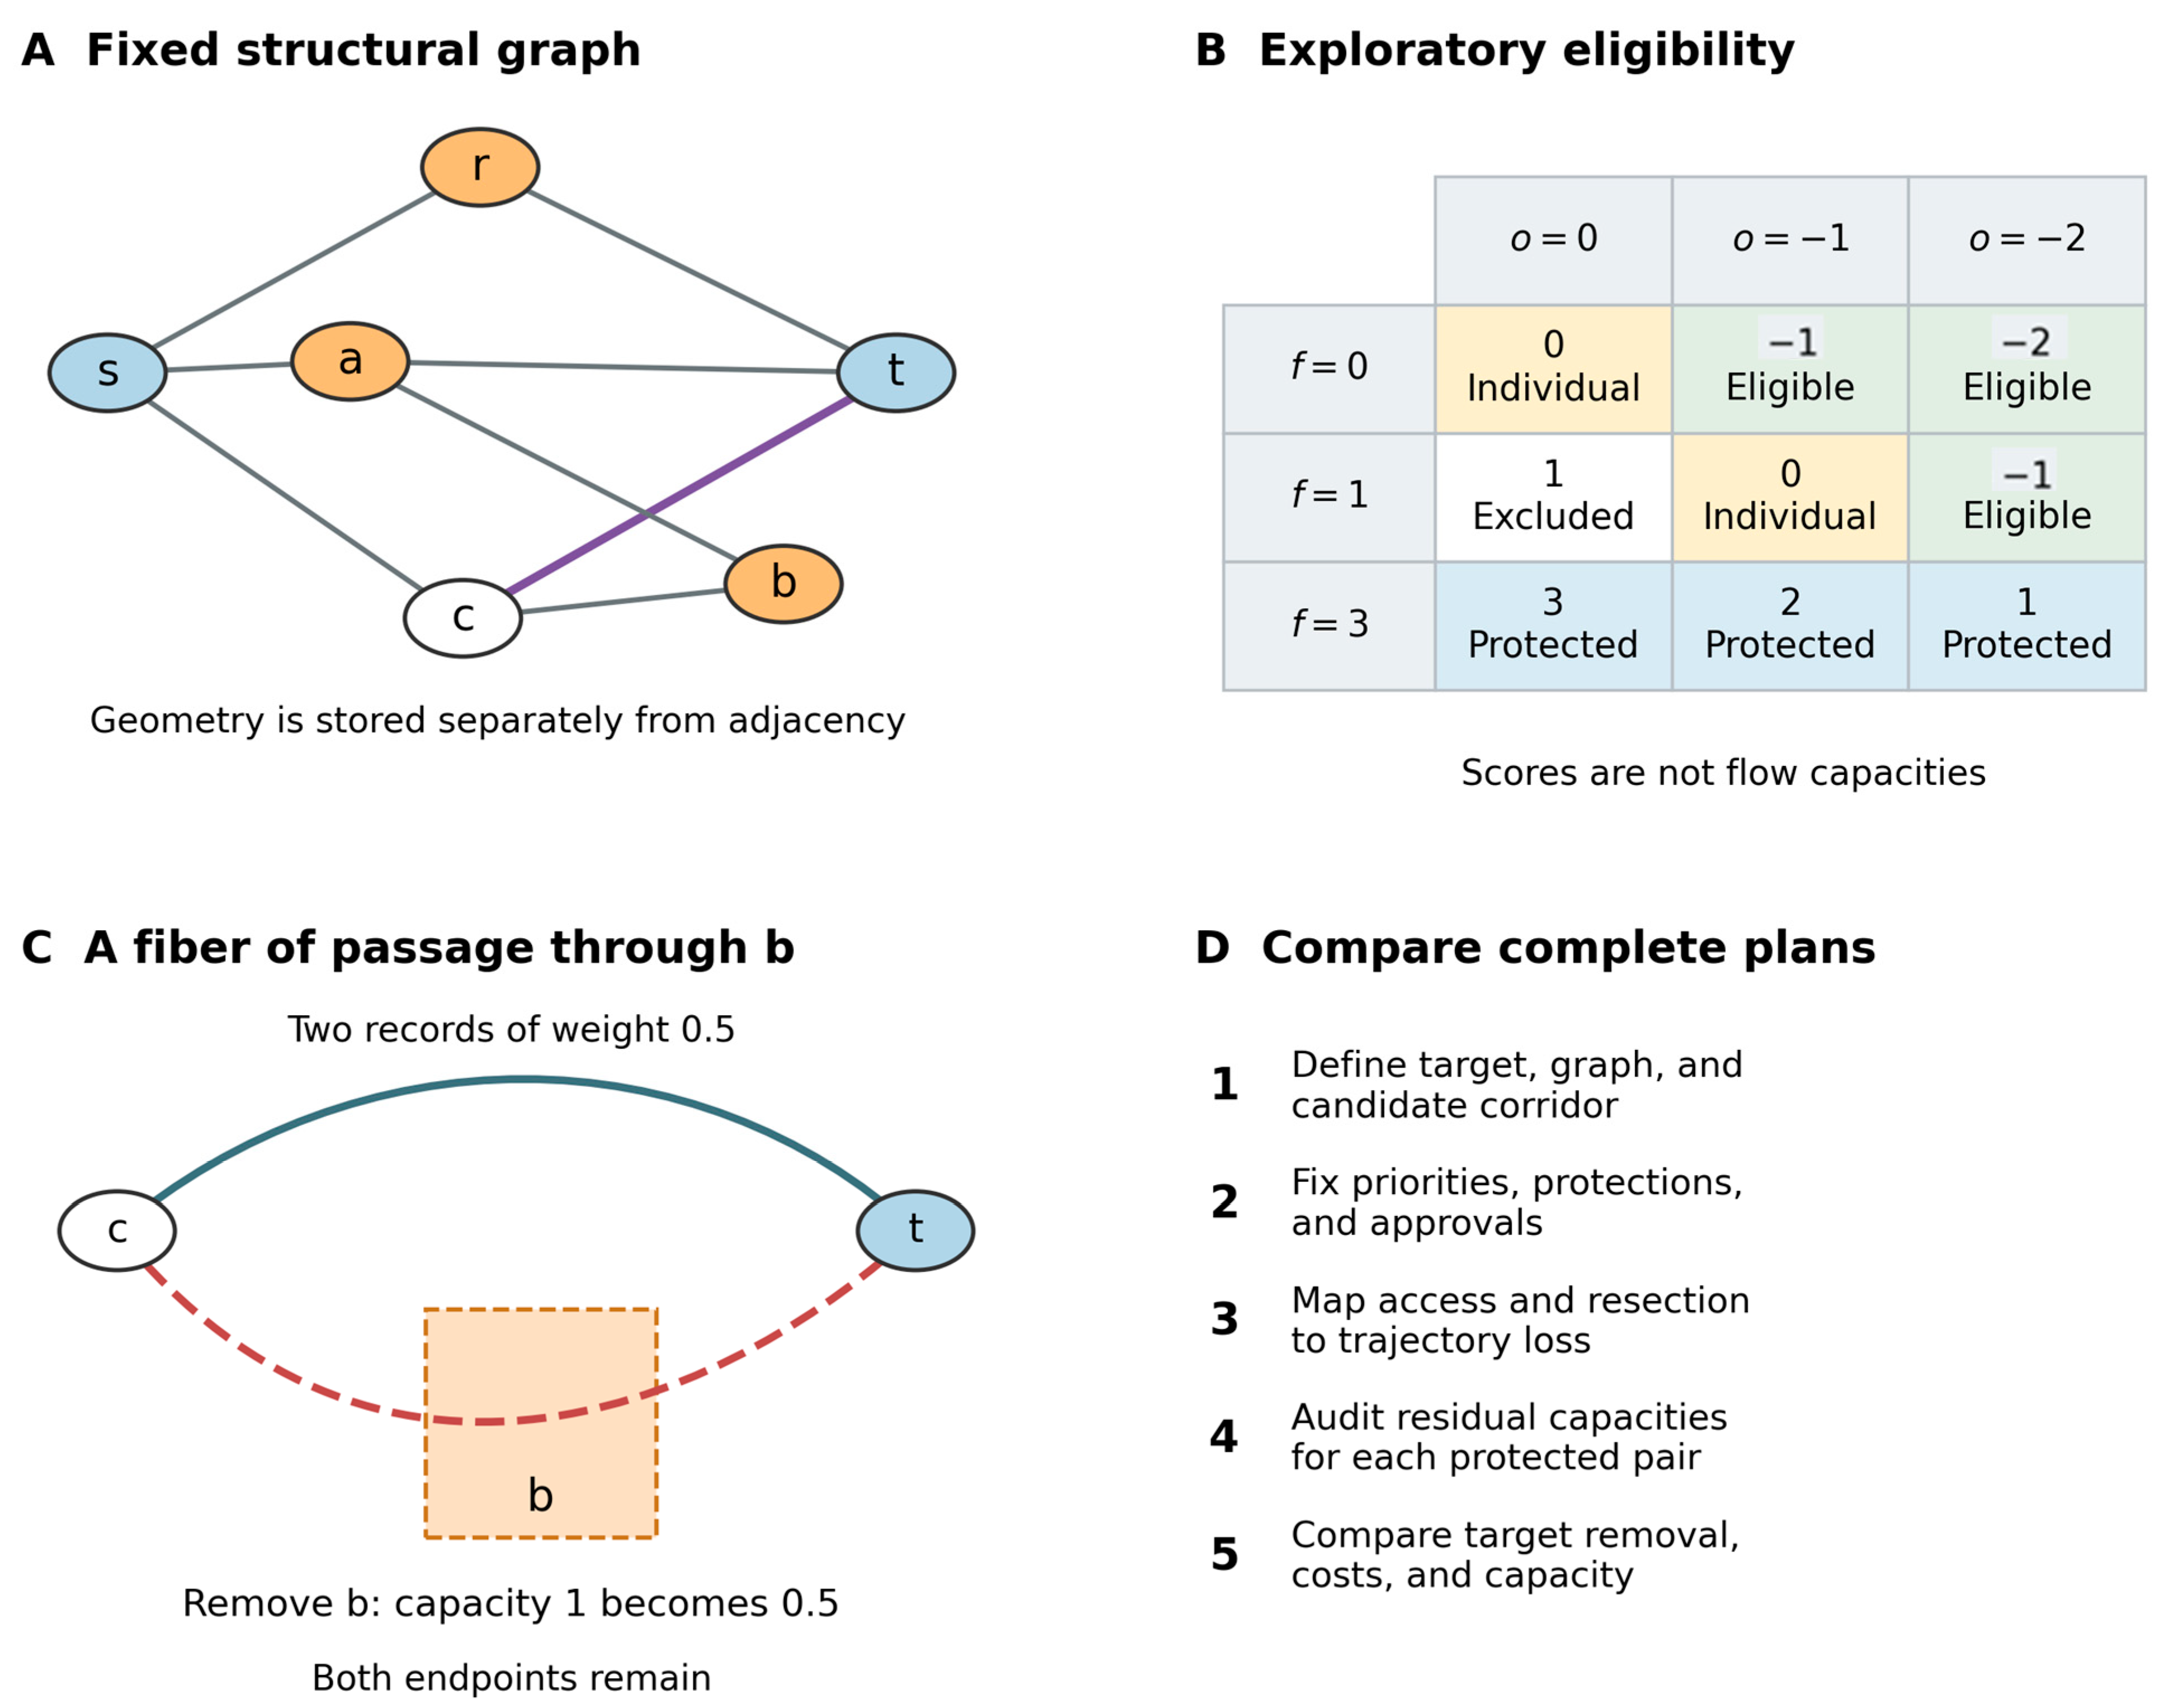
The glioma-related subgraph includes tumor-bearing units and potentially affected connections. Its boundary vertices can lie outside the image-defined lesion. An annotation applies to the stated segment or connection group, not automatically to an entire fascicle. Both internal connections and fibers passing through the candidate volume are assessed. Figure 1A shows the synthetic structural graph; Figure 1C illustrates the additional spatial information needed to model a fiber of passage.
Figure 1.
Spatial injury and comparison of candidate plans. (A) The fixed structural graph used in the synthetic example. Orange nodes r, a, and b are candidate units; blue nodes s and t are protected endpoints; the unfilled node c is retained outside the candidate set. The highlighted c–t connection has trajectory geometry specified separately. (B) The exploratory classification is a rule for considering connection interruption, not a capacity scale. (C) One of two equally weighted c–t trajectories intersects unit b. Removing b reduces c–t capacity from 1 to 0.5 while c and t remain. The spatial intersection creates no intermediate topological junction. (D) Spatial injury is applied before flow is audited and complete plans are compared. All values and geometry are illustrative.
Each structural edge has a set of trajectory records with nonnegative weights. Their intersections with candidate units are stored separately from the topological graph. A trajectory is lost when the declared access injury or at least one selected tissue unit interrupts it. Its weight is counted once even if several selected units intersect it. The edge’s residual capacity is the sum of its surviving trajectory weights. Removing only some records therefore produces a partial loss of aggregate capacity. A spatial crossing between two trajectories does not create a new connection between them.
The preservation coefficient is the weighted fraction of a connection’s preoperative capacity retained after a candidate plan. It ranges from 0 for complete interruption to 1 for no additional loss. Residual capacity equals preoperative capacity multiplied by this coefficient. It is calculated separately for each connection and candidate plan from the declared trajectory weights and spatial interruption map.
This construction also covers removal of an endpoint: every trajectory record includes any removable endpoint unit. It separates pre-existing network compromise, represented in the preoperative reconstruction, from additional injury caused by the proposed plan. A streamline weight is a modeling quantity, not an axon count or a measured fraction of physiological transmission.
The surgeon defines candidate tissue sets and corridors. A selected set may be displayed as a supernode, but the detailed graph is retained for computation. Unrestricted contraction can erase internal bottlenecks and inflate maximum flow. A computational reduction would require a separate demonstration that it preserves the relevant capacities and terminal cuts.
5.2. An Exploratory Classification of Affected Connections
Table 2 defines two annotations for connections whose interruption is under consideration. Functional importance is assigned in the context of the patient’s priorities and the available functional evidence. Radiological involvement describes the assessed connection segment or trajectory group. Both the evidence and its uncertainty are documented.
Table 2.
Proposed annotations for connections exposed by a candidate plan.
The sum defines the exploratory classification in Table 3. Scores of −2 or −1 identify connections eligible for consideration. A score of 0 requires a documented individual decision before a numerical run. Positive scores exclude interruption in that model instance. Functional importance 3 also imposes an explicit protection, independently of the summed score. This priority remains protected for every permitted radiological value.
Table 3.
Eligibility classification from the proposed sum.
These categories express an ordinal decision rule. They are not commensurate measurements of survival gain and neurological harm, and they are not used as flow capacities. In particular, a fully involved connection with functional importance 1 becomes eligible under the proposed rule. Whether that trade-off is acceptable is an assumption requiring content validation and empirical evaluation. Unresolved classification uncertainty requires further assessment or comparison of explicit scenarios; it does not default to approval.
For functionally mixed bundles, use distinct nonoverlapping trajectory groups when the data support that distinction. Otherwise, retain the most protective applicable functional classification. Multiple task labels must not duplicate a physical trajectory or create extra capacity. The negative radiological values do not establish that interruption itself produces an oncological benefit. Target removal is evaluated separately.
5.3. Tumor Target and Constraints on a Complete Plan
The objective is the modeled volume of the declared tumor target removed. Each candidate unit contributes its volume multiplied by its target fraction. A practical image-based definition is the proportion of the unit occupied by a specified segmentation mask. Such a definition measures radiological target volume rather than histological tumor-cell content. A calibrated probability model could instead provide an expected tumor fraction, but its source and validation would need to be reported.
The target must be stated for each instance: contrast-enhancing tissue, a defined nonenhancing FLAIR component, or a specified metabolic target when appropriate data are available. FLAIR abnormality can include processes other than tumor and should not be labeled uniformly as tumor. Enhancing and nonenhancing compartments should be reported separately when relevant to the integrated diagnosis [3,4,5]. Overlapping masks must be partitioned or combined as a union before volume is counted. Changing the mask or fraction estimates can change the preferred plan and should be tested in sensitivity analysis.
Within each clinically selected corridor, the revised model maximizes target removal subject to five conditions:
- Selected tissue units form a connected set anchored at the declared entry unit.
- Protected tissue is retained, and no trajectory belonging to an excluded or indispensable connection is interrupted. Borderline connections require prior documented approval.
- Direct tissue-related functional cost remains within a declared patient-conditioned budget.
- Weighted structural disruption remains within a separate budget. Partial connection loss is counted proportionally to the declared trajectory weights.
- Residual capacity meets the required threshold for every protected pair, together with additional anatomical restrictions.
The direct tissue cost, structural penalty, and capacity have distinct definitions. Ordinal functional categories guide protections and elicitation; their numbers are not automatically added to those costs. Biopsy, no resection, and other corridors are assessed as separate alternatives. Supplementary Material S1 specifies the spatial loss operator, the linear constraints, and the internal correctness argument.
5.4. What Maximum Flow Contributes
After spatial injury has updated the capacities, maximum flow measures the remaining routing capacity between a declared pair. It equals the minimum capacity of a cut separating that pair [36,37]. When all surviving edges have unit capacity, it also counts the maximum number of edge-disjoint paths [38]. With fractional or otherwise weighted capacities, it remains a capacity measure rather than a path count.
The biological rationale is that surviving, partly redundant structural routes may provide a substrate for maintaining or reorganizing function. Maximum flow captures a particular aspect of that reserve: vulnerability to a separating bottleneck. It does not establish that any indirect path can perform the computation of a lost association bundle. Path length, intermediate regions, task roles, and the timing of adaptation can matter. These considerations motivate task-relevant protected pairs, comparison with alternative network measures, and longitudinal outcome testing.
Reading illustrates the distinction. Visual, lexical, and semantic operations can each contribute to understanding a sentence. Losing a component may reduce overall performance, but additional capacity in another component is not necessarily an equivalent substitute. The model can impose separate requirements for clinically specified components; it does not assume that every higher-order function corresponds to one edge.
Ford–Fulkerson, Edmonds–Karp, and Dinic are established methods for the flow calculation [36,37,39,40]. Dinic is a suitable implementation option, with Edmonds–Karp useful as an independent numerical comparison. Their choice does not change the mathematical optimum for the same capacities and terminals. The resection-selection problem still requires enumeration or a constrained optimization method. Each protected pair is audited independently; competition among simultaneous tasks would require a different shared-capacity formulation.
5.5. Comparing Plans and Checking the Example
The model compares target removal, direct functional cost, structural disruption, and the residual capacity of each protected pair. Varying the declared budgets and thresholds follows the epsilon-constraint approach [41]. A plan is dominated if another removes at least as much target, has no greater cost or disruption, preserves at least as much capacity for every pair, and improves at least one measure. Complete enumeration requires all attainable constraint levels and tied optima; otherwise, the output is a sample of nondominated plans. Figure 1D summarizes this sequence.
The six-node example now includes a connection whose endpoints are retained, but one of its two equally weighted trajectories passes through candidate unit b. Removing b halves that connection’s capacity. At the same cost budgets, thresholds of 1, 1.5, and 2 select different resections with modeled target volumes of 5, 4, and 1. Withholding approval for the borderline connection changes feasibility. Reclassifying it as indispensable blocks the same injury regardless of radiological involvement.
Supplementary Material S1 provides every input and calculation. The example was checked by exact rational enumeration, augmenting-path flow, exhaustive cuts, two SciPy flow implementations, and a mixed-integer solver. A shortest-hop comparison illustrates that different network measures can distinguish different plans. These checks establish the behavior of the stated synthetic model. They do not establish tractability at realistic scale or predictive performance in patients.
6. Uncertainty and Falsifiable Prediction
The primary computational hypothesis is that estimated structural disruption and residual connectivity improve prediction of postoperative function beyond conventional clinical, anatomical, and molecular variables. Subsequent reorganization supported by surviving routes is one possible mechanism. Prediction alone would not demonstrate that mechanism.
Assess alternative segmentations, target fractions, tract reconstructions, functional classifications, borderline approvals, and capacity weights as explicit scenarios. A plan is feasible across a tested scenario set only if it meets every protection and limit in each scenario. Otherwise, report how often it is feasible and how its measures vary. Keep the detailed representation fixed when comparing plans so that a change in parcellation or contraction does not masquerade as a treatment effect.
The hypothesis would be weakened by failure to improve prediction in held-out or external data, poor calibration, or instability across plausible reconstructions. Content validation must also test whether the eligibility rule expresses patient priorities consistently, especially the proposed trade-off for a relevant but fully involved connection. Failure of the quantitative hypothesis would leave the separate communication value of the seven-step framework open to evaluation.
7. Resource Adaptation
Access to imaging, mapping, equipment, and trained teams is unequal [42]. The framework relates each resource to the uncertainty it can reduce (Table 4). The clinical process can be used at every tier. The individual numerical model requires an adequately specified structural graph, spatial connection trajectories, and the other declared inputs, usually including diffusion imaging and reconstruction expertise.
Table 4.
Resources and their contribution to the framework.
At the essential tier, the output may be a documented choice to limit the objective, change the approach, or refer the patient. A population template can support research simulations and probabilistic exposure estimates. It cannot be treated as an equivalent measurement of that patient’s organization. If individual information is unavailable, it could change the operative boundary; numerical illustration should not be used to conceal the uncertainty. Resources also include rehabilitation, institutional support, and access to subsequent therapy.
8. Discussion
8.1. Validation Agenda
The clinical framework first requires content validation with patients, neurosurgeons, neuro-oncologists, neuroradiologists, neuropsychologists, and rehabilitation specialists. Standardized vignettes should test completeness, inter-rater agreement, the stability of functional categories, and the reasons for approving borderline connections. A prospective feasibility phase should measure completion time, documentation quality, acceptability, and changes in decisions.
The quantitative component requires a separate observational study. Graph predictions should initially be recorded without using them to expand the clinically selected resection. Preserve preoperative inputs and early postoperative imaging so that predicted and realized injuries can be compared. Table 5 proposes an operational starting point for prospective testing; it is a study design proposal, not a reported clinical result.
Table 5.
Proposed prospective assessment of the computational hypothesis.
The prediction time needs particular care. A strictly preoperative forecast uses the proposed plan and baseline information. A postoperative recovery forecast may use the realized resection and discharge deficit but must be reported as a different model. Death, progression, treatment changes, and missing follow-up should be handled explicitly rather than assigning favorable functional scores to unavailable assessments. Reporting should follow TRIPOD + AI guidance for prediction models, including regression-based models [44].
Longitudinal connectivity and task measurements would be needed to investigate compensation as a mechanism. IDH interactions should remain exploratory and be examined within biologically coherent diagnostic groups. A real-connectome simulation with documented segmentation, reconstruction, runtime, and optimization gap is also needed to assess practical scale before a clinical implementation is proposed.
8.2. Relation to Existing Approaches and Limitations
The framework builds on network-based accounts of glioma surgery and existing maximum-flow models [11,12,13]. BCBtoolkit provides methods to assess direct and remote effects of lesions [14]. Salvalaggio and colleagues used multivariate models to relate lesion and disconnection patterns to post-stroke deficits; structural disconnection predicted behavior at a level comparable to lesion information [15]. These results provide a relevant methodological precedent. They do not validate the present glioma resection model or demonstrate that residual maximum flow predicts recovery.
The proposed extension asks which connected tissue set best meets several declared objectives and restrictions before it is removed. Its clinical component also documents how personal priorities and missing resources affect that comparison. Whether this explicit organization improves planning, communication, or outcomes is an empirical question. The current formulation offers a way to test those claims rather than evidence that the claims are already true.
The main limitations concern input validity and the correspondence between structure and function. Radiological tract involvement does not establish histological infiltration or loss of function. Trajectory weights do not directly measure physiological capacity. The ordinal classification and its cutoffs lack consensus, reliability estimates, and clinical calibration. A static undirected graph omits directed, dynamic, and task-dependent interactions. Additive costs can miss joint vulnerabilities, and independent pairwise audits do not model simultaneous competition for capacity.
The synthetic example has complete inputs and verified arithmetic, but it is small and uncalibrated. No patient cohort, realistic connectome benchmark, or clinical benefit is reported. Neither the mathematical proof nor agreement between algorithms validates a resection boundary. The next stages must evaluate content, reproducibility, computation at realistic scale, prediction, and clinical utility separately.
9. Conclusions
Diffuse glioma planning can be formulated as a constrained comparison of tumor removal, network injury, and patient priorities. The seven-step framework preserves the coupled tumor–brain system as its conceptual core. The revised mathematical model links candidate tissue removal to trajectory interruption, including fibers of passage and partial bundle loss, before auditing residual connectivity. The proposed eligibility rule and prognostic hypothesis require prospective evaluation. Resource adaptation makes uncertainty and its consequences for the plan explicit.
Supplementary Materials
The following supporting information can be downloaded at: https://www.mdpi.com/article/10.3390/brainsci16111188/s1. Supplementary Material S1 contains the mathematical formulation, eligibility rule, spatial injury constraints, correctness argument, and synthetic examples. Supplementary Material S2 reports an atlas-based feasibility analysis for a hypothetical posterior fusiform glioma, including spatial interruption, partial preservation, residual capacity, and sensitivity checks. Accompanying code and reproducibility packages support both analyses. Table S1. Symbols used in the formulation. Table S2. Complete structural edge list and edge inputs. Table S3. Complete candidate-unit inputs for baseline priorities P0. Table S4. All connected selections containing r, with baseline priorities P0, Fmax = 3, and Dmax = 5. Table S5. Lost edges counted once for each selection. Table S6. Effect of the explicitly changed priorities P1. References [36,37,38,41,45,46,47,48,49,50,51,52,53,54] are cited in the Supplementary Materials.
Author Contributions
Conceptualization, G.M.C.; writing—original draft, G.M.C., Á.H.G.T., and T.K.d.S.; writing—review and editing, G.M.C., Á.H.G.T., and T.K.d.S. All authors have read and agreed to the published version of the manuscript.
Funding
This research received no external funding.
Institutional Review Board Statement
Not applicable. This theoretical work reports no research involving human participants or animals.
Informed Consent Statement
Not applicable.
Data Availability Statement
No original clinical dataset was generated or analyzed. Synthetic inputs are specified in Supplementary Material S1, with accompanying code to reproduce its calculations. Public atlas sources, selection and preprocessing, scenario inputs, and attribution are documented in Supplementary Material S2. The S2 reproducibility package contains analysis code, cached contact inputs, all candidate results, source checksums, and instructions for rebuilding the atlas analysis.
Acknowledgments
We thank Alícia Muniz Costa for her teachings and for being a source of inspiration in our lives. ChatGPT (OpenAI) and Claude (Anthropic) were used for editorial assistance during preparation. ChatGPT also assisted with the revised mathematical formalization, diagram, programming, and internal checks of the synthetic examples. The framework, seven-step structure, central hypothesis, and proposed classification originated with the lead author. No patient data were generated or analyzed by these tools. The authors are responsible for the content and its verification before submission.
Conflicts of Interest
The authors declare no conflicts of interest.
Abbreviations
| CNS | Central nervous system |
| FLAIR | Fluid-attenuated inversion recovery |
| fMRI | Functional magnetic resonance imaging |
| IDH | Isocitrate dehydrogenase |
| MRI | Magnetic resonance imaging |
| NANO | Neurologic Assessment in Neuro-Oncology |
| WHO CNS5 | Fifth edition of the WHO Classification of Tumours of the Central Nervous System |
References
- Louis, D.N.; Perry, A.; Wesseling, P.; Brat, D.J.; Cree, I.A.; Figarella-Branger, D.; Hawkins, C.; Ng, H.K.; Pfister, S.M.; Reifenberger, G.; et al. The 2021 WHO classification of tumors of the central nervous system: A summary. Neuro Oncol. 2021, 23, 1231–1251. [Google Scholar] [CrossRef] [Scilit] [PubMed]
- Weller, M.; van den Bent, M.; Preusser, M.; Le Rhun, E.; Tonn, J.C.; Minniti, G.; Bendszus, M.; Balana, C.; Chinot, O.; Dirven, L.; et al. EANO guidelines on the diagnosis and treatment of diffuse gliomas of adulthood. Nat. Rev. Clin. Oncol. 2021, 18, 170–186. [Google Scholar] [CrossRef] [Scilit] [PubMed]
- Goldbrunner, R.; Foroglou, N.; Signorelli, F.; Schucht, P.; Jakola, A.S.; Minniti, G.; Rola, R.; Renovanz, M.; Preusser, M.; Furtner, J.; et al. EANS-EANO guidelines on the extent of resection in gliomas. Neuro Oncol. 2026, 28, 38–54. [Google Scholar] [CrossRef] [Scilit] [PubMed]
- Karschnia, P.; Vogelbaum, M.A.; van den Bent, M.; Cahill, D.P.; Bello, L.; Narita, Y.; Berger, M.S.; Weller, M.; Tonn, J.-C. Evidence-based recommendations on categories for extent of resection in diffuse glioma. Eur. J. Cancer 2021, 149, 23–33. [Google Scholar] [CrossRef] [Scilit] [PubMed]
- Karschnia, P.; Young, J.S.; Dono, A.; Häni, L.; Sciortino, T.; Bruno, F.; Juenger, S.T.; Teske, N.; Morshed, R.A.; Haddad, A.F.; et al. Prognostic validation of a new classification system for extent of resection in glioblastoma: A report of the RANO resect group. Neuro Oncol. 2023, 25, 940–954. [Google Scholar] [CrossRef] [Scilit] [PubMed]
- De Witt Hamer, P.C.; Klein, M.; Hervey-Jumper, S.L.; Wefel, J.S.; Berger, M.S. Functional outcomes and health-related quality of life following glioma surgery. Neurosurgery 2021, 88, 720–732. [Google Scholar] [CrossRef] [Scilit] [PubMed]
- Sporns, O.; Tononi, G.; Kötter, R. The human connectome: A structural description of the human brain. PLoS Comput. Biol. 2005, 1, e42. [Google Scholar] [CrossRef] [Scilit] [PubMed]
- Hagmann, P.; Cammoun, L.; Gigandet, X.; Gerhard, S.; Grant, P.E.; Wedeen, V.; Meuli, R.; Thiran, J.-P.; Honey, C.J.; Sporns, O. MR connectomics: Principles and challenges. J. Neurosci. Methods 2010, 194, 34–45. [Google Scholar] [CrossRef] [Scilit] [PubMed]
- Bullmore, E.; Sporns, O. Complex brain networks: Graph theoretical analysis of structural and functional systems. Nat. Rev. Neurosci. 2009, 10, 186–198. [Google Scholar] [CrossRef] [Scilit] [PubMed]
- Fornito, A.; Bullmore, E.T. Connectomics: A new paradigm for understanding brain disease. Eur. Neuropsychopharmacol. 2015, 25, 733–748. [Google Scholar] [CrossRef] [Scilit] [PubMed]
- Herbet, G.; Duffau, H. Revisiting the functional anatomy of the human brain: Toward a meta-networking theory of cerebral functions. Physiol. Rev. 2020, 100, 1181–1228. [Google Scholar] [CrossRef] [Scilit] [PubMed]
- Duffau, H. Brain connectomics applied to oncological neuroscience: From a traditional surgical strategy focusing on glioma topography to a meta-network approach. Acta Neurochir. 2021, 163, 905–917. [Google Scholar] [CrossRef] [Scilit] [PubMed]
- Lyoo, Y.; Kim, J.E.; Yoon, S. Modelling information flow along the human connectome using maximum flow. Med. Hypotheses 2018, 110, 155–160. [Google Scholar] [CrossRef] [Scilit] [PubMed]
- Foulon, C.; Cerliani, L.; Kinkingnéhun, S.; Levy, R.; Rosso, C.; Urbanski, M.; Volle, E.; De Schotten, M.T. Advanced lesion symptom mapping analyses and implementation as BCBtoolkit. GigaScience 2018, 7, giy004. [Google Scholar] [CrossRef] [Scilit] [PubMed]
- Salvalaggio, A.; De Filippo De Grazia, M.; Zorzi, M.; Thiebaut de Schotten, M.; Corbetta, M. Post-stroke deficit prediction from lesion and indirect structural and functional disconnection. Brain 2020, 143, 2173–2188. [Google Scholar] [CrossRef] [Scilit] [PubMed]
- De Benedictis, A.; Duffau, H. Brain hodotopy: From esoteric concept to practical surgical applications. Neurosurgery 2011, 68, 1703–1723. [Google Scholar] [CrossRef] [Scilit] [PubMed]
- Duffau, H. Stimulation mapping of white matter tracts to study brain functional connectivity. Nat. Rev. Neurol. 2015, 11, 255–265. [Google Scholar] [CrossRef] [Scilit] [PubMed]
- Ius, T.; Angelini, E.; Thiebaut de Schotten, M.; Mandonnet, E.; Duffau, H. Evidence for potentials and limitations of brain plasticity using an atlas of functional resectability of WHO grade II gliomas: Towards a “minimal common brain”. Neuroimage 2011, 56, 992–1000. [Google Scholar] [CrossRef] [Scilit] [PubMed]
- Satterthwaite, T.D.; Davatzikos, C. Towards an individualized delineation of functional neuroanatomy. Neuron 2015, 87, 471–473. [Google Scholar] [CrossRef] [Scilit] [PubMed]
- Pouratian, N.; Bookheimer, S.Y. The reliability of neuroanatomy as a predictor of eloquence: A review. Neurosurg. Focus 2010, 28, E3. [Google Scholar] [CrossRef] [Scilit] [PubMed]
- Kelly, C.; Castellanos, F.X. Strengthening connections: Functional connectivity and brain plasticity. Neuropsychol. Rev. 2014, 24, 63–76. [Google Scholar] [CrossRef] [Scilit] [PubMed]
- Stampanoni Bassi, M.; Iezzi, E.; Gilio, L.; Centonze, D.; Buttari, F. Synaptic plasticity shapes brain connectivity: Implications for network topology. Int. J. Mol. Sci. 2019, 20, 6193. [Google Scholar] [CrossRef] [Scilit] [PubMed]
- Venkatesh, H.S.; Johung, T.B.; Caretti, V.; Noll, A.; Tang, Y.; Nagaraja, S.; Gibson, E.M.; Mount, C.W.; Polepalli, J.; Mitra, S.S.; et al. Neuronal activity promotes glioma growth through neuroligin-3 secretion. Cell 2015, 161, 803–816. [Google Scholar] [CrossRef] [Scilit] [PubMed]
- Venkatesh, H.S.; Morishita, W.; Geraghty, A.C.; Silverbush, D.; Gillespie, S.M.; Arzt, M.; Tam, L.T.; Espenel, C.; Ponnuswami, A.; Ni, L.; et al. Electrical and synaptic integration of glioma into neural circuits. Nature 2019, 573, 539–545. [Google Scholar] [CrossRef] [Scilit] [PubMed]
- Venkataramani, V.; Tanev, D.I.; Strahle, C.; Studier-Fischer, A.; Fankhauser, L.; Kessler, T.; Körber, C.; Kardorff, M.; Ratliff, M.; Xie, R.; et al. Glutamatergic synaptic input to glioma cells drives brain tumour progression. Nature 2019, 573, 532–538. [Google Scholar] [CrossRef] [Scilit] [PubMed]
- Osswald, M.; Jung, E.; Sahm, F.; Solecki, G.; Venkataramani, V.; Blaes, J.; Weil, S.; Horstmann, H.; Wiestler, B.; Syed, M.; et al. Brain tumour cells interconnect to a functional and resistant network. Nature 2015, 528, 93–98. [Google Scholar] [CrossRef] [Scilit] [PubMed]
- Krishna, S.; Choudhury, A.; Keough, M.B.; Seo, K.; Ni, L.; Kakaizada, S.; Lee, A.; Aabedi, A.; Popova, G.; Lipkin, B.; et al. Glioblastoma remodelling of human neural circuits decreases survival. Nature 2023, 617, 599–607. [Google Scholar] [CrossRef] [Scilit] [PubMed]
- Monje, M. The neuroscience of brain cancers. Neuron 2025, 113, 2734–2739. [Google Scholar] [CrossRef] [Scilit] [PubMed]
- Chen, H.; Judkins, J.; Thomas, C.; Wu, M.; Khoury, L.; Benjamin, C.G.; Pacione, D.; Golfinos, J.G.; Kumthekar, P.; Ghamsari, F.; et al. Mutant IDH1 and seizures in patients with glioma. Neurology 2017, 88, 1805–1813. [Google Scholar] [CrossRef] [Scilit] [PubMed]
- Jütten, K.; Mainz, V.; Gauggel, S.; Patel, H.J.; Binkofski, F.; Wiesmann, M.; Clusmann, H.; Na, C.-H. Diffusion tensor imaging reveals microstructural heterogeneity of normal-appearing white matter and related cognitive dysfunction in glioma patients. Front. Oncol. 2019, 9, 536. [Google Scholar] [CrossRef] [Scilit] [PubMed]
- Mandal, A.S.; Romero-Garcia, R.; Hart, M.G.; Suckling, J. Genetic, cellular, and connectomic characterization of the brain regions commonly plagued by glioma. Brain 2020, 143, 3294–3307. [Google Scholar] [CrossRef] [Scilit] [PubMed]
- Chen, Z.; Ye, N.; Teng, C.; Li, X. Alternations and applications of the structural and functional connectome in gliomas: A mini-review. Front. Neurosci. 2022, 16, 856808. [Google Scholar] [CrossRef] [Scilit] [PubMed]
- Lv, K.; Cao, X.; Wang, R.; Du, P.; Fu, J.; Geng, D.; Zhang, J. Neuroplasticity of glioma patients: Brain structure and topological network. Front. Neurol. 2022, 13, 871613. [Google Scholar] [CrossRef] [Scilit] [PubMed]
- Appelbaum, P.S. Assessment of patients’ competence to consent to treatment. N. Engl. J. Med. 2007, 357, 1834–1840. [Google Scholar] [CrossRef] [Scilit] [PubMed]
- Bonosi, L.; Marrone, S.; Benigno, U.E.; Buscemi, F.; Musso, S.; Porzio, M.; Silven, M.P.; Torregrossa, F.; Grasso, G. Maximal safe resection in glioblastoma surgery: A systematic review of advanced intraoperative image-guided techniques. Brain Sci. 2023, 13, 216. [Google Scholar] [CrossRef] [Scilit] [PubMed]
- Ford, L.R., Jr.; Fulkerson, D.R. Maximal flow through a network. Can. J. Math. 1956, 8, 399–404. [Google Scholar] [CrossRef] [Scilit]
- Edmonds, J.; Karp, R.M. Theoretical improvements in algorithmic efficiency for network flow problems. J. Assoc. Comput. Mach. 1972, 19, 248–264. [Google Scholar] [CrossRef] [Scilit]
- Menger, K. Zur allgemeinen Kurventheorie. Fundam. Math. 1927, 10, 96–115. [Google Scholar] [CrossRef] [Scilit]
- Ahuja, R.K.; Magnanti, T.L.; Orlin, J.B. Network Flows: Theory, Algorithms, and Applications. J. Oper. Res. Soc. 1994, 45, 1340. [Google Scholar] [CrossRef] [Scilit]
- Dinic, E.A. Algorithm for solution of a problem of maximum flow in networks with power estimation. Sov. Math. Dokl. 1970, 11, 1277–1280. [Google Scholar]
- Haimes, Y.Y.; Lasdon, L.S.; Wismer, D.A. On a bicriterion formulation of the problems of integrated system identification and system optimization. IEEE Trans. Syst. Man Cybern. 1971, SMC-1, 296–297. [Google Scholar] [CrossRef] [Scilit]
- Valerio, J.E.; Ramirez-Velandia, F.; Fernandez-Gomez, M.P.; Rea, N.S.; Alvarez-Pinzon, A.M. Bridging the global technology gap in neurosurgery: Disparities in access to advanced tools for brain tumor resection. Neurosurg. Pract. 2024, 5, e00090. [Google Scholar] [CrossRef] [Scilit] [PubMed]
- Nayak, L.; DeAngelis, L.M.; Brandes, A.A.; Peereboom, D.M.; Galanis, E.; Lin, N.U.; Soffietti, R.; Macdonald, D.R.; Chamberlain, M.; Perry, J.; et al. The Neurologic Assessment in Neuro-Oncology (NANO) scale: A tool to assess neurologic function for integration into the Response Assessment in Neuro-Oncology (RANO) criteria. Neuro Oncol. 2017, 19, 625–635. [Google Scholar] [CrossRef] [Scilit] [PubMed]
- Collins, G.S.; Moons, K.G.M.; Dhiman, P.; Riley, R.D.; Beam, A.L.; Van Calster, B.; Ghassemi, M.; Liu, X.; Reitsma, J.B.; van Smeden, M.; et al. TRIPOD+AI statement: Updated guidance for reporting clinical prediction models that use regression or machine learning methods. BMJ 2024, 385, e078378. [Google Scholar] [CrossRef] [Scilit] [PubMed]
- Ahuja, R.K.; Magnanti, T.L.; Orlin, J.B. Network Flows: Theory, Algorithms, and Applications; Prentice Hall: Englewood Cliffs, NJ, USA, 1993. [Google Scholar]
- Land, A.H.; Doig, A.G. An automatic method of solving discrete programming problems. Econometrica 1960, 28, 497–520. [Google Scholar] [CrossRef] [Scilit]
- Yeh, F.C. Population-based tract-to-region connectome of the human brain and its hierarchical topology. Nat. Commun. 2022, 13, 4933. [Google Scholar] [CrossRef] [Scilit] [PubMed]
- Yeh, F.C. Population-Probability Atlas and Tract-to-Region Connectome and HCP1065 Population-Averaged Tractography Atlas. Dataset Release hcp1065. Available online: https://brain.labsolver.org/hcp_trk_atlas.html (accessed on 22 October 2026).
- Klein, A.; Tourville, J. 101 labeled brain images and a consistent human cortical labeling protocol. Front. Neurosci. 2012, 6, 171. [Google Scholar] [CrossRef] [Scilit] [PubMed]
- Ng, S.; Moritz-Gasser, S.; Lemaitre, A.L.; Duffau, H.; Herbet, G. White matter disconnectivity fingerprints causally linked to dissociated forms of alexia. Commun. Biol. 2021, 4, 1413. [Google Scholar] [CrossRef] [Scilit] [PubMed]
- Motomura, K.; Fujii, M.; Maesawa, S.; Kuramitsu, S.; Natsume, A.; Wakabayashi, T. Association of dorsal inferior frontooccipital fasciculus fibers in the deep parietal lobe with both reading and writing processes: A brain mapping study. J. Neurosurg. 2014, 121, 142–148. [Google Scholar] [CrossRef] [Scilit] [PubMed]
- Almairac, F.; Herbet, G.; Moritz-Gasser, S.; Menjot de Champfleur, N.; Duffau, H. The left inferior fronto-occipital fasciculus subserves language semantics: A multilevel lesion study. Brain Struct. Funct. 2015, 220, 1983–1995. [Google Scholar] [CrossRef] [Scilit] [PubMed]
- Chau, A.M.; Gagliardi, F.; Smith, A.; Pelzer, N.R.; Stewart, F.; Mortini, P.; Elbabaa, S.K.; Caputy, A.J.; Gragnaniello, C. The paramedian supracerebellar transtentorial approach to the posterior fusiform gyrus. Acta Neurochir. 2016, 158, 2149–2154. [Google Scholar] [CrossRef] [Scilit] [PubMed]
- Brown, D.A.; Hanalioglu, S.; Chaichana, K.; Duffau, H. Transcortico-subcortical approach for left posterior mediobasal temporal region gliomas: A case series and anatomical review of relevant white matter tracts. World Neurosurg. 2020, 139, e737–e747. [Google Scholar] [CrossRef] [Scilit] [PubMed]

Disclaimer/Publisher’s Note: The statements, opinions and data contained in all publications are solely those of the individual author(s) and contributor(s) and not of MDPI and/or the editor(s). MDPI and/or the editor(s) disclaim responsibility for any injury to people or property resulting from any ideas, methods, instructions or products referred to in the content. |
© 2026 by the authors. Licensee MDPI, Basel, Switzerland. This article is an open access article distributed under the terms and conditions of the Creative Commons Attribution (CC BY) license.