


Abstract
Electrocardiogram (ECG) heartbeat classification is an essential component of automated arrhythmia detection and intelligent cardiac monitoring systems. Traditionally, ECG analysis has depended on manual interpretation by clinicians and conventional machine learning approaches based on handcrafted features, which are labor-intensive, noise-sensitive, and inadequate for capturing complex nonlinear morphological and temporal characteristics of ECG signals. Furthermore, real-world ECG datasets are highly imbalanced, noisy, and exhibit overlapping waveform patterns across heartbeat classes, leading to biased learning, poor minority class detection, and unreliable predictions. To address these challenges, this paper presents a calibration-aware, reliability-oriented evaluation framework for ECG heartbeat classification, incorporating hybrid deep learning architectures that combine convolutional feature extraction, bidirectional GRU-based temporal modeling, and attention mechanisms. The framework assesses probabilistic reliability using calibration metrics, such as the Brier Score and Expected Calibration Error (ECE), rather than explicitly modeling predictive uncertainty methods. Experimental results on the ECG Heartbeat dataset show that CNN achieves the highest testing accuracy (98.44%), largely due to strong performance on the majority class in an imbalanced setting. Among hybrid approaches, a representative hybrid CNN + BiGRU + Attention model attains a competitive accuracy of 97.80%, along with a higher macro F1-score (0.9052), improved training stability, and good calibration behavior (Brier Score = 0.0417, ECE = 0.1023). As the experiments are conducted on preprocessed, fixed-length segments, the results reflect performance under controlled conditions rather than real-world clinical deployment conditions and should therefore be interpreted as a benchmark-level evaluation. Furthermore, no single model consistently outperforms others across all evaluation criteria, as different metrics capture distinct aspects of performance.
1. Introduction
Globally, cardiovascular diseases (CVDs) are the leading cause of death with an estimated 17.9 million deaths per year, which is approximately 32% of all deaths worldwide. These conditions include cardiac arrhythmias, which are clinically critical since irregular heart rhythms may cause serious complications, including stroke, heart failure, and sudden cardiac death unless identified at an early stage [1]. Electrocardiography (ECG), an inexpensive, non-invasive method of electrical cardiac monitoring, is a clinically well-established and widely used diagnostic instrument to establish abnormal heart rhythm or to monitor cardiac activity. The volume of ECG data being collected in clinical and remote environments, therefore, has grown exponentially with the fast development of wearable sensors, telecardiology, and continuous health monitoring systems. This rapid growth in data volume renders manual data analysis more difficult, time-consuming, and prone to human error, hence the need to create automated and intelligent ECG heartbeat classification platforms [2]. Conventionally, ECG inspection has been performed by trained cardiologists who study the morphology of waveforms (P-wave, QRS complex, T-wave) as well as RR intervals and rhythm patterns. Although manual interpretation is a clinical gold standard, it is labor-intensive and prone to inter-observer variability, especially when it comes to the analysis of long-term records such as 24 h Holter ECG records [3]. In the traditional automated approaches that made use of traditional machine learning algorithms, Support Vector Machine (SVM), k-Nearest Neighbor (k-NN) and decision trees were used to assist clinicians with hand-designed features within the time domain and frequency domain, or in the statistical representation of ECG signals [4]. However, these approaches are highly dependent on domain knowledge concerning feature engineering and are, in most cases, incapable of capturing the nonlinear and dynamical nature of ECG signals. Moreover, standard methods are highly susceptible to noise, baseline drift and signal artifacts, which are common in real ECG records and therefore lead to lower-quality estimates and low generalizability to large groups of patients [5]. Recently, deep learning methods (a subset of AI) and their application to biomedical signal processing and automated ECG analysis have undergone a revolutionary transformation by allowing end-to-end learning on raw or minimally processed signals. Convolutional Neural Networks (CNNs) have shown great potential in deriving hierarchical spatial patterns in ECG waveforms, and Recurrent Neural Networks (RNNs), such as Long Short-Term Memory (LSTM) and Gated Recurrent Units (GRUs), have been successful in learning temporal patterns in sequential cardiac signals [6,7]. The recent literature reports that deep learning models outperform classical machine learning models by a large margin in the detection of arrhythmias in ECG signals, with accuracy rates that frequently surpass 95 percent on state-of-the-art datasets like the MIT-BIH Arrhythmia Database [8]. Moreover, few researchers have demonstrated the benefit of hybrid deep learning architectures (CNN prediction and sequential prediction), which integrate spatial morphology and long-term temporal rhythm patterns in heartbeat multi-class classification tasks. The hybrid methods feature improved feature representation, do not require manual preprocessing and enhance the results on several ECG classification tasks [9]. Although great improvements have been made, there are still some issues in developing robust and practical ECG classification systems. Among the primary concerns is the imbalance in the number of classes of standard datasets, of which MIT-BIH is no exception, as there are many more normal heartbeats than arrhythmic ones in the dataset, which causes the models to be biased when trained and the minority arrhythmia classes to be poorly classified [10]. Furthermore, ECGs recorded in natural environments are generally contaminated with various types of noise, including motion artifacts, electrode interference and baseline shifts, that compromise model performance and reliability. Another issue is the inability to interpret most deep learning models and their uncertainty estimation capability, as they are black-box models that provide deterministic predictions without levels of confidence. This is of particular concern to medical practice, which requires high reliability and minimal error tolerance since the predictions made can carry vital clinical consequences [11,12]. Also, most advanced hybrid architectures demand high computational complexity, parameter size, and training, which limits their use in real time and even in devices with resource limitations, such as wearable monitors in healthcare. Further, the issue of generalization on heterogeneous datasets and patient groups remains a long-term problem in the ECG classification research [13]. It has been demonstrated that single-dataset-trained models perform poorly on unseen datasets due to variations in signal acquisition protocols, demographics and noises of patients. The increasing popularity of real-time automated diagnosis and the need to establish clinically reliable AI systems support the importance of the development of effective frameworks that are not only highly accurate but can also provide reliable predictions with calibrated confidence [14,15].
This study therefore aims to provide a calibration-aware hybrid deep learning model for multi-class ECG heartbeat classification, capable of capturing spatial morphological characteristics of ECG signals and modeling temporal relationships within the cardiac cycle. Although previous research has explored hybrid architectures using convolutional, temporal, and attention-based modules, the focus of this work is not on the novelty of architecture. Rather, it provides a reliability-aware learning and evaluation paradigm that goes beyond traditional accuracy-based methods. Although the model generates probabilistic results, it does not include uncertainty estimation processes explicitly. Rather, it assesses probabilistic reliability based on calibration measures like Expected Calibration Error (ECE) and the Brier Score, which measure the consistency between the predicted confidence and actual results. In addition, the designed framework will also enable convergence stability analysis using EMA, preprocessing fidelity assessment using quantitative filter comparison and a unified experimental design which offers a chance to investigate model behavior with noisy ECG signals. The approach involves convolutional feature extraction with temporal modeling to improve its robustness and attention mechanisms, which enable it to focus on specific parts of diagnostically relevant waves.
While the framework is tested on standard ECG datasets, the proposed experiments are conducted in a controlled environment with preprocessed, fixed-length heartbeats and do not address variation in patients, continuous signals and noise in clinical data. The current work does not focus on developing new models but rather on the assessment of ECG classification models in terms of reliability and trust. The goal is to propose a framework to evaluate ECG classification systems in terms of reliability and trustworthiness, which will reveal the difference between accuracy and reliability in imbalanced data settings, which are typical in many clinical applications.
1.1. Contribution
The key contributions of this research are summarized as follows:
- This work presents a reliability- and calibration-aware deep learning framework for ECG heartbeat classification that moves beyond accuracy-centric evaluation by explicitly addressing prediction reliability and trustworthiness, which are important for future clinical applications.
- The framework systematically integrates probabilistic calibration metrics (Expected Calibration Error, Maximum Calibration Error, and Brier Score) to quantify the alignment between predicted confidence and true outcomes, addressing an often-overlooked aspect in ECG classification.
- A unified and reproducible benchmarking protocol is established, where multiple architectures (CNN, RNN, TCN, Transformer, and hybrid models) are evaluated under identical preprocessing, data splits, and training settings, enabling fair and unbiased comparison.
- The study introduces EMA-based multi-run convergence analysis, providing a robust assessment of training stability and model consistency beyond conventional single-run evaluation.
- A representative CNN–BiGRU–Attention model is included as a representative hybrid architecture, improving balanced classification performance and enhancing sensitivity toward underrepresented heartbeat classes (S and F) in imbalanced datasets.
1.2. Structure of Work
The rest of this paper is structured in the following way. Section 2 is a review of prior work in the ECG heartbeat classification field and deep learning. Section 3 outlines the proposed methodology, such as the details of the dataset, preprocessing, exploratory data analysis, feature processing, and the development of the fully integrated hybrid CNN-BiGRU-Attention model. Section 4 presents experimental findings and a discussion. Lastly, Section 5 summarizes the paper and gives possible directions for future research.
2. Related Work
This section is a review of the literature on ECG heartbeat and arrhythmia classification that highlights the development of deep learning and hybrid procedures to enhance diagnostic performance. Bai et al. (2024) [16] proposed a hybrid CNN-BiGRU model with multi-head attention to classify ECG arrhythmia data with the help of the MIT-BIH dataset. The paper showed that convolutional layers with recurrent and attention mechanisms are effective in learning the spatial morphology and temporal relations of ECG signals with a high accuracy and F1-score. The authors pointed out that hybrid architectures demonstrate superior performance in enhancing robustness in the multi-class heartbeat classification. Ansari et al. (2023) [17] conducted a large-scale survey on ECG arrhythmia detection and classification using deep learning. The study examined CNN, RNN, Transformer, and hybrid models and found them to be more effective based on ECG analysis with traditional machine learning models, whereas hybrid models demonstrate a better performance in detecting complex arrhythmias. In [18], researchers Xiao et al. (2023) conducted a review of deep learning-based ECG arrhythmia classification techniques, noting that the most used benchmark in multi-class heartbeat classification is the MIT-BIH dataset. Another trend that was noted in the study is the increased adoption of hybrid deep learning models that combine CNNs with sequence models to achieve better performance and reliability. Zheng et al. (2024) [19] suggested a hierarchical CNN + BiLSTM using an attention model to detect arrhythmias. It used convolutional layers to extract features and bidirectional LSTM with attention to extract long-range dependencies, enhancing classification events and interpretability in the ECG signal. Researcher Guhdar et al. (2025) [20] designed an optimized deep learning model to classify ECG arrhythmias with the help of standard datasets mentioned in MIT-BIH and PTB. The model aimed at enhancing the strength of classification and generalization across datasets; it is crucial to note that robust deep learning architectures are vital in analyzing clinical ECGs. Malleswari et al. (2024) [21] suggested a CNN-based transfer learning framework applied to ECG signal classification with the help of time–frequency representations. They found that their results were better in terms of classification accuracy and robustness as a result of the high-level of feature extraction in multi-class ECG classification systems. Researchers Raza et al. (2023) [22] suggested the use of a deep CNN-based model that classifies ECG heartbeats into five AAMI classes using the MIT-BIH dataset. The research established that CNNs are very efficient in automated classification of ECG signals and give useful results in terms of detecting various categories of heartbeats. Researchers Reshad et al. (2025) [23] conducted a review on the deep learning methods of ECG arrhythmia detection and found that hybrid CNN-RNN models are more accurate and have higher F1-scores compared to single-model methods. Another problem identified in the study is the interpretability of the models, generalization, and reliability in clinical ECG diagnosis. To enhance the diagnostic accuracy and automation of arrhythmia detection, researchers Jahangir et al. (2025) [24] came up with a hybrid classification model based on ECG-based arrhythmia detection with advanced stacked models. The paper indicates the significance of automatic and dependable ECG classification systems to clinical diagnosis and provides evidence that hybrid intelligent models have the potential to correctly classify arrhythmias without much human effort. Researchers Prakash et al. (2025) [25] carried out a systematic review of ECG beat classification and evolving trends in deep learning, asserting that the system requires interpretable, reliable and clinically deployable AI systems. The study defines hybrid deep learning, cross-modal fusion, and trustworthy AI as some of the main opportunities for future research in ECG classification. Potharaju et al. (2025) [26] suggested a multi-resolution hybrid sliding window deep learning model to classify ECG beat-level arrhythmias based on the MIT-BIH dataset. The approach identifies multi-scale temporal windows and processes them using hybrid CNN and stacked LSTM models to incorporate contexts of both local morphology and global rhythm. The experiment showed better classification and classification strength in the case of multi-class ECG heartbeat classification. Researchers Elsheikhy et al. (2025) [27] designed a low-weight deep learning model comprising CNN and channel attention mechanisms to classify ECG arrhythmias. The model aims to improve diagnostic reliability by automatically laying emphasis on informative ECG segments and decreasing sensitivity to noise. Experimental analysis showed high accuracy and increased F1-score on multi-class arrhythmia detection, and therefore, it is applicable in real-time clinical analysis. Researchers Daduvy et al. (2025) [28] proposed a Multi-Scale Convolutional LSTM Dense Network (MS-CLDNet) as a good ECG arrhythmia classifier. The model utilizes multi-scale convolutional feature extraction and LSTM-based temporal modeling techniques to improve the accuracy and robustness of classification among several arrhythmia classes. Their findings affirm that hybrid CNNLSTM frameworks are superior in terms of multi-class ECG classification to traditional deep learning frameworks. To offer a more holistic view of the latest developments, Table 1 presents an overview of most of the important research in ECG heartbeat and arrhythmia classification, differentiating datasets, model frameworks, contributions, findings, and limitations.
Table 1.
Summary of recent deep learning and hybrid models for ECG heartbeat and arrhythmia classification.
3. Evaluation Framework and Model Architectures for ECG Classification
In this section, the methodology followed to classify multi-class ECG heartbeats is elaborated, with the sequential pipeline, starting with the dataset acquisition stage/signal preprocessing phase to the exploratory data analysis and feature processing stage, the development of multiple deep learning classifiers as well as the hybrid model, and, finally, the performance, stability, and calibration-based reliability assessment, as illustrated in Figure 1.
Figure 1.
Proposed framework for ECG heartbeat classification using advanced AI learning models.
3.1. Dataset
The ECG Heartbeat Categorization Dataset is a labeled collection of preprocessed electrocardiogram (ECG) heartbeat signals, widely used for classification and biomedical signal analysis tasks. The data are derived from PhysioNet databases (mainly the MIT-BIH Arrhythmia Database and the PTB Diagnostic ECG Database), where continuous ECG signals are divided into single heartbeats by R-peak detection. Every sample corresponds to a normalized heartbeat of constant length (around 187 time steps), which allows representation of inputs to machine learning and deep learning models on an equal structure. The dataset has five heartbeat categories according to the AAMI specification: Normal (N), Supraventricular (S), Ventricular (V), Fusion (F), and Unknown (Q). It is highly skewed, with normal beats forming the majority category and some of the abnormal categories (especially S and F) underrepresented. The data are in CSV format with predefined training and testing splits. The training set has about 87,554 samples, and the validation set has about 21,892 samples, which amounts to about an 80:20 split ratio. This design is in line with previous research that utilizes this dataset. It is noted that the dataset is structured on a heartbeat level, without any apparent identifiers of patients [29]. Table 2 shows a description of the ECG dataset.
Table 2.
Description of the ECG heartbeat dataset features and specifications.
3.2. Data Preprocessing
This section will explain the data preprocessing procedure for the ECG heartbeat signals, such as data noise removal, signal denoising analysis to improve the quality of the signal and provide a consistent and reliable input to the subsequent analysis, and model training. The quantitative effect of the different denoising methods on the preservation and distortion of ECG signals is presented in the results of the filter comparison in Table 3. The notch filter has the highest SNR (=29.07 dB), the lowest RMSE (=0.0427) and MAE (=0.0361), and a near-perfect correlation (=0.9988), which means that it can eliminate narrowband noise (e.g., powerline interference) while preserving the original waveform morphology and temporal structure of the ECG beats. This makes it the most appropriate filter for keeping clinically significant characteristics like R-peak sharpness and minute waveform changes, which are statistically significant in categorizing heartbeats. The median and Savitzky–Golay (savgol) filters, however, perform moderately, having both lower SNR values (by a factor of 14 dB) and greater reconstruction errors than the notch filter. Although their correlation coefficients are relatively high (around 0.96–0.97), the higher values of RMSE and MAE indicate the effect of smoothing that may eliminate sharp ECG signals and decrease morphological characteristics that are used for discrimination. The bandpass filter performs poorly with a negative SNR (=−3.83 dB), extremely high RMSE (=1.73) and MAE (=1.37), and very low correlation (=0.31), which means a strong degradation of the signal and the loss of the original waveform information. In terms of research, these findings suggest that aggressive frequency domain filtering (bandpass) can yield the desired signal content, including noise, but targeted filtering (notch) yields the ideal noise reduction with the least signal content. Thus, in ECG-based classification tasks, the notch filter is the most suitable preprocessing option, which optimally reduces noise while maintaining signal fidelity and class-discriminative morphological features.
Table 3.
Performance comparison of ECG denoising filters.
Figure 2 presents a visual comparison of ECG heartbeat signals processed using median, Savitzky–Golay, bandpass, and notch filters across representative classes. The addition of the notch-filtered waveform to the results in Table 3 allows for visual confirmation of the notch filter’s effectiveness. As shown in Figure 2a, the notch filter preserves the waveform structure (such as R-peaks and amplitude transitions) of the original waveform and effectively eliminates narrow-band noise. This is consistent with the quantitative results (the highest SNR and the lowest reconstruction error). While the median and Savitzky–Golay filters have moderate denoising performance (preserving the waveform structure but resulting in some smoothing), they can be employed to smooth out some morphological details. On the other hand, the bandpass filter is highly distorted in waveform structure, such as baseline drift, amplitude and morphological features. This is more apparent in some of the classes where the waveform structures are more complex or variable. Although it performs poorly in quantitative terms (e.g., negative SNR), the bandpass filter is also used as a baseline because it is commonly applied in traditional ECG preprocessing to isolate frequency bands of interest. Nevertheless, the findings indicate that fixed bandpass filtering is an appropriate method for pre-segmented heartbeat signals since it can negatively affect diagnostically valuable features. This comparison shows the significance of morphology-conserving filtering methods, like the notch filter, to robust ECG classification in noisy and imbalanced data.
Figure 2.
Comparison of original and filtered ECG beat for (a) label 0, (b) label 1 and (c) label 2 data sets using median, Savitzky–Golay, and bandpass filters.
Figure 2b depicts the same comparison but with label 1, where it is evident that there are changes in the pre- and post-peak areas of the original waveform. The median filter averages the sharp noise spikes but only averages the small oscillations slightly, indicating local averaging. The Savitzky–Golay filter is also not as vigorous in eliminating sharp edges of the signal and the waveform curvature; however, it attenuates bigger signal trends and smaller temporal fluctuations. The bandpass-filtered signal has strong baseline correction at the cost of amplitude dynamics and QRS morphological distortion, which can be damaging to class-discriminative temporal features. The filtering of label 2 is depicted in Figure 2c, in which case the original signal has a broader waveform with a moderate R-peak and a steady plateau. The median filter does not distort the morphology of the image but removes artifacts that are impulse in nature and is also resistant to noise; it does not severely distort the structure. The Savitzky–Golay filter makes the waveforms smoother and maintains their continuity, which makes downstream modeling of the signal more stable, although the steepness of the peaks decreases slightly. On the other hand, the bandpass filter adds visible re-shaping of the waveform and bias of the presented waveform, which changes the inherent time nature of the beat. From a methodological perspective, given the substantially higher sample count in all three figures, the median and Savitzky–Golay filters are morphology-preserving filters that are appropriate for the analysis of ECG, but bandpass filtering always distorts structure and can lose discriminative electrophysiological features.
3.3. Exploratory Data Analysis
This section presents the exploratory data analysis (EDA) of the ECG heartbeat signals to understand the nature of the waveforms, the statistical characteristics and the format of the data used in the model development.
Figure 3 shows randomly selected ECG beat waveforms representing each of the classes (N, S, V, F, and Q), which enables qualitative analysis of intra-class variability and morphological differences at the signal level. The beats of the Normal (N) class are regular with sharp and distinct R-peak and stable post-peak peaks, indicating that depolarization patterns in this group are regular and have low variability among samples. Conversely, the Supraventricular (S) class exhibits significant variations in waveform morphology, such as abnormal pre-R and post-R waves and slight changes in peak amplitude, which indicate atrial-origin electrical activity changes and increased temporal dispersion over normal beats. The Ventricular (V) beats exhibit larger and more distorted waveforms with smaller R-peaks and longer recovery intervals that are indicative of abnormal ventricular depolarization and enhanced signal dispersion, a major classification model discriminative feature.
Figure 3.
Random ECG beat waveforms for each heartbeat class (N, S, V, F, and Q).
The Fusion (F) type shows the morphological features of both normal and abnormal beats, with the waveform having intermediate peak sharpness and disordered baseline changes, meaning that there is a superposition of both the Ventricular and Normal conduction patterns. The Unknown (Q) class, meanwhile, is not homogeneous but heterogeneous, with much more variation in amplitude, slope, and position of the peaks; thus, it shows high intra-class variability and the possibility of noise or uncharacterized pathological patterns. As a research question, the visual differences prove that the separability of classes in this dataset is primarily driven by morphological variations in the sharpness of peaks, the width of waveforms and the stability of the baseline, not merely by a difference in amplitude. Also, the heterogeneity observed in the minority categories (S, F, and Q) implies that there is a greater potential of misclassifying the model because of overlap in the temporal characteristics, thus indicating a strong requirement for powerful feature extraction mechanisms (e.g., time–frequency analysis or deep convolutional architecture) and that imbalance-aware training algorithms are essential to capture subtle electrophysiological variation across heartbeat categories.
Table 4 summarizes the statistical features of the ECG heartbeat signals and suggests that the ECG-recorded heartbeat signals are very standardized. The mean values are very close to zero, and the standard deviation values are very close to one across samples, which confirms the previous normalization of the time-series signals. The range of minimum and maximum values is not symmetrical; the positive peaks are much higher than the negative ones, which is typical of ECG signals, where the R-peak has a strong dominance over the amplitude of the waveform. The peak-to-peak (PTP) values are approximately 5.3 to 7.2, indicating that signal amplitude and morphological dispersion across beats vary with different beats. This can be related to the difference in the waveforms by different classes, like wider ventricular beats or sharper normal beats.
Table 4.
Statistical summary of normalized ECG heartbeat signal features.
The energy and RMS values are almost fixed (around 187 and about 1, respectively), which means that the signal length is constant, and the overall signal power after preprocessing is maintained, which is advantageous in model training at low scale and avoiding bias due to scale. Nevertheless, the skewness values are all high and positive (3.1–4.3), which demonstrates a strong right-tailed distribution with major R-peaks and minor high-intensity fragments per beat. From a research perspective, this statistical behavior suggests that the discriminative information in the dataset is not stored in the global scale of characteristics (mean, RMS, or energy) but in morphological characteristics like amplitude spikes, asymmetry of waveforms and variations in shape across time. The maximum skew and the difference between the maximum and minimum distances between peaks also indicate that a more careful approach based on higher-order statistics and geometry of the waveforms (i.e., shape descriptors, wavelet features, or deep temporal encoders) would be more effective than a simple statistical summary in correctly classifying the heartbeat.
3.4. Feature Processing
This section demonstrates the processing of the features using the dimensionality reduction method, namely, PCA and t-SNE, to examine the variance structure and nonlinear distribution of the ECG heartbeat features in the latent feature space. Figure 4 demonstrates the PCA projection of the heartbeat signals of the ECG signals on the first and second principal components, which represent the majority of the variance in the dataset. The nonlinear separation of the classes (N, S, V, F, and Q), as shown by the scattered and overlapping distribution of the points, implies that the classes are not separable in a low-dimensional space, which suggests that the features are high in complexity and that the similarity between the classes is high. The lack of clear clusters suggests that the discriminative data are spread over several dimensions, which justifies the use of nonlinear and deep learning models that are effective in learning finer morphological variations in ECG waveforms.
Figure 4.
PCA projection of ECG signals.
The PCA projection of the ECG signals illustrates that the first two principal components only capture a small fraction of the total variance (PC1 = 13.7% and PC2 = 11.6%, with a cumulative variance of about 25.2, indicating that additional dimensions are necessary to fully describe the intrinsic structure of the heartbeat data). According to the projection, the scatter distribution is a thick, overlapping cluster where no distinct boundaries can be identified between the Normal and Supraventricular, Ventricular, Fusion and Unknown beats in the PC1–PC2 space, indicating that linear variance-maximizing transformations are not sufficient to identify the peculiarities of each beat (Normal, Supraventricular, Ventricular, Fusion and Unknown). This overlap suggests that inter-class morphological variations are subtle and not uniformly oriented along the dominating directions of variance but spread out in many dimensions. From an analysis of variance perspective, given that the explained variance in terms of components (only approximately 61.2 percent cumulative variance in PC10) decays gradually, many components have significant signal characteristics, as ECG waveforms have many varying signals over time and morphologies. The lack of clear class-based grouping in the projection indicates a large amount of feature overlap and heterogeneity within a class, which is expected for Fusion and Unknown rows, which have mixed waveform properties. From an analytical standpoint, this implies that the data are nonlinearly separated into classes and highly entangled with features, and thus, linear dimensionality reduction fails to analyze the separability. In turn, it is expected that more expressive representations, including nonlinear embeddings (e.g., t-SNE, UMAP) or deep feature learning, will be necessary to learn discriminative electrophysiological patterns since the primary variance in PCA is dominated by global variations in waveforms instead of morphological signatures of classes.
In Figure 5, the t-SNE plot of the ECG signals indicates that the data of heartbeat signals inherently exhibit a nonlinear geometry and that there are several nonlinear and fragmented clusters that are spiral-shaped, not compact, and not linearly separable groups. In contrast to the PCA projection, t-SNE considers local neighborhood associations, and the existence of multiple large sub-clusters suggests that the data have some local morphological patterns in the ECG beats. The apparent overlap of points, however, indicates that even in the nonlinear embedding space, the boundary between the classes cannot be drawn clearly enough; thus, there is significant inter-class similarity in the morphology of the waveforms between the abnormal categories of beats. Research-wise, this disseminated but organized clustering tendency implies that there would be high intra-class variability and latent substructures that would have been caused by variability in the sharpness of the R-peaks, the width of the waveforms and the variability in the baseline variations for each heartbeat class. The lack of distinct clusters corresponding to each one of the labeled categories suggests that distinct arrhythmia types overlap in their electrophysiological features and thus complicate classification. Also, the appearance of ring-shaped and lengthy cluster structures suggests that the space underlying the feature is manifold, but not Euclidean, i.e., discriminative information is represented in nonlinear dynamics over time but not in the form of simple amplitude differences. This fact suggests that nonlinear feature extractors, including deep convolutional or sequence-based models, are more effective than linear classifiers in localizing the pattern of waveforms in the vicinity and hierarchical temporal relationships.
Figure 5.
t-SNE projection of ECG signals.
In general, the t-SNE visualization indicates that the dataset has both important local structure but also a lot of class entanglement and heterogeneity, which justifies the importance of strong, high-capacity models and better feature learning schemes to correctly classify heartbeats.
3.5. Applied Classifiers
In the case of the ECG Heartbeat dataset, the input samples were normalized one-dimensional time-series signals of fixed length (about 187 time steps), representing a single cardiac cycle. The fine-grained morphological features, including the P-wave, QRS complex and T-wave, as well as subtle temporal variations and class imbalance between heartbeat types, contain the discriminative information. Thus, the deep learning frameworks used on these data should be able to effectively represent the local morphology of waveforms, local temporal dynamics, and nonlinearity in feature interactions, as well as be resistant to noise and intra-class variation.
Table 5 presents a comprehensive comparison of computational complexity, inference latency, and memory requirements across all evaluated ECG classification models. The findings point out the trade-off between predictive performance and computational efficiency. Lightweight models like CNN provide faster inference and consume fewer resources, but hybrid and attention-based models have better balance and reliability in classification at the expense of higher computational costs.
Table 5.
Comprehensive computational complexity of models.
While the computational complexity analysis presented in Table 5 provides detailed insights into model parameters, FLOPs, inference latency, and memory requirements, it does not directly quantify how efficiently each model translates computational cost into predictive performance. To address this limitation, we suggest a performance–efficiency trade-off analysis that directly compares performance in classification (in terms of the macro F1-score) to computational cost (in terms of FLOPs and inference time) (Table 6). This type of quantitative analysis is necessary to determine the feasibility of using deep learning models in real-time practice and resource-limited healthcare settings, where the ability to balance accuracy and efficiency is vital. The hybrid model (CNN + BiGRU + Attention) measures of trade-off (e.g., F1/FLOPs and F1/Latency) enable a normalized comparison between the models, which gives a better idea of what kind of architecture can offer the optimal performance per unit of computational cost.
Table 6.
Performance–efficiency trade-off analysis of ECG classification models.
Table 7 summarizes the implementation details, hyperparameter settings, and experimental configuration used in this study to ensure reproducibility and transparency.
Table 7.
Implementation details and experimental configuration.
A 1D Convolutional Neural Network (CNN) is well suited because it can extract localized features using learnable filters, which slide over the ECG sequence to support automatic recognition of clinically significant patterns, e.g., R-peak sharpness and slope transitions. The convolutional transformation at layer is defined as
where is the kernel size, are learnable weights, and is a nonlinear activation function. In the context of ECG signals, this operation allows the model to learn morphology-aware representations that are invariant to small temporal shifts, which is essential due to slight variations in beat alignment [30,31].
Recurrent architectures, such as LSTM, BiLSTM, and GRU, are particularly effective for ECG classification because the heartbeat waveform is inherently sequential, and the diagnostic significance of a sample depends on its temporal context within the cardiac cycle [32,33,34]. The LSTM network addresses long-term dependency learning using gated memory mechanisms that regulate information flow:
where denotes element-wise (Hadamard) multiplication, , , and denote the forget, input, and output gates and is the hidden state. For ECG beats, this mechanism enables the model to retain contextual dependencies across the entire waveform, including pre-R and post-R segments. BiLSTM further enhances temporal modeling by processing the sequence in both the forward and backward directions,
which is particularly beneficial for ECG signals since diagnostic morphology is distributed symmetrically around the R-peak rather than being strictly causal. GRU, a simplified recurrent architecture, reduces computational complexity while maintaining effective sequence learning through update and reset gates,
making it suitable for large-scale ECG datasets with high sample counts [33,34]. Here, is the input at time step , is the previous hidden state, is the update gate, is the reset gate, are input weight matrices, are recurrent weight matrices, is the sigmoid activation function, is the hyperbolic tangent activation, is the candidate hidden state, is the final hidden state, and denotes element-wise multiplication.
The LSTM + Autoencoder architecture is particularly relevant for ECG datasets due to the presence of noise, baseline drift, and morphological heterogeneity across classes. In this framework, the encoder compresses the input signal into a latent representation
and the decoder reconstructs the signal as
with the objective of minimizing reconstruction loss . This approach enhances denoising and extracts compact latent features that preserve essential electrophysiological patterns, improving classification robustness for minority and noisy heartbeat classes [35].
Hybrid architectures such as CNN + GRU, CNN + BiGRU, and CNN + BiLSTM are especially well-aligned with the ECG Heartbeat dataset because they integrate hierarchical feature learning. The CNN layers first extract local morphological descriptors , and the recurrent layers then model temporal dependencies
enabling both spatial (morphological) and temporal features to be captured simultaneously [36,37,38]. This is essential in the detection of arrhythmias, where fine distortions of the waveforms and successive dependencies both characterize the separability of the classes. CNN + BiGRU and CNN + BiLSTM also enhance the performance of the model because of the bidirectional temporal context, which is useful in separating similar morphologies of heartbeats, as observed in imbalanced datasets.
The CNN + BiGRU + Attention architecture (described in Algorithm 1) is an ensemble of convolutional layers for extracting hierarchical morphological features, a sequence of bidirectional GRU layers for modeling temporal relationships, and an attention mechanism for adaptive weighting of features. The CNN layers acquire local waveform characteristics, such as R-peak morphology and signal transitions, and BiGRU acquires the temporal relationships around a signal in both directions. The CNN–BiGRU–Attention architecture is included as a representative hybrid model commonly used in the ECG classification literature. Its role in this paper is to facilitate analysis of calibration, stability, and class-wise performance under a unified evaluation framework.
| Algorithm 1. Representative CNN + BiGRU + Attention Architecture for ECG Heartbeat |
| Input: Preprocessed ECG heartbeat signals , where Initialize model parameters θ Set CNN filters, kernel size, BiGRU units, and attention parameters for each input ECG beat x_i in X do # Step 1: Input Layer Input x_i ∈ R187×1 # Step 2: CNN Block (Morphological Feature Extraction) F1 ← Conv1D(x_i, filters = 32, kernel = 3) F1 ← ReLU(F1) F1 ← BatchNormalization(F1) F1 ← MaxPooling(F1) F2 ← Conv1D(F1, filters = 64, kernel = 3) F2 ← ReLU(F2) F2 ← BatchNormalization(F2) F2 ← MaxPooling(F2) # Step 3: Sequence Formation H_seq ← Reshape(F2) # Step 4: Bidirectional GRU (Temporal Modeling) H_forward ← GRU_forward(H_seq) H_backward ← GRU_backward(H_seq) H_bi ← Concatenate(H_forward, H_backward) # Step 5: Attention Mechanism e_t ← tanh(W * H_bi + b) α_t ← softmax(e_t) C ← Σ (α_t * H_bi) # Step 6: Dense Layer Z ← Dense(C) Z ← ReLU(Z) # Step 7: Regularization Z ← Dropout(Z, rate = 0.5) # Step 8: Output Layer _i ← Softmax(Z) end for Return predicted labels = argmax(_i) Output: Predicted class labels |
The attention mechanism is used to assign the weights of importance to various temporal features by calculating attention scores and producing a context vector as a weighted average of BiGRU outputs. This allows the model to emphasize regions of the ECG signal that are diagnostically relevant (e.g., the QRS complex) and downplay the effects of less informative parts of the signal. This context representation is then forwarded through connected layers and an ultimate multi-class softmax classifier.
An alternative to recurrent models is the Temporal Convolutional Network, TCN, which uses dilated causal convolutions that dilate the receptive field but do not increase the model depth excessively:
where is the output at time step , represents the input at a dilated time step, are the convolutional filter weights, is the kernel size, is the dilation factor, and the summation computes the weighted sum over the receptive field. In the case of ECG signals, it enables the network to capture long-range dependencies over the full heartbeat cycle with fixed gradients and parallel computation, making the TCN very useful in fixed-length classification of biomedical time-series [39]. Models that utilize attention, like CNN + BiGRU + Attention and CNN + Self-Attention, propose adaptive weighting schemes that give preference to diagnostically relevant regions of the ECG waveform. The attention weights are calculated to be:
and the context vector is
where is the hidden state at time step , is the weight matrix, is the attention weight vector, is the activation function, is the attention score for time step , is the normalized attention weight obtained using the softmax function, is the total sequence length, denotes the exponential function, and is the context vector computed as the weighted sum of hidden states.
Such a mechanism is most useful in ECG data where the QRS complex contains more discriminative information than other parts of the data, allowing the model to concentrate on the relevant electrophysiological patterns and minimize the impact of less informative baseline areas [40,41]. Figure 6 shows the overall architecture of the suggested CNN-BiGRU-Attention framework for classifying ECG heartbeats.
Figure 6.
CNN + BiGRU + Attention architecture for multi-class ECG heartbeat classification.
Multi-head self-attention (MHSA) and Transformer models build upon this idea, with the former representing global temporal correlations and nonlinear interactions at all time steps.
Multi-head attention is formulated as:
where each head learns different temporal subspace representations of the ECG signal [42]. Positional encoding is incorporated to preserve temporal order:
These models are particularly suitable for the ECG Heartbeat dataset due to the nonlinear class overlap and complex waveform manifold structure observed in dimensionality reduction analyses.
CNN + SE (Channel Attention) + Temporal Attention architectures further enhance representation learning by recalibrating channel-wise feature importance using squeeze-and-excitation:
where scales feature channels to emphasize informative morphological filters [43]. Temporal attention is added to provide selective focus on essential waveform parts to enhance discrimination between similar arrhythmic classes. Lastly, the Transformer model that uses self-attention and feed-forward layers solely has been found to be very effective at capturing long range dependencies and global interactions between waveforms without recurrence:
where the feed-forward network (FFN) is defined as
where represents the input sequence (feature embeddings), denotes positional encoding, is multi-head self-attention, is the feed-forward network, indicates residual addition, x represents the input feature vector, is the weight matrix of the first (input-to-hidden) layer, is the bias vector of the first layer, denotes the linear transformation of the input, is the ReLU activation function, is the weight matrix of the second (hidden-to-output) layer, is the bias vector of the second layer, and is the final output of the feed-forward network.
In the case of the ECG Heartbeat dataset, the architecture can capture rich temporal dependencies among the whole beat and can deal with huge intra-class variations and nonlinear separability [44]. Altogether, simpler CNN and GRU classifiers are effective in capturing local and short-term temporal dynamics, hybrid CNN-RNN models are most effective in morphology–temporal integration, and attention/Transformer-based classifiers can most effectively represent the data, being especially applied to imbalanced, noisy, and morphologically complicated ECG heartbeat classification problems.
4. Results and Discussion
The findings of the applied ECG heartbeat classification models and the analysis of their performance based on accuracy, macro-level measures, training stability, class-based performance and calibration reliability will be discussed in this section to provide a detailed analysis of the performance and stability of models on the imbalanced ECG dataset.
Table 8 summarizes the training and validation performance of all evaluated models on the ECG heartbeat dataset, highlighting differences in convergence behavior, generalization, and model design.
Table 8.
Training and validation performance.
CNN has the highest validation accuracy (98.44%) and low training loss (0.0359) and, therefore, converged well and learned the dominant patterns in the dataset. This performance is, however, affected by the imbalance in the dataset in terms of the number of classes, with the largest class (Normal) having a large share in determining the accuracy. Recurrent models like BiLSTM and GRU have relatively worse performance, with validation accuracies of 91.59 and 88.04, respectively, and increased validation losses. This implies that temporal modeling alone cannot be used to classify ECGs and that ECG classification also necessitates robust morphological feature extraction. Architectures that use a CNN with recurrent layers show definite improvements. The CNN + GRU, CNN + BiGRU and CNN + BiLSTM models have better validation accuracies (95.99–97.09%) and lower losses in comparison with standalone recurrent models. This verifies that the fusion of convolutional feature extraction and temporal modeling enhances representation learning and generalization. The CNN + BiGRU + Attention model has a validation accuracy of 97.80%, compared with CNN, which has a slightly lower value, but still very competitive. Noteworthily, it has the lowest training loss (0.0208) and one of the lowest validation losses (0.0546), which means that it learns effectively and generalizes well. The low accuracy difference (~0.64) with CNN indicates that the fully integrated hybrid model is competitive in performance, and it has extra feature representation with attention. Attention-based models (CNN + SE + Temporal Attention) also perform well (97.60% validation accuracy), which supports the validity of the adaptive weighting of features. Transformer and LSTM + Autoencoder are less accurate and have larger loss values, which implies that their convergence is worse, and they are less suitable to this dataset. In sum, according to the table, CNN-based hybrid and attention models have a good balance between accuracy and generalization. Although CNN has the highest raw accuracy, hybrid and attention-based models also have similar performance, albeit with better learning efficiency and robustness, which makes them more suitable for complex ECG classification problems.
Table 9 gives the precision, recall and F1-score values of all the models on the ECG heartbeat dataset, which is highly imbalanced, with the Normal (N) class dominating and the minority ones, like Supraventricular (S) and Fusion (F), having a significantly lower number of samples. Recall is likely to be overstated in such an environment by correct predictions on the majority class, whereas precision and F1-score are more indicative of balanced performance across classes.
Table 9.
Overall performance (macro precision, recall, F1-score).
The standalone CNN model has a high recall (0.9381), which means that it can label a large proportion of samples correctly. This is, however, mostly propelled by the dominant Normal type, where the model is very strong because it can capture clear morphological patterns. It has a relatively low precision (0.8572), indicating that it produces higher false positives, especially in differentiating minority classes that have common waveform characteristics with the Normal class. By contrast, the CNN + BiGRU + Attention model has the highest F1-score (0.9052), indicating a better compromise between precision and recall. Though its recall (0.8837) is a little lower than that of CNN, it has much higher precision (0.9318), a fact that shows that it is better at discriminating similar classes of heartbeats. The latter is especially relevant for this dataset, where the morphological differences between the minority classes (S and F) and temporal irregularities are subtle and hard to differentiate based on the spatial features. The hybrid models like CNN + BiLSTM (F1 = 0.8685) and CNN + BiGRU (F1 = 0.8488) perform better than the standalone recurrent models because they use morphological feature extraction in combination with the temporal context. Nevertheless, they do not put any emphasis on time steps, which restricts their capability to concentrate on diagnostically significant areas of the signal. Because CNN + BiGRU + Attention incorporates the attention mechanism, it can assign more weight to the important parts of the ECG signal (e.g., QRS complex and abnormal intervals), which enhances its ability to classify the data, particularly the underrepresented data. This results in a reduction in the number of misclassifications between overlapping classes and generally increases precision and the F1-score. The GRU, BiLSTM, and Self-Attention models demonstrate moderate performance (F1 ≈ 0.7273), suggesting that the use of temporal modeling or attention without powerful convolutional feature extraction is not sufficient for this dataset. The model with the weakest performance (F1 = 0.6507) is the Transformer model, probably because of its reliance on mass data and the absence of inductive bias towards ECG waveform structures. These results indicate that for these unbalanced ECG data, the models that integrate morphological feature extraction, time-varying models, and attention mechanisms prove to perform better in balancing precision and recall, and thus, they are more effective in the classification of majority and minority heartbeat classes.
After analyzing both the tables, the results do not indicate a single universally best model. Instead, performance varies depending on the evaluation criterion. The CNN model achieves the highest accuracy, reflecting strong performance on the dominant class, while the hybrid CNN–BiGRU–Attention model provides an improved macro F1-score, better minority-class detection, and more consistent calibration, albeit with a slight reduction in overall accuracy. This highlights a trade-off between accuracy and balanced, reliability-oriented performance. Therefore, model selection depends on the objective being optimized, and accuracy alone may not fully reflect reliability in imbalanced ECG classification.
Table 10 provides a comparison of the class-wise precision, recall and F1-score values of the standalone CNN model versus the ECG heartbeat dataset with the CNN + BiGRU + Attention model. The dataset is very unbalanced, where the Normal (N) category is predominant and the Supraventricular (S) and Fusion (F) categories are underrepresented and have an overlapping morphology of their waveforms.
Table 10.
Class-wise performance of CNN and CNN + BiGRU + Attention.
For the Normal (N) class, both models achieve very high performance. CNN shows slightly higher recall (0.9966 vs. 0.9832), indicating near-perfect detection of the majority class. The CNN + BiGRU + Attention model maintains comparable performance (F1 = 0.9889), suggesting that introducing temporal modeling and attention does not degrade majority-class recognition. In the Supraventricular (S) case, a trade-off is evident. The CNN model is more precise (0.9171) but has lower recall (0.7158), i.e., it misses many S beats (false negatives), which is normal when a model is biased towards the dominant Normal category. The suggested model has a much higher recall (0.8561), meaning it is more effective in detecting underrepresented beats, but its precision declines (0.7267) because there are more false positives. This shows a change to more sensitivity of minority classes. In the case of the Ventricular (V) class, both the models perform well. The CNN + BiGRU + Attention model has a higher recall (0.9599 vs. 0.9413), indicating that it is better at capturing irregularities in time related to the ventricular beat, although it has a similar F1-score (0.9465 vs. 0.9565). In the case of the Fusion (F) class, which is among the most difficult classes because of morphological overlap with other classes, the disparity is greater. CNN demonstrates moderate but balanced performance (F1 = 0.7850), whilst the fully integrated hybrid model improves recall (0.9012 vs. 0.7778) considerably, that is, it identifies more fusion beats. This, however, comes at the expense of reduced precision (0.6432), which indicates confusion between similar classes. This is desirable in asymmetrical datasets where the quality of minority detection tends to increase with a higher false positive rate. In the case of the Unknown (Q) class, the two models have almost the same very good performance (F1 ≈ 0.99), which means that this class is relatively easier to differentiate in the dataset. In general, the findings indicate that the CNN model is biased towards the majority class, and the recall of N is very high, but minority classes (S and F) have lower recall. Comparatively, the suggested CNN + BiGRU + Attention model enhances the recall of minority classes, particularly S and F, using temporal dependencies and attention-based weighting of features.
Figure 7 presents an example of the training dynamics and convergence behavior of the CNN + BiGRU + Attention and CNN models in the form of accuracy and loss curves and EMA-smoothed trends with epochs. Figure 7a show the accuracy plot of the CNN + BiGRU + Attention model, which clearly illustrates that the accuracy levels strongly increase in the first epochs, and the accuracy levels start to approach high values of 0.98 to 0.99, which also means that the model can learn and demonstrates high generalization. The EMA-smoothed curves also suggest stable convergence because of the minimized fluctuations in the epochs and the observed steady increase in the validation accuracy. Both training and validation loss have also been observed to reduce steeply in the initial stages and then stabilize and remain at low levels, indicating efficient optimization and little overfitting. Both the robust convergence and stable learning dynamics, as well as the narrow gap between training and validation measures, confirm the consistency of the learning and EMA curves and the accuracy of the model on the imbalanced ECG dataset.
Figure 7.
Training and validation accuracy and loss curves with EMA smoothing. (a) CNN + BiGRU + Attention Model Accuracy, Loss + EMA/EME; (b) CNN Model Accuracy, Loss + EMA/EME.
Similar to Figure 7b, both the training and validation performance accuracy of the CNN model increase steadily, though at a slower rate than in the initial epochs; the difference between the two finally stabilizes around high values, which indicates successful learning and excellent generalization. The EMA trends are also smoother and more consistent upward, which suggests stable convergence and lower fluctuation in the trend during training. The loss plots of training and validation show that the two loss curves start decreasing sharply in the initial epochs and gradually stabilize at low values as the epochs progress, indicating efficient optimization and minimization of error. The narrow difference between the training and validation measures implies that there is not much overfitting and balanced model learning, whereas the smooth EMA loss curve further suggests a stable training process and consistent performance of the CNN model on the ECG heartbeat classification task.
Table 11 presents the Exponential Moving Average (EMA)-smoothed training and validation performance of all the evaluated models, reported as mean ± standard deviation over five independent runs. EMA smoothing is applied to reduce short-term fluctuations in epoch-wise training curves and provide a clearer representation of convergence behavior. However, since EMA reflects stability within a single run, the inclusion of multiple runs and statistical reporting ensures an assessment of inter-run robustness and reproducibility.
Table 11.
EMA-smoothed training and validation performance of ECG classification models.
The results indicate that hybrid CNN-based architectures consistently achieve higher mean validation accuracy with lower standard deviation, demonstrating both strong performance and stable convergence. The CNN + BiGRU + Attention model demonstrates stable convergence across runs, and its EMA validation accuracy (0.9751 ± 0.0024) and validation loss (0.0929 ± 0.0027) are among the highest. Its low standard deviation indicates that the model is stable across a variety of runs, that is, it is resistant to stochastic fluctuations during training. On the other hand, standalone recurrent models, such as BiLSTM and GRU, exhibit lower mean accuracy and more variability, which means that their learning dynamics are less stable since they do not extract morphological features, only temporal features. Similarly, Transformer and attention-only models have more substantial standard deviations and worse accuracies, suggesting that they are sensitive to the magnitude of the data and have worse inductive bias in the structure of ECG waveforms. The results in the table suggest that combining convolutional feature extraction, temporal modeling, and attention mechanisms can improve predictive performance while also contributing to more stable training behavior under the evaluated conditions. EMA-based smoothing (capturing intra-run convergence) and statistical analysis across multiple runs (capturing inter-run variability) provide a more comprehensive view of model consistency.
Figure 8 presents the calibration behavior of the evaluated models, illustrating the alignment between the predicted probabilities and actual outcomes in ECG heartbeat classification. While calibration metrics provide insight into probabilistic consistency, their interpretation is limited to controlled experimental conditions and may not fully generalize to real-world clinical environments. Expected Calibration Error (ECE = 0.1023) shows that the degree of calibration is moderate, as the accuracy of the predicted probabilities is consistent with the observed accuracy; however, there are still certain deviations within the confidence limits. This is particularly noticeable in uneven ECG data, with minority classes of arrhythmias potentially showing over-confidence and under-confidence because of small sample sizes and similarities in the morphologies of waveforms. Maximum Calibration Error (MCE = 0.1831) is the highest deviation between the predicted confidence and empirical accuracy, and it takes the form of local calibration errors in certain areas of the probability space. These anomalies are more likely to be related to problematic and non-homogeneous classes, like Fusion and Supraventricular beats, in which morphological overlap complicates classification. The Brier Score (0.0417) is low, indicating that there is a small mean squared error between the predicted probabilities and the true labels. This suggests that the model’s probability estimates are quite accurate and calibrated. Although the low Brier Score indicates good overall probabilistic performance, it should be complemented with ECE and MCE for a full understanding of model performance. The Brier Score is defined as
where is the predicted probability and is the true class indicator. A low Brier Score indicates that the model produces sharp and accurate probability distributions rather than uncertain predictions.
Figure 8.
Calibration and reliability metrics of the fully integrated hybrid model.
Compared to the baseline models evaluated under the same experimental setup, the CNN + BiGRU + Attention model demonstrates reasonably consistent calibration behavior under the evaluated conditions, as reflected by its lower Brier Score and competitive ECE values. Furthermore, its calibration performance remains stable across multiple runs, indicating that the observed improvements are not due to random variation. From a research perspective, the low Brier Score paired with a moderate ECE is not only indicative of an accurate framework but also probabilistically accuracy, which is useful in interpreting model confidence in controlled evaluation settings where confidence calibration has a direct impact on clinical trust. Moreover, the relatively controlled MCE means that severe miscalibration is limited, and the uncertainty measure remains stable in the case of noisy signals and class imbalance.
Since calibration metrics are evaluated for a single model, the analysis focuses on interpreting the quality of its probabilistic predictions rather than performing a comparative assessment across architectures. This limits the ability to draw conclusions about relative calibration performance; therefore, the results should be interpreted as indicative rather than evidence of superiority over baseline models.
Table 12 presents a detailed comparison of ECG heartbeat classification techniques by distinctly distinguishing between the reproduced models, the evaluated hybrid model and literature reported results, thus addressing the issue of fairness and reproducibility.
Table 12.
Comparison of ECG heartbeat classification methods under unified and reported settings.
The models implemented in this paper, including CNN, CNN + BiLSTM, CNN + BiGRU, TCN, Transformer, and CNN + SE + Temporal Attention, were all trained and evaluated using the same data preparation pipeline, with a fixed train–test ratio of ECG heartbeat data, ensuring a fair and controlled experimental setting. This combined setup eliminates variability because the data partitioning, training process and performance metrics allow for a just comparison of model performance. Here, the baseline CNN model attains the most accurate level (98.44%), mainly because it is quite effective at capturing the prevailing morphological modes in an unbalanced dataset, whereas the CNN + BiGRU + Attention model attains competitive accuracy (97.80%) with enhanced balanced learning properties, as indicated in the prior F1-score analysis. By contrast, the bottom part of the table contains exemplary recent works, like Zheng et al. (2024) [19], Raza et al. (2023) [22], Jahangir et al. (2025) [24], and Elsheikhy et al. (2025) [27], with their findings being directly copied from their original sources. The datasets (e.g., wearable ECG, MIT-BIH, or multi-dataset setting) and preprocessing and evaluation protocols differ between these studies and thus are not directly comparable with reproduced results. However, they are included to give a wider perspective on the different accuracies that have been reported in the recent literature. The explicit separation of reproduced and literature-based results in the table achieves methodological transparency. Although a reviewer may be convinced that the comparison conditions are unclear, the results show that the evaluated hybrid model competes competently with both rigorously tested baselines and state-of-the-art practices.
It is important to note that these findings are based on a pre-segmented and preprocessed dataset with fixed-length heartbeat inputs. Therefore, the observed improvements in calibration and class-wise performance reflect model behavior under controlled experimental conditions; they do not directly imply robustness in real-world clinical environments.
5. Conclusions
This paper presents a reliability-driven deep learning model of multi-class ECG heartbeat classification using a highly imbalanced and morphologically diverse dataset. It shows that different models perform differently depending on the evaluation criteria. While CNN achieves the highest accuracy, CNN + BiGRU + Attention provides better balance across classes, improved calibration, and more stable performance. Therefore, multiple evaluation metrics have been considered for meaningful ECG classification. In addition, the calibration analysis shows that the proposed framework provides credible confidence estimates, through a low Brier Score and controlled calibration error, which suggests that it can be utilized to provide more plausible decision support systems in controlled experimental conditions.
Despite these results, there are some limitations. The approach is tested on a single benchmark dataset using segmented, pre-determined-length heartbeats, which may not capture real-world ECG data and signals and have varying continuous patterns, patients and noise. Further, there may be class imbalance (such as S and F labels) in the dataset, which may affect the evaluation of the model, despite using macro-level metrics. In addition, the presented framework does not explore post hoc calibration methods or models with uncertainty.
Our future work will address these limitations by evaluating the framework on various datasets with patient-level separation and continuous ECG to get more information on its long-term behavior. Calibration and uncertainty-aware models, such as Bayesian neural networks, Monte Carlo dropout and others, can also be combined to enhance probabilistic reliability in safety-critical scenarios. Finally, a more advanced class imbalance strategy, including focal loss, cost-sensitive learning and data augmentation, such as Generative Adversarial Networks (GANs) to generate ECGs, can also be used to improve the detection of rare classes. To achieve trust in the physical world, explainable AI methods, such as Grad-CAM and attention-based visualization methods for enhancing interpretability in clinical practice, will also be needed. Lastly, efficient and compact edge/wearable-friendly models and extensions to multi-lead ECG analysis, streaming data and other multimodal physiological signals hold the key to more robust and clinically relevant intelligent cardiac monitoring.
Author Contributions
Conceptualization, J.R.; Methodology, J.R.; Software, J.R.; Validation, J.R.; Formal analysis, J.R.; Investigation, J.R.; Writing—review & editing, S.G. and V.M.; Visualization, V.M.; Supervision, S.G. and V.M.; Funding acquisition, S.G. All authors have read and agreed to the published version of the manuscript.
Funding
This research received no external funding.
Institutional Review Board Statement
Not applicable.
Informed Consent Statement
Not applicable.
Data Availability Statement
The data presented in this study are openly available in MIT-BIH Arrhythmia & PTB Diagnostic ECG (https://www.kaggle.com/datasets/shayanfazeli/heartbeat, (accessed on 23 December 2025)).
Conflicts of Interest
The authors declare no conflict of interest.
References
- Di Cesare, M.; Perel, P.; Taylor, S.; Kabudula, C.; Bixby, H.; Gaziano, T.A.; McGhie, D.V.; Mwangi, J.; Pervan, B.; Narula, J.; et al. The heart of the world. Glob. Heart 2024, 19, 11. [Google Scholar] [CrossRef] [Scilit]
- Cosoli, G.; Spinsante, S.; Scardulla, F.; D’ACquisto, L.; Scalise, L. Wireless ECG and cardiac monitoring systems: State of the art, available commercial devices and useful electronic components. Measurement 2021, 177, 109243. [Google Scholar] [CrossRef] [Scilit]
- Wasimuddin, M.; Elleithy, K.; Abuzneid, A.-S.; Faezipour, M.; Abuzaghleh, O. Stages-based ECG signal analysis from traditional signal processing to machine learning approaches: A survey. IEEE Access 2020, 8, 177782–177803. [Google Scholar] [CrossRef] [Scilit]
- Houssein, E.H.; Hammad, A.; Ali, A.A. Human emotion recognition from EEG-based brain–computer interface using machine learning: A comprehensive review. Neural Comput. Appl. 2022, 34, 12527–12557. [Google Scholar] [CrossRef] [Scilit]
- Prakash, A.J.; Atef, M. A lightweight deep learning approach for patient-specific electrocardiogram beat classification using local and long-term dependencies. Eng. Appl. Artif. Intell. 2025, 152, 110754. [Google Scholar]
- Kolhar, M.; Kazi, R.N.A.; Mohapatra, H.; Al Rajeh, A.M. AI-driven real-time classification of ECG signals for cardiac monitoring using i-AlexNet architecture. Diagnostics 2024, 14, 1344. [Google Scholar]
- Koul, A.; Bawa, R.K.; Kumar, Y. Artificial intelligence techniques to predict the airway disorders illness: A systematic review. Arch. Comput. Methods Eng. 2023, 30, 831–864. [Google Scholar] [CrossRef] [Scilit]
- Gupta, U.; Paluru, N.; Nankani, D.; Kulkarni, K.; Awasthi, N. A comprehensive review on efficient artificial intelligence models for classification of abnormal cardiac rhythms using electrocardiograms. Heliyon 2024, 10, e26787. [Google Scholar] [CrossRef] [Scilit]
- Ye, Y.; Chipusu, K.; Ashraf, M.A.; Ding, B.; Huang, Y.; Huang, J. Hybrid CNN-BLSTM architecture for classification and detection of arrhythmia in ECG signals. Sci. Rep. 2025, 15, 34510. [Google Scholar] [CrossRef] [Scilit]
- Singh, P.; Sharma, A. Interpretation and classification of arrhythmia using deep convolutional network. IEEE Trans. Instrum. Meas. 2022, 71, 1–12. [Google Scholar] [CrossRef] [Scilit]
- Lee, S.-Y.; Su, P.-H.; Hung, Y.-W.; Lee, I.-P.; Li, S.-J.; Chen, J.-Y. Motion artifact reduction algorithm for wearable electrocardiogram monitoring systems. IEEE Trans. Consum. Electron. 2023, 69, 533–547. [Google Scholar] [CrossRef] [Scilit]
- Ádám, N.; Val’ko, D.; Balogh, Z.; Madoš, B.; Hurtuk, J. Comparative evaluation of filtration techniques for ECG signal denoising with emphasis on stationary wavelet transform. Sci. Rep. 2025, 15, 42514. [Google Scholar] [CrossRef] [Scilit]
- Chourasiya, L.; Lillohre, U.K.; Pandey, A.K.; Simaiya, S.; Hussien, S.A.; Ghith, E.S.; Khan, M. Enhancing healthcare classification with hybrid multimedia data processing and deep learning TNBO FCNN approach in IoT-enabled environments. Sci. Rep. 2025, 16, 3286. [Google Scholar] [CrossRef] [Scilit]
- Chattopadhyay, A.; Mishra, S.; González-Briones, A. Integration of machine learning and IoT in healthcare domain. In Hybrid Artificial Intelligence and IoT in Healthcare; Springer: Singapore, 2021; pp. 223–244. [Google Scholar]
- Palanisamy, S.; Thangaraju, V.; Kandasamy, J.; Salau, A.O. Towards precision in IoT-based healthcare systems: A hybrid optimized framework for big data classification. J. Big Data 2025, 12, 190. [Google Scholar] [CrossRef] [Scilit]
- Bai, X.; Dong, X.; Li, Y.; Liu, R.; Zhang, H. A hybrid deep learning network for automatic diagnosis of cardiac arrhythmia based on 12-lead ECG. Sci. Rep. 2024, 14, 24441. [Google Scholar] [CrossRef] [Scilit]
- Ansari, Y.; Mourad, O.; Qaraqe, K.; Serpedin, E. Deep learning for ECG Arrhythmia detection and classification: An overview of progress for period 2017–2023. Front. Physiol. 2023, 14, 1246746. [Google Scholar] [CrossRef] [Scilit] [PubMed]
- Xiao, Q.; Lee, K.; Mokhtar, S.A.; Ismail, I.; Pauzi, A.L.b.M.; Zhang, Q.; Lim, P.Y. Deep learning-based ECG arrhythmia classification: A systematic review. Appl. Sci. 2023, 13, 4964. [Google Scholar] [CrossRef] [Scilit]
- Zheng, G.; Lee, S.; Koh, J.; Pahwa, K.; Li, H.; Xu, Z.; Sun, H.; Su, J.; Cho, S.P.; Im, S.I.; et al. Hierarchical deep learning for autonomous multi-label arrhythmia detection and classification on real-world wearable electrocardiogram data. Digit. Health 2024, 10, 20552076241278942. [Google Scholar]
- Guhdar, M.; Mohammed, A.O.; Mstafa, R.J. Advanced deep learning framework for ECG arrhythmia classification using 1D-CNN with attention mechanism. Knowl. Based Syst. 2025, 315, 113301. [Google Scholar] [CrossRef] [Scilit]
- Malleswari, P.N.; Odugu, V.K.; Rao, T.J.V.S.; Aswini, T.V.N.L. Deep learning-assisted arrhythmia classification using 2-D ECG spectrograms. EURASIP J. Adv. Signal Process. 2024, 2024, 104. [Google Scholar] [CrossRef] [Scilit]
- Raza, M.A.; Anwar, M.; Nisar, K.; Ibrahim, A.A.A.; Raza, U.A.; Khan, S.A.; Ahmad, F. Classification of electrocardiogram signals for arrhythmia detection using convolutional neural network. Comput. Mater. Contin. 2023, 77, 3817–3834. [Google Scholar] [CrossRef] [Scilit]
- Reshad, A.I.; Nino, V.; Valero, M. Deep learning-based detection of arrhythmia using ecg signals–a comprehensive review. Vasc. Health Risk Manag. 2025, ume 21, 685–703. [Google Scholar]
- Jahangir, R.; Islam, M.N.; Islam, M.S.; Islam, M.M. ECG-based heart arrhythmia classification using feature engineering and a hybrid stacked machine learning. BMC Cardiovasc. Disord. 2025, 25, 260. [Google Scholar] [CrossRef] [Scilit] [PubMed]
- Prakash, A.J.; Belkacem, A.N.; Elfadel, I.M.; Jelinek, H.F.; Atef, M. Advances in machine and deep learning for ECG beat classification: A systematic review. Front. Digit. Health 2025, 7, 1649923. [Google Scholar]
- Potharaju, S.; Raghavulu, K.V.; Kumar, N.S.P.; Salendra, S.; Tambe, S.N.; Kantipudi, M.V.V.P. Multi-resolution hybrid sliding window approach for ECG arrhythmia detection using deep learning models. Discov. Appl. Sci. 2025, 7, 1412. [Google Scholar] [CrossRef] [Scilit]
- Elsheikhy, D.H.; Hassan, A.S.; Yhiea, N.M.; Fareed, A.M.; Rashed, E.A. Lightweight Deep Learning Architecture for Multi-Lead ECG Arrhythmia Detection. Sensors 2025, 25, 5542. [Google Scholar] [CrossRef] [Scilit]
- Daduvy, A.; Kaza, V.S.; Shuaib, M.; Mohzary, M.; Alam, S.; Sheneamer, A. A multi-scale convolutional LSTM-dense network for robust cardiac arrhythmia classification from ECG signals. Comput. Biol. Med. 2025, 191, 110121. [Google Scholar]
- Fazeli, S. ECG Heartbeat Categorization Dataset; Kaggle: San Francisco, CA, USA, 2018; Available online: https://www.kaggle.com/datasets/shayanfazeli/heartbeat (accessed on 23 December 2025).
- De Waele, T.; Fontaine, J.; De Poorter, E.; Shahid, A. Generalized ECG Heartbeat Classification Using Time-Series Transformers. IEEE Access 2026, 14, 7699–7714. [Google Scholar]
- Berrahou, N.; El Alami, A.; Mesbah, A.; El Alami, R.; Berrahou, A. Arrhythmia detection in inter-patient ECG signals using entropy rate features and RR intervals with CNN architecture. Comput. Methods Biomech. Biomed. Eng. 2026, 29, 103–122. [Google Scholar] [CrossRef] [Scilit]
- Cheng, J.; Zou, Q.; Zhao, Y. ECG signal classification based on deep CNN and BiLSTM. BMC Med. Inform. Decis. Mak. 2021, 21, 365. [Google Scholar] [CrossRef] [Scilit]
- Kłosowski, G.; Rymarczyk, T.; Wójcik, D.; Skowron, S.; Cieplak, T.; Adamkiewicz, P. The use of time-frequency moments as inputs of lstm network for ecg signal classification. Electronics 2020, 9, 1452. [Google Scholar] [CrossRef] [Scilit]
- Ji, W.; Zhu, D. ECG classification exercise health analysis algorithm based on GRU and convolutional neural network. IEEE Access 2024, 12, 59842–59850. [Google Scholar] [CrossRef] [Scilit]
- Hou, B.; Yang, J.; Wang, P.; Yan, R. LSTM-based auto-encoder model for ECG arrhythmias classification. IEEE Trans. Instrum. Meas. 2019, 69, 1232–1240. [Google Scholar] [CrossRef] [Scilit]
- Yao, G.; Mao, X.; Li, N.; Xu, H.; Xu, X.; Jiao, Y.; Ni, J. Interpretation of electrocardiogram heartbeat by CNN and GRU. Comput. Math. Methods Med. 2021, 2021, 6534942. [Google Scholar] [CrossRef] [Scilit] [PubMed]
- He, X.; Hu, C.; Ma, K.; Huang, J.; He, H. Ecg-based arrhythmia classification using discrete wavelet transform and attention-enhanced CNN-BiGRU model. Phys. Eng. Sci. Med. 2025, 48, 1995–2009. [Google Scholar] [CrossRef] [Scilit]
- Kalatehjari, E.; Hosseini, M.M.; Harimi, A.; Abolghasemi, V. Advanced ensemble learning-based CNN-BiLSTM network for cardiovascular disease classification using ECG and PCG signal. Biomed. Signal Process. Control 2025, 108, 107846. [Google Scholar] [CrossRef] [Scilit]
- Ismail, A.R.; Jovanovic, S.; Ramzan, N.; Rabah, H. ECG classification using an optimal temporal convolutional network for remote health monitoring. Sensors 2023, 23, 1697. [Google Scholar] [CrossRef] [Scilit]
- Chopannejad, S.; Roshanpoor, A.; Sadoughi, F. Attention-assisted hybrid CNN-BILSTM-BiGRU model with SMOTE–Tomek method to detect cardiac arrhythmia based on 12-lead electrocardiogram signals. Digit. Health 2024, 10, 20552076241234624. [Google Scholar] [CrossRef] [Scilit]
- Shah, A.; Singh, D.; Mohamed, H.G.; Bharany, S.; Rehman, A.U.; Hussen, S. Electrocardiogram analysis for cardiac arrhythmia classification and prediction through self attention based auto encoder. Sci. Rep. 2025, 15, 9230. [Google Scholar] [CrossRef] [Scilit]
- Wang, S.-T.; Hsu, W.-Y.; Lai, S.-C.; Sheu, M.-H.; Chang, C.-Y.; Hsia, S.-C.; Wang, S.-H. Feature-Shuffle and Multi-Head Attention-Based Autoencoder for Eliminating Electrode Motion Noise in ECG Applications. Sensors 2025, 25, 6322. [Google Scholar] [CrossRef] [Scilit] [PubMed]
- Zhang, J.; Liu, A.; Gao, M.; Chen, X.; Zhang, X.; Chen, X. ECG-based multi-class arrhythmia detection using spatio-temporal attention-based convolutional recurrent neural network. Artif. Intell. Med. 2020, 106, 101856. [Google Scholar] [CrossRef] [Scilit] [PubMed]
- Ikram, S.; Ikram, A.; Singh, H.; Awan, M.D.A.; Naveed, S.; Díez, I.D.l.T.; Gongora, H.F.; Montero, T.C.C. Transformer-based ECG classification for early detection of cardiac arrhythmias. Front. Med. 2025, 12, 1600855. [Google Scholar] [CrossRef] [Scilit] [PubMed]
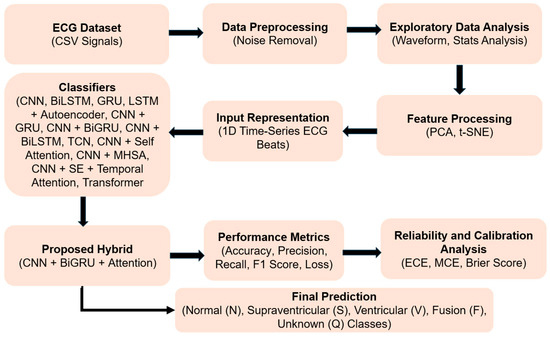
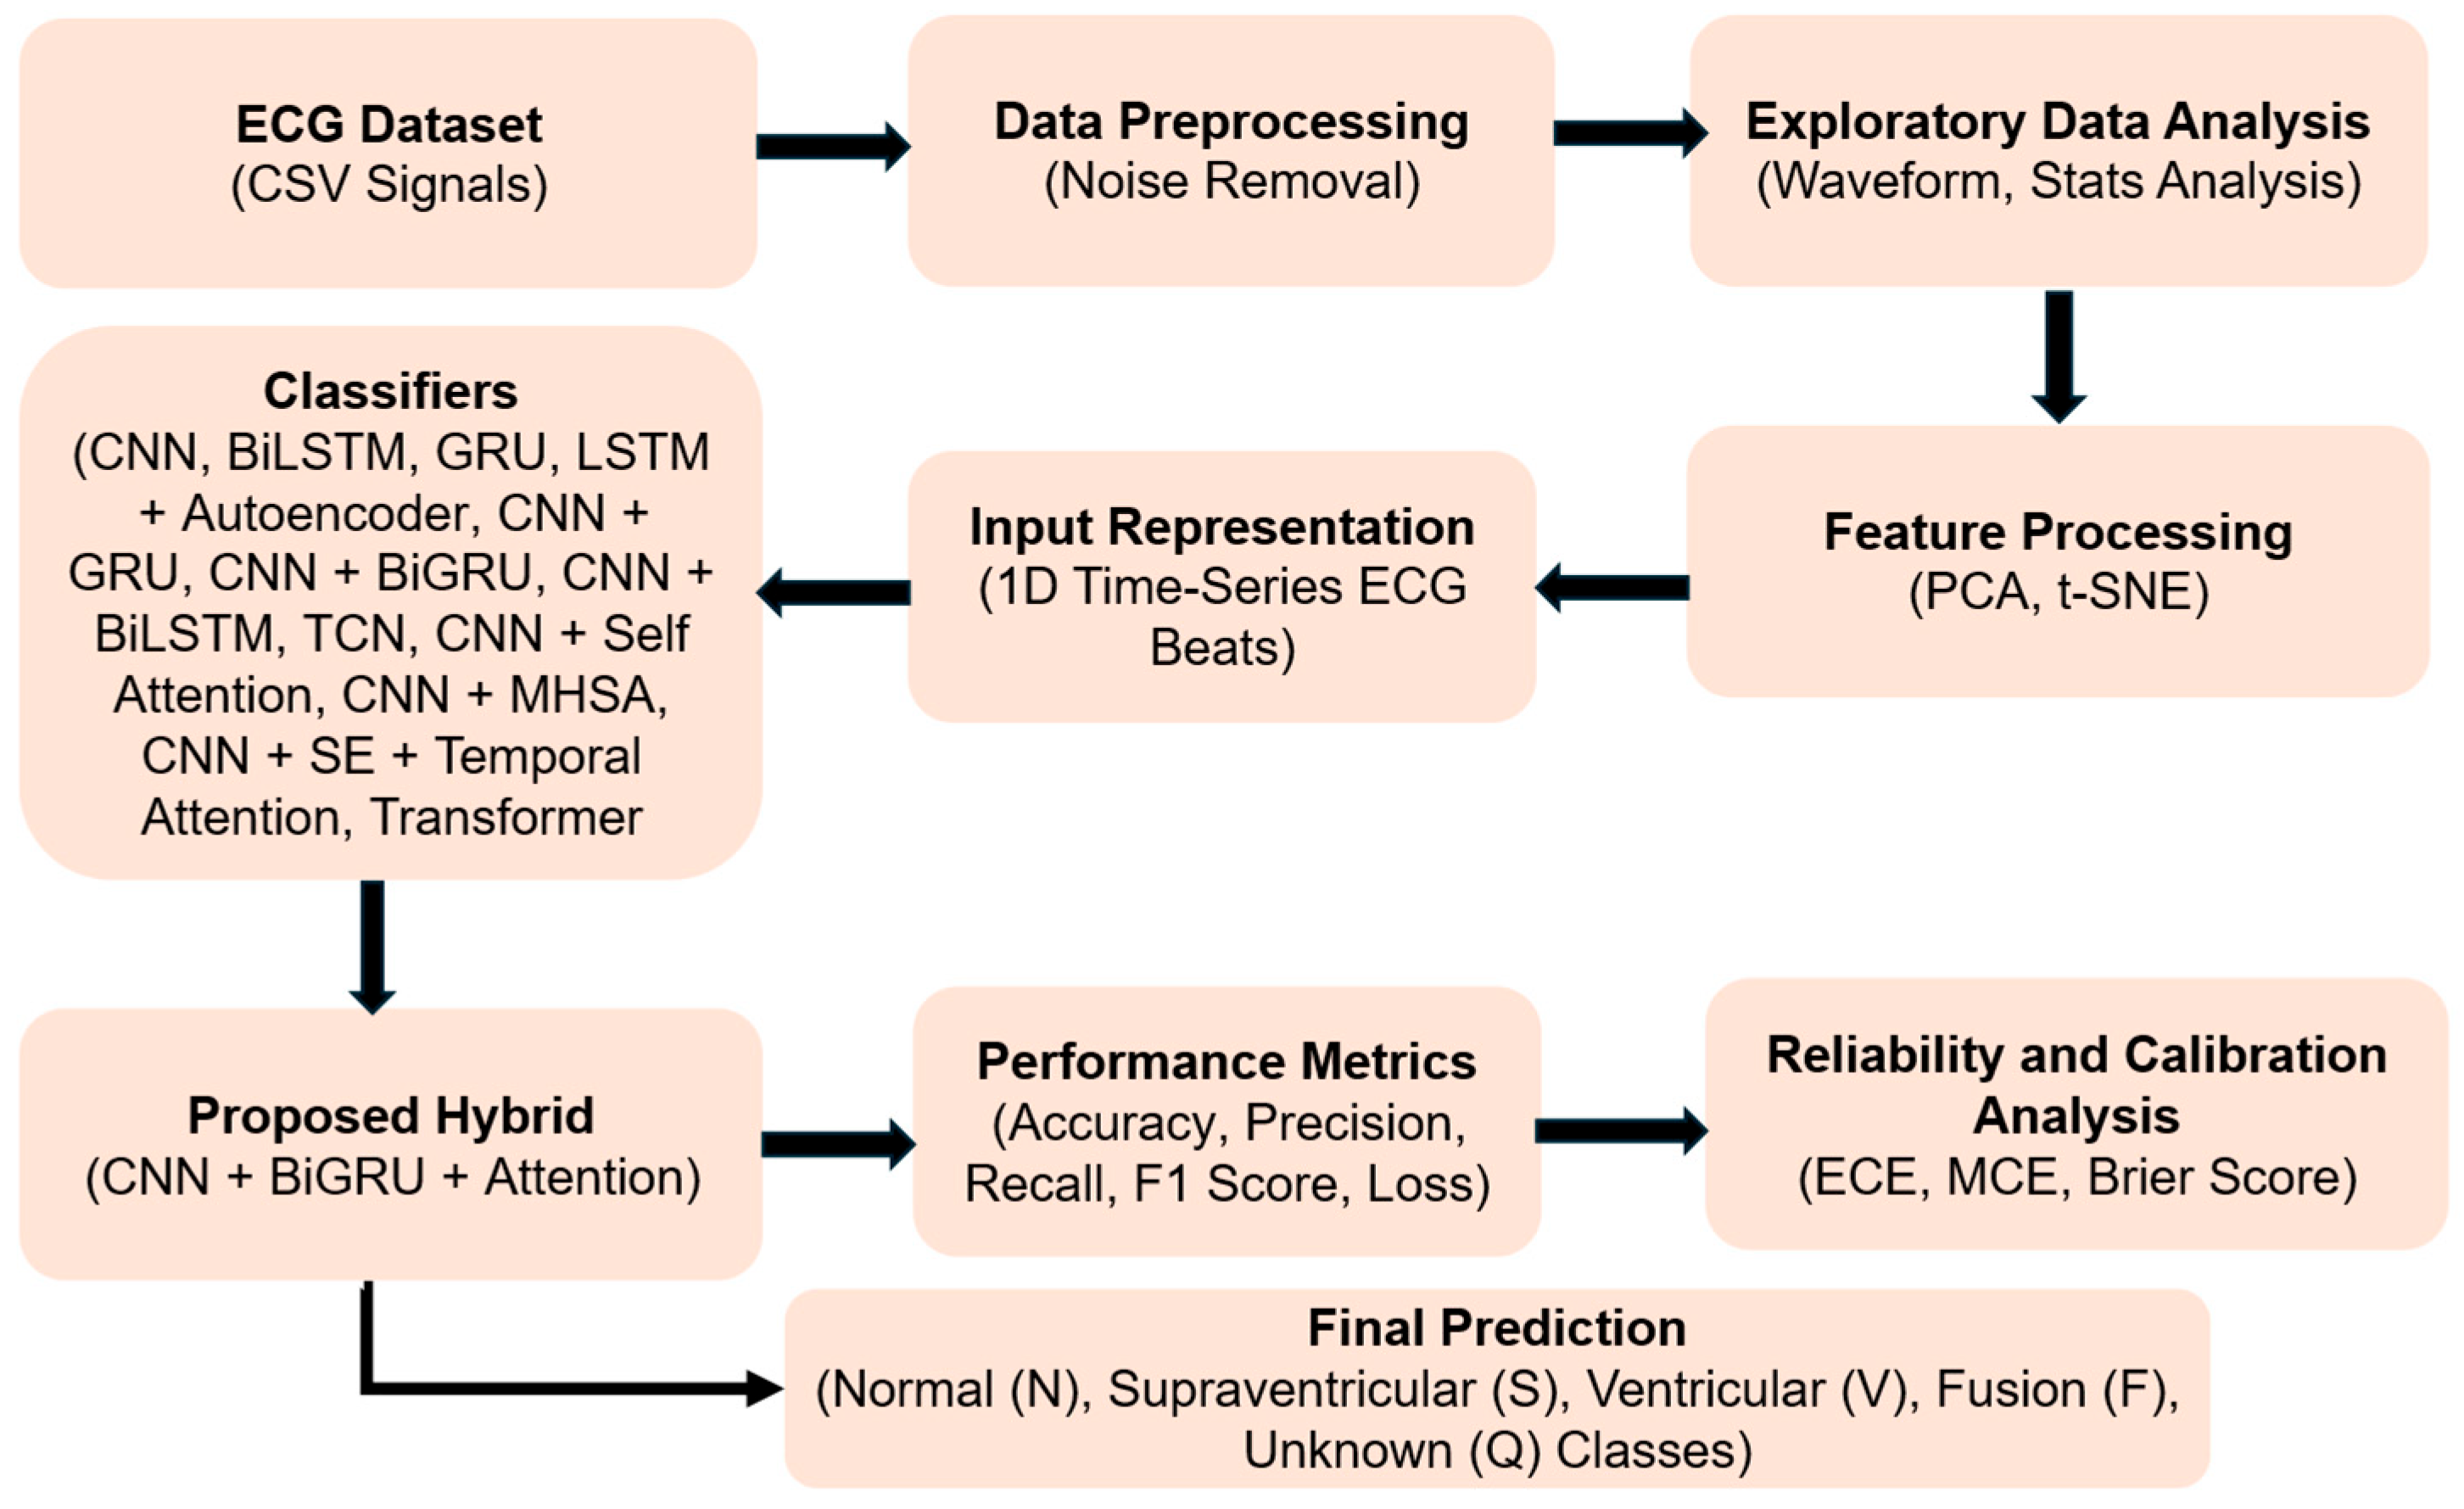
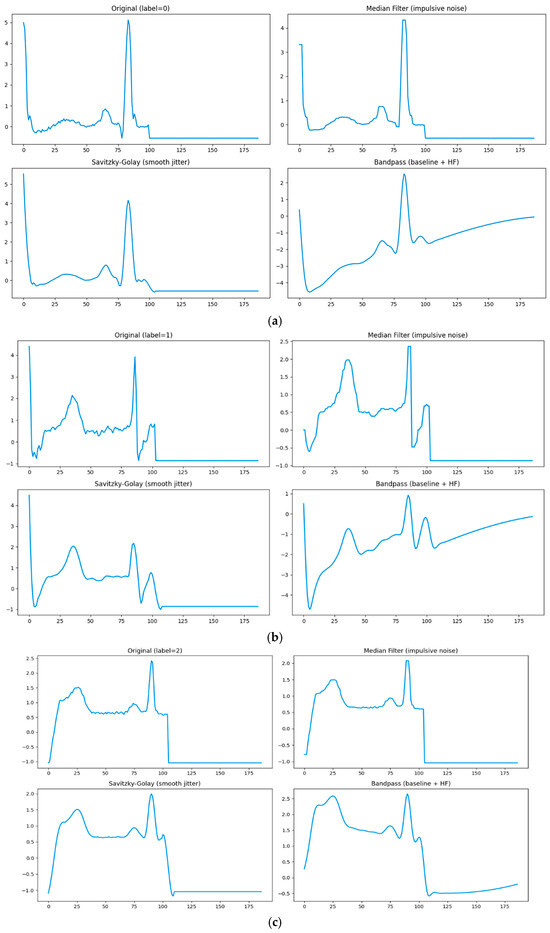
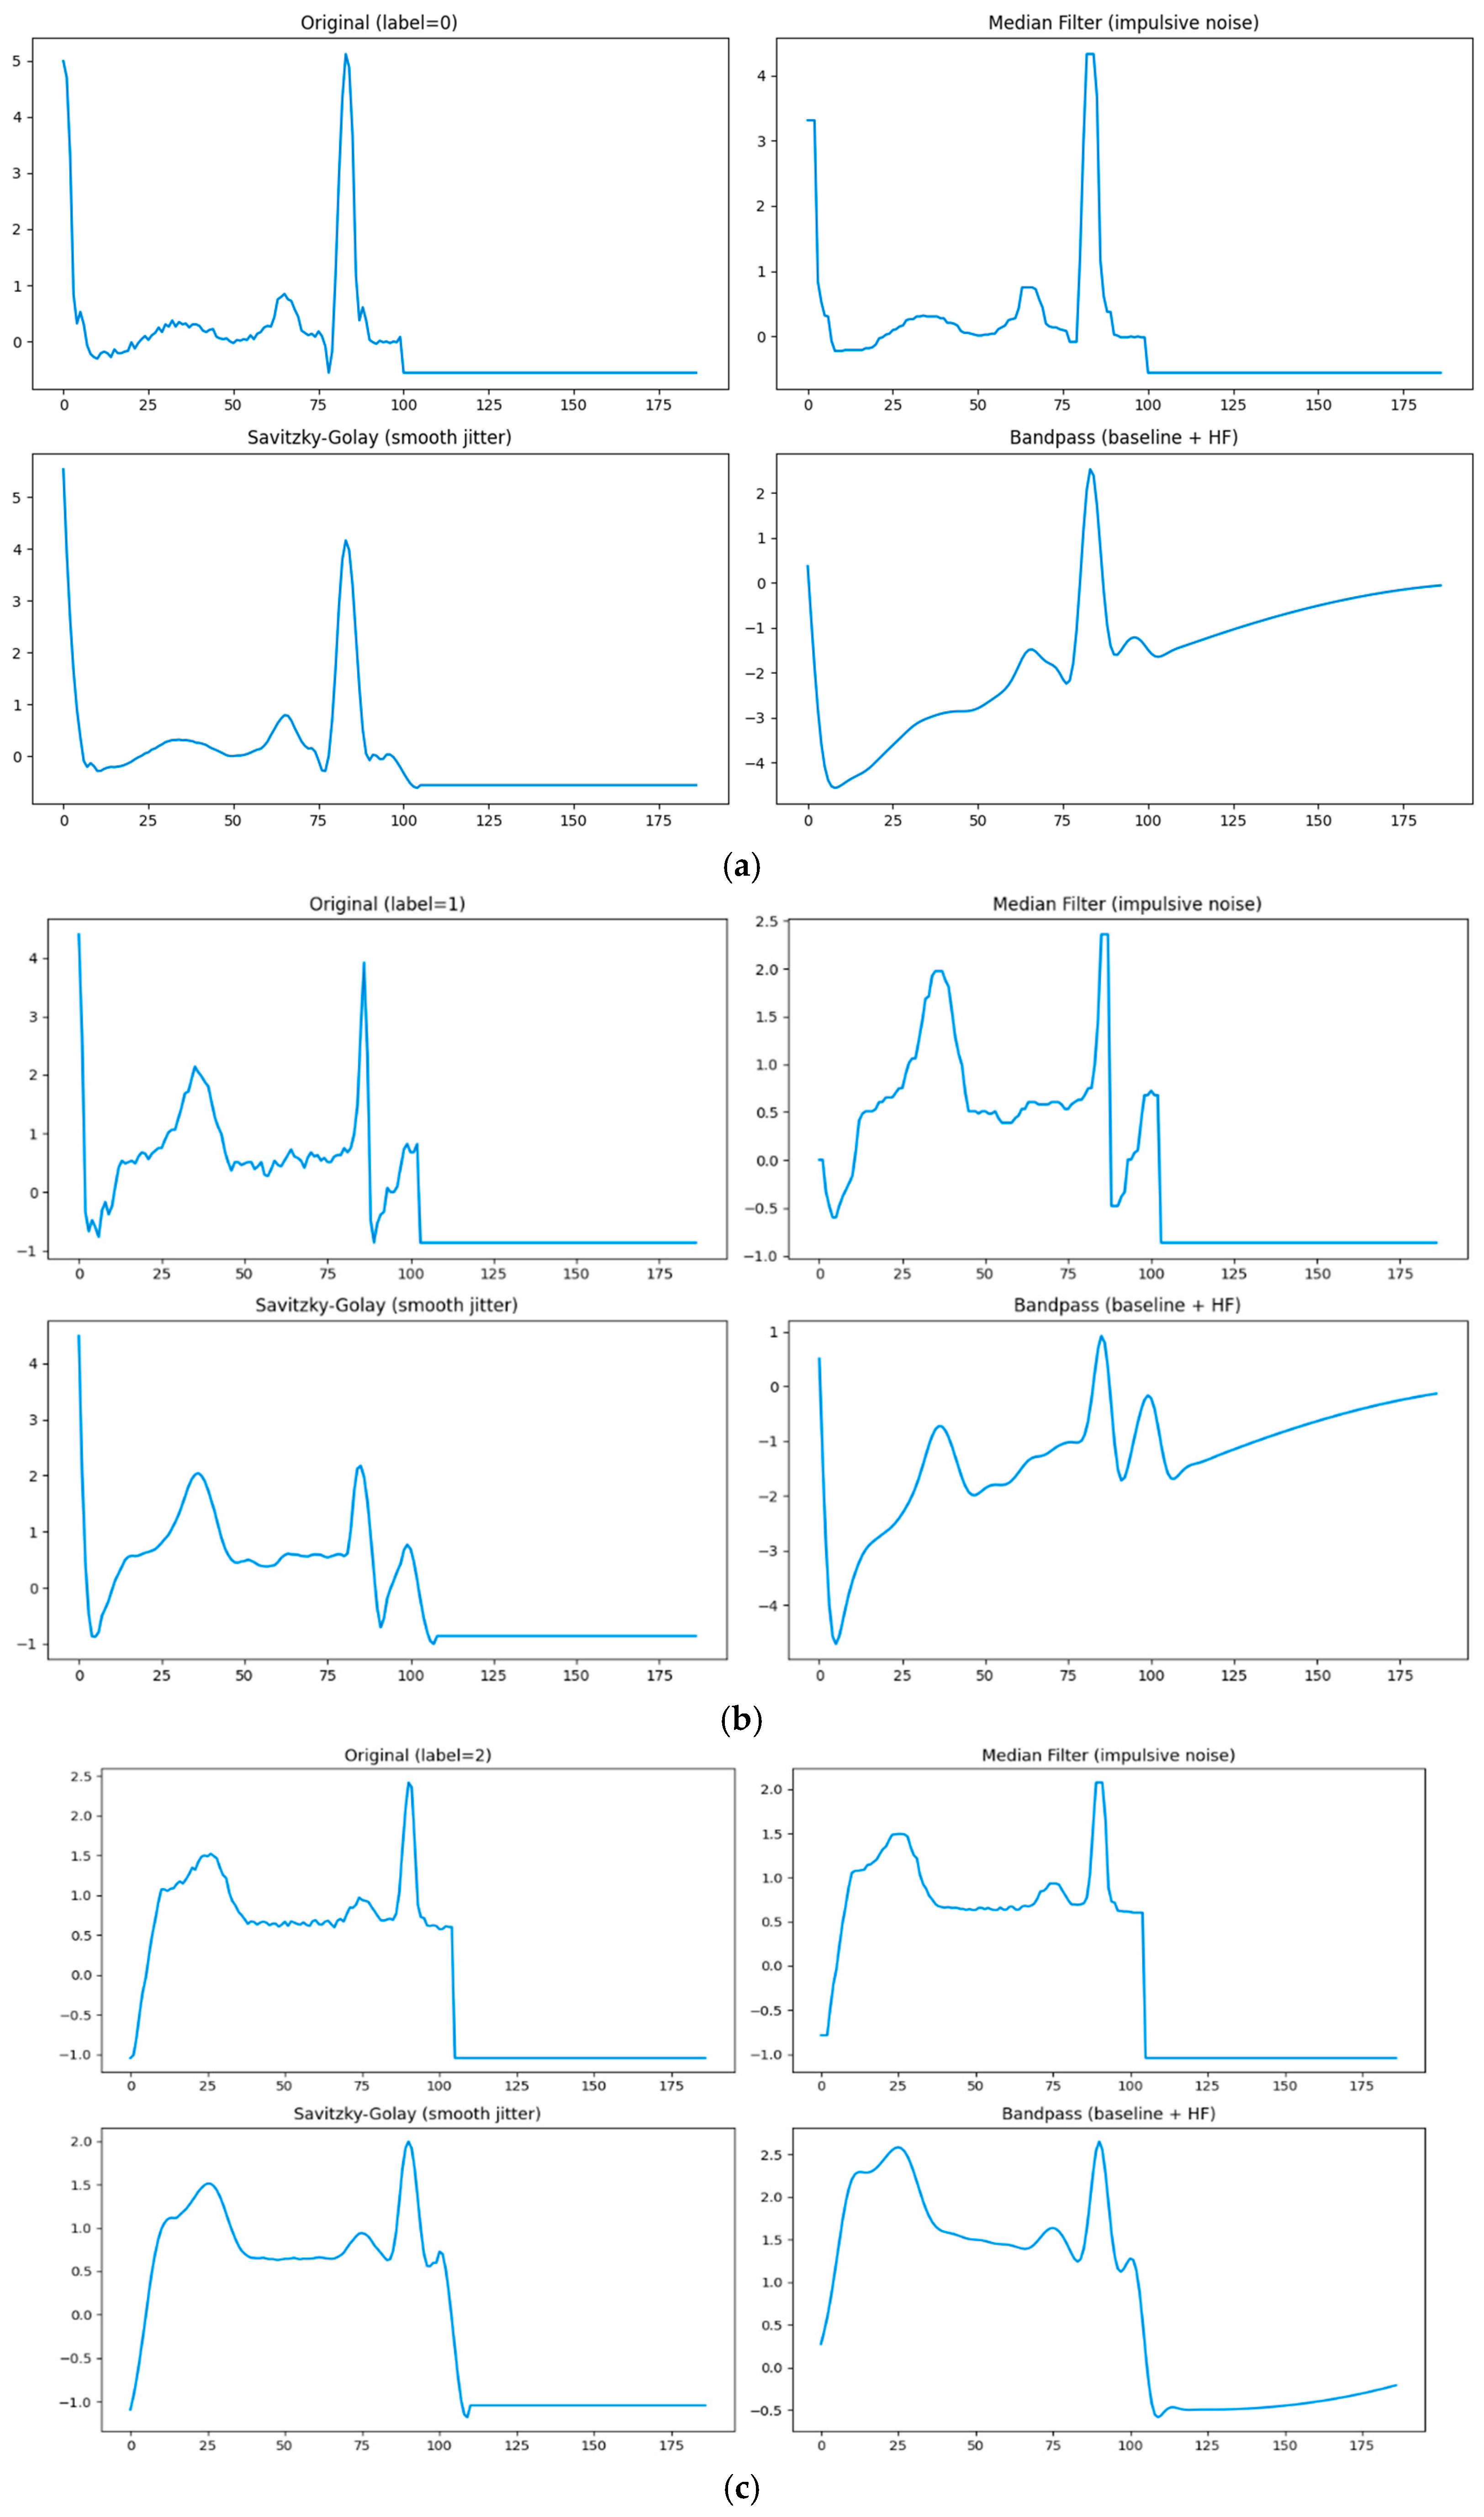
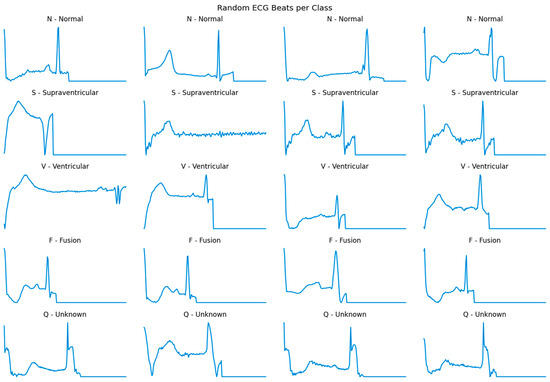
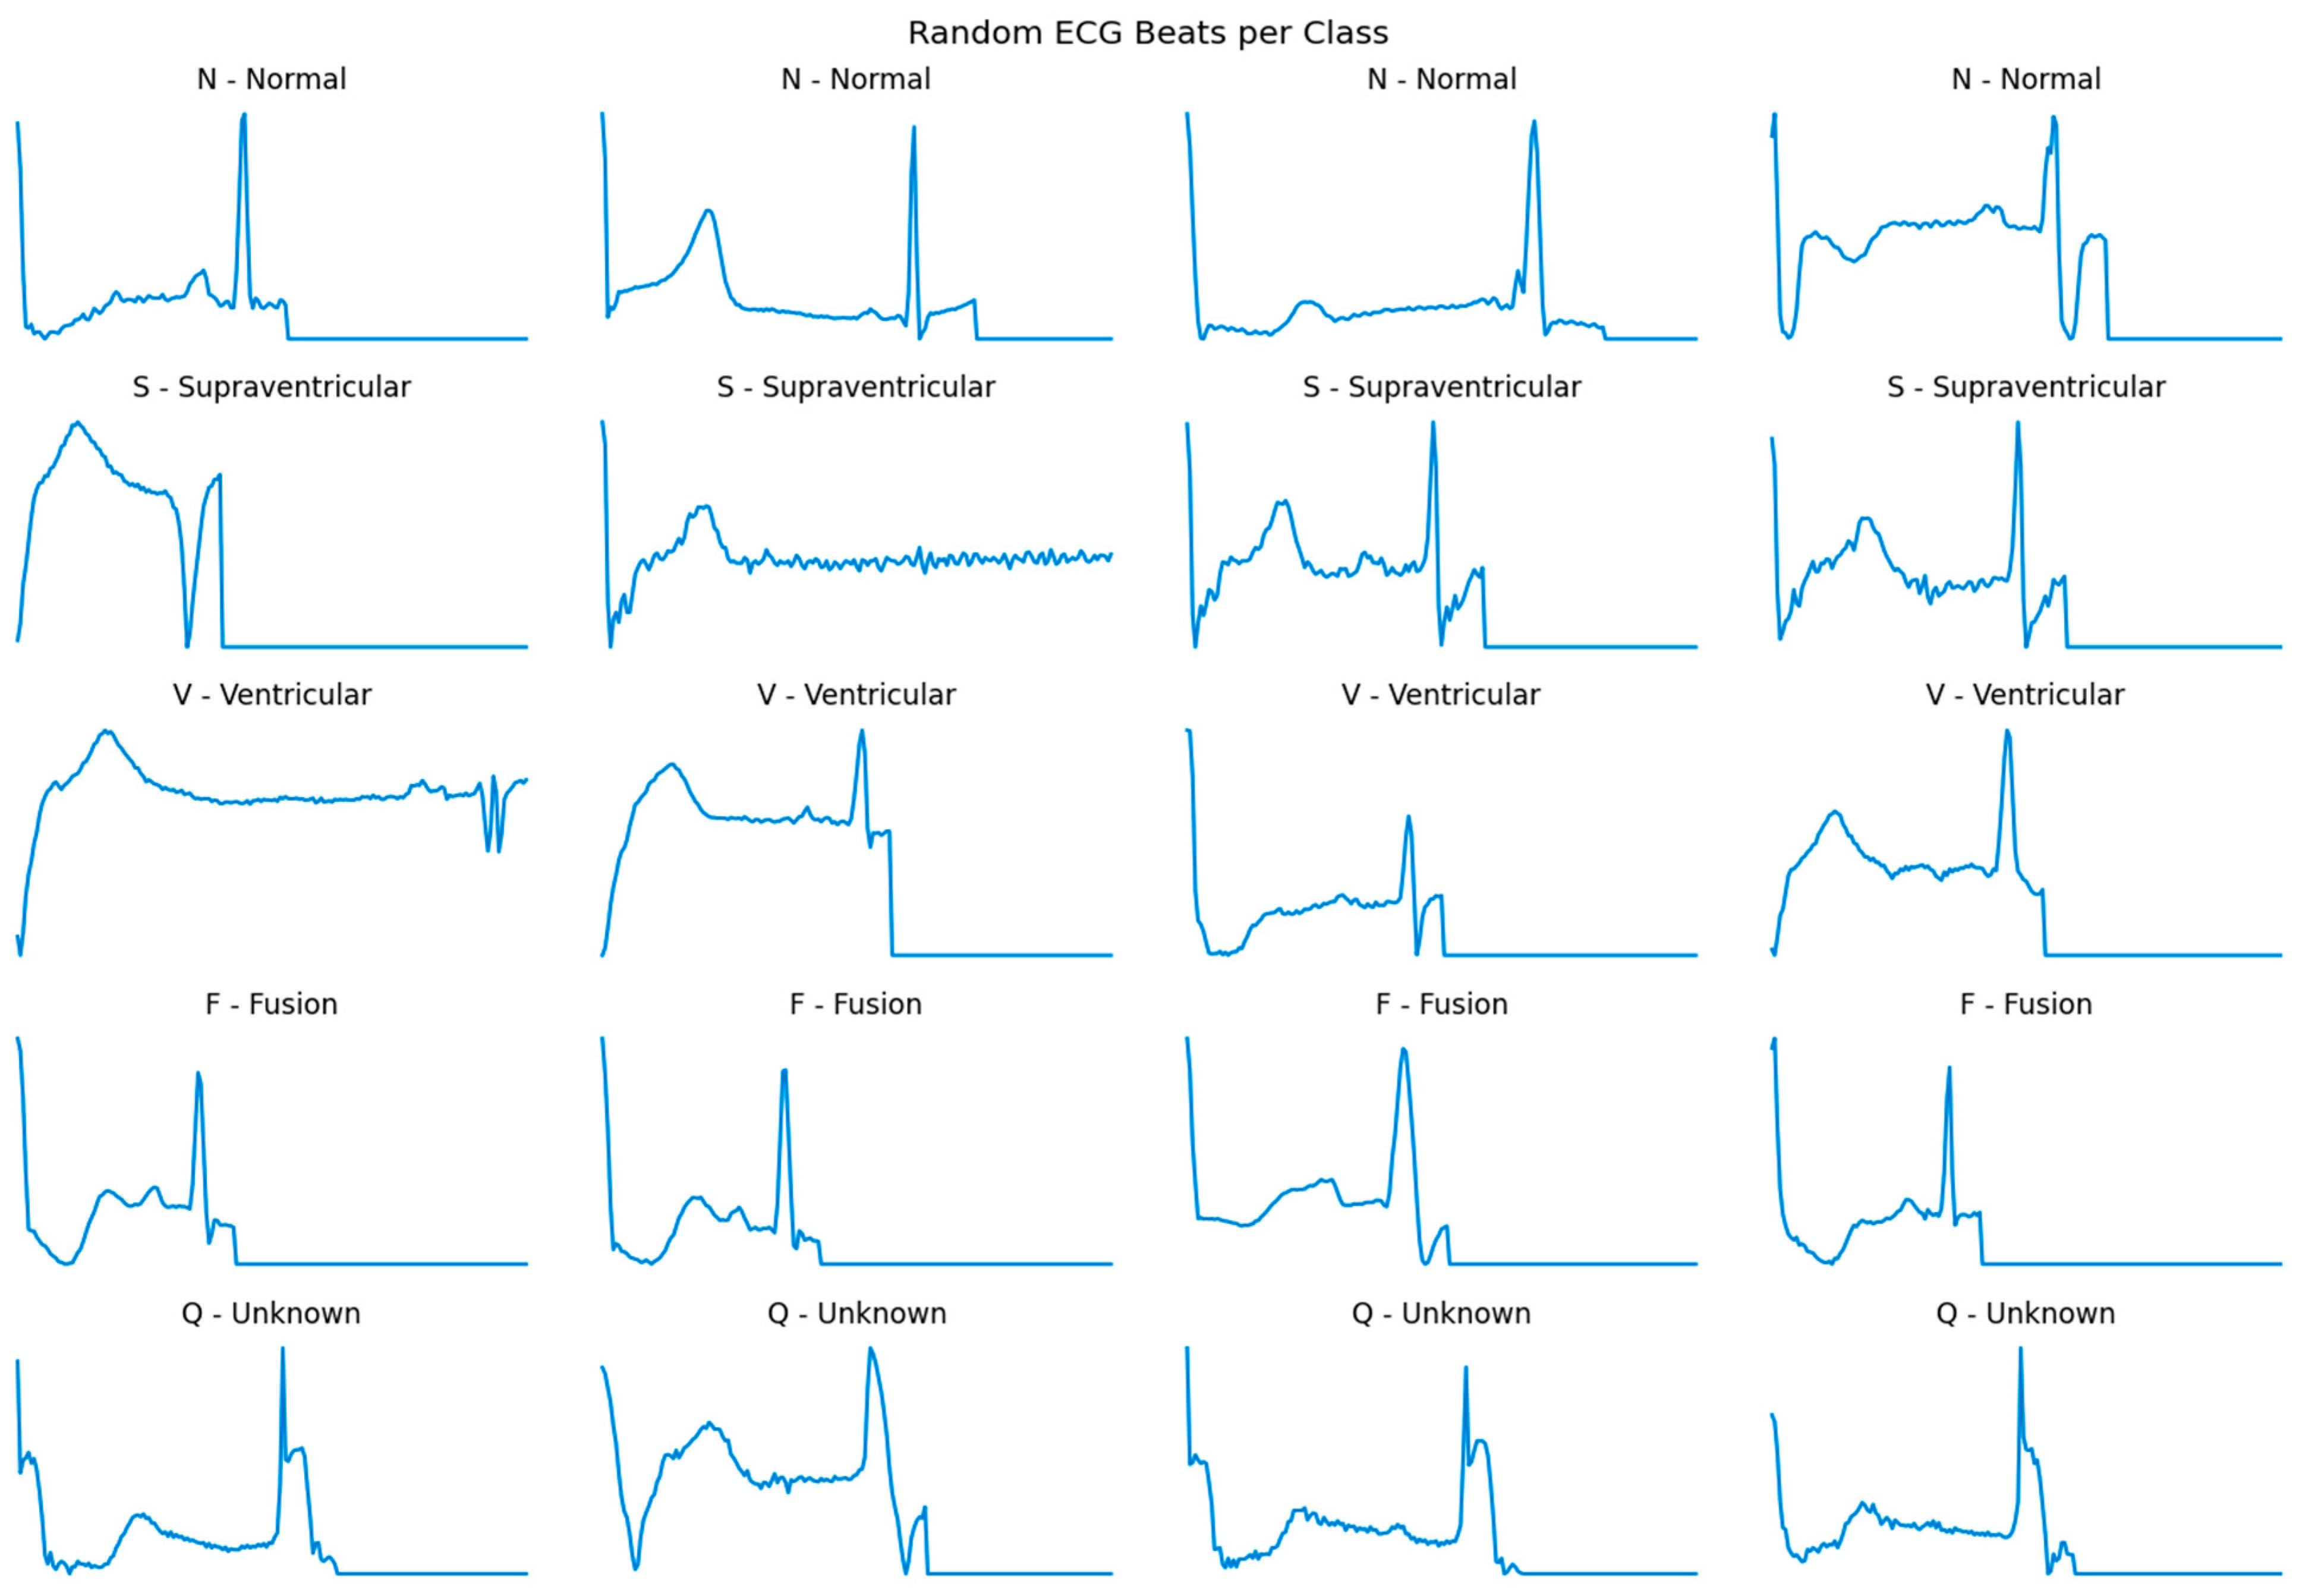
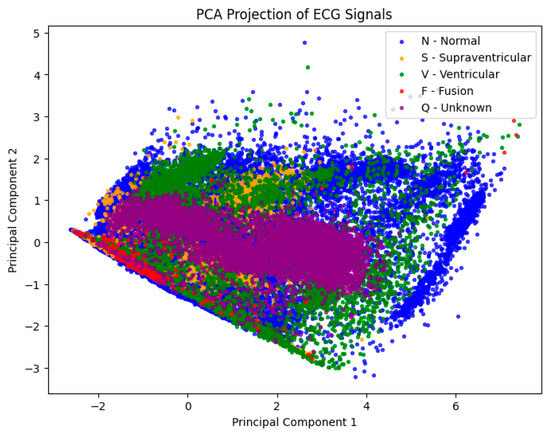
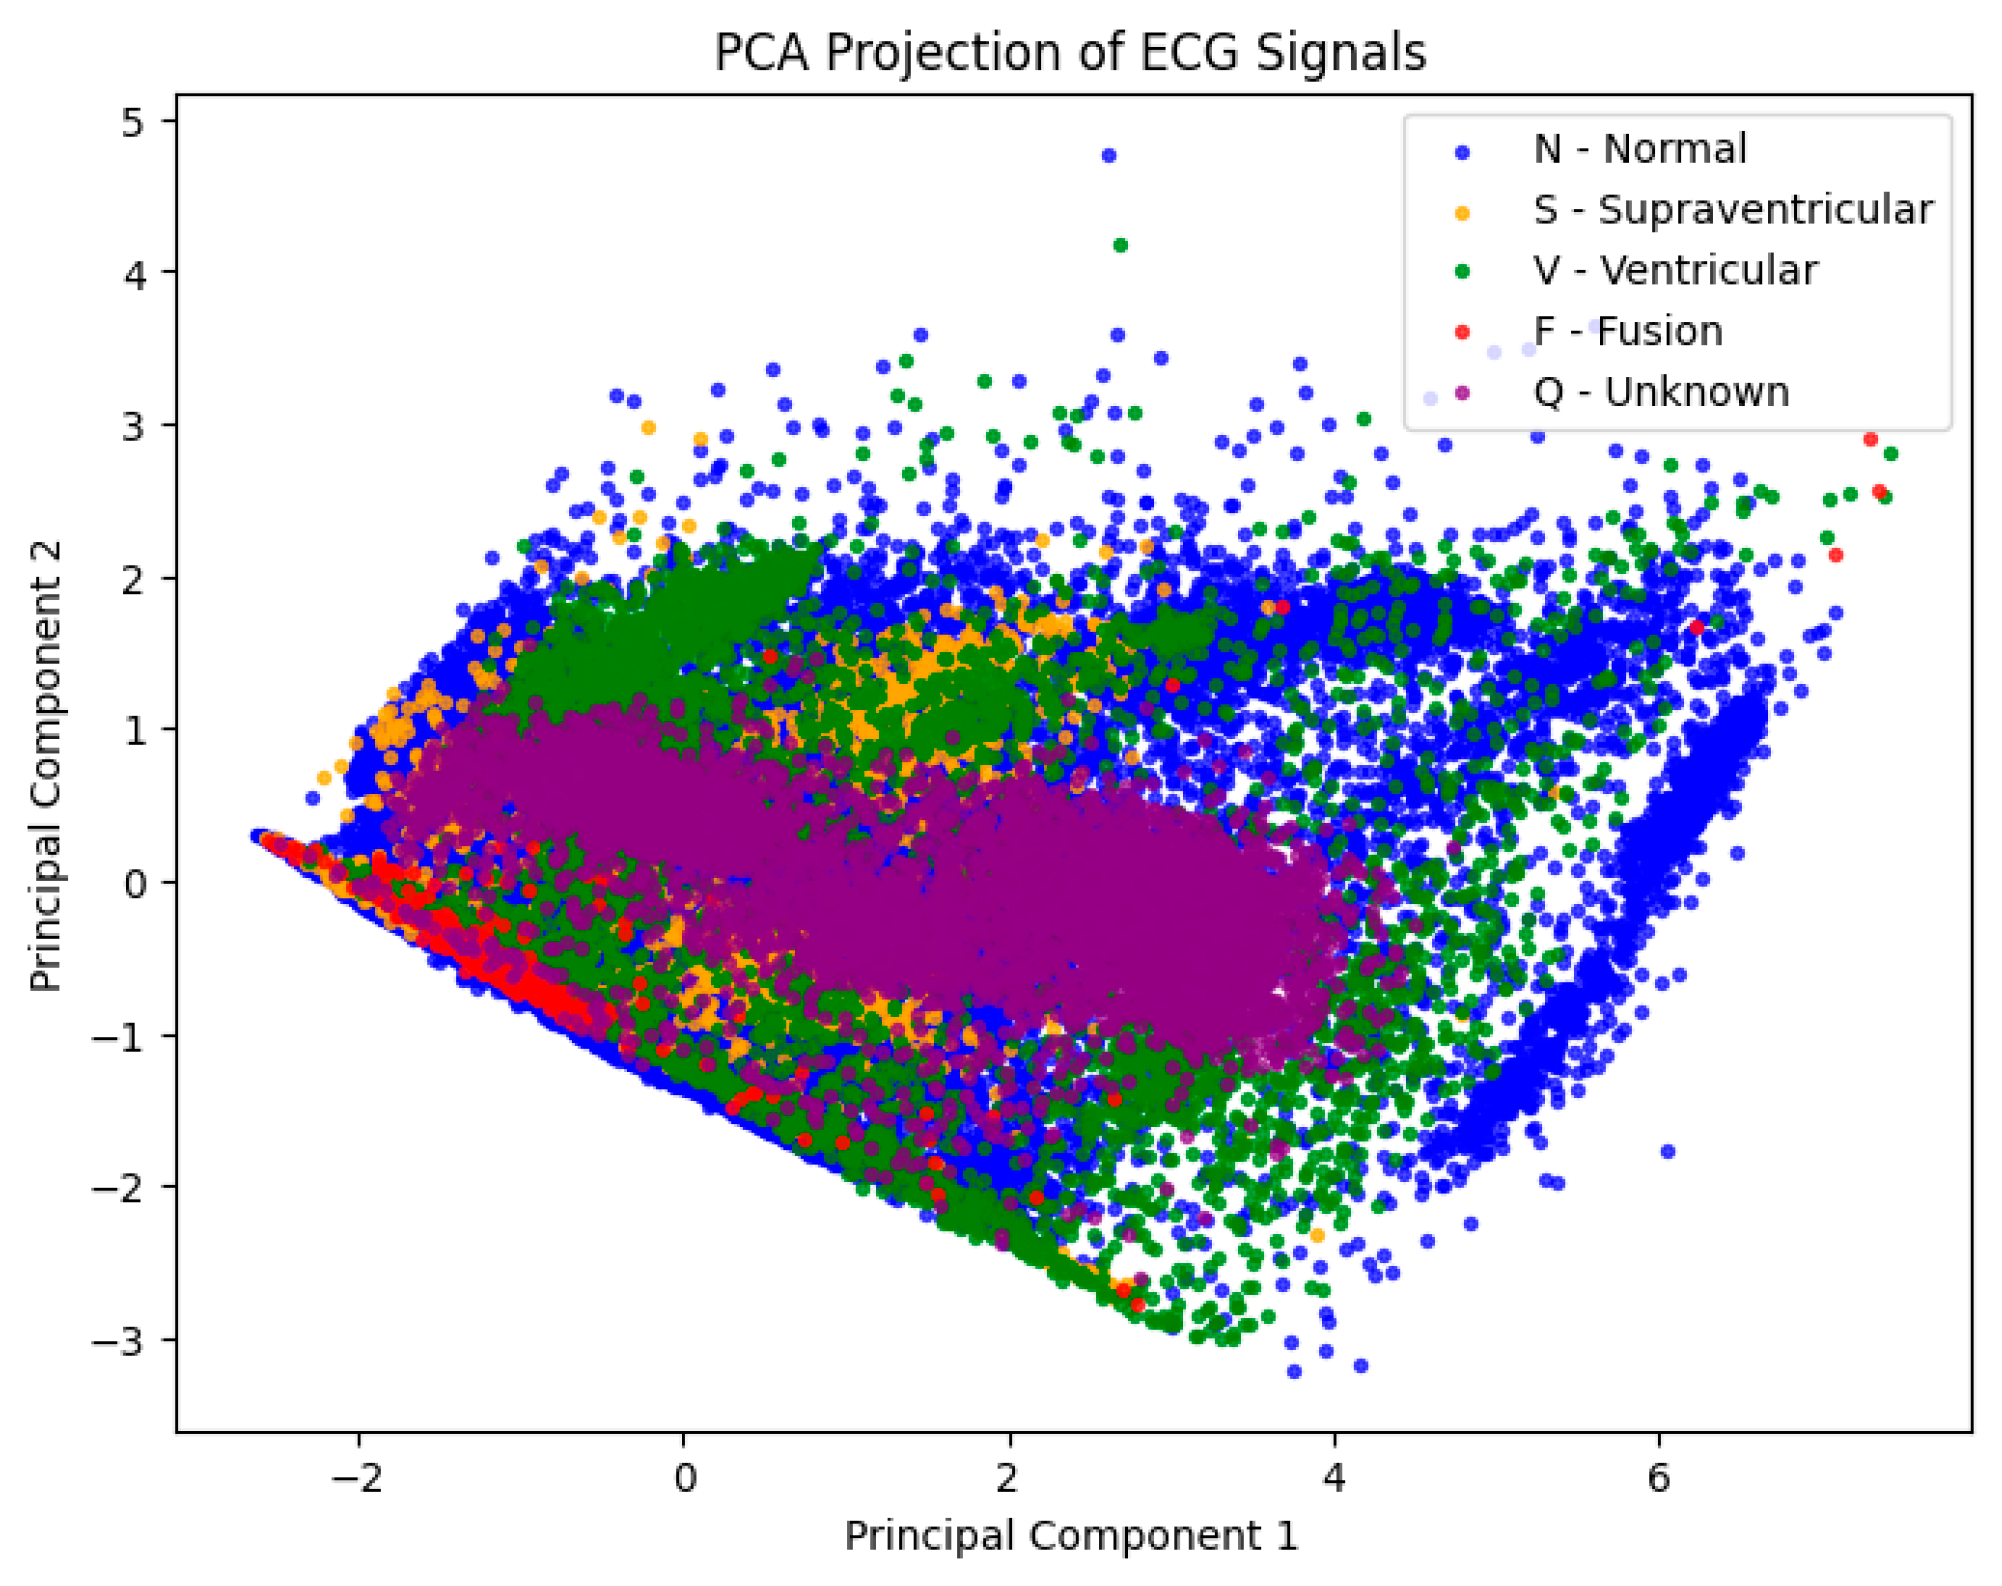
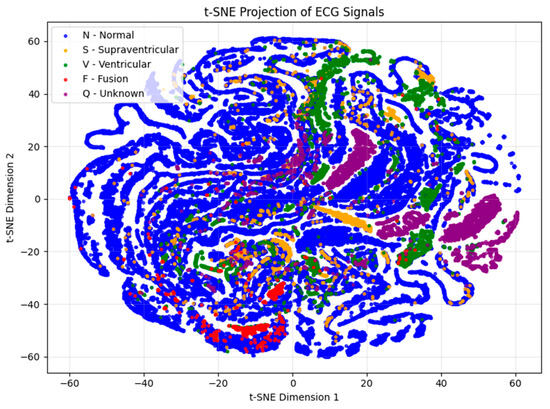
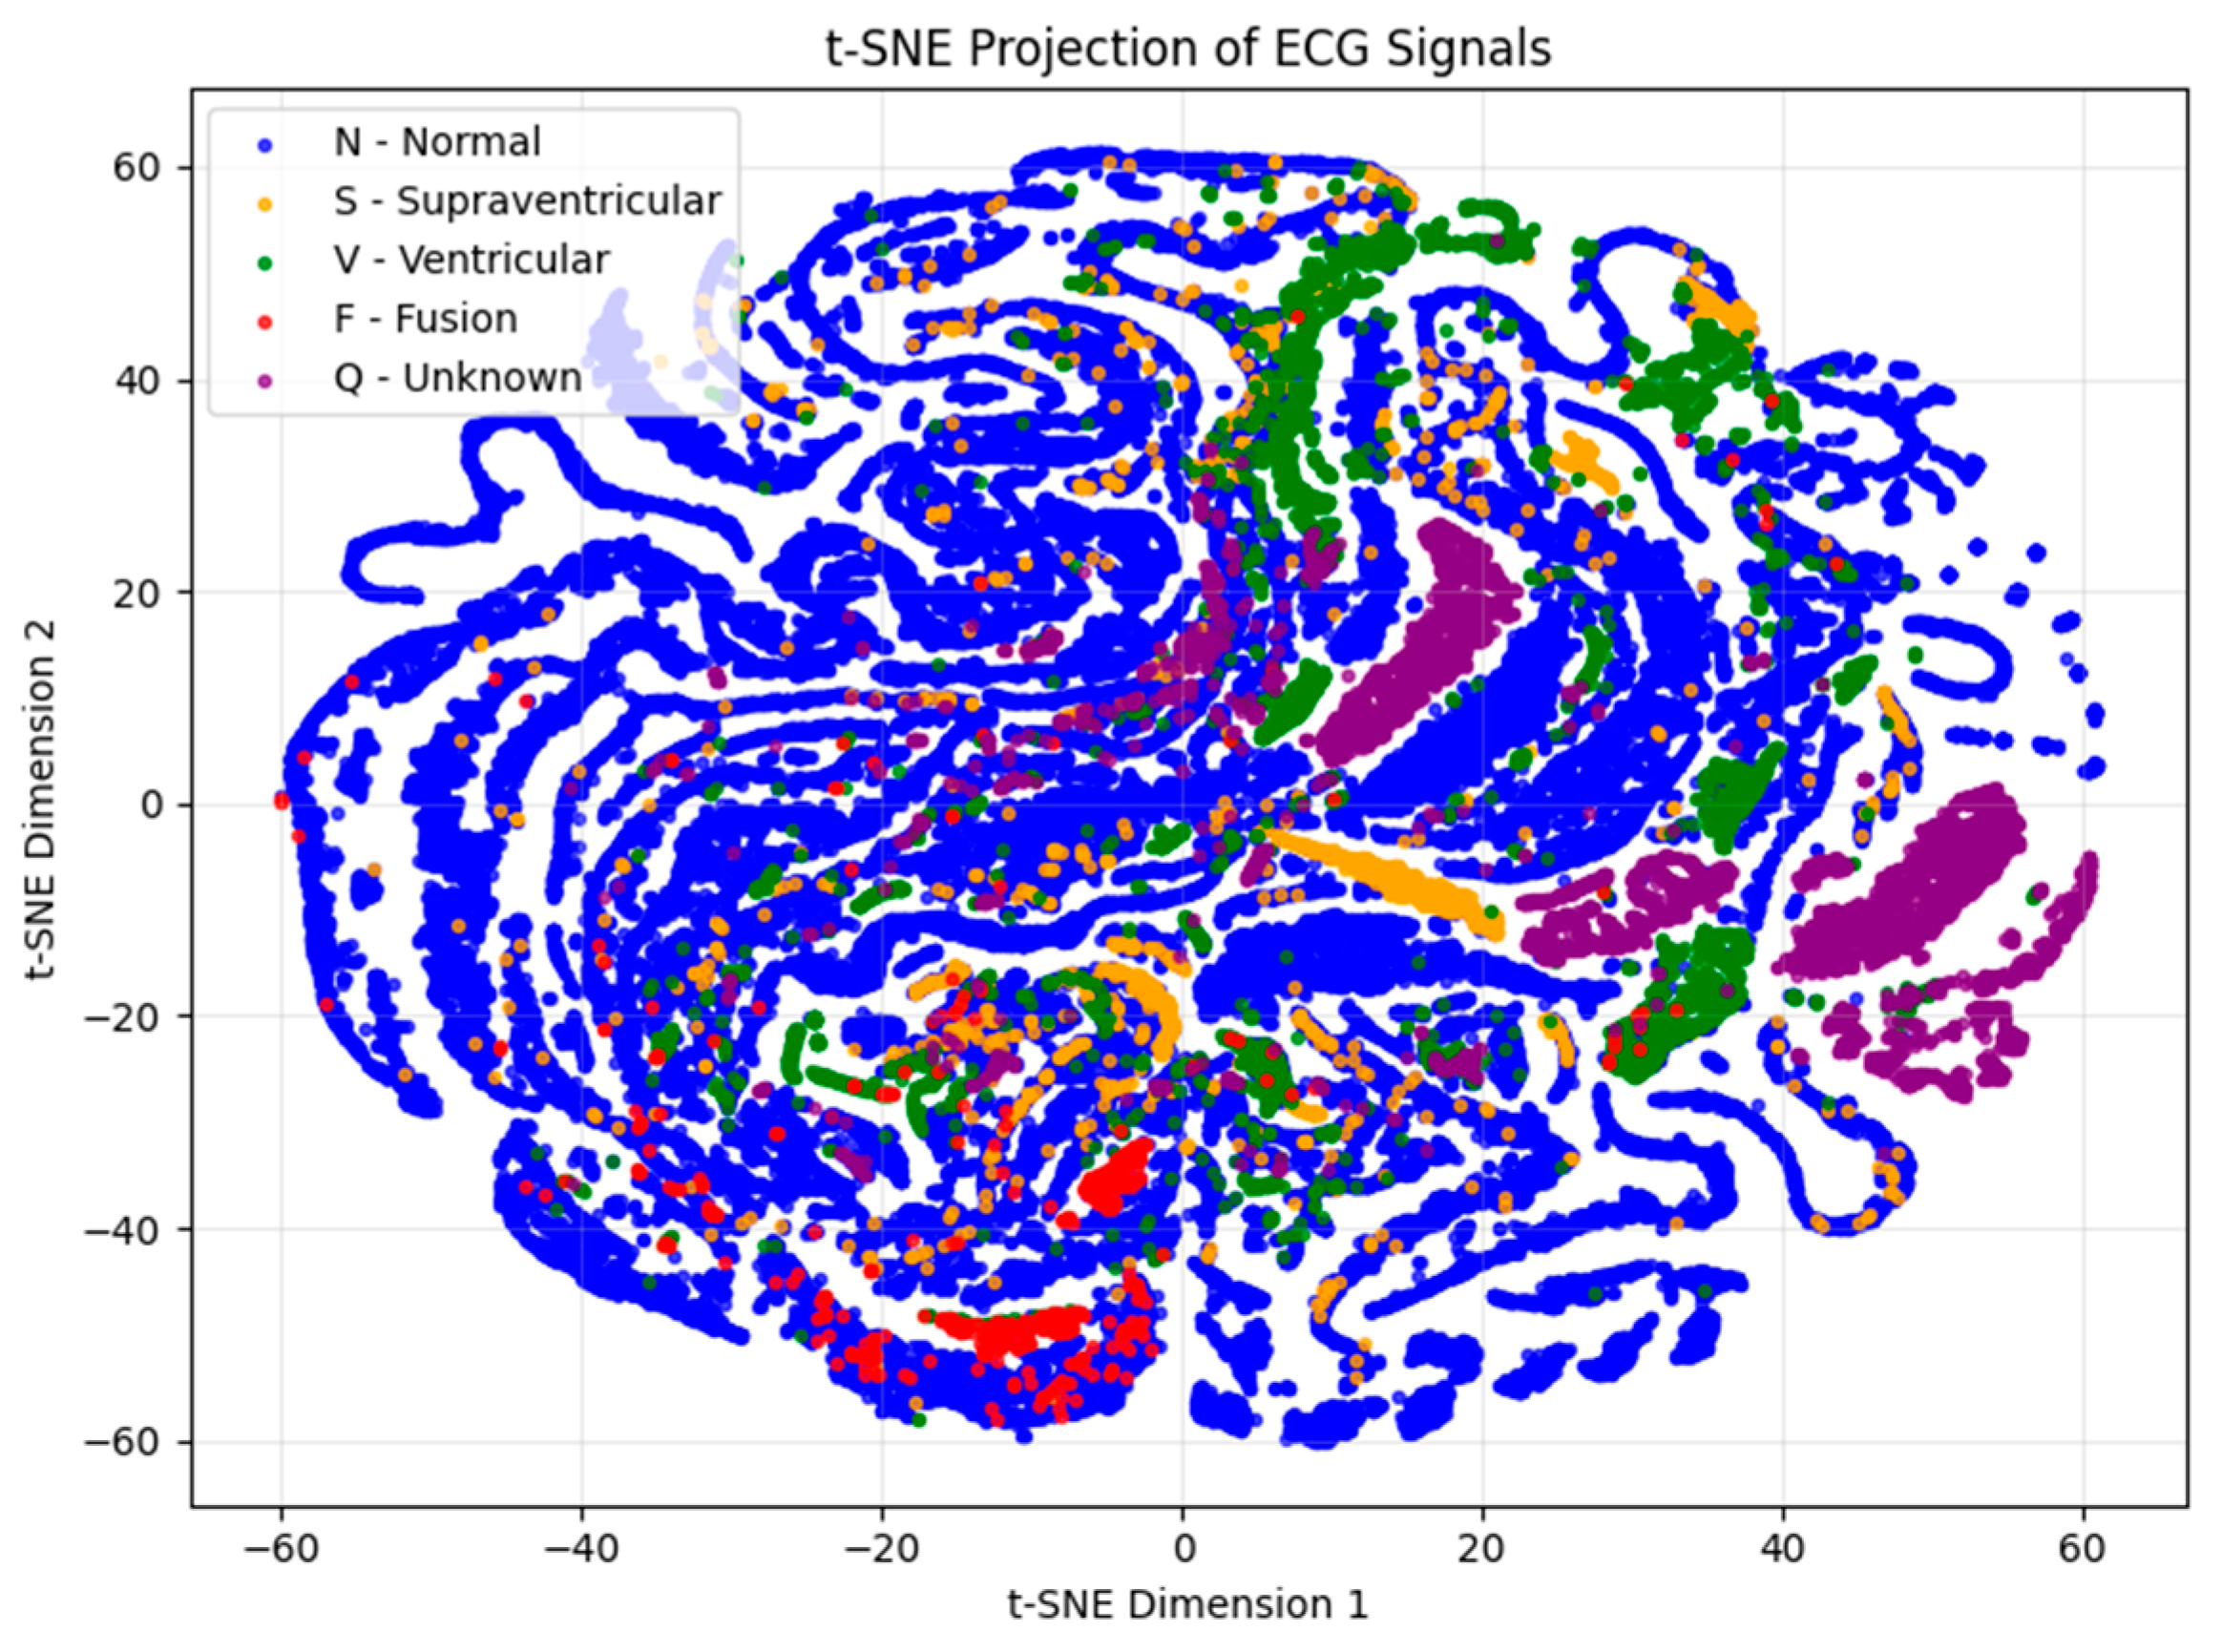
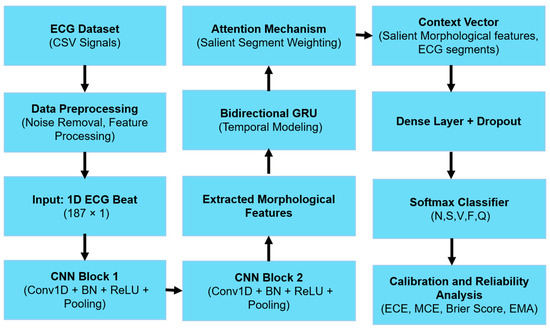
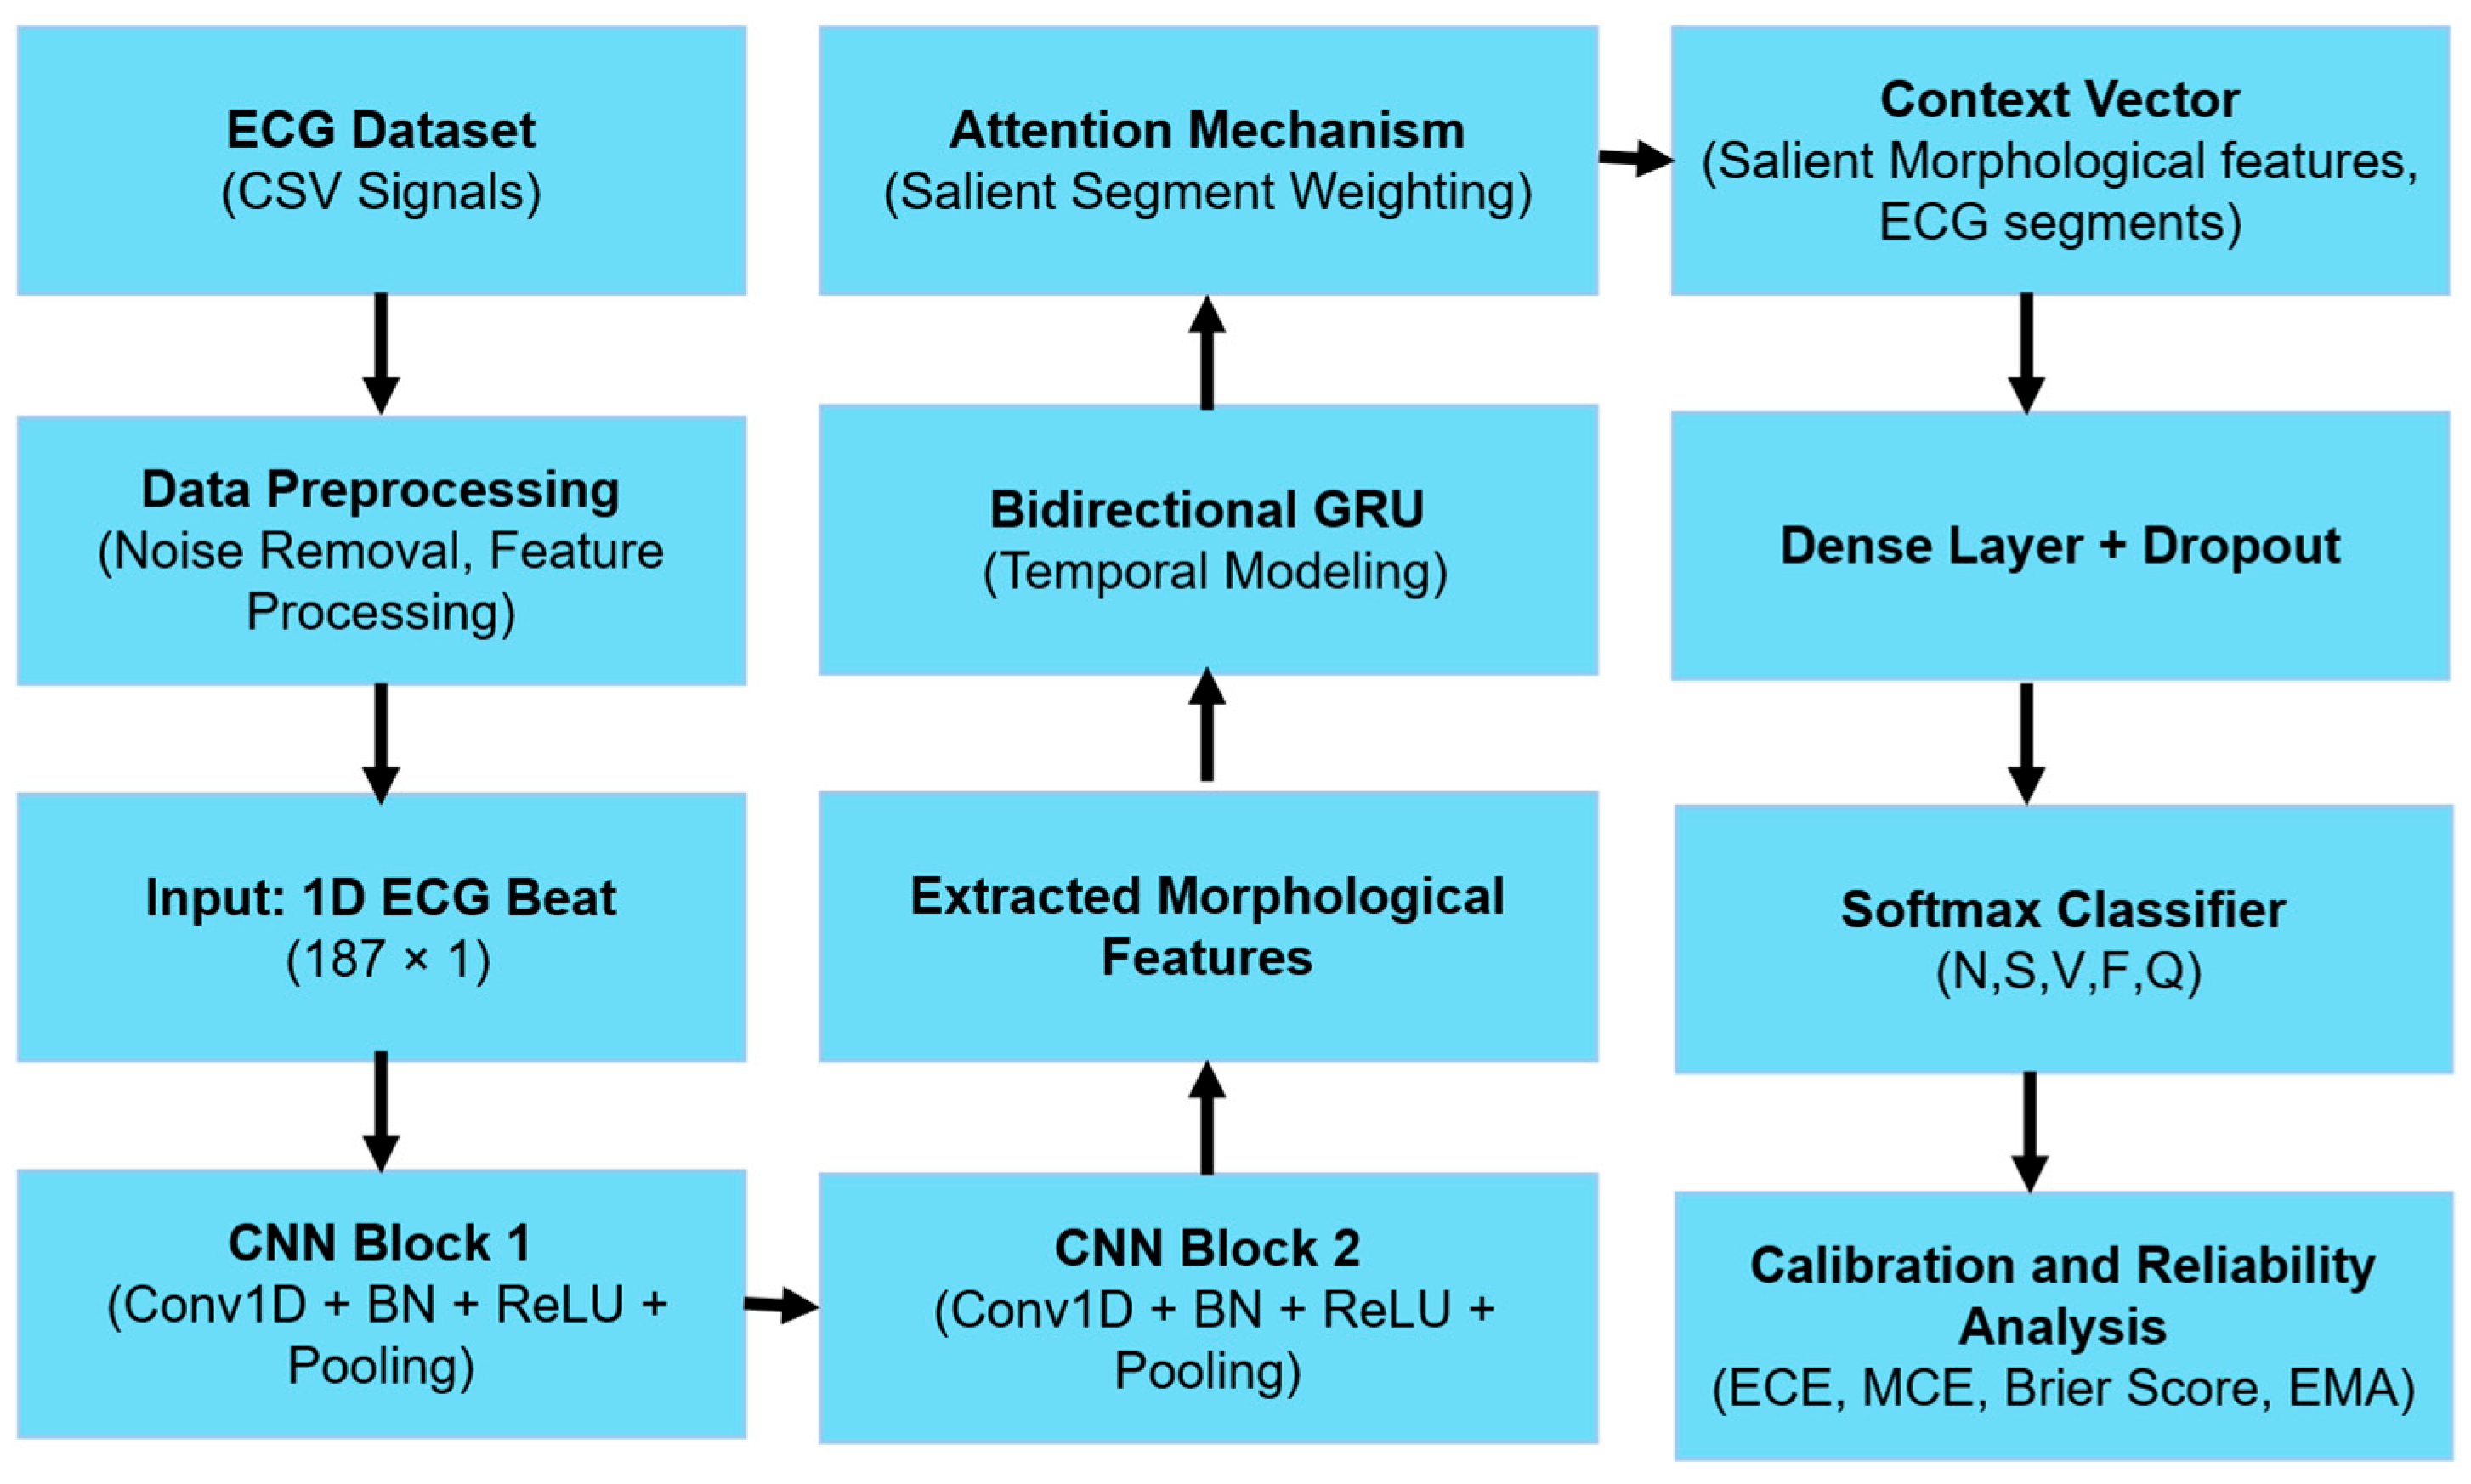
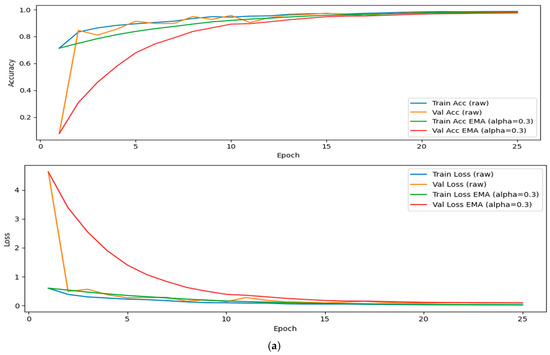
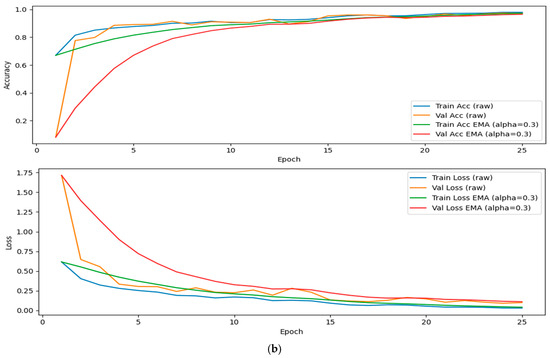
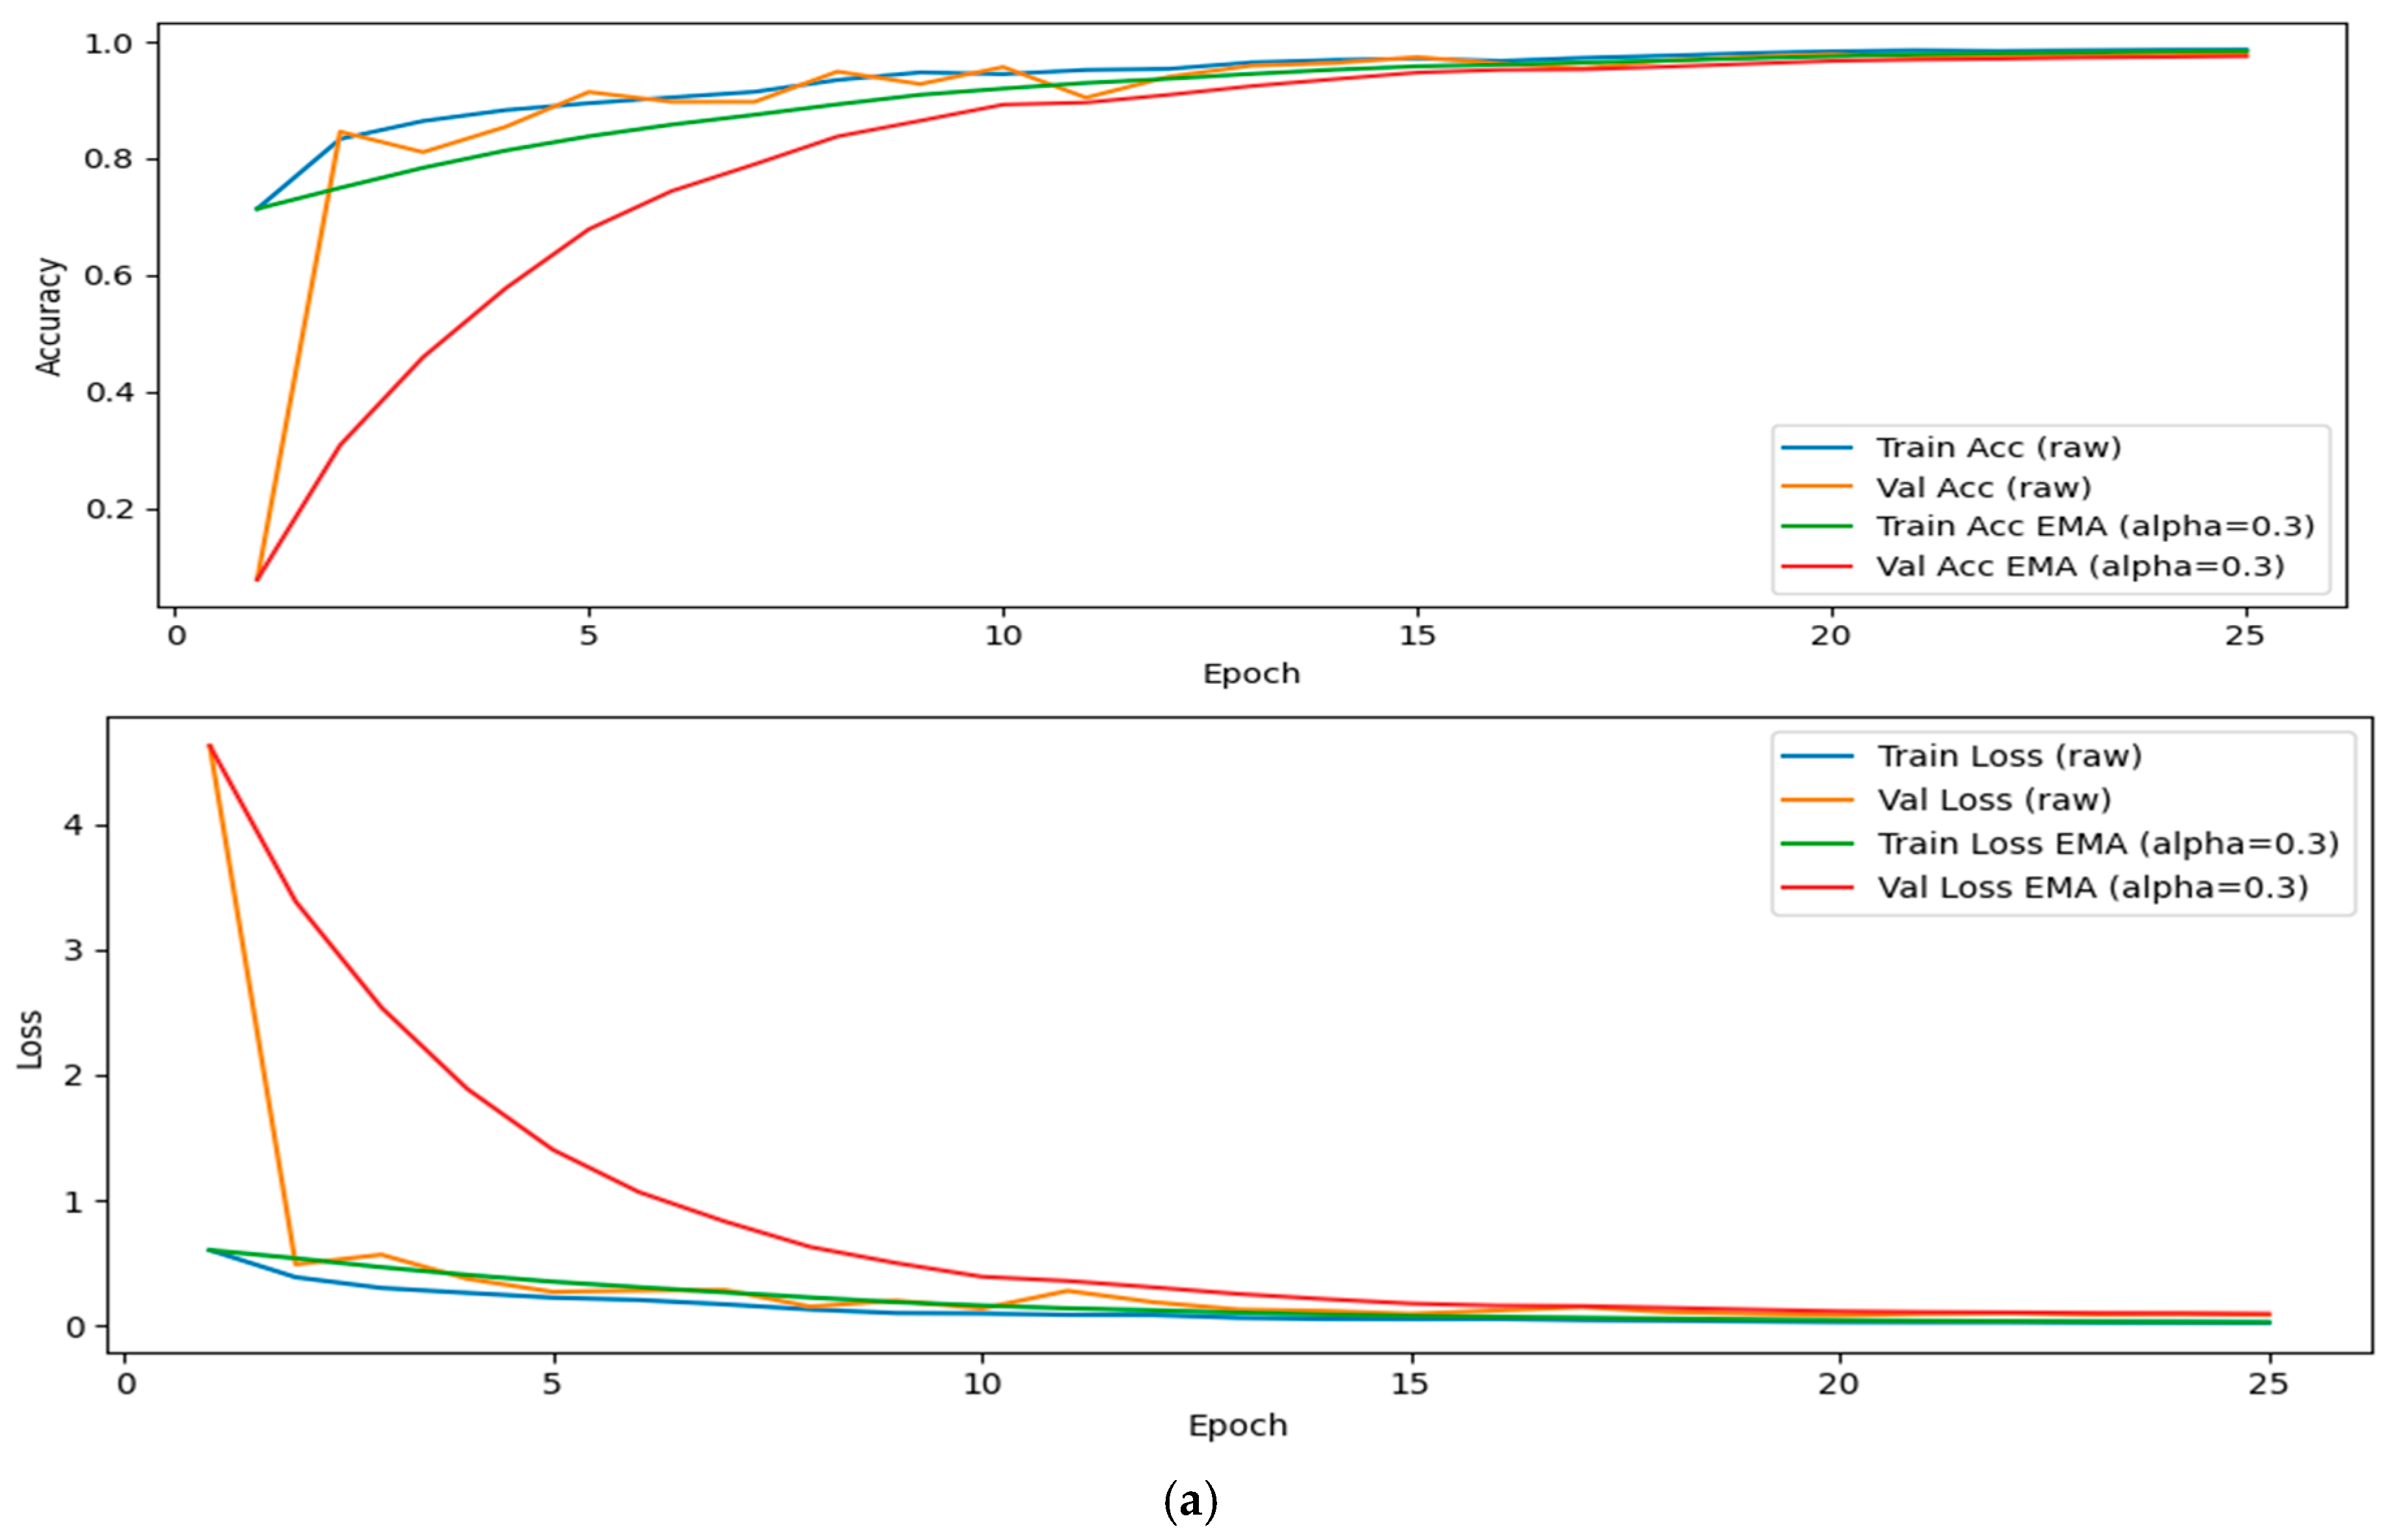
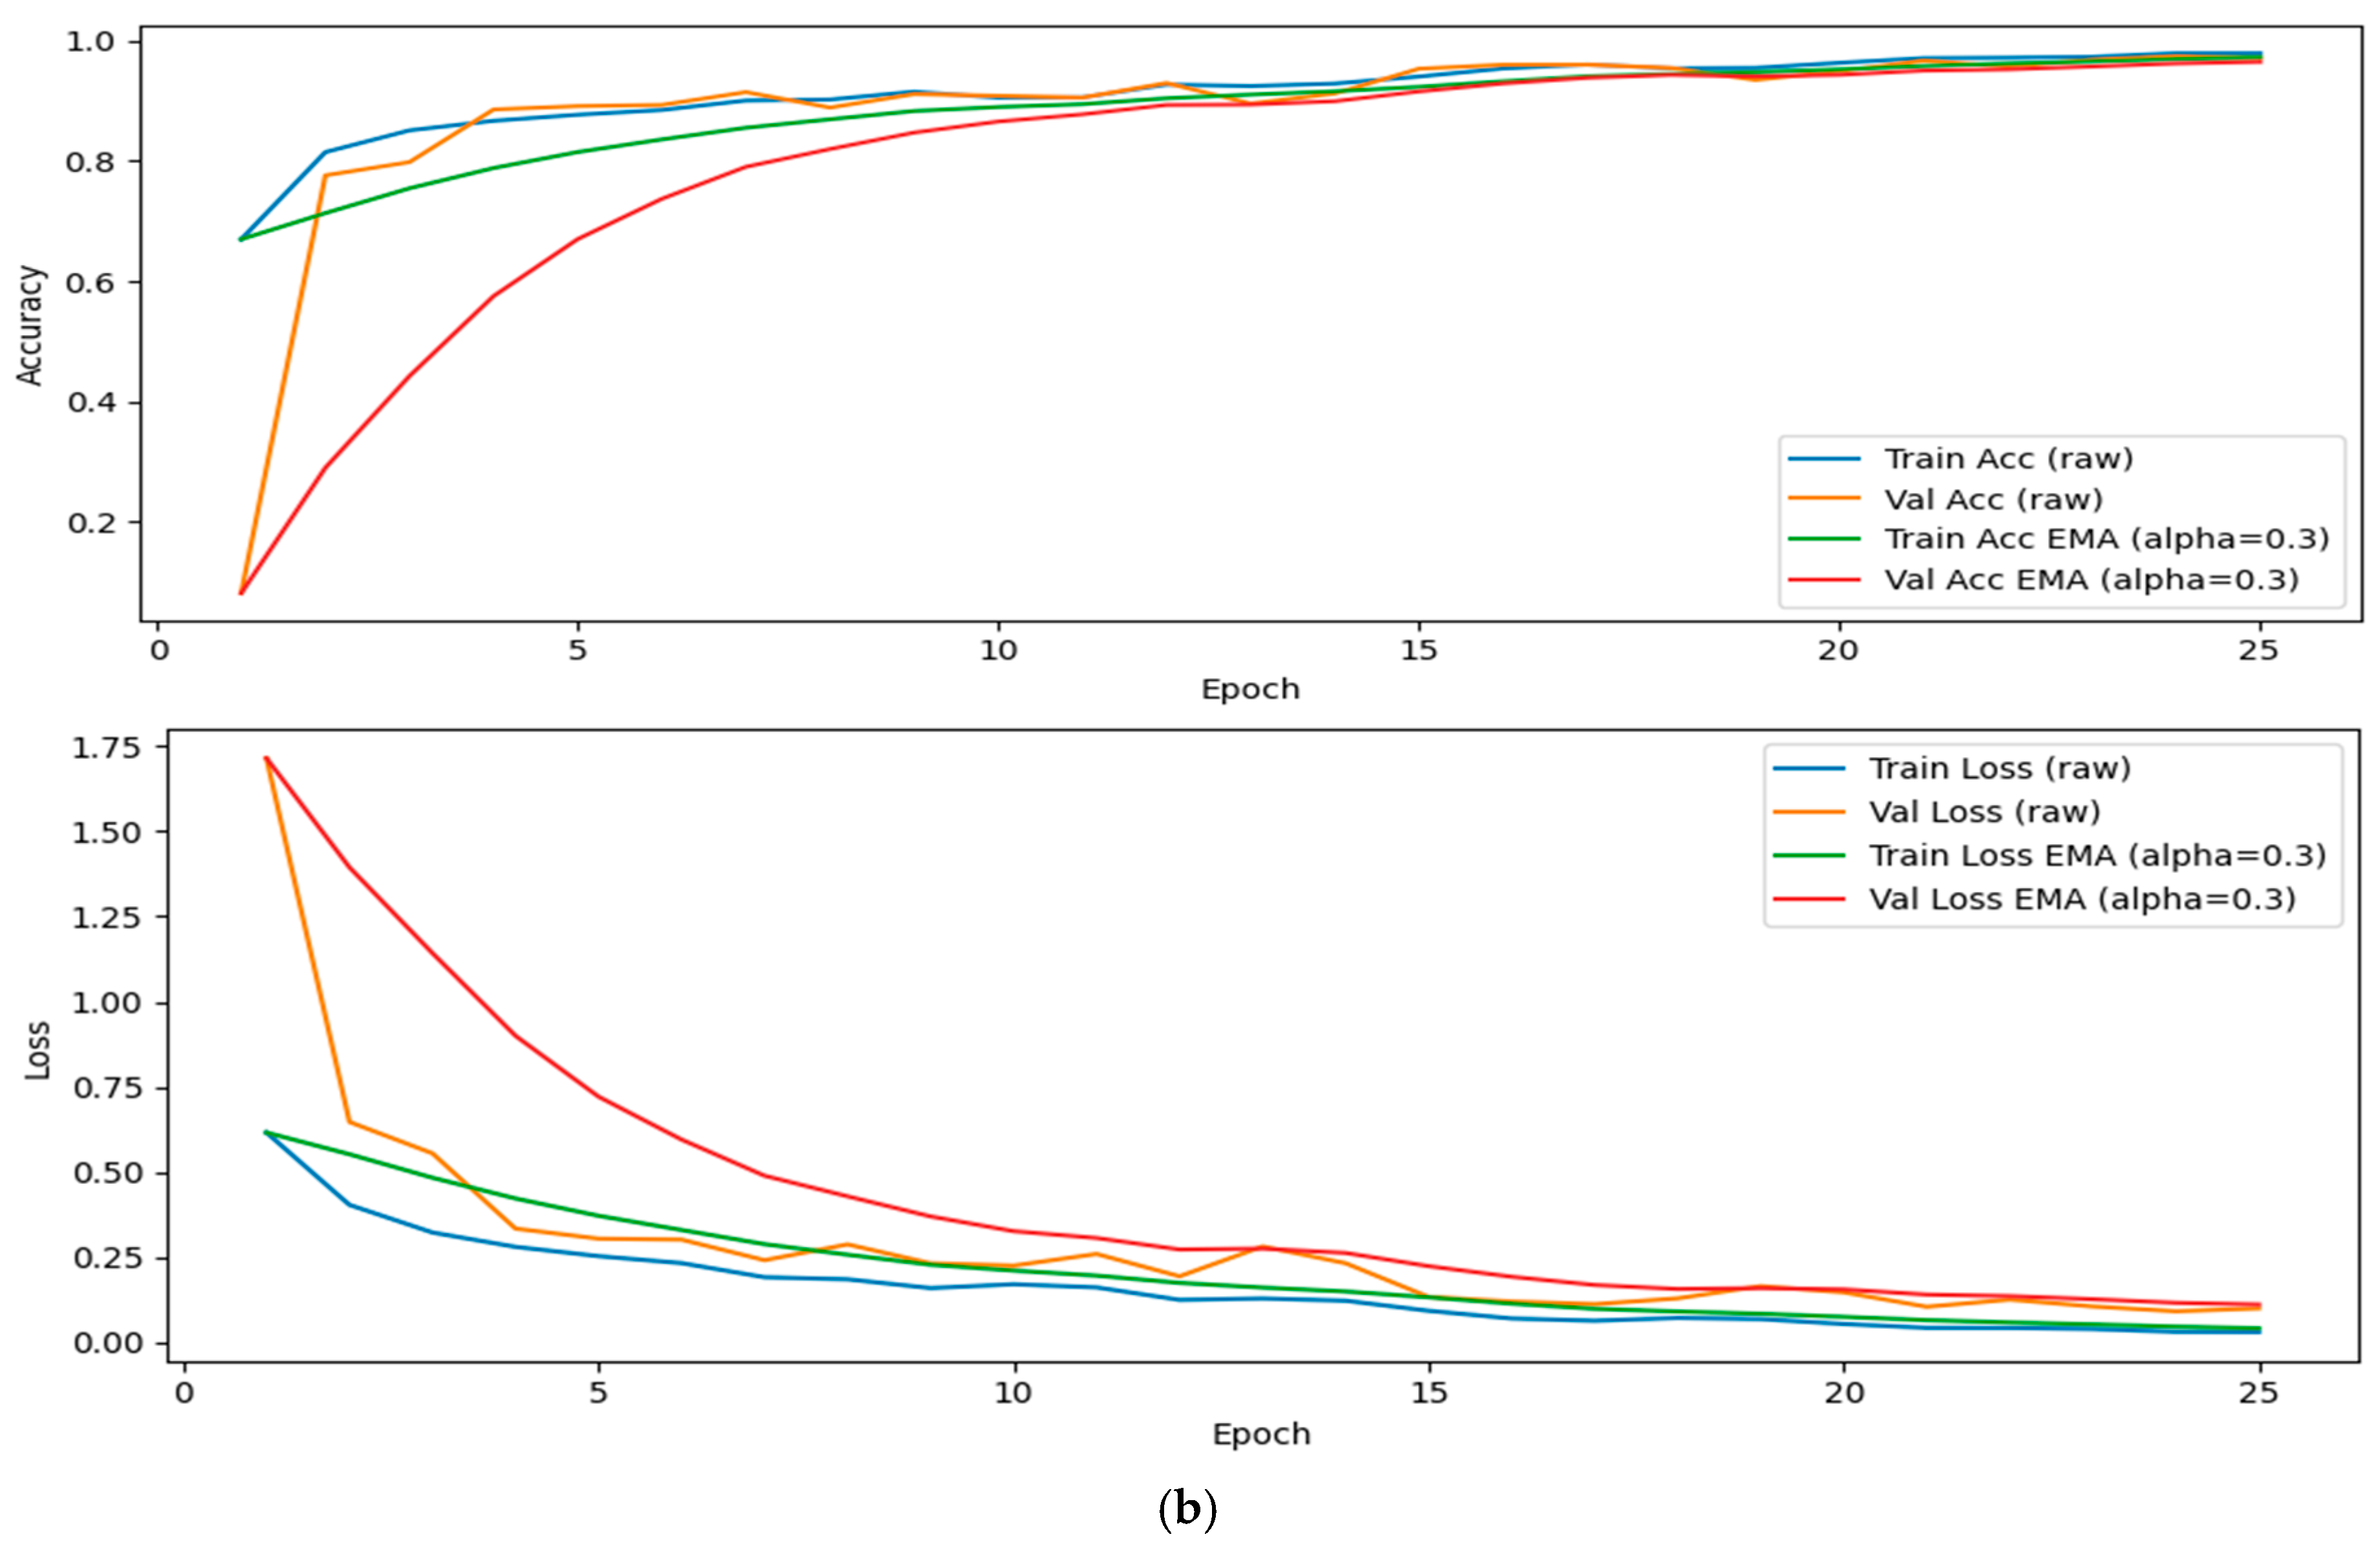
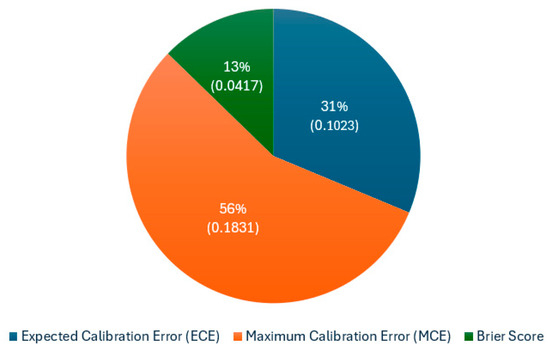
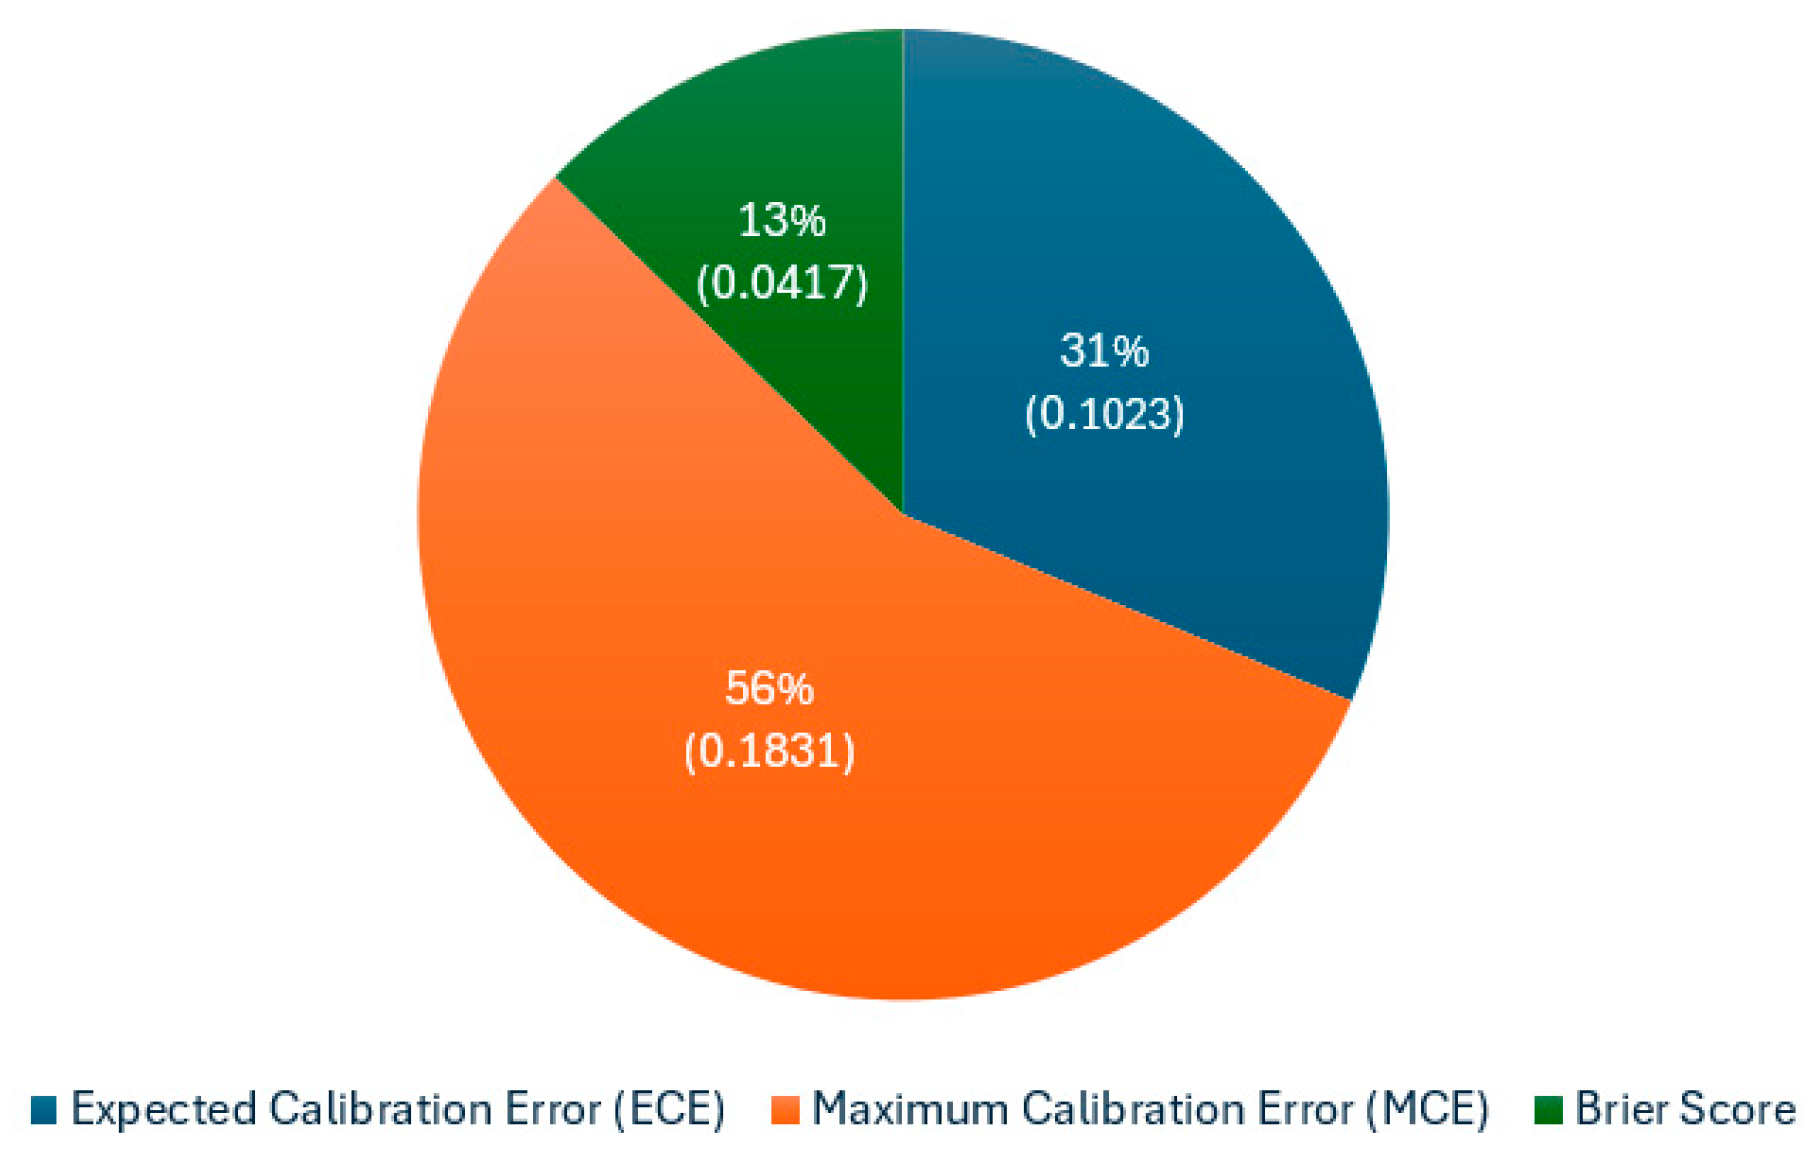

Disclaimer/Publisher’s Note: The statements, opinions and data contained in all publications are solely those of the individual author(s) and contributor(s) and not of MDPI and/or the editor(s). MDPI and/or the editor(s) disclaim responsibility for any injury to people or property resulting from any ideas, methods, instructions or products referred to in the content. |
© 2026 by the authors. Licensee MDPI, Basel, Switzerland. This article is an open access article distributed under the terms and conditions of the Creative Commons Attribution (CC BY) license.