


Abstract
Urban low-altitude logistics is increasingly constrained by obstacle-rich city morphology and wind-induced flight disturbances, which makes conventional path-planning methods insufficient for simultaneously ensuring efficiency, feasibility, and robustness. To address this issue, this study proposes an improved whale optimization algorithm (IWOA) for wind-field-coupled three-dimensional UAV path planning in urban environments. A voxel-based urban model is established, and the planning objective integrates flight time, energy consumption, wind-field penalty, and path smoothness. On the basis of the original whale optimization algorithm, the proposed method introduces a wind-field-guided local adjustment operator, adaptive convergence control, elite preservation, large-scale mutation, and feasibility repair. The proposed method is evaluated through a structured simulation framework comprising four scenarios: a baseline case, urban density variation, complex wind-field variation, and multi-destination delivery. The results show that IWOA consistently yields the lowest composite cost among the compared algorithms and exhibits better path smoothness, stronger wind adaptation, and earlier convergence stability. In the baseline case, the total cost of IWOA is reduced by 17.3%, 13.1%, and 6.7% relative to A*, GA, and WOA, respectively. Under the high-density urban environment and the complex wind field, IWOA also maintains the best performance, indicating stronger robustness under increased environmental difficulty. Sensitivity analyses further show that wind speed and wind direction have pronounced effects on the total cost, while the energy coefficient mainly affects the energy-related component. These results demonstrate that the proposed framework provides an effective and practically relevant solution for urban low-altitude UAV logistics path planning.
1. Introduction
Urban low-altitude logistics is receiving increasing attention because last-mile delivery continues to impose a disproportionate economic burden on logistics systems. The World Economic Forum reported that last-mile costs accounted for 53% of total shipping costs in 2023, compared with 41% in 2018 [1]. In parallel, INRIX reported that U.S. drivers lost an average of 43 h to traffic congestion in 2024, corresponding to more than four billion hours of delay and an estimated cost of $74 billion nationwide [2]. These figures indicate that improving urban delivery efficiency is not merely an operational issue but also an economically significant transportation problem.
Against this background, UAV-based delivery has attracted substantial attention as a potential alternative to conventional ground logistics in time-sensitive and congestion-prone urban areas. A U.S. DOT deployment evaluation reported that depot-based drone delivery can achieve up to 60% cost savings relative to truck-only delivery under low-demand and small-area conditions [3]. Such evidence suggests that UAV logistics may offer a meaningful efficiency advantage when service conditions and route design are appropriately matched.
However, the operational benefits of UAV delivery are strongly constrained by urban atmospheric disturbances, especially wind fields, turbulence, and building-induced airflow. Recent work on autonomous drone navigation has shown that wind is among the most critical environmental factors affecting path feasibility and flight safety. A multi-objective reinforcement learning approach was proposed for drones navigating through urban wind zones, with validation in both simulation and a real New York City setting; the study also emphasized that wind zones can significantly affect navigation decisions even when only limited sensing information is available [4].
In addition to learning-based methods, CFD-based wind estimation and wind-aware planning have also been introduced into UAV routing. A recent study on UAV logistics in Shenzhen integrated wind-field analysis into path planning, considered wind resistance and turbulence constraints, and employed CFD to calculate wind fields; the results showed improvements in groundspeed and energy consumption compared with wind-agnostic planning [5]. Meanwhile, high-resolution urban wind-field simulation studies have shown that realistic city-scale airflow prediction remains computationally demanding, motivating reduced-order or surrogate modeling approaches for large urban domains. These developments indicate that wind should be treated as a core planning variable rather than an external disturbance term [6].
The literature on urban wind environments further confirms that dense built environments generate complex aerodynamic phenomena, including turbulence, wake vortices, and wind shear, which directly affect the safety and stability of low-altitude flight. A recent review of urban air mobility in the built environment concluded that current research still lacks sufficient quantitative treatment of localized turbulence coupling and that more accurate simulation and data-assimilation methods are needed for complex urban wind environments [7,8,9,10,11].
From the optimization perspective, WOA and its variants have been widely used for UAV path planning because of their simple structure and strong global search capability. Recent improved WOA-based studies have achieved better convergence and smoother trajectories in 3D UAV path planning and multi-UAV scenarios [12]. However, most of these works still focus on generic optimization performance or cooperative mission planning, rather than explicitly modeling wind-coupled cost structures in urban low-altitude logistics [13]. At the same time, recent multi-objective multi-UAV path-planning research has highlighted a key limitation of traditional weighted-sum methods: objective weights are often subjective, and Pareto-based or non-dominated sorting approaches are increasingly adopted to represent trade-offs more systematically [14].
To address these gaps, this paper develops a three-dimensional voxel-based path-planning framework for UAV urban logistics that explicitly incorporates wind-field effects. The proposed model represents the urban environment as a 3D voxel space and integrates time cost, energy consumption, wind-field penalty, and path smoothness into the optimization objective. On this basis, an improved whale optimization algorithm is designed to balance global exploration and local exploitation in wind-coupled environments. The main distinction of this study from existing WOA-based approaches is its explicit focus on wind-aware path planning for urban logistics, rather than on general 3D route optimization or multi-UAV coordination alone.
2. Problem Description and Modeling
2.1. Problem Description
This study investigates the three-dimensional path-planning problem for a single UAV in urban delivery scenarios, taking into account building obstacles and wind-field disturbances. The UAV departs from a distribution center, flies through the urban low-altitude environment, and reaches the target point to complete the delivery task. The objective is to minimize the total flight cost by optimizing the path structure while satisfying flight safety and feasibility constraints. The model input consists of a three-dimensional voxel-based urban environment, the coordinates of the start and destination points, the wind-field distribution and its variation characteristics, and the UAV dynamic and endurance constraints. The output is a sequence of three-dimensional waypoints that minimizes the weighted sum of the path-cost function under the given constraints.
The proposed method is evaluated in terms of total cost, path smoothness and feasibility, convergence speed and stability, as well as sensitivity to key variables such as wind speed, wind direction, and energy coefficients.
2.2. Model Assumptions
Considering computational complexity and model adaptability, and in order to make the model more consistent with real UAV delivery scenarios, several assumptions are made for the UAV delivery model in this study.
- (1)
- Obstacle configuration: Obstacles within the service area are assumed to have a fixed spatial distribution, including static physical obstacles such as buildings and permanent no-fly zones such as government facilities.
- (2)
- UAV parameters: The UAVs performing missions are fully charged and equipped with usable backup batteries; the single-service range is significantly shorter than the maximum flight distance of the drones.
- (3)
- Customer point (destination) constraints: The geographic coordinates of customer points are assumed to be accurate, and their spatial locations remain fixed. The cargo demand at each customer point does not exceed the maximum payload capacity of the UAV.
- (4)
- Task planning: Delivery tasks must be completed within a fixed time window.
2.3. Model Building
2.3.1. Objective Functions
To better characterize the trade-offs among flight efficiency, energy consumption, wind adaptation, and path smoothness, the UAV path-planning problem is formulated as a multi-objective optimization problem. Four conflicting objectives are considered, namely flight time, energy consumption, wind-field penalty, and turning-angle penalty. In order to obtain a single fitness value for the IWOA solver, the four objectives are first normalized [15,16] and then aggregated using a weighted-sum scalarization scheme.
- (1)
- Time Cost
The flight time cost is defined as follows:
where denotes the length of the -th path segment, and represents the effective flight velocity along the segment . The effective velocity is influenced by the wind field and can be expressed as follows:
where is the UAV cruising speed under still-air conditions, denotes the wind velocity vector, and is the unit direction vector of the segment , defined as
- (2)
- Energy Consumption Cost
The energy consumption cost considers horizontal flight and climbing energy:
where is the horizontal energy coefficient, is the climb energy coefficient, and represents the altitude change.
- (3)
- Wind-Field Cost
The wind-field cost is represented by a unified wind cost potential function:
where are weighting coefficients. Where are the horizontal wind resistance cost, vertical wind shear cost, and building-induced disturbance cost, respectively. The three components are defined as follows:
where and denote the horizontal wind vector and horizontal unit direction of segment , respectively; denotes the vertical wind component; is the distance from the midpoint of segment to the nearest building or high-disturbance region; and is a spatial attenuation parameter. The wind-field cost is then formulated as
- (4)
- Path Smoothness Cost
To penalize excessive turning, the path smoothness cost is defined as follows:
where the turning angle is as follows:
- (5)
- Normalization of Objective Functions
To eliminate the influence of different scales, all objective functions are normalized:
2.3.2. Constraint Conditions
- (1)
- Climb angle
- (2)
- Boundary limit
- (3)
- No-fly zone
2.3.3. Building the Model
In the three-dimensional space
the UAV departs from the start point () and flies to the goal point (). The path is represented by a sequence of waypoints, including the start and goal points:
where denotes the -th waypoint. The objective is to minimize the composite cost under obstacle-avoidance and boundary constraints.
The final optimization objective is defined as follows:
subject to:
where
represents the weight of each objective.
3. Algorithm
To develop a UAV path-optimization method suitable for complex wind fields, this study compares several commonly used path-optimization algorithms [17,18,19,20,21,22], including A*, the genetic algorithm (GA), and the whale optimization algorithm (WOA). A* is well-suited for shortest-path search on grids but is less effective in continuous spaces and under nonuniform wind-field effects. Although GA has global search capabilities, they are sensitive to parameter settings and may become trapped in local optima.
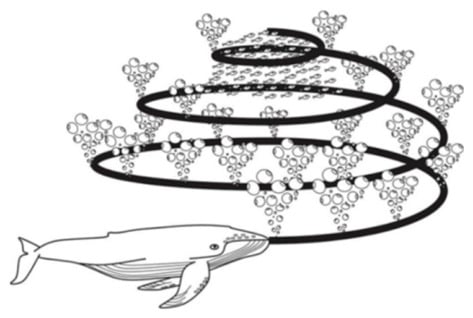
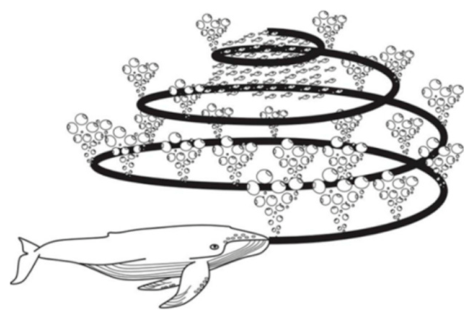
WOA is a swarm-intelligence optimization algorithm inspired by the encircling and bubble-net hunting behavior of whales. Its main advantages are a simple update mechanism, a switching strategy among encircling, exploration, and spiral update modes, and efficient vector-based computation. Compared with GA, WOA often converges faster for the same population size. Compared with A*, WOA can directly optimize complex cost functions in a continuous control-point space that couples flight physics with wind-field effects. Based on these considerations, this study adopts WOA as the baseline and proposes an improved variant, IWOA, to balance global exploration and wind-aware local optimization. The bubble-net feeding behavior that inspires the original WOA is illustrated in Figure 1.
Figure 1.
Bubble-net feeding behavior of whales.
3.1. Improvement Strategy
To improve search efficiency and solution quality under wind-field-coupled costs, IWOA introduces enhancement operators on the basis of the original WOA.
- (1)
- Wind-field-guided local adjustment operator
To incorporate environmental information into the search process, a wind-field-guided local adjustment operator is designed. For each waypoint in the path-encoding vector , the local wind influence is characterized using the wind potential field . The descent direction is defined as follows:
where is a small constant used to avoid division by zero. The local step size is given by
where is the base step size, is the local wind vector, and is a reference wind speed.
A candidate set is then constructed as
For each candidate , the corresponding waypoint in the original path is replaced to form a new path , and the composite fitness value is evaluated. The candidate yielding the minimum fitness is retained. This operator enables the search process to move toward regions with lower wind-induced cost while preserving feasible path encoding.
- (2)
- Adaptive convergence control operator
To balance global exploration and local exploitation, the convergence factor of WOA is modified as
where is the current iteration, is the maximum number of iterations, and is a nonlinear control parameter. Compared with the original linear decay strategy, this nonlinear schedule maintains stronger exploration in the early stage and accelerates convergence in the later stage, which is particularly useful in dense urban environments and complex wind fields.
- (3)
- Elite preservation and large-scale mutation operator
To prevent the loss of high-quality solutions, an elitism strategy is adopted in each generation. The top individuals with the lowest fitness values are preserved directly, where is the population size and is the elite ratio.
For the elite individuals, a local refinement process is further applied. During iterations, small Gaussian perturbations are introduced to selected waypoints, and the wind-field-guided local adjustment operator is reapplied. Any improved solution immediately replaces the original one.
For the worst-performing individuals in each generation, a large-scale mutation strategy is used to preserve population diversity. The perturbation is given by
where is the identity matrix. The mutation scale decreases with iteration as
where is the initial perturbation scale. This strategy helps the algorithm escape local optima in the early stage and gradually switch to fine exploitation later.
- (4)
- Feasibility repair and conflict-avoidance operator
Because the search is performed in a discretized three-dimensional urban environment, the updated paths may contain infeasible segments, such as boundary violations or collisions with obstacles. To ensure practical feasibility, a repair operator is applied after each update.
If a path segment intersects an obstacle voxel, a detour waypoint is generated as
where is a local safe direction estimated from the obstacle boundary, and is a small repair distance. After collision repair, a spline-based smoothing procedure is used to remove unnecessary zigzag motions and improve trajectory continuity.
3.2. Algorithm Outline
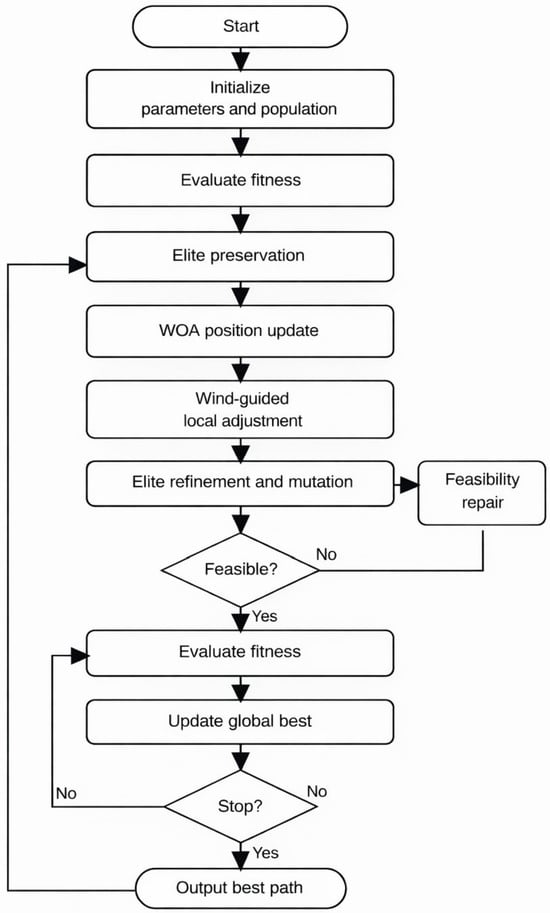
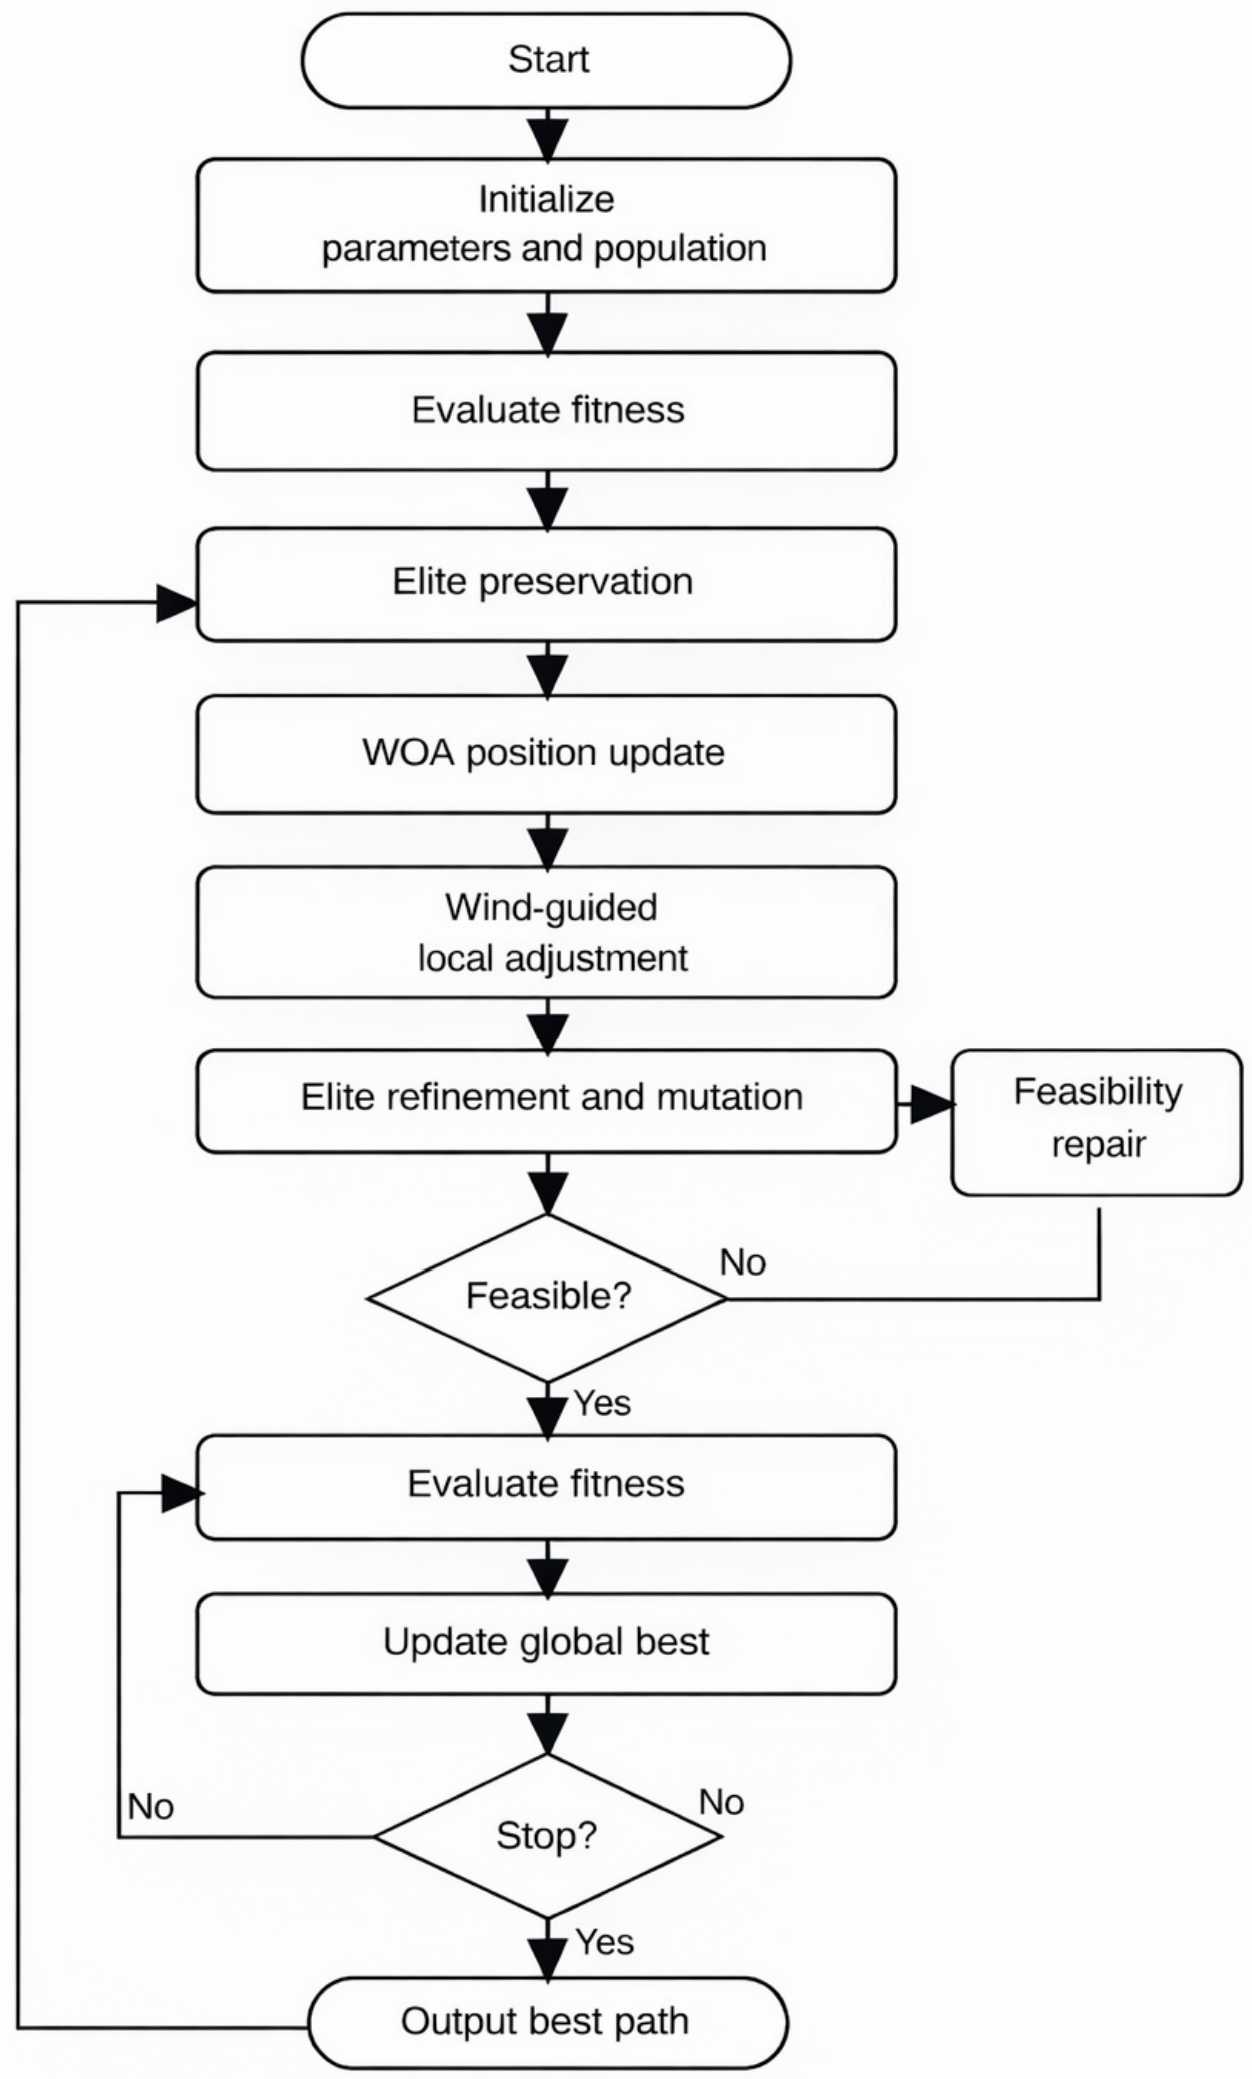
The proposed IWOA is designed to solve the wind-field-coupled UAV path-planning problem in a three-dimensional voxel environment. The algorithm combines the standard encircling, exploration, and spiral behaviors of WOA with the wind-field-guided local adjustment operator, elite preservation, large-scale mutation, and feasibility repair strategy introduced in Section 3.1. The overall framework is shown in Figure 2.
Figure 2.
Flowchart of the proposed IWOA.
The detailed procedure is summarized as follows:
Step 1: Initialize the algorithm parameters, including the population size , maximum number of iterations , elite ratio , base step size , mutation scale , and other control coefficients. Generate an initial population of feasible 3D paths in the voxel-based urban environment. Each path is encoded as a sequence of waypoints from the origin to the destination.
Step 2: Evaluate the fitness of each individual using the comprehensive cost function, which includes flight time, energy consumption, wind penalty, and smoothness penalty. Perform collision detection and penalize infeasible solutions.
Step 3: Sort the population according to fitness values and preserve the top individuals as elite solutions. These individuals are retained for subsequent refinement and are not replaced by ordinary position updates.
Step 4: Update the remaining individuals using the standard WOA update rules. When the encircling condition is satisfied, move the current solution toward the best individual. Otherwise, perform exploration based on a randomly selected whale. If the spiral updating condition is triggered, generate a spiral position update around the current best solution.
Step 5: For each updated waypoint, apply the wind-field-guided local adjustment operator defined in Section 3.1. The local candidate set is generated by moving along the negative gradient direction of the wind cost potential. The candidate yielding the lowest fitness is retained. This step enables the algorithm to actively avoid high-risk wind regions and improves the environmental adaptability of the path.
Step 6: Perform local refinement on the elite individuals using small Gaussian perturbations and repeated wind-guided adjustment. At the same time, apply large-scale mutation to the worst-performing individuals to maintain population diversity and prevent premature convergence. The mutation scale decreases gradually with iterations, allowing global exploration in early stages and fine exploitation in later stages.
Step 7: Check whether the updated paths violate the boundary constraints or intersect with obstacle voxels. If infeasible segments are detected, repair them by inserting safe detour waypoints. After repair, apply spline-based smoothing to reduce unnecessary turns and improve path continuity.
Step 8: Evaluate the fitness of all individuals after the above operations and update the global best solution if a better path is found. Record the historical best fitness value and the corresponding path for convergence analysis.
Step 9: If the maximum number of iterations is reached or the convergence criterion is satisfied, output the globally best feasible path as the final solution. Otherwise, return to Step 4 and continue the optimization process.
4. Simulation
4.1. Simulation Scenario
To ensure reproducibility and enable a clear evaluation of the proposed algorithm, a three-dimensional (3D) urban low-altitude environment is first constructed.
Specifically, the continuous spatial domain is discretized into a structured voxel grid. To balance computational efficiency and spatial resolution, scaling factors are introduced to transform the original coordinates into a normalized grid space. The scaling factors along the X, Y, and Z directions are set to 0.1, 0.1, and 2.0, respectively. As a result, the simulation space is defined as a cuboid domain of size 1000 × 1000 × 250.
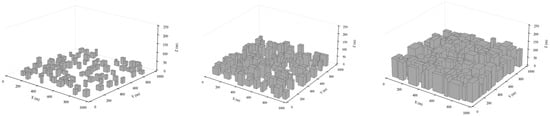
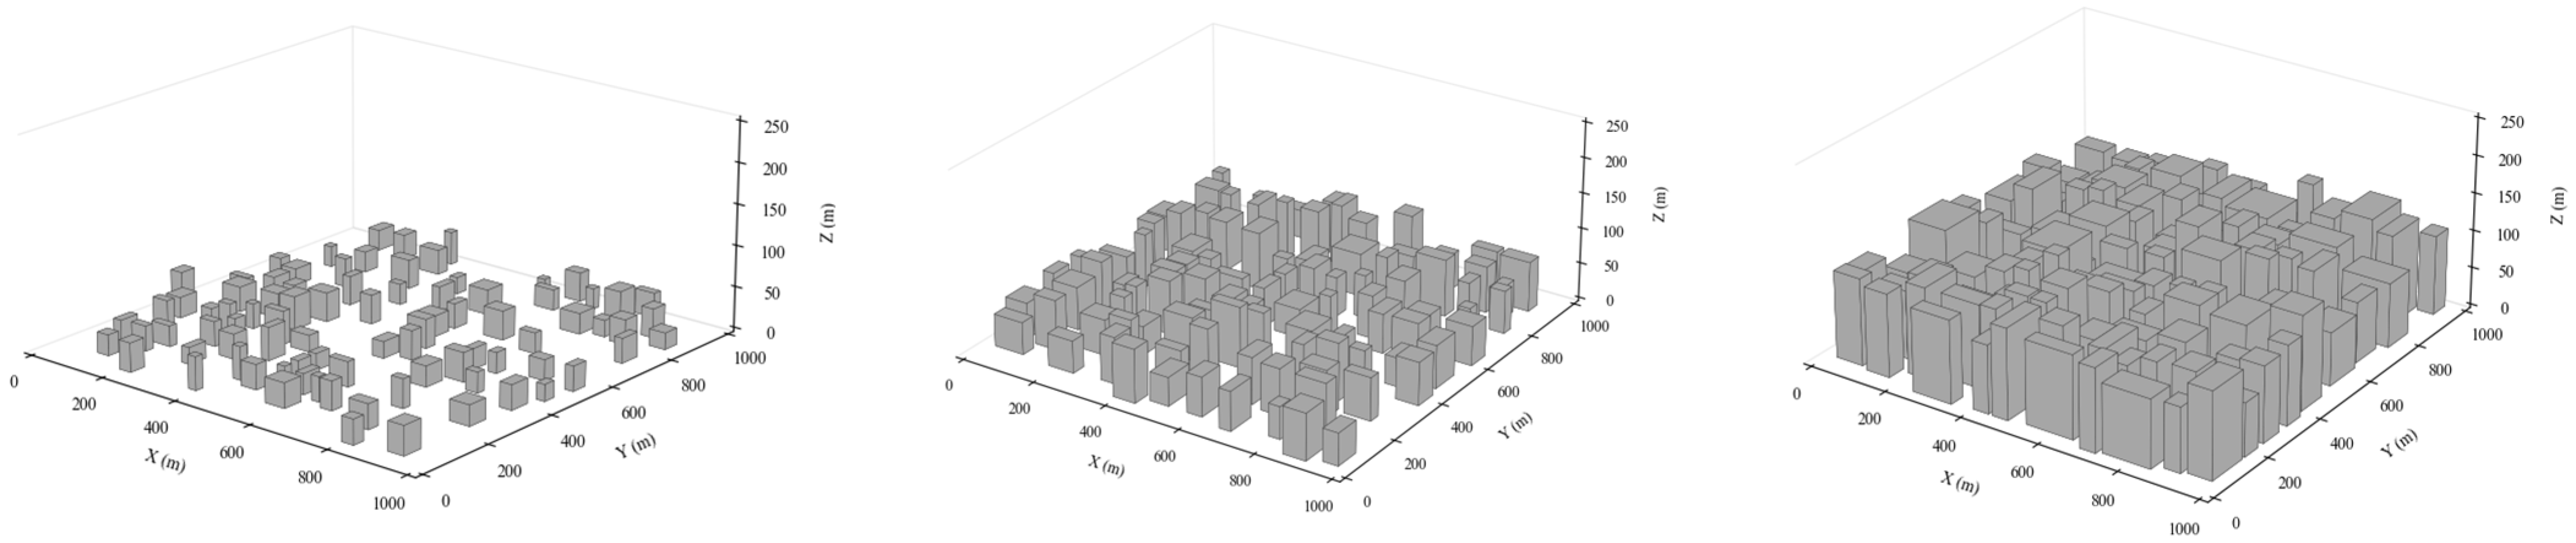
To investigate the influence of urban morphology on UAV path planning, three urban density levels are constructed, namely low-density, medium-density, and high-density environments. Urban density is quantified by the obstacle occupancy ratio, defined as the ratio of building-occupied voxels to the total number of voxels in the horizontal plane. In this study, the occupancy ratios are set to 10%, 25%, and 50% for the low-, medium-, and high-density scenarios, respectively. To further distinguish the three cases, the average building heights are set to 30 m, 60 m, and 100 m, respectively, with higher-density environments also exhibiting smaller inter-building spacing and narrower flight corridors.
The low-density scenario represents suburban or peripheral urban areas with sparse and relatively short buildings, large open spaces, and weak geometric confinement. The medium-density scenario represents typical urban blocks with mixed building heights and partially constrained corridors. The high-density scenario represents dense downtown environments characterized by compact building clusters, tall structures, and narrow navigable passages, which together create a more challenging path-planning environment. The three urban density levels are shown in Figure 3.
Figure 3.
Three urban density levels.
Within this discretized environment, obstacle regions are encoded as occupied cells with a value of 1, while free space is represented by 0. This binary representation facilitates efficient path searching in a constrained 3D environment.
On this basis, two wind models are designed to evaluate the robustness of the proposed method under different environmental conditions.
The background wind model is defined as an urban atmospheric boundary-layer profile:
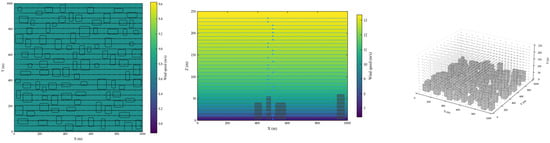
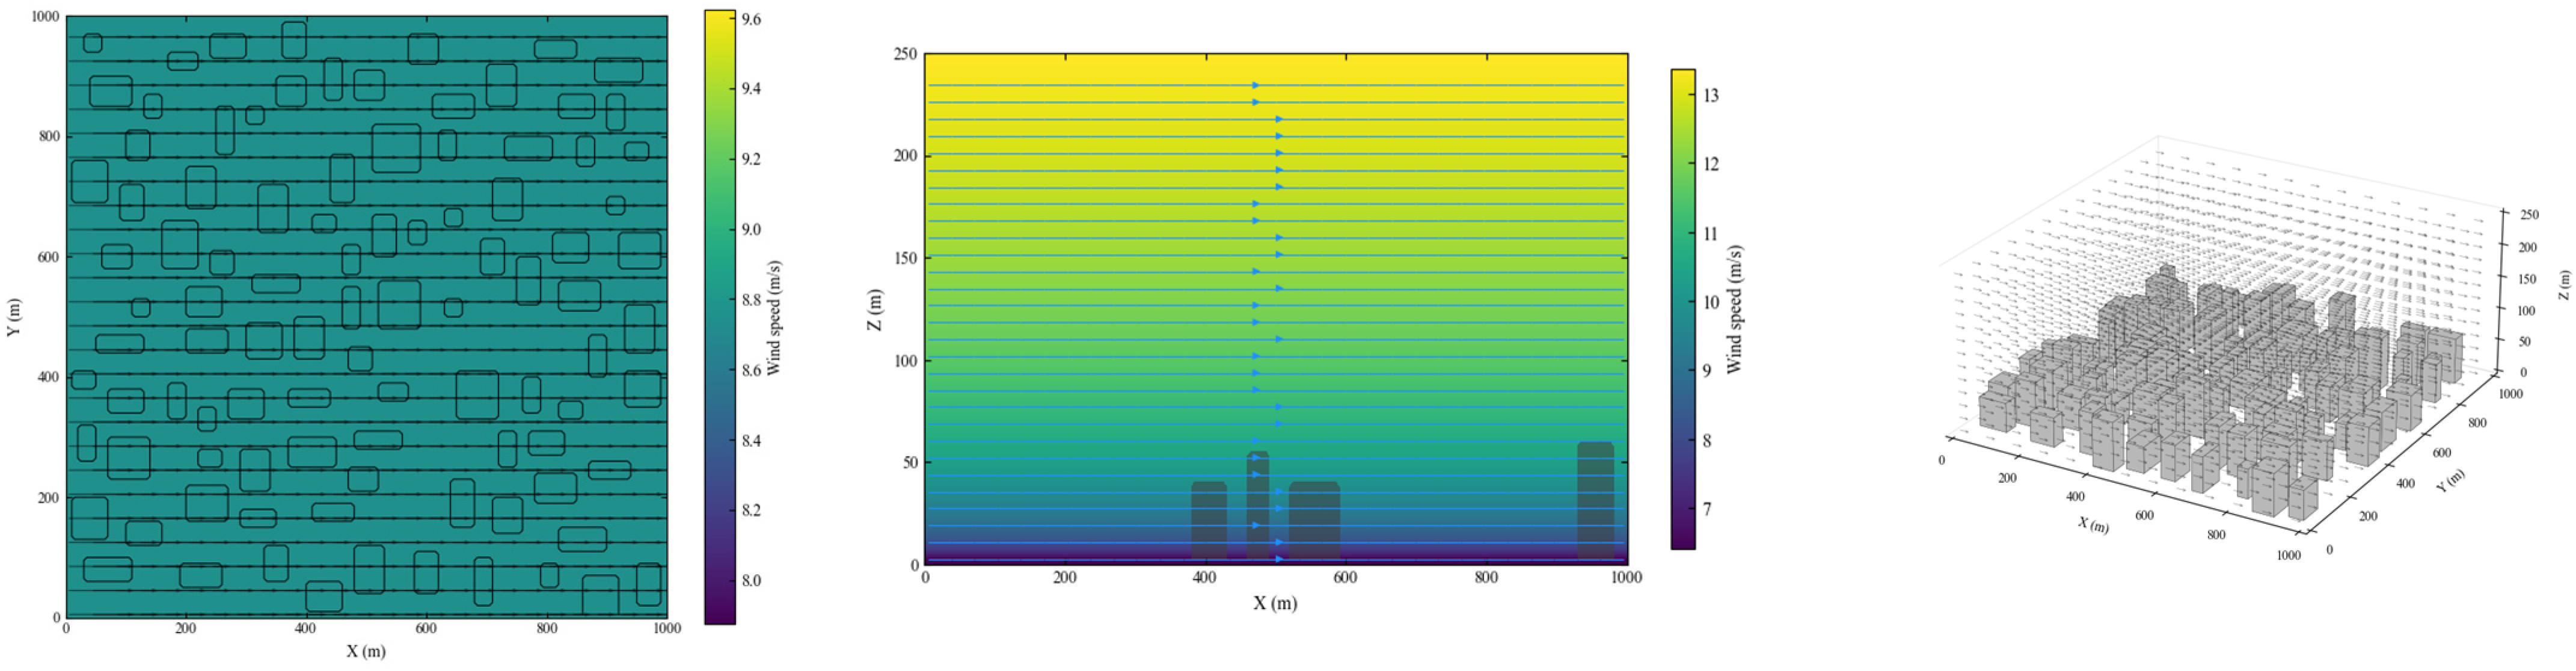
where is the reference wind speed at altitude , is the vertical shear exponent, and is the prevailing wind direction. The background wind field used in this study is illustrated in Figure 4.
Figure 4.
The background wind model . Squares denote obstacles, and arrows denote local wind vectors.
The complex urban wind model is expressed as follows:
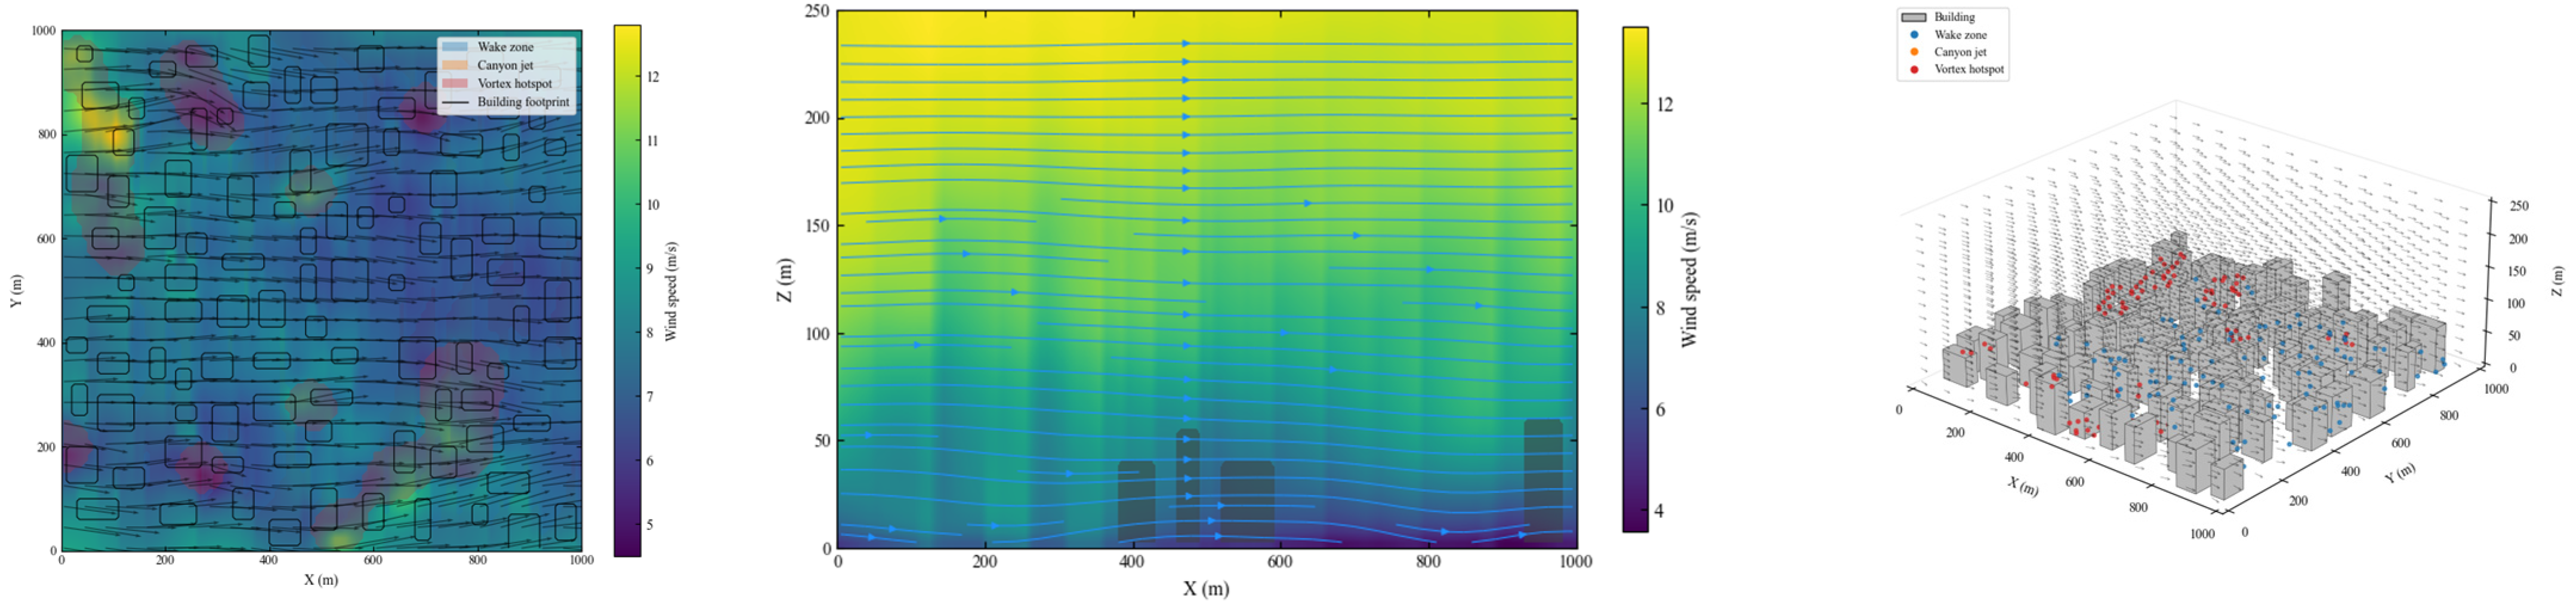
where represents building-induced disturbances such as wake effects and local acceleration, and denotes spatially correlated turbulent fluctuations. This unified wind representation ensures consistency between the objective function, the optimization operator, and the simulation environment. The complex urban wind field is illustrated in Figure 5.
Figure 5.
The complex urban wind model . Squares denote obstacles, and arrows denote local wind vectors under building-induced disturbance.
To comprehensively evaluate the performance and robustness of the proposed IWOA under different urban and atmospheric conditions, four structured simulation scenarios are designed.
- (1)
- Scenario 1: Baseline Case
The baseline scenario is constructed to validate the basic effectiveness of the proposed algorithm. In this scenario, a medium-density urban environment is considered. The wind field follows the atmospheric boundary-layer model , which introduces a realistic but relatively smooth vertical wind variation. A single UAV is deployed to travel from a fixed origin to a single destination. No additional task complexity is introduced in this scenario.
- (2)
- Scenario 2: Urban Density Variation
To investigate the adaptability of the proposed method under different urban morphologies, this scenario further examines the low- and high-density environments, while the medium-density case is represented by Scenario 1.
In all cases, the wind field remains unchanged and follows the same atmospheric boundary-layer model as in Scenario 1. A single UAV is used, and the origin–destination pair is fixed.
- (3)
- Scenario 3: Wind Field Variation
To reflect realistic urban atmospheric conditions, this scenario evaluates the impact of the complex wind model B under the same medium-density urban environment, with the corresponding wind model A result taken from Scenario 1 as the reference case.
- (4)
- Scenario 4: Multi-Destination Task
To extend the problem beyond a single origin–destination pair, a multi-destination scenario is introduced.
A single UAV departs from a central depot and is required to serve multiple customer locations. Each destination is treated independently, and separate paths are generated for each delivery task.
The environment is set as a medium-density urban area with the complex wind-field model . Performance metrics such as total cost, average cost, and path variability are analyzed.
4.2. Parameter Input
The common simulation, objective function, and algorithmic parameters used in this study are summarized in Table 1, Table 2, Table 3 and Table 4. The simulation domain is defined as a m voxelized urban space with a spatial resolution of m. The UAV cruise speed is set to 15 m/s, and the maximum climb angle is limited to . For objective evaluation, the four normalized cost components, namely time cost, energy consumption cost, wind-field cost, and path smoothness cost, are weighted by –. In the wind-field term, the relative contributions of horizontal wind resistance, vertical wind shear, and building-induced disturbance are controlled by –.
Table 1.
Common simulation, objective function, and algorithm parameters.
Table 2.
Wind model parameters.
Table 3.
Simulation scenario settings.
Table 4.
Cost components in Scene 1.
For fair comparison, the main algorithmic settings are kept unchanged across all scenarios. In particular, the population size and maximum iteration number of WOA and IWOA are fixed at 60 and 150, respectively. In implementation, each candidate path is encoded by path points. The parameters of the two wind models are listed in Table 2, while the five simulation scenarios are summarized in Table 3.
4.3. Result Visualization
4.3.1. Baseline Comparison in the Medium-Density Environment Under Wind Model A
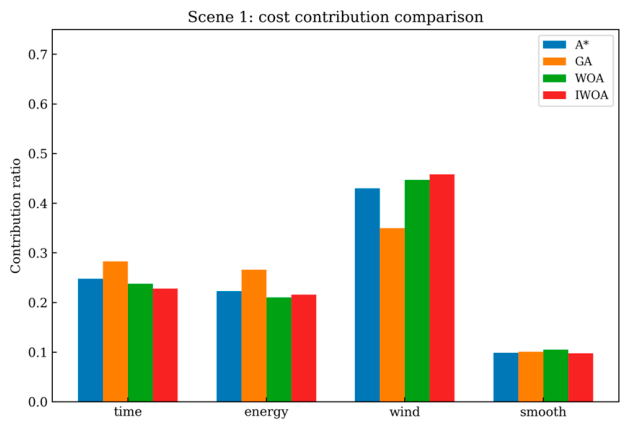
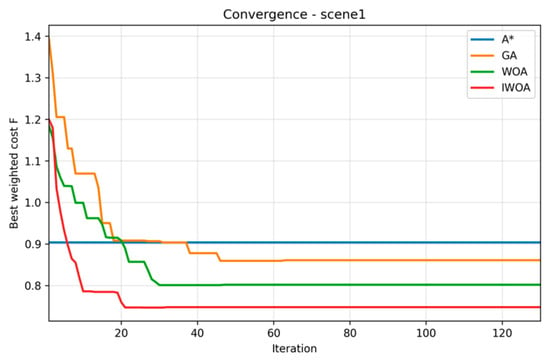
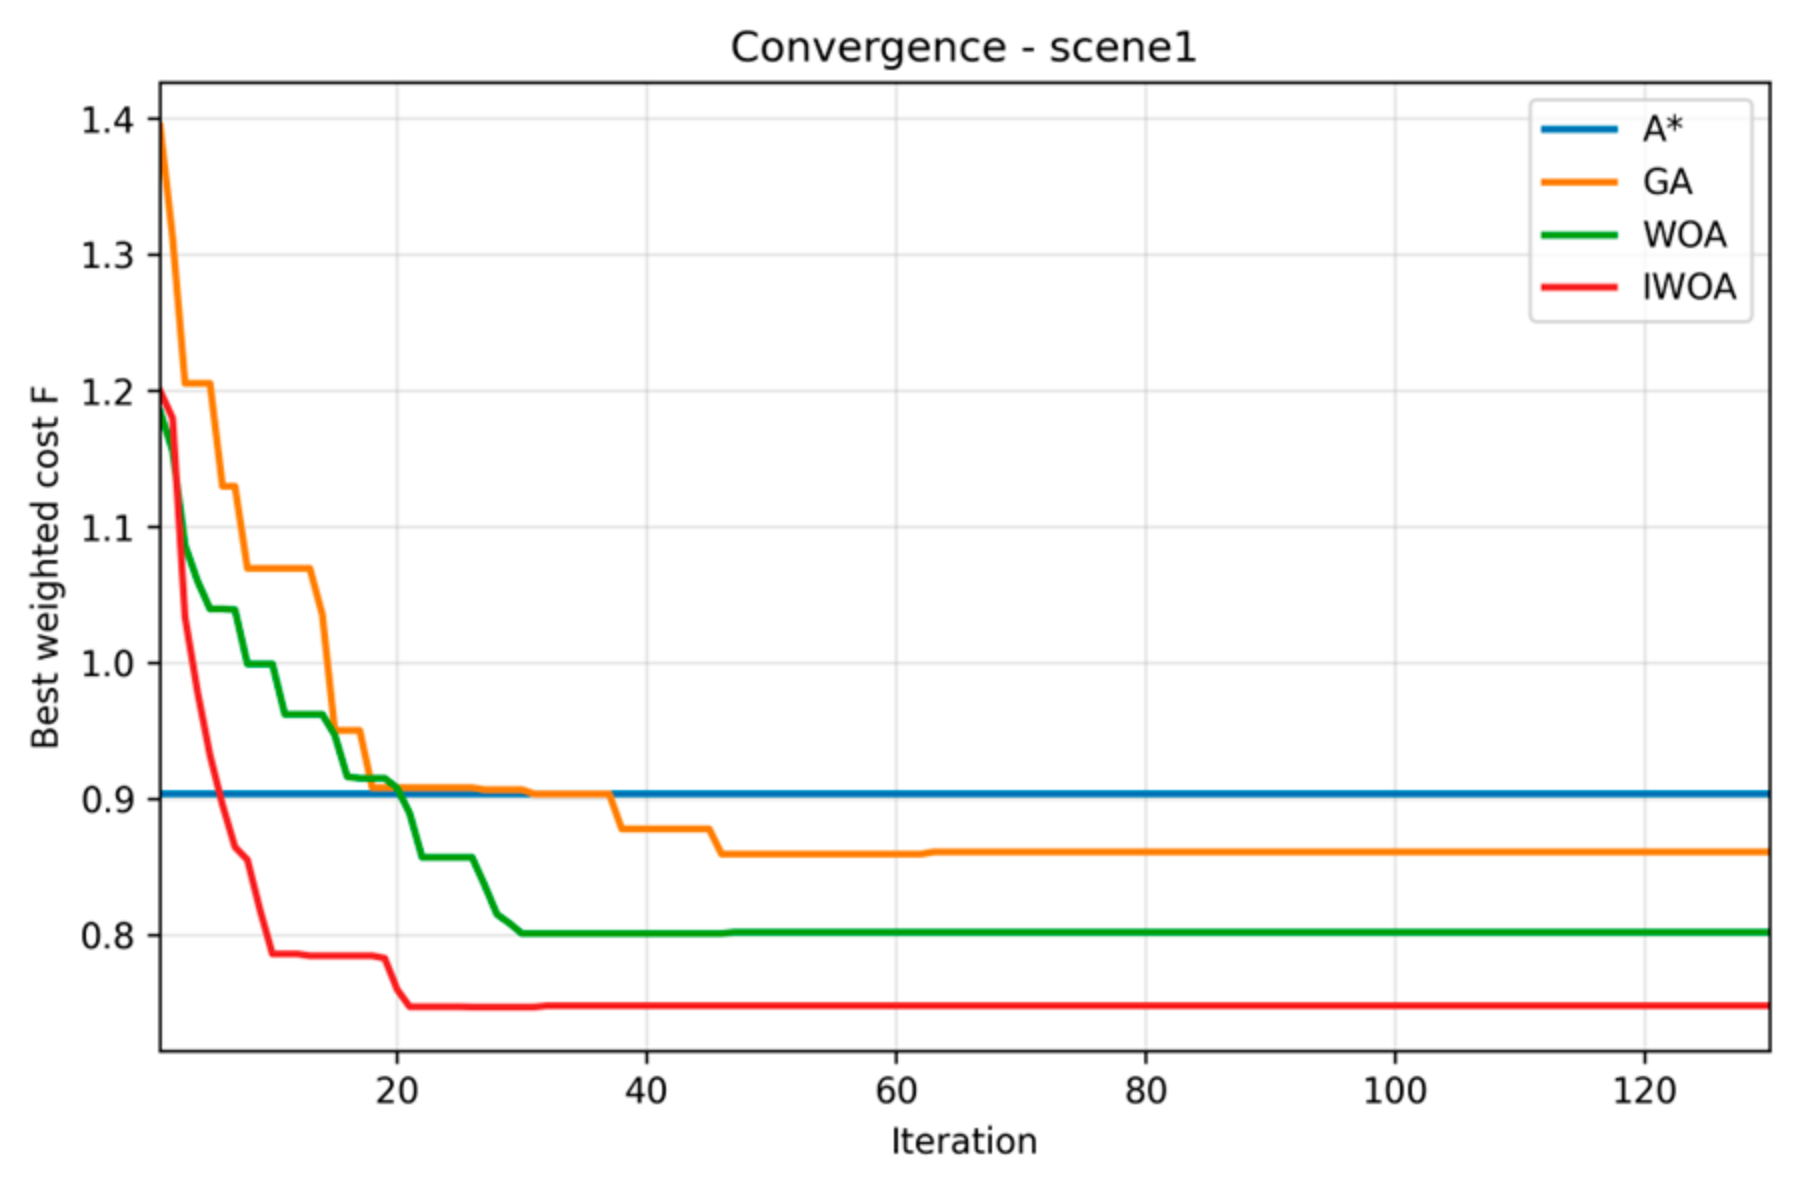
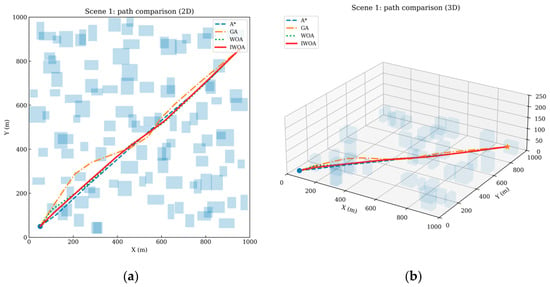
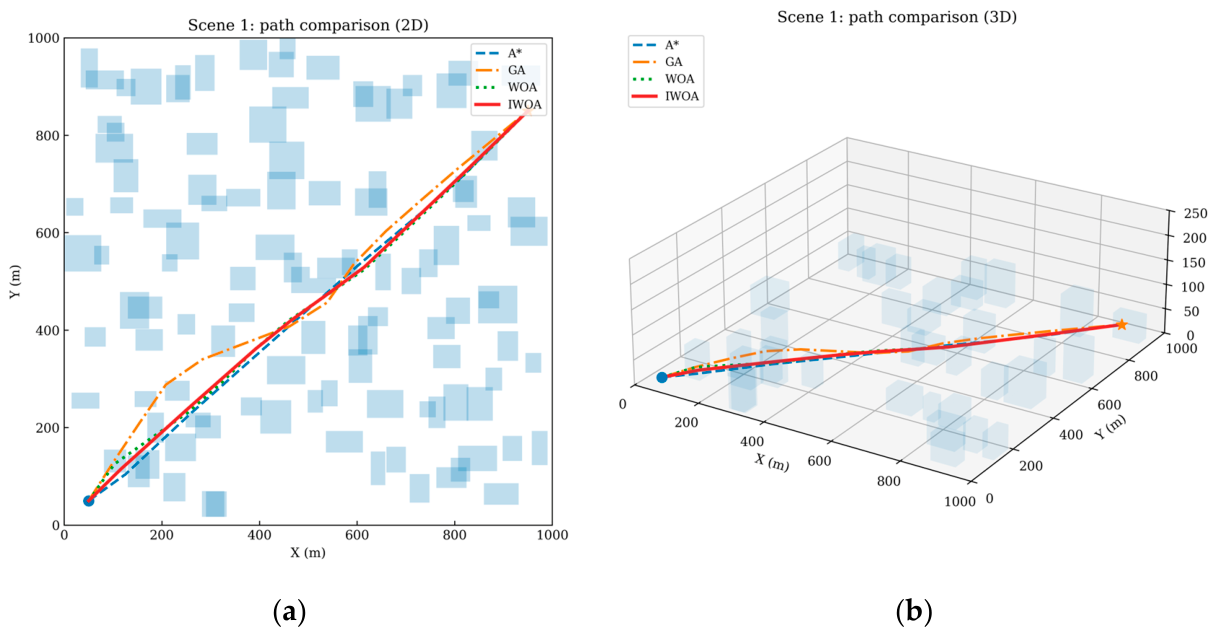
Table 4 and Figure 6, Figure 7 and Figure 8 present the baseline results in the medium-density urban environment under wind model A. Among the four compared algorithms, IWOA achieves the lowest composite cost, with F = 0.748, whereas the corresponding values of WOA, GA, and A* are 0.802, 0.861, and 0.904, respectively. This corresponds to total cost reductions of 6.7%, 13.1%, and 17.3% relative to WOA, GA, and A*, respectively. At the component level, the most significant gain comes from the wind-field term f3. Compared with A*, GA, and WOA, the wind-field cost of IWOA is reduced by 42.3%, 29.2%, and 17.4%, respectively, indicating that the proposed wind-aware local adjustment mechanism effectively guides the search away from high-penalty airflow regions. Meanwhile, the time cost f1 and energy cost f2 of IWOA are also slightly lower than those of the other algorithms, which shows that the gain is not obtained by sacrificing flight efficiency.
Figure 6.
Cost contribution comparison of A*, GA, WOA, and IWOA in Scene 1.
Figure 7.
Convergence curves of A*, GA, WOA, and IWOA in Scene 1.
Figure 8.
(a): 2D path comparison of A*, GA, WOA, and IWOA in Scene 1; (b): 3D path comparison of A*, GA, WOA, and IWOA in Scene 1. Blue squares denote obstacles, the blue dot denotes the start point, and the orange star denotes the destination.
The visual results further support the numerical comparison. Figure 6 shows that the contribution of the wind-field penalty is dominant in the overall cost difference, while Figure 7 indicates that IWOA reaches a stable convergence stage earlier than GA and WOA. In contrast, A* remains at a fixed level because it does not perform iterative population-based improvement. As shown in Figure 8, the 2D and 3D paths generated by IWOA are shorter and smoother, with fewer unnecessary turns and more effective avoidance of wind-sensitive regions. Therefore, under the baseline setting, IWOA already demonstrates a better balance among efficiency, energy consumption, and environmental adaptability than the three benchmark algorithms.
4.3.2. Performance Under Different Urban Densities
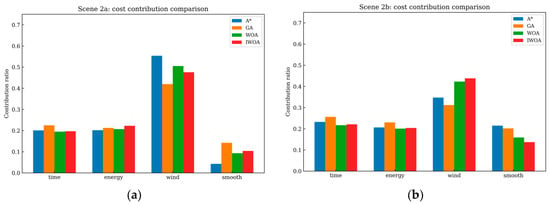
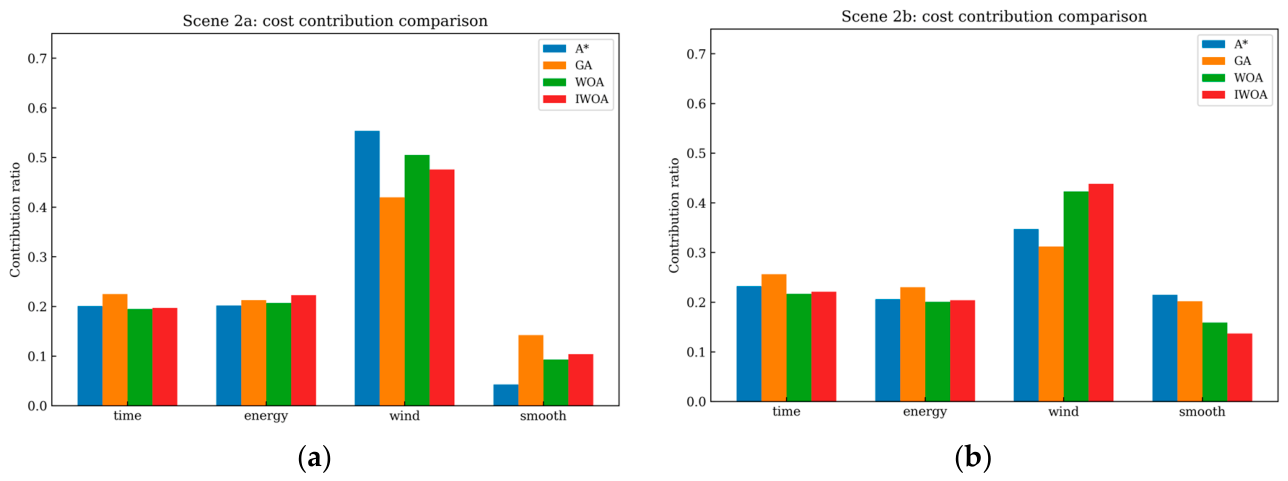
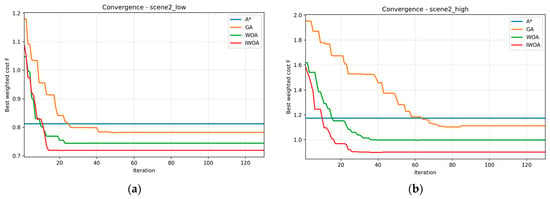
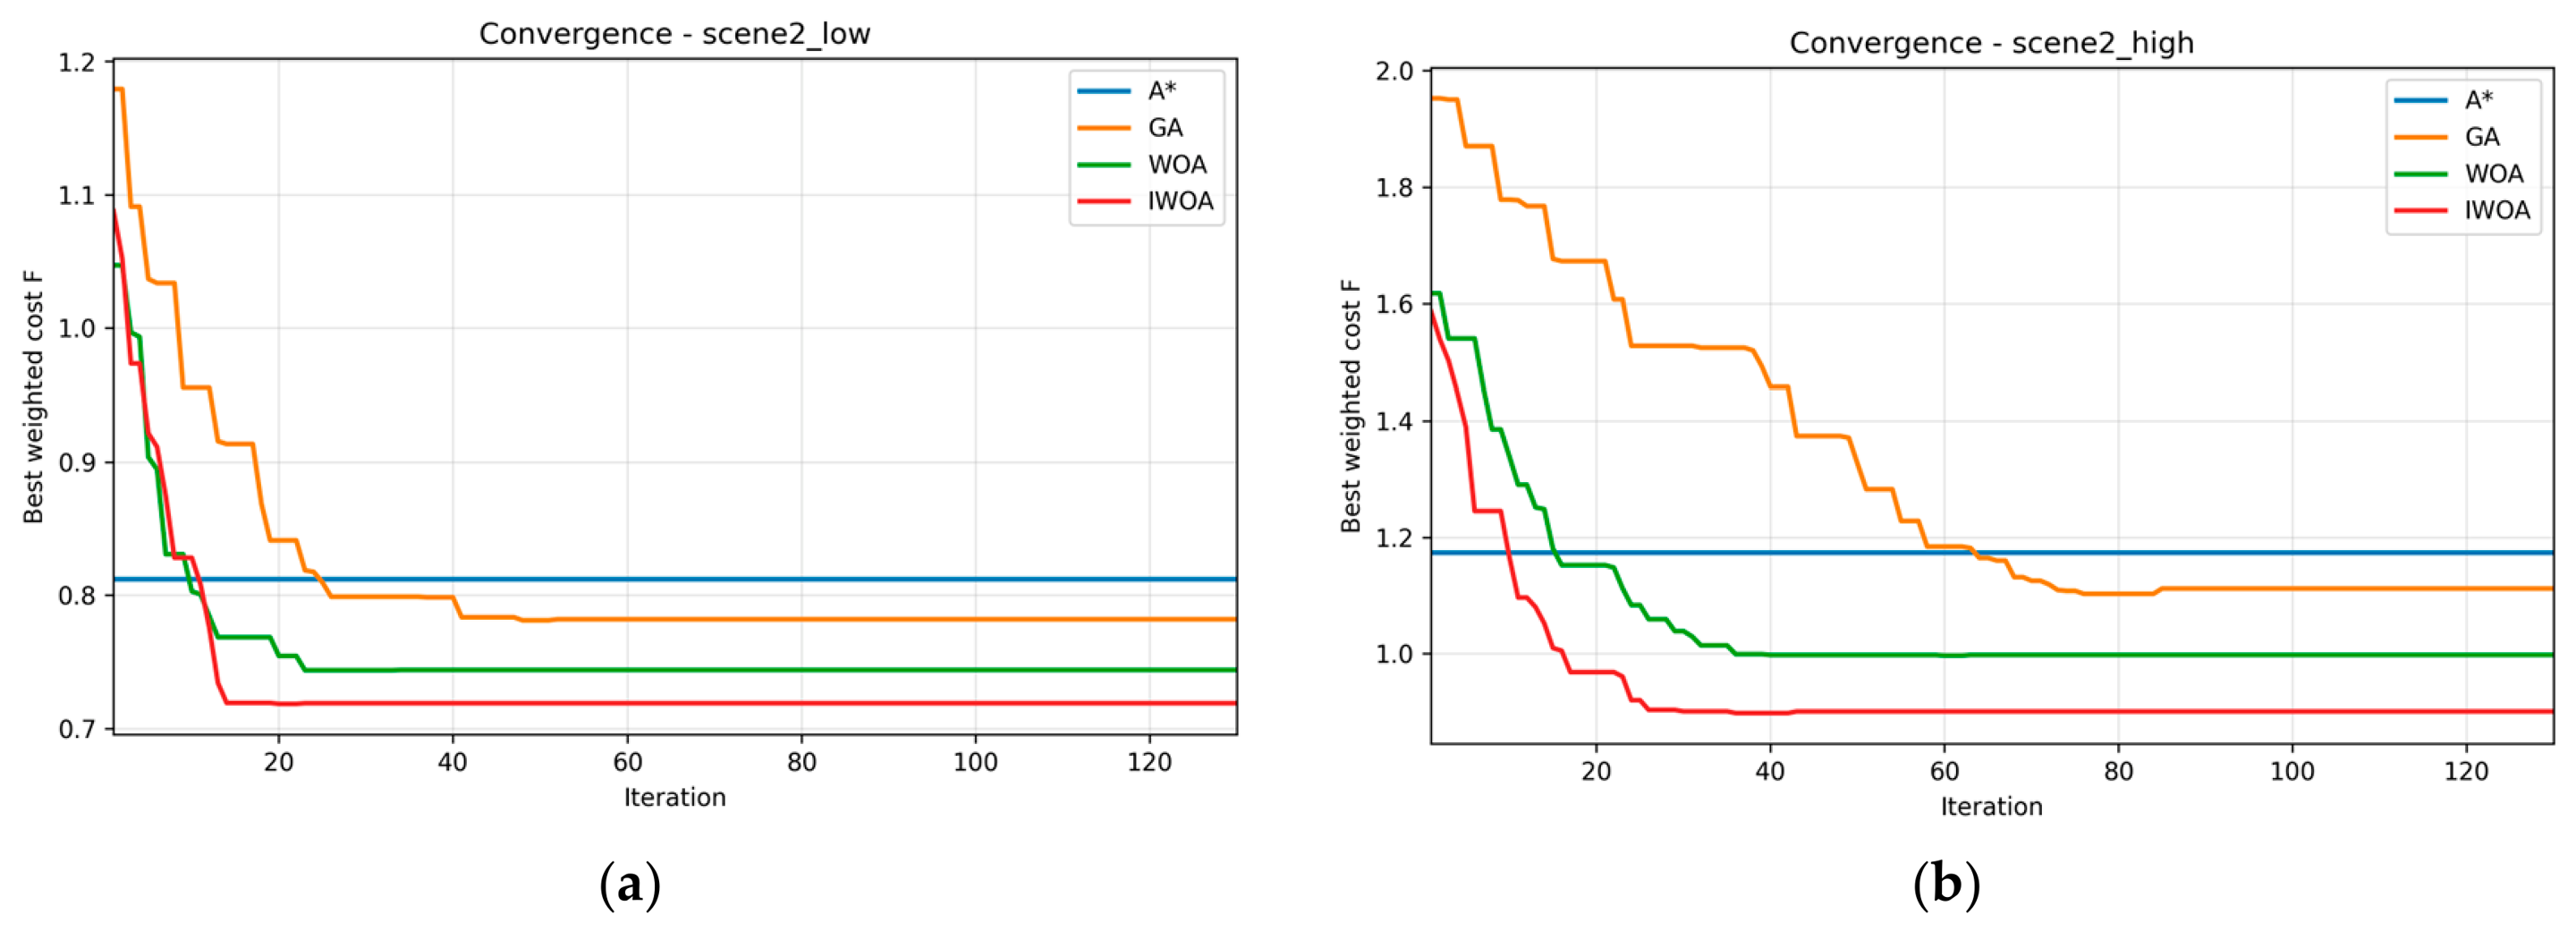
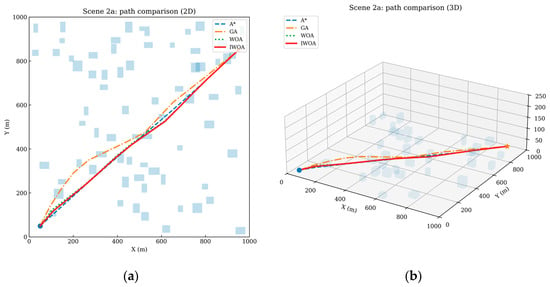
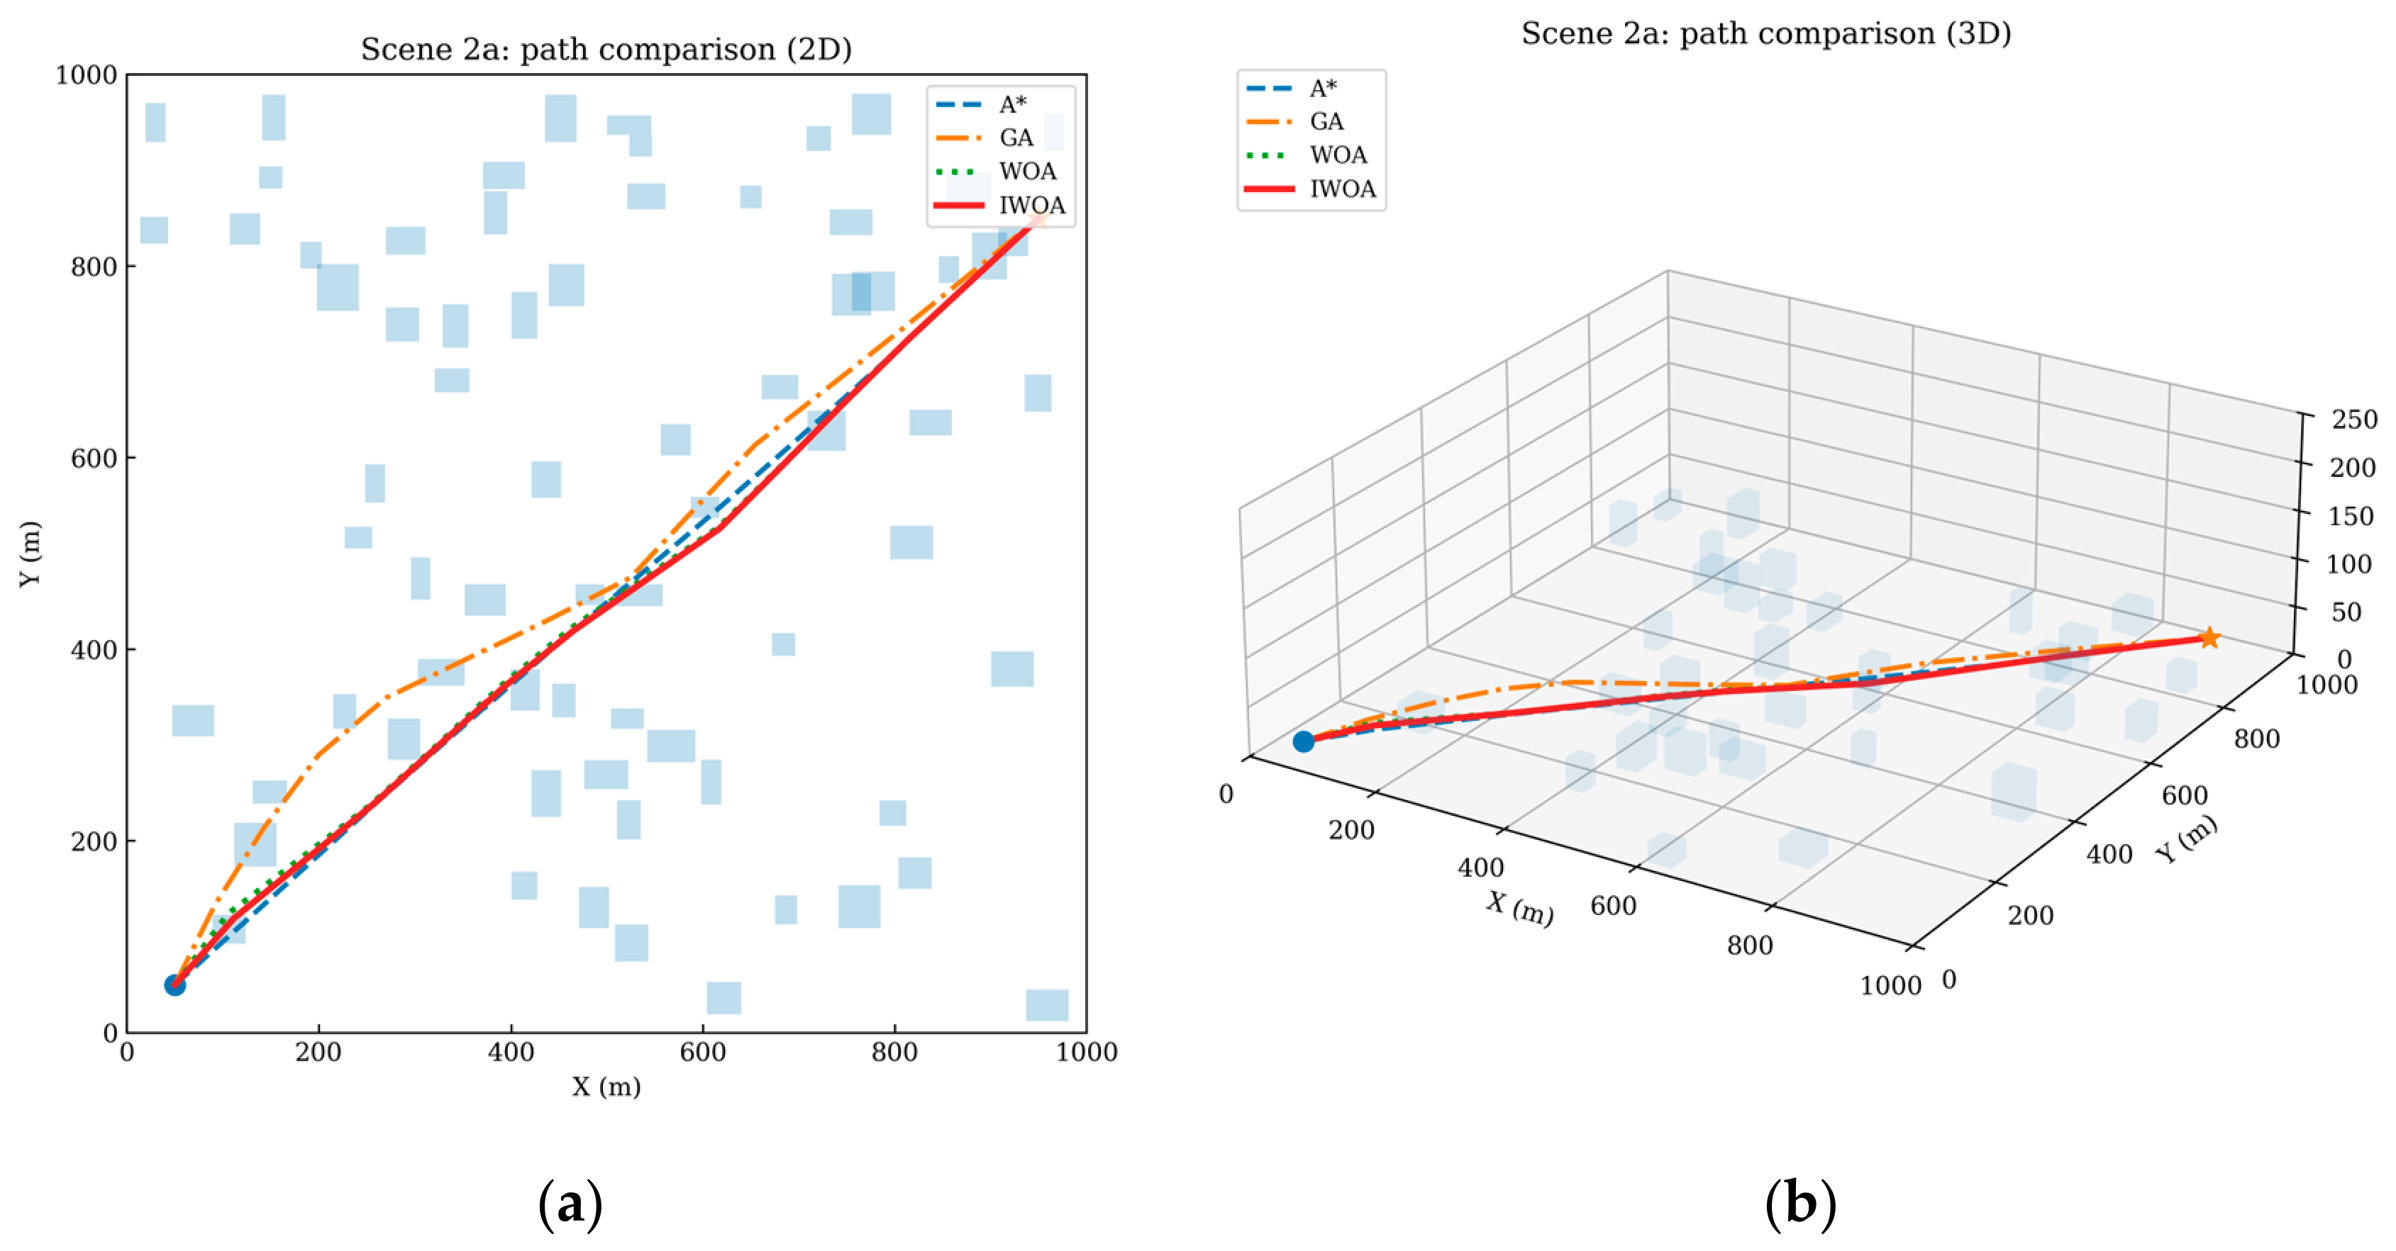
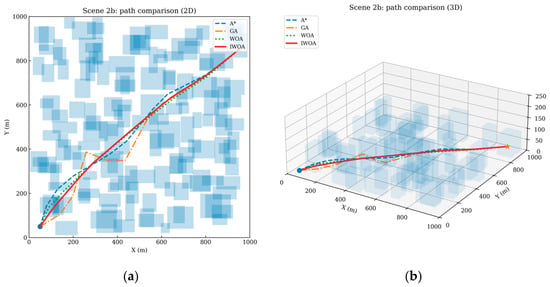
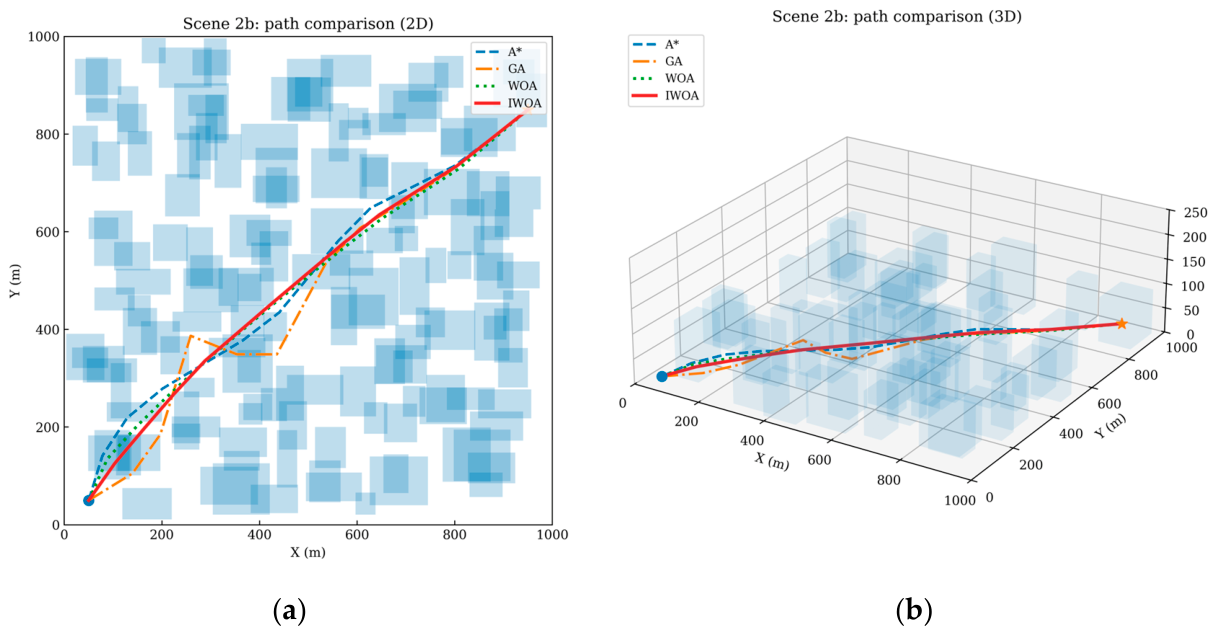
Table 5 and Table 6, together with Figure 9, Figure 10, Figure 11 and Figure 12, illustrate the effect of urban density on algorithm performance. In the low-density environment, all algorithms can produce feasible paths with relatively small detours, and the performance gap between methods is moderate. Even in this comparatively simple case, IWOA still yields the lowest total cost (F = 0.719), outperforming WOA, GA, and A* by 3.4%, 8.1%, and 11.5%, respectively. The improvement is again mainly associated with the wind-field term, because a more adaptive path can exploit the available open space while avoiding local adverse airflow regions.
Table 5.
Cost components in Scene 2 under the low-density urban environment.
Table 6.
Cost components in Scene 2 under the high-density urban environment.
Figure 9.
(a): Cost contribution comparison of A*, GA, WOA, and IWOA in Scene 2 under the low-density urban environment; (b): cost contribution comparison of A*, GA, WOA, and IWOA in Scene 2 under the high-density urban environment.
Figure 10.
(a): Convergence curves of A*, GA, WOA, and IWOA in Scene 2 under the low-density urban environment; (b): convergence curves of A*, GA, WOA, and IWOA in Scene 2 under the high-density urban environment.
Figure 11.
(a): 2D path comparison of A*, GA, WOA, and IWOA in Scene 2 under the low-density urban environment; (b): 3D path comparison of A*, GA, WOA, and IWOA in Scene 2 under the low-density urban environment. Blue squares denote obstacles, the blue dot denotes the start point, and the orange star denotes the destination.
Figure 12.
(a): 2D path comparison of A*, GA, WOA, and IWOA in Scene 2 under the high-density urban environment; (b): 3D path comparison of A*, GA, WOA, and IWOA in Scene 2 under the high-density urban environment. Blue squares denote obstacles, the blue dot denotes the start point, and the orange star denotes the destination.
When the environment changes from low density to high density, the planning difficulty increases sharply. The total cost of A*, GA, WOA, and IWOA rises from 0.812, 0.782, 0.744, and 0.719 to 1.173, 1.112, 0.998, and 0.901, corresponding to increases of 44.5%, 42.2%, 34.1%, and 25.3%, respectively. This comparison indicates that IWOA is the least sensitive to increasing urban geometric complexity. In the high-density case, IWOA still remains the best-performing method and reduces the total cost by 9.7%, 19.0%, and 23.2% relative to WOA, GA, and A*. The path plots in Figure 11 and Figure 12 indicate that obstacle crowding forces all algorithms to take longer detours and to pass through narrower corridors, but IWOA preserves smoother route geometry and lower wind-related costs. Hence, the proposed strategy is particularly advantageous when obstacle density and corridor confinement become severe.
4.3.3. Performance Under the Complex Wind Field
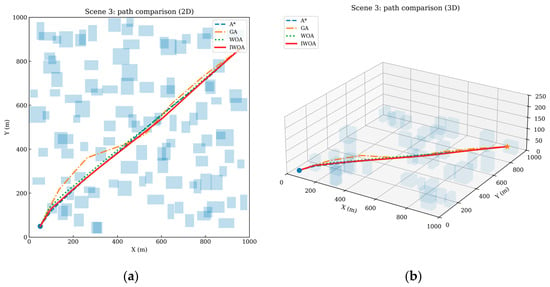
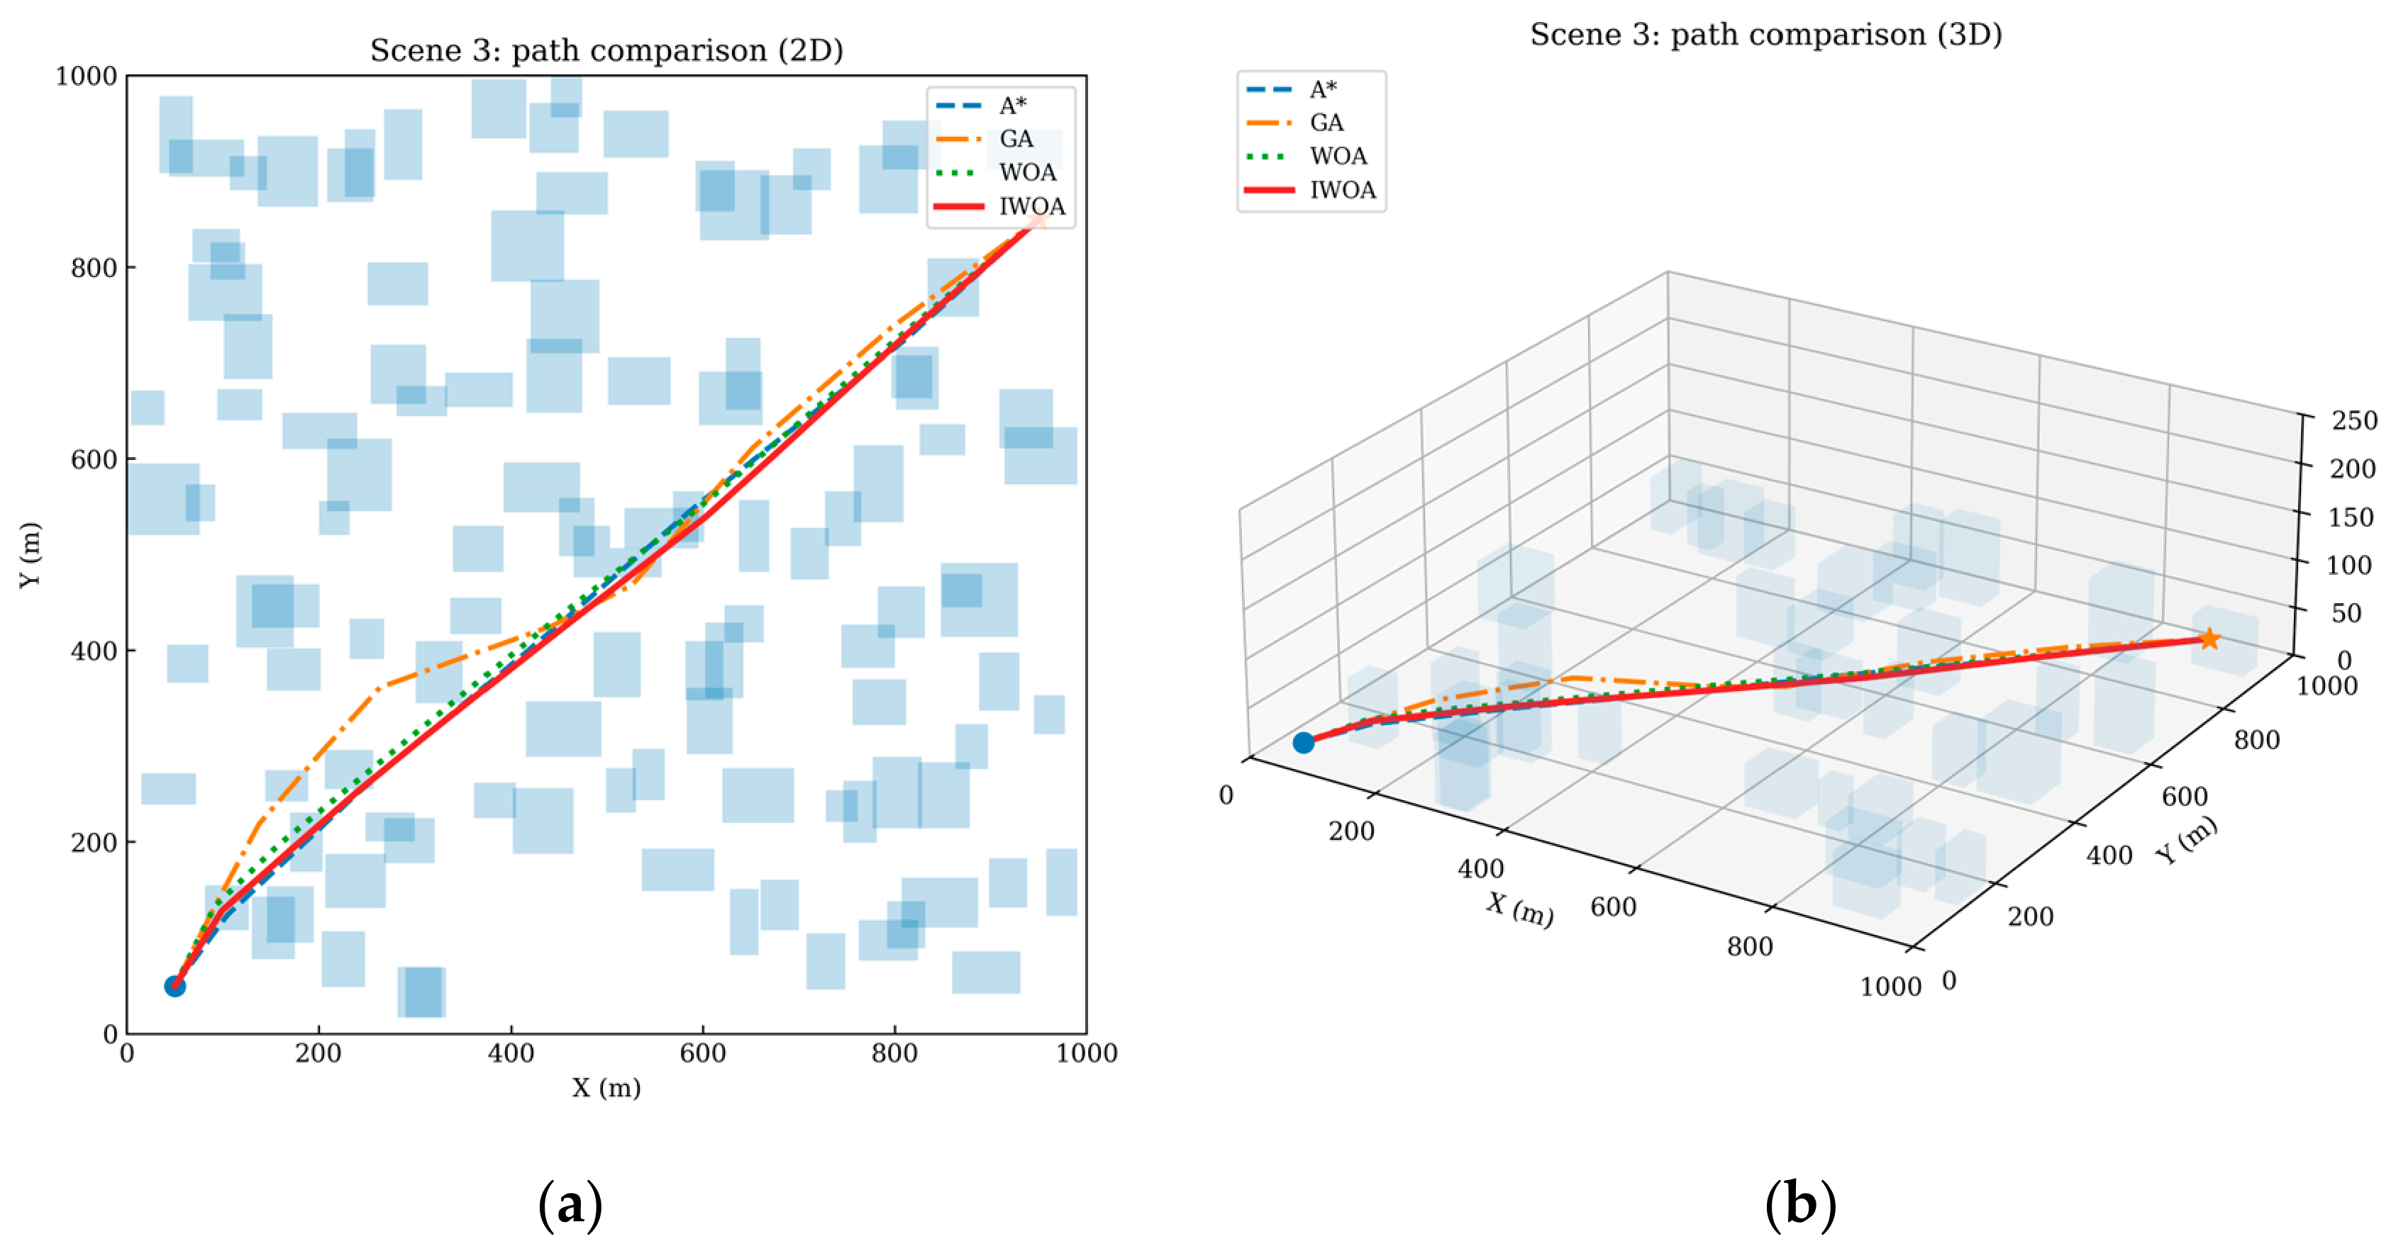
Table 7 and Figure 13, Figure 14 and Figure 15 compare the algorithms under the complex wind field while keeping the medium-density urban morphology unchanged. Relative to the baseline case in Scene 1, the total cost increases for all methods, which confirms that building-induced wind disturbances impose a substantial additional burden on route planning. However, the increase is the smallest for IWOA. Specifically, the total cost of IWOA rises from 0.748 in Scene 1 to 0.821 in Scene 3, corresponding to an increase of 9.8%, whereas the increases for WOA, GA, and A* are 14.0%, 15.9%, and 16.4%, respectively. This result demonstrates that IWOA has stronger robustness when the wind field becomes spatially heterogeneous and more turbulent.
Table 7.
Cost components in Scene 3.
Figure 13.
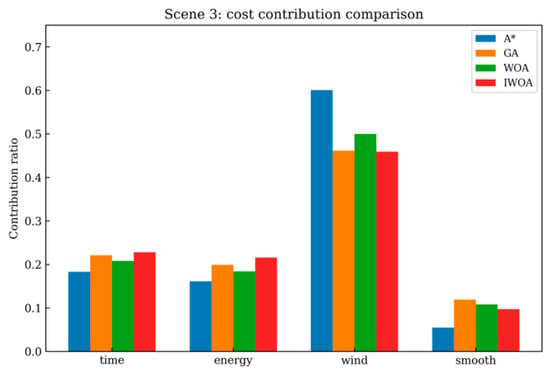
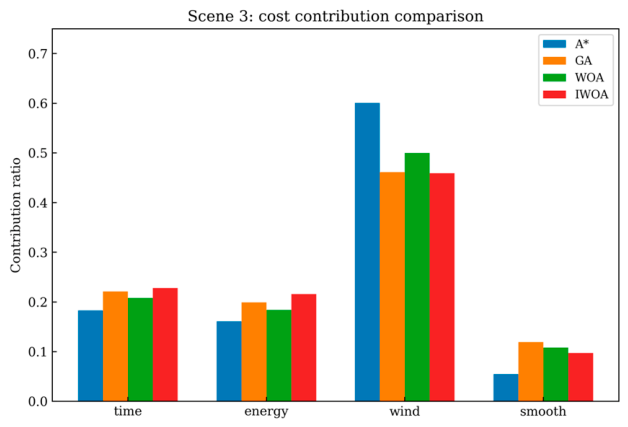
Cost contribution comparison of A*, GA, WOA, and IWOA in Scene 3.
Figure 14.
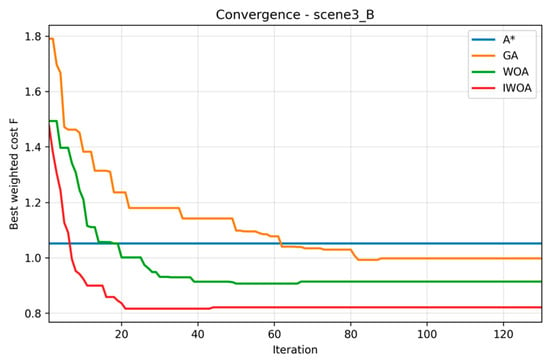
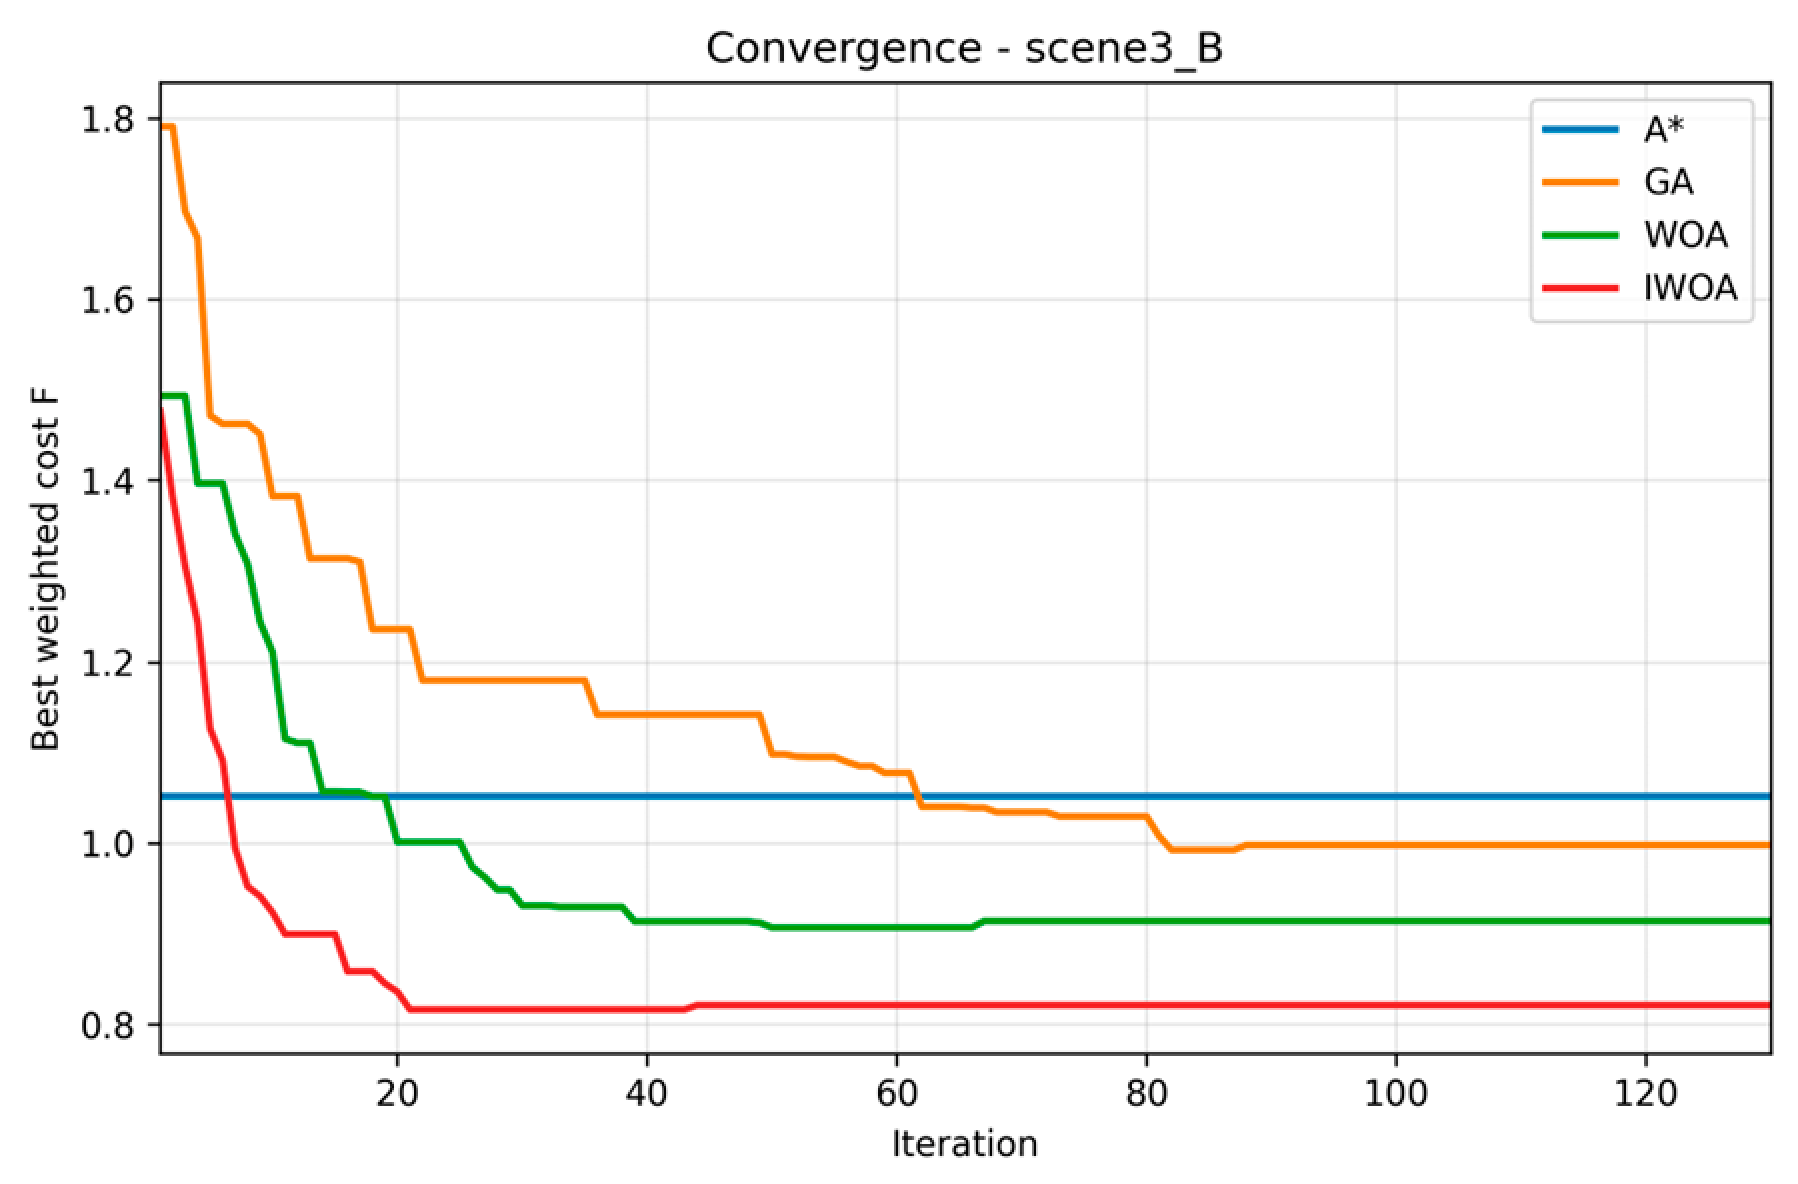
Convergence curves of A*, GA, WOA, and IWOA in Scene 3.
Figure 15.
(a): 2D path comparison of A*, GA, WOA, and IWOA in Scene 3; (b): 3D path comparison of A*, GA, WOA, and IWOA in Scene 3. Blue squares denote obstacles, the blue dot denotes the start point, and the orange star denotes the destination.
A closer inspection of the cost components indicates that the wind-field term remains the dominant source of performance variation. Compared with Scene 1, the wind-related component f3 increases for all algorithms, but the increase is still comparatively restrained for IWOA. Figure 13 shows that IWOA retains the lowest wind penalty among all methods, and Figure 14 indicates faster stabilization than GA and WOA even under the more difficult wind conditions. As shown in Figure 15, the paths generated by IWOA avoid the high-risk disturbance regions more effectively and exhibit fewer sharp detours. Therefore, the advantage of the proposed method is not limited to generic optimization capability; rather, it is closely associated with the explicit use of wind-field information during local search and repair.
4.3.4. Extension to Multi-Destination Delivery Tasks
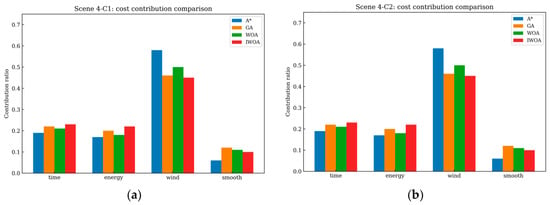
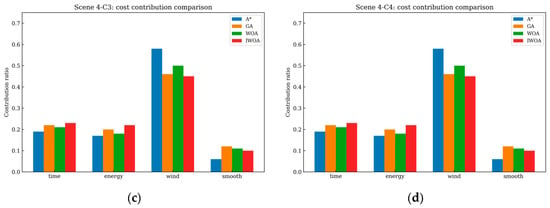
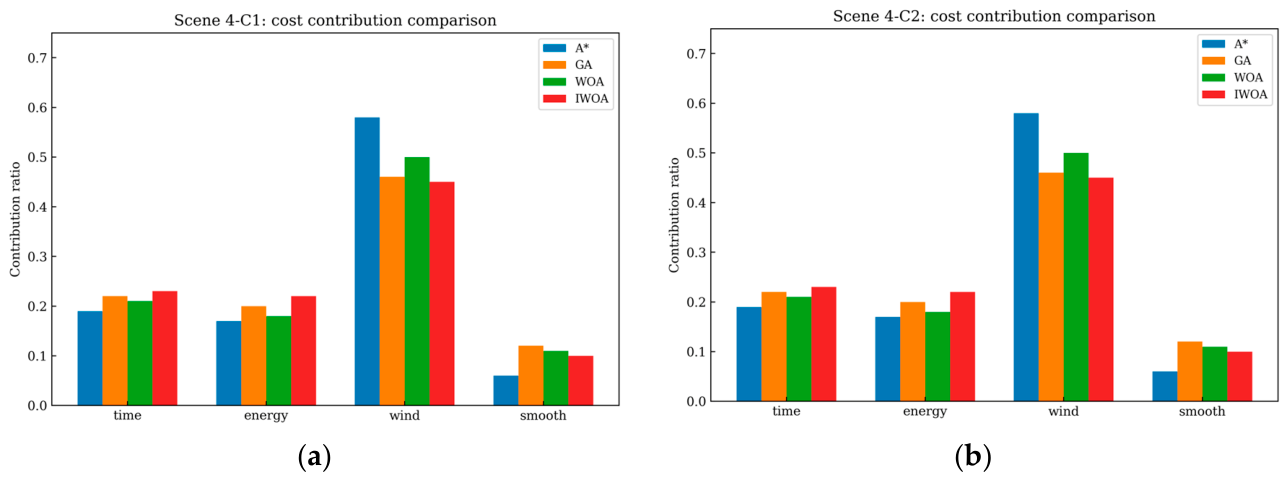
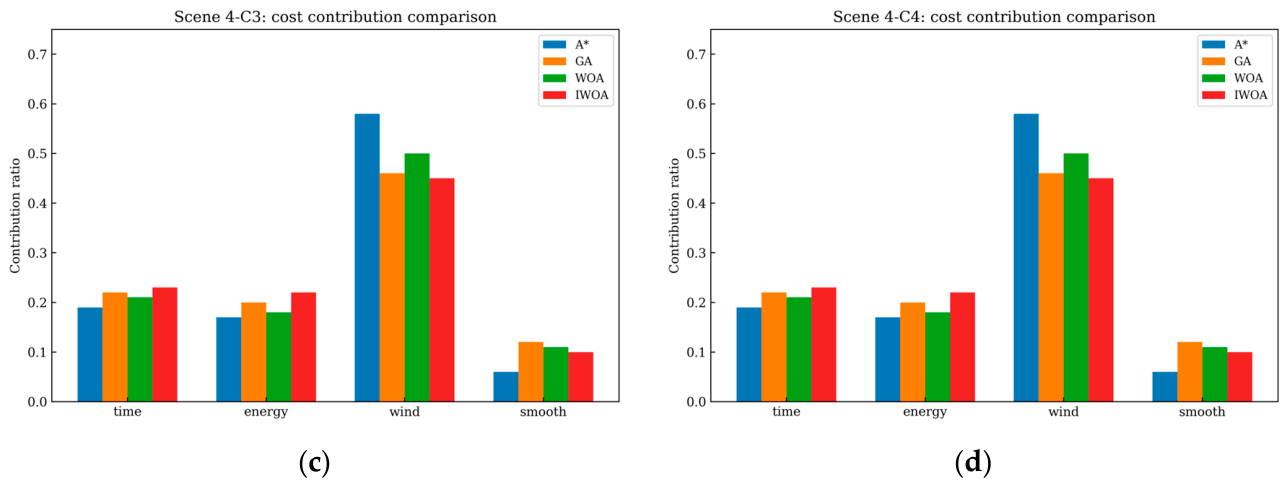
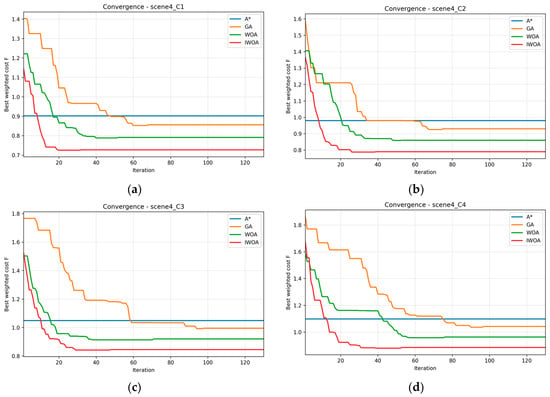
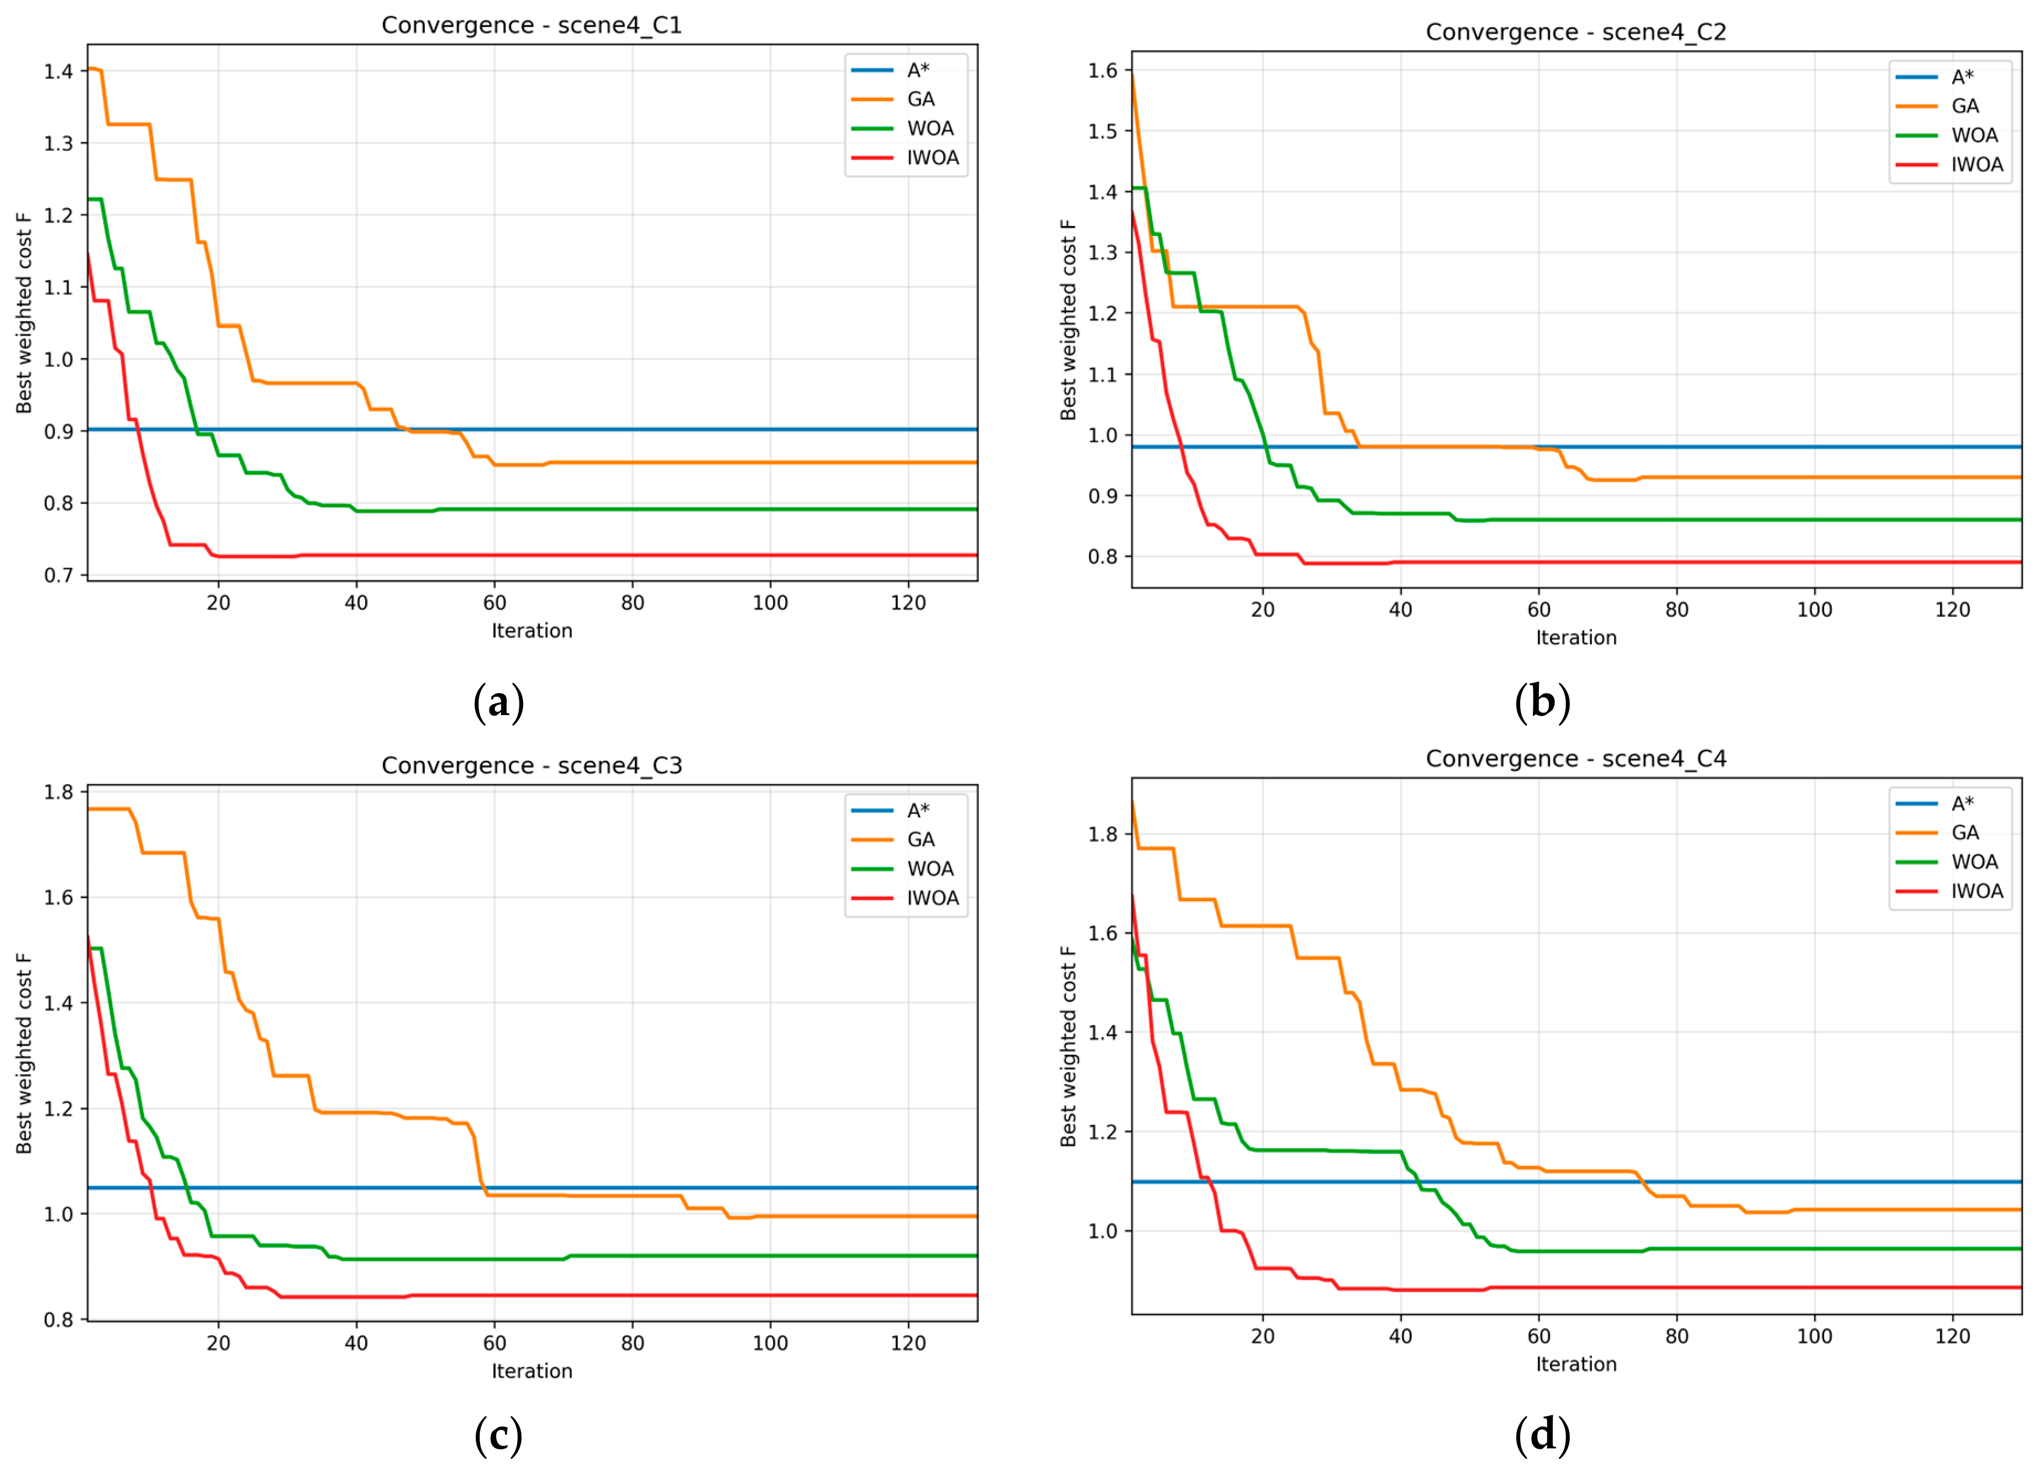
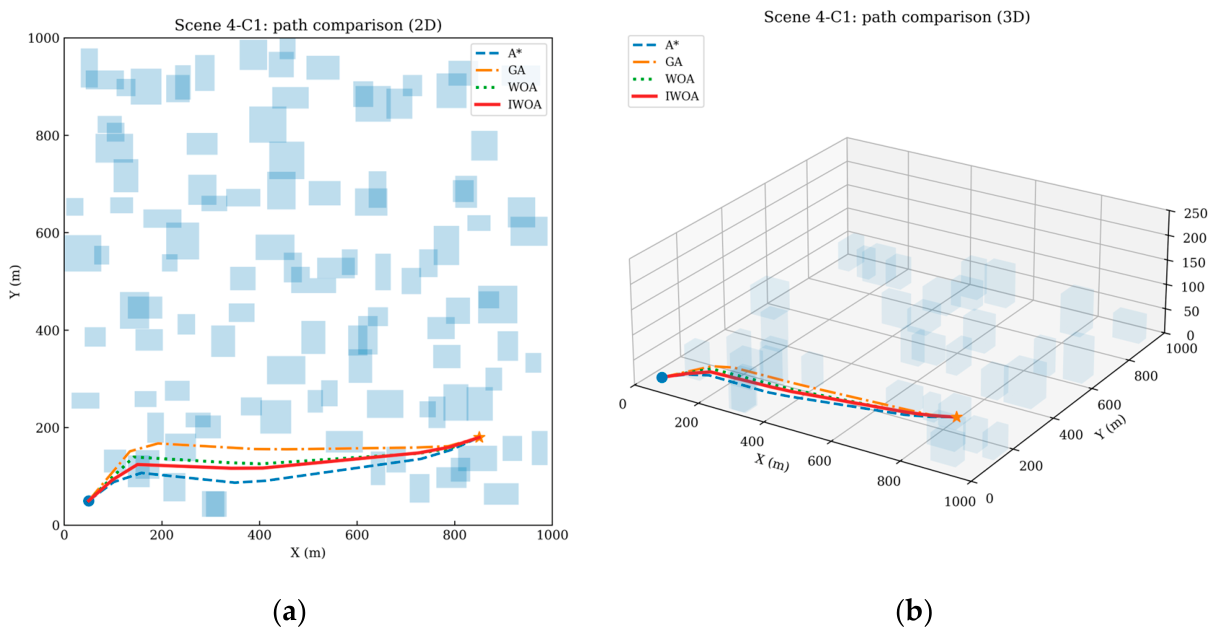
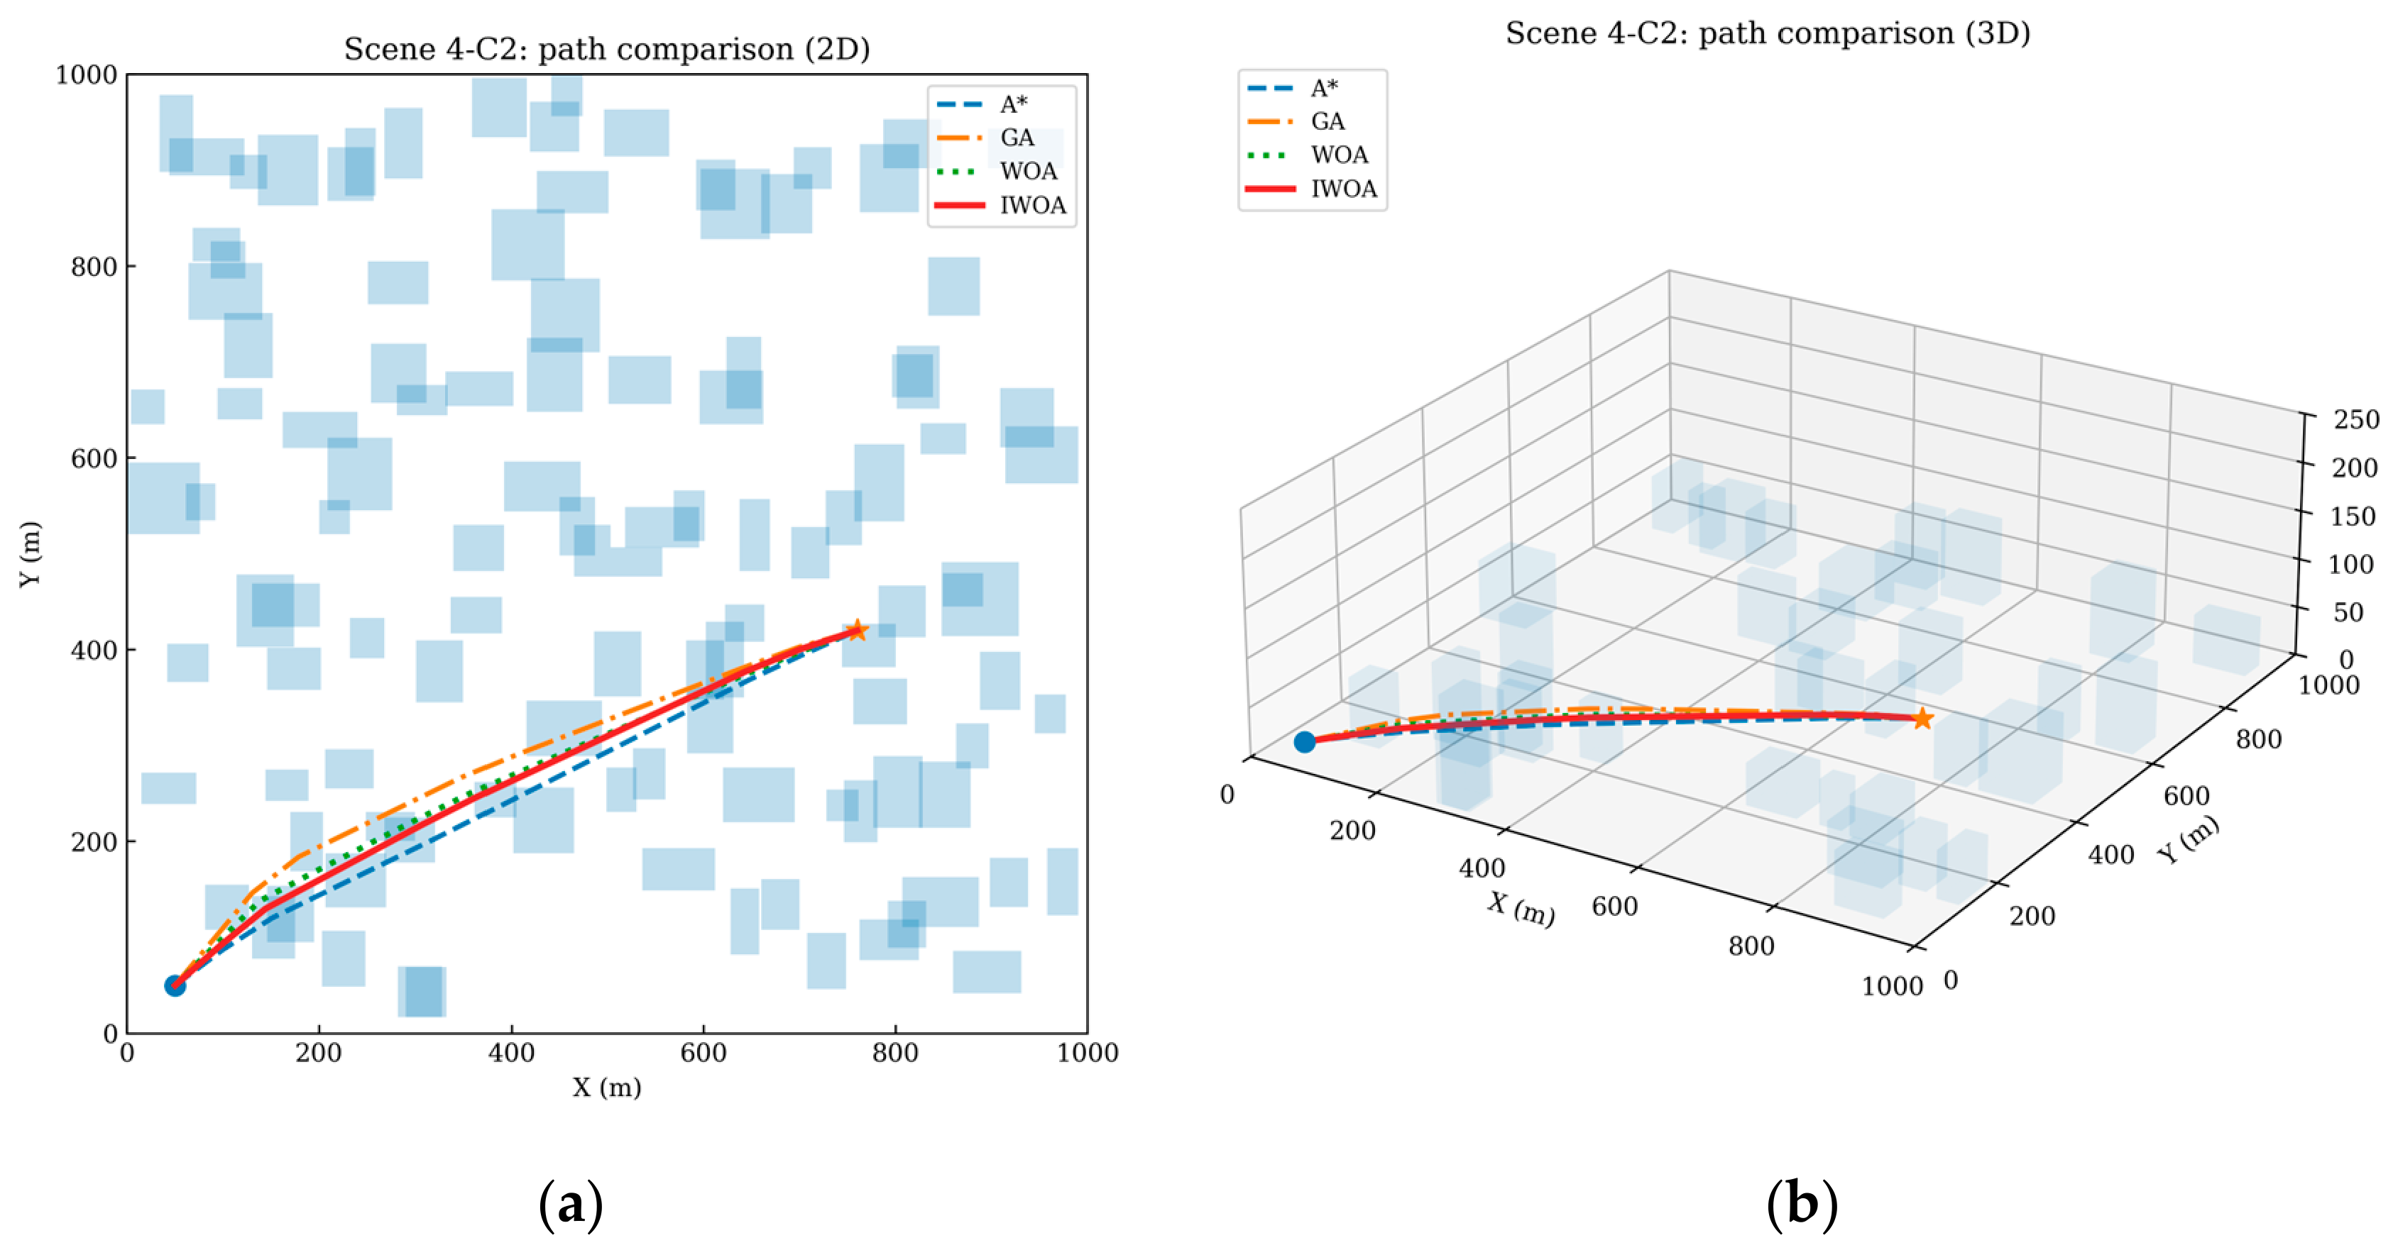
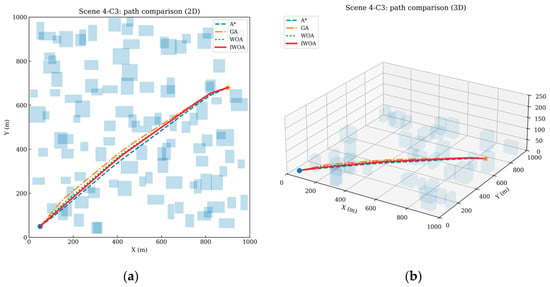
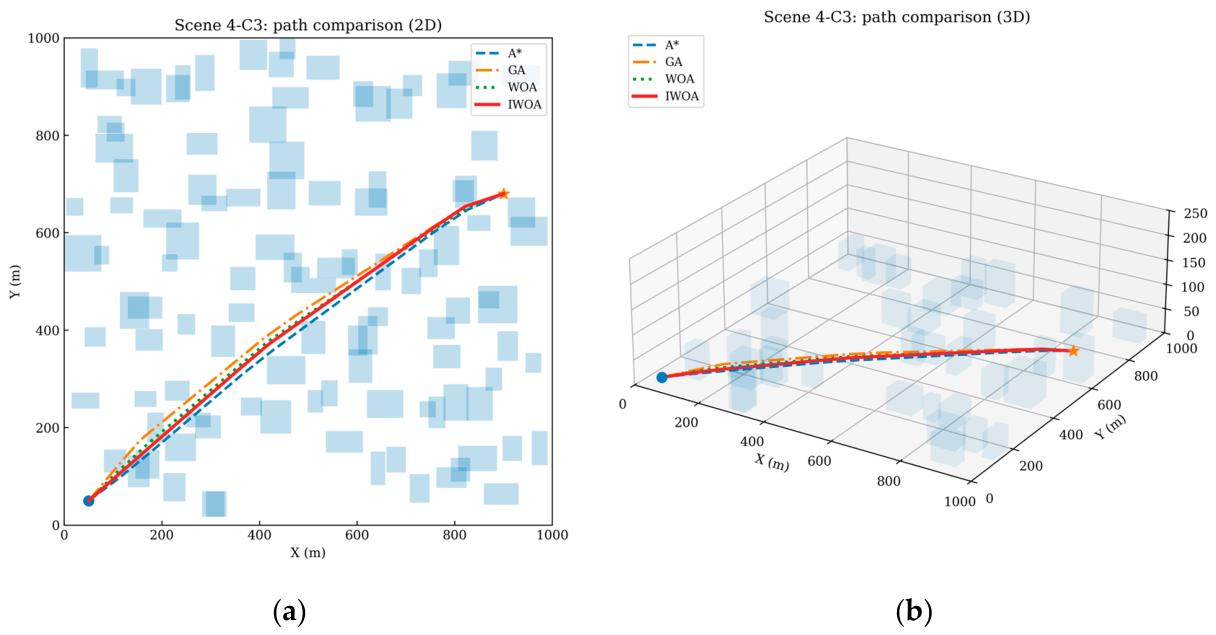
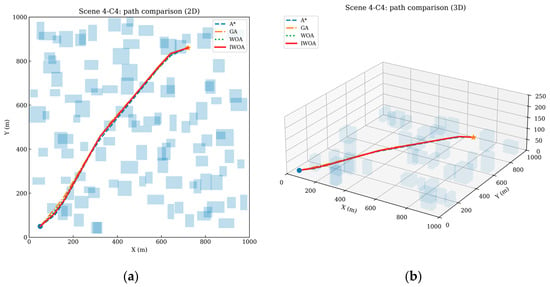
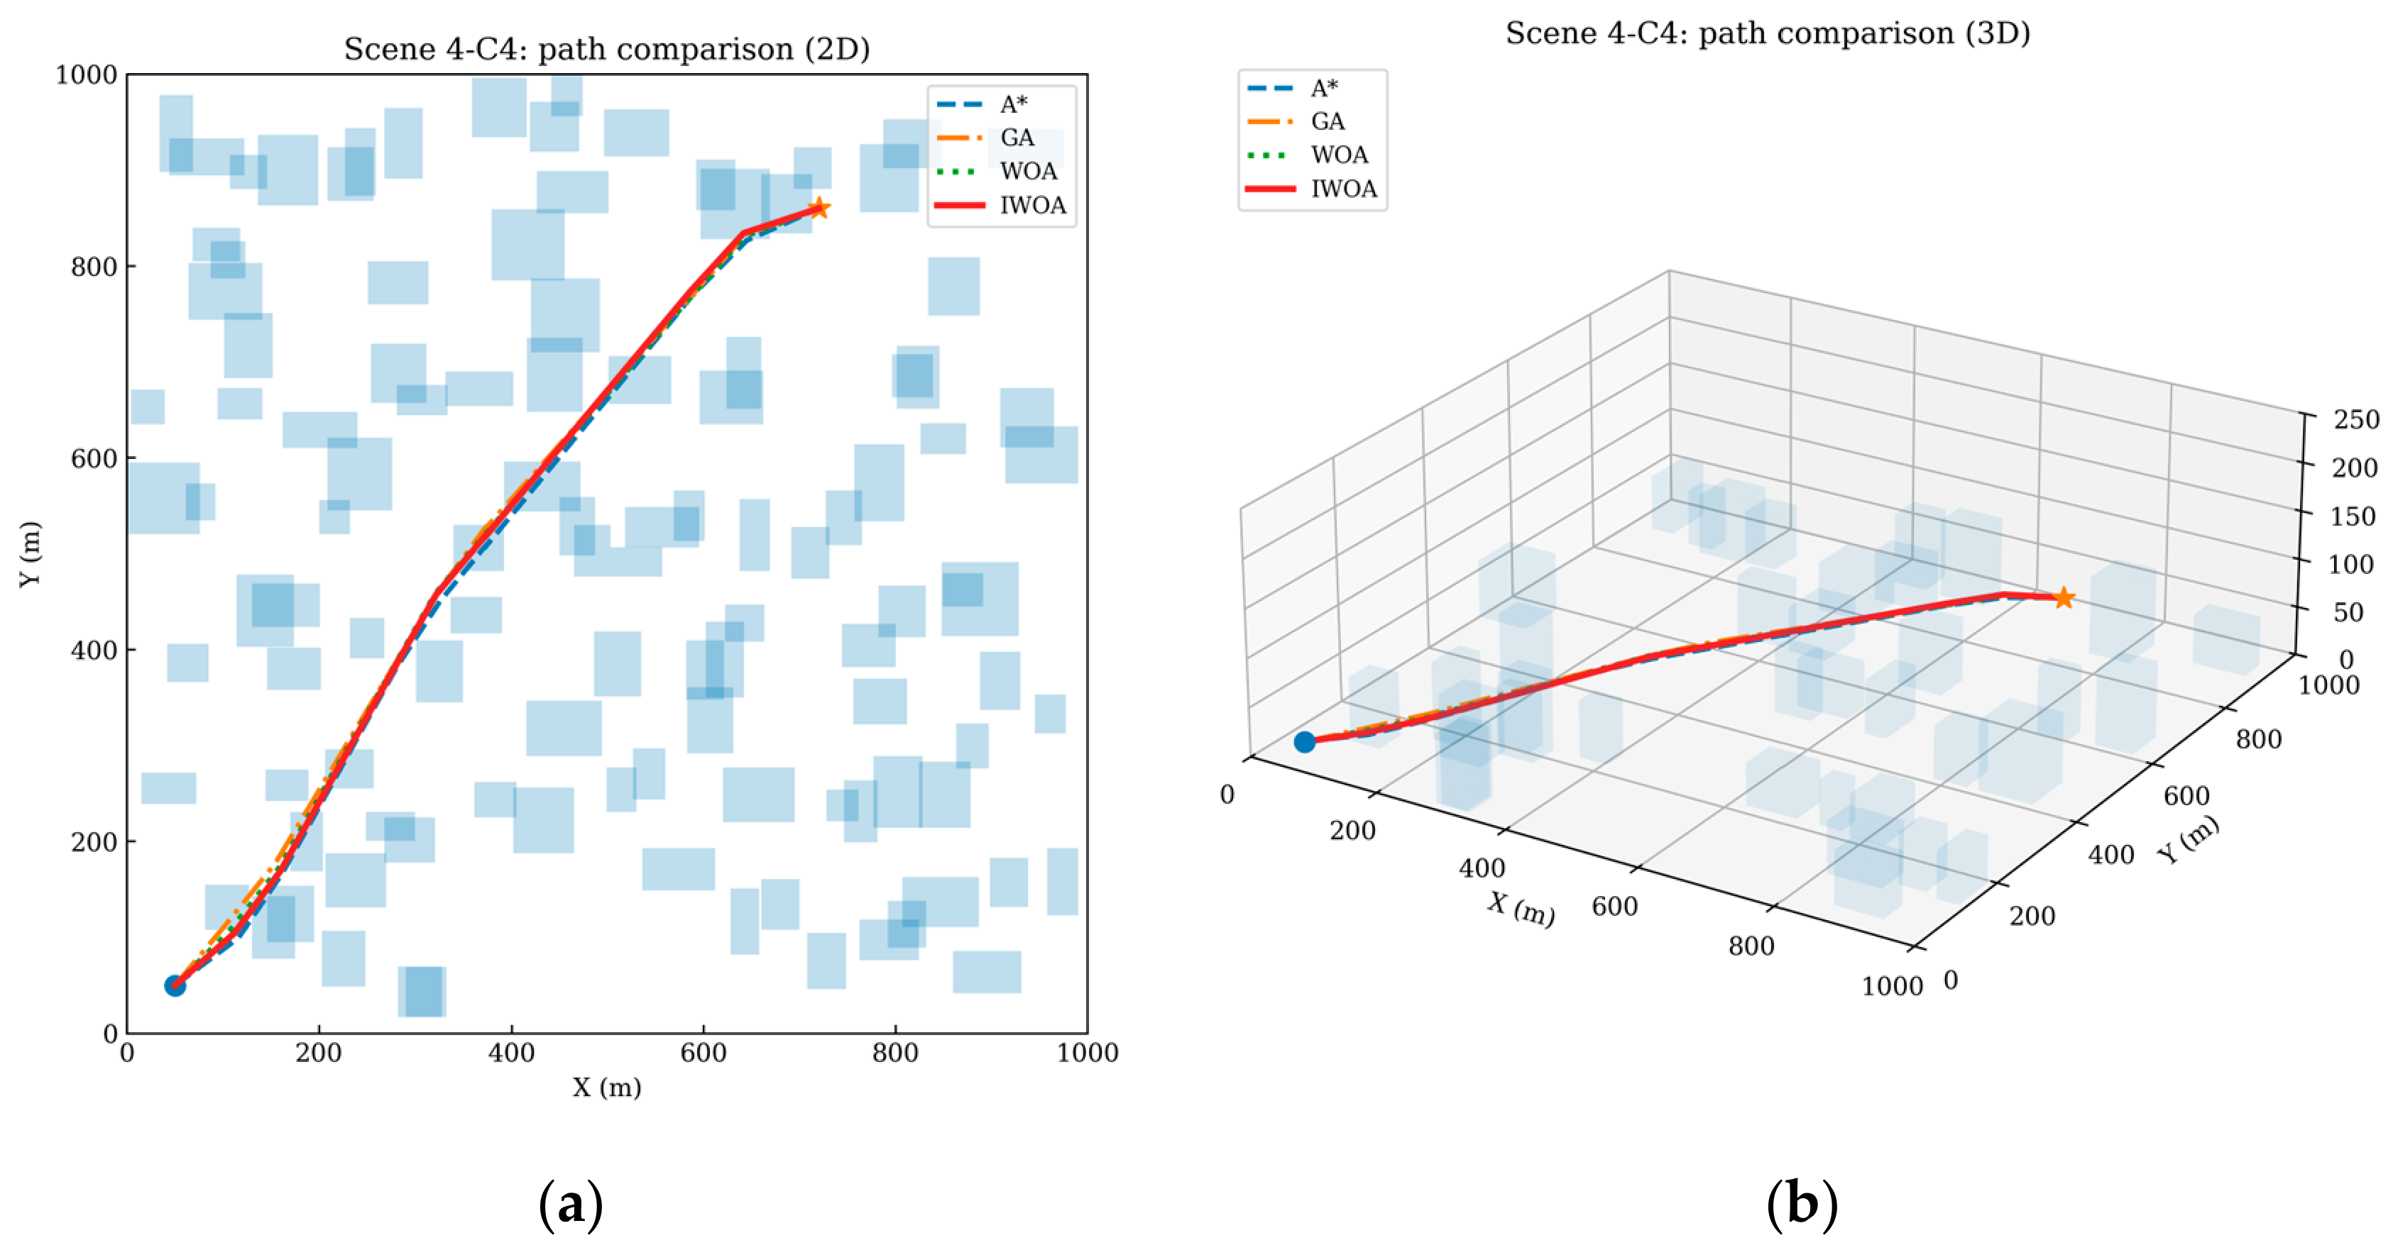
Scene 4 extends the problem from a single destination to multiple customer points and is used to evaluate the generality of the proposed method in a delivery-oriented setting. The results in Table 8 and Figure 16, Figure 17, Figure 18, Figure 19, Figure 20 and Figure 21 show that IWOA consistently achieves the lowest total cost for all four destinations. For customer points C1–C4, the total costs of IWOA are 0.727, 0.790, 0.845, and 0.885, respectively, which are lower than those of WOA, GA, and A* in every case. On average, the total cost of IWOA across the four destinations is 0.812, representing reductions of about 8.1%, 15.1%, and 19.4% relative to WOA, GA, and A*, respectively. This consistency indicates that the proposed algorithm is not tuned only to a single route geometry and can preserve its advantage across multiple delivery tasks.
Table 8.
Cost components in Scene 4.
Figure 16.
(a): Cost contribution comparison of A*, GA, WOA, and IWOA for customer point C1 in Scene 4; (b): Cost contribution comparison of A*, GA, WOA, and IWOA for customer point C2 in Scene 4; (c): Cost contribution comparison of A*, GA, WOA, and IWOA for customer point C3 in Scene 4; (d): Cost contribution comparison of A*, GA, WOA, and IWOA for customer point C4 in Scene 4.
Figure 17.
(a): Convergence curves of A*, GA, WOA, and IWOA for customer point C1 in Scene 4; (b): Convergence curves of A*, GA, WOA, and IWOA for customer point C2 in Scene 4; (c): Convergence curves of A*, GA, WOA, and IWOA for customer point C3 in Scene 4; (d): Convergence curves of A*, GA, WOA, and IWOA for customer point C4 in Scene 4.
Figure 18.
(a): 2D path comparison of A*, GA, WOA, and IWOA for customer point C1 in Scene 4; (b): 3D path comparison of A*, GA, WOA, and IWOA for customer point C1 in Scene 4. Blue squares denote obstacles, the blue dot denotes the start point, and the orange star denotes the destination.
Figure 19.
(a): 2D path comparison of A*, GA, WOA, and IWOA for customer point C2 in Scene 4; (b): 3D path comparison of A*, GA, WOA, and IWOA for customer point C2 in Scene 4. Blue squares denote obstacles, the blue dot denotes the start point, and the orange star denotes the destination.
Figure 20.
(a): 2D path comparison of A*, GA, WOA, and IWOA for customer point C3 in Scene 4; (b): 3D path comparison of A*, GA, WOA, and IWOA for customer point C3 in Scene 4. Blue squares denote obstacles, the blue dot denotes the start point, and the orange star denotes the destination.
Figure 21.
(a): 2D path comparison of A*, GA, WOA, and IWOA for customer point C4 in Scene 4; (b): 3D path comparison of A*, GA, WOA, and IWOA for customer point C4 in Scene 4. Blue squares denote obstacles, the blue dot denotes the start point, and the orange star denotes the destination.
The destination-specific results also reveal differences in task difficulty. C1 yields the lowest total cost, whereas C4 is the most difficult case, which implies that route geometry and the spatial relationship between the depot, obstacles, and local wind structures have a direct impact on optimization performance. Figure 16 and Figure 17 show that the relative ranking of the algorithms remains stable across all destinations, with IWOA converging earlier and to a lower final level. The path comparisons in Figure 18, Figure 19, Figure 20 and Figure 21 further show that IWOA produces routes with fewer unnecessary turns and more coherent obstacle-avoidance behavior in both 2D and 3D views. These results suggest that the proposed method can be extended naturally from a single-destination problem to repeated destination-wise urban logistics tasks.
4.3.5. Sensitivity Analysis of Key Variables
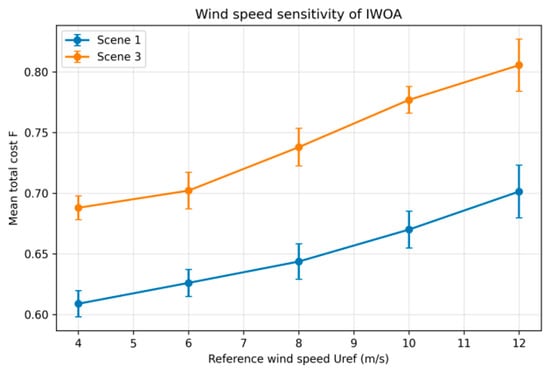
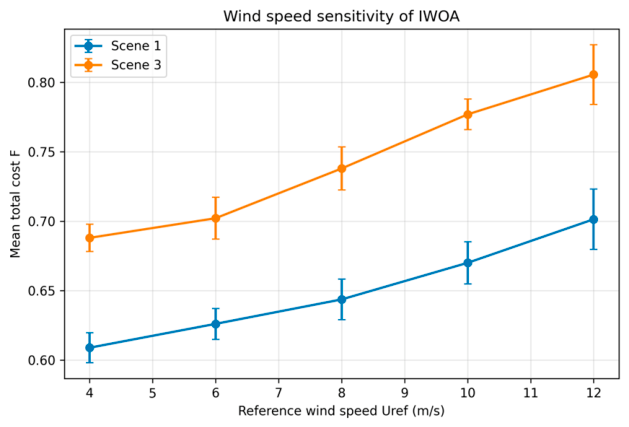
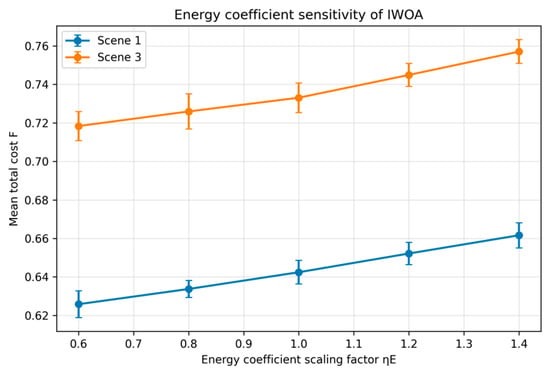
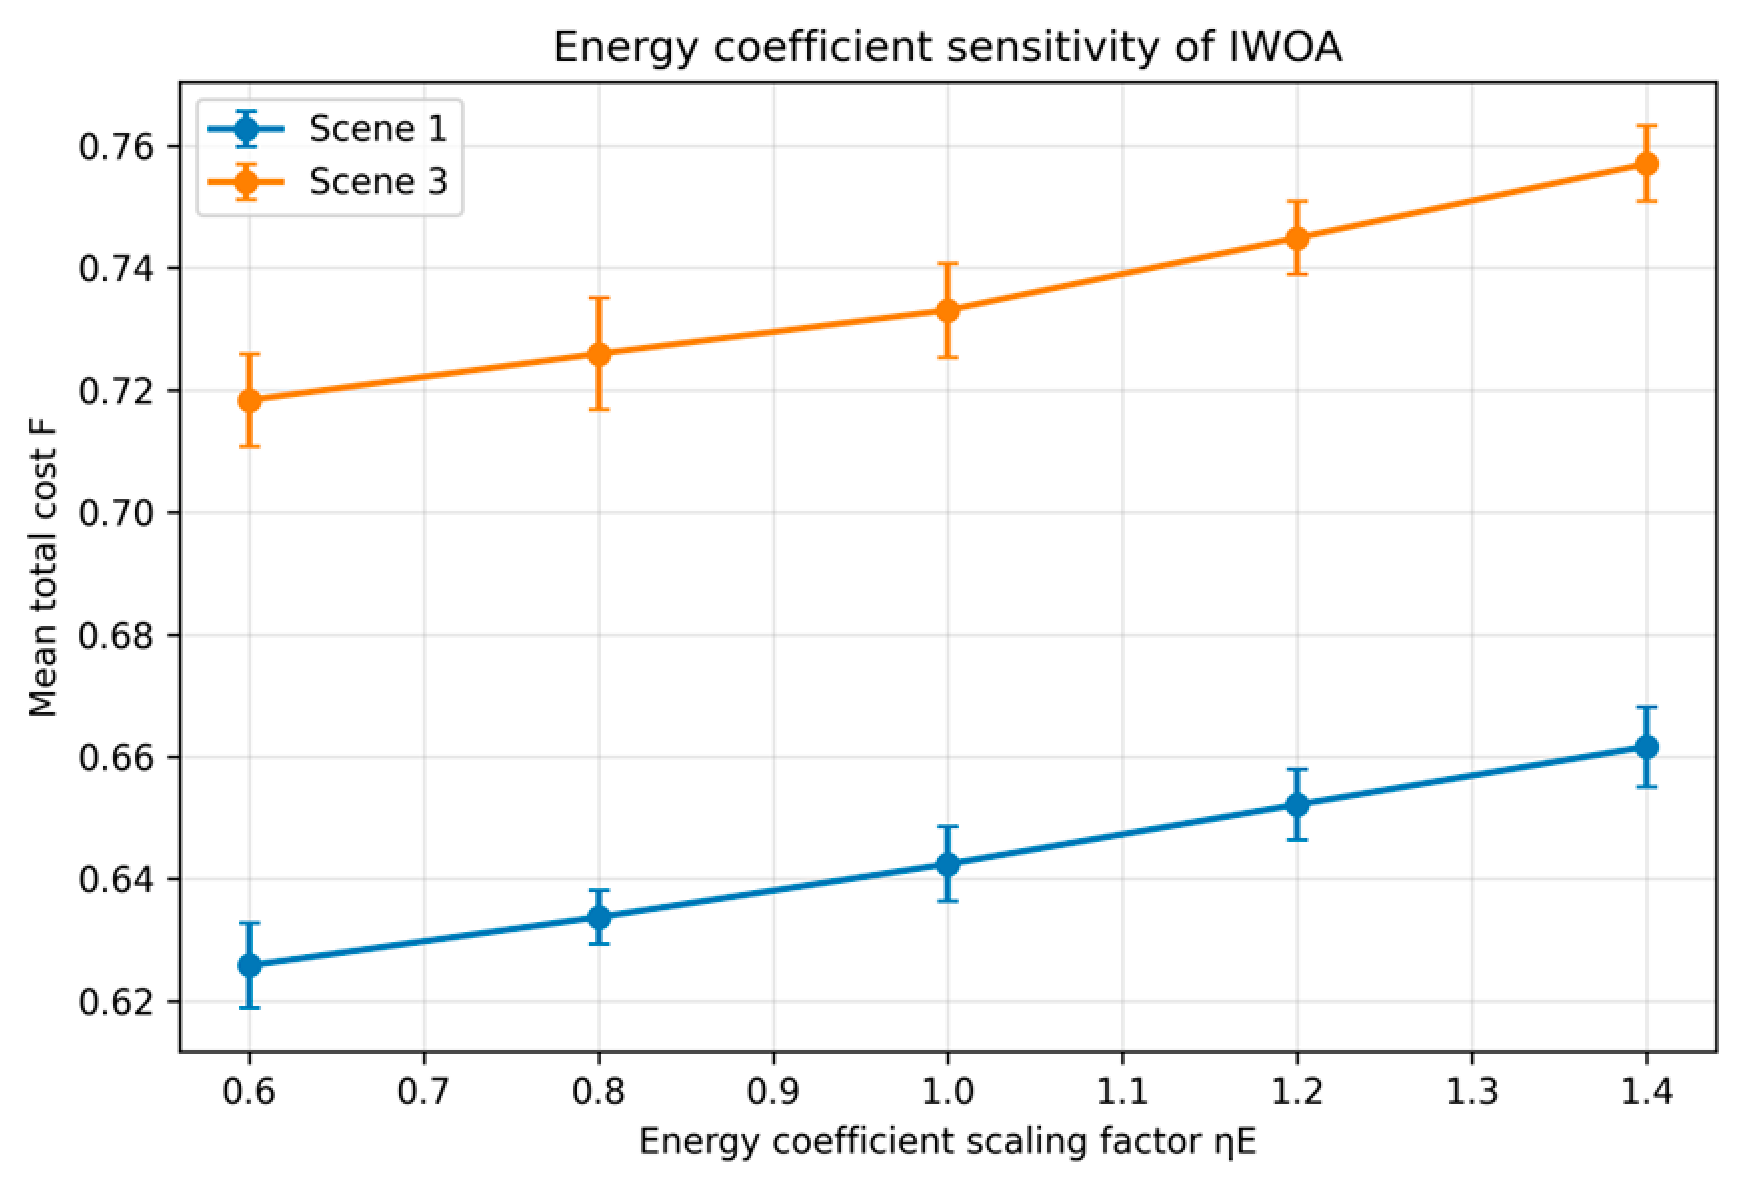
To further examine the robustness of the proposed method, a sensitivity analysis is conducted for three key variables, namely reference wind speed, prevailing wind direction, and energy coefficient scaling, while only IWOA is retained as the optimization algorithm. Figure 22, Figure 23 and Figure 24 summarize the variation in the mean total cost under Scene 1 and Scene 3. As shown in Figure 22, the mean total cost increases monotonically with the reference wind speed in both scenarios. In Scene 1, the mean total cost rises from 0.609 at 4 m/s to 0.701 at 12 m/s, whereas in Scene 3 it increases from 0.688 to 0.806 over the same range. The increase is steeper in Scene 3, indicating that the interaction between stronger background flow and building-induced disturbances amplifies the planning difficulty under the complex urban wind field.
Figure 22.
Sensitivity of the mean total cost of IWOA to the reference wind speed under Scene 1 and Scene 3.
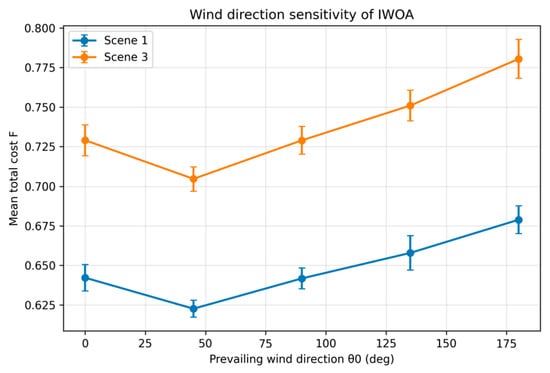
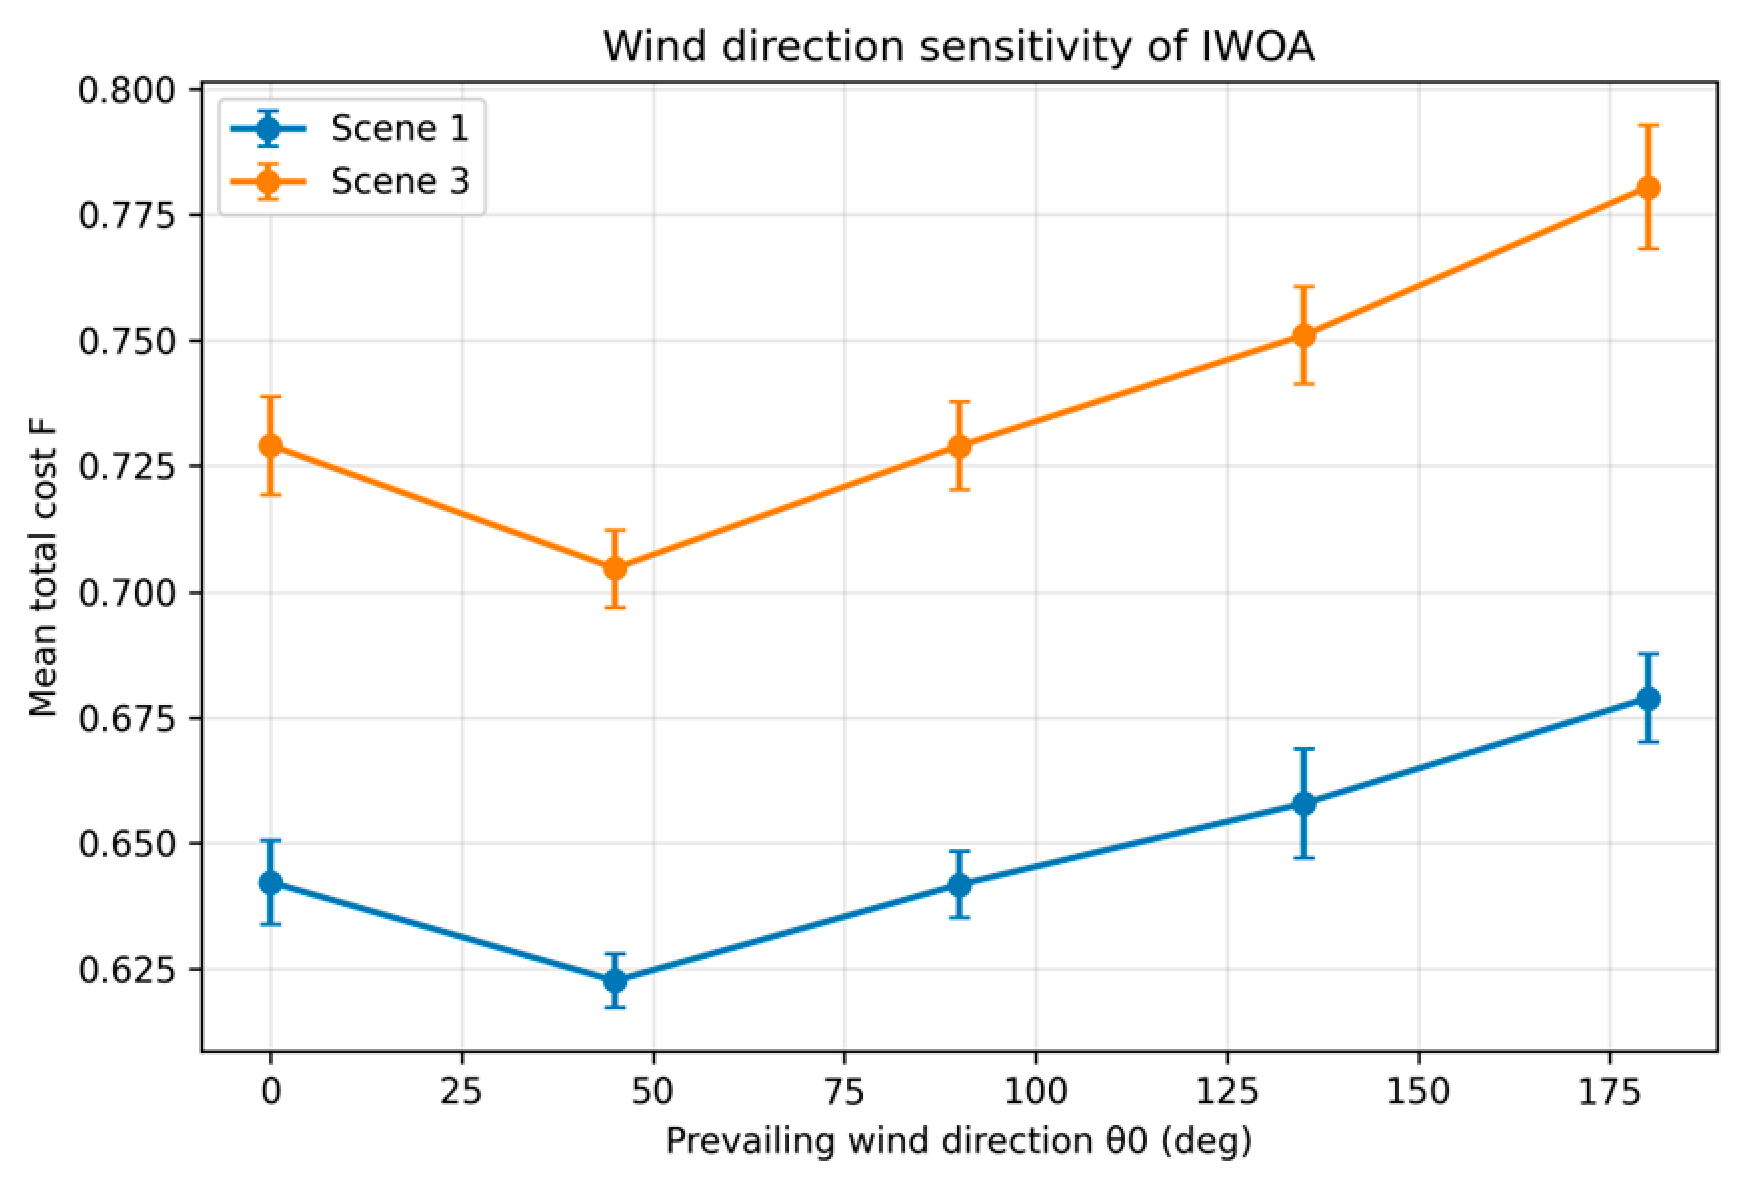
Figure 23.
Sensitivity of the mean total cost of IWOA to the prevailing wind direction under Scene 1 and Scene 3.
Figure 24.
Sensitivity of the mean total cost of IWOA to the energy coefficient scaling factor under Scene 1 and Scene 3.
Figure 23 shows the effect of the prevailing wind direction. The lowest mean total cost occurs around 45°, which is consistent with the dominant direction of the start-to-goal displacement in the considered scenario. When the wind direction deviates from this favorable alignment, especially toward 180°, the mean total cost increases in both scenes. This indicates that crosswind and adverse headwind effects lead to higher wind-related penalties and more conservative route adjustments. Figure 24 presents the influence of the energy coefficient scaling factor. As the scaling factor increases from 0.6 to 1.4, the mean total cost also increases in both scenes, mainly because the energy-consumption term becomes more dominant in the weighted objective. Compared with wind speed and wind direction, the energy coefficient has a smoother effect on the overall cost, which suggests that environmental parameters remain the primary source of uncertainty in urban low-altitude path planning.
5. Discussion
The above results reveal several important findings for wind-aware UAV path planning in urban low-altitude logistics. First, the proposed IWOA achieves its main advantage through a better balance between global exploration and environment-informed local exploitation. The performance gains are not restricted to a single metric; instead, they are observed simultaneously in total cost, wind-related cost, path quality, and convergence behavior. In particular, the repeated reduction in the wind-field component across all scenarios indicates that the wind-guided local adjustment operator plays a central role in steering the search away from aerodynamically unfavorable regions. This mechanism distinguishes the proposed method from conventional population-based optimization strategies that treat the environment mainly as a static cost map.
Second, the scenario comparison confirms that urban density and wind complexity jointly determine the difficulty of the planning problem. When the environment changes from low density to high density, obstacle crowding increases route confinement and reduces the number of feasible low-cost corridors. Likewise, when the wind field changes from the background model to the complex urban model, the planner must cope not only with stronger mean wind effects but also with local wake, canyon, and vortex disturbances. The fact that IWOA remains the best-performing algorithm under both types of difficulty suggests that the combination of elite preservation, mutation, and feasibility repair improves both search stability and robustness. This observation is consistent with recent studies emphasizing the importance of integrating environmental information into UAV path planning rather than relying solely on generic optimization improvements.
Third, the multi-destination results indicate that the proposed method can support repeated delivery tasks in a depot-to-customer urban logistics setting. Although the current implementation treats each customer independently, the stable ranking across C1–C4 suggests that the algorithm can provide a reliable single-flight planning module for larger logistics frameworks. In practice, this is valuable because real urban delivery systems often require repeated route generation under changing demand and environmental conditions. The sensitivity analysis provides an additional practical insight: wind speed and wind direction have stronger effects on the overall planning outcome than moderate changes in the energy coefficient, which means that environmental forecasting and online wind updates may be more critical than minor refinements of the energy model parameters.
At the same time, several limitations should be acknowledged. The wind field used in this study is still a simulation-based representation and does not rely on measured real-time urban wind data. The weighted-sum objective provides a clear scalar fitness for algorithm comparison, but it cannot fully characterize trade-offs among time, energy, safety, and smoothness in the same way as a Pareto-based formulation [10,11]. In addition, the multi-destination setting is implemented through destination-wise independent planning rather than full vehicle routing or time window scheduling. Therefore, future work should focus on incorporating real or reconstructed urban wind observations, extending the framework to dynamic online replanning, and integrating multi-objective or multi-UAV decision mechanisms for more realistic low-altitude logistics operations.
6. Conclusions
This study proposes an improved whale optimization algorithm for wind-field-coupled UAV path planning in urban low-altitude logistics and evaluates it in a three-dimensional voxel-based urban environment. By integrating wind-field-guided local adjustment, adaptive convergence control, elite preservation, large-scale mutation, and feasibility repair into the standard WOA framework, the proposed method improves both solution quality and environmental adaptability. The main conclusions are as follows:
- (1)
- In the baseline medium-density scenario under wind model A, IWOA achieves the lowest total cost and reduces F by 17.3%, 13.1%, and 6.7% relative to A*, GA, and WOA, respectively. The largest improvement occurs in the wind-field cost component, indicating that the proposed method is effective in avoiding high-penalty airflow regions.
- (2)
- Under urban density variation, IWOA maintains the best performance in both low-density and high-density environments. When the environment changes from low density to high density, the total cost increase in IWOA is smaller than that of the competing methods, demonstrating stronger robustness under increased obstacle confinement.
- (3)
- Under the complex urban wind field, IWOA still converges to the best solution and exhibits the smallest deterioration relative to the baseline case. This shows that the proposed method is better suited to handling building-induced disturbances, wake effects, and other spatially heterogeneous wind phenomena.
- (4)
- In the multi-destination scenario, IWOA consistently achieves the lowest total cost for all four customer points, which confirms that the method can be extended from a single origin–destination task to repeated urban delivery tasks. The sensitivity analysis further shows that wind speed and wind direction have pronounced effects on the total cost, whereas the influence of the energy coefficient is comparatively smoother.
Overall, the proposed IWOA framework provides an effective solution for wind-aware urban UAV path planning and offers useful methodological support for future research on intelligent low-altitude logistics systems. Future studies should further incorporate real urban wind measurements, dynamic task constraints, and multi-objective or multi-UAV extensions to improve practical applicability.
Author Contributions
Conceptualization, S.Y.; Methodology, S.Y.; Writing—original draft preparation, Y.H.; Writing—review and editing, Y.H.; Visualization, Y.H.; Supervision, H.Z.; Project administration, H.Z. All authors have read and agreed to the published version of the manuscript.
Funding
This research received no external funding.
Institutional Review Board Statement
Not applicable.
Informed Consent Statement
Not applicable.
Data Availability Statement
The data presented in this study are available from the corresponding author upon reasonable request. The code and complete datasets are not publicly available at this stage because related studies within the research group are still ongoing.
Conflicts of Interest
The authors declare no conflicts of interest.
References
- World Economic Forum. Sustainable and Efficient Last-Mile Delivery in Cities; Last-Mile Cost Share Evidence; World Economic Forum: Geneva, Switzerland, 2024. [Google Scholar]
- INRIX. 2024 Global Traffic Scorecard. Congestion Statistics and Cost of Delay; INRIX: Washington, DC, USA, 2025. [Google Scholar]
- U.S. Department of Transportation, ITS Deployment Evaluation. Model Results Showed that Depot-Based Drone Delivery Led to up to 60 Percent Cost Savings Compared to Truck-Only Delivery When Servicing Low Demand in Small Areas; University of Illinois at Urbana-Champaign: Champaign, IL, USA, 2024. [Google Scholar]
- Wu, J.; Ye, Y.; Du, J. Multi-objective reinforcement learning for autonomous drone navigation in urban areas with wind zones. Autom. Constr. 2024, 158, 105253. [Google Scholar] [CrossRef] [Scilit]
- Gu, R.; Zhao, Y.; Ren, X. Integrating wind field analysis in UAV path planning: Enhancing safety and energy efficiency for urban logistics. Chin. J. Aeronaut. 2025, 39, 103605. [Google Scholar] [CrossRef] [Scilit]
- Xiang, S.; Zhou, J.; Fu, X.; Zheng, L.; Wang, Y.; Zhang, Y.; Yi, K.; Liu, J.; Ma, J.; Tao, S. Fast Simulation of High Resolution Urban Wind Fields at City Scale. Urban Clim. 2021, 39, 100941. [Google Scholar] [CrossRef] [Scilit]
- Dai, Y.; Zhu, F.; Tu, W.; Zhu, H.; Qin, D.; Wang, H.; Zhai, Z. (John) Urban Air Mobility in the Built Environment: A Review of Aerodynamic Interactions, Thermal Effects, and Simulation Challenges. Sustain. Cities Soc. 2025, 133, 106853. [Google Scholar] [CrossRef] [Scilit]
- Seon, D.; Kim, K.H.; Jeong, S. A High-Resolution Urban Wind Environment Generation Model for a UAMFlight Risk Assessment. Int. J. Aeronaut. Space Sci. 2025, 26, 2984–2995. [Google Scholar] [CrossRef] [Scilit]
- Jia, H.; Lin, C.; Iwabuchi, M.; Kikumoto, H. Ten Questions Concerning Urban Wind Environments for the Safe Utilization of Urban Air Mobility. Build. Environ. 2026, 290, 114136. [Google Scholar] [CrossRef] [Scilit]
- Lin, C.; Ooka, R.; Takakuwa, Y.; Kikumoto, H. Rooftop Wind Environment with Parapets under Upwind Building Sheltering: A Wind Tunnel Study with Implications for Urban-Air-Mobility Safety. Build. Environ. 2026, 287, 113854. [Google Scholar] [CrossRef] [Scilit]
- Yeo, H.; Lee, S. Impact of Heterogeneous Building Arrangement on Local Turbulence Escalation. Build. Environ. 2023, 236, 110217. [Google Scholar] [CrossRef] [Scilit]
- Xu, T.; Chen, C. DBO-AWOA: An Adaptive Whale Optimization Algorithm for Global Optimization and UAV 3D Path Planning. Sensors 2025, 25, 2336. [Google Scholar] [CrossRef] [Scilit] [PubMed]
- Liu, Z.; Li, S.; Xu, H. An Improved Whale Migration Optimization Algorithm for Cooperative UAV 3D Path Planning. Biomimetics 2025, 10, 655. [Google Scholar] [CrossRef] [Scilit] [PubMed]
- Liu, Y.; Chen, Y.; Hu, M.; Zhang, W. Resilient multi-UAV path planning for effective and reliable information collection. Phys. Commun. 2025, 71, 102685. [Google Scholar] [CrossRef] [Scilit]
- Ehrgott, M.; Köksalan, M.; Kadziński, M.; Deb, K. Fifty Years of Multi-Objective Optimization and Decision-Making: From Mathematical Programming to Evolutionary Computation. Eur. J. Oper. Res. 2026, 330, 1–25. [Google Scholar] [CrossRef] [Scilit]
- Güven, İ.; Yanmaz, E. Multi-Objective Path Planning for Multi-UAV Connectivity and Area Coverage. Ad Hoc Netw. 2024, 160, 103520. [Google Scholar] [CrossRef] [Scilit]
- Hart, P.E.; Nilsson, N.J.; Raphael, B. A formal basis for the heuristic determination of minimum cost paths. IEEE Trans. Syst. Sci. Cybern. 1968, 4, 100–107. [Google Scholar] [CrossRef] [Scilit]
- Hu, M.-Z.; Li, X.-G.; Ren, Z.-Y.; Zeng, S. UAV 3D path planning based on an improved heuristic A* algorithm. Acta Armamentarii 2024, 45, 302–307. [Google Scholar] [CrossRef]
- Wang, Q.; Wang, L.; Ni, S.-S.; Chen, M.X. UAV path planning for emergency rescue based on an improved A* algorithm. Comput. Simul. 2024, 41, 84–88. [Google Scholar] [CrossRef]
- Mirjalili, S.; Mirjalili, S.M.; Lewis, A. Grey wolf optimizer. Adv. Eng. Softw. 2014, 69, 46–61. [Google Scholar] [CrossRef] [Scilit]
- Kennedy, J.; Eberhart, R. Particle swarm optimization. In Proceedings of the 1995 IEEE International Conference on Neural Networks (ICNN’95), Perth, Australia, 27 November–1 December 1995; pp. 1942–1948. [Google Scholar]
- Mirjalili, S. Genetic algorithm. In Evolutionary Algorithms and Neural Networks: Theory and Applications; Springer: Cham, Switzerland, 2019; pp. 43–55. [Google Scholar]

Disclaimer/Publisher’s Note: The statements, opinions and data contained in all publications are solely those of the individual author(s) and contributor(s) and not of MDPI and/or the editor(s). MDPI and/or the editor(s) disclaim responsibility for any injury to people or property resulting from any ideas, methods, instructions or products referred to in the content. |
© 2026 by the authors. Licensee MDPI, Basel, Switzerland. This article is an open access article distributed under the terms and conditions of the Creative Commons Attribution (CC BY) license.