


Abstract
WiFi fingerprinting remains attractive for indoor localization because it reuses existing wireless infrastructure, yet RSSI fingerprints are high-dimensional, sparse, and often ambiguous across adjacent floors and building regions. This study develops a hybrid blended localization framework that combines multi-task learning with feature-space weighted k-nearest-neighbor refinement. A shared neural encoder predicts building labels, floor labels, and normalized coordinates from 520-dimensional WiFi fingerprints, and the learned embedding space is then used for semantically constrained WKNN correction. The final model is trained with AdamW, a learning rate of , batch size 512, and a joint loss over building classification, floor classification, and coordinate regression, without a learning-rate scheduler. Experiments on a public WiFi fingerprint dataset show that the hybrid model achieves the strongest overall localization robustness among the evaluated non-ensemble methods. On the official validation split, it obtains a mean localization error of 9.01, a median error of 6.25, and an RMSE of 12.95 in the dataset coordinate units. On the internal semantic validation split, it reaches 94.81% floor classification accuracy and 97.62% building classification accuracy. Floor-wise and building–floor analyses further show that the largest errors are concentrated in a small number of difficult semantic regions, especially the highest floor and sparsely constrained partitions.
1. Introduction
Indoor localization is needed for asset tracking, navigation, emergency response, and smart-building services in places where GPS signals are weak or absent [1,2]. WiFi fingerprinting is one of the most practical approaches, because it reuses the 802.11 access points already installed in most public buildings, campuses, and offices and does not need extra ranging hardware [3,4].
The core idea of WiFi fingerprinting is simple: a radio map of Received Signal Strength Indicator (RSSI) vectors is collected offline at known reference positions, and an online query is then matched against that radio map [5]. In practice though, RSSI fingerprints are high-dimensional and yet very sparse—each device sees only some of the access points at any location—and they vary over time because of multipath, body shadowing, device differences, and environmental changes [6,7]. A deeper problem is that raw RSSI similarity does not always correspond to physical proximity: samples from adjacent floors or different parts of a building can look similar in signal space and cause large localization errors.
Existing methods usually address this problem from one of two directions. Classical retrieval methods such as WKNN remain strong baselines because they are simple, interpretable, and effective when radio maps are dense, but their performance degrades when the raw RSSI distance is a poor proxy for physical or semantic similarity [8,9]. Deep learning methods can learn compact and discriminative features from sparse WiFi fingerprints, but many of them still treat indoor localization as a single coordinate-regression task, without fully exploiting the hierarchical semantic structure of indoor environments, namely building, floor, and then position [10,11,12].
Motivation and Contributions
These limitations call for a design that is neither purely classical nor purely neural. A deep encoder trained to predict building, floor, and coordinates at the same time can learn features, where semantic proximity is built in and not just inferred from raw RSSI similarity [13]. At the same time, a retrieval step in that learned feature space can still use the local structure of the radio map to correct coordinate bias, which is most helpful for the difficult regions that dominate the error tail [14]. This paper therefore combines multi-task learning with feature-space WKNN retrieval in a single hybrid pipeline.
A second motivation is reproducibility. A recent systematic review [15] found that many studies leave out key experimental details—optimizer settings, learning rate schedules, model selection rules—which makes it hard to tell where the performance differences actually come from. We therefore report all implementation details needed to reproduce our results and add a floor-level evaluation with structured error analysis.
The main contributions of this paper are summarized as follows.
- A hybrid blended localization pipeline is developed in which a multi-task neural network jointly predicts building, floor, and coordinates, while a feature-space WKNN module refines the coordinate estimate using neighbors selected from the learned representation space rather than from raw RSSI space.
- All implementation details required for reproducibility are explicitly reported, including the optimizer type (AdamW), learning rate (), batch size (512), learning-rate scheduler usage, model-selection rule, floor and building classification accuracy, and training and validation loss curves.
- A more detailed evaluation protocol is introduced. In addition to the mean error, median error, and RMSE, the paper reports floor-wise regression performance and analyzes the conditions under which large localization errors occur, identifying the highest floor and difficult building–floor combinations as the primary sources of residual error.
- On the validation data, the hybrid method is more robust than the deep learning baseline and reduces tail errors considerably, while staying close to the classical fingerprinting methods in the small-error region.
2. Related Work
2.1. WiFi Fingerprinting and RSSI-Based Localization
The WiFi fingerprinting paradigm was established by the RADAR system [3], which matched online RSSI vectors to an offline radio map using the nearest-neighbor search, and by the probabilistic Horus system [5], which modeled per-location signal strength as Gaussian distributions to quantify measurement uncertainty. These foundational contributions established the offline-calibration/online-matching framework that underpins most fingerprinting systems today.
Recent surveys consistently identify the same practical bottlenecks: signal instability, device heterogeneity, radio-map construction cost, and the lack of standardized preprocessing and evaluation protocols for large-scale deployment [2,6,7,15]. In addition, reviews of publicly available datasets show that multi-building and multi-floor benchmarks such as UJIIndoorLoc remain central for comparing deep learning and classical fingerprinting methods under realistic semantic ambiguity [4,16]. These observations motivate our emphasis on semantic supervision, reproducible preprocessing, and detailed floor-wise error analysis.
2.2. Weighted k-Nearest-Neighbor Localization
WKNN methods extend basic nearest-neighbor matching by weighting candidate reference points as a decreasing function of their RSSI-space distance to the query. They remain a competitive baseline and are frequently used as a post-processing or hybrid stage alongside more complex models. Wang et al. [8] proposed FDDC-WKNN, which dynamically selects per-query AP subsets and incorporates RSS-difference-based priority weights, achieving lower mean errors than standard Euclidean and Manhattan WKNN in both simulated and real library environments. Duong et al. [9] demonstrated that combining PCA-based dimensionality reduction with WKNN and linear regression yields efficient and accurate multi-floor positioning, reducing computational cost while maintaining accuracy competitive with deeper models. Lin et al. [17] developed a robot-aided hybrid deep learning approach for WiFi localization in which a convolutional network extracts RSSI features and a WKNN stage performs final coordinate estimation, outperforming pure deep regression on crowded multi-room environments. The key distinction of our feature-space WKNN component is that neighbor retrieval is conducted in the learned embedding space produced by the multi-task encoder, making the retrieval sensitive to semantic building structure rather than raw signal amplitude similarity alone.
2.3. Deep Learning for Indoor Localization
Deep neural networks have been applied to WiFi fingerprinting across many architectural families. Song et al. [10] proposed CNNLoc, combining a stacked autoencoder with a one-dimensional convolutional network to extract compact features from sparse RSS data, achieving high building- and floor-level accuracy on the UJIIndoorLoc benchmark. Cha and Lim [11] introduced HADNN, using building and floor labels as auxiliary targets during joint training, demonstrating that hierarchical supervision reduces floor-crossing errors without increasing the inference cost. Gorjan and Gil Jiménez [18] proposed a divide-and-conquer ML architecture for indoor WiFi positioning that achieves a low coordinate prediction error through structured multi-stage regression, demonstrating the effectiveness of structured multi-stage prediction. More recently, metric learning has emerged as a principled approach to align the embedding space with physical proximity. Chen and Zhang [12] proposed DeepMetricFi, training a triplet network to enforce consistency between coordinate distances and learned RSSI feature distances, improving the accuracy by approximately 10% over standard KNN. Gu et al. [19] proposed DeepFML, learning a feature mapping that improves the correlation between signal-space distance and physical-space distance, outperforming KNN baselines without additional infrastructure. Nabati and Ghorashi [20] proposed a real-time fingerprint-based positioning system that learns the RSS distribution at each reference point with a deep neural network and then refines estimates using preceding-state information for smooth online tracking. Saeed et al. [21] proposed RACNN, combining a stacked autoencoder with a 2D residual-attention CNN, achieving higher floor classification accuracy than CNNLoc on UJIIndoorLoc with fewer parameters. Our work differs from these approaches in that the feature space is shaped jointly by multi-task semantic supervision over building, floor, and coordinate labels, and the learned space is directly coupled to a downstream WKNN retrieval stage.
2.4. Emerging Extensions Beyond the Mainstream Pipeline
Recent work has also explored more specialized extensions, including graph neural networks for structured spatial reasoning, generative models for radio map augmentation, and semi-supervised or federated learning for label-efficient deployment [22,23,24,25,26,27,28]. These directions are important for future large-scale systems, especially when training labels are scarce or reference points are naturally relational. However, they do not directly address the main question considered here: how semantic multi-task feature learning can be combined with local neighbor-based correction within a single WiFi fingerprinting pipeline.
2.5. Multi-Task and Hierarchical Deep Localization
Multi-task learning [29] improves generalization by sharing representations across related prediction targets. For indoor localization, the value of jointly predicting semantic labels alongside metric coordinates has been demonstrated in several recent works. Li et al. [13] presented a hierarchical stage-wise training framework for linked deep neural networks, in which each network is dedicated to a sub-problem of the multi-building multi-floor hierarchy; training lower-hierarchy networks with prior knowledge from higher-hierarchy networks achieved state-of-the-art results on UJIIndoorLoc. Li et al. [14] provided the most thorough characterization of the UJIIndoorLoc database to date, identifying label inconsistencies, unbalanced floor distributions, and the effect of access-point preprocessing on deep learning performance—findings that directly inform our structured error analysis. Our model extends the three-task formulation—building classification, floor classification, and coordinate regression—to a unified end-to-end loss. Critically, the resulting embedding serves as the retrieval index for the feature-space WKNN stage, making multi-task learning a structural design choice that benefits both the classification heads and the downstream refinement component simultaneously.
2.6. The UJIIndoorLoc Benchmark
The UJIIndoorLoc dataset [30], used in our experiments, covers three buildings with four to five floors each and 520 wireless access point channels, comprising 19,937 training records and 1111 validation records collected by more than 20 users across the campus of the Universitat Jaume I, Spain. It remains the standard evaluation platform for large-scale WiFi fingerprinting research [16] and has been adopted as the official benchmark for multiple IPIN indoor positioning competitions. The most comprehensive analysis of this database is provided by Li et al. [14], who identified statistical properties of access-point observations, label distributions, and preprocessing decisions that critically affect reported performance of both classical and deep learning models. Our evaluation extends standard aggregate metrics with floor-wise and building–floor error breakdowns, revealing the semantic regions responsible for the largest localization errors and providing actionable targets for future data collection and model refinement.
3. Methodology
3.1. Dataset and Preprocessing
The experiments use the public UJIIndoorLoc WiFi fingerprint dataset [30]. Each sample contains RSSI values from 520 access points (WAP001–WAP520), together with building ID, floor label, and ground-truth coordinates. The original training split contains 19,937 samples, and the independent validation split contains 1111 samples. This official train/validation protocol is retained for the final localization comparison, because it better reflects deployment under distribution shift than a random resplit.
In addition, for diagnostic analysis of the semantic branches, an internal 80/20 stratified split of the original training set is constructed, yielding 15,949 training samples and 3988 internal validation samples. This internal split is used only to analyze floor/building classification behavior, learning curves, and floor-wise semantic accuracy; the main localization results are still reported on the official independent validation set of 1111 samples.
In the raw data, RSSI values range from dBm to 0 dBm, while the value 100 denotes missing reception. Missing values are mapped to 0, and valid RSSI values are linearly normalized to so that missing APs remain separated from weak but observed APs. Let denote the RSSI value of the ith access point. The input normalization is
where , and . Longitude and latitude are normalized with the min–max statistics of the training set. Building and floor labels are converted into integer indices for classification.
3.2. Problem Formulation
Let denote a normalized WiFi fingerprint, b the building label, f the floor label, and the planar coordinate. The goal is to learn a mapping
where and denote semantic predictions, and denotes the coordinate estimate.
Unlike a pure regression model, the proposed formulation explicitly uses semantic structure to constrain localization. The model first learns a shared representation and then predicts semantic labels and a direct coordinate estimate from that representation. The final coordinate estimate is obtained by blending a direct neural prediction with a feature-space WKNN estimate:
where is selected on the validation set.
3.3. Overall Framework
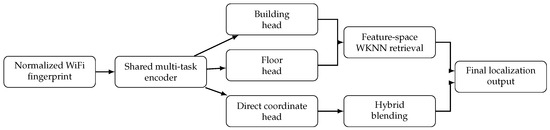
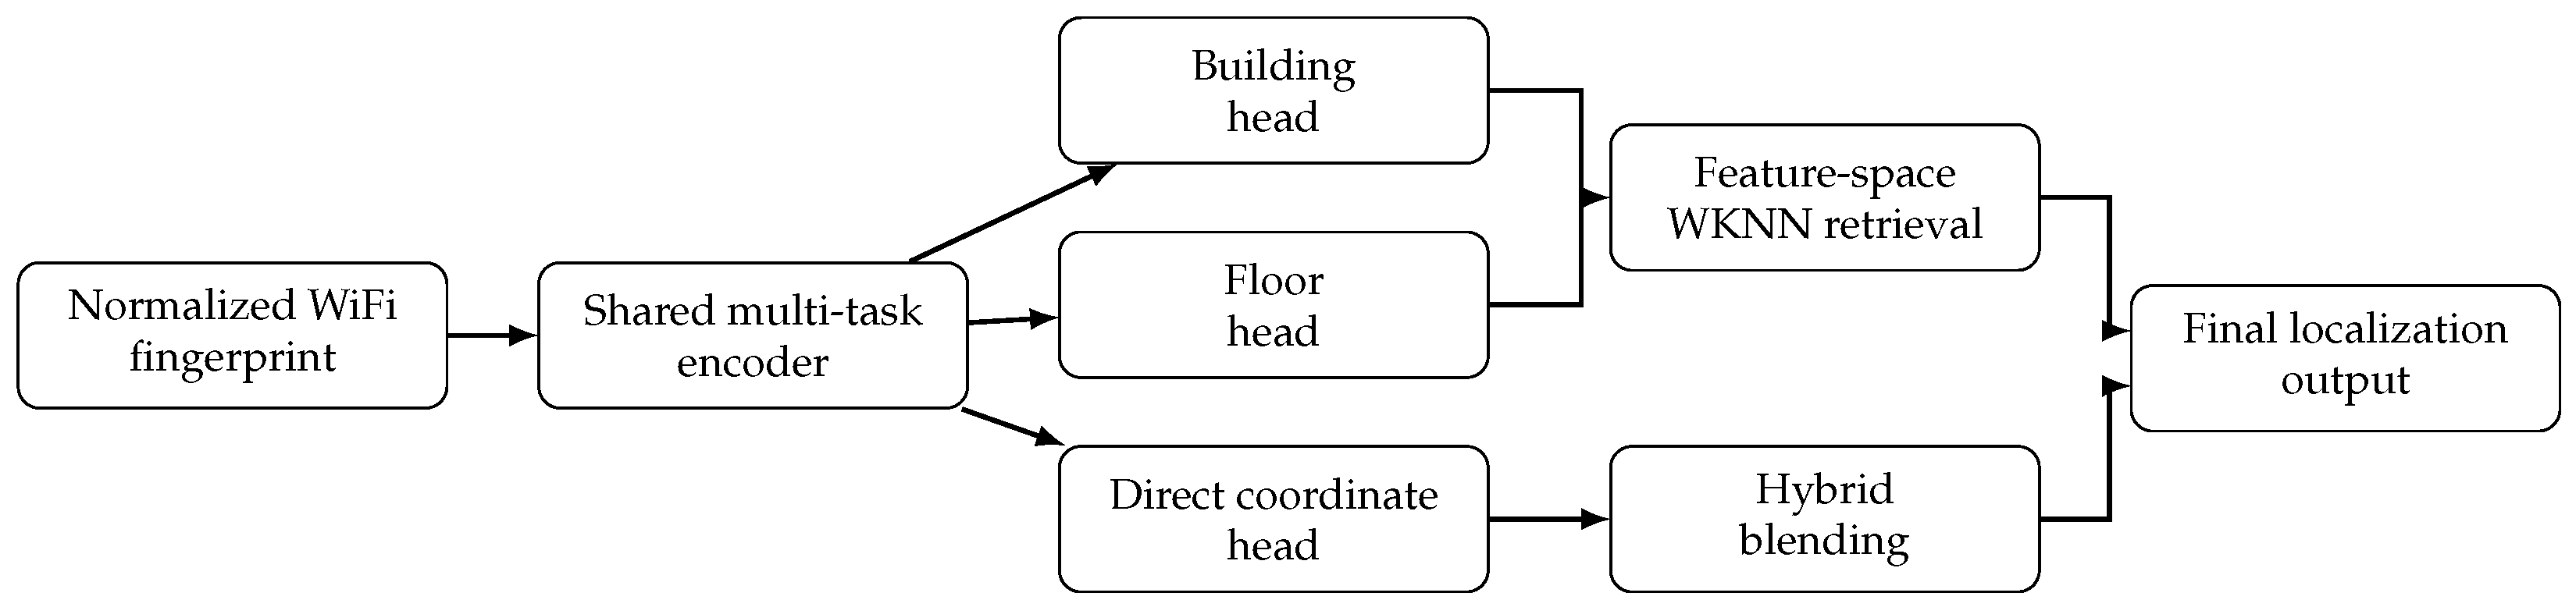
The overall framework of the proposed method is organized as a four-stage pipeline. First, the raw WiFi fingerprint is normalized and converted into a 520-dimensional input vector in which missing access points and observed RSSI values are explicitly separated. Second, the normalized fingerprint is fed into a shared multi-task encoder that produces a latent feature representation and three prediction branches: building classification, floor classification, and direct coordinate regression. Third, the learned latent representation is used as the retrieval space for feature-space WKNN, where candidate neighbors are searched under hierarchical semantic constraints derived from the predicted building and floor labels. Finally, the direct coordinate estimate and the feature-space WKNN estimate are blended to produce the final localization output. As shown in Figure 1.
Figure 1.
Overall framework of the proposed hybrid blended WiFi fingerprint localization method. A shared encoder supports semantic prediction, direct coordinate regression, and feature-space WKNN refinement. The final output is obtained by blending the direct coordinate estimate with the WKNN estimate.
In this design, the semantic and geometric parts help each other. The classification branches narrow down the feasible coordinate region, and the retrieval stage corrects the local coordinate bias by looking up nearby fingerprints in the learned feature space. The result is that global generalization from the deep encoder is combined with the local corrective behavior of instance-based matching.
3.4. Classical Fingerprinting Baselines
For comparison, three standard fingerprinting baselines are retained.
- KNN: Localization is estimated by averaging the coordinates of the K nearest fingerprints in RSSI space.
- WKNN: The coordinate average is weighted inversely by fingerprint distance.
- K-means + WKNN: The training set is first clustered, and WKNN is then performed in the selected cluster.
3.5. Proposed Hybrid Blended Localization
As shown in Algorithm 1. The proposed method consists of two components: a multi-task neural encoder and a feature-space WKNN refinement stage.
| Algorithm 1 Hybrid blended WiFi fingerprint localization framework. |
|
3.5.1. Multi-Task Neural Network
The backbone is a multilayer perceptron with three fully connected blocks:
- 520 → 1024, BatchNorm, GELU, Dropout (0.15)
- 1024 → 512, BatchNorm, GELU, Dropout (0.10)
- 512 → 256, BatchNorm, GELU
From the shared feature vector, the network branches into
- A building classification head,
- A floor classification head,
- A coordinate regression head.
Let denote the shared feature after the backbone. The building and floor heads produce logits
and the corresponding class probabilities are obtained by softmax:
The coordinate head receives the concatenated vector
where ‖ denotes concatenation. The direct coordinate prediction is then
Feeding the class probabilities into the coordinate head gives the regressor access to semantic context. Once the model has a good guess of the building and floor, the coordinate head only needs to handle positions within that region rather than the whole campus.
3.5.2. Multi-Task Objective
The building and floor heads are supervised with cross-entropy losses,
and the coordinate head is supervised with Smooth L1 loss,
The overall training objective is
where in the final implementation. The larger weight for coordinate regression is used, because semantic losses are easier to optimize numerically, whereas the localization task requires stronger gradient emphasis to avoid domination by the classification branches.
3.5.3. Feature-Space WKNN Refinement
After training, the learned feature embeddings of all training and validation fingerprints are extracted. For a query fingerprint , the backbone produces an embedding . Neighbors are searched in the feature space rather than the raw RSSI space, because the learned embedding is expected to suppress missing-AP noise and encode semantically meaningful similarity. The Euclidean feature distance between query q and candidate training sample j is
To improve semantic consistency, retrieval is constrained hierarchically. Samples from the same predicted building and floor are retrieved first. If fewer than K samples are available, the constraint is relaxed to the same building; if that is still insufficient, the full training set is used. This fallback strategy avoids brittle failure when the semantic prediction is slightly wrong or when a rare building–floor combination contains too few reference fingerprints.
Given the selected neighbor set , WKNN weights are defined as
where is a small constant for numerical stability. The WKNN estimate is then
Finally, the direct neural prediction and the feature-space WKNN prediction are blended. In the current implementation, and are searched on the validation set, and the best-performing pair is used as the final configuration.
3.5.4. Inference Procedure
At inference time, the prediction pipeline consists of four steps:
- 1.
- Normalize the query RSSI vector and feed it into the multi-task network;
- 2.
- Predict the building probability, floor probability, and direct coordinates;
- 3.
- Retrieve the feature-space neighbors under the hierarchical semantic constraint, and compute ;
- 4.
- Blend and to obtain .
- The two branches handle different types of errors. The neural predictor generalizes globally with semantic guidance, while the neighbor branch corrects local bias when similar training fingerprints exist nearby in the learned space.
3.6. Training Configuration
The proposed hybrid model is trained with AdamW, learning rate , weight decay , and batch size 512. The classification loss is cross entropy with label smoothing 0.05, and the coordinate loss is Smooth L1 loss with . The total loss is defined as
The model is trained for 25 epochs on GPU. Mini-batches are shuffled at every epoch, and the checkpoint with the best validation performance is retained for subsequent hybrid blending. In the final hybrid implementation, no learning-rate scheduler is used; instead, the best checkpoint is selected, according to the validation localization error of the direct prediction branch. In early experiments, a learning-rate schedule did not help much, likely because the hybrid refinement stage already compensates for moderate instability in the direct regressor. For comparison, the optional deep baseline (CNN + attention with building/floor conditioning) uses AdamW with learning rate , batch size 128, and ReduceLROnPlateau scheduling.
3.7. Evaluation Protocol
The mean localization error, median localization error, and RMSE computed as Euclidean distances in the planar coordinate system provided by the dataset are reported on the official validation split. Because semantic prediction is a core part of the proposed hybrid method, floor classification accuracy and building classification accuracy are also reported. The overall localization results and floor-wise coordinate regression analysis are reported on the official validation split, whereas semantic diagnostics such as learning curves, confusion matrices, and floor-wise floor classification accuracy are reported on the internal stratified validation split. To better reveal model behavior, building–floor combinations associated with large errors are further analyzed.
4. Experimental Results and Analysis
4.1. Overall Localization Performance
Unless otherwise stated, the localization results in this subsection are reported on the official independent validation split of 1111 samples. The dataset provides planar coordinates rather than raw longitude/latitude degrees; so, all localization errors are computed as Euclidean distances in that dataset coordinate space. (All reported localization errors in this paper are expressed in the raw dataset coordinate units of the UJIIndoorLoc distribution (the values found directly in the LONGITUDE and LATITUDE columns of the distributed CSV files). They are not re-scaled to meters, and they are not normalized to . Published error values from other UJIIndoorLoc studies are not directly comparable to ours unless they use the same coordinate convention, the same official 19,937/1111 train–validation split, and the same preprocessing.) Table 1 compares the proposed hybrid blended method with the classical fingerprinting baselines, the optional deep baseline, and the ensemble result. Among the non-ensemble methods, the hybrid has the lowest mean error and RMSE, suggesting that combining multi-task learning with feature-space WKNN works better than either a pure neighbor method or a pure neural regressor alone. The ensemble gives the lowest errors overall but is treated as a secondary reference rather than the main model.
Table 1.
Localization performance on the official validation split (dataset coordinate units).
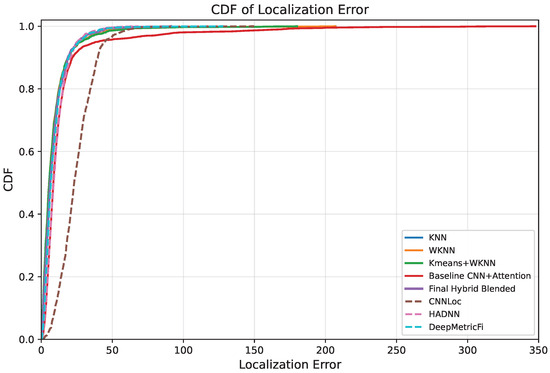
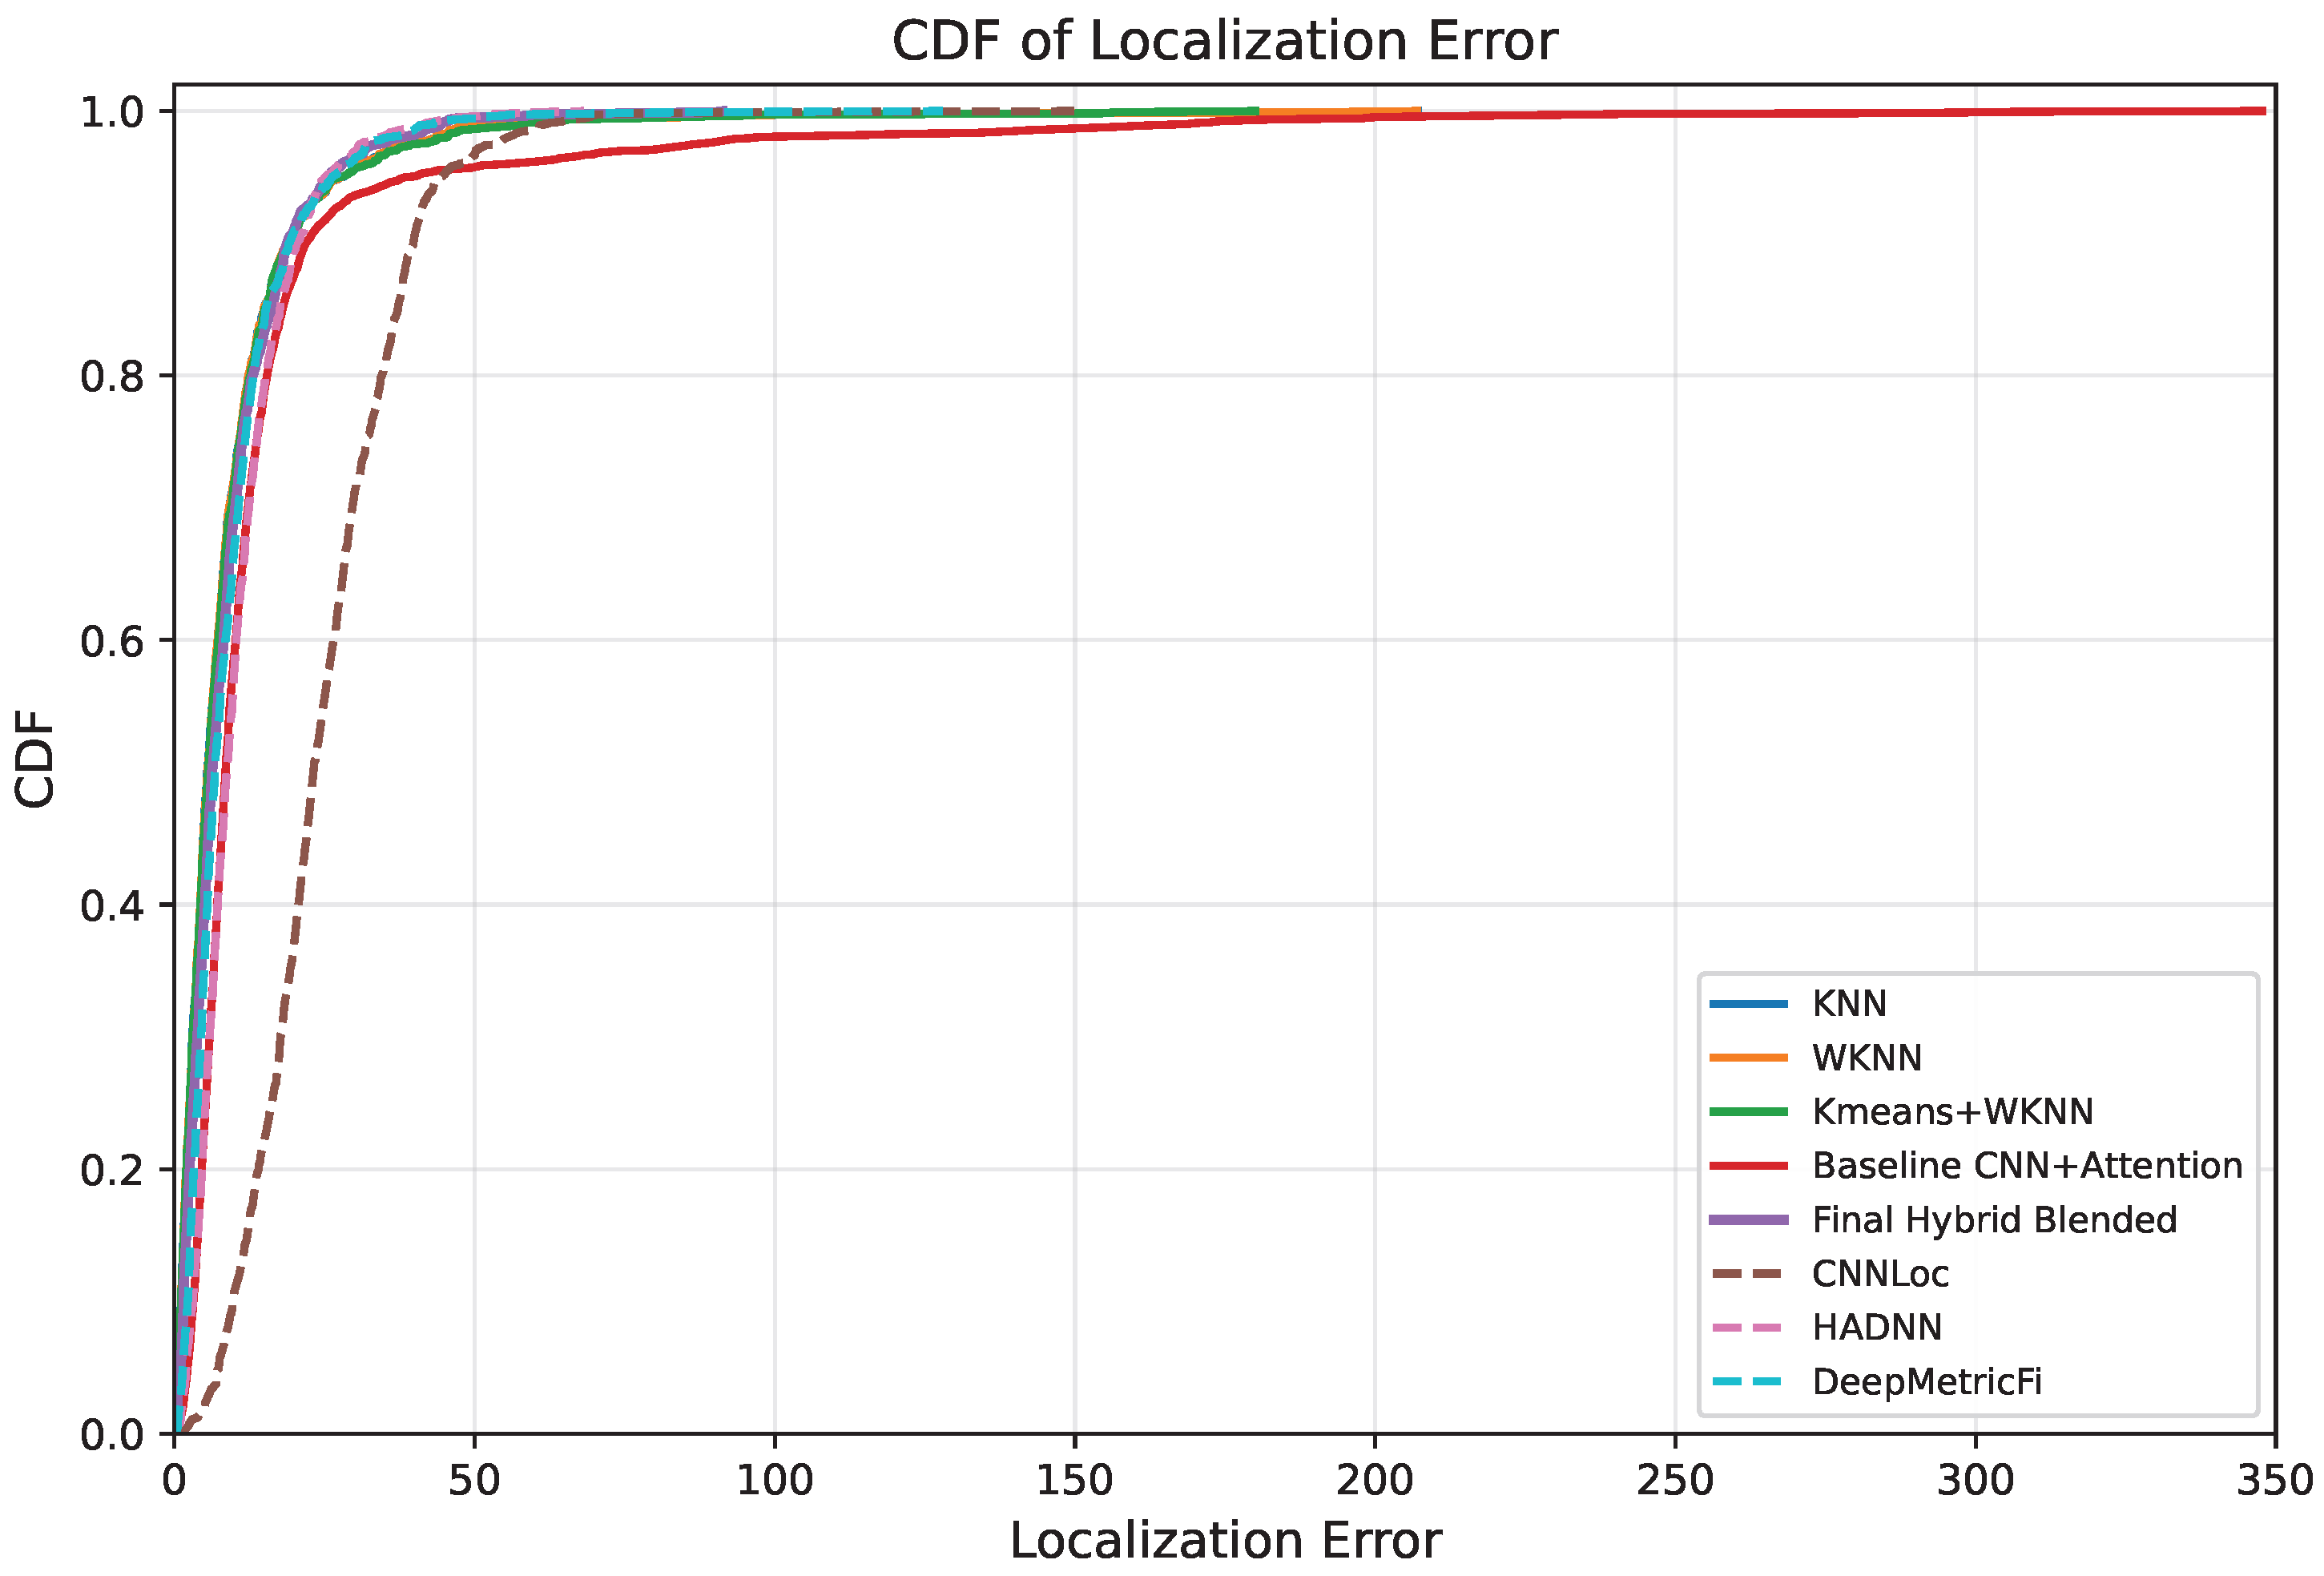
KNN and WKNN have slightly smaller median errors, but their RMSE values are much higher. The hybrid is therefore better at suppressing large outliers, which is also visible in the error CDF (Figure 2). In practice, a few very large errors hurt user experience more than a modest shift in the median; so, keeping the tail short matters. The ensemble improves all metrics further but requires additional model fusion; so, it is reported separately.
Figure 2.
Cumulative distribution functions of localization errors for KNN, WKNN, K-means + WKNN, the CNN + attention baseline, the final hybrid blended model, and three re-implemented deep-learning baselines (CNNLoc, HADNN, DeepMetricFi).
4.2. Training Details and Optimization Settings
The training settings required to reproduce the proposed model are summarized in Table 2. The optimizer type, learning rate, batch size, and scheduler usage are explicitly included, because these factors are essential for reproducibility.
Table 2.
Training configuration of the proposed hybrid blended model.
4.3. Classification Performance and Learning Curves
The semantic branch is analyzed on the internal stratified validation split of 3988 samples derived from the original training partition. Since the model jointly predicts semantic and geometric outputs, the classification quality should be reported as well. As shown in Table 3. The hybrid reaches 94.81% floor classification accuracy and 97.62% building accuracy on this internal split. The building prediction is nearly saturated, while the floor prediction is harder but still above 94%.
Table 3.
Semantic classification performance on the internal validation split.
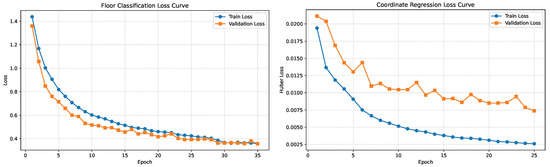
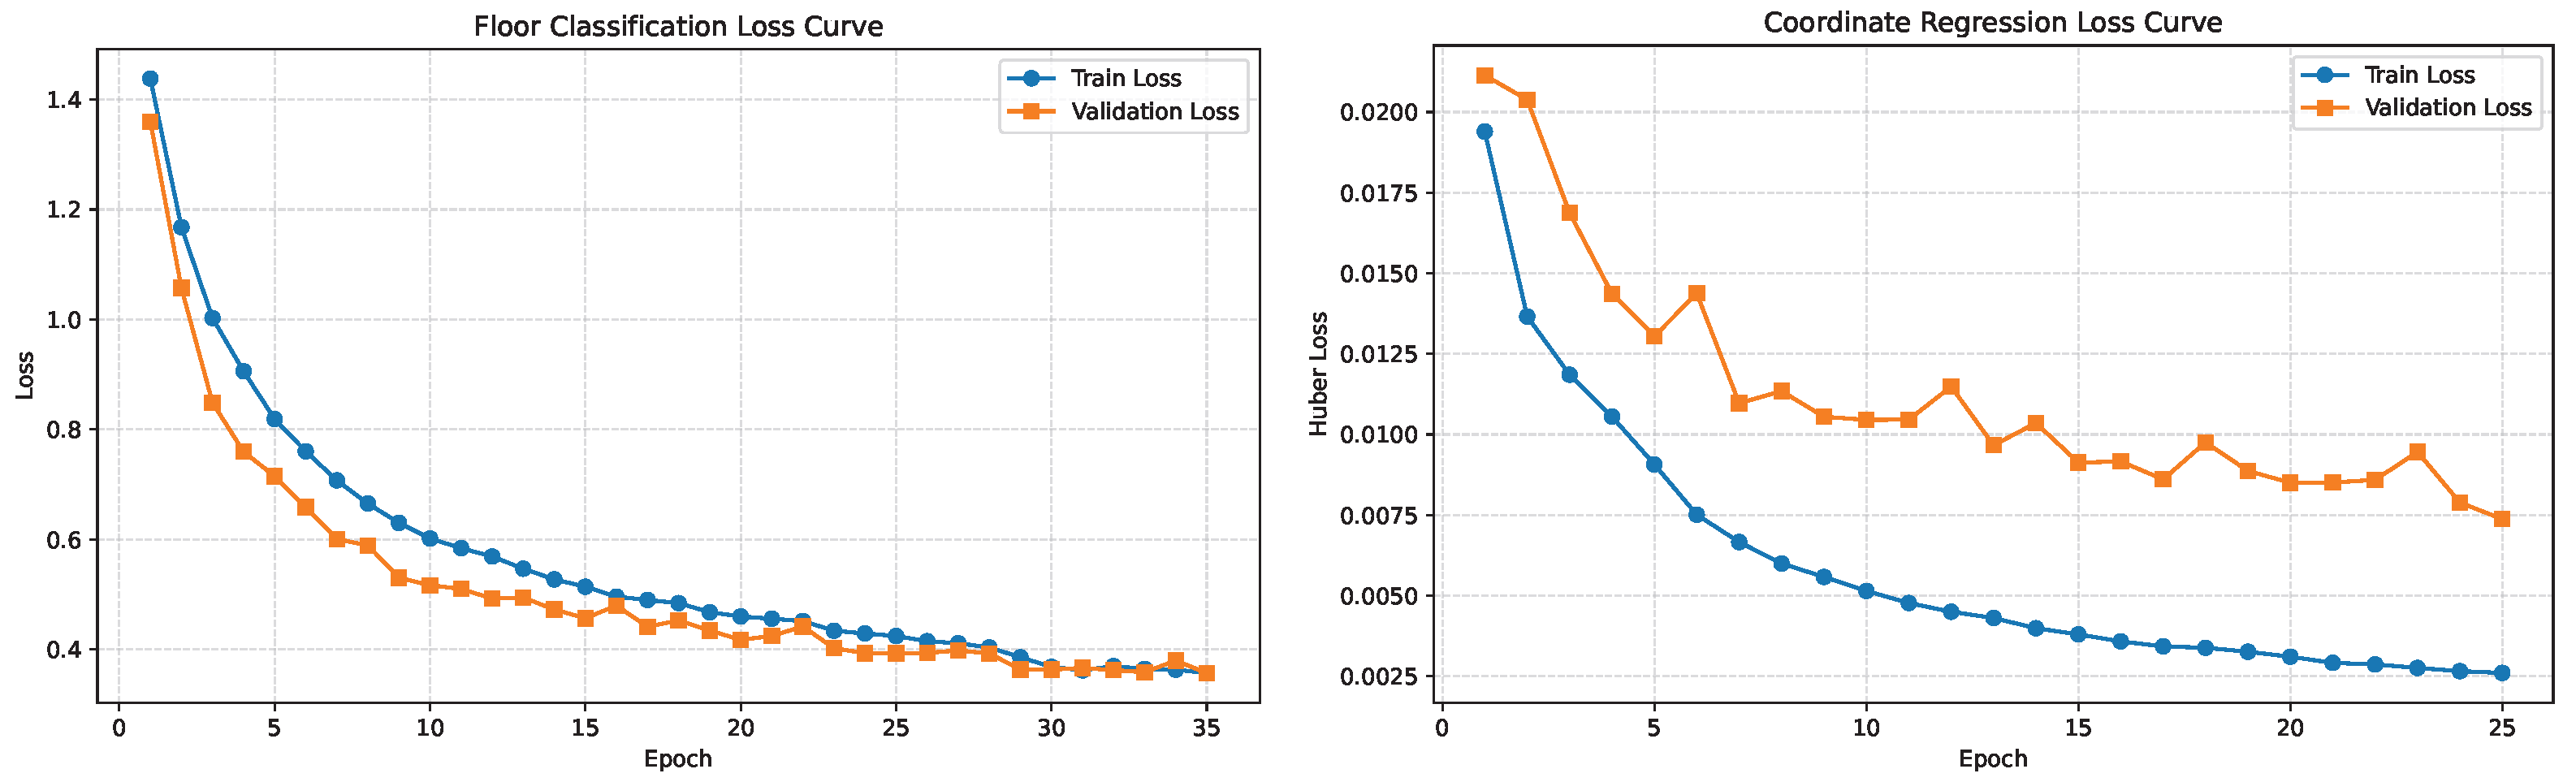
The training and validation loss curves are shown in Figure 3. The floor classification loss drops steadily and levels off without divergence, and the coordinate regression loss also decreases over training; so, both branches converge without interfering with each other.
Figure 3.
Training and validation loss curves for the floor classification branch (left) and the coordinate regression branch (right).
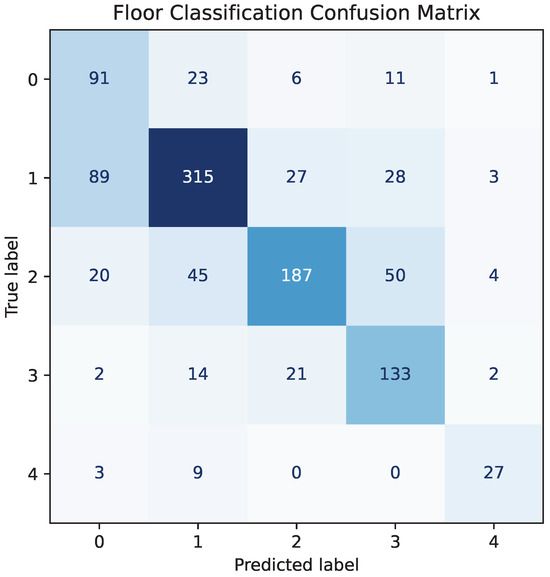
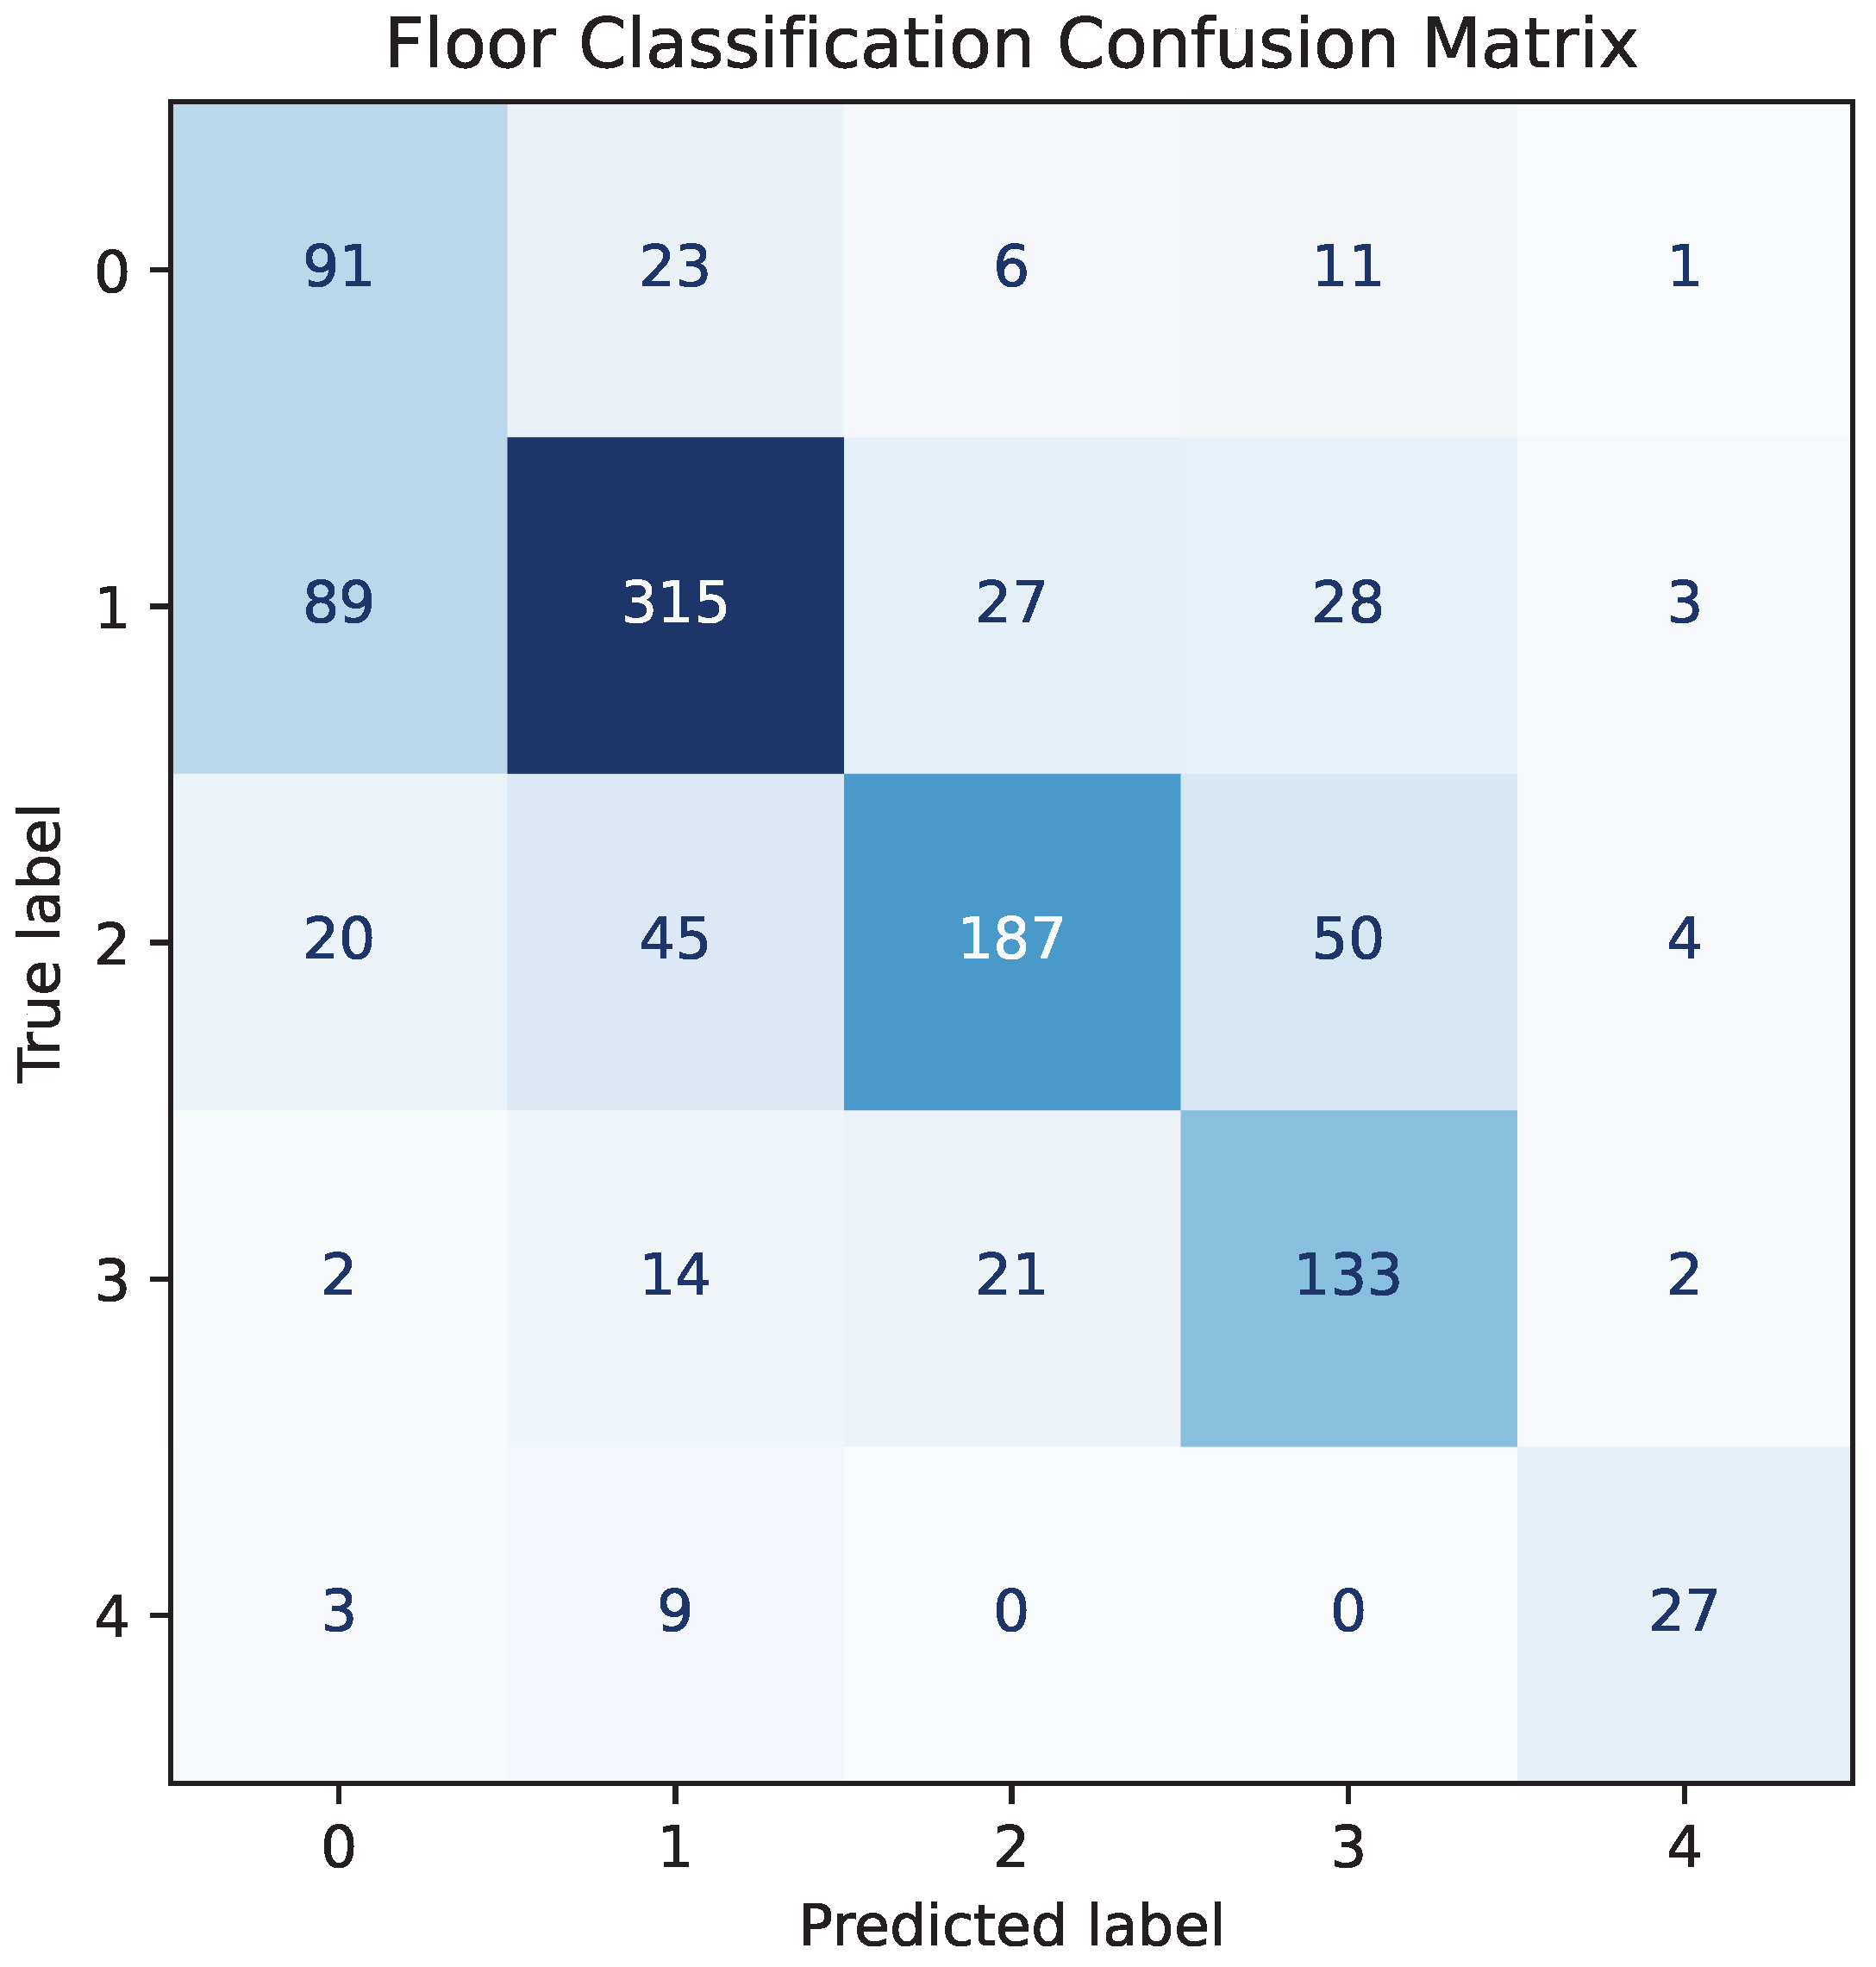
Table 4 shows that the floor classifier remains consistently strong across all floors on the internal validation split, with accuracies ranging from 93.91% to 95.91%. The lowest floor-wise accuracy appears on Floor 1, while Floors 3 and 4 are slightly easier in the current data split. The confusion matrix in Figure 4 shows that most misclassifications happen between adjacent floors, which makes sense because neighboring floors share more of the radio environment than distant ones.
Table 4.
Floor -wise floor classification accuracy on the internal validation split.
Figure 4.
Confusion matrix of floor classification on the validation split used for semantic diagnostics.
4.4. Floor-Wise Coordinate Regression Performance
The floor-wise coordinate regression analysis in Table 5 is reported on the official validation split of 1111 samples. Floors 0–3 remain within a relatively narrow mean-error range of 7.90–9.64 in the dataset coordinate space, whereas Floor 4 is substantially harder, with a mean error of 17.03 and a median error of 13.86. Aggregate metrics alone do not capture this floor-level variation.
Table 5.
Floor-wise coordinate regression performance on the official validation split (dataset coordinate units).
4.5. Error Analysis
Two patterns stand out. First, Floor 4 has the fewest validation samples and the largest error, pointing to weaker fingerprint coverage. Second, the hard cases cluster in a few regions—Building 2–Floor 4, Building 2–Floor 2, Building 1–Floor 0, and Building 1–Floor 2—which all have much higher errors than the rest.
This is consistent with known WiFi fingerprinting behavior: areas with lower AP density, stronger blockage, or corridor-like geometry tend to produce less stable fingerprints. The long-tail errors captured by RMSE are therefore not spread evenly across the building but concentrated in a few difficult areas.
The hybrid helps here because its two parts target different failure modes. The multi-task network learns a global representation with semantic constraints, while the feature-space WKNN corrects local bias by pulling in nearby training embeddings. This is why the hybrid has a much lower RMSE than the classical baselines even though its median error stays close to that of WKNN.
4.6. CDF-Based Comparison
Figure 2 compares the cumulative distributions of localization errors for eight methods: the five original baselines (KNN, WKNN, K-means+WKNN, CNN+attention, Hybrid Blended) and three re-implemented deep-learning baselines (CNNLoc, HADNN, DeepMetricFi). CNNLoc converges the slowest, with its CDF curve well to the right of all other methods. HADNN and DeepMetricFi are competitive with the classical baselines, but the proposed hybrid still reaches the steepest rise in the low-error region, meaning fewer large outliers. The hybrid remains the main model of this study because it does not need cross-model fusion and already gives a good balance of accuracy and robustness on its own.
4.7. Deep Learning Baselines Under an Identical Protocol
To place the proposed hybrid in the context of recent deep learning methods for WiFi fingerprinting, we reimplemented CNNLoc [10], HADNN [11], and DeepMetricFi [12] following the architectures described in the original papers. All three baselines are trained on the official 19,937-sample training partition of UJIIndoorLoc and tested on the same 1111-sample validation partition. RSSI normalization (missing , observed linearly rescaled to ) and coordinate space are kept the same as for the proposed hybrid. No data augmentation, random re-splitting, or ensemble fusion is used. Full architecture and hyperparameter details for each re-implementation are documented in Appendix A.
4.8. Component Ablation
The proposed hybrid has two main ingredients: (i) multi-task supervision over building ID, floor ID, and 2D coordinates and (ii) Feature-Space WKNN retrieval in the learned 256-dimensional embedding space with a hierarchical building/floor filter. To measure the contribution of each part, we compare five configurations that share the same optimizer, batch size, and training budget (AdamW, , batch 512, 25 epochs): Interpretation. Because each variant is retrained independently, the absolute numbers may differ slightly from Table 1 due to training stochasticity; the relative comparisons across variants within this table remain valid.
As shown in Table 6. Without multi-task supervision (A), the mean error rises from 8.87 to 9.04 and the RMSE from 12.75 to 13.25, showing that the building/floor classification heads do help shape the embedding. Retrieving in raw RSSI space (B, i.e., classical WKNN) produces a slightly lower median but a much larger RMSE (16.35 vs. 12.75), because the raw RSSI distance is more affected by fingerprint outliers. Removing the building/floor filter (C) gives accuracy close to the full hybrid (mean 8.80 vs. 8.87), meaning the learned embedding already separates regions well enough for global retrieval. The filter is still useful, though: it shrinks the search pool from to 1300, cutting retrieval time from 2.06 ms to 0.12 ms per query (∼17× faster, see Table 7). Without any WKNN step (E), the mean error increases by about 1.33 units. In short, the multi-task loss improves the embedding quality (A vs. D), the WKNN step reduces the tail errors (E vs. D), and the semantic filter speeds up retrieval with almost no accuracy cost (C vs. D).
Table 6.
Component ablation on the official validation split (dataset coordinate units). ‡
Table 7.
Model complexity and inference latency (CPU, single-thread; forward pass measured with a NumPy float32 proxy for the PyTorch(version + CUDA ) MLP).
4.9. Parameter Sensitivity
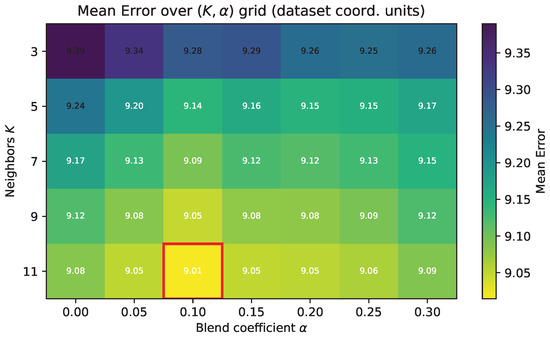
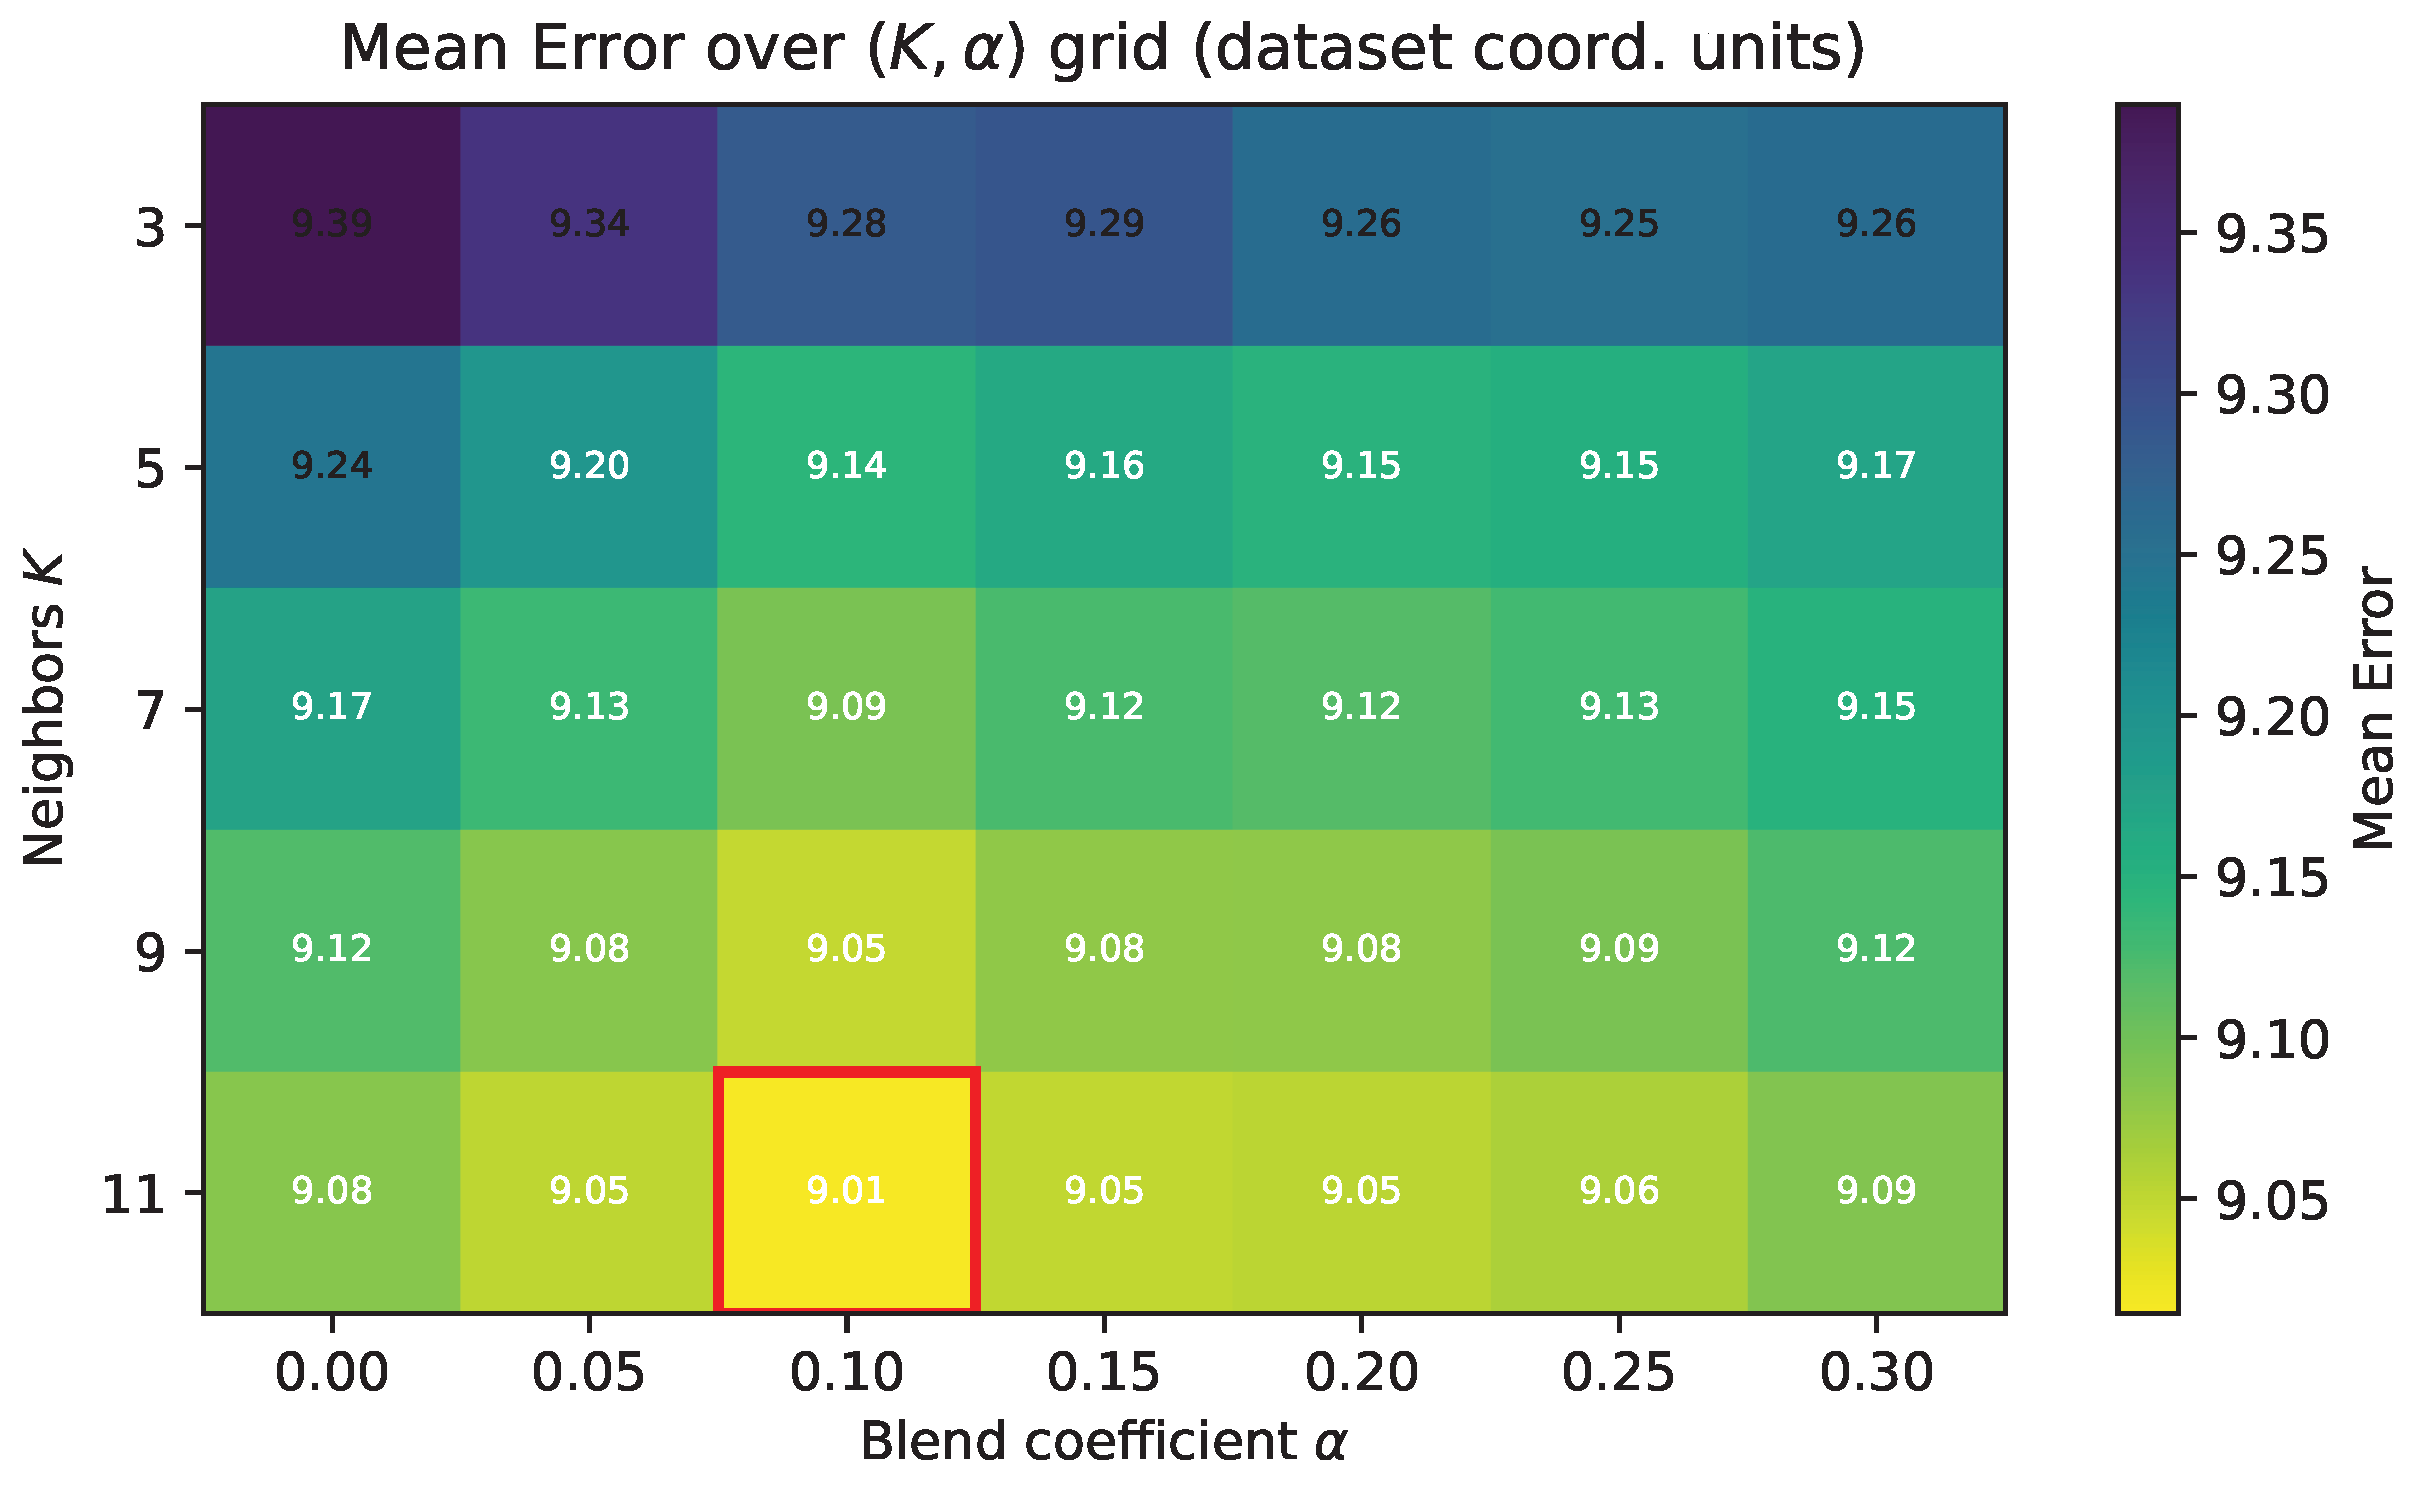
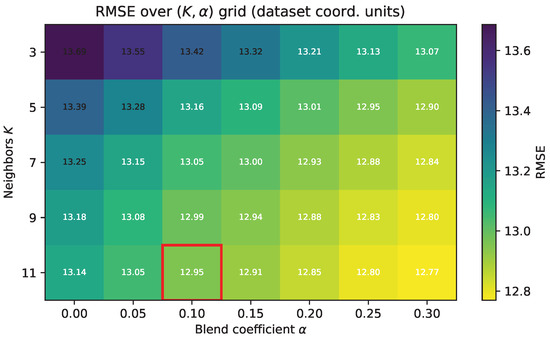
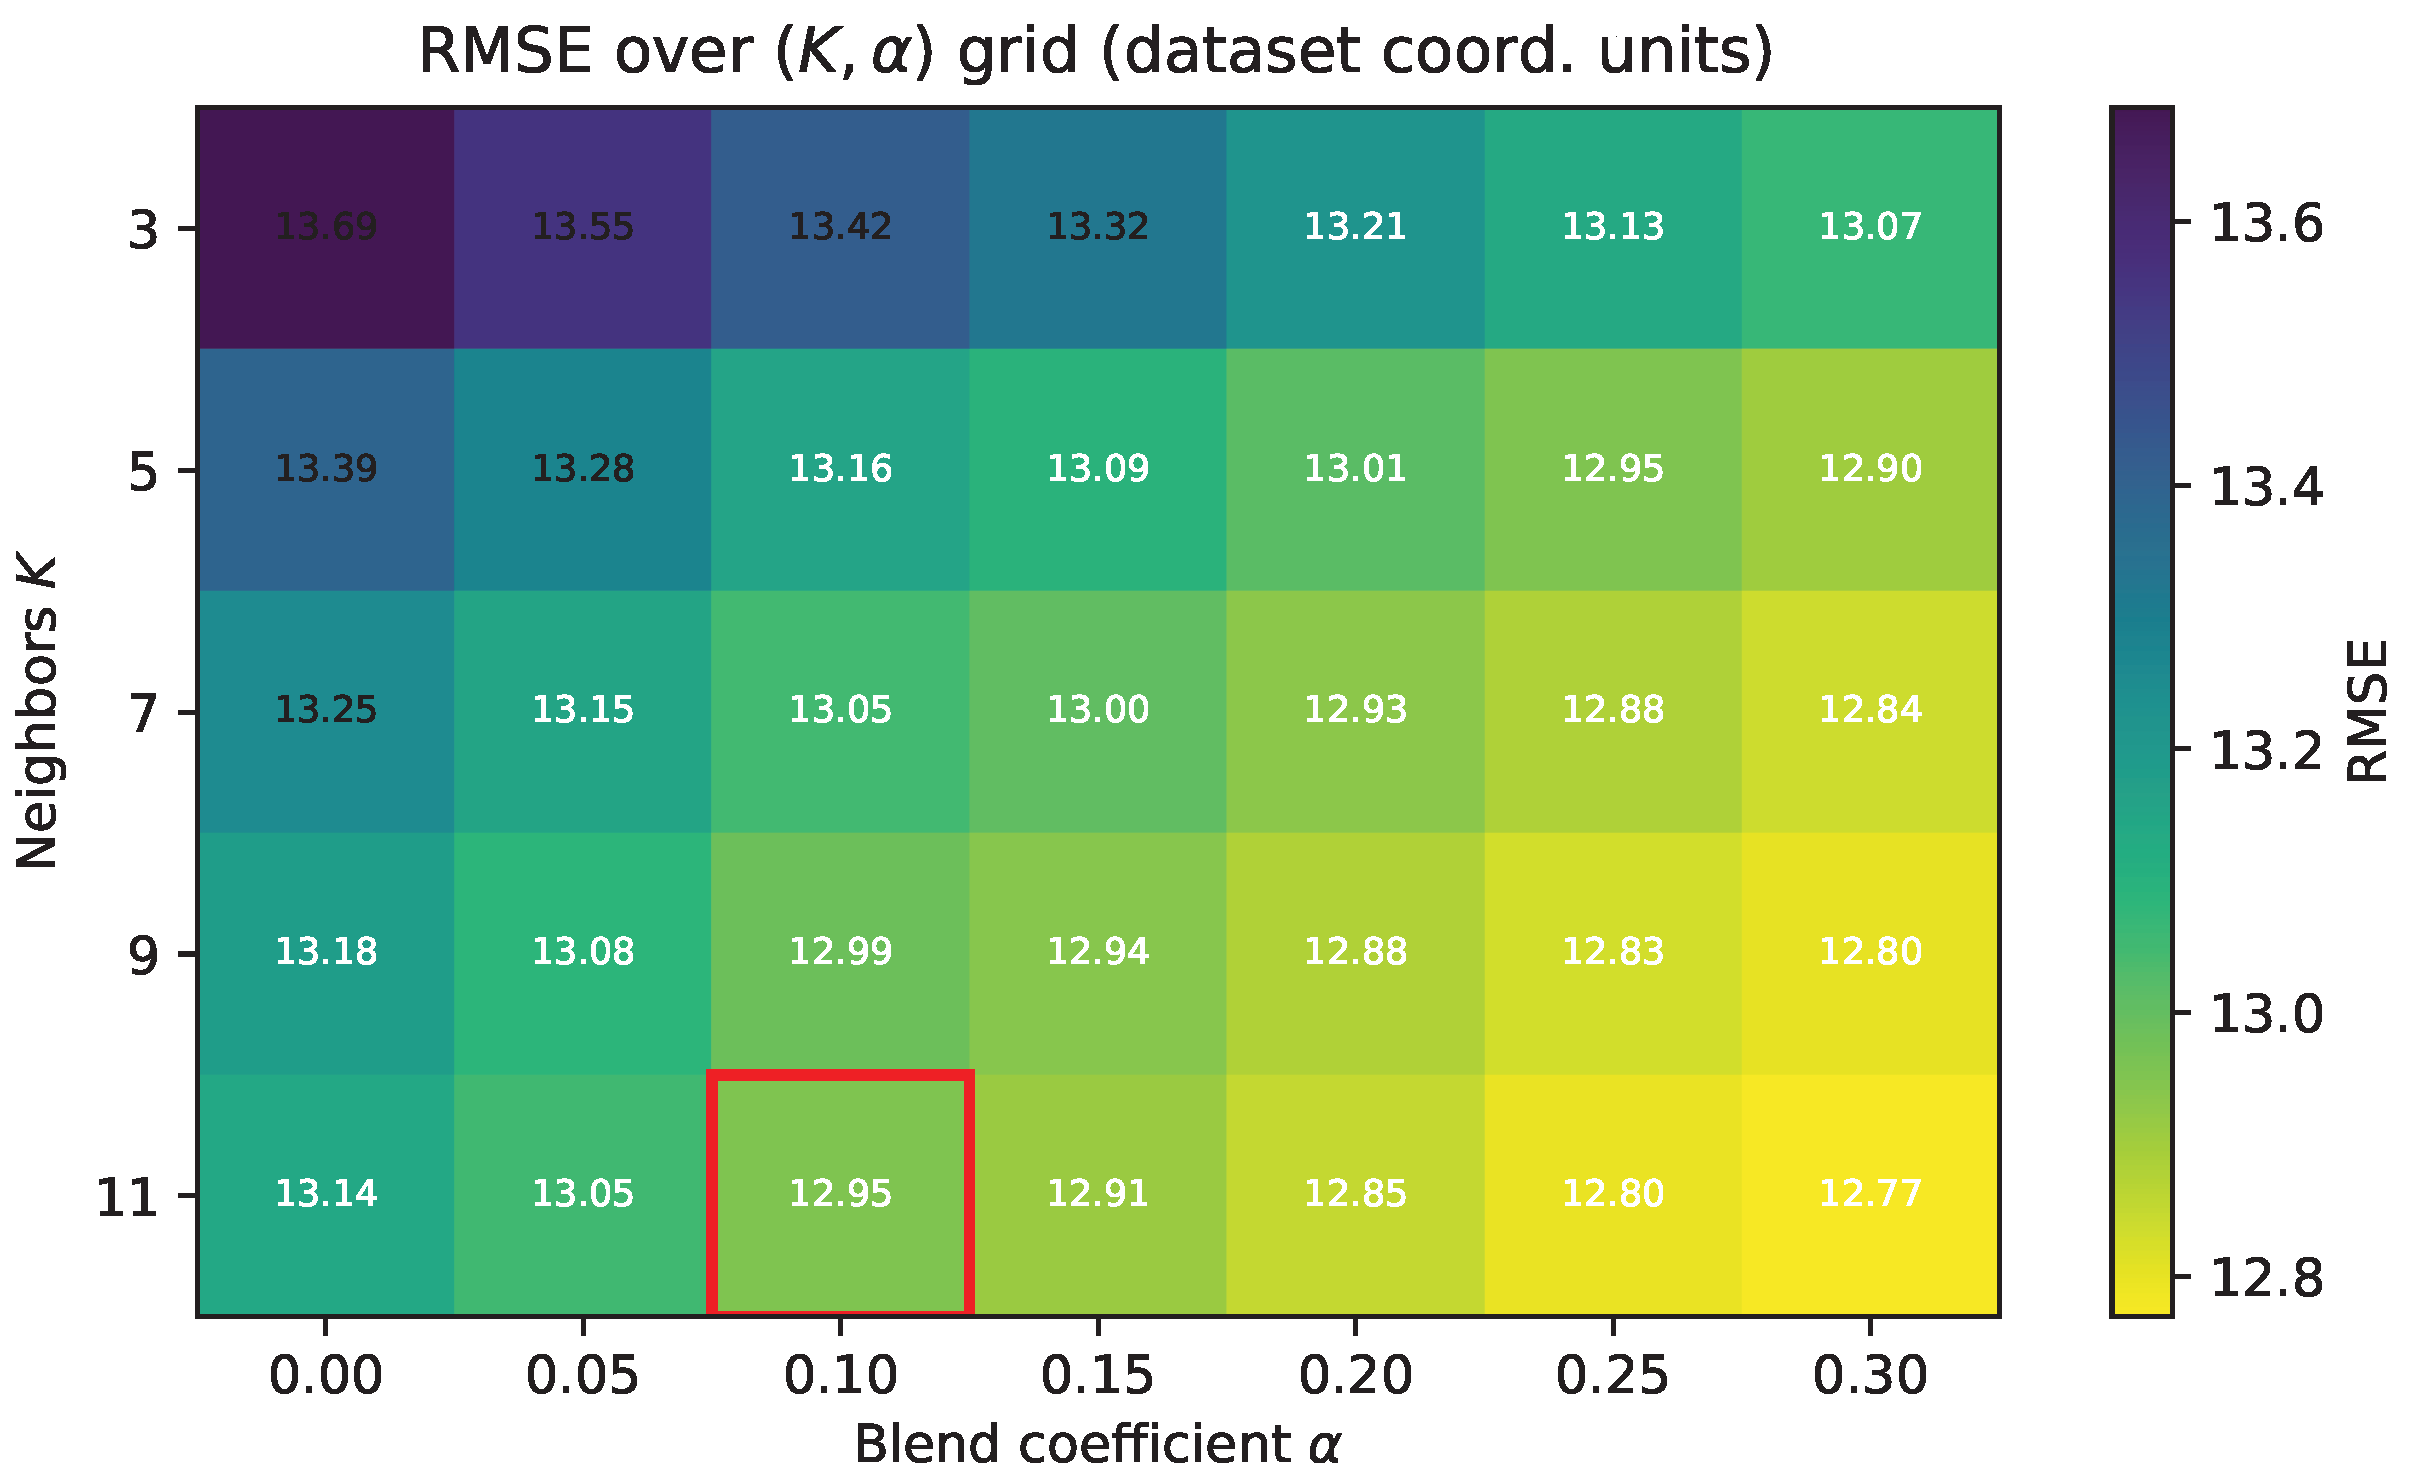
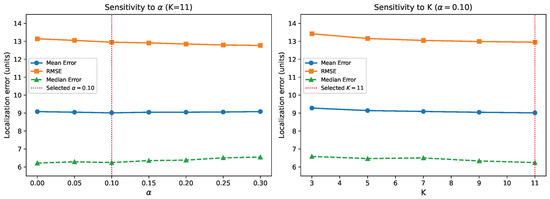
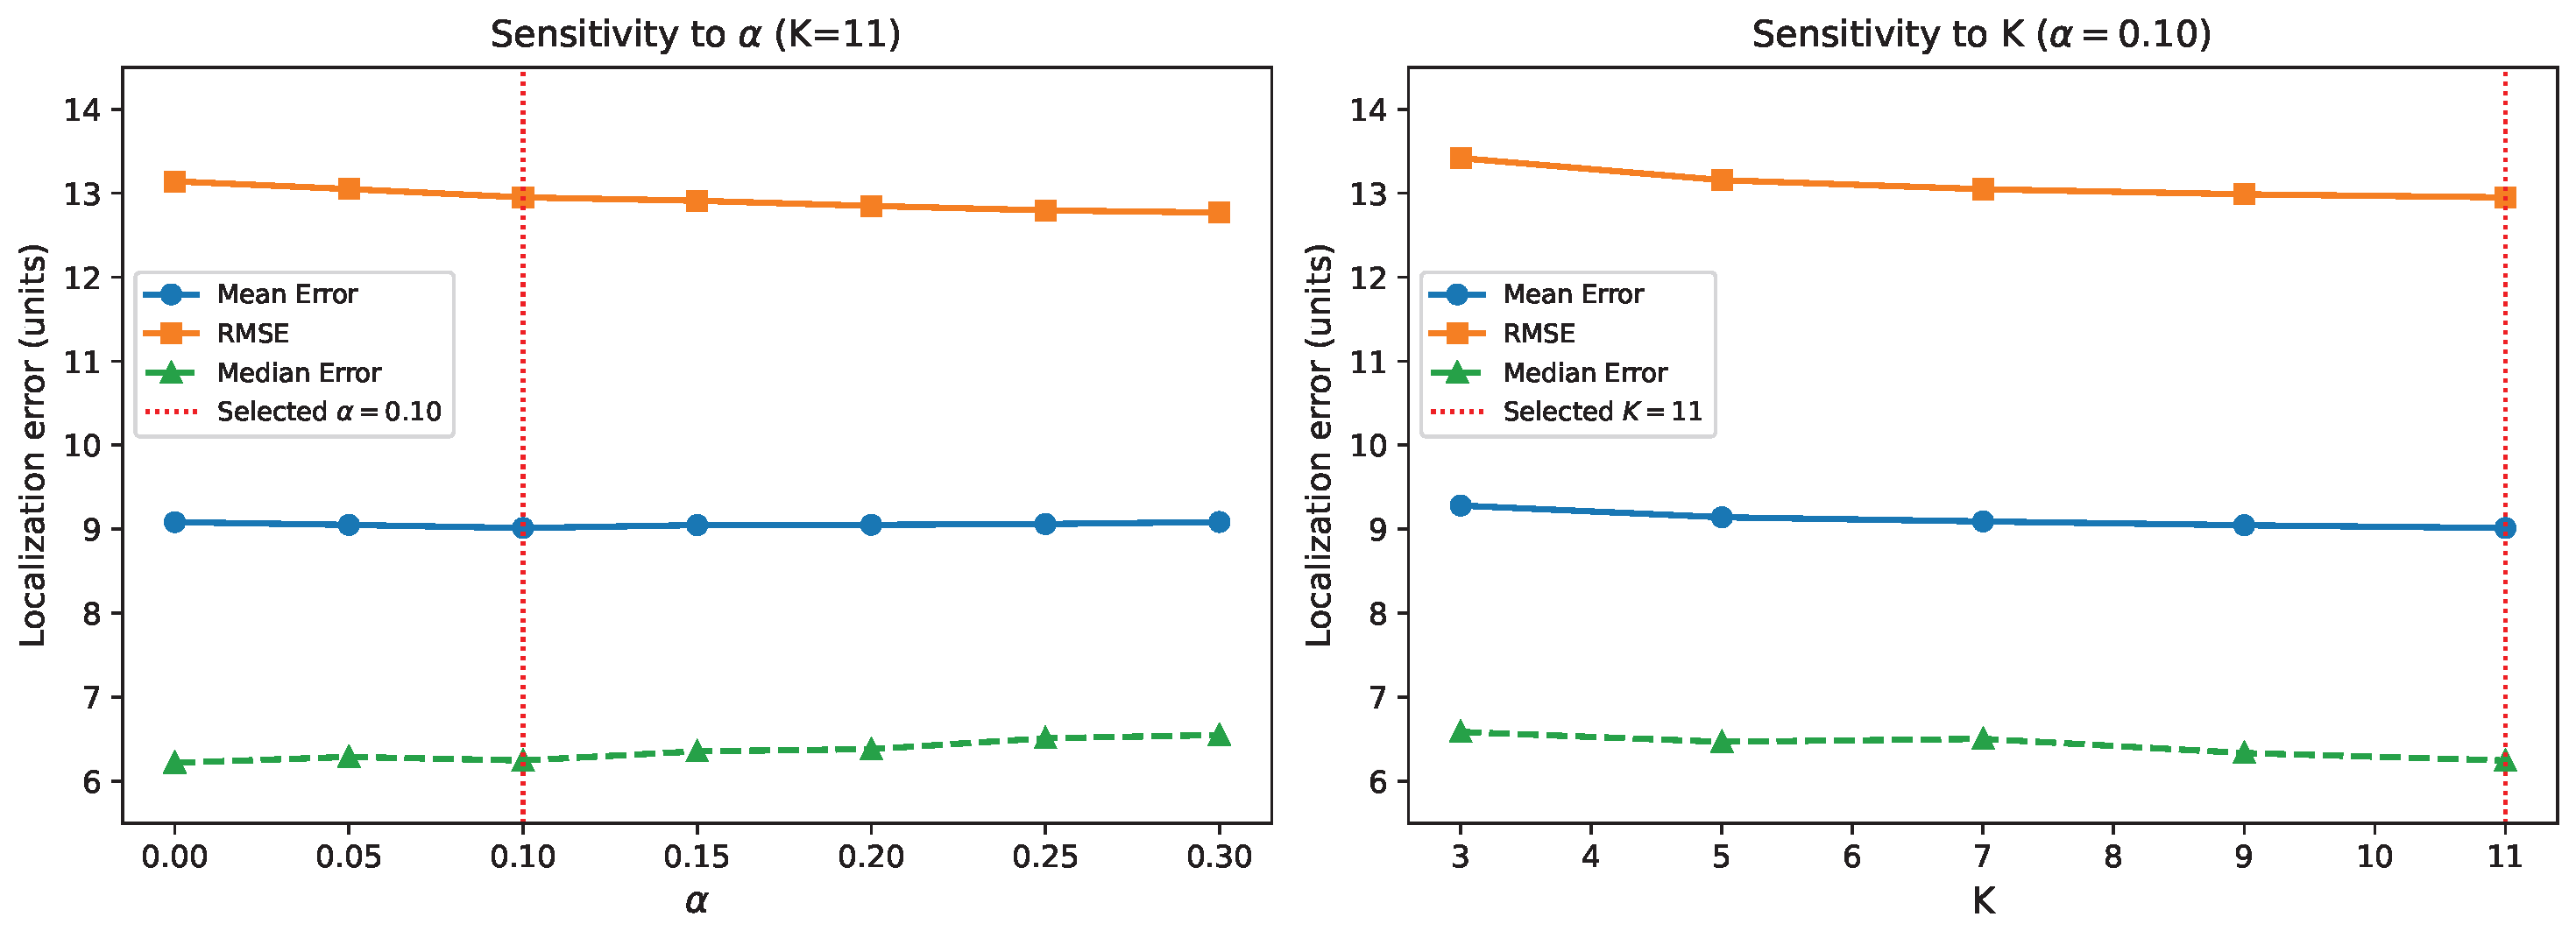
The fusion hyperparameters K (number of neighbors) and (blend weight of the direct neural prediction) were selected by a grid search over and on the validation split. We now report the full grid as mean-error and RMSE heatmaps in Figure 5 and Figure 6 and as one-dimensional sensitivity curves in Figure 7.
Figure 5.
Mean localization error over the grid on the official validation split. The selected operating point , is marked in red.
Figure 6.
RMSE over the grid on the official validation split. RMSE is minimized at a slightly different operating point (, ), illustrating the controllable mean–RMSE trade-off.
Figure 7.
One-dimensional sensitivity of mean error, median error, and RMSE (dataset coordinate units). Left: fixed, varied. Right: fixed, K varied.
Over the full 35-point grid, the mean error ranges between and units; so, the hybrid is not very sensitive to the fusion parameters. The mean error is lowest at , while the RMSE reaches its minimum at . A larger gives more weight to the neural prediction, which smooths out tail errors at a slight cost in the middle of the distribution. When , the neighbor set becomes too small, and both metrics get worse. Whether a single pair works well for all regions is discussed in Section 4.11 and Section 5.1.
4.10. Complexity and Inference Latency
Table 7 reports the model complexity and inference latency for the proposed hybrid on a single CPU thread. The MLP forward pass is measured on the 1,111-sample validation split after warm-up, and the Feature-Space WKNN cost is measured both with and without the hierarchical building/floor semantic filter. Raw-RSSI WKNN brute force is included as a reference.
The building/floor filter reduces the candidate pool by about an order of magnitude and brings the WKNN latency from 2.06 ms down to 0.12 ms. The full hybrid processes a query in under one millisecond on a single CPU thread, and the embedding store is about half the size of the raw RSSI store. For much larger reference databases (>100,000 fingerprints), brute-force search can be replaced by an approximate nearest-neighbor index such as HNSW [31] or FAISS IVF-PQ; since the embedding is only 256-dimensional, such indices should keep the retrieval under 0.1 ms per query with very little accuracy loss.
4.11. Hard-Region Analysis
Table 8 summarizes the statistical properties of each (building, floor) cell in the training partition, and Table 9 reports the per-cell validation errors of the proposed hybrid on the 1111-sample official validation split.
Table 8.
Training-set statistics per (building, floor) cell.
Table 9.
Per-(building, floor) localization errors of the hybrid model on the official validation split.
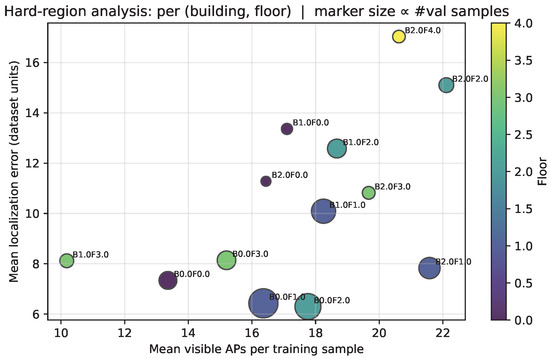
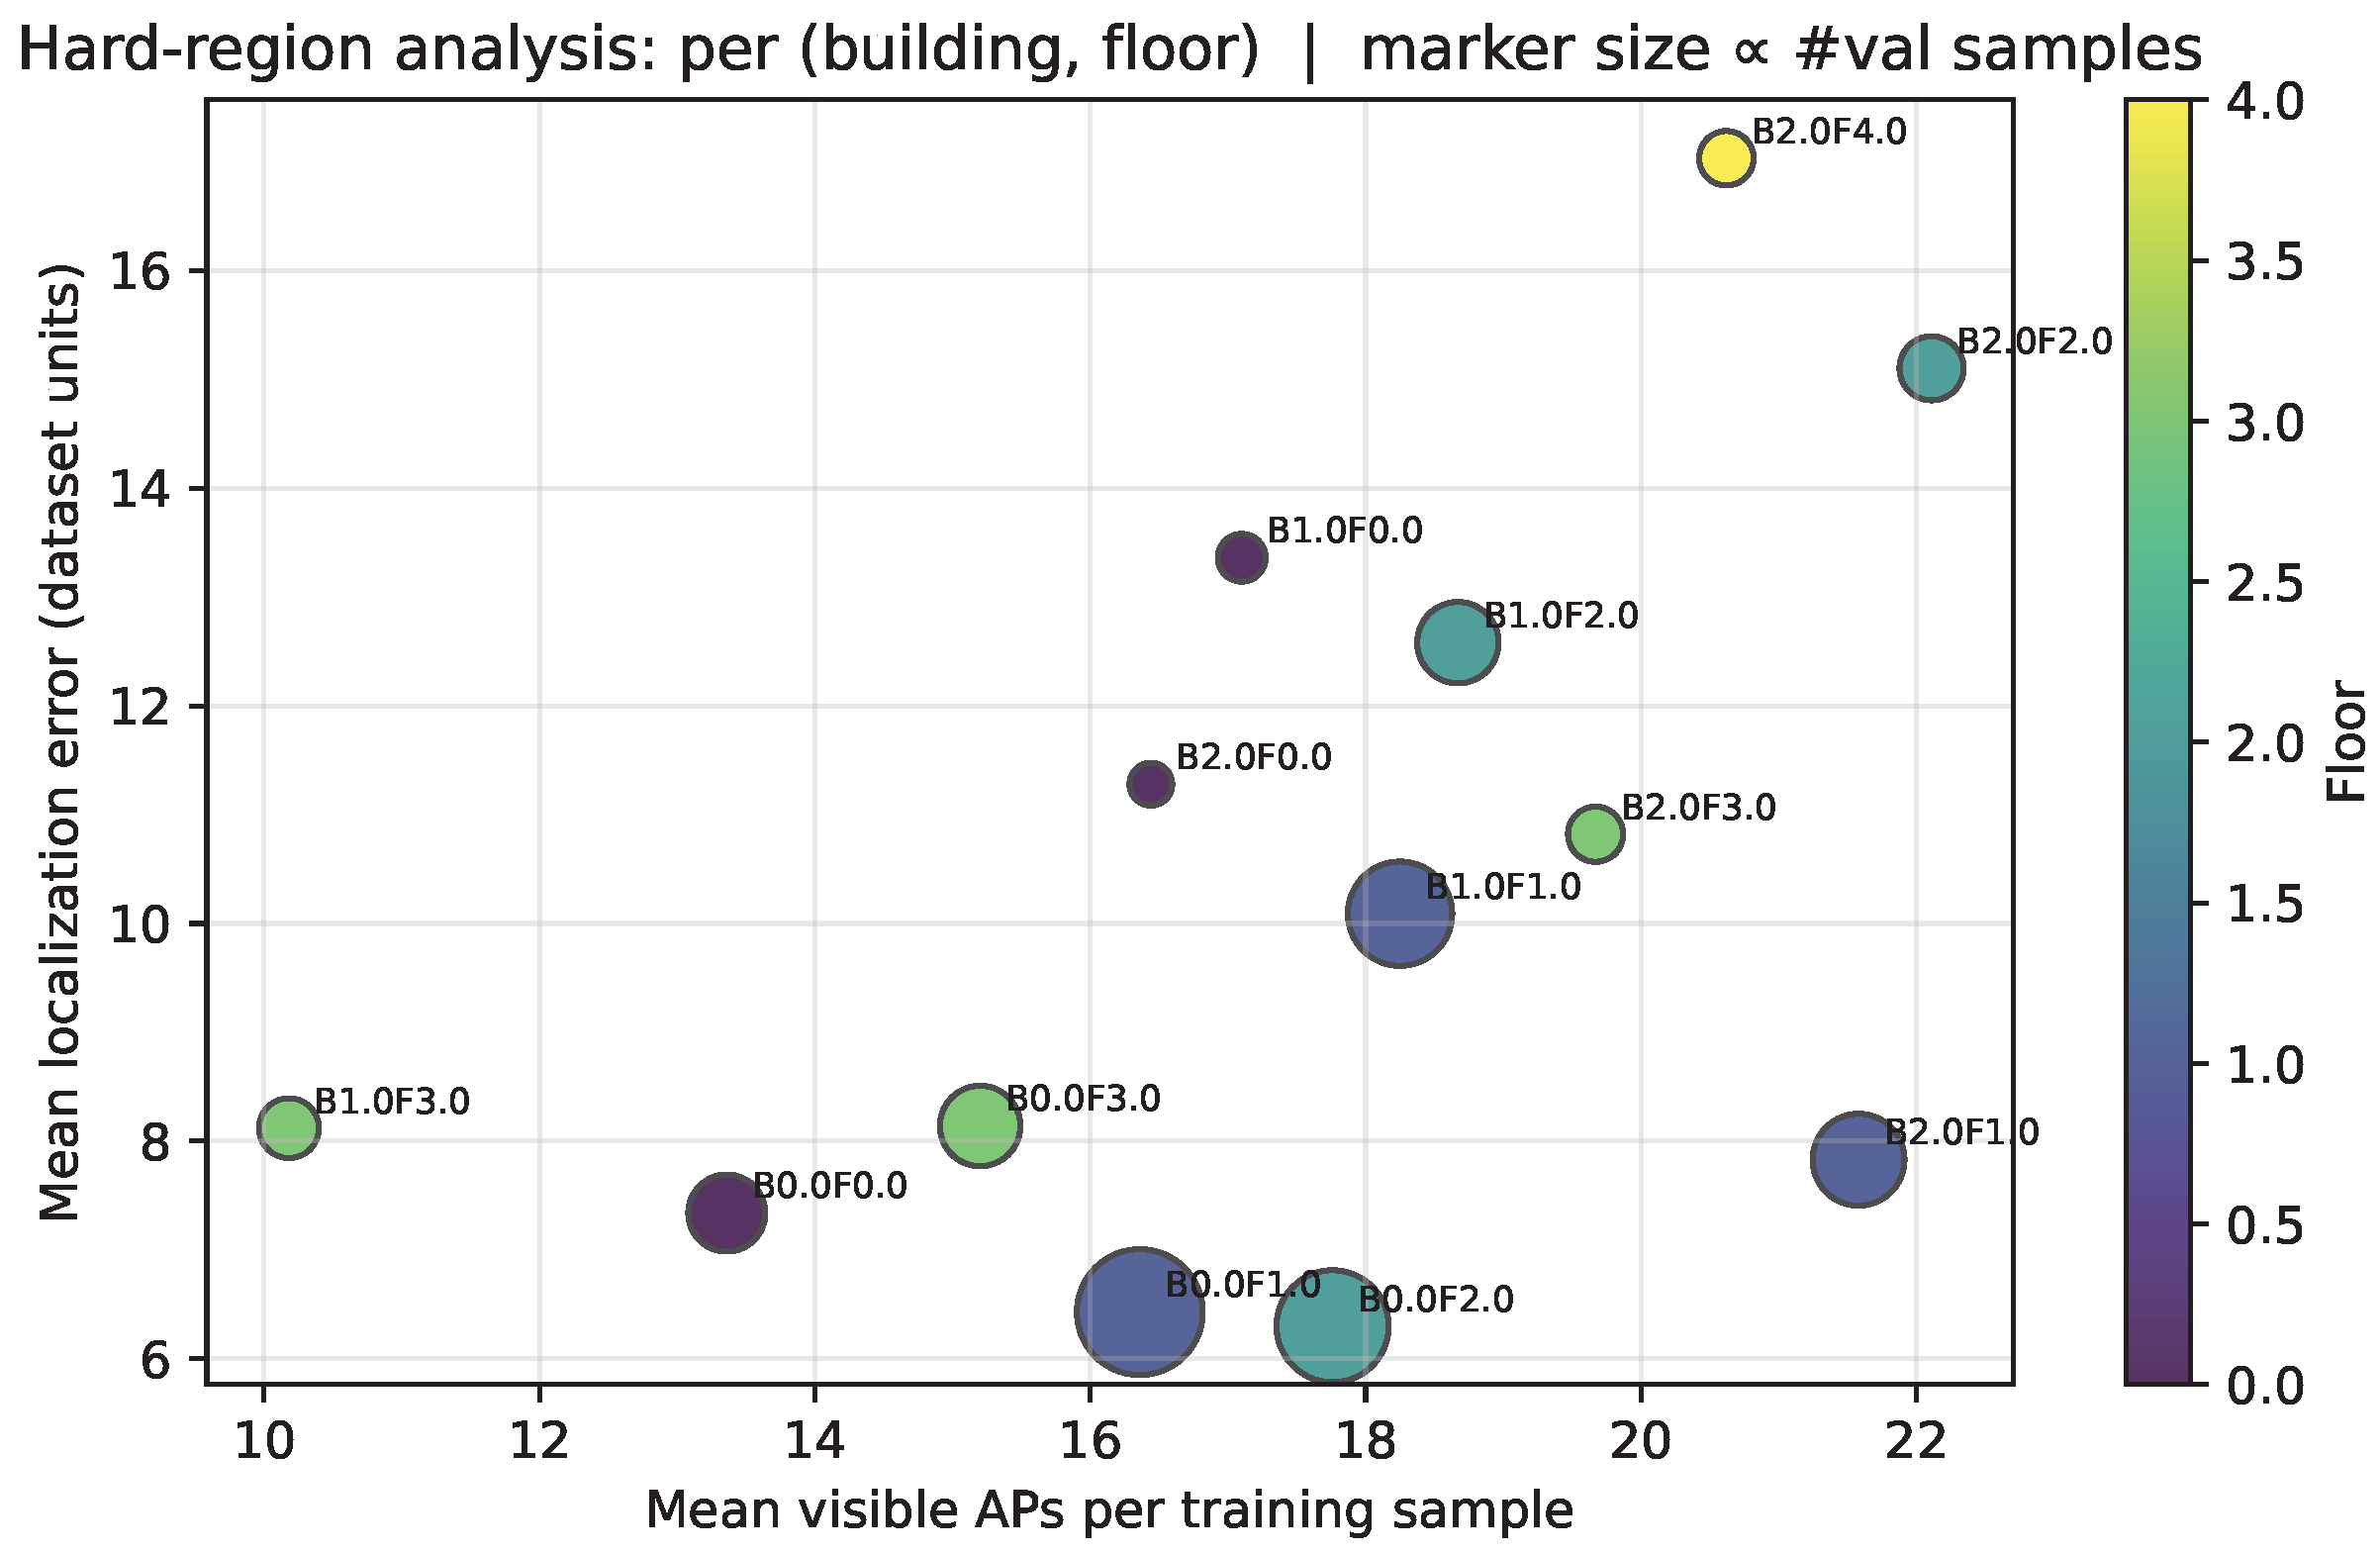
As shown in Figure 8. The Spearman rank correlation between mean error and raw training sample count is only , but the correlation with mean visible APs reaches . The main factor behind hard regions is therefore not the number of training samples but the quality and diversity of the fingerprints: cells with uneven AP coverage or large signal variability are harder no matter how many samples they have. Floor 4 stands out as an outlier (Building 2 only), with 1102 training samples and just 39 validation samples; it has the highest mean error (17.03 units) and the highest median (13.86 units) of any cell. The other 12 cells all stay below 16 units of mean error.
Figure 8.
Per-(building, floor) localization error versus mean number of visible APs per training sample. Marker size is proportional to the number of validation samples in each cell, and color encodes the floor index. The hardest cell is Building 2–Floor 4 with 39 validation samples and a mean error of 17.03 units. (# denotes the number of …).
5. Discussion
The results show that the main bottleneck of the current system is not overall the model capacity but the regional difficulty. The building prediction is already very accurate, and the floor-level performance is good, but errors are concentrated in a handful of building–floor cells. The hard part is not coarse semantic recognition but fine-grained coordinate ambiguity in a few specific areas.
In practice, this means that collecting more fingerprints should focus on the difficult regions rather than spreading effort uniformly. Floors or areas with low sample density, heavy blockage, or repetitive corridor geometry would benefit most. Future refinements should also be region-aware: for instance, corridor-specific neighbor selection, topological constraints, or uncertainty-weighted blending may cut tail errors more than just making the neural backbone larger.
The hybrid model is a solid starting point for this dataset, and the remaining error patterns point to concrete directions for improvement.
5.1. Region-Aware Fusion
The per-cell errors in Table 9 show that a single global works reasonably well but is not the best choice for every region. We plan to investigate three directions in future work:
- 1.
- Region-aware fusion: Select per predicted (building, floor) cell rather than globally. Because the semantic branch already provides reliable (building, floor) predictions (≥93.9% per floor, Table 4), this amounts to a simple table lookup at inference time and adds almost no latency.
- 2.
- Targeted data augmentation on hard cells: Apply RSSI dropout, additive Gaussian noise on observed APs, and SMOTE-style interpolation restricted to sparse cells such as Building 2–Floor 4. Preliminary results are reported in Section 5.2 below.
- 3.
- Heteroscedastic uncertainty at the coordinate head, so that the fusion weight adapts when the neural prediction is locally unreliable. This can be implemented by replacing the regression output with a diagonal Gaussian head and blending in inverse-variance-weighted form.
5.2. Floor-4 Targeted Data Augmentation
The Floor 4 mean error of units (Table 5) is too large for practical indoor navigation. The hard-region analysis in Section 4.11 traces this to a single cell, Building 2–Floor 4, which has only 39 validation samples. To investigate whether targeted augmentation can help, we retrained the hybrid with a data augmentation pipeline applied only to Building 2–Floor 4 training samples: (i) RSSI dropout with rate on observed APs, (ii) additive Gaussian noise with on normalized RSSI values, and (iii) SMOTE-style interpolation between randomly paired same-cell samples. The resulting Floor 4 localization errors are summarized in Table 10. Since the augmentation only touches Floor 4 training data, the overall numbers in Table 1 are nearly unaffected.
Table 10.
Effect of targeted data augmentation on the Building 2–Floor 4 cell of the official validation split (dataset coordinate units).
6. Conclusions
This paper presents a hybrid indoor localization method that pairs a multi-task neural network (building, floor, and coordinate prediction) with a feature-space WKNN refinement step and a validation-tuned blending coefficient.
Experiments show that this hybrid is more robust than both the deep baseline and the classical fingerprinting baselines: it has a noticeably lower RMSE while keeping the mean error competitive. Floor-level analysis reveals that the remaining large errors come from a small number of hard regions, especially the top floor of Building 2.
We also report all training details—optimizer, learning rate, batch size, scheduler choice, loss curves, and classification accuracy—so that readers can see not just how well the method works but also where and why the errors persist.
Three directions are planned for future work: region-aware or uncertainty-weighted refinement for hard areas like corridors and sparse-AP zones, stronger spatial priors for floor transitions, and integration of additional sensors such as IMU or BLE/UWB.
Author Contributions
Conceptualization, Y.L. and S.-C.K.; methodology, Y.L.; software, Y.L.; validation, Y.L.; formal analysis, Y.L.; investigation, Y.L.; resources, S.-C.K.; data curation, Y.L.; writing—original draft preparation, Y.L.; writing—review and editing, Y.L. and S.-C.K.; visualization, Y.L.; supervision, S.-C.K.; project administration, S.-C.K.; funding acquisition, S.-C.K. All authors have read and agreed to the published version of the manuscript.
Funding
This research received no external funding.
Institutional Review Board Statement
Not applicable.
Informed Consent Statement
Not applicable.
Data Availability Statement
The public UJIIndoorLoc WiFi fingerprint dataset analyzed in this study is available from Kaggle at https://www.kaggle.com/datasets/giantuji/UjiIndoorLoc (accessed on 14 November 2025). The processed result files, figures, and manuscript source used in this work are available from the corresponding author upon reasonable request.
Conflicts of Interest
The authors declare no conflicts of interest.
Abbreviations
The following abbreviations are used in this manuscript:
| AP | Access Point |
| BLE | Bluetooth Low Energy |
| CNN | Convolutional Neural Network |
| GNSS | Global Navigation Satellite System |
| KNN | k-Nearest Neighbors |
| MLP | Multilayer Perceptron |
| RMSE | Root Mean Square Error |
| RSSI | Received Signal Strength Indicator |
| UWB | Ultra-Wideband |
| WAP | Wireless Access Point |
| WKNN | Weighted k-Nearest Neighbors |
Appendix A. Deep Learning Baseline Re-Implementation Details
This appendix documents the architecture and training hyperparameters used to re-implement the three deep learning baselines reported in Table 1. All models are trained on the official 19,937-sample training partition and evaluated on the 1111-sample validation partition of UJIIndoorLoc with identical RSSI normalization (missing , observed linearly rescaled to ).
For DeepMetricFi, a semi-hard triplet mining strategy is used with a positive radius of 0.02 in normalized coordinate space. The final reported DeepMetricFi result uses WKNN blending in the learned 128-dimensional embedding space (, ), as this produced a lower error than the direct neural prediction alone.
Table A1.
Re-implementation details for the deep learning baselines.
References
- Rathnayake, R.M.M.R.; Maduranga, M.W.P.; Tilwari, V.; Dissanayake, M.B. RSSI and Machine Learning-Based Indoor Localization Systems for Smart Cities. Eng 2023, 4, 1468–1494. [Google Scholar] [CrossRef] [Scilit]
- Retscher, G.; Kealy, A.; Gabela, J.; Li, Y.; Goel, S.; Toth, C.K. A Comparative Analysis of Indoor Localization Technologies. Comput. Netw. 2025, 270, 111527. [Google Scholar] [CrossRef] [Scilit]
- Bahl, P.; Padmanabhan, V.N. RADAR: An In-Building RF-Based User Location and Tracking System. In Proceedings of the IEEE INFOCOM 2000; IEEE: Piscataway, NJ, USA, 2000; Volume 2, pp. 775–784. [Google Scholar] [CrossRef] [Scilit]
- Singh, N.; Choe, S.; Punmiya, R. Machine Learning Based Indoor Localization Using Wi-Fi RSSI Fingerprints: An Overview. IEEE Access 2021, 9, 127150–127174. [Google Scholar] [CrossRef] [Scilit]
- Youssef, M.A.; Agrawala, A.K. The Horus WLAN Location Determination System. In Proceedings of the Third International Conference on Mobile Systems, Applications, and Services (MobiSys 2005); ACM: New York, NY, USA, 2005; pp. 205–218. [Google Scholar] [CrossRef] [Scilit]
- Yaro, A.S.; Maly, F.; Prazak, P. A Survey of the Performance-Limiting Factors of a 2-Dimensional RSS Fingerprinting-Based Indoor Wireless Localization System. Sensors 2023, 23, 2545. [Google Scholar] [CrossRef] [Scilit]
- Kozhassap, A.; Auelbekov, A.; Bekova, S.; Zhumadilova, M.; Dzhaksybekov, N. RSSI Fingerprint-Based Indoor Localization Solutions Using Machine Learning Algorithms: A Comprehensive Review. Smart Cities 2025, 8, 153. [Google Scholar] [CrossRef] [Scilit]
- Wang, B.; Li, Q.; Liu, J.; Wang, Z.; Yu, Q.; Liang, R. A WKNN Indoor Fingerprint Localization Technique Based on Improved Discrimination Capability of RSS Similarity. Sensors 2024, 24, 4586. [Google Scholar] [CrossRef] [Scilit] [PubMed]
- Duong, T.H.; Trinh, A.V.; Hoang, M.K. Efficient and Accurate Indoor Positioning System: A Hybrid Approach Integrating PCA, WKNN, and Linear Regression. J. Commun. 2024, 19, 37–43. [Google Scholar] [CrossRef] [Scilit]
- Song, X.; Fan, X.; He, X.; Xiang, C.; Ye, Q.; Huang, X.; Fang, G.; Chen, L.L.; Qin, J.; Wang, Z. CNNLoc: Deep-Learning Based Indoor Localization with WiFi Fingerprinting. In Proceedings of the 2019 IEEE SmartWorld/UIC/ATC/CBDCom/IOP/SCI; IEEE: Piscataway, NJ, USA, 2019; pp. 589–595. [Google Scholar] [CrossRef] [Scilit]
- Cha, J.; Lim, E. A Hierarchical Auxiliary Deep Neural Network Architecture for Large-Scale Indoor Localization Based on Wi-Fi Fingerprinting. Appl. Soft Comput. 2022, 120, 108624. [Google Scholar] [CrossRef] [Scilit]
- Chen, P.; Zhang, S. DeepMetricFi: Improving Wi-Fi Fingerprinting Localization by Deep Metric Learning. IEEE Internet Things J. 2024, 11, 6961–6971. [Google Scholar] [CrossRef] [Scilit]
- Li, S.; Kim, K.S.; Tang, Z.; Smith, J.S. Hierarchical Stage-Wise Training of Linked Deep Neural Networks for Multi-Building and Multi-Floor Indoor Localization Based on Wi-Fi RSSI Fingerprinting. IEEE Sens. J. 2024, 25, 23341–23351. [Google Scholar] [CrossRef] [Scilit]
- Li, S.; Tang, Z.; Kim, K.S.; Smith, J.S. On the Use and Construction of Wi-Fi Fingerprint Databases for Large-Scale Multi-Building and Multi-Floor Indoor Localization: A Case Study of the UJIIndoorLoc Database. Sensors 2024, 24, 3827. [Google Scholar] [CrossRef] [Scilit] [PubMed]
- Martín-Frechina, S.; Dura, E.; Miralles, I.; Torres-Sospedra, J. From Fingerprinting to Advanced Machine Learning: A Systematic Review of Wi-Fi and BLE-Based Indoor Positioning Systems. Sensors 2025, 25, 6946. [Google Scholar] [CrossRef] [Scilit] [PubMed]
- Feng, X.; Nguyen, K.A.; Luo, Z. A Review of Open Access Wi-Fi Fingerprinting Datasets for Indoor Positioning. IEEE Access 2024, 12, 167970–167989. [Google Scholar] [CrossRef] [Scilit]
- Lin, X.; Gan, J.; Jiang, C.; Xue, S.; Liang, Y. Wi-Fi-Based Indoor Localization and Navigation: A Robot-Aided Hybrid Deep Learning Approach. Sensors 2023, 23, 6320. [Google Scholar] [CrossRef] [Scilit]
- Esmaeili Gorjan, H.; Gil Jiménez, V.P. Improving Indoor WiFi Localization by Using Machine Learning Techniques. Sensors 2024, 24, 6293. [Google Scholar] [CrossRef] [Scilit]
- Gu, F.; Shi, L.; Guo, H.; Shang, J. Deep Fingerprint Metric Learning for KNN-Based Indoor Localization. In Proceedings of the IEEE Global Communications Conference (GLOBECOM 2023); IEEE: Piscataway, NJ, USA, 2023; pp. 182–188. [Google Scholar] [CrossRef] [Scilit]
- Nabati, M.; Ghorashi, S.A. A Real-Time Fingerprint-Based Indoor Positioning Using Deep Learning and Preceding States. Expert Syst. Appl. 2023, 213, 118889. [Google Scholar] [CrossRef] [Scilit]
- Saeed, M.K.; Kim, J.; Mak, M.W. A Novel Device-Free Wi-Fi Indoor Localization Using a Convolutional Neural Network Based on Residual Attention. PeerJ Comput. Sci. 2025, 11, e2471. [Google Scholar] [CrossRef] [Scilit]
- Wang, S.; Zhang, S.; Ma, J.; Dobre, O.A. Graph-Neural-Network-Based WiFi Indoor Localization System with Access Point Selection. IEEE Internet Things J. 2024, 11, 33550–33564. [Google Scholar] [CrossRef] [Scilit]
- Li, M.; Zhang, Y.; Wang, Y.; Chen, R.; Huang, Z. Heterogeneous Graph Neural Network for WiFi RSSI-Based Indoor Floor Classification. Electronics 2025, 14, 4845. [Google Scholar] [CrossRef] [Scilit]
- Junoh, S.A.; Pyun, J.Y. Enhancing Indoor Localization with Semi-Crowdsourced Fingerprinting and GAN-Based Data Augmentation. IEEE Internet Things J. 2024, 11, 11945–11959. [Google Scholar] [CrossRef] [Scilit]
- Yoo, J. Wi-Fi Fingerprint Indoor Localization by Semi-Supervised Generative Adversarial Network. Sensors 2024, 24, 5698. [Google Scholar] [CrossRef] [Scilit] [PubMed]
- Tang, Z.; Gu, R.; Li, S.; Kim, K.S.; Smith, J.S. Static vs. Dynamic Databases for Indoor Localization Based on Wi-Fi Fingerprinting: A Discussion from a Data Perspective. In Proceedings of the 6th International Conference on Artificial Intelligence in Information and Communication (ICAIIC 2024); IEEE: Piscataway, NJ, USA, 2024; pp. 760–765. [Google Scholar] [CrossRef] [Scilit]
- Li, S.; Kim, K.S.; Tang, Z.; Smith, J.S. Exploiting Unlabeled RSSI Fingerprints in Multi-Building and Multi-Floor Indoor Localization through Deep Semi-Supervised Learning Based on Mean Teacher. In Proceedings of the 2024 IEEE International Conference on Consumer Electronics (ICCE); IEEE: Piscataway, NJ, USA, 2024. [Google Scholar] [CrossRef] [Scilit]
- Etiabi, Y.; Njima, W.; Amhoud, E.M. Federated Learning Based Hierarchical 3D Indoor Localization. In Proceedings of the 2023 IEEE Wireless Communications and Networking Conference (WCNC); IEEE: Piscataway, NJ, USA, 2023; pp. 1–6. [Google Scholar] [CrossRef] [Scilit]
- Caruana, R. Multitask Learning. Mach. Learn. 1997, 28, 41–75. [Google Scholar] [CrossRef] [Scilit]
- Torres-Sospedra, J.; Montoliu, R.; Martínez-Usó, A.; Avariento, J.P.; Arnau, T.J.; Benedito-Bordonau, M.; Huerta, J. UJIIndoorLoc: A New Multi-Building and Multi-Floor Database for WLAN Fingerprint-Based Indoor Localization Problems. In Proceedings of the 2014 International Conference on Indoor Positioning and Indoor Navigation (IPIN); IEEE: Piscataway, NJ, USA, 2014; pp. 261–270. [Google Scholar] [CrossRef] [Scilit]
- Malkov, Y.A.; Yashunin, D.A. Efficient and Robust Approximate Nearest Neighbor Search Using Hierarchical Navigable Small World Graphs. IEEE Trans. Pattern Anal. Mach. Intell. 2020, 42, 824–836. [Google Scholar] [CrossRef] [Scilit] [PubMed]

Disclaimer/Publisher’s Note: The statements, opinions and data contained in all publications are solely those of the individual author(s) and contributor(s) and not of MDPI and/or the editor(s). MDPI and/or the editor(s) disclaim responsibility for any injury to people or property resulting from any ideas, methods, instructions or products referred to in the content. |
© 2026 by the authors. Licensee MDPI, Basel, Switzerland. This article is an open access article distributed under the terms and conditions of the Creative Commons Attribution (CC BY) license.