


Abstract
Traditional wood identification models are vulnerable to out-of-distribution (OOD) substitution in the global timber trade. In response to this issue, this study presents a dual-stage cascade authentication architecture using in situ Raman spectroscopy and machine learning. First, a physically informed preprocessing strategy, integrating adaptive truncation (>1749 cm−1) and first-derivative filtering, is developed to extract a 1309-dimensional composite feature matrix. This step effectively decouples non-linear fluorescence and converts physical detector saturation into highly discriminative features. To mitigate data leakage, the system utilizes a cross-validated Random Forest engine for Stage-1 closed-set discriminative screening. Subsequently, it cascades a high-dimensional One-Class Support Vector Machine (OCSVM) for Stage-2 open-set non-linear boundary verification in the Reproducing Kernel Hilbert Space. This design avoids the “variance trap” of traditional linear dimensionality reduction (e.g., PCA), preserving weak but critical secondary metabolite signals. Under a controlled OOD benchmarking scenario involving three taxonomically and chemically similar substitute species, the optimized Stage-1 engine maintains a 91.67% closed-set accuracy on known species. Crucially, Stage-2 verification achieves an open-set detection AUROC of 0.9722 and limits the FPR95 to 3.33%. Feature importance mapping indicates that the model effectively incorporates macroscopicoptical surrogate features (e.g., fluorescence decay boundaries) for decision-making. Overall, this study offers a robust, controlled non-destructive approach for real-world wood authenticity verification.
1. Introduction
The continuous growth in demand within the global precious wood market is accompanied by illegal adulteration and substitution. Rare hardwoods (e.g., Pterocarpus santalinus, Dalbergia melanoxylon), due to their exceptional physio-mechanical properties and high economic value, are widely listed in the Appendices of the Convention on International Trade in Endangered Species of Wild Fauna and Flora (CITES) or national key protection lists, subjecting them to strict international trade regulations. However, driven by profit, fraudulent substitution using closely related species frequently occurs in the timber supply chain [1]. For instance, Baphia nitida is often used to counterfeit P. santalinus; similarly, African padauk is easily confused with protected species such as Pterocarpus macrocarpus and Pterocarpus erinaceus [2]. The 11 wood species selected in this study represent the primary “target precious woods” and their “common substitutes” in the current international timber trade. These species exhibit a high degree of similarity in macroscopic visual textures and microscopic anatomical features. Some substitutes are often subjected to chemical dyeing and physical pressurization to obscure visual discrepancies, further increasing the difficulty of customs enforcement and wood identification [3].
Traditional anatomical and physio-chemical identification methods [4,5], along with recent mass spectrometry techniques [6], are often limited by low throughput, the requirement for extensive laboratory expertise, or destructive sampling constraints. Consequently, vibrational spectroscopy has emerged as a promising alternative, facilitating the integration of wood science and chemometrics in recent years. Currently, near-infrared (NIR) spectroscopy and Fourier-transform infrared (FTIR) spectroscopy are relatively mature technologies applied in this field [7]. However, these techniques still present inherent physical limitations in the in situ detection of complex wood samples. NIR spectroscopy primarily reflects the overtone and combination absorption of bonded atoms within molecules; its spectral bands are typically too broad and severely overlapped, making it difficult to extract high-resolution specific chemical fingerprints targeting trace secondary metabolites [8]. On the other hand, although FTIR possesses good fingerprint features in the mid-infrared region, it is extremely sensitive to free and bound water (the -OH stretching vibration) within the wood, and the strong water absorption masks crucial characteristic peaks [9]. Furthermore, high-quality FTIR analysis generally requires destructive sample preparation operations, such as grinding and pellet pressing, failing to meet the requirements of on-site non-destructive inspections.
Raman spectroscopy is particularly well-suited for this application. As an inelastic scattering technique, it is insensitive to moisture, enabling in situ and non-destructive detection [10]. It also provides high-resolution vibrational information of molecular backbones. Such spectral features can not only characterize the conformational differences of lignin and cellulose across different tree species but also effectively detect trace secondary metabolites (e.g., santalins, specific flavonoids) that distinguish precious woods [11,12].
However, the large-scale application of Raman spectroscopy in the wood sector is frequently hindered by broadband autofluorescence backgrounds. The lignin polymers and complex secondary chromophores within wood cell walls readily generate strong fluorescence signals under conventional laser excitation, sometimes causing local physical saturation of the detector [13]. Traditional baseline correction algorithms (e.g., polynomial fitting or asymmetric least squares), when processing such non-linear baselines, are prone to fitting deviations, which may lead to the loss of weak Raman scattering characteristic information [14].
Beyond the difficulties in spectral signal parsing, existing classification models also face severe generalization limitations in practical applications. Most studies construct models based on the “closed-world assumption,” which presumes that test samples strictly belong to known categories within the training set [15]. This presents a critical, testable knowledge gap: in practical open inspection environments, the system must handle input data (, where P is the number of spectral features) containing both legitimate target species and completely unknown out-of-distribution (OOD) counterfeits. Traditional multi-class classifiers, due to their “forced-classification” decision logic, are mathematically prone to misclassifying these unseen OOD samples as known precious categories with high confidence. This generates unacceptable false-positive rates and degrades the reliability of the regulatory system [16]. Therefore, the core objective of this study is to formalize and evaluate an open-set recognition (OSR) machine learning framework that can simultaneously and accurately classify known species (output ) and robustly reject unseen OOD anomalies (output ).
Motivated by these challenges, we developed a dual-stage wood authentication architecture integrating physically informed feature engineering and a cascade network. Rather than claiming an absolute conceptual innovation, this study aims to systematically integrate established chemometric preprocessing techniques with robust machine learning algorithms to address the specific engineering bottlenecks of in situ OOD wood identification. The main contributions, evaluated under a strictly controlled preliminary investigation, are as follows:
- Spectroscopy-driven spectral preprocessing strategy: We apply a preprocessing pipeline integrating adaptive truncation (>1749 cm−1) and first-derivative filtering. This mitigates broadband fluorescence interference and converts physical detector saturation signals into usable edge features, yielding a 1309-dimensional composite spectral fingerprint.
- Dual-stage cascade open-set recognition architecture: We construct a cascade architecture that uses a cross-validated Random Forest (RF) for known-class discriminative screening, followed by a One-Class Support Vector Machine (OCSVM) for non-linear boundary verification, significantly improving the rejection of OOD samples.
- Validation of non-linear feature mapping: Comparative experiments demonstrate that direct high-dimensional feature mapping in the Reproducing Kernel Hilbert Space (RKHS) retains low-variance secondary metabolite signals better than traditional linear dimensionality reduction (e.g., PCA), leading to a lower false-positive rate.
- Data-driven feature interpretability: Reverse mapping of global feature importance identifies high-weight nodes within the 1800–2400 cm−1 Raman “silent region”. This analysis shows how the model incorporates macroscopic optical surrogate features (e.g., instrumental overexposure and fluorescence decay) into its decision-making, providing an objective interpretative basis for spectroscopic analysis in high-noise environments.
2. Materials and Methods
2.1. Sample Preparation and Spectra Acquisition
This study constructed an in situ Raman spectroscopy dataset for open-set wood identification. The samples include 11 target tree species and their common substitutes in the international timber trade (phylogenetic information is detailed in Table 1). As illustrated in Figure 1a (labeled 1–11: P. erinaceus, B. nitida, B. madagascariensis, P. zhennan, M. laurentii, Diospyros spp., P. macrocarpus, P. santalinus, P. indicus, D. melanoxylon, and P. soyauxii, respectively), these species share high visual similarity in macroscopic color and texture, making visual authenticity identification difficult. To establish reliable ground truth, the taxonomic classification of all test samples was confirmed through macroscopic and microscopic anatomical cross-validation. Before spectral acquisition, samples were physically sectioned into standardized blocks (approximately cm) and flattened to expose a clean detection surface. The testing areas for the Raman probes were confined to the heartwood regions, which contain the specific secondary metabolites.
Table 1.
Basic information and market roles of the 11 wood species analyzed in this study. (Note: The phylogenetic and market role information strictly aligns with the open-set recognition evaluation protocol).
Figure 1.
Preparation of wood samples and in situ Raman spectroscopy setup. (a) Macroscopic cross-sectional slices of the 11 visually similar wood species analyzed in this study. Numbers 1–11 correspond to the 11 wood species detailed in Table 1. (b) The experimental setup for portable, non-destructive spectral acquisition on the heartwood surface.
To simulate non-destructive inspections in practical port environments (Figure 1b), spectral acquisition was conducted using an unbranded, custom-built Original Equipment Manufacturer (OEM) portable Raman system provided by a collaborating technology enterprise (Qingdao GKHC Opto-Electronics Engineering Co., Ltd., Qingdao, China), instead of a traditional benchtop micro-Raman setup. To ensure complete experimental reproducibility, the core optical parameters were strictly calibrated. To ensure stable optical coupling on the rough wood surface, the fiber-optic probe was equipped with an opaque cylindrical spacer. During acquisition, this spacer was placed in direct physical contact with the sample. This contact-coupling mechanism ensured a strictly fixed working distance of ∼5 mm and effectively shielded the collection area from ambient light interference. The laser spot size on the sample surface was approximately 100 μm, which provided a sufficiently representative macroscopic sampling area for the wood tissue, thereby achieving reliable non-destructive measurement. A 0–5 cm vertical scale bar is also included to indicate the macroscopic dimensions of the wood blocks. To suppress the initial fluorescence induced by highly conjugated lignin, a 785 nm near-infrared solid-state diode laser was used for excitation, rather than a conventional 532 nm source [17]. The laser directly irradiated the secondary walls of wood fiber cells, with the power at the sample surface strictly limited to 10–15 mW to avoid local thermal degradation of the heat-sensitive organic metabolites [18]. The spectral acquisition range was set to 200–3200 cm−1, with a spectral resolution of approximately 1.5 cm−1. To account for intra-species biological variation, spectra were collected from independent specimens across different batches. The microscopic sampling points covered various anatomical zones, such as earlywood/latewood boundaries, different growth rings, and wood rays. For each wood category, 30 high-quality spectra were selected, yielding a dataset of .
Following the open-set recognition (OSR) evaluation protocol [19], the dataset was partitioned into known classes and out-of-distribution (OOD) unknown classes. Specifically, 8 wood species, including Pterocarpus santalinus, were designated as known categories for training and closed-set testing (totaling 240 samples, denoted as ). A multi-species OOD testing matrix was formed using 3 unknown classes—Baphia nitida, Pterocarpus macrocarpus, and Pterocarpus soyauxii—which share visual or density characteristics with the target woods but were excluded from model training (totaling 90 samples, denoted as ). For the closed-set evaluation phase, the model was cross-validated on . For the open-set evaluation phase, the test set was defined as to assess the system’s rejection capability against unseen substitute species.
2.2. Physically Informed Adaptive Spectral Truncation and Preprocessing Strategy
During in situ Raman spectral acquisition, the highly conjugated polymers and complex secondary chromophores abundant in the cell walls of precious woods frequently induce intense broadband autofluorescence under 785 nm laser excitation [20]. This non-linear background radiation interferes with the weak Raman scattering signals and frequently induces physical saturation (saturation overexposure) of the charge-coupled device (CCD) detector in the low-wavenumber region, thereby outputting uninformative flat-top signals with near-zero variance [21]. For such fluorescence curves exhibiting steep gradients, traditional baseline correction algorithms (e.g., global polynomial detrending or asymmetric least squares, AsLS) often struggle to accurately track the local rapid decay due to the mathematical constraints of global fitting [22]. Forcing a fit under these conditions frequently triggers “baseline distortion,” leading to the smoothing or loss of high-frequency chemical bond vibrational features. To address the fitting limitations of traditional baseline correction algorithms when processing local non-linear overexposed signals, this study proposes a physically informed spectral preprocessing workflow (the P1 strategy). The raw spectra are first converted into a standardized data format—a feature matrix where each row represents a sample and each column corresponds to a specific wavenumber intensity. The complete data processing pipeline of this P1 strategy is illustrated in Figure 2 and primarily consists of three progressive core steps:
Figure 2.
Flowchart of the proposed physically informed (P1) Raman spectra preprocessing strategy. The cascaded workflow consists of three core steps: (1) adaptive truncation (>1749 cm−1) to discard uninformative detector saturation dead zones; (2) 1st-derivative Savitzky–Golay filtering to decouple the non-linear broadband fluorescence background and mathematically convert the physical saturation flat-top into a topological edge; and (3) Standard Normal Variate (SNV) normalization to eliminate multiplicative scattering effects. In the flowchart, different background colors distinguish the distinct processing stages. The red cross in step (1) indicates the discarded spectral region after truncation, and the horizontal dashed lines in the subsequent steps represent the zero reference line. This pipeline ultimately transforms raw in situ spectra into a high-quality 1309-dimensional feature matrix ready for high-dimensional feature learning.
Step 1: Adaptive Truncation based on Global Overexposure Boundary Statistics. Although the 785 nm laser mitigates some fluorescence, the intense emission from heartwood chromophores still causes severe CCD detector saturation in the low-frequency spectral region. If this frequency band were directly retained, these zero-variance features would interfere with the feature extraction of subsequent machine learning classifiers. To establish the most reasonable physical truncation starting point, this study conducted global statistical analysis and optimization on the spectral overexposure exit points (i.e., the physical critical point where the variance begins to be significantly greater than zero) of 324 valid samples. The experimental statistical distribution revealed significant species and individual differences in the overexposure phenomenon, where 50% of the samples ended overexposure before index 644, 70% recovered normal response before index 739 (corresponding to a Raman shift of approximately 1749 cm−1), and 85% had their critical points delayed to index 910 (approximately 2030.5 cm−1), while a rare few extreme long-tail samples had overexposure persisting up to index 1514. Given this distribution, setting the truncation threshold is a trade-off between “eliminating overexposure dead zones” and “retaining high-frequency features.” Adopting a conservative 85% sample safety line (>2030.5 cm−1) for truncation would ensure the vast majority of samples avoid the saturation zone, but it would irreversibly eliminate a massive amount of Raman vibrational fingerprints and initial fluorescence decay information beneficial for classification. Therefore, this study ultimately adopted a more aggressive 70% sample safety line, strictly setting the feature truncation starting point at 1749 cm−1. While effectively excluding the interference from the core low-frequency physical saturation dead zone, this truncation standard preserves the valid spectral band comprising 1309-dimensional mid-to-high-frequency features for subsequent models.
Step 2: First-Derivative Savitzky–Golay (SG) Filtering. Following the adaptive truncation at 1749cm−1, the retained spectral signals still superimpose a tilted non-linear fluorescence decay background. In the frequency domain, broadband fluorescence manifests as a low-frequency, slowly varying signal, whereas Raman scattering appears as high-frequency narrow-band features. This study employed a first-order Savitzky–Golay derivative filter (smoothing window , polynomial order ) to extract frequency-domain features from the truncated signals. The introduction of this operator has two physical effects: First, by deriving constant offsets and slowly varying linear trends to zero, the first derivative shifts the macroscopic fluorescence decay background to near the zero axis without requiring a preset baseline morphology, simultaneously sharpening the local rate of change in weak Raman peaks [23]. Second, because the preceding truncation strategy allows approximately 30% of the samples to retain a small amount of saturated edges, the first-derivative filtering converts this physical phenomenon of “flat-top to rapid decay” numerically into “zero-values and sudden drop edges” within the feature space, which serve as highly discriminative macroscopic optical surrogate features. Simultaneously, the non-linear fluorescence decay slope information caused by chromophore concentration differences among various woods is completely preserved via this filter.
Step 3: Standard Normal Variate (SNV) Normalization. During in situ microscopic spectral acquisition, the microscopic surface roughness of the wood samples inevitably induces minor fluctuations in the laser depth of focus and optical path length, subsequently generating multiplicative scattering effects in spectral intensity. To mitigate the systematic errors caused by these physical observation discrepancies, the SNV algorithm was introduced at the end of the workflow [24]. This method performs independent mean-centering and standard deviation normalization on each spectrum () to unify the spectral scale distribution across all samples. Through this cascaded P1 preprocessing workflow—comprising adaptive truncation based on 70% critical point optimization, 1st-derivative SG filtering, and SNV normalization—the raw Raman spectra, affected by overexposure and fluorescence interference, are transformed into a standardized feature matrix containing 1309-dimensional representative composite features. This establishes a reliable data foundation ( matrix, where and ) for subsequent machine learning models.
2.3. Baseline Classification Models and High-Dimensional Feature Space Validation
Following the extraction of the 1309-dimensional truncated and differential-fused features, this study constructed a closed-set multi-class classification model targeting 11 known precious woods and common substitutes. This task presents a typical “Small-N-Large-P” problem (where refers to the number of input feature dimensions, and represents the limited sample size per class). Given this data structure, significant multicollinearity exists among adjacent wavenumber channels, and the feature matrix contains silent bands lacking effective molecular vibration information. To comprehensively evaluate the generalization ability and applicability of different underlying algorithms on such high-dimensional sparse features, four representative machine learning and deep learning algorithms were introduced as a benchmark library.
Regarding the selection of baseline models, this study proceeded from three dimensions: distance metric, hyperplane optimization, and deep feature extraction. First, the K-Nearest Neighbors (KNN) algorithm based on global Euclidean distance was introduced as a basic non-parametric baseline to assess the objective impact of the “curse of dimensionality” on traditional distance metrics in high-dimensional spaces [25]. Second, a Support Vector Machine (SVM) based on structural risk minimization was employed. Considering that Raman spectral features often exhibit non-linear boundaries in multidimensional space, a Radial Basis Function (RBF) kernel was embedded into the SVM model, aiming to effectively separate heterogeneous classes by implicitly mapping the original features into a high-dimensional space [26]. Furthermore, a customized one-dimensional convolutional neural network (1D-CNN) was constructed to evaluate the non-linear deep feature extraction architecture based on backpropagation. Although deploying a data-hungry deep learning model on a dataset with limited samples inherently places the network at a disadvantage, we intentionally retained the 1D-CNN as a baseline to empirically demonstrate its susceptibility to overfitting high-dimensional instrumental noise in “Small-N-Large-P” scenarios. To mitigate severe overfitting during neural network training, an early stopping mechanism was implemented to control retraining [27].
After comprehensive comparison, the Random Forest (RF) algorithm, based on decision tree ensemble theory, was selected as the core engine for the closed-set classification task. Mechanistically, the RF model is well-suited to the feature structure of high-dimensional tabular data like Raman spectra [28]. The RF is constructed in parallel by multiple independent base learners, performing random sampling of the feature subspace during node splitting (by configuring the maximum number of features to ). This configuration acts as an inherent regularization technique to mitigate the risk of overfitting associated with the dimensionality problem. This ensemble mechanism, based on Gini impurity, endows the model with a certain capacity for “implicit feature selection.” When processing the 1309-dimensional composite input, the RF can adaptively reduce the weights of redundant baseline noise and uninformative regions, effectively extracting weak, high-frequency Raman features with strong species specificity. This underlying logic against multicollinearity effectively matches the micro-chemical vibrational features extracted by the P1 preprocessing workflow, ensuring that the model maintains the integrity of the high-dimensional feature space without requiring explicit dimensionality reduction.
To ensure statistical robustness and avoid the risk of target data leakage during feature standardization, all baseline models were encapsulated within a Scikit-learn Pipeline structure under a systematic 5-fold cross-validation (CV) framework. This protocol guaranteed that the StandardScaler was fitted exclusively on the training folds and subsequently applied to the validation folds in each iteration. Through exhaustive grid search, the average performance of each model on the validation set was used to dynamically guide the iterative update of parameters. The implementation environments, the global hyperparameter search spaces, and the anchoredoptimal core configurations (including the learning rate search space for the Adam optimizer used in the 1D-CNN) are detailed in Table 2. All algorithm evaluations were conducted on a workstation (Legion R9000P 2021, Lenovo Group Ltd., Beijing, China) equipped with an AMD Ryzen 7 5800H Mobile Processor (Advanced Micro Devices, Inc., Santa Clara, CA, USA) and 16 GB (8 GB × 2) DDR4-3200 SODIMM RAM running Python 3.9 (Python Software Foundation, Wilmington, DE, USA). The optimized machine learning models offer near-instantaneous inference times (on the order of milliseconds per sample), demonstrating high feasibility for future deployment on portable devices in real-world customs inspections.
Table 2.
Hyperparameter search space and optimized configurations of the baseline classification models in the 5-fold cross-validation framework.
2.4. Dual-Stage Cascade Authentication Architecture Against Open-Set Attacks
Real-world wood inspection environments frequently face interference from out-of-distribution (OOD) similar substitute species, exhibiting the characteristics of a dynamic open system. The underlying mathematical logic of the aforementioned traditional classification baseline models tends to partition extended decision hyperplanes among known classes, lacking closed boundary constraints on the local boundaries of the feature space [29]. Driven by this inherent “Closed-World Assumption”, these algorithms are unable to form closed boundaries. Consequently, when the inspection system encounters “unseen classes” that are absent from the training database, classifiers are restricted by their “forced-classification” nature. They erroneously project and assign OOD samples to the nearest known precious wood category with extremely high mathematical confidence [30]. To effectively address this vulnerability, this study proposes a dual-stage cascade authentication architecture consisting of a “Discriminative Screening Layer” and a “One-Class Verification Layer” connected in series. By integrating physical feature extraction with non-linear boundary detection, this architecture aims to overcome the generalization limitations of traditional closed-set models in open-set recognition tasks (as shown in Figure 3).
Figure 3.
Schematic of the proposed dual-stage cascade authentication architecture. The framework consists of a high-throughput Random Forest (RF) discriminative screening layer for closed-set known species (Stage 1) and a high-dimensional One-Class SVM (OCSVM) verification layer for out-of-distribution (OOD) rejection (Stage 2). The final authentication decision is strictly governed by an “AND logic” gate, ensuring both high-confidence target prediction and rigid spatial compliance.
In the first stage of the dual-stage architecture, a multi-class identification engine based on Random Forest (RF) is deployed as a high-throughput screening frontline. Given the dimensional composite Raman spectral vector extracted via P1 preprocessing, the RF engine circumvents multicollinearity interference by constructing an ensemble space containing T independent decision trees. For the C wood categories in the known closed-set space ( known species in this study’s Stage 1 training phase), the probability distribution prediction mechanism in the first stage can be formalized as the aggregation of the outputs from the base learners:
where is the indicator function. The species identification output of the first-stage screening frontline follows the Maximum A Posteriori (MAP) principle:
This engine can effectively capture the differences in composite spectral features among different woods. However, given the inherent vulnerability of this discriminative engine to OOD counterfeits, its high-confidence predictions cannot serve as the final basis for authenticity clearance. All samples classified as protected precious woods (e.g., Pterocarpus santalinus) must proceed to the second stage to undergo a more rigorous non-linear verification.
To construct a highly exclusive authenticity discriminator (One-Class Classifier, OCC) for the top-tier protected target woods, this study evaluated the “variance trap” faced by traditional one-class modeling when processing high-frequency Raman spectra. In the traditional anomaly detection paradigm, Principal Component Analysis (PCA) is often relied upon for preliminary dimensionality reduction [31]. Its essence is to find an orthogonal projection matrix to maximize the projection variance:
where is the covariance matrix of the spectral features. In wood spectral analysis, the main polymers of the cell wall (such as cellulose and lignin) typically dominate the principal eigenvalues of due to their large Raman scattering cross-sections. Conversely, the signals of trace secondary metabolites (e.g., santalins), which help distinguish specific rare species, are mostly mapped into the long-tail feature space with extremely low variance. If linear dimensional truncation is performed directly according to Equation (3), these low-variance but highly discriminative chemical fingerprint features are easily discarded as redundant noise. This results in a looser decision boundary for the target data in the low-dimensional subspace, thereby significantly reducing the model’s rejection capability against similar substitutes (the empirical data visualization of this phenomenon will be detailed in the subsequent feature space analysis).
To fundamentally avoid the dilemma of feature loss caused by explicit dimensionality reduction, this architecture introduces a One-Class Support Vector Machine (OCSVM) in the second stage to construct a decision boundary directly in the original 1309-dimensional feature space [32]. This mechanism utilizes an implicit mapping function to project the spectral features into an infinite-dimensional Reproducing Kernel Hilbert Space (RKHS, ). The OCSVM aims to find the smallest non-linear hypersphere within this high-dimensional normed space that tightly encapsulates the target data distribution. Its primal problem can be transformed into solving the following quadratic programming equation with penalty constraints:
where is the normal vector of the hyperplane in the RKHS, is the distance from the origin to the hyperplane (i.e., the classification threshold), and are the slack variables. The hyperparameter (set to 0.05 in this study) plays a crucial dual regulatory role: it serves as both the lower bound for the fraction of support vectors and the upper bound for the training error (the fraction of rejected genuine targets). To avoid the computational complexity caused by directly calculating the high-dimensional inner product , this study introduces the Radial Basis Function (RBF) kernel:
By solving the Lagrangian dual problem, the final sign decision function , of the second-stage one-class verification network is established as:
Under this mechanism, any counterfeit sample lacking the specific micro-vibrational features of the target secondary metabolites, or exhibiting phase differences in the fluorescence decay curve, will undergo significant deviation in the RKHS space, thereby triggering and being precisely rejected by the hypersphere. At the final decision logic layer, this architecture adopts a strict cascade “AND logic” gating mechanism to jointly determine the dual-stage outputs. Assuming the protected target precious wood category is , the final security authentication conclusion of the system is strictly controlled by the following Boolean logic decision equation:
Through the aforementioned cascade decision mechanism, the system achieves the dual constraints of physical frequency-domain features and non-linear spatial boundaries. This strategy aims to advance the existing closed-set comparison paradigm to open-set authenticity verification, with the goal of effectively reducing the false-positive risks brought by OOD samples in real-world inspection scenarios.
2.5. Implicit Physico-Chemical Feature Mapping Strategy Based on Feature Importance
Although the dual-stage cascade architecture demonstrates robust performance when processing high-dimensional data, non-linear machine learning algorithms generally suffer from insufficient interpretability (the “black-box” characteristic). In wood spectral analysis, purely data-driven models lacking physico-chemical grounding are prone to overfitting instrumental noise. To enhance the spectroscopic interpretability of the model and explore the correlation between the algorithmic decision logic and the underlying material chemistry, this study introduces a global feature contribution quantification and physical mapping strategy based on Mean Decrease in Impurity (MDI) extracted from the Stage-1 RF engine.
Algorithmically, the implicit feature selection process of the RF model can be quantified through impurity changes during node splitting. This study aggregated the cumulative contribution of the 1309-dimensional features to the decrease in Gini impurity across all decision trees, thereby calculating the feature importance score for each spectral channel. Compared to local interpretation methods (e.g., LIME or SHAP) [33], MDI provides a statistical measure from a global perspective, facilitating the extraction of the major feature dimensions that drive the classification of the 11 wood taxa. To facilitate relative comparison, the raw feature importance scores were subjected to Min-Max Normalization, mapping the values to the interval.
Furthermore, to explore the spectroscopic significance of these mathematical importance scores, we adopted a feature mapping strategy. Specifically, the normalized feature weights were re-projected onto their corresponding Raman shift (cm−1) coordinate axis to construct a decision-to-spectrum correlation profile. The objective of this mapping analysis is not to forcibly assign conventional micro-chemical bond vibration interpretations to all high-frequency features [34], but rather to objectively observe the distribution patterns of highly weighted features within the global physical frequency domain. Particularly in high-noise in situ detection environments where classic Raman bands (e.g., the ∼1600 cm−1 lignin peak) may be obscured by detector saturation, this analysis helps reveal how the model implicitly utilizes macroscopic optical surrogate features—such as the fluorescence decay boundaries preserved by the P1 strategy—to establish robust decision boundaries [35].
3. Results and Discussion
3.1. Physical Decoupling of Raman Fluorescence via Differential Preprocessing and Adaptive Truncation
Extracting chemical vibration signals from in situ Raman spectra of wood, which are typically accompanied by a strong broadband autofluorescence background, is a prerequisite for high-precision species identification. This study first evaluated the impact of different baseline correction and truncation strategies on extracting weak high-frequency features through spectral preprocessing ablation experiments. In closed-set tests uniformly employing a Support Vector Machine (SVM) as the baseline evaluator, the model relying solely on Standard Normal Variate (SNV) normalization (the P0 control group, which retains the original baseline morphology) achieved an average classification accuracy of only 77.27% (). To effectively remove potential background interference, different baseline decoupling strategies were introduced. When a conventional linear detrending algorithm (the P2 control group) was applied to subtract the global baseline, the model’s closed-set accuracy significantly improved to 84.85% () [36]. Meanwhile, the physically informed workflow proposed in this study (the P1 strategy, integrating adaptive truncation with first-derivative Savitzky–Golay filtering and SNV) also achieved a recognition rate of 82.73% (). The performance leap of the P1 and P2 groups compared to the uncorrected P0 group strongly demonstrates that the pronounced non-linear baseline drift and fluorescence interference in raw spectra indeed mask the intrinsic chemical features contributed by wood secondary metabolites. Therefore, effective preprocessing decoupling is an essential step to release these weak fingerprint details.
Although the global baseline removal strategy of P2 achieved a slightly higher numerical performance under the single SVM evaluation, an analysis combining physical signal evolution mechanisms and feature space characteristics establishes the applicability and superiority of the P1 strategy as the feature extraction module for this architecture. Through morphological observation of the processed spectral curves (as shown in Figure 4a), conventional linear fitting (the P2 group) exposes certain mathematical limitations. Although P2 macroscopically flattens the baseline at both ends, its model struggles to adapt to the local non-linear decay of broadband fluorescence, resulting in distinct fitting depressions in the feature region of the spectral curve (as shown in Figure 4b) [37]. This “Baseline Distortion” alters the original morphology of the spectra, leading to the attenuation or loss of weak high-frequency local Raman peaks that determine the specificity of precious wood species. When dealing with highly similar substitute species, this loss of feature information degrades the fine-grained discriminative ability of the model.
Figure 4.
Comparison of Raman spectra preprocessing strategies. (a) The raw Raman spectrum post-adaptive truncation (>1749 cm−1), showing a broadband fluorescence background and a residual detector saturation flat-top at the lower wavenumber edge. (b) The P2 processing strategy (Linear Detrending), which causes baseline distortion and suppresses local chemical peaks when applied to the non-linear fluorescence decay. (c) The proposed P1 processing workflow (1st-derivative Savitzky–Golay filter combined with SNV), which flattens the sloping baseline, retains high-frequency vibrational features, and converts the physical saturation flat-top into a sudden drop edge. In all subfigures, the horizontal dashed lines represent the zero reference line.
In contrast, the P1 workflow proposed in this study demonstrates superior background removal and signal preservation. As shown in Figure 4c, the first-derivative filter effectively utilizes the frequency-domain differences between the low-frequency broadband (fluorescence background) and the high-frequency sharp bands (Raman scattering). It successfully eliminates the tilted baseline offset, stabilizes the baseline near the zero axis, and simultaneously highlights the local variation features of genuine Raman peaks [38]. Furthermore, addressing the detector fluorescence saturation caused by high-energy laser excitation during in situ acquisition, the P1 strategy—building upon the 1749 cm−1 adaptive truncation—converts the physical phenomenon of “Saturation flat-top” remaining in approximately 30% of the dataset into “Zero-values and sudden drop edges” with high feature separability.
This feature processing approach, which combines micro-chemical vibrations with macroscopic physical fluorescence saturation and converts them into high-frequency edge structures, effectively mitigates the critical information loss often caused by traditional noise reduction algorithms. The 1309-dimensional features extracted by the P1 strategy not only preserve the backbone vibration information of lignin and cellulose but also transforms the instrument’s physical response limits into usable classification dimensions. This physical signal-level preprocessing provides the necessary data foundation for the subsequent feature selection by the Random Forest (RF) classifier and the open-set verification by the One-Class Support Vector Machine (OCSVM).
3.2. Closed-Set Multi-Class Classification Performance and Feature Robustness of Random Forest
After establishing the effectiveness of the P1 preprocessing and the 1309-dimensional adaptive truncation strategy, this study inputs the extracted high-dimensional fused feature matrix into various machine learning models. The objective was to evaluate their generalization capabilities in the multi-class classification task involving 11 wood species with high visual and anatomical similarity. To prevent data leakage, all models were encapsulated within a Scikit-learn Pipeline and evaluated under a rigorous five-fold cross-validation (5-fold CV) framework. As shown in Table 3, the evaluation results reflect the performance variations among the algorithms when processing high-dimensional Raman spectral data. The K-Nearest Neighbors (KNN) algorithm, based on the global Euclidean distance metric, yielded an average CV accuracy of 69.70% (). This result highlights the complexity of Raman spectral data: the data dimension is high (), significant multicollinearity exists among adjacent wavenumber channels, and the data contains silent bands lacking prominent chemical vibration information. Under this data structure, the KNN algorithm is constrained by the “curse of dimensionality”: in high-dimensional space, the distance measures between samples of different classes tend to homogenize, thereby reducing the classification efficacy of the algorithm [39].
Table 3.
Quantitative performance comparison of the baseline classification models on the 11-class full dataset. The metrics include 5-fold cross-validation average accuracy, standard deviation, 95% Confidence Intervals (CIs), and inference time. The optimized Random Forest (RF) engine demonstrates the best overall performance, robustness, and high inference efficiency in handling the high-dimensional sparse Raman feature matrix.
Regarding the deep learning baseline, we fully agree that deploying a one-dimensional convolutional neural network (1D-CNN) on a dataset with only 30 samples per class inherently disadvantages the model. We intentionally retained the 1D-CNN not as a competitive benchmarking framework, but rather as a negative control to empirically demonstrate the structural limitations of data-hungry deep learning models in “Small-N-Large-P” scenarios. Although the 1D-CNN possesses non-linear extraction capabilities, under the condition of only 30 independent samples per class, the deep network is highly prone to overfitting the high-dimensional instrumental noise rather than learning true chemical signatures, resulting in significant accuracy fluctuations () [40]. On the other hand, the Support Vector Machine (SVM) incorporating a Radial Basis Function (RBF) kernel struggled severely with the broadband collinear interference, yielding an accuracy of only 60.61%. The global hyperplane optimization mechanism of SVM faces mathematical constraints in selecting effective support vectors when dealing with such high-dimensional sparse features [41].
In contrast, the Random Forest (RF) based on tree model ensembles exhibited superior noise resistance and algorithmic robustness for complex spectral tabular data. Even with default parameters, the RF achieved an accuracy of 82.42%. After grid search optimization (incorporating max_features = ‘sqrt’ and class balancing), the RF was established as the most suitable classification engine, reaching an optimized accuracy of 83.94% () [42]. The strong performance of the RF model is attributed to its algorithmic mechanism. When constructing a forest of decision trees, RF randomly samples feature subsets during node splitting. This ensemble learning mechanism endows the model with a certain “implicit feature selection” capability. Confronting the 1309-dimensional spectral input, RF adaptively reduces the weights of uninformative silent bands and broadband noise, effectively extracting highly species-specific chemical feature dimensions.
However, this baseline evaluation also elegantly highlights the core scientific motivation of this study: even after rigorous hyperparameter tuning, the optimized RF model reached a performance ceiling of approximately 84% on the 11-class task. Analysis of the experimental data and the confusion matrix (Figure 5a) reveals that this bottleneck is primarily caused by severe misclassifications between the target precious woods and their highly convergent OOD substitutes. This empirical finding strictly proves that traditional forced closed-set multi-classification cannot thoroughly resolve the confusion caused by highly similar counterfeits. Consequently, this necessitates the introduction of the subsequent dual-stage open-set architecture to reject unknown anomalies.
Figure 5.
Performance visualization of the baseline multi-class classification. (a) The confusion matrix of the Random Forest (RF) model, demonstrating its classification performance and the inherent misclassification bottlenecks across 11 visually and anatomically convergent wood species. (b) Global accuracy comparison among baseline models, confirming the superiority of the RF engine in handling high-dimensional Raman spectral features.
3.3. Cascade Defense Evaluation Against Open-Set Attacks and Sensitivity Analysis
Under the standardized open-set recognition (OSR) evaluation protocol, this study quantified the defense robustness of the dual-stage verification mechanism in a real-world open environment. Diverging from the conventional closed-set validation paradigm in chemometrics that mixes all samples randomly, this study strictly constructed a “known-unknown” isolated testing environment. In the first-stage closed-set multi-class validation, the Random Forest (RF) classifier achieved a 91.67% closed-set accuracy on a test set comprising eight known wood species, leveraging its implicit feature selection mechanism to suppress multicollinear noise. However, the actual timber trade regulatory network is a highly unpredictable dynamic system. When the inspection system encountered an injection test comprising 90 out-of-distribution (OOD) samples from multiple species—namely Baphia nitida, Pterocarpus macrocarpus, and Pterocarpus soyauxii—the generalization limitations of a single discriminative model became evident. These multi-source substitute species exhibit high similarity with target classes like Pterocarpus santalinus in macroscopic color, air-dry density, and cellular anatomical structure. Faced with these unseen substitute species, the RF engine, acting as the system’s first line of defense, suffered from “forced-classification” misjudgments [43]. System records showed that among these 90 multi-species OOD samples, up to 28 samples (accounting for 31.11%) crossed the decision boundary with extremely high mathematical confidence and were misclassified as the protected target class, “Pterocarpus santalinus”. This phenomenon objectively reveals the inherent limitation of traditional classifiers based on the “closed-world assumption”: lacking strict boundary constraints on local data distributions, discriminative models tend to infinitely partition the entire high-dimensional feature space, causing OOD samples to be easily projected and assigned to the nearest known category. Such high-confidence algorithmic misjudgments would trigger significant false-positive leakage risks in actual customs inspections.
To mitigate the limitations of the aforementioned single-stage classifiers, this study introduced a dual-stage cascade architecture, aiming to construct a progressive security authentication mechanism through the joint determination of physical feature extraction and non-linear spatial boundaries. Upon outputting a high-confidence prediction in the first stage, the system does not directly trigger a clearance command; all samples preliminarily classified as high-value target classes (e.g., P. santalinus) must be fed into the second-stage one-class discriminator for non-linear verification. To objectively quantify the efficacy of the verification stage, this study employed core OSR metrics: the Area Under the Receiver Operating Characteristic curve (AUROC) and the False Positive Rate at 95% True Positive Rate (FPR95). FPR95 provides a highly practical engineering perspective: it measures the proportion of similar substitutes the system would erroneously clear, assuming 95% of genuine precious woods pass smoothly.
Based on the aforementioned evaluation protocol, the experimental results and 2D non-linear visualizations via t-Distributed Stochastic Neighbor Embedding (t-SNE) empirically reveal the negative impact of explicit linear dimensionality reduction in Raman spectral data analysis. In the baseline comparative tests, we selected Principal Component Analysis (PCA, optimized to retain 95% cumulative reconstructed variance) as the representative baseline for traditional linear chemometric dimensionality reduction. While more advanced non-linear reduction techniques exist (e.g., UMAP, autoencoders), explicitly introducing them as a precursor to OCSVM is functionally redundant. This is because the OCSVM equipped with an RBF kernel already implicitly maps the data into an infinite-dimensional non-linear space. Therefore, PCA was retained solely to demonstrate the pitfalls of linear truncation. As expected, when this traditional PCA + OCSVM pipeline was applied, the system’s ability to discriminate OOD samples degraded significantly. Quantitative evaluation (Figure 6) indicates that this linear dimensionality reduction combination yielded an AUROC of only 0.8315, with an FPR95 as high as 45.56%. Tracing back to the photophysical and phytochemical response mechanisms, the essence of this phenomenon lies in the mismatch between the underlying mathematical logic of PCA and the distribution of biomass features. In pursuit of maximizing global variance reconstruction, PCA inevitably prioritizes extracting the high-concentration macromolecular backbones shared by all woods (e.g., primary peaks of cellulose and lignin). However, the trace secondary metabolite signals that truly determine the specificity of precious tree species exhibit a long-tail distribution with extremely low variance within the global high-dimensional matrix. Forcibly imposing linear dimensional truncation causes these critical chemical fingerprints to be physically stripped away [44], rendering the decision boundary of the target class in the low-dimensional subspace overly loose (as evidenced by the overlap in Figure 7b).
Figure 6.
Boundary separation performance comparison between explicit linear dimension reduction and implicit high-dimensional mapping. The conventional PCA approach suffers from linear dimensionality reduction limitations, resulting in an AUROC of only 0.8315 and an FPR95 as high as 45.56%. In contrast, the OCSVM directly operating in the 1309-dimensional RKHS manifold captures weak secondary metabolite signals, dramatically boosting the AUROC to 0.9722 and effectively reducing the FPR95 to 3.33%.
Figure 7.
2D visualizations via t-SNE of the high-dimensional Raman feature space under different processing and dimensionality reduction methods. (a) Mapping of raw spectra, showing class overlap affected by the broadband fluorescence background. (b) Linear PCA of P1 features, illustrating the overlapping distributions between the target P. santalinus (red) and the multi-species out-of-distribution (OOD) samples (blue, orange, and purple). (c) Non-linear manifold mapping of P1 features, displaying the clustering of known species and the spatial separation of the multi-species OOD samples.
While the non-linear manifold visualizations (Figure 7c) qualitatively demonstrate robust class separation, further statistical validation is required to ensure the model is not merely memorizing instrumental noise. To address concerns regarding the risk of the high-dimensional OCSVM overfitting the specific instrumental noise rather than learning a robust biological manifold (the dimensionality problem), a comprehensive hyperparameter sensitivity analysis was conducted. We evaluated the system’s AUROC and FPR95 across a wide grid of the outlier fraction () and the RBF kernel coefficient (). As detailed in Table 4, across all hyperparameter combinations, the OCSVM maintained highly stable and exceptional performance (AUROC ranging from 0.9583 to 0.9750, and FPR95 strictly bounded between 3.33% and 6.67%). This robust sensitivity matrix empirically demonstrates that the algorithm is genuinely capturing the underlying physico-chemical boundaries of the wood species, rather than spuriously fitting to high-dimensional sparsity or batch-specific noise [45].
Table 4.
Hyperparameter sensitivity analysis of the Stage 2 high-dimensional OCSVM on the open-set verification task. The highly stable AUROC and FPR95 metrics across diverse combinations of the outlier fraction () and kernel coefficient () confirm the model’s resistance to high-dimensional overfitting.
As illustrated by the quantitative metrics in Figure 6 and the defense data flow in Figure 8, under this high-dimensional verification architecture, the system’s comprehensive capability to withstand open-set attacks was decisively enhanced (achieving an AUROC of 0.9722). Specifically, confronting the 28 leaked samples generated by the “forced-classification” of the first-stage discriminative engine (a leakage rate of 31.11%), the second-stage OCSVM successfully executed a precise secondary interception. It effectively captured and rejected 25 of these multi-source OOD samples, drastically compressing the final false positives to a mere three samples, thereby substantially reducing the system’s global FPR95 to 3.33%. These quantitative results demonstrate that the non-linear boundary constructed in high-dimensional space (visualized via t-SNE in Figure 7c) can effectively identify the spatial distribution differences and fluorescence variations in the OOD samples. This cascade gating mechanism successfully extends the paradigm of wood spectral identification from “closed-set classification” to “open-set authenticity verification”.
Figure 8.
Quantitative flow analysis of the dual-stage cascade defense architecture under a multi-species open-set attack. The stacked bars illustrate the progressive interception of 90 unseen OOD samples (B. nitida, P. macrocarpus, and P. soyauxii). In Stage 1, the Random Forest classifier exhibited closed-world limitations by misclassifying 28 samples as the target species (a 31.11% leakage rate). In Stage 2, the high-dimensional OCSVM successfully identified and intercepted 25 of these misclassified samples, effectively compressing the final false positives to merely 3 samples, corresponding to a system-level AUROC of 0.9722 and an FPR95 of 3.33%.
Finally, to intuitively validate the independent contributions and synergistic effects of each core component within the proposed architecture, this study conducted an ablation study. By isolating and replacing key modules across three dimensions—feature preprocessing, selection of the closed-set classification engine, and open-set dimensionality reduction strategy—this experiment comprehensively compared the performance of derivative models in terms of closed-set accuracy and open-set false positive rate (FPR95). The quantitative results are detailed in Table 5.
Table 5.
System-level ablation study demonstrating the contribution of each proposed component. The symbol “✓” indicates the adoption of the proposed module, while “×” denotes the use of a conventional baseline alternative.
3.4. Implicit Physico-Chemical Feature Mapping and Model Interpretability
To address the “black-box” nature of the machine learning model and explore its connection to underlying material chemistry, this study explored the underlying data-driven logic of the model’s decisions through a global feature importance (Mean Decrease in Impurity, MDI) reverse mapping mechanism. Traditional Raman spectroscopic analysis typically focuses on the extraction of chemical bond vibrational features (e.g., the prominent lignin peak at ∼1600 cm−1) within the “fingerprint region.” However, by analyzing the weight distribution of the core decision nodes (as shown in Figure 9), the results objectively reveal that the high-weight features utilized by the model for class separation are not entirely confined to the conventional low-frequency chemical fingerprint region. Instead, some decision nodes are highly concentrated in the 1800–2400 cm−1 band, which is traditionally regarded as the Raman “silent region.”
Figure 9.
Global feature importance mapping demonstrating the implicit physico-chemical interpretability of the decision mechanism. By reverse-mapping the normalized Mean Decrease in Impurity (MDI) scores onto the Raman shift physical axis, it is revealed that the model’s highest-weight decision nodes are unexpectedly concentrated in the conventional “silent region” (1800–2400 cm−1). These dominant peaks precisely anchor the “fluorescence decay edges” and “saturation exit points” (e.g., 1877.1 cm−1, 1960.6 cm−1), proving that the algorithm achieves an implicit multi-source feature fusion of micro-chemical vibrations and macro-physical fluorescence variations.
While classic wood identification relies heavily on micro-chemical vibrational bands such as the aforementioned lignin peak, these low-wavenumber regions frequently suffer from severe detector saturation due to the intense fluorescence emitted by secondary metabolites under 785 nm excitation. Consequently, these classic peaks are inherently masked in authentic in situ environments. Integrating the analysis of the instrument’s physical response characteristics during in situ detection, these nodes with extremely high decision weights (e.g., 1877.1 cm−1, 1960.6 cm−1) physically correspond to the non-linear decay edges (fluorescence decay edges) where the broadband fluorescence emission exits the physical saturation of the detector. This feature distribution phenomenon reflects a practical engineering constraint in in situ wood detection: the abundant secondary chromophores in precious hardwoods induce intense fluorescence, causing the traditional 400–1800 cm−1 core microscopic Raman fingerprint region to be easily and partially masked by the detector’s saturation dead zone (flat-top) [46].
The feature reverse mapping results demonstrate that the RF engine employed in this study, when confronted with the truncated high-frequency data, effectively transforms this unavoidable “physical phenomenon of instrument overexposure and fluorescence response” into highly discriminative “macroscopic morphological surrogate features.” The high-confidence decision-making of the algorithm does not solely rely on ideal Raman scattering signals, which are challenging to extract on-site, but rather achieves a data-driven fusion of “microscopic Raman vibrational residuals” and “macroscopic optical response decay patterns.” By utilizing the interactive morphology between specific woods and the optical response limits of the instrument as a supplementary decision dimension, this architecture provides a secure and pragmatic feature engineering solution for in situ wood species identification, effectively bridging the gap between theoretical spectroscopic analysis and real-world inspection requirements.
4. Conclusions
To address the open-set recognition (OSR) challenges in real-world precious wood trade scenarios, this study proposes a dual-stage cascade authentication pipeline combining physically informed preprocessing and machine learning applied to Raman spectroscopy. To overcome the engineering bottlenecks of detector physical saturation and broadband fluorescence interference during in situ detection, a cascade preprocessing strategy was adopted, combining adaptive truncation (>1749 cm−1) based on critical point statistics with first-derivative Savitzky–Golay filtering. This strategy effectively suppresses background interference and transforms the physical limits of instrument saturation into highly discriminative features, successfully extracting a 1309-dimensional high-quality composite spectral feature matrix.
When evaluated against combined multi-species (e.g., Baphia nitida, Pterocarpus macrocarpus, and Pterocarpus soyauxii) out-of-distribution (OOD) attacks, this architecture effectively compensates for the generalization vulnerabilities of traditional discriminative models bounded by the “closed-world assumption” (successfully intercepting 25 out of the 28 misclassified leaked samples from the first stage). Furthermore, it completely circumvents the “variance trap” and the loss of low-variance chemical features caused by conventional linear dimensionality reduction methods (such as PCA, which exhibited an FPR95 as high as 45.56%). By introducing a high-dimensional One-Class Support Vector Machine (OCSVM) in the second stage to construct non-linear target boundaries directly in the Reproducing Kernel Hilbert Space (RKHS), the system demonstrates superior open-set rejection capabilities. Quantitative evaluations indicate that this cascade mechanism not only maintains an average cross-validation accuracy of 91.67% in known closed-set classification but also boosts the Area Under the Receiver Operating Characteristic curve (AUROC) to 0.9722 during rigorous multi-species open-set verification, drastically reducing the False Positive Rate at 95% True Positive Rate (FPR95) to 3.33%.
Additionally, through global feature importance mapping analysis, this study confirms that the highly weighted nodes within the 1800–2400 cm−1 Raman “silent region” are not random noise; rather, they precisely anchor the macroscopic optical edges of the instrument’s saturation boundaries and the non-linear fluorescence decay. This reveals that, when faced with the limitations of high-noise in situ detection, the algorithm implicitly achieves a data-driven fusion of “microscopic chemical vibrational residuals” and “macroscopic physical fluorescence features.” This finding avoids the excessive micro-chemical interpretation of high-frequency Raman features and provides a highly secure and pragmatic engineering basis for the spectroscopic decisions of non-linear classifiers. In practice, this architecture can be deployed on portable Raman spectrometers equipped with edge-computing devices. Compared to traditional FTIR methodologies that inherently require complex and destructive sample preparation (e.g., grinding and pellet pressing), our system offers a significant practical advantage. Once the raw spectral data is acquired in situ by customs officers, the optimized models running on standard computational platforms can execute the complete dual-stage verification within milliseconds. It instantly outputs a “Clearance” or “OOD Alert” entirely without requiring destructive sampling.
Despite these promising results, we acknowledge that the current study represents a controlled preliminary investigation. First, the dataset is relatively limited ( per class), and the performance metrics have not yet been subjected to independent cross-laboratory or cross-instrument external validation. Due to the variations in CCD quantum efficiencies and optical geometries among different commercial Raman spectrometers, achieving global generalizability will require future development of dedicated spectral calibration transfer algorithms, which remains the primary focus of our next-stage deployment research. Second, the current OOD scenario—constructed using three taxonomically and chemically similar substitute species—serves as a controlled approximation of reality. Real-world open-set environments exhibit a much broader spectrum of unknowns, including chemically dyed counterfeits, moisture-degraded wood, and samples with environmental contamination (e.g., ultraviolet oxidative degradation and fungal infections) [47,48]. Future research will focus on expanding the dataset to include these complex degradation factors and near-distribution variations (e.g., identical species from different geographic origins) to further enhance the system’s robustness for global timber regulation. Furthermore, the modular nature of this dual-stage architecture ensures high scalability; if new target species are integrated into the database, only the Stage-1 RF engine requires rapid retraining, while the Stage-2 verification framework can be efficiently updated with minimal computational cost.
Author Contributions
Conceptualization, J.B., H.S. and L.Z.; methodology, J.B. and H.S.; software, J.B. and H.S.; validation, J.B., H.S. and L.Z.; formal analysis, J.B. and H.S.; investigation, J.B. and H.S.; resources, L.Z.; data curation, J.B. and H.S.; writing—original draft preparation, J.B. and H.S.; writing—review and editing, L.Z.; visualization, J.B. and H.S.; supervision, L.Z.; funding acquisition, L.Z. All authors have read and agreed to the published version of the manuscript.
Funding
This research was funded by the National Natural Science Foundation of China, grant number 62265001.
Institutional Review Board Statement
Not applicable.
Informed Consent Statement
Not applicable.
Data Availability Statement
The in situ Raman spectroscopy dataset of the 11 wood species and the high-dimensional composite feature matrices generated during this study are available upon reasonable request from the corresponding author.
Conflicts of Interest
The authors declare no conflicts of interest.
Abbreviations
The following abbreviations are used in this manuscript:
| 1D-CNN | One-Dimensional Convolutional Neural Network |
| AsLS | Asymmetric Least Squares |
| AUROC | Area Under the Receiver Operating Characteristic curve |
| CCD | Charge-Coupled Device |
| CITES | Convention on International Trade in Endangered Species of Wild Fauna and Flora |
| CV | Cross-Validation |
| FPR95 | False Positive Rate at 95% True Positive Rate |
| FTIR | Fourier-Transform Infrared |
| KNN | K-Nearest Neighbors |
| MAP | Maximum A Posteriori |
| MDI | Mean Decrease in Impurity |
| NIR | Near-Infrared |
| OCC | One-Class Classifier |
| OCSVM | One-Class Support Vector Machine |
| OOD | Out-of-Distribution |
| OSR | Open-Set Recognition |
| PCA | Principal Component Analysis |
| RBF | Radial Basis Function |
| RF | Random Forest |
| RKHS | Reproducing Kernel Hilbert Space |
| SG | Savitzky–Golay |
| SNV | Standard Normal Variate |
| SVM | Support Vector Machine |
References
- Prajapati, S.; Sapkota, M.; Mishra, A.; Singh, S.; Sharma, T.; Panicker, L.; Lakshmi, S.M. An overview of forensic analysis methods of Pterocarpus Santalinus Lf. and their suitability to combat biodiversity crime, adulteration and environmental exploitation: A review. Discov. Plants 2025, 2, 4. [Google Scholar] [CrossRef] [Scilit]
- Elkins, K.M.; Marlette, K. Spectroscopic analysis of counterfeit wood products and application of forensic botany to solve criminal cases. In Advances in Forensic Biology and Genetics; Springer Nature: Singapore, 2025; pp. 459–466. [Google Scholar]
- Ruffinatto, F.; Negro, F.; Crivellaro, A. The macroscopic structure of wood. Forests 2023, 14, 644. [Google Scholar] [CrossRef] [Scilit]
- Lamichhane, D.D. Identification of Five Wood Species of the Meliaceae Family on the Basis of Their Wood Anatomical and Chemical Characteristics; Bibliothèque de l’Université Laval: Quebec, QC, Canada, 2022. [Google Scholar]
- Schmitz, N.; Beeckman, H.; Blanc-Jolivet, C.; Boeschoten, L.; Braga, J.W.; Cabezas, J.A.; Chaix, G.; Crameri, S.; Degen, B.; Deklerck, V.; et al. Overview of Current Practices in Data Analysis for Wood Identification—A Guide for the Different Timber Tracking Methods; European Forest Institute: Joensuu, Finland, 2020. [Google Scholar]
- Isak, I.; Newson, H.L.; Singh, T. Wood species differentiation: A comparative study of direct analysis in real-time and chromatography mass spectrometry. Forests 2025, 16, 255. [Google Scholar] [CrossRef] [Scilit]
- Tsuchikawa, S.; Inagaki, T.; Ma, T. Application of near-infrared spectroscopy to forest and wood products. Curr. For. Rep. 2023, 9, 401–412. [Google Scholar] [CrossRef] [Scilit]
- Deepa, M.S.; Shukla, S.R.; Kelkar, B.U. Overview of applications of near infrared (NIR) spectroscopy in wood science: Recent advances and future prospects. J. Indian Acad. Wood Sci. 2024, 21, 34–57. [Google Scholar] [CrossRef] [Scilit]
- Melendreras, C.; Montero, J.; Costa-Fernández, J.M.; Soldado, A.; Ferrero, F.; Linera, F.F.; Valledor, M.; Campo, J.C. Trends in Vibrational Spectroscopy: NIRS and Raman Techniques for Health and Food Safety Control. Sensors 2026, 26, 989. [Google Scholar] [CrossRef] [Scilit]
- Fakayode, S.O.; Brady, P.N.; Grant, C.; Fernand Narcisse, V.; Rosado Flores, P.; Lisse, C.H.; Bwambok, D.K. Electrochemical sensors, biosensors, and optical sensors for the detection of opioids and their analogs: Pharmaceutical, clinical, and forensic applications. Chemosensors 2024, 12, 58. [Google Scholar] [CrossRef] [Scilit]
- Füchtner, S.; Thygesen, L.G. Subcellular level impact of extractives on brown rot decay of Norway spruce elucidated by confocal Raman microscopy and multivariate data analysis. Wood Sci. Technol. 2023, 57, 827–859. [Google Scholar] [CrossRef] [Scilit]
- Sasani, N.; Bock, P.; Felhofer, M.; Gierlinger, N. Raman imaging reveals in-situ microchemistry of cuticle and epidermis of spruce needles. Plant Methods 2021, 17, 17. [Google Scholar] [CrossRef] [Scilit]
- Zhang, M.; Feng, Y.; Li, L.; Zhang, X.; Xu, F. Reducing fluorescence interference for improved Raman spectroscopic analysis of plant cell walls. Wood Sci. Technol. 2024, 58, 1697–1710. [Google Scholar] [CrossRef] [Scilit]
- Maceda, A.; Terrazas, T. Fluorescence microscopy methods for the analysis and characterization of lignin. Polymers 2022, 14, 961. [Google Scholar] [CrossRef] [Scilit]
- Vaze, S.; Han, K.; Vedaldi, A.; Zisserman, A. Open-set recognition: A good closed-set classifier is all you need. In Proceedings of the 10th International Conference on Learning Representations (ICLR), Virtual, 25–29 April 2022. [Google Scholar]
- Yang, J.; Zhou, K.; Li, Y.; Liu, Z. Generalized out-of-distribution detection: A survey. Int. J. Comput. Vis. 2024, 132, 5635–5662. [Google Scholar] [CrossRef] [Scilit]
- Holub, D.; Pořízka, P.; Kizovský, M.; Prochazka, D.; Samek, O.; Kaiser, J. The potential of combining laser-induced breakdown spectroscopy and Raman spectroscopy data for the analysis of wood samples. Spectrochim. Acta Part B At. Spectrosc. 2022, 195, 106487. [Google Scholar] [CrossRef] [Scilit]
- Zhang, Z.; Wang, Z.; Avramidis, S.; Wu, S.; Yu, K.; Li, Y. Systematic Review of Applications of Near-Infrared Spectroscopy in Forest Engineering and Wood Industry: Progress and Perspectives. Crit. Rev. Anal. Chem. 2026, 56, 1–44. [Google Scholar] [CrossRef] [Scilit]
- Geng, C.; Huang, S.J.; Chen, S. Recent advances in open set recognition: A survey. IEEE Trans. Pattern Anal. Mach. Intell. 2020, 43, 3614–3631. [Google Scholar] [CrossRef] [Scilit]
- Klement, W.N.; Leproux, P.; Browne, W.R.; Kano, H. CMOS and CCD Detection in Raman Spectroscopy: A Comparison Using Spontaneous and Multiplex Coherent Anti-Stokes Raman Scattering (CARS). J. Raman Spectrosc. 2025, 56, 933–938. [Google Scholar] [CrossRef] [Scilit]
- Sowoidnich, K.; Towrie, M.; Matousek, P. Shifted excitation Raman difference spectroscopy combined with wide area illumination and sample rotation for wood species classification. Appl. Spectrosc. 2023, 77, 666–681. [Google Scholar] [CrossRef] [Scilit]
- Guo, Y.; Jin, W.; Wang, W.; He, Y.; Qiu, S. Baseline correction for Raman spectra using a spectral estimation-based asymmetrically reweighted penalized least squares method. Appl. Opt. 2023, 62, 4766–4776. [Google Scholar] [CrossRef] [Scilit]
- Kałka, A.J.; Turek, A.M. Searching for alternatives to the Savitzky–Golay filter in the spectral processing domain. Appl. Spectrosc. 2023, 77, 426–432. [Google Scholar] [CrossRef] [Scilit]
- Mishra, P.; Nordon, A.; Roger, J.M. Improved prediction of tablet properties with near-infrared spectroscopy by a fusion of scatter correction techniques. J. Pharm. Biomed. Anal. 2021, 192, 113684. [Google Scholar] [CrossRef] [Scilit]
- Razaque, A.; Ben Haj Frej, M.; Almi’ani, M.; Alotaibi, M.; Alotaibi, B. Improved support vector machine enabled radial basis function and linear variants for remote sensing image classification. Sensors 2021, 21, 4431. [Google Scholar] [CrossRef] [Scilit] [PubMed]
- Du, K.L.; Jiang, B.; Lu, J.; Hua, J.; Swamy, M.N.S. Exploring kernel machines and support vector machines: Principles, techniques, and future directions. Mathematics 2024, 12, 3935. [Google Scholar] [CrossRef] [Scilit]
- Gütter, J.; Kruspe, A.; Zhu, X.X.; Niebling, J. Impact of training set size on the ability of deep neural networks to deal with omission noise. Front. Remote Sens. 2022, 3, 932431. [Google Scholar] [CrossRef] [Scilit]
- Quaye, G.E. Random Forest for High-Dimensional Data. Doctoral Dissertation, The University of Texas at El Paso, El Paso, TX, USA, 2024. [Google Scholar]
- Berger, C.; Paschali, M.; Glocker, B.; Kamnitsas, K. Confidence-Based out-of-Distribution Detection: A Comparative Study and Analysis. In Proceedings of the International Workshop on Uncertainty for Safe Utilization of Machine Learning in Medical Imaging (UNSURE 2021), Strasbourg, France, 27 September 2021; Springer: Cham, Switzerland, 2021; pp. 122–132. [Google Scholar]
- Antequera-Sánchez, I.; Suárez-Díaz, J.L.; Montes, R.; Herrera, F. SeNeDiF-OOD: Semantic Nested Dichotomy Fusion for Out-of-Distribution Detection Methodology in Open-World Classification. A Case Study on Monument Style Classification. arXiv 2026, arXiv:2601.18739. [Google Scholar]
- Haider, Z.A.; Khan, F.M.; Zafar, A.; Khan, I.U. Optimizing machine learning classifiers for credit card fraud detection on highly imbalanced datasets using PCA and SMOTE techniques. VAWKUM Trans. Comput. Sci. 2024, 12, 28–49. [Google Scholar] [CrossRef] [Scilit]
- Qiao, Y.; Wu, K.; Jin, P. Efficient anomaly detection for high-dimensional sensing data with one-class support vector machine. IEEE Trans. Knowl. Data Eng. 2021, 35, 404–417. [Google Scholar] [CrossRef] [Scilit]
- de Abreu Araújo, I.; Hidaka Torres, R.; Neto, N.C.S. A Review of Framework for Machine Learning Interpretability. In Proceedings of the 24th International Conference on Human-Computer Interaction (HCI International 2022), Virtual, 26 June–1 July 2022; Springer: Cham, Switzerland, 2022; pp. 261–272. [Google Scholar]
- Agarwal, U.P.; Ralph, S.A. Raman spectra of delignified plant fibers: Exploring the impact of Xylan’s presence on the spectral features of cellulose. Fibers 2023, 12, 5. [Google Scholar] [CrossRef] [Scilit]
- Li, J.; Wang, X.; Min, S.; Xia, J.; Li, J. Raman spectroscopy combined with convolutional neural network for the sub-types classification of breast cancer and critical feature visualization. Comput. Methods Programs Biomed. 2024, 255, 108361. [Google Scholar] [CrossRef] [Scilit]
- Park, S.; Kim, H. Robust baseline correction for Raman spectra by constrained Gaussian radial basis function fitting. Chemom. Intell. Lab. Syst. 2024, 253, 105205. [Google Scholar] [CrossRef] [Scilit]
- Zhao, X.Y.; Liu, G.Y.; Sui, Y.T.; Xu, M.; Tong, L. Denoising method for Raman spectra with low signal-to-noise ratio based on feature extraction. Spectrochim. Acta Part A Mol. Biomol. Spectrosc. 2021, 250, 119374. [Google Scholar] [CrossRef] [Scilit]
- Peng, D.; Gui, Z.; Wu, H. Interpreting the curse of dimensionality from distance concentration and manifold effect. arXiv 2023, arXiv:2401.00422. [Google Scholar]
- Vandaele, R.; Kang, B.; De Bie, T.; Saeys, Y. The Curse Revisited: When are Distances Informative for the Ground Truth in Noisy High-Dimensional Data? In Proceedings of the 25th International Conference on Artificial Intelligence and Statistics (AISTATS 2022), Valencia, Spain, 28–30 March 2022; PMLR: Cambridge, MA, USA, 2022; Volume 151, pp. 2158–2172. [Google Scholar]
- Mozaffari, M.H.; Tay, L.L. Overfitting One-Dimensional convolutional neural networks for Raman spectra identification. Spectrochim. Acta Part A Mol. Biomol. Spectrosc. 2022, 272, 120961. [Google Scholar] [CrossRef] [Scilit]
- Ang, Y.; Yao, P.; Bao, Y.; Feng, Y.; Huang, Q.; Tung, A.K.; Huang, Z. RFOD: Random Forest-based Outlier Detection for Tabular Data. arXiv 2025, arXiv:2510.08747. [Google Scholar] [CrossRef] [Scilit]
- Cao, Y.; Li, H.; Yang, Y. Combining random forest and multicollinearity modeling for index tracking. Commun. Stat.-Simul. Comput. 2024, 53, 3868–3879. [Google Scholar] [CrossRef] [Scilit]
- Tang, K.; Hou, C.; Peng, W.; Fang, X.; Wu, Z.; Nie, Y.; Wang, W.; Tian, Z. Simplification is all you need against out-of-distribution overconfidence. In Proceedings of the Computer Vision and Pattern Recognition Conference, Nashville, TN, USA, 11–15 June 2025; pp. 5030–5040. [Google Scholar]
- Zhang, Y.; Zhang, J.; Qian, J.; Yan, Z.; Zhang, J.; Zhao, L.; Wen, L.; Li, W. Portable mass spectrometry and machine learning for detecting Angelica sinensis adulteration. J. Food Compos. Anal. 2025, 147, 108115. [Google Scholar] [CrossRef] [Scilit]
- Suresh, K.; Velmurugan, K.J.; Vidhya, R. Deep anomaly detection: A linear one-class SVM approach for high-dimensional and large-scale data. Appl. Soft Comput. 2024, 167, 112369. [Google Scholar] [CrossRef] [Scilit]
- Belt, T.; Venäläinen, M.; Altgen, M.; Harju, A.; Rautkari, L. Extractive concentrations and cellular-level distributions change radially from outer to inner heartwood in Scots pine. Tree Physiol. 2021, 41, 1034–1045. [Google Scholar] [CrossRef] [Scilit]
- Botti, S.; Di Lazzaro, P.; Flora, F.; Mezi, L.; Murra, D. Raman spectral mapping reveal molecular changes in cellulose aging induced by ultraviolet and extreme ultraviolet radiation. Cellulose 2024, 31, 749–758. [Google Scholar] [CrossRef] [Scilit]
- Gupta, B.S.; Jelle, B.P.; Gao, T. In vitro cell composition identification of wood decay fungi by Fourier transform infrared spectroscopy. R. Soc. Open Sci. 2022, 9, 201935. [Google Scholar] [CrossRef] [Scilit]
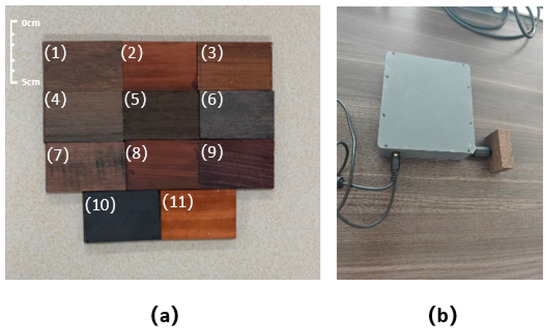
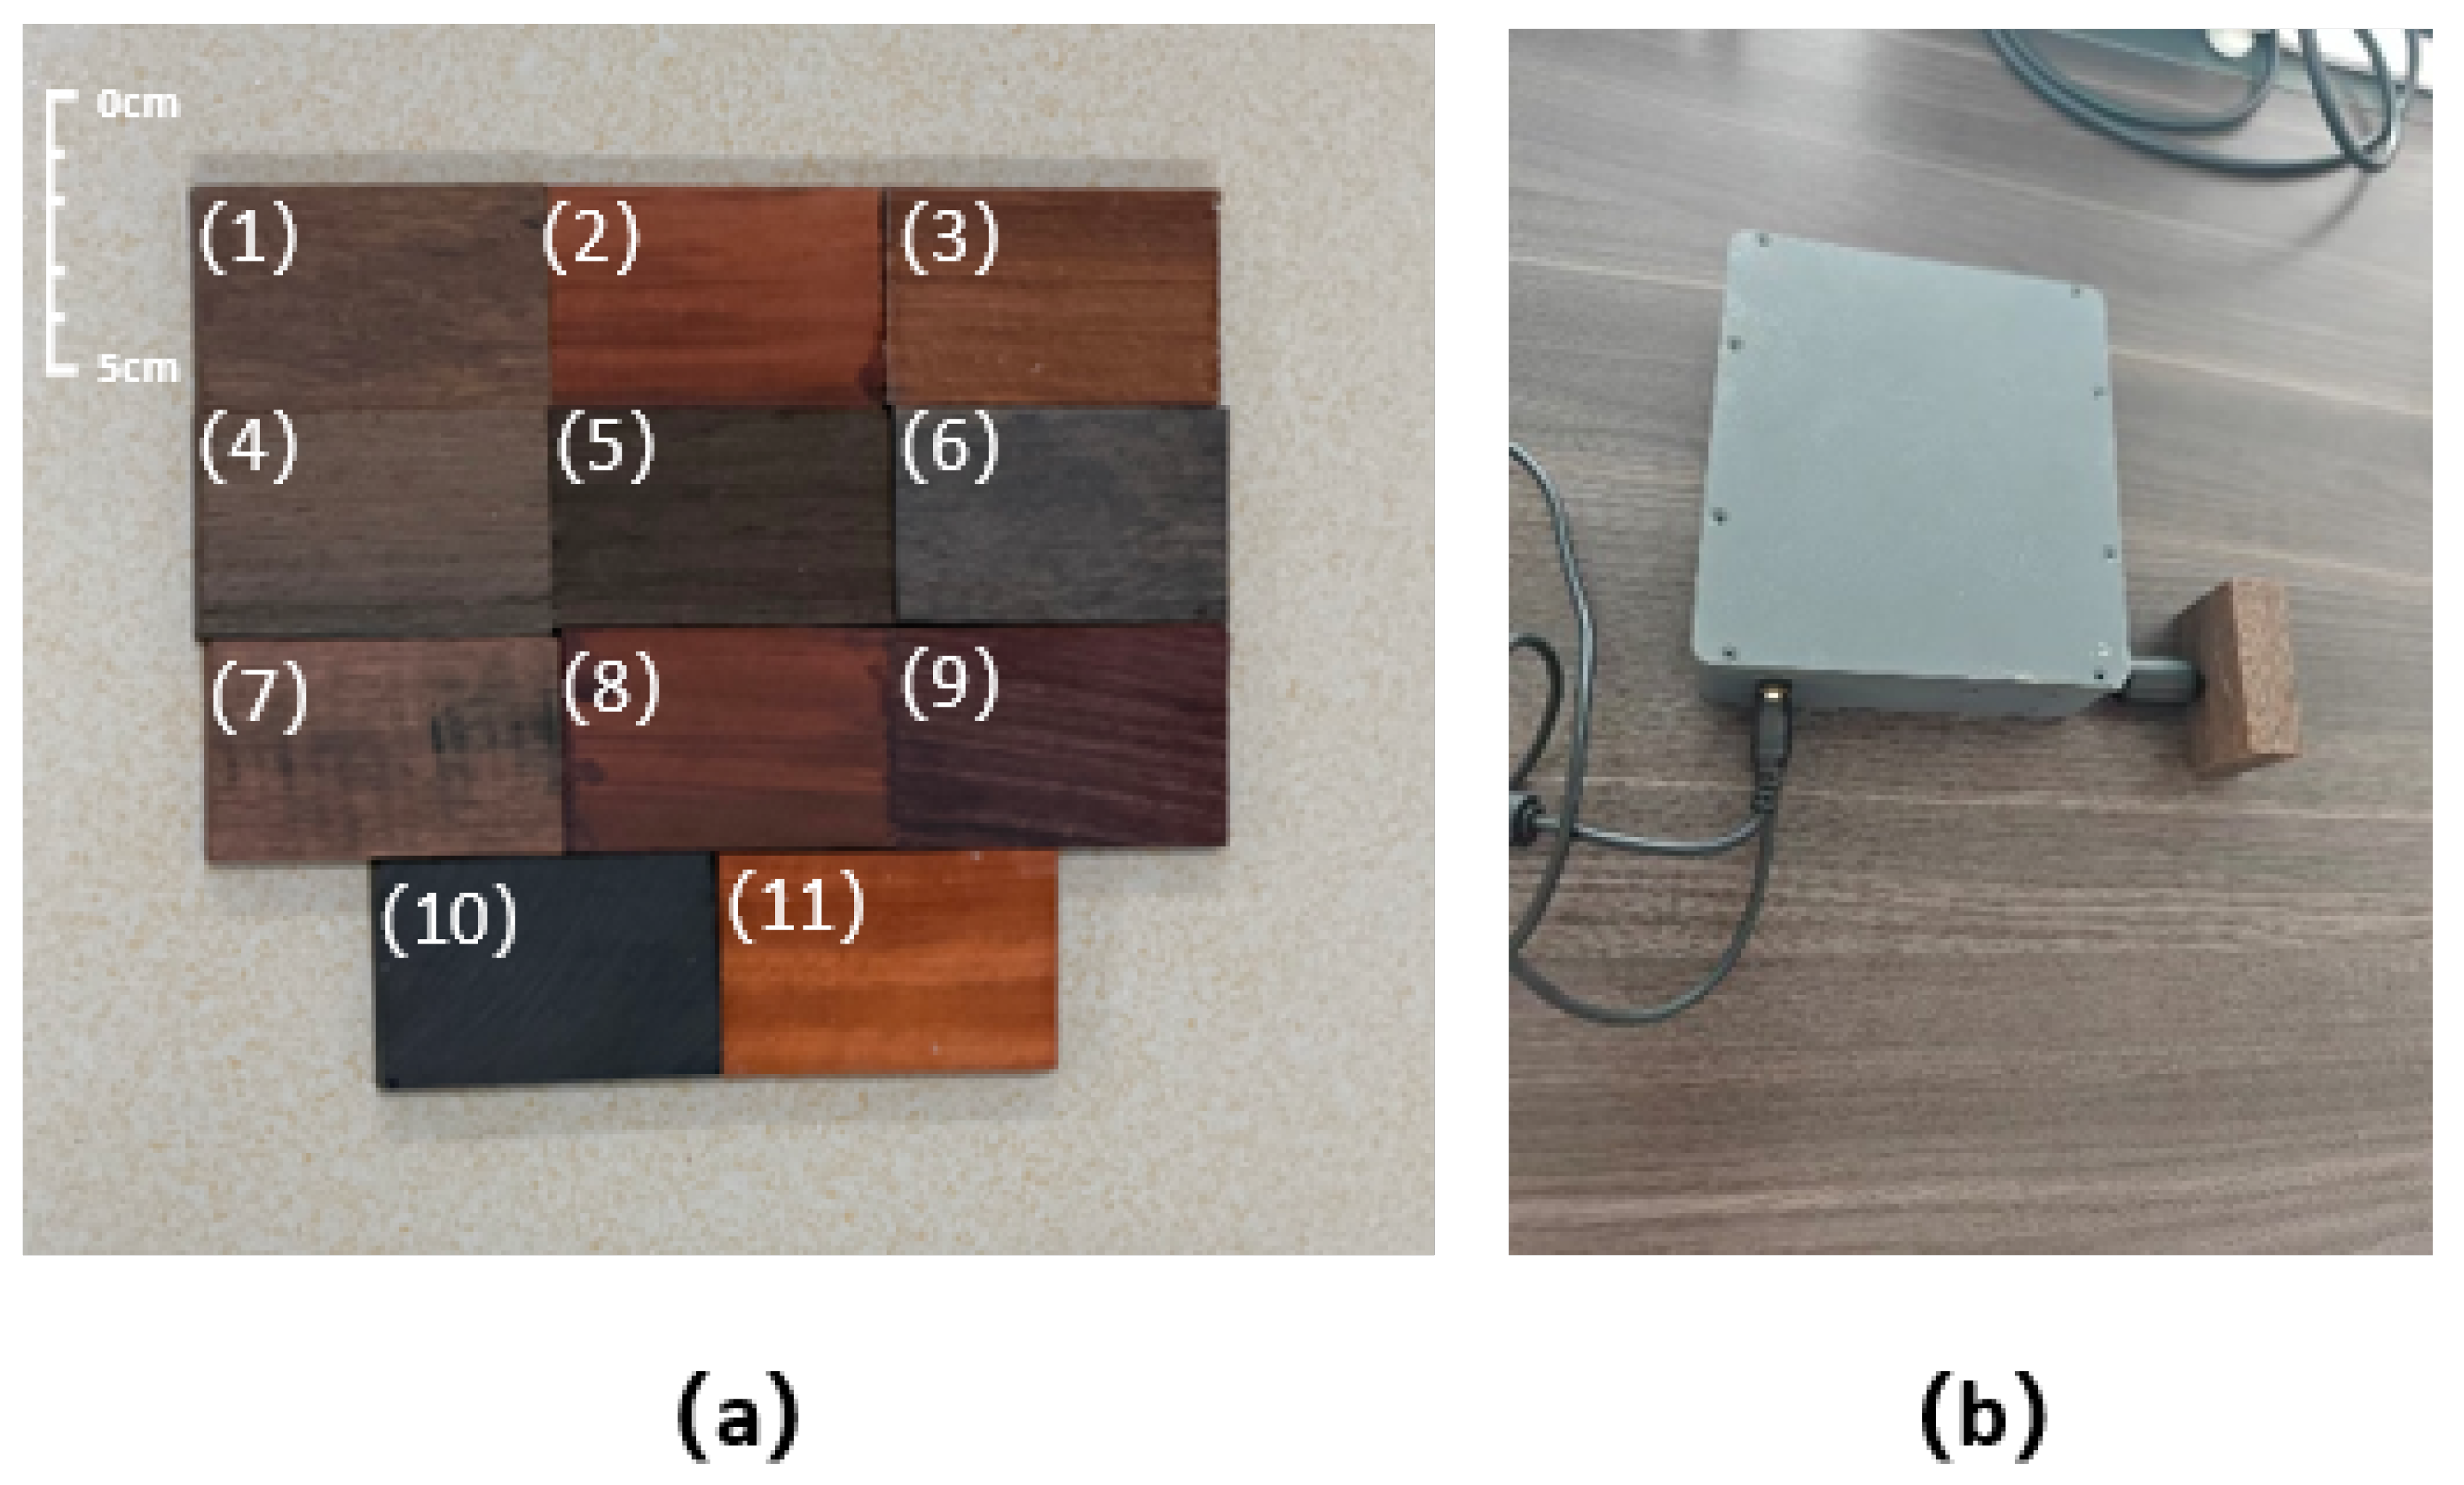
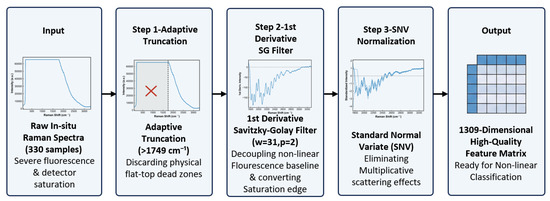
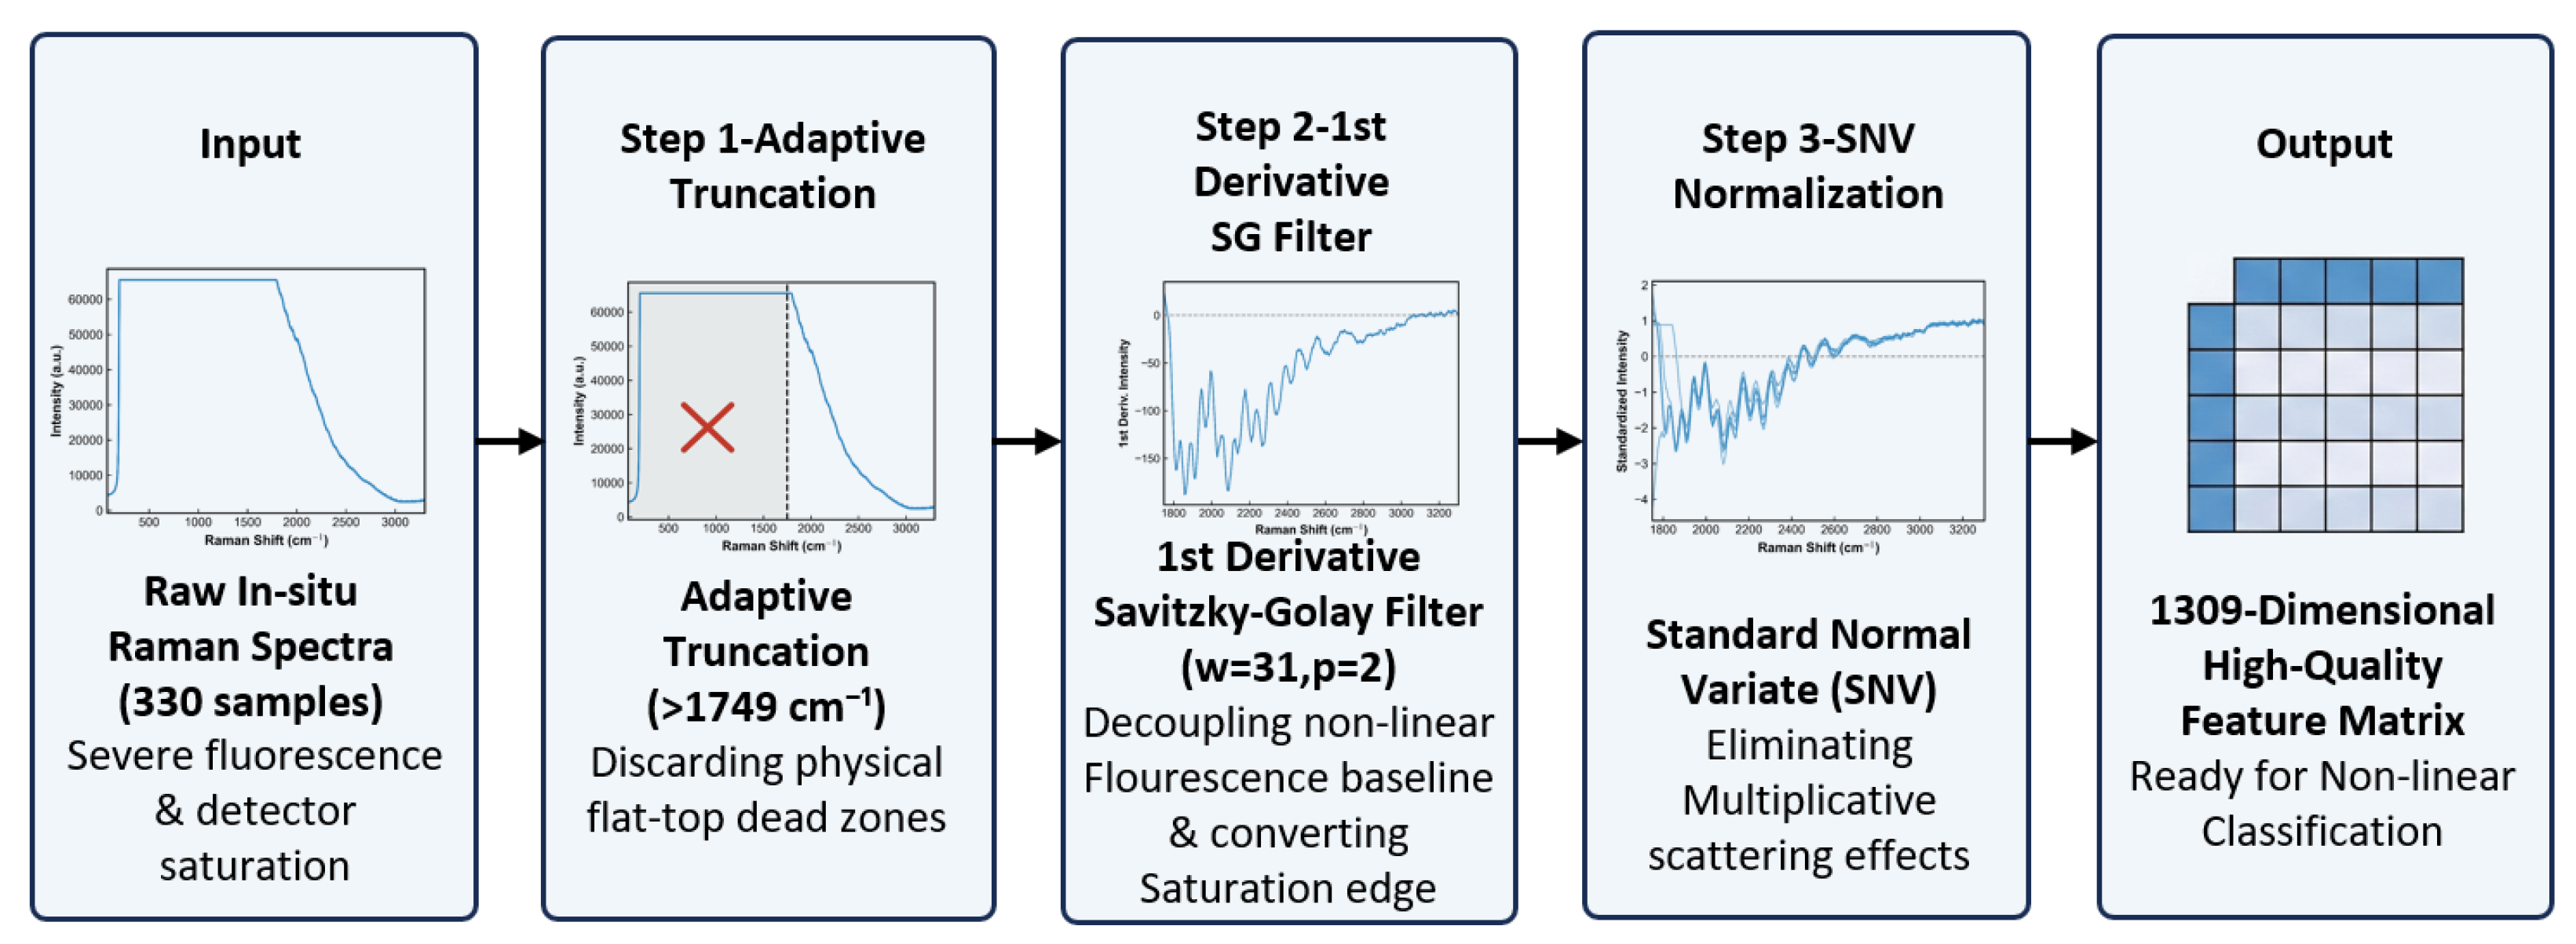
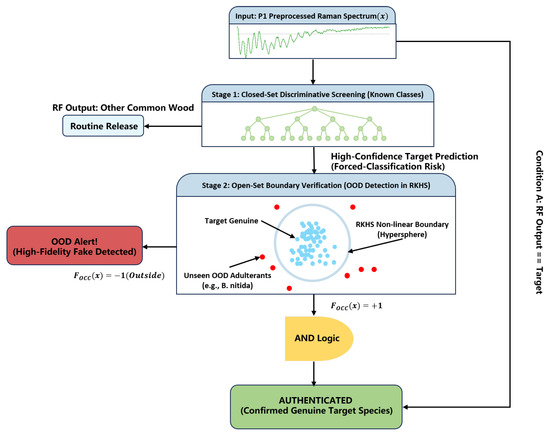
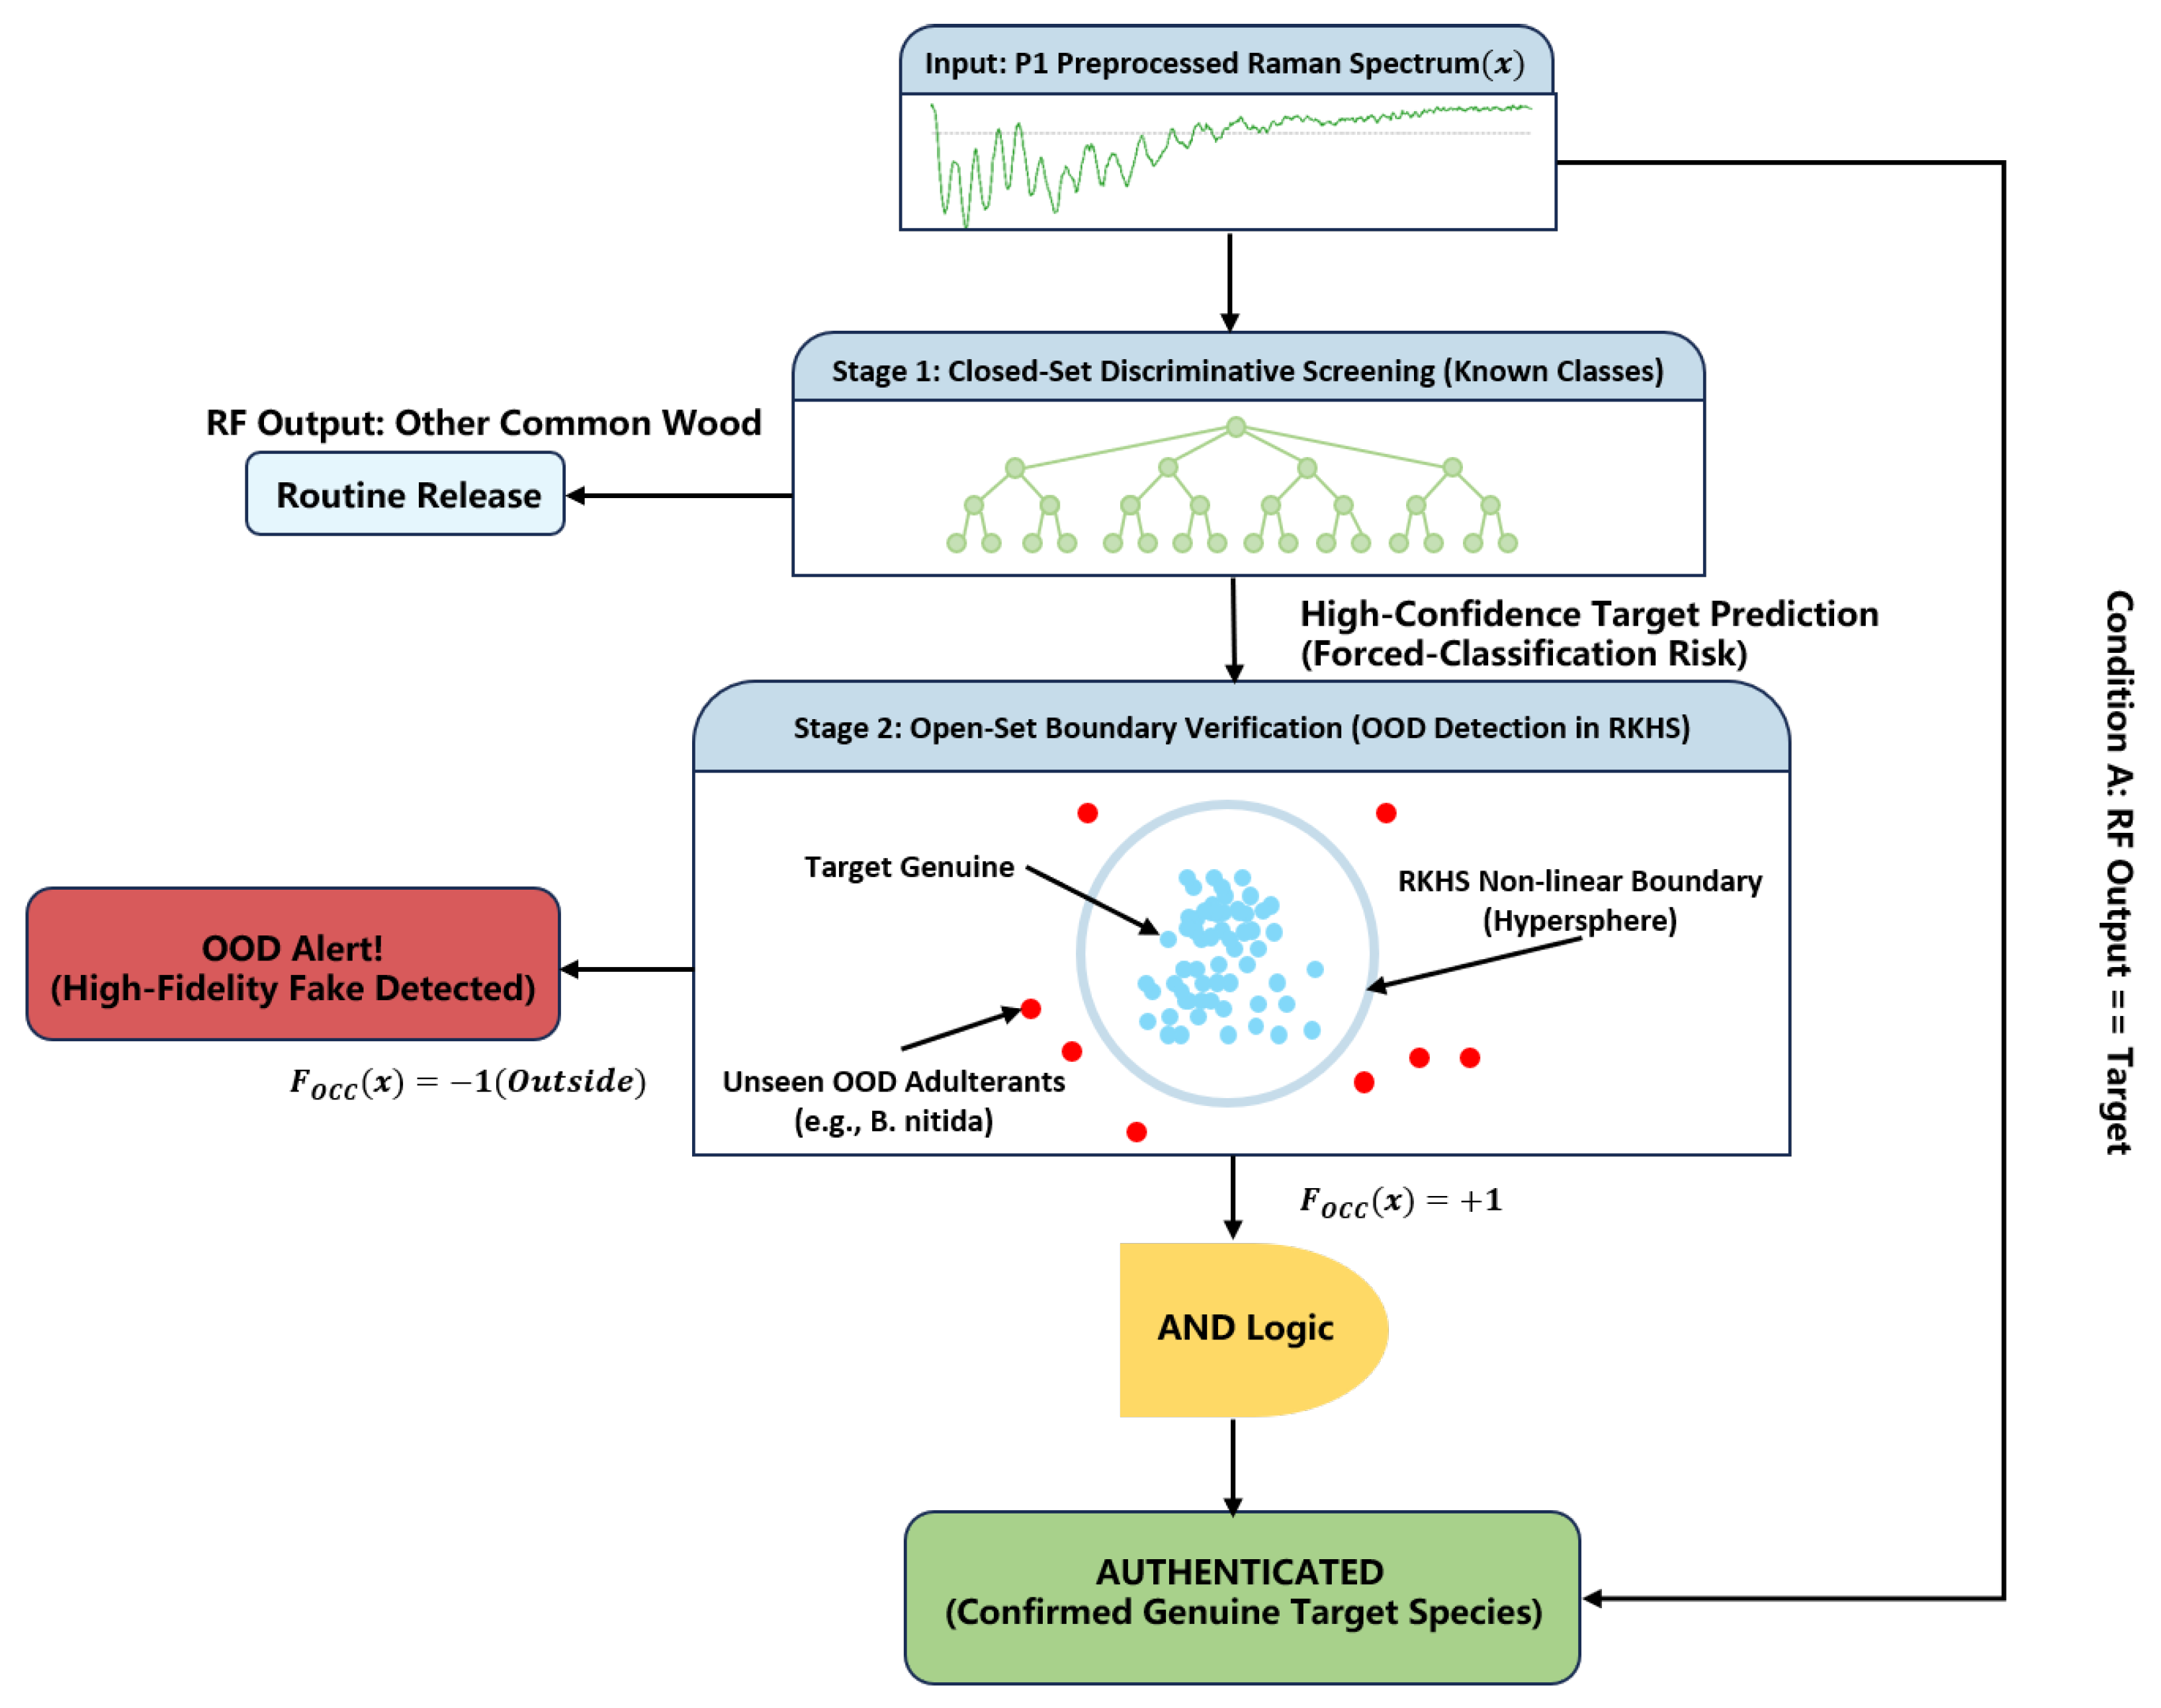
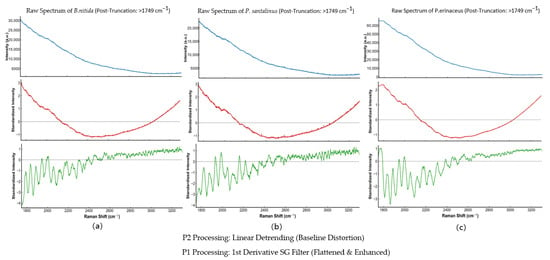
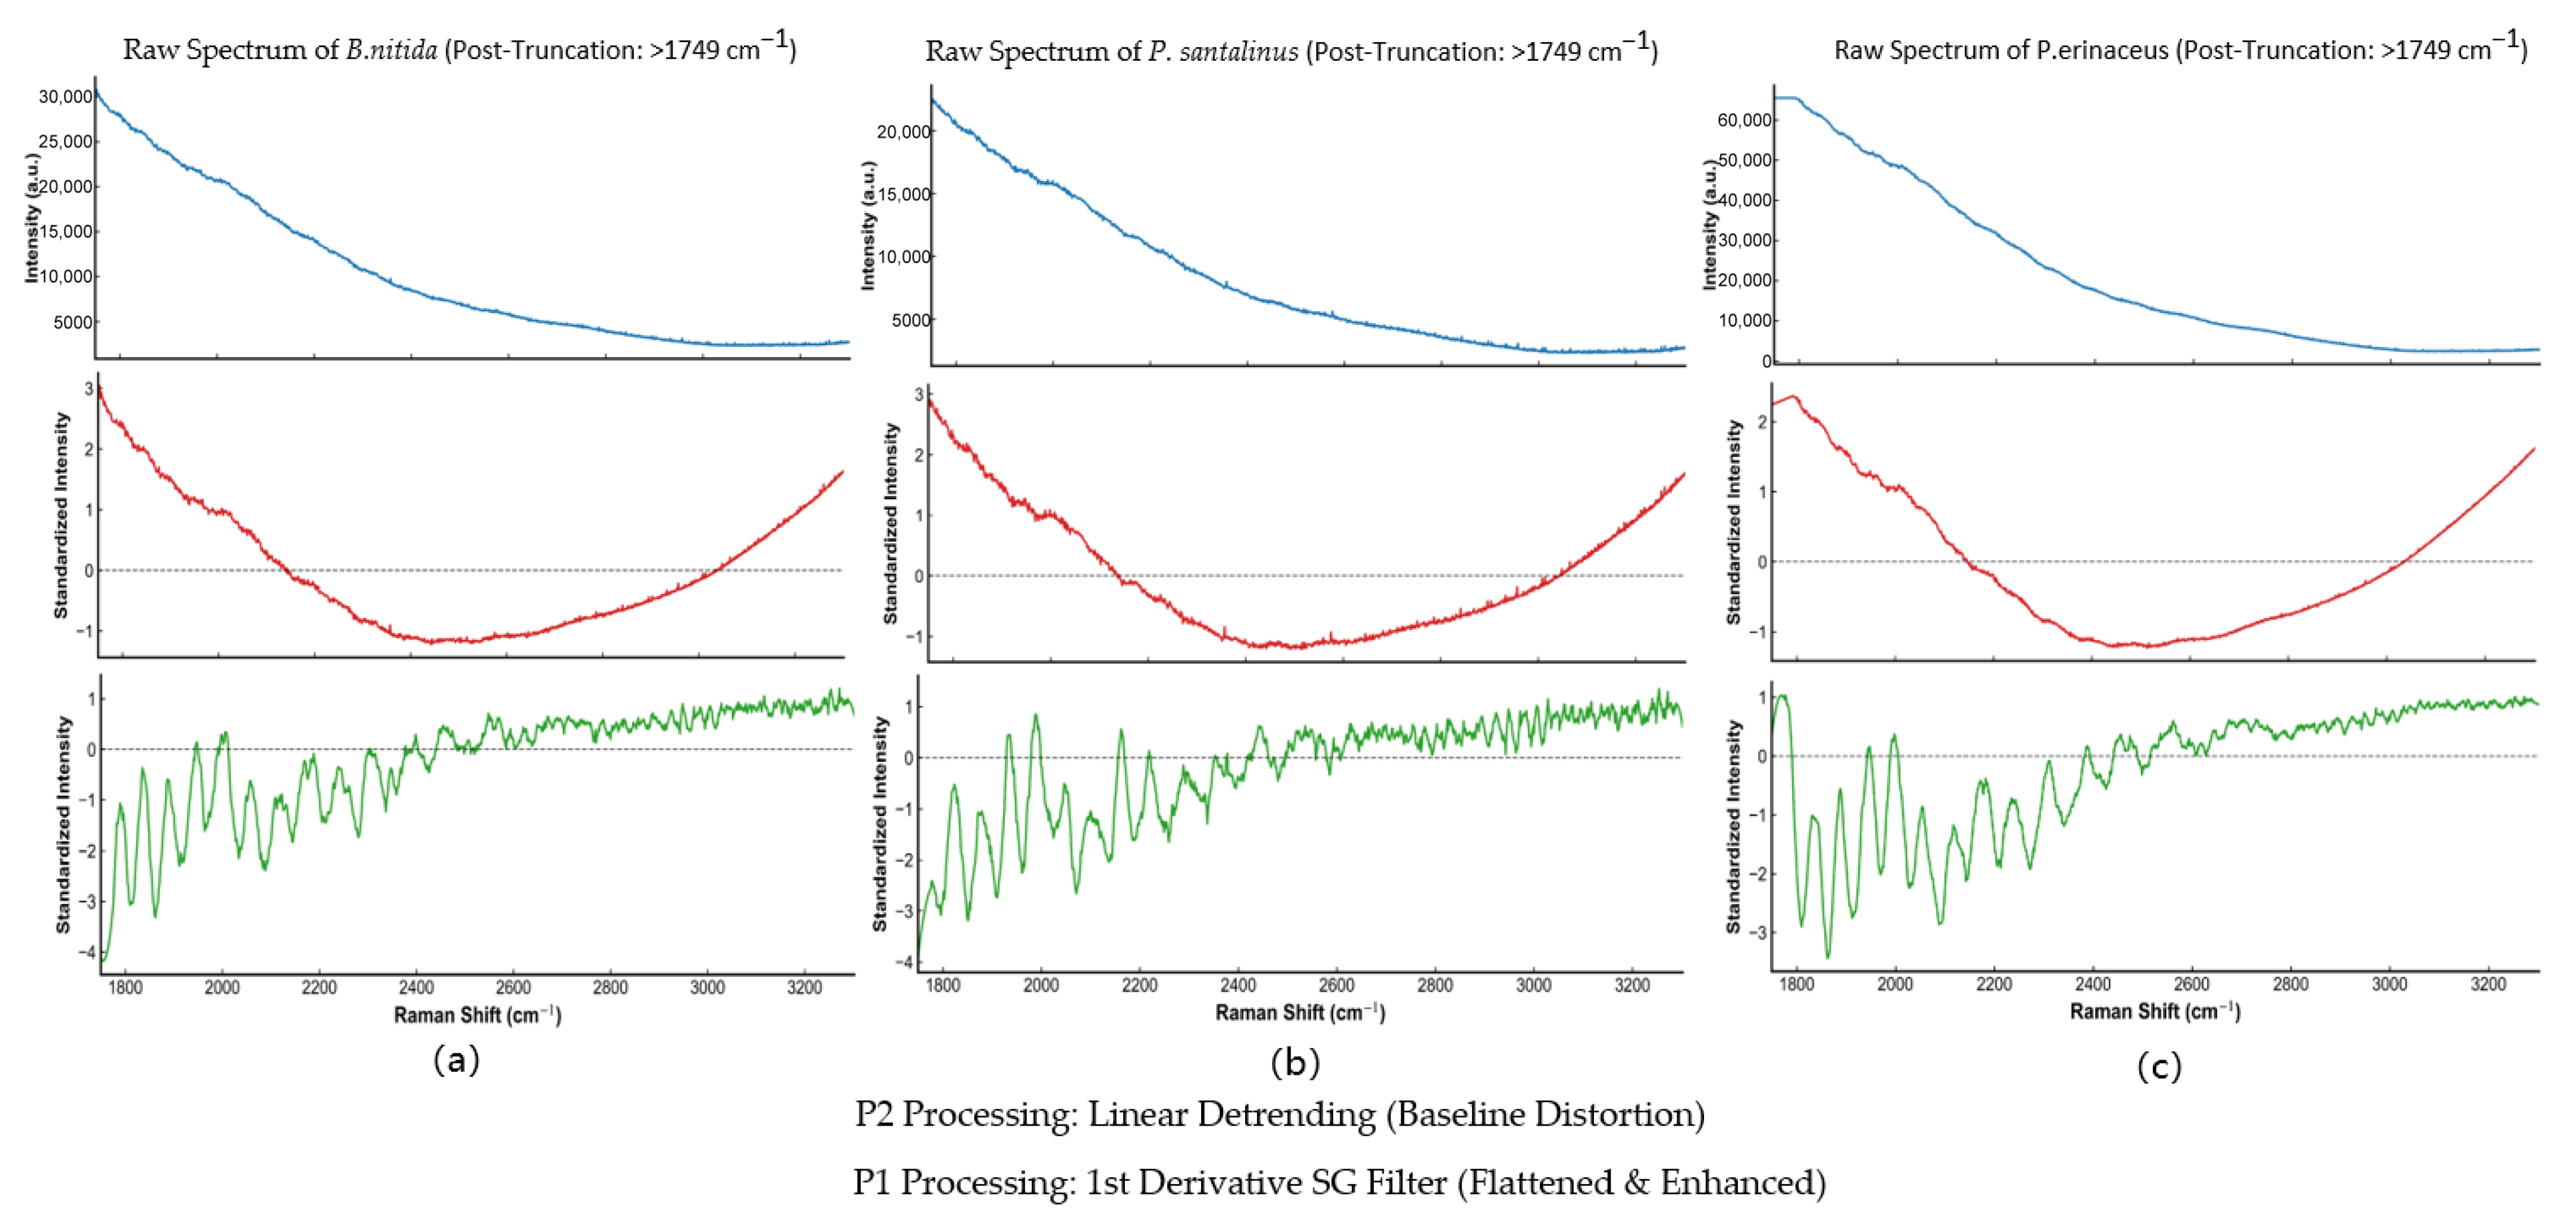
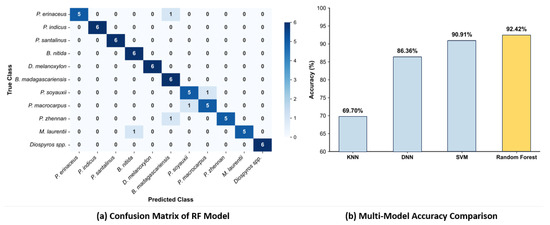
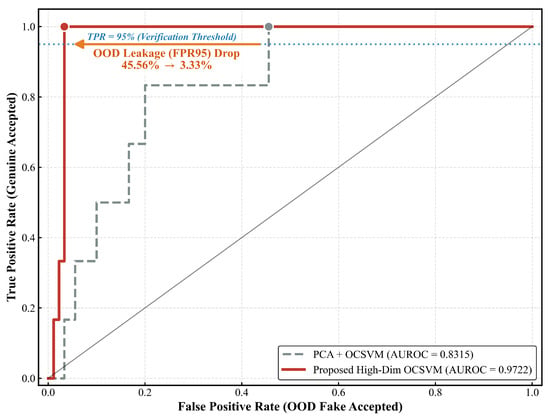
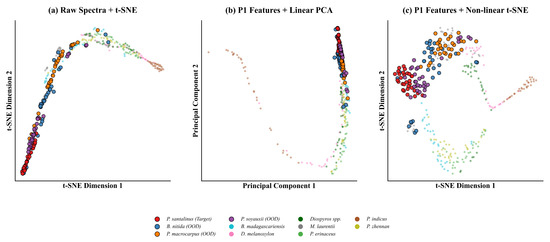
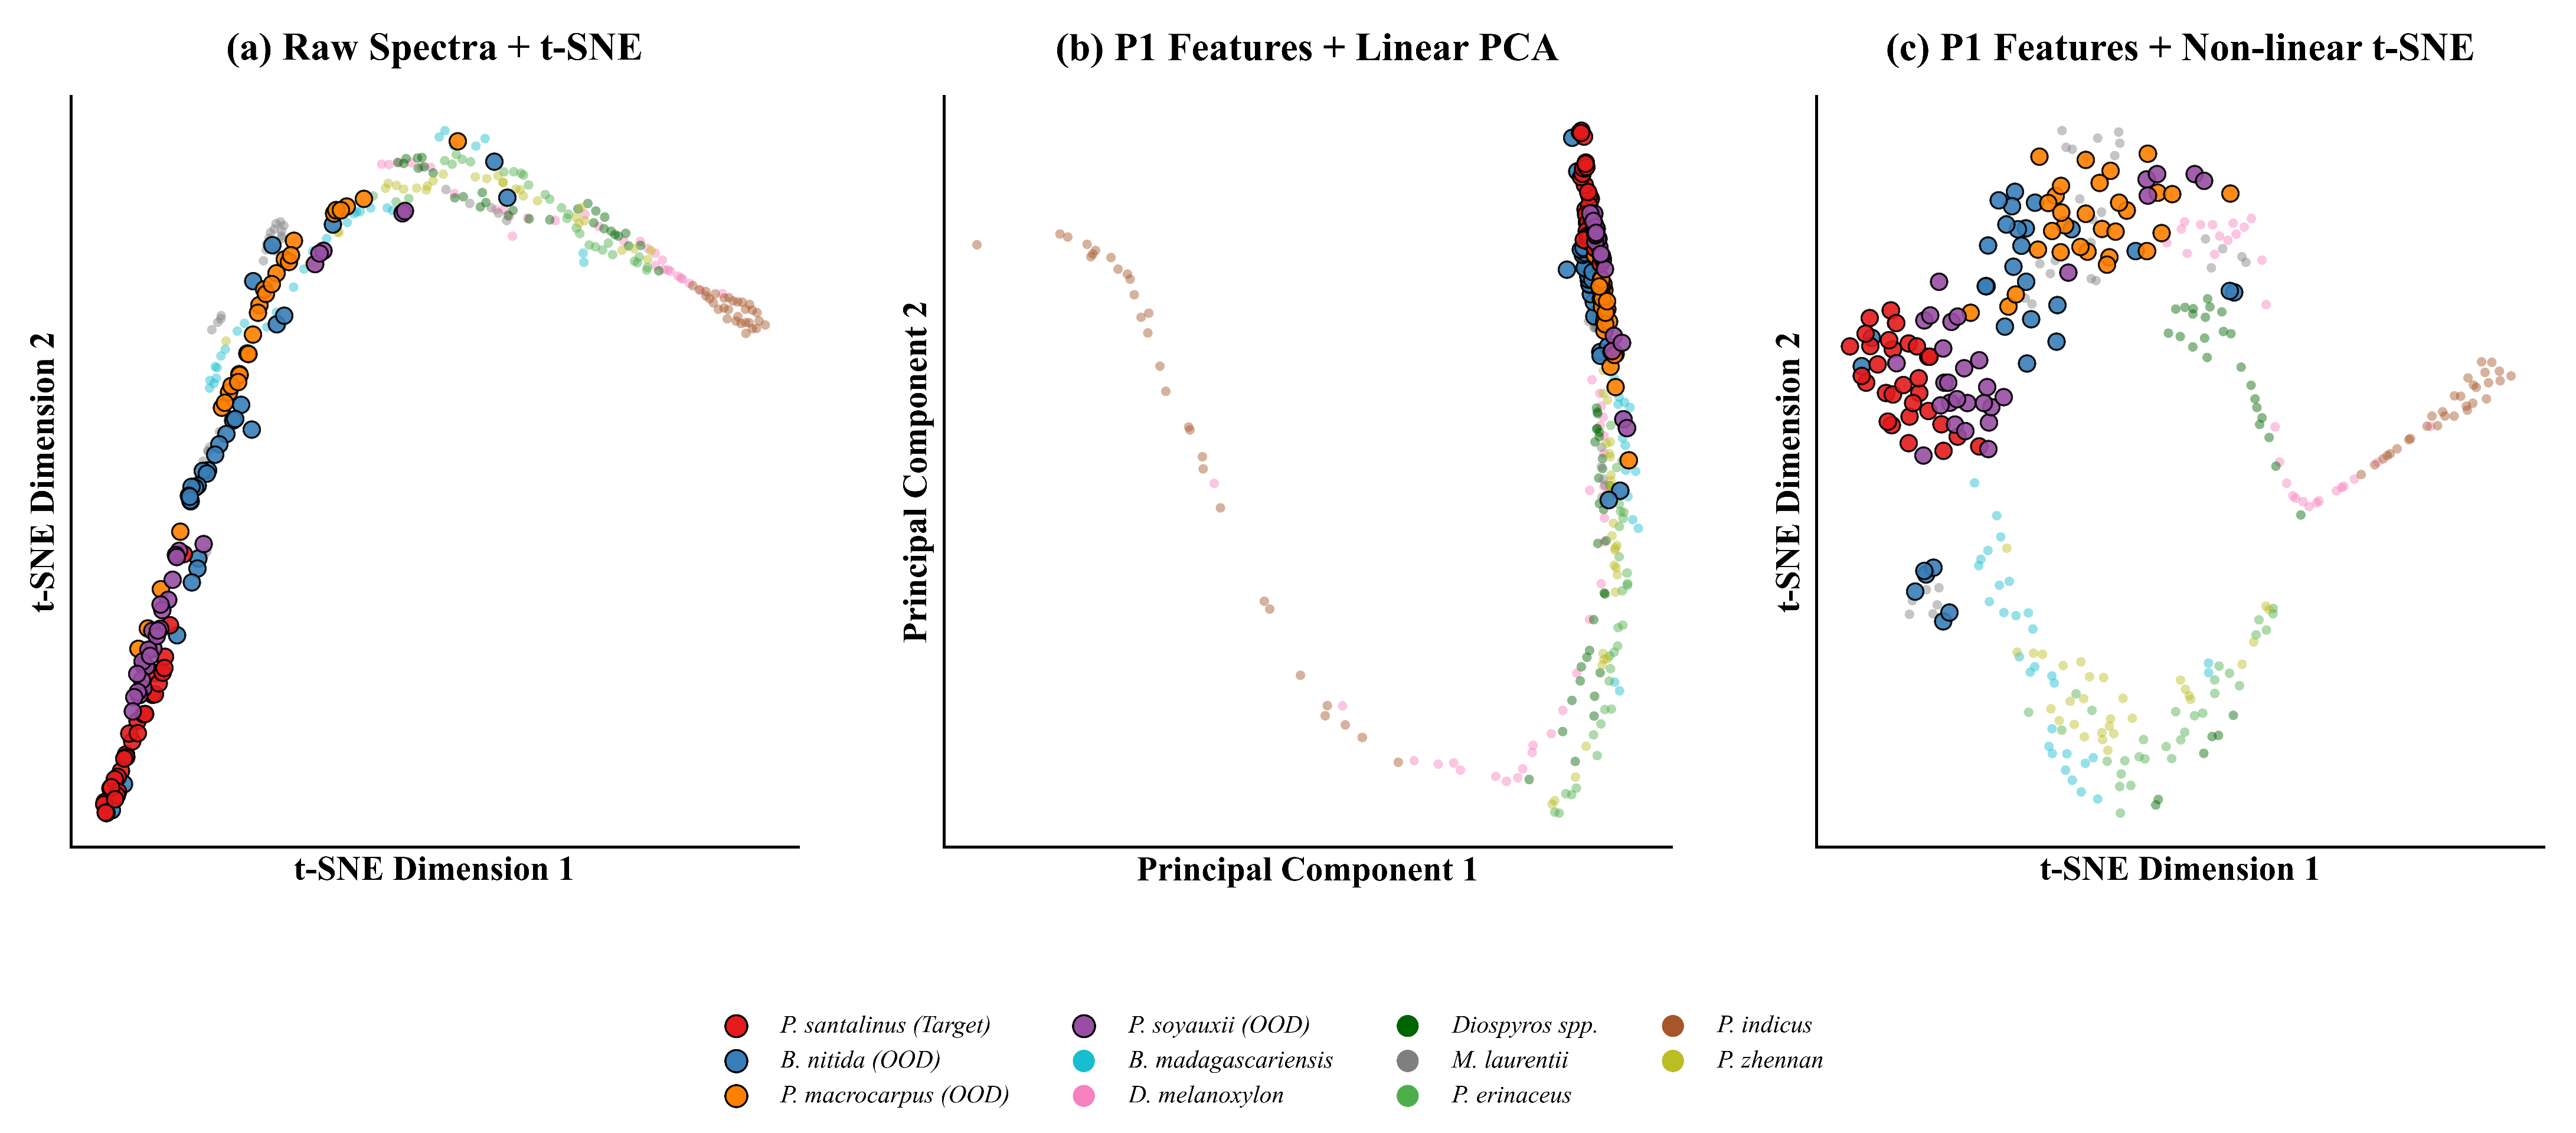
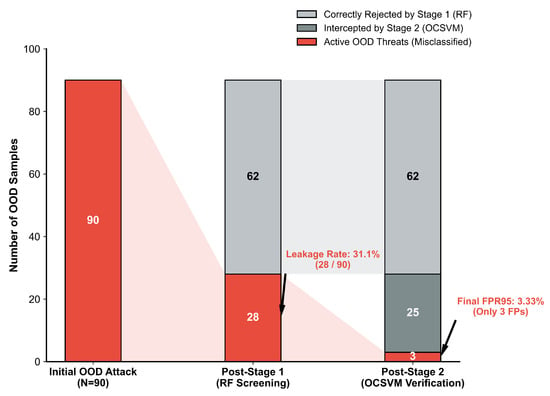
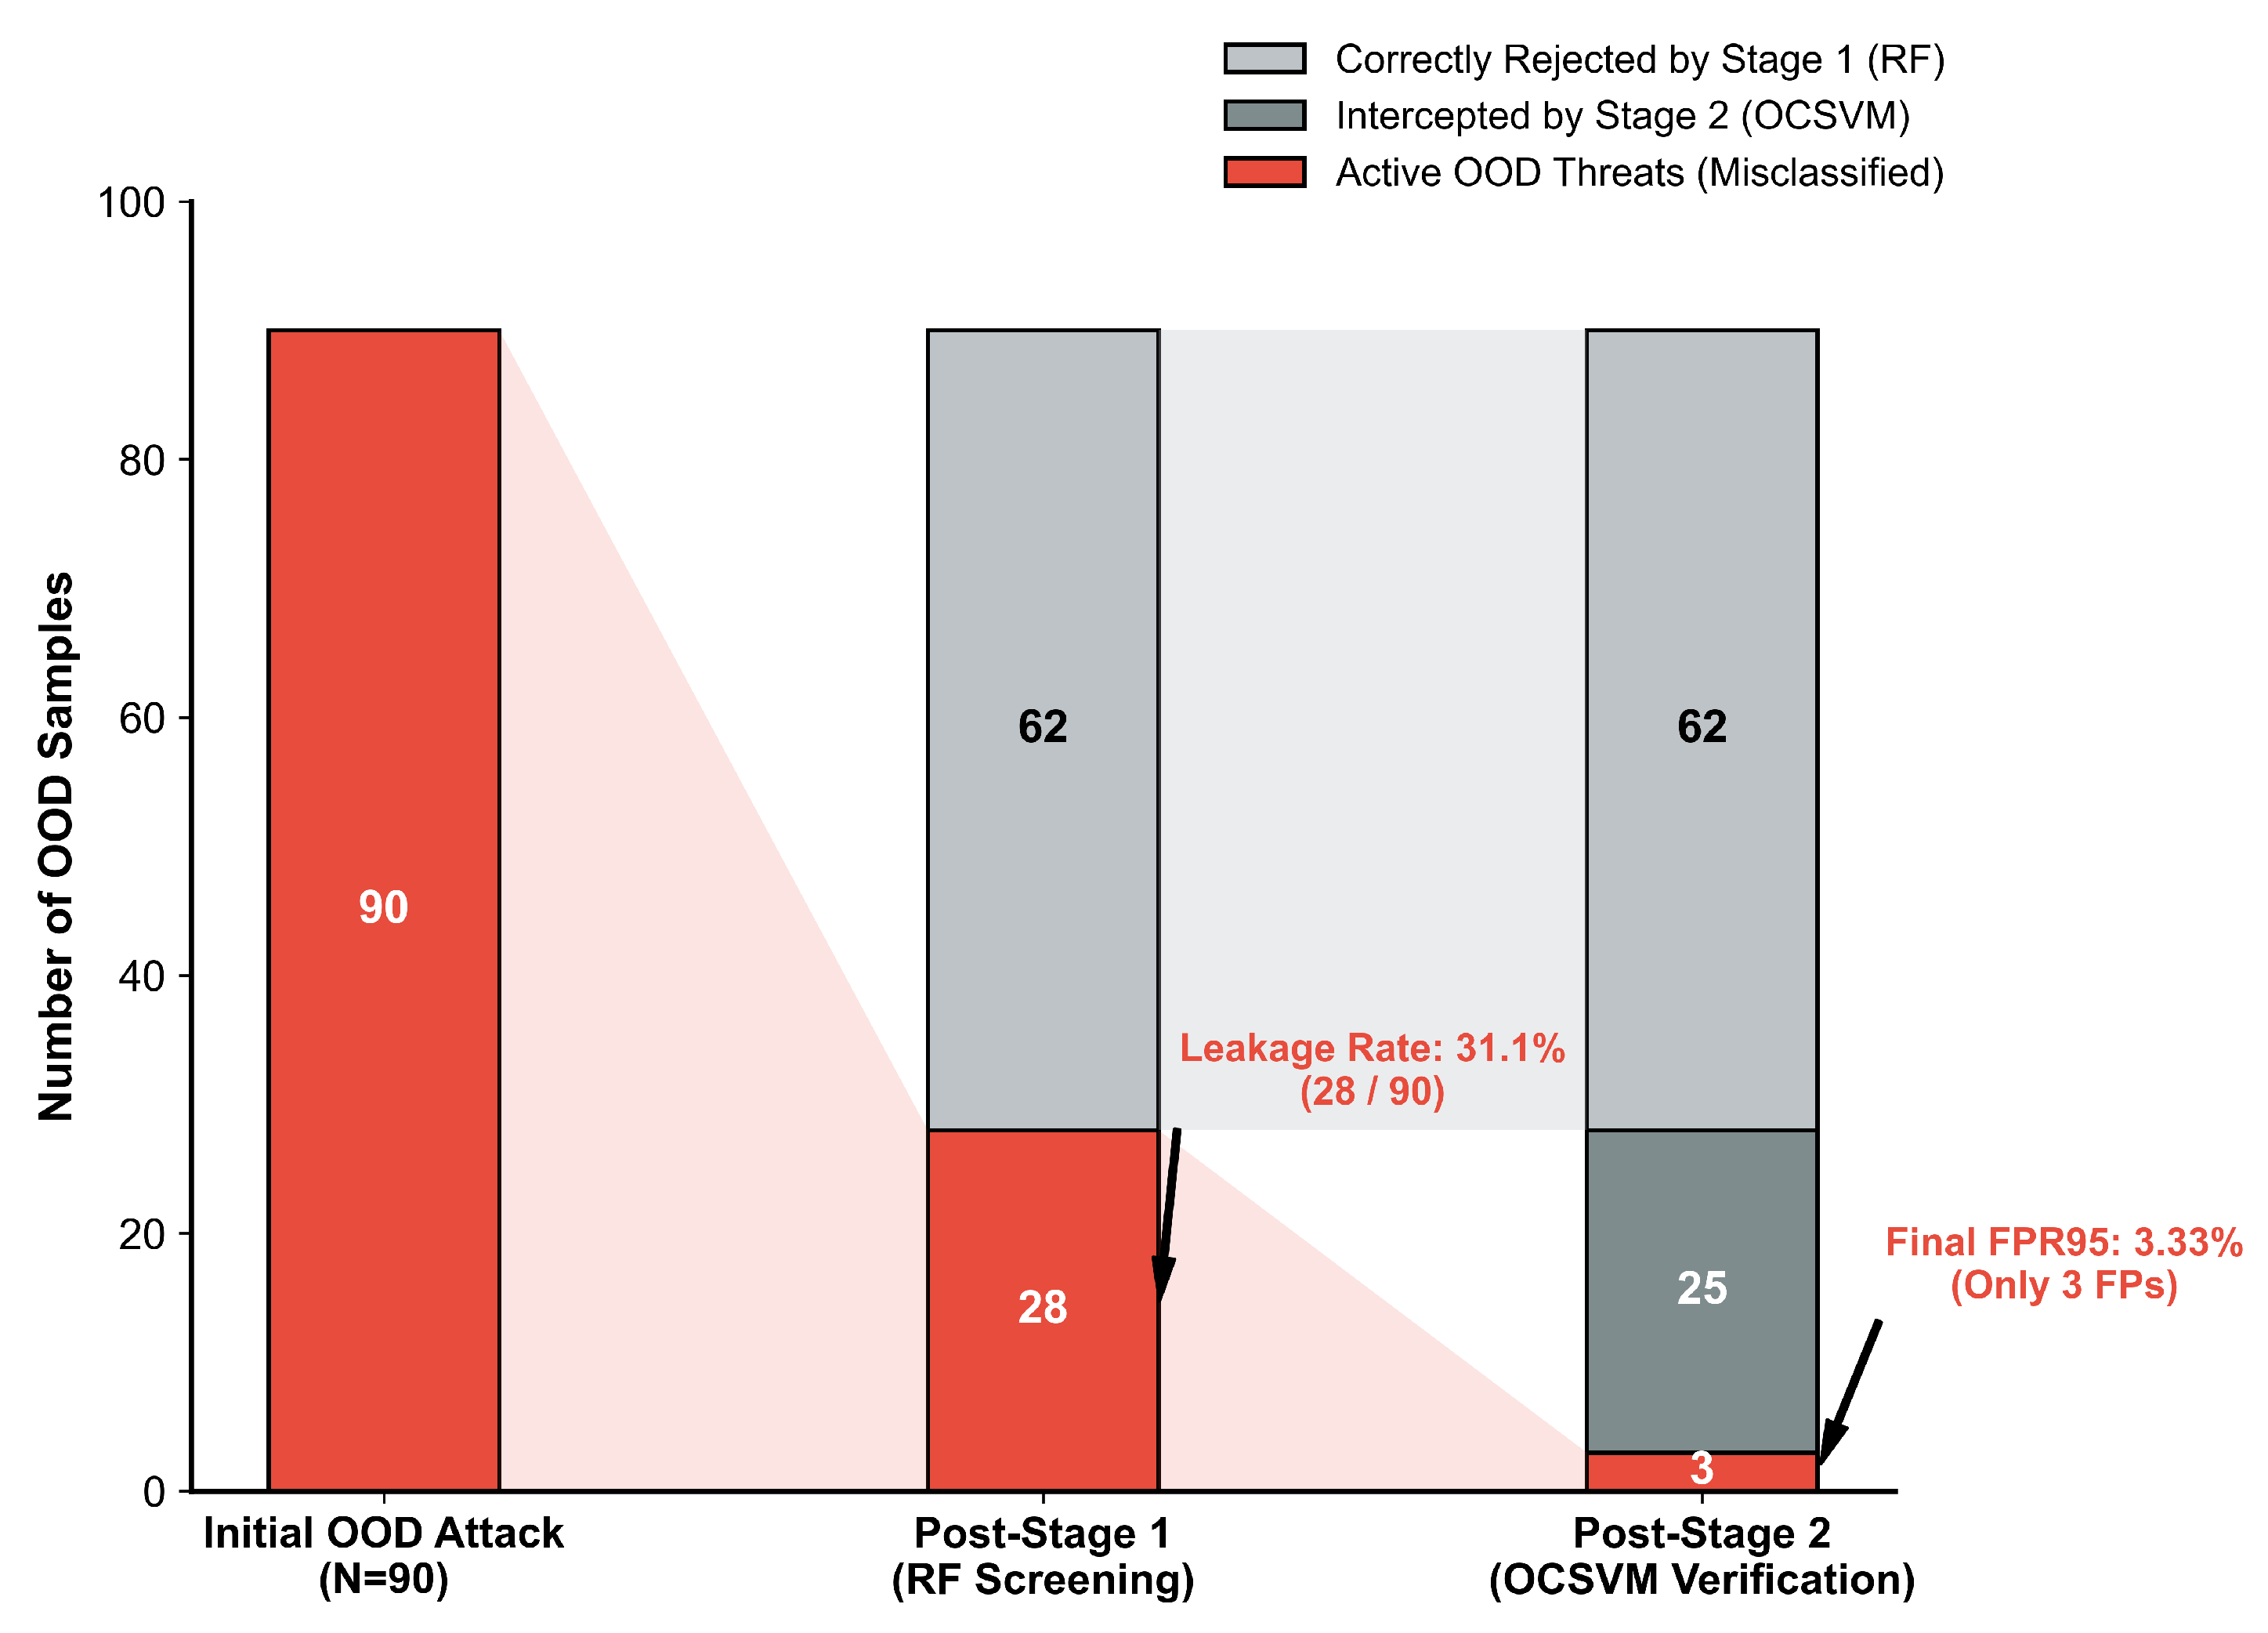
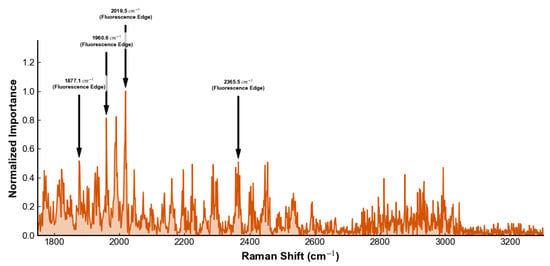
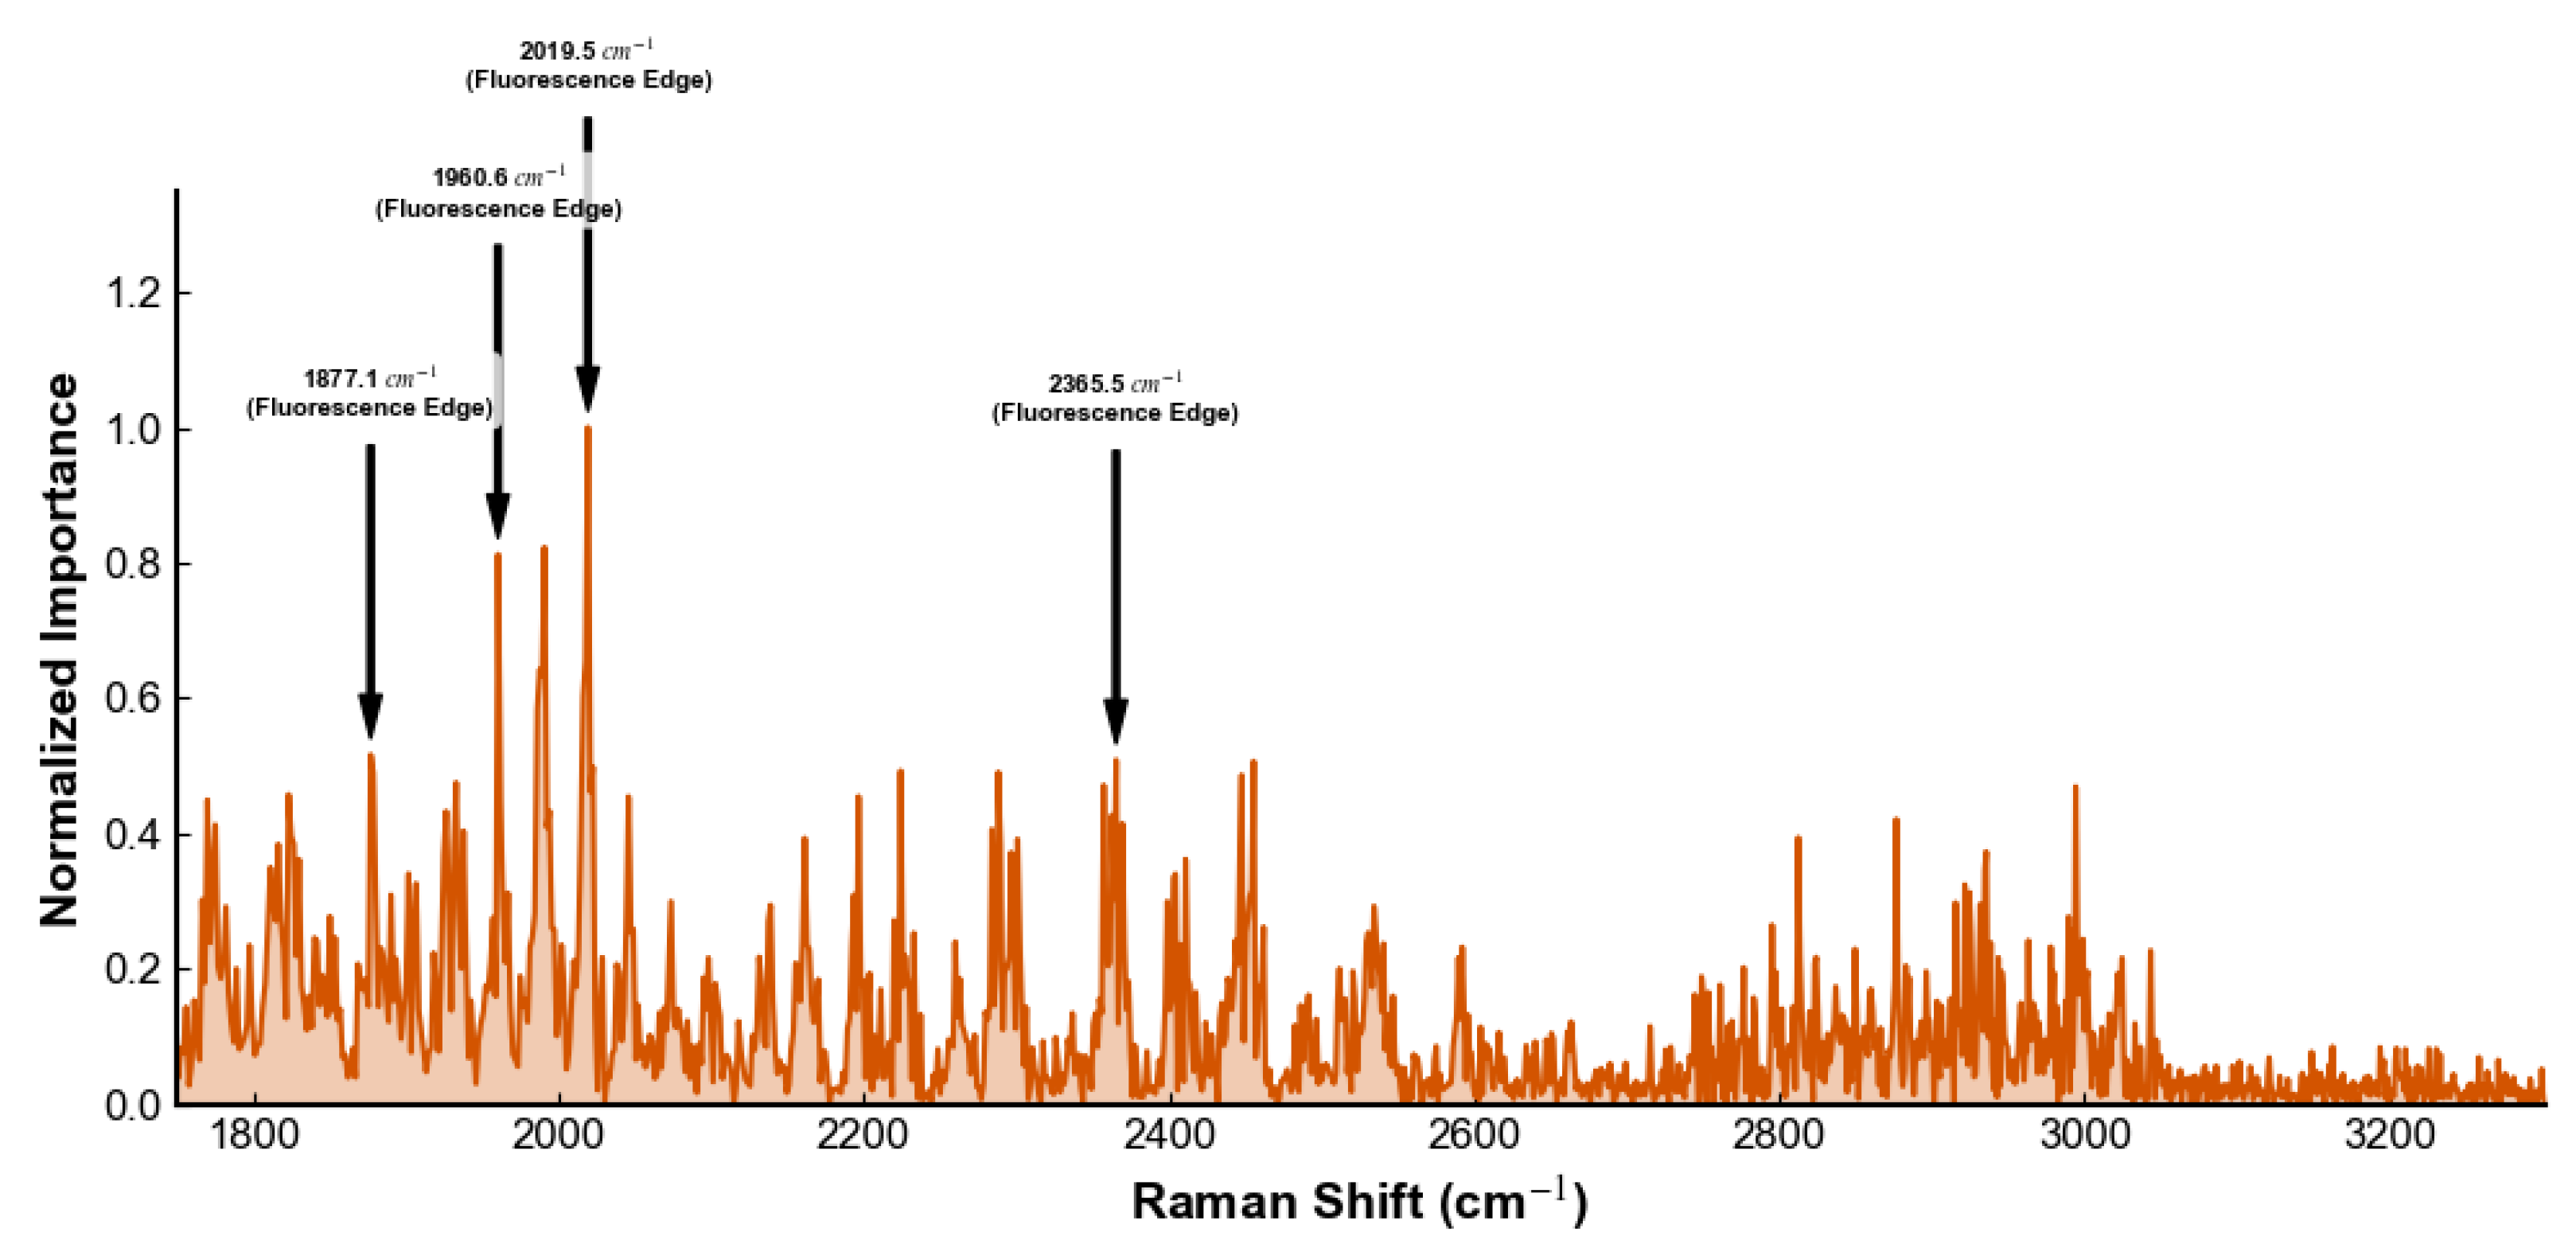

Disclaimer/Publisher’s Note: The statements, opinions and data contained in all publications are solely those of the individual author(s) and contributor(s) and not of MDPI and/or the editor(s). MDPI and/or the editor(s) disclaim responsibility for any injury to people or property resulting from any ideas, methods, instructions or products referred to in the content. |
© 2026 by the authors. Licensee MDPI, Basel, Switzerland. This article is an open access article distributed under the terms and conditions of the Creative Commons Attribution (CC BY) license.