


Abstract
The increasing deployment of shared transmission corridors for High-Voltage Alternating Current (HVAC) and High-Voltage Direct Current (HVDC) systems has intensified the need to evaluate electromagnetic compatibility in hybrid overhead line configurations. This study presents an analytical methodology to estimate the electric field magnitude and magnetic flux density generated by hybrid HVAC–HVDC transmission lines under steady-state operating conditions. The electric field is determined using the Maxwell potential matrix combined with the image method, while the magnetic field is obtained from a formulation based on the Biot–Savart law. Two representative case studies were analyzed with identical electrical operating conditions but different transverse conductor arrangements to evaluate the influence of geometry on the electromagnetic environment of the corridor. The results show that variations in the spatial configuration of the conductors produce noticeable changes in the location and magnitude of the electric and magnetic field maxima across the right-of-way. These findings demonstrate that conductor geometry plays a key role in the electromagnetic behavior of hybrid corridors and should be considered in the design and assessment of HVAC–HVDC transmission systems.
1. Introduction
The rapid build-out of bulk transmission to integrate renewable generation and enhance interregional transfer capacity is pushing utilities to reuse constrained rights-of-way by collocating High-Voltage Direct Current (HVDC) and High-Voltage Alternating Current (HVAC) circuits in the same corridor or even on the same towers. While hybrid AC/DC corridors can substantially increase transfer capacity and controllability, they also raise open questions about electromagnetic compatibility (EMC) related to field coupling, induced voltages/currents in adjacent infrastructure, corona-driven ion flows, and compliance with exposure guidelines. Recent utility projects and technical committee work (e.g., CIGRE) have highlighted the need to systematically characterize these interactions under both steady-state and transient conditions [1,2,3].
From a physical standpoint, EMC issues in hybrid corridors arise from capacitive and inductive coupling between nearby AC and DC conductors, superposed electric fields from AC phase conductors and DC poles, and space-charge effects due to DC-line corona that modulate ground-level electric fields. International technical guidance [4] defines relevant electromagnetic environment parameters for HVDC overhead lines—electric field, ion current density, magnetic field, radio interference, and audible noise—providing a baseline for evaluating hybrid configurations. Contemporary modeling combines ion-flow/field solvers with numerical techniques (e.g., Krylov subspace methods) to resolve time-varying ground-level fields in mixed HVAC–HVDC geometries, and recent studies quantify field distributions for bipolar 500–800 kV HVDC layouts [3,4,5].
Beyond line-to-line coupling, hybrid corridors can influence nearby metallic infrastructure. Induced voltages and currents on buried pipelines and signaling cables may exceed compatibility thresholds during power-frequency steady states and especially during fault or switching transients. Field-to-structure coupling has been analyzed for modernized railway lines and for long pipelines near overhead EHV corridors; mitigation options include dedicated screening conductors, optimized earthing, and route geometry adjustments. Engineering guidance likewise flags that during AC or DC fault events, exposure of parallel infrastructure to elevated currents can threaten coating integrity or equipment immunity [6,7,8].
Human exposure aspects also underpin EMC acceptance for co-located lines. For HVDC, static electric and magnetic fields predominate; reviews to date report no confirmed health risks for the weak static EMFs typical of compliant HVDC systems, while acknowledging ion-flow phenomena near conductors and localized perception effects. For time-varying fields at 50/60 Hz and below 100 kHz, the ICNIRP low-frequency guidelines (2010) provide basic restrictions and reference levels that are widely adopted in compliance assessments; above 100 kHz the updated ICNIRP 2020 RF guidelines apply. Hybrid corridors therefore require evaluating exposure against the appropriate static and low-frequency limits, with attention to combined AC/DC field conditions across accessible corridors [9,10,11,12].
Despite these advances, gaps remain in standardized compatibility criteria and validated multiphysics workflows for hybrid corridors under realistic operating envelopes (seasonal loading, conductor weathering, precipitation) and network events (single-pole/bi-pole blocking, AC faults, converter control actions). There is a particular need for unified metrics that relate field/coupling calculations to compatibility targets for adjacent infrastructure and exposure compliance, as well as for design-space studies that trade off tower geometry, phase/pole arrangement, and mitigation (shield wires, transposition, screening conductors) [1,3,13].
Recent advances in multiphysics modeling and material-oriented electromagnetic analysis have further enhanced the understanding of coupled electromagnetic phenomena in complex systems [14].
Although the present work focuses on steady-state electromagnetic field estimation, it is recognized that hybrid HVAC–HVDC corridors may experience significantly different electromagnetic conditions during transient events such as AC faults, DC pole blocking, converter control disturbances, and switching overvoltages. Under these conditions, rapid variations in current and voltage may produce stronger inductive and capacitive coupling effects, as well as travelling-wave interactions that can modify the spatial distribution and magnitude of electromagnetic fields.
Under such transient conditions, electromagnetic coupling mechanisms may significantly increase, leading to field magnitudes that differ substantially from steady-state estimations.
Therefore, the analytical framework proposed in this study is intended as a first-order engineering assessment tool aimed at evaluating the influence of conductor geometry under nominal operating conditions. The extension of the methodology toward transient electromagnetic analysis through electromagnetic transient (EMT) or multiphysics numerical modelling represents a relevant direction for future research.
While classical electromagnetic formulations such as the Maxwell potential matrix and the Biot–Savart law are well established, their integrated application to hybrid HVAC–HVDC transmission corridors as a comparative geometric assessment framework remains limited in the literature. The contribution of this work lies in the development of a unified analytical procedure that allows evaluating the redistribution of electric and magnetic fields resulting solely from geometric variations in co-located AC/DC transmission structures.
This approach provides a computationally efficient alternative for preliminary corridor design studies, enabling the identification of configurations that may reduce ground-level electromagnetic exposure or mitigate coupling with nearby infrastructure before undertaking more detailed numerical simulations.
The electromagnetic field in hybrid HVAC–HVDC corridors is evaluated as the superposition of quasi-static electric and magnetic field contributions associated with conductor voltages and currents.
This contributes to bridging the gap between classical electromagnetic field modeling and practical hybrid transmission corridor design assessment.
Unlike previous studies that address HVAC or HVDC systems independently, this work focuses on their combined interaction within shared transmission corridors.
1.1. Hybrid Corridors
The integration of HVDC and HVAC transmission lines in a single corridor has gained relevance for optimizing power transfer capacity and grid control. However, the electromagnetic interactions (EMI) arising from this hybrid configuration are highly dependent on the geometric arrangement of the lines, which can significantly influence coupling, induction, and electromagnetic compatibility effects. In this regard, it is crucial to analyze the main configurations of hybrid corridors, such as parallel, skewed, and crossed lines, and explore how each affects the interaction between HVAC and HVDC systems, with an emphasis on their implications for EMC under various operating conditions.
1.1.1. Parallel Lines
In hybrid corridors with parallel lines, HVDC and HVAC transmission lines are laid in the same direction across the corridor, with spatial separation determined by safety and efficiency standards. This configuration, although common, presents specific challenges in terms of electromagnetic compatibility due to capacitive and inductive coupling between the high-voltage lines. Capacitive coupling is especially significant when HVAC lines are located in proximity to HVDC lines, since the electric fields generated by the alternating current phase can induce currents in the direct current line, affecting both the stability of the HVDC line and adjacent metallic structures, such as transmission towers or communication lines [15,16].
A recent study in [3] shows that the proximity of HVAC lines to HVDC lines increases electromagnetic interference, with measurable effects in the distortion of magnetic fields and the induction of transient voltages in nearby infrastructure. To mitigate these effects, shielding techniques and optimization of phase arrangements in HVAC lines have been proposed, with the aim of reducing mutual induction.
1.1.2. Oblique Lines
In oblique line configurations, HVAC and HVDC lines are arranged at different angles, which adds complexity to the analysis of electromagnetic interactions. The angular arrangement modifies the capacitive coupling pattern and the distribution of the electric and magnetic fields generated by both lines. Studies in [13] indicate that orienting lines at oblique angles can increase electromagnetic interference, since HVAC and HVDC lines interact differently depending on the geometry of the power fields.
In this type of configuration, the effects of corona and ion flow due to HVDC lines become more complex, since induced currents can generate disturbances along the corridors, affecting telecommunications equipment and nearby infrastructure [17].
1.1.3. Crossed Lines
Crossed line configurations, where HVDC and HVAC lines cross at right or irregular angles, represent one of the most challenging scenarios in terms of electromagnetic compatibility. Studies have shown that line crossings, particularly when AC lines cross DC lines, can generate very high inductive and capacitive couplings, increasing interference between the two networks. These couplings can induce voltages and currents exceeding compatibility limits in nearby structures, such as signal cables or buried pipelines [17].
Furthermore, the presence of transients due to load changes or line faults can cause significant fluctuations in the electric and magnetic fields, increasing the risks of damage to sensitive equipment in nearby areas. Research such as [18] has studied crossed line configurations and proposed mitigation strategies including the use of more efficient shielding screens, the installation of optimized grounding conductors, and adjusting tower geometry to reduce mutual induction.
2. Materials and Methods
2.1. Methodology for Calculating Electric Field Intensity in Hybrid Transmission Lines
The methodology described below allows for calculating the electric field intensity components across the corridor of an overhead transmission line.
In this work, the term “pole” refers exclusively to the electrical polarity of the HVDC system, whereas “conductor” refers to the physical current-carrying element.
The electric field intensity is obtained through a two-dimensional analysis of the transmission line, considering parallel poles at ground level and considering the spatial configuration of the line, the length of the corridor, the number of conductors per pole, the radius of the conductor, and the nominal voltage of the line.
Since the analysis is carried out under steady-state HVDC conditions, the electromagnetic fields are considered time-invariant. Therefore, the electric field is derived exclusively from the electrostatic scalar potential, neglecting the time-varying component associated with the magnetic vector potential.
This methodology does not consider corona discharge or space charge effects. These phenomena introduce nonlinear behavior in the electric field distribution and are therefore beyond the scope of the present analytical formulation.
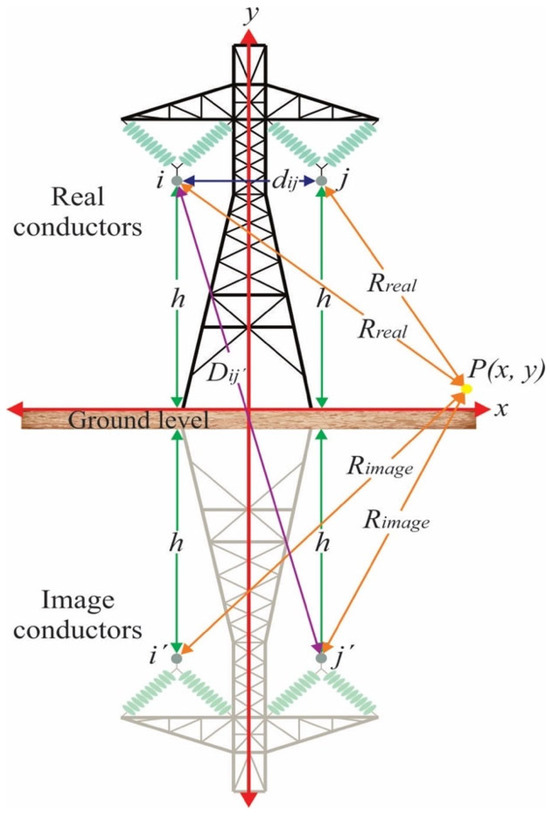
Based on this approach, the steps described below will be carried out, considering various variables, which are presented in Figure 1 [19].
Figure 1.
Geometric definition of variables. Reproduced from Ref. [19], licensed under CC BY-NC 2.5 Peru.
For a hybrid configuration, the electric field calculation is performed similarly to that for lines energized with AC or DC. In this case, space charge is not considered, and the image method using the Maxwell potential matrix is used.
A Cartesian coordinate system is adopted, where the x-axis corresponds to the horizontal direction and the y-axis to the vertical direction.
Here, represents height where the real poles meet , and the image poles , meet, distance between real poles , , distance between the actual pole and the image pole , point where you want to know the electric field intensity which will be located in the coordinated , that represent the horizontal and vertical axes respectively, distance between real poles , to point , distance between image poles , to point ; all distances are considered in meters.
Initially, the Maxwell potential matrix is obtained; for monopolar and bipolar lines, the rank of the matrix will depend on the number of conductors per pole , and in this way we will have on order of , which is expressed through Equation (1) [20,21,22].
The elements of the main diagonal are formed by the Maxwell potential own self of the pole conductor, and it is determined through Equation (2) [23].
represents the Maxwell potentials own self for the conductor per pole and is expressed in units of , represents the electrical permittivity constant of vacuum. It has a value of , conductor radius per pole, and in the case that the pole is constituted by an arrangement of multiple conductors, the equivalent radius is considered, which is determined by means of Equation (3) [23].
Here, is the equivalent radius of the pole conductor’s arrangement expressed in , is the separation between the conductors that make up the arrangement, and number of conductors that exist in the arrangement.
The Maxwell potentials that lie outside the main diagonal correspond to the potential between conductors , and are determined by means of Equation (4).
it is the Maxwell potential between the pole and real, expressed in . The distances and are determined with Equations (5) and (6) respectively.
The coordinates , represent the horizontal and vertical coordinates of the real pole , the coordinates , represent the horizontal and vertical coordinates of the image pole , while the coordinated , represent the horizontal and vertical coordinates of the real pole , all units of the coordinates are expressed in .
Once the Maxwell potential matrix has been obtained, the electric voltage matrix is obtained, the electrical voltage of the pole will be considered positive when it is evaluated at the positive pole and negative when the negative pole is considered. Its expression will be as shown in Equation (7), in units of [20].
The next step is obtaining the matrix of electric charges which is expressed in , which is obtained starting from Equation (8).
Once the electric charge matrix is obtained, the electric field intensity can be obtained, which is represented by its components respectively. The calculation of the electric field intensity is determined at any point within the transmission corridor of the line, for it a point must be set, in this way the electric field intensity is in function of the location of that point. The calculation of the electric field intensity is determined with Equations (9) and (10) respectively and will be expressed in .
The distances and are determined from Equations (11) and (12) respectively [24].
The coordinates , represent the horizontal and vertical coordinates of the image pole ; these coordinates are expressed in .
The calculated electric field intensity at any point on the transmission corridor, will present horizontal and vertical components , which are obtained from Equations (13) and (14) respectively [25].
The total electric field intensity at the measurement point is obtained by applying Equation (15) [19].
The IEEE standard recommends that calculations of electric field strength and magnetic flux density be performed at a height of 1 m above ground level within the transmission line corridor to standardize measurements and facilitate comparison of results between studies [26].
It should be noted that the representation of energized conductors through equivalent line-charge distributions constitutes a macroscopic modeling abstraction commonly used in transmission-line electromagnetic field assessment. These equivalent charges are introduced to reproduce the electric field associated with conductor voltage levels and boundary conditions, and do not represent a physical net charge imbalance within the conductors.
2.2. Methodology for Calculating Magnetic Flux Density in Hybrid Transmission Lines
This methodology is an expanded version of our article presented in Energies 2025, 18, 5022 [27]. The proposed methodology allows determining the magnetic flux density components within the corridor of an HVDC and HVAC transmission line. This calculation is based on the geometric configuration of the line, the corridor length, the number of conductors per pole, the radius of the conductors, and the nominal operating voltage level.
The above assumptions imply that the same condition will be maintained along the entire transmission line. The electric current density for monopolar and bipolar lines is initially determined using Equations (16) and (17).
The total magnetic flux density is obtained as the superposition of contributions from the HVAC three-phase currents and the HVDC pole currents.
For the HVAC system, the magnetic field contribution is evaluated considering balanced three-phase currents with a phase displacement of 120°. The total AC magnetic flux density is obtained from the vector superposition of the instantaneous contributions of the three phase conductors. In the present study, the reported magnetic-field values correspond to the maximum magnitude of the resulting time-varying magnetic flux density over one electrical cycle.
where denotes the electric current flowing through the pole, expressed in , corresponds to the transmitted power, measured in and represents the nominal pole voltage, in .
For the bipolar HVDC configuration, the transmitted power is assumed to be equally shared between the positive and negative poles; therefore, the current per pole is calculated as half of the total transmitted power divided by the pole voltage.
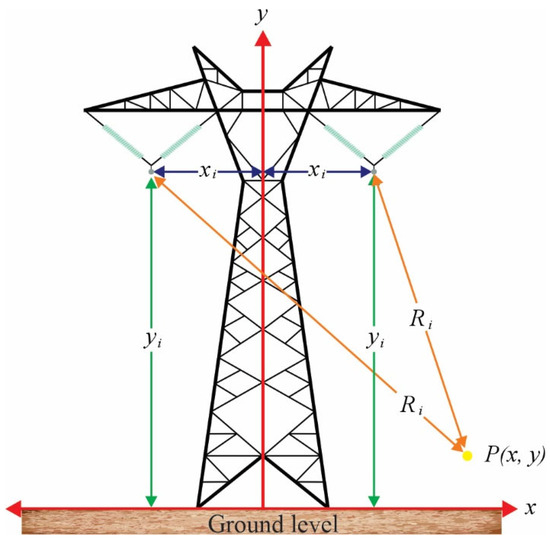
The methodology considers various variables; these are presented in Figure 2.
Figure 2.
Geometric definition of variables. Reproduced from Ref. [27] under the Creative Commons Attribution (CC BY 4.0) license.
Here, corresponds to the height of the pole conductor, and represents the horizontal distance from said pole to the central axis of the tower. Point , at which the magnetic flux density is to be evaluated, is located at the coordinates (, ), corresponding to the horizontal and vertical axes, respectively. The distance is defined as the separation between the pole and point . All distances are expressed in meters.
Once the electric current at the pole is determined, the magnetic flux density can be calculated, which is expressed by its components and , respectively. The magnetic flux density is calculated at any point along the transmission line corridor. To do this, a point is defined, so that the magnetic flux density is defined based on the location of that point.
This density is determined using Equations (18) and (19) and is expressed in [28].
where represents the vacuum magnetic permeability constant, which has a value of .
The distance , in turn, is determined from Equation (20).
The magnetic flux density calculated at a point P within the transmission line corridor exhibits two components: a horizontal component and a vertical component , which are obtained from Equations (21) and (22), respectively [28,29].
where represents the number of poles present on the transmission line.
The total magnetic flux density at the measurement point is obtained by applying Equation (23), which considers the combined contribution of all poles to the magnetic field at that point [27].
3. Results
3.1. Case Study 1
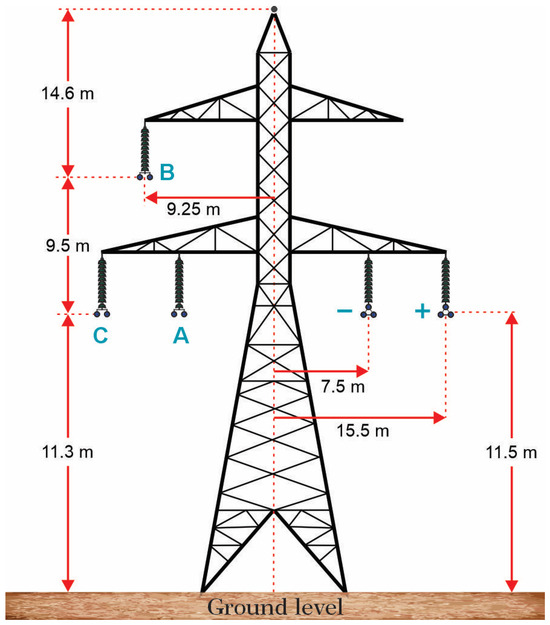
To demonstrate the application of the proposed methodology for calculating electric field magnitude and magnetic flux density in hybrid corridors, a representative configuration of a hybrid HVAC–HVDC overhead transmission line was analyzed. The geometric arrangement of the conductors was defined based on the profile reported in [30], which represents a structure shared by a three-phase AC circuit and a two-phase DC circuit. This configuration is suitable for evaluating electromagnetic behavior in hybrid arrangements, as it allows for the simultaneous study of the contribution of AC phases, DC poles, and ground wire within the same right-of-way.
These configurations are not intended to replicate a specific real-world installation but to provide a controlled and representative framework for evaluating the influence of geometric parameters on the electromagnetic field distribution.
The hybrid line considered in this study consists of a three-phase HVAC circuit with a nominal voltage of 420 kV and a two-pole HVDC link operating at ±400 kV. A phase current of 1000 A was assumed for the AC system, while a pole current of 3000 A was considered for the DC system, representing operating conditions for high-capacity transmission lines. A subconductor radius of 0.01595 m and a subconductor spacing of 0.40 m were adopted for both systems. The HVAC circuit was modeled with an arrangement of two subconductors per phase, while the HVDC system was represented with three subconductors per pole, to realistically reproduce the typical conductor bundle configuration used in high-voltage lines. Additionally, the presence of an overhead guard wire with a radius of 0.0121 m was considered, as its inclusion allows for an accurate representation of the structure’s complete geometry and its influence on the distribution of electromagnetic fields. Together, these parameters define a representative hybrid HVAC–HVDC line configuration used to evaluate the spatial distribution of the electric field and magnetic flux density within the right-of-way.
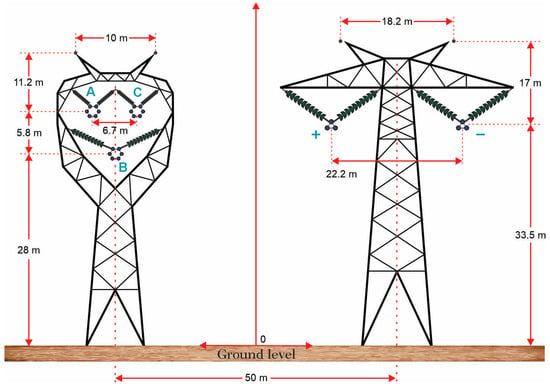
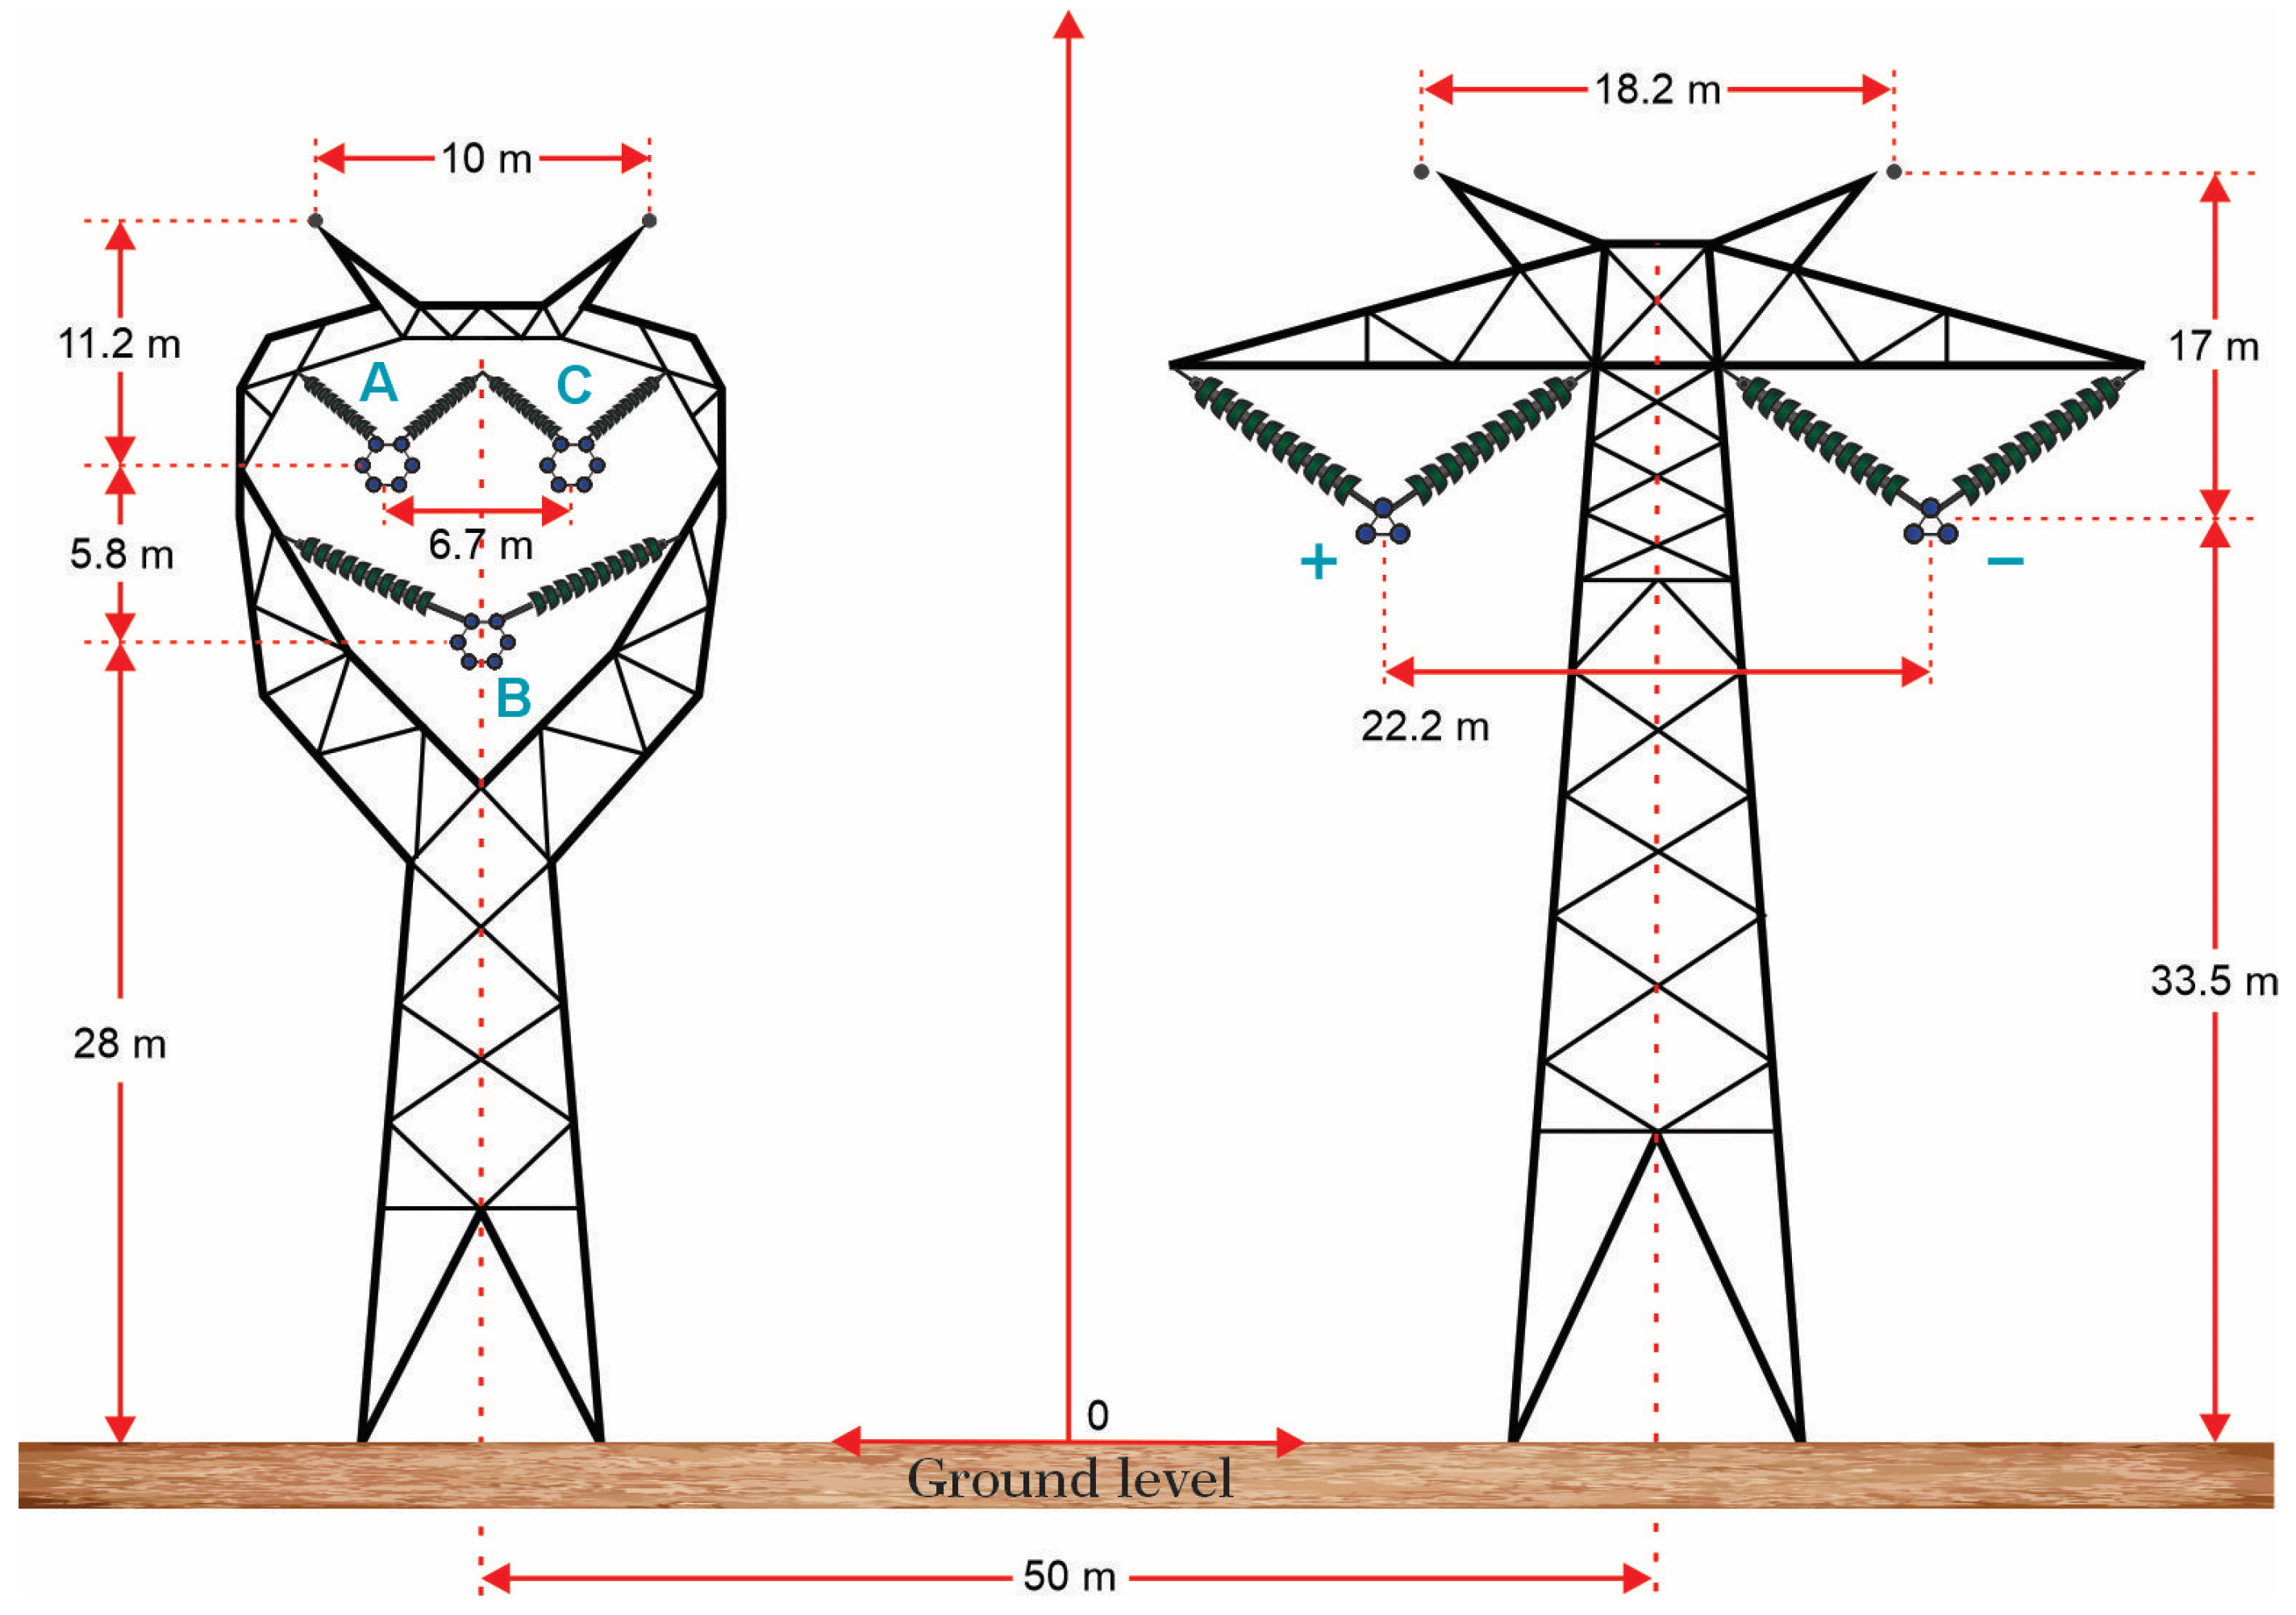
The cross-sectional geometry of the system was defined by the Cartesian coordinates of each conductor with respect to the central axis of the structure. The positions corresponding to the HVAC circuit phases, the HVDC system poles, and the ground wire were established from the geometric configuration shown in Figure 3, while their specific coordinates are presented in Table 1. This representation allows for a precise description of the spatial arrangement of the conductors within the hybrid structure and is a fundamental element for calculating the electromagnetic fields at ground level. The adopted configuration reproduces a realistic condition of coexistence between HVAC and HVDC systems installed on the same structure, allowing for a consistent analysis of the influence of the line geometry on the spatial distribution of the electric and magnetic fields within the transmission corridor.
Figure 3.
Author-developed transverse geometric model of a hybrid HVAC–HVDC transmission line used in Case Study 1, reconstructed and substantially modified based on dimensional information reported in Ref. [30].
Table 1.
Spatial coordinates of the conductors in the hybrid transmission line configuration.
To characterize the electromagnetic environment of the hybrid corridor, electric and magnetic fields were evaluated at a height of 1 m above ground level across a 120 m right-of-way. This ground-level assessment is widely used in electromagnetic compatibility studies for transmission lines, as it allows for the analysis of lateral field variations within the corridor and the evaluation of the accessible electromagnetic environment within the right-of-way. Under these conditions, the developed methodology was applied to determine the spatial distribution of the electric field and magnetic flux density generated by the simultaneous operation of the HVAC and HVDC systems installed on the same structure. This approach allows for the identification of regions with higher field intensity within the corridor and provides a consistent basis for analyzing the electromagnetic behavior of the hybrid line. The electric field results obtained using this procedure are presented and analyzed in the following subsection.
3.1.1. Electric Field Results
The magnitude of the electric field in the hybrid line was determined using the analytical methodology described in Section 2.1, based on the use of the Maxwell potential matrix and the method of images to represent the influence of the ground plane. From the line geometry, the subconductor arrangement, and the voltages assigned to each phase and pole, the electric charge densities associated with each conductor were calculated. Subsequently, these charges were used to determine the horizontal and vertical components of the electric field at evaluation points located within the right-of-way.
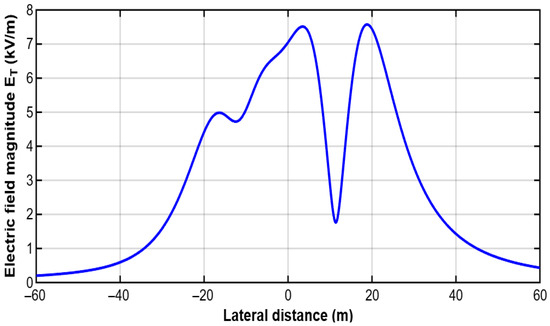
As an initial verification of the calculation procedure, the electric field was evaluated at a representative point along the corridor located at coordinate A(5,1), that is, 5 m laterally from the line axis and 1 m above ground level. At this point, the combined contribution of the HVAC circuit phases, the HVDC system poles, and the ground wire produces an electric field distribution characterized by a dominant horizontal component relative to the vertical component. The vector combination of both components results in a total electric field magnitude of 7.3114 kV/m, which is consistent with the expected order of magnitude for high-voltage hybrid transmission configurations and illustrates the application of the analytical procedure at a representative observation point.
Once the model was verified for consistency at this reference point, the calculation was extended across the entire 120 m right-of-way to obtain the lateral profile of the electric field magnitude within the hybrid corridor. This analysis allows for the identification of regions with the highest field intensity at ground level and the evaluation of the influence of the conductors’ geometric arrangement on the corridor’s electromagnetic environment. The resulting profile of the total electric field magnitude is shown in Figure 4.
Figure 4.
Lateral profile of the electric field magnitude across the hybrid HVAC-HVDC transmission corridor.
3.1.2. Magnetic Field Results
The magnetic flux density generated by the hybrid line was determined using the analytical methodology described in Section 2.2, which is based on the application of the Biot–Savart law to estimate the magnetic contribution of each conductor as a function of the current flowing through it and its geometric position within the structure.
In the considered configuration, the HVAC system was represented by balanced three-phase currents under steady-state conditions. In the HVAC subsystem, the three-phase currents were treated as balanced sinusoidal quantities with a 120° phase displacement, and their magnetic contributions were combined through time-dependent vector superposition. The HVDC system was modeled using constant currents of equal magnitude and opposite direction in each pole.
Under these conditions, the total magnetic flux density at each point of the corridor was obtained from the vector sum of the individual contributions generated by the phases of the HVAC circuit, the poles of the HVDC system, and the ground wire.
In the evaluated configuration, the total magnetic field results from the superposition of a time-varying HVAC contribution and a steady HVDC contribution. Owing to the higher current magnitude in the DC poles, the HVDC subsystem tends to dominate the total magnetic flux density in regions close to the DC conductors, while the HVAC subsystem introduces phase-dependent spatial modulation.
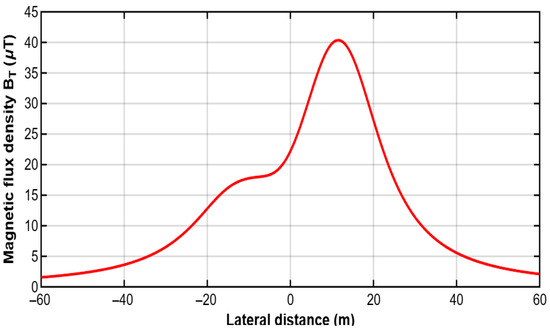
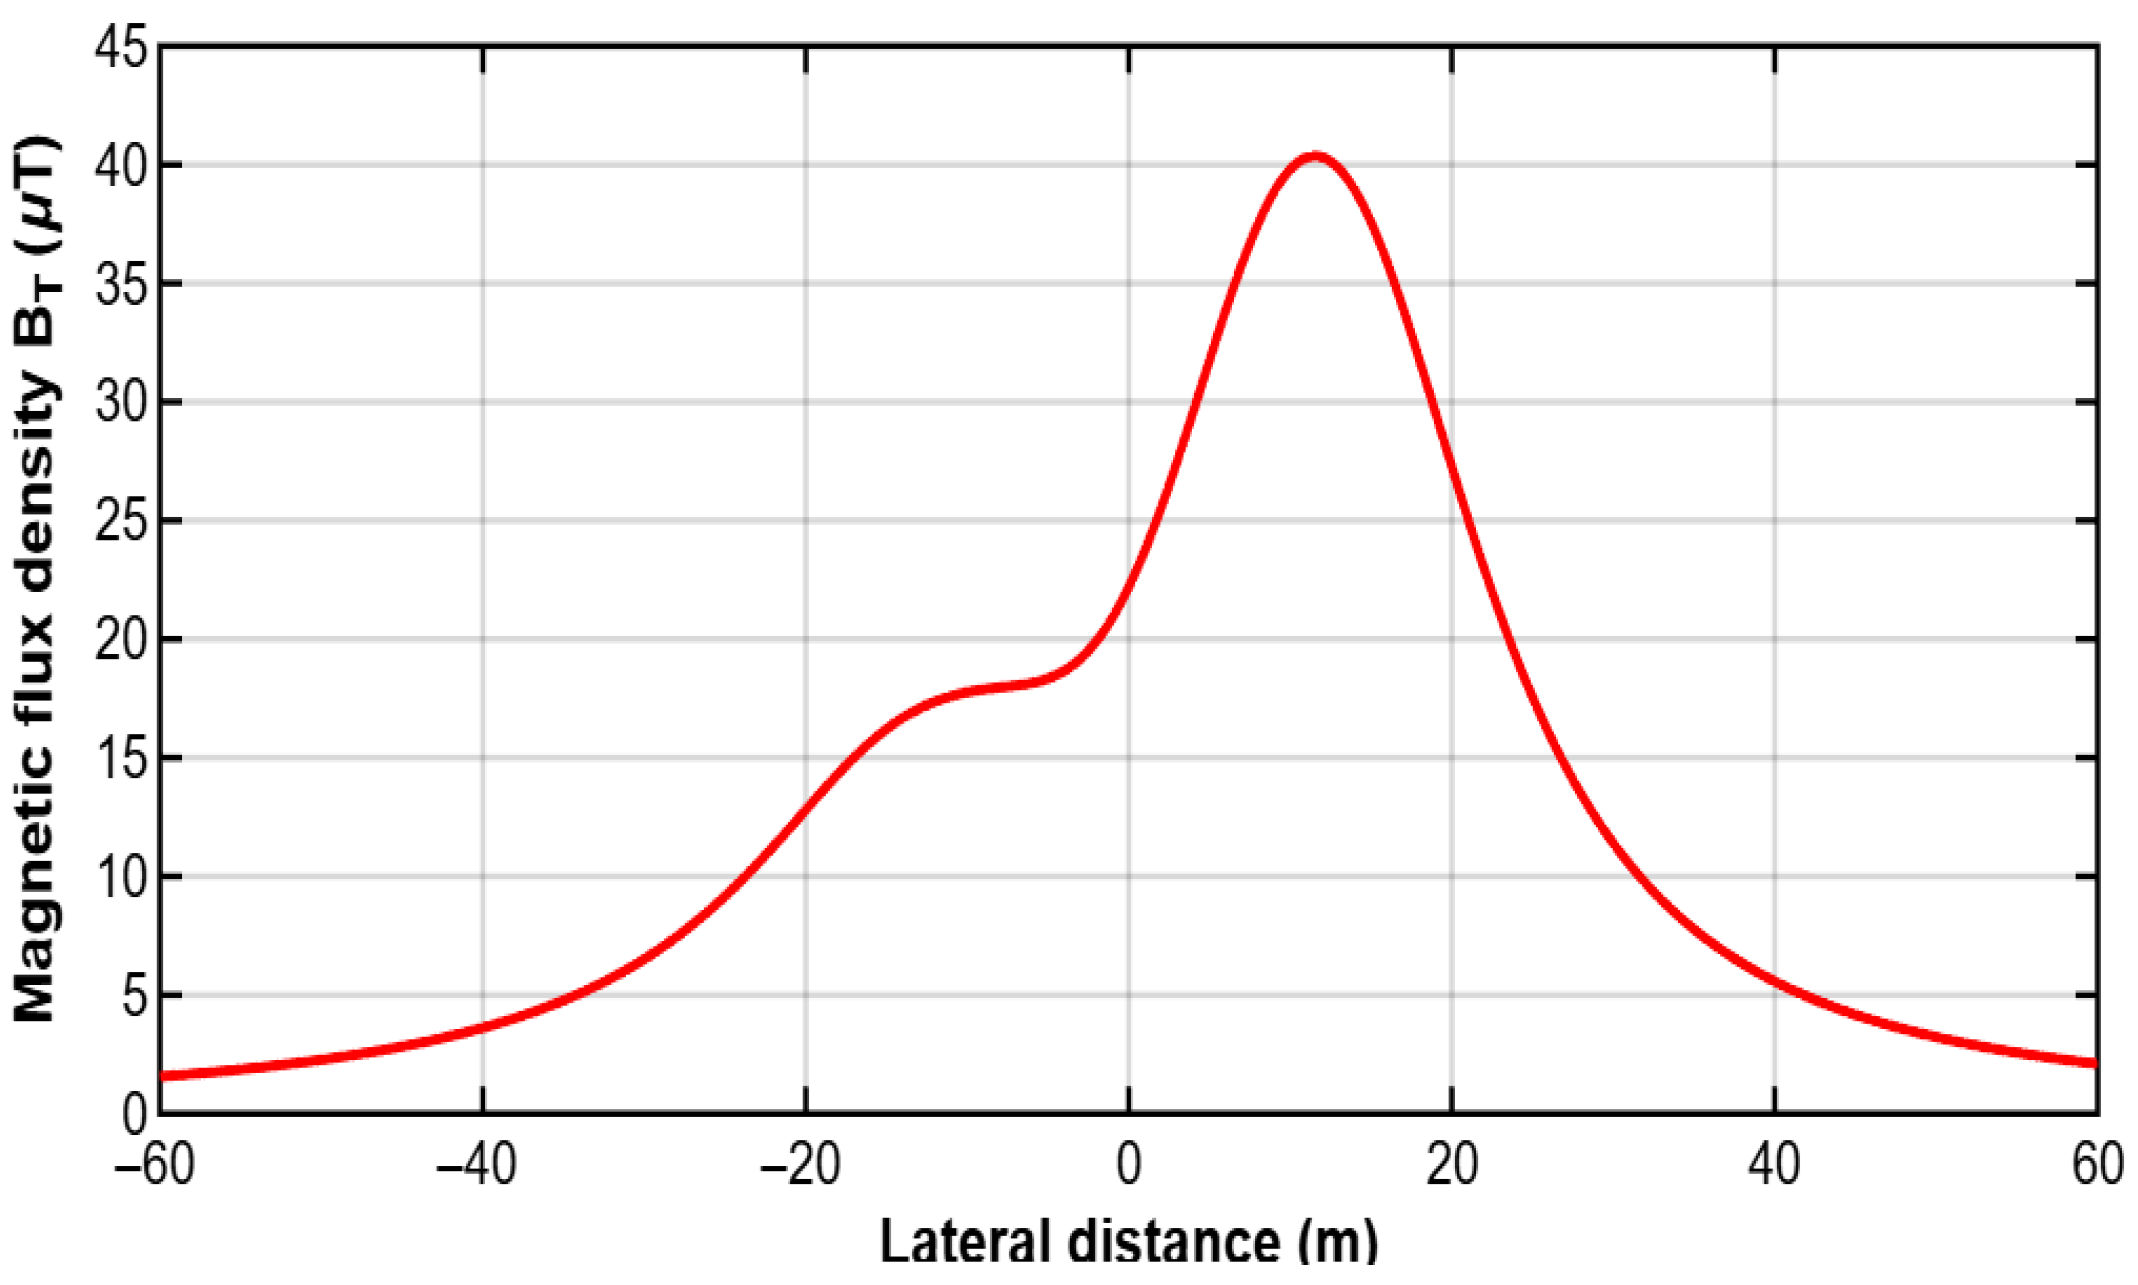
As an initial verification of the calculation procedure, the magnetic field was evaluated at a representative point along the corridor located at coordinate A(−11,1), corresponding to a lateral position of −11 m relative to the line axis and a height of 1 m above ground level. At this point, the horizontal and vertical components of the magnetic field were determined from the contributions of the HVAC phases and the HVDC pole currents. The vector combination of these contributions resulted in a total magnetic flux density of 17.5935 μT, which is consistent with the expected order of magnitude for hybrid HVAC–HVDC transmission environments and reflects the combined contribution of the AC and DC subsystems at the selected observation point.
Once the model was verified for consistency at this reference point, the calculation was extended across the entire 120 m right-of-way to obtain the lateral profile of the magnetic flux density within the hybrid corridor. This analysis allows for the evaluation of the spatial variation in the magnetic field at ground level and the identification of regions of higher intensity associated with the proximity of energized conductors. The resulting distribution reflects the overlap of the magnetic contributions from the three-phase HVAC system and the bipolar HVDC system, generating a spatial pattern characteristic of hybrid corridors. The resulting magnetic flux density profile across the right-of-way is shown in Figure 5.
Figure 5.
Lateral profile of the magnetic flux density across the hybrid HVAC-HVDC transmission corridor.
3.2. Case Study 2
This configuration allows the effect of geometric variation to be isolated without introducing additional variability associated with site-specific conditions.
To further validate the proposed methodology and analyze the influence of geometric configuration on the electromagnetic behavior of hybrid HVAC–HVDC corridors, a second overhead transmission line scenario was considered. In this case, the transverse arrangement of the conductors was modified compared to Case Study 1, while maintaining constant electrical operating conditions. This strategy allows for the evaluation of the effect of the structure’s geometry on the spatial distribution of electric and magnetic fields at ground level, isolating the impact of the geometric variation on the system’s electrical parameters.
As in the previous scenario, the analyzed hybrid line consists of a three-phase HVAC circuit with a nominal voltage of 420 kV and a two-pole HVDC link operating at ±400 kV. For the AC system, a phase current of 1000 A was considered, while for the DC system, a pole current of 3000 A was assumed—conditions representative of high-capacity transmission lines. Likewise, the same geometric parameters associated with the subconductor array were maintained: a subconductor radius of 0.01595 m and a subconductor spacing of 0.40 m. The HVAC circuit was modeled using an array of two subconductors per phase, while the HVDC system was represented by three subconductors per pole. Similarly, an upper guard wire with a radius of 0.0121 m was included to represent the complete configuration of the structure and its influence on the electromagnetic environment of the corridor.
The cross-sectional geometry of the system was defined using the Cartesian coordinates of each conductor with respect to the central axis of the structure. In this second scenario, the relative position of the HVAC circuit phases and the HVDC system poles was modified to analyze how changes in the spatial arrangement of the conductors can alter the distribution of electromagnetic fields within the right-of-way. The schematic representation of the hybrid structure under consideration is shown in Figure 6, while the coordinates corresponding to this configuration are presented in Table 2.
Figure 6.
Author-developed transverse geometric model of the hybrid HVAC–HVDC transmission corridor used in Case Study 2, adapted from Ref. [31], reprinted with permission from IEEE.
Table 2.
Cartesian coordinates of conductors for the hybrid transmission line for case study 2.
It should be noted that the guard wire positions are idealized for analytical purposes and are intended to evaluate their influence on the electromagnetic field distribution, rather than to represent a specific tower design.
To ensure comparability between the two scenarios, the electromagnetic field evaluation was performed under the same analytical conditions used in Case Study 1. Specifically, the electric and magnetic fields were calculated at a height of 1 m above ground level across a 120 m right-of-way. This evaluation condition allows for the analysis of lateral variations in the electromagnetic environment within the hybrid corridor and is a common reference point in electromagnetic compatibility studies for transmission lines. Based on these premises, the analytical methodology developed was applied again to determine the spatial distribution of the electric field and magnetic flux density generated by the new geometric configuration of the hybrid line.
3.2.1. Electric Field Results
The electric field distribution for Case Study 2 was obtained by applying the analytical methodology described in Section 2.1. In this scenario, the calculation was performed considering the new geometric arrangement of the conductors within the hybrid structure, keeping the electrical operating conditions defined for Case Study 1 constant. Under these conditions, the horizontal and vertical components of the electric field were determined at evaluation points located within the right-of-way, which allowed analysis of the effect of geometric modification on the spatial distribution of the electric field at ground level.
The magnitude of the electric field was evaluated across the right-of-way considering an observation line located 1 m above ground level. From the new geometric arrangement of the conductors, the horizontal and vertical components of the electric field were determined at different points across the corridor, allowing analysis of the lateral variation in the field and the effect of the hybrid configuration on its spatial distribution.
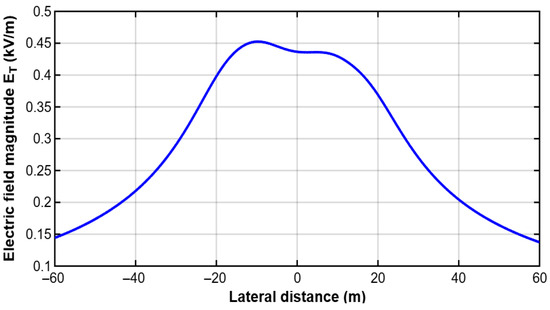
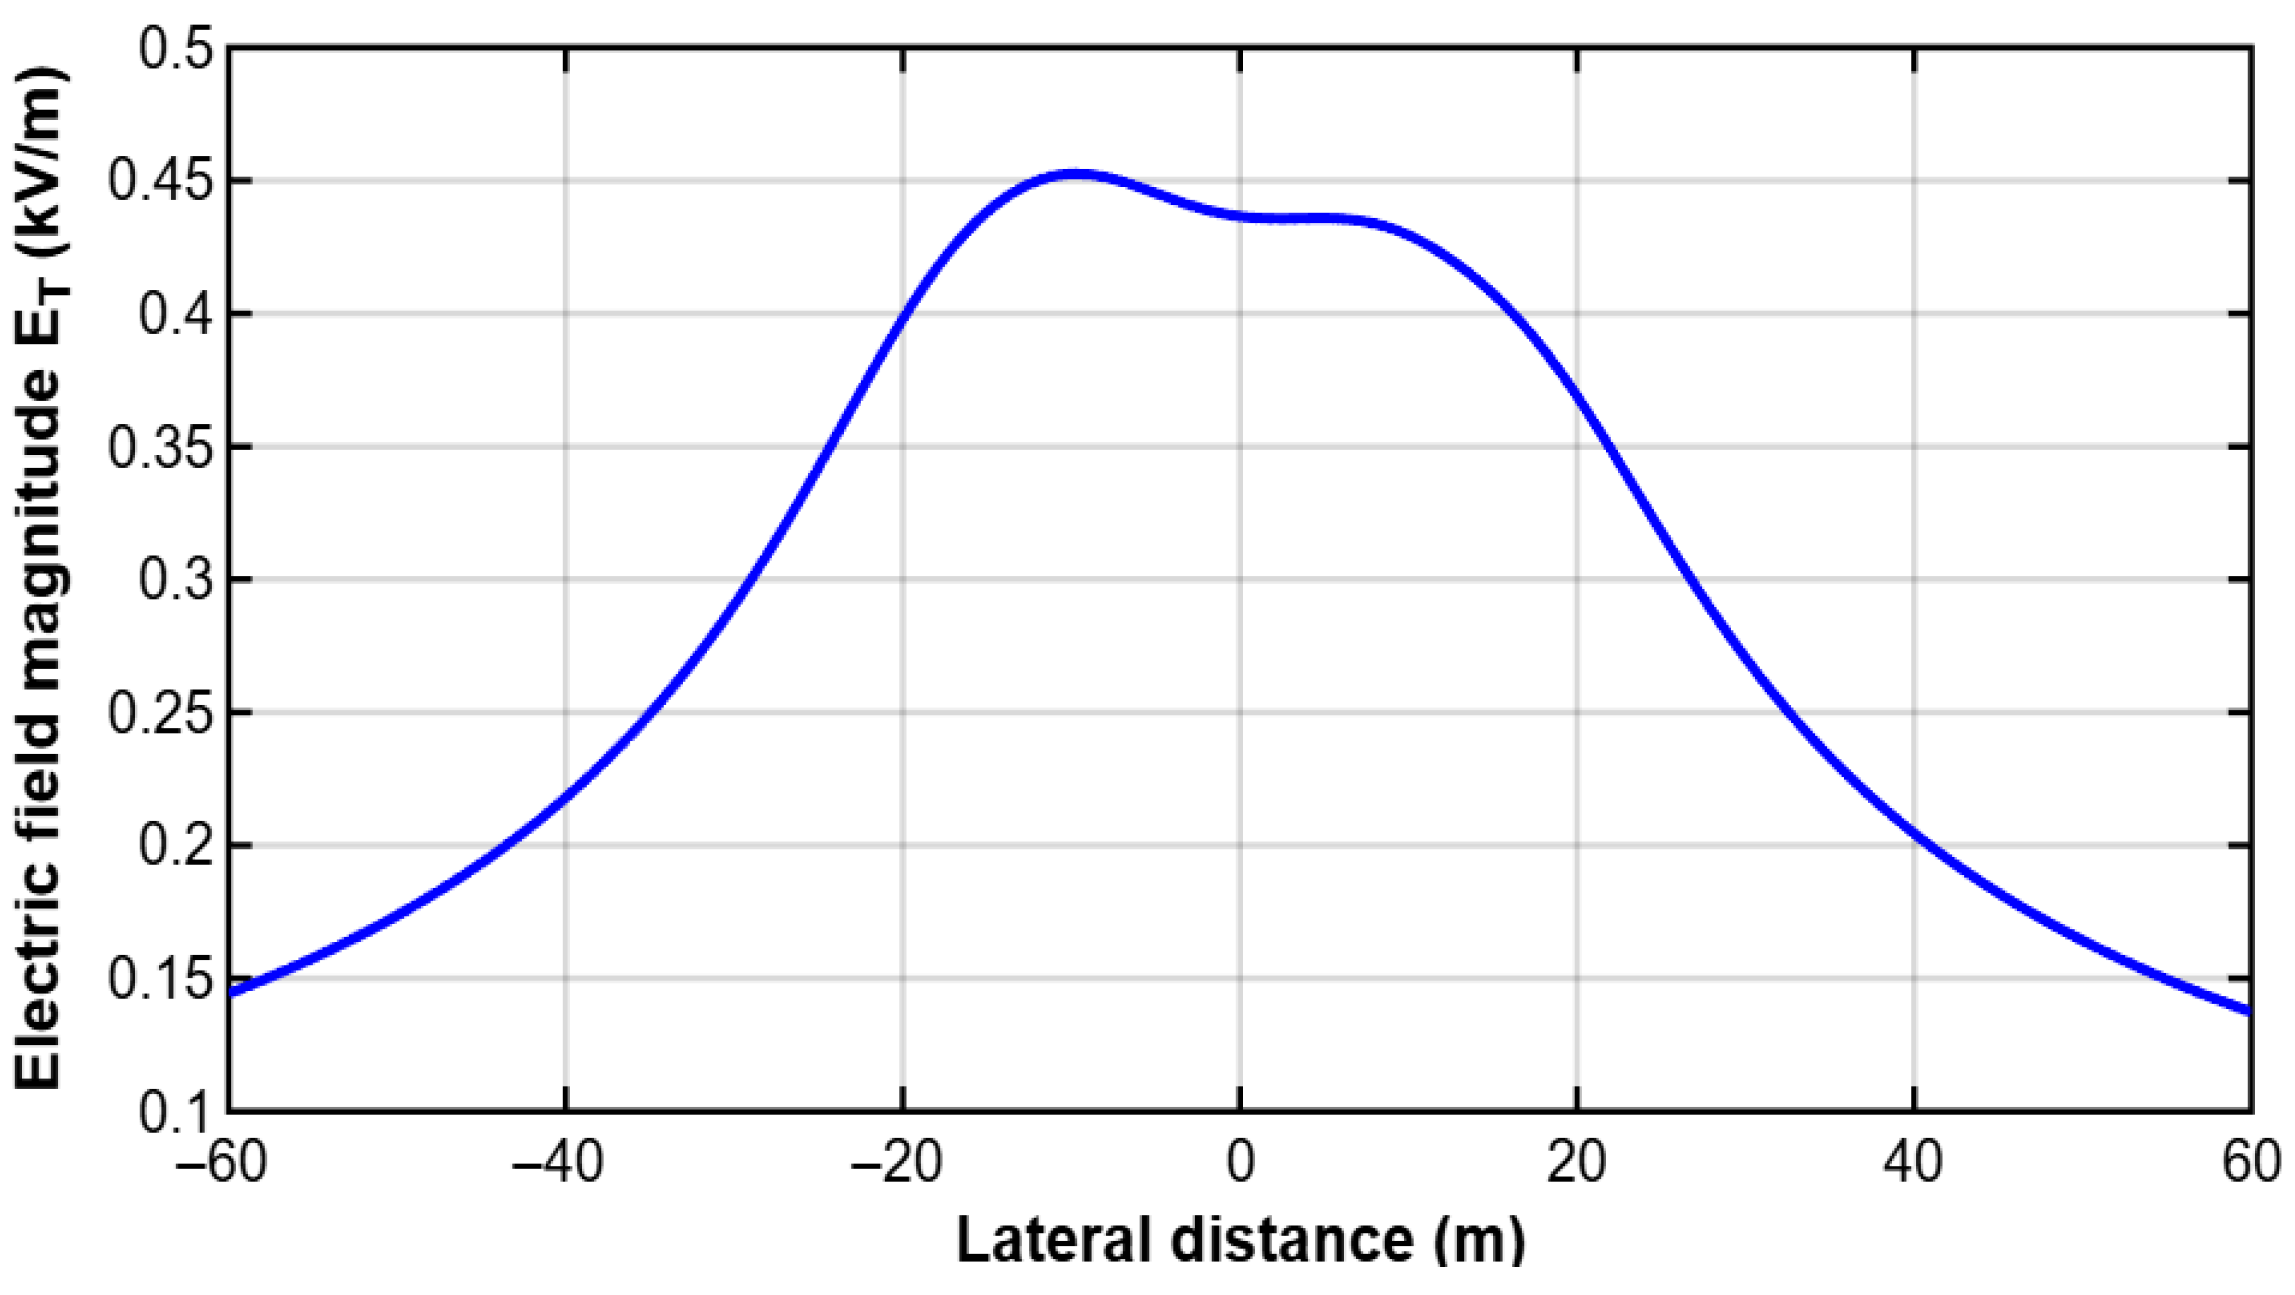
The lateral profile of the electric field magnitude across the right-of-way was obtained considering the new geometric arrangement of the conductors. The results demonstrate the direct influence of the line’s transverse configuration on the spatial distribution of the electric field within the hybrid corridor. By modifying the relative position of the HVAC circuit phases and the HVDC system poles, a shift is observed in the regions of highest electric field intensity with respect to the structure’s axis. This behavior confirms that the line’s transverse geometry is a determining factor in the spatial distribution of the electric field in hybrid HVAC–HVDC corridors. The lateral profile of the total electric field magnitude is shown in Figure 7.
Figure 7.
Lateral profile of the electric field magnitude across the hybrid HVAC-HVDC transmission corridor (case study 2).
3.2.2. Magnetic Field Results
The magnetic flux density for case study 2 was determined using the methodology described in Section 2.2, considering the new geometric arrangement of the conductors within the hybrid structure. In this scenario, the HVAC system was represented by balanced, steady-state three-phase currents, while the HVDC system was modeled by constant currents of equal magnitude and opposite direction at each pole. Under these conditions, the total magnetic flux density at each point in the corridor was obtained from the vector superposition of the individual contributions generated by the phases of the HVAC circuit and by the poles of the HVDC system.
The lateral profile of the magnetic flux density was evaluated across the right-of-way, considering an observation line located 1 m above ground level. The results obtained allow for the analysis of the spatial variation in the magnetic field within the hybrid corridor and the evaluation of the effect of geometric modification on the field distribution. In particular, the new arrangement of the HVAC system phases and the HVDC poles produces a displacement in the regions of highest magnetic intensity relative to the structure’s axis.
This behavior reflects the direct dependence of the magnetic field on the magnitude of the current flowing through the conductors and on the distance between them and the point of observation. In hybrid HVAC–HVDC corridors, the interaction between the three-phase currents of the HVAC system and the direct currents of the HVDC system generates a characteristic spatial distribution of the magnetic field, where the contribution of the HVDC poles can be dominant in certain regions of the corridor due to the high current levels associated with this type of connection.
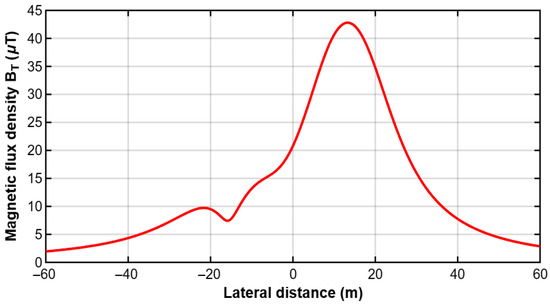
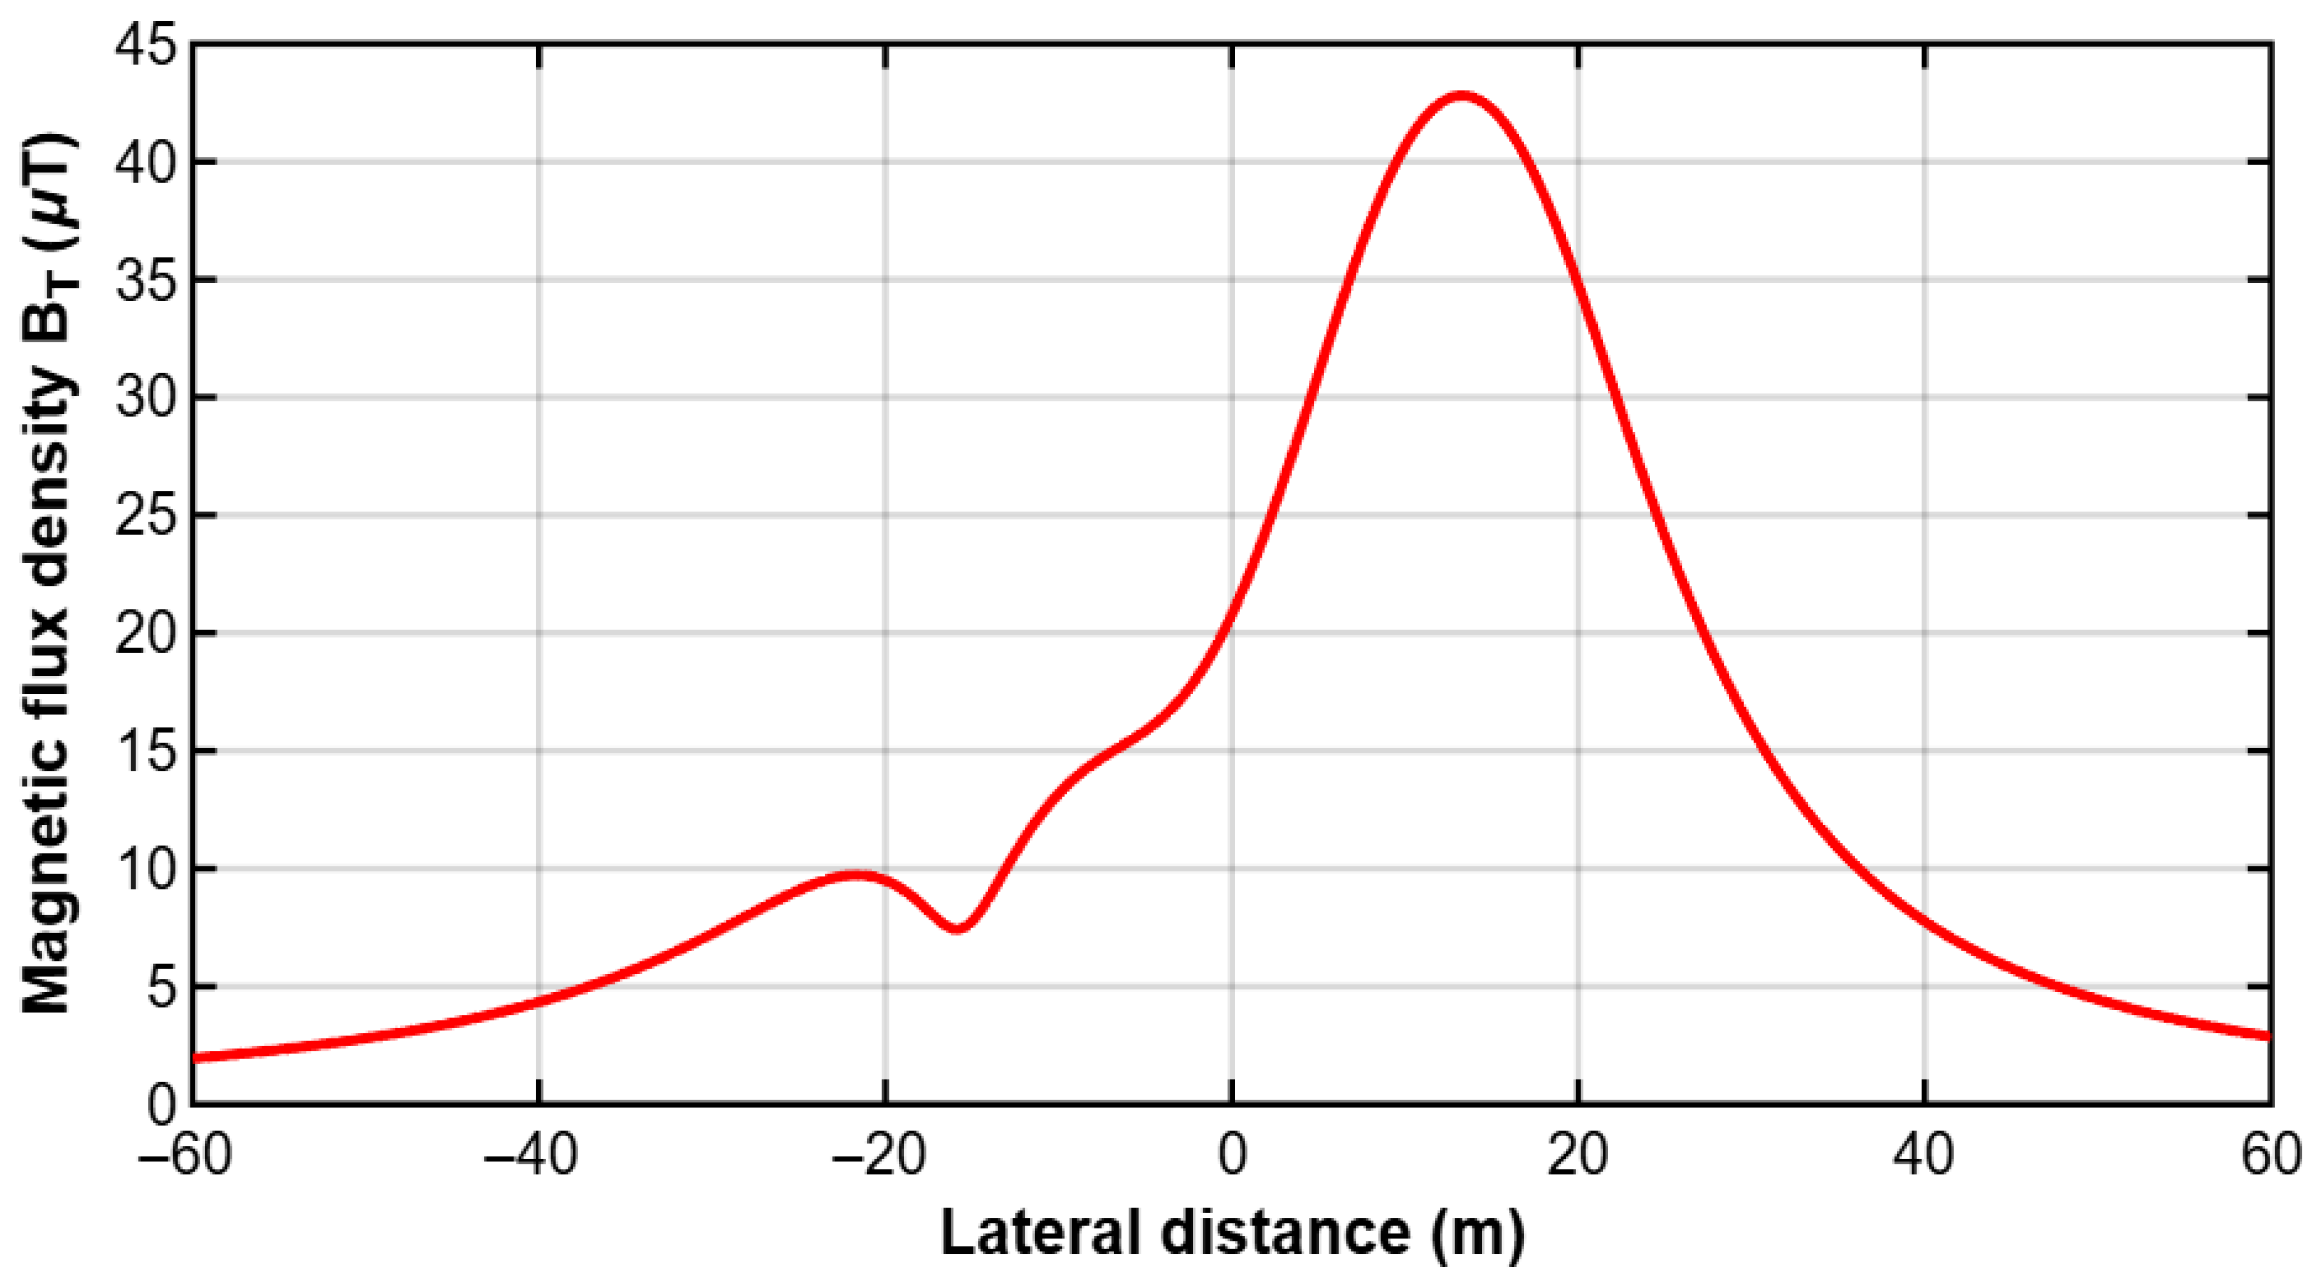
The lateral profile of the magnetic flux density corresponding to case study 2 is presented in Figure 8, where the variation in the magnetic field across the right-of-way under the new geometric configuration of the hybrid line can be observed.
Figure 8.
Lateral profile of the magnetic flux density across the hybrid HVAC-HVDC transmission corridor (case study 2).
4. Discussion
The results obtained for the analyzed hybrid HVAC–HVDC transmission configurations demonstrate that the spatial distribution of electromagnetic fields within the corridor is governed by the superposition of quasi-static electric and magnetic field contributions associated with conductor voltage levels, current magnitudes, and relative geometric positioning. Although the electrical operating conditions were maintained constant in both case studies, modifications in the transverse arrangement of conductors produced noticeable redistribution of field maxima across the right-of-way, highlighting the sensitivity of ground-level electromagnetic exposure to structural design variables in shared transmission corridors.
While partial magnetic field cancellation occurs in balanced three-phase HVAC systems, this effect is modified in hybrid HVAC–HVDC configurations due to the presence of DC components and asymmetrical conductor arrangements.
From an electromagnetic interaction perspective, the electric field behavior is primarily influenced by the potential distribution imposed by the energized conductors and by capacitive coupling mechanisms between adjacent AC and DC circuits. Variations in lateral spacing and conductor elevation modify the equipotential field pattern, resulting in spatial shifts in local maxima and changes in the field decay gradient across the corridor. This confirms that conductor geometry plays a key role in defining the quasi-electrostatic environment associated with hybrid transmission systems.
In contrast, the magnetic flux density distribution is more directly related to the magnitude and phase relationship of the currents flowing through the conductors, as well as to the lateral distance between the observation point and each current source. In hybrid corridors, the contribution of HVDC pole currents may become dominant in specific regions due to their relatively high magnitude and unidirectional nature, while balanced three-phase HVAC currents introduce a spatial modulation effect that may partially attenuate or redistribute the resulting magnetic field profile. Consequently, even moderate geometric modifications can produce measurable changes in the location and extent of the main magnetic-field peaks across the corridor.
From this perspective, the total magnetic field in hybrid corridors should be interpreted as the result of two physically different components: a static or quasi-static contribution from the HVDC poles and a time-varying contribution from the balanced three-phase HVAC system. The relative importance of each component depends on conductor position, current magnitude, and the observation point.
Furthermore, the combined presence of HVAC and HVDC circuits produces a superimposed magnetic field pattern whose spatial characteristics depend on conductor geometry and current distribution across the corridor. This interaction may lead to localized reinforcement or attenuation zones, particularly in regions where the contribution of HVDC pole currents becomes dominant. Consequently, the cross-sectional configuration of hybrid transmission structures can be interpreted as a relevant engineering design variable influencing magnetic field exposure conditions and overall electromagnetic compatibility performance.
Taken together, the results show that the cross-sectional configuration of the line simultaneously influences the distribution of the electric and magnetic fields within the hybrid corridor. This indicates that the structure’s geometry can be considered a relevant design parameter for evaluating the electromagnetic environment of hybrid HVAC–HVDC lines.
It is important to note that the present analytical framework does not explicitly account for corona-generated ion flow and space-charge effects, which may significantly influence the electric field distribution in high-voltage DC transmission systems, particularly under adverse weather conditions or at very high operating voltage levels. In practical hybrid HVAC–HVDC corridors, ionized particles produced by conductor surface discharge can modify the near-ground electric field magnitude and introduce additional variability associated with atmospheric conditions, conductor surface state, and environmental factors.
Additionally, the present analytical model does not explicitly account for the influence of metallic supporting structures (towers), which may locally distort or partially shield the electric field distribution in the vicinity of the corridor. Therefore, the obtained electric-field profiles should be interpreted as conductor-dominated estimations under idealized structural conditions.
Nevertheless, the quasi-static analytical approach adopted in this study allows isolating the influence of geometric configuration on the electromagnetic environment of the corridor under nominal operating conditions. The incorporation of corona-induced space-charge modelling and weather-dependent electromagnetic effects constitutes a relevant extension of the proposed methodology and represents a suitable topic for future multiphysics numerical investigations.
Although the analytical formulation developed in this study provides a consistent first-order estimation of electromagnetic field distribution in hybrid HVAC–HVDC transmission corridors, further validation through advanced numerical modelling techniques is considered a relevant step for future research. In particular, finite element method (FEM) multiphysics simulations and EMT analysis tools may enable a more detailed representation of conductor surface phenomena, space-charge dynamics, atmospheric effects, and transient operating conditions.
Such complementary approaches would allow extending the proposed methodology toward high-fidelity electromagnetic compatibility assessments and supporting optimized structural design strategies for next-generation hybrid transmission infrastructures.
Furthermore, the revised formulation establishes a clear consistency between the physical assumptions and the obtained numerical results, reinforcing the validity of the proposed analytical approach.
The proposed analytical framework is intended as a computationally efficient tool for preliminary electromagnetic assessment, complementing more detailed numerical simulation approaches.
4.1. Comparative Analysis Between Case Study 1 and Case Study 2
To explicitly identify the influence of the geometric configuration on the electromagnetic environment of the hybrid corridor, the lateral profiles of the magnitude of the electric field and the magnetic flux density obtained for case studies 1 and 2 were compared. In both scenarios, the electrical operating conditions were kept constant, so the differences observed in the comparative curves can be attributed mainly to the modification in the transverse arrangement of the phases of the HVAC system and the poles of the HVDC system.
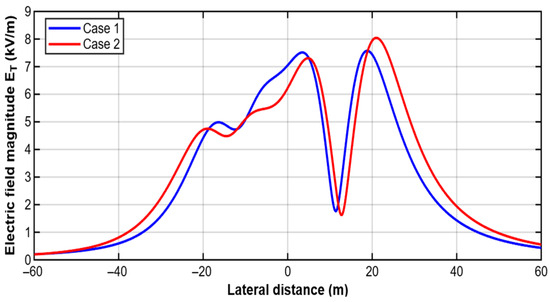
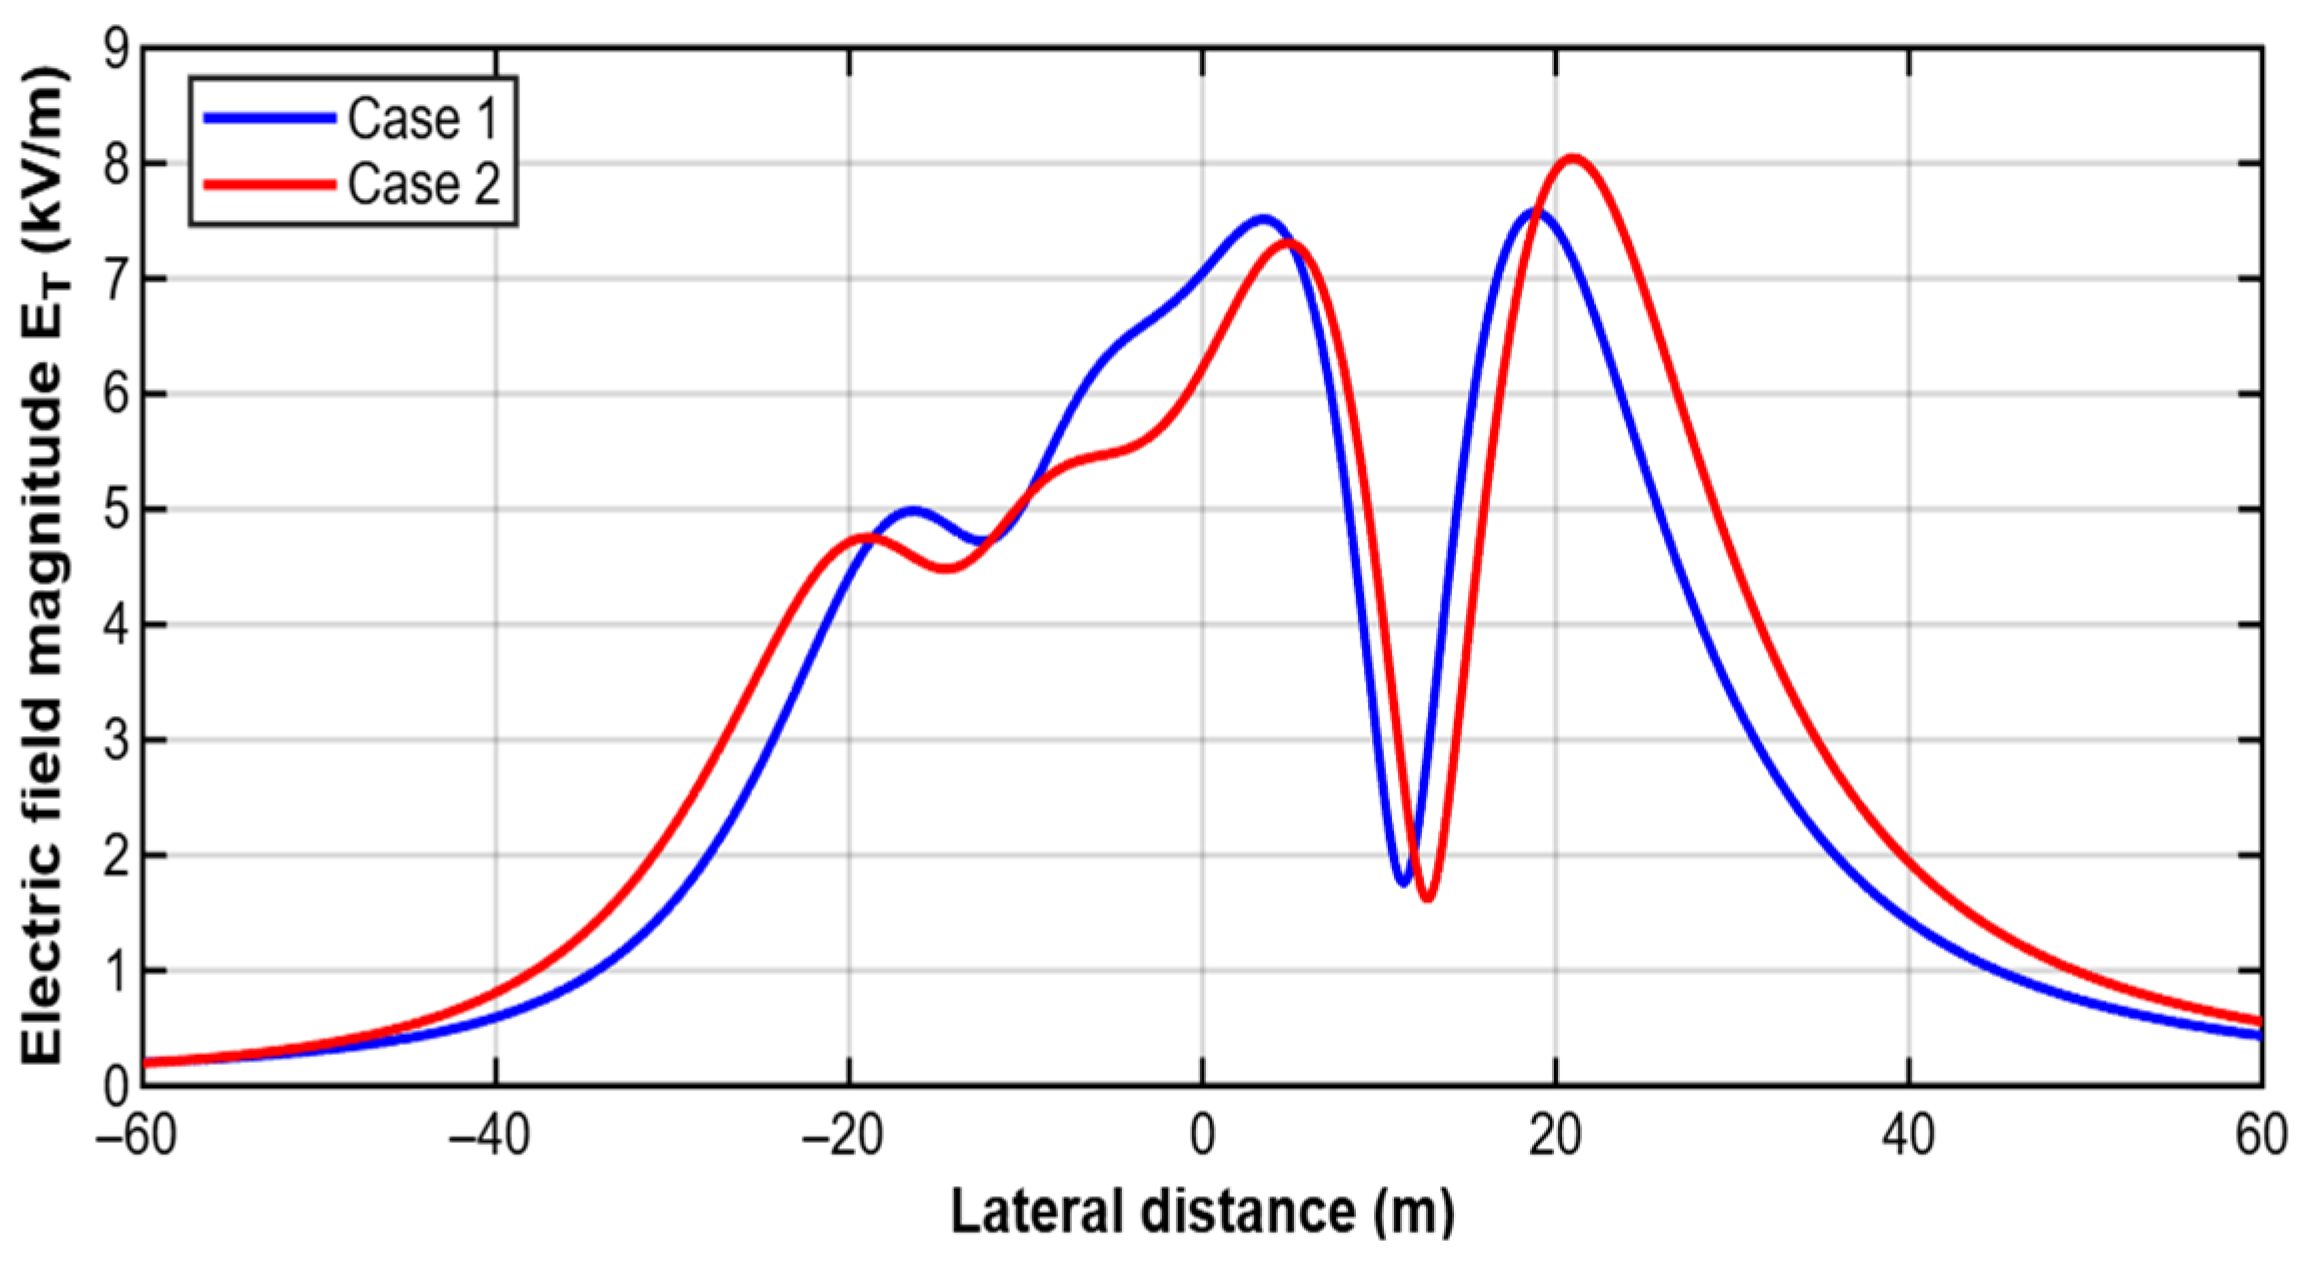
Figure 9 presents a comparison of the electric field magnitude for both case studies. In general, the two curves maintain a similar overall trend, indicating that the physical nature of the phenomenon remains constant as voltage levels and the overall composition of the hybrid array are preserved. However, the comparison reveals clear differences in the location and amplitude of the local maxima. In both cases, field elevations are observed in the left region of the corridor, a zone of pronounced increase in the central region, and a second, larger maximum in the positive region of the lateral axis. Nevertheless, in case study 2, the curve shows a shift to the right and a slightly higher maximum value in the positive region of the corridor, reaching approximately 8 kV/m, while in case study 1, the corresponding maximum is slightly lower.
Figure 9.
Comparison of the lateral profiles of the electric field magnitude for case study 1 and case study 2.
This behavior indicates that the geometric redistribution of the conductors modifies the superposition of the electrostatic contributions from the HVAC phases and the HVDC poles. In particular, the increased separation and the change in the relative location of the conductors produce a lateral translation of the regions of highest intensity and an alteration in the shape of the intermediate valleys and peaks of the electric field profile. The depression observed in both cases around the central positive region of the corridor also demonstrates that there are areas where the contributions from different conductors tend to partially reduce the resulting magnitude of the field. From a design perspective, this result is relevant because it shows that cross-sectional geometry can be used to displace or attenuate critical electric field regions within the right-of-way.
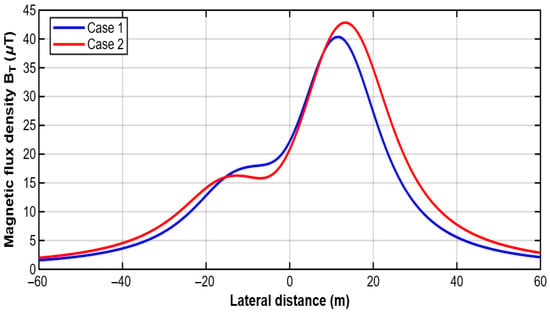
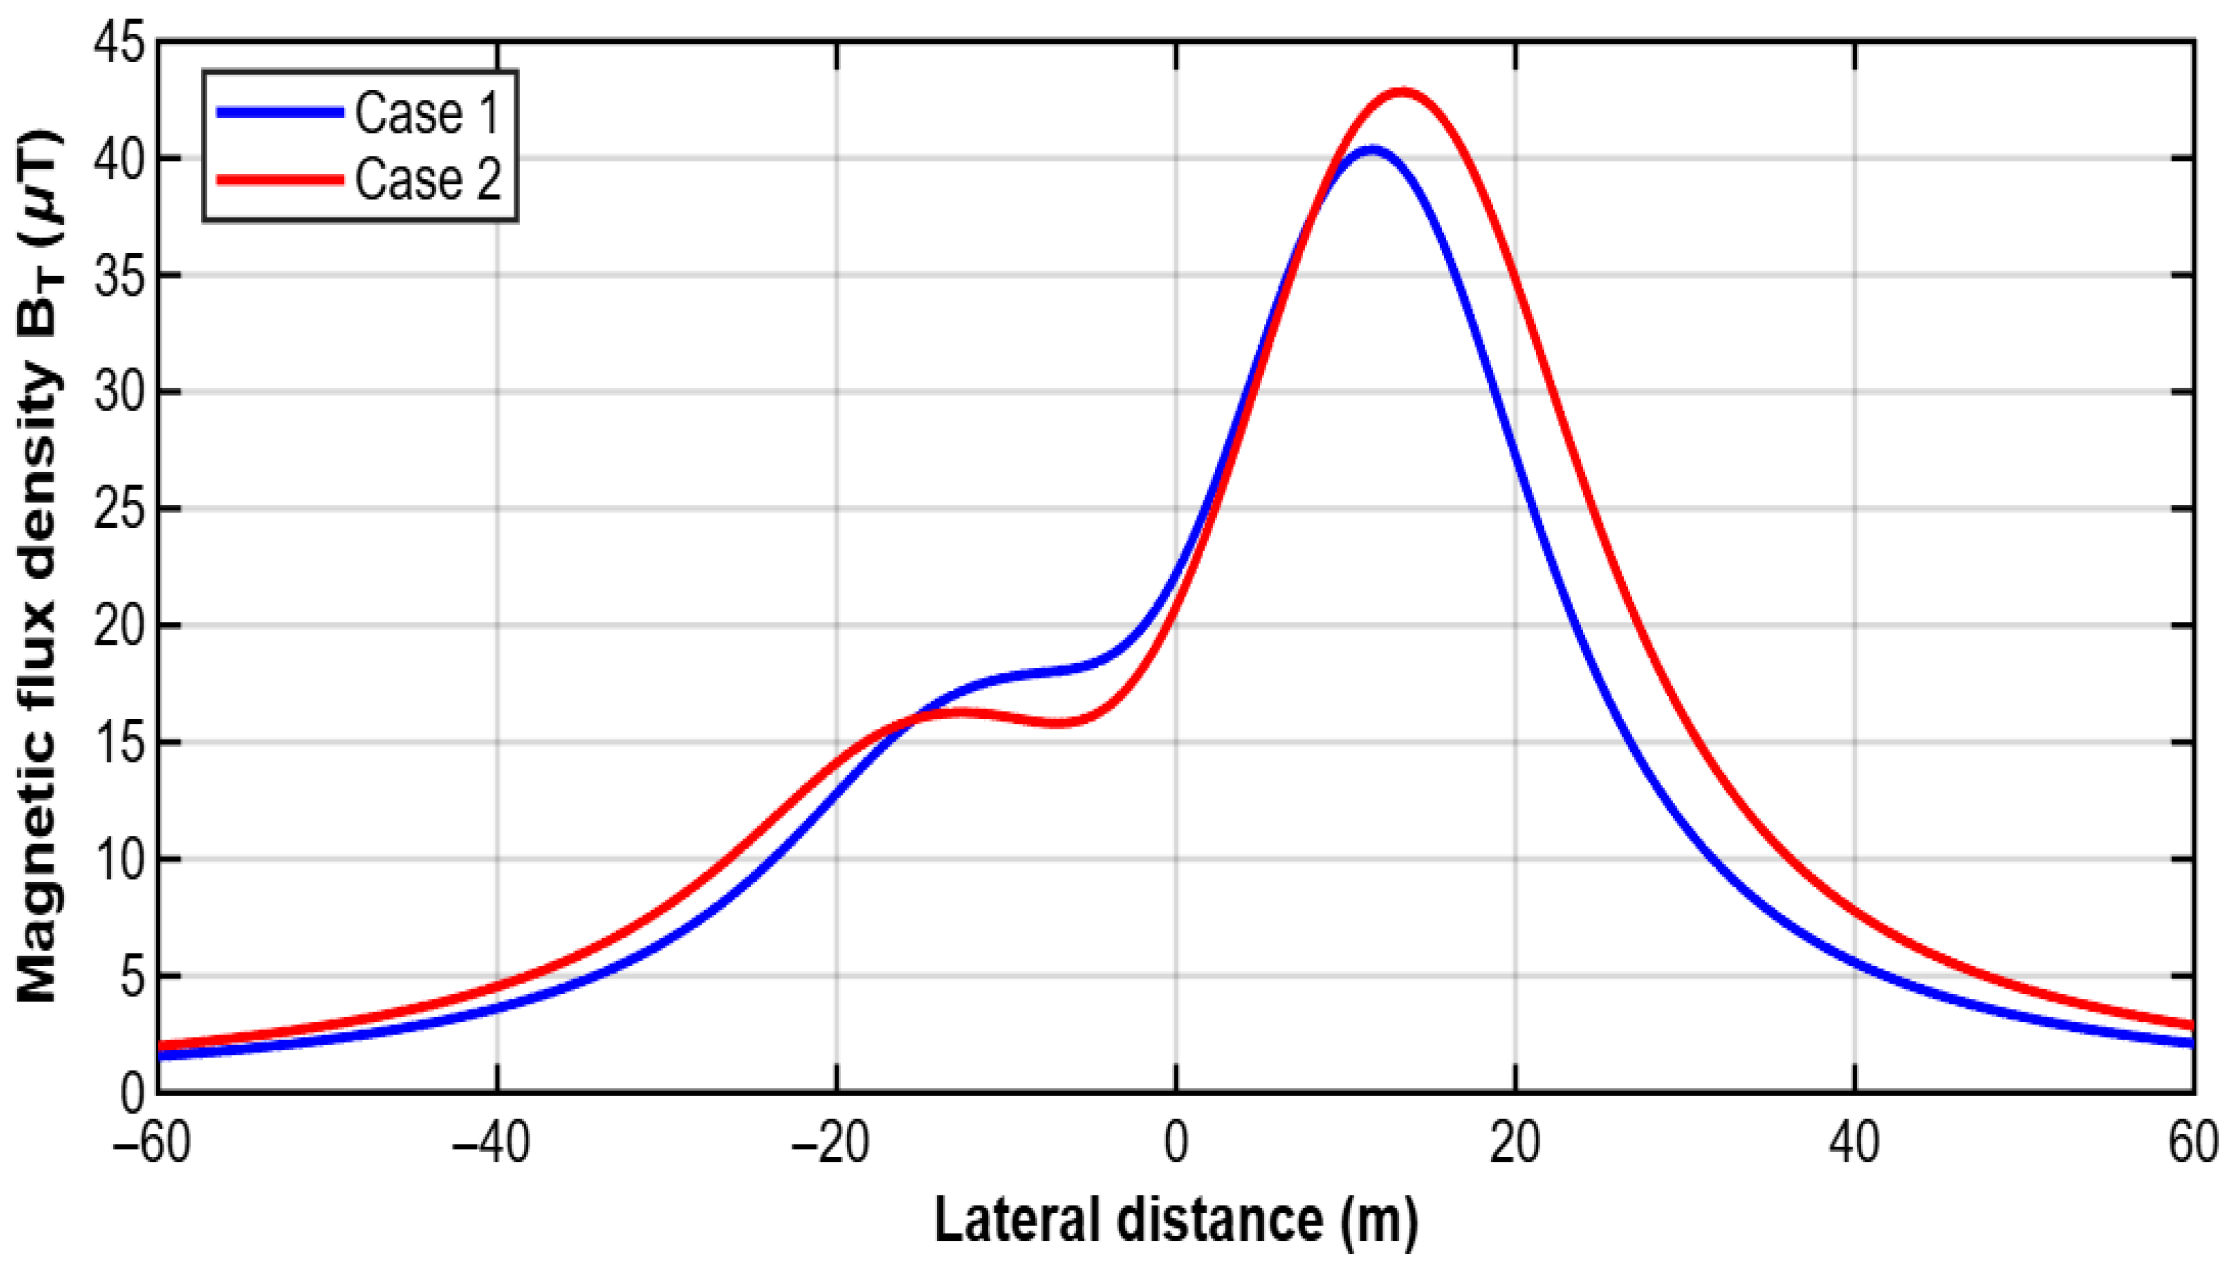
Figure 10 shows a comparison of the magnetic flux density between case studies 1 and 2. As with the electric field, both curves exhibit a similar general trend, with a gradual increase from the ends of the corridor, an intermediate zone of more moderate growth, and a main maximum located in the positive region of the lateral axis. However, the comparison reveals more marked differences in the amplitude of the main peak and in the spatial extent of the curve. In case study 2, the magnetic field maximum is slightly higher than in case study 1, with a value close to 42–43 μT compared to approximately 40–41 μT in case 1. Furthermore, the curve for case 2 shows a rightward shift and a wider decay in the positive region of the corridor, indicating a spatial redistribution of the total magnetic contribution.
Figure 10.
Comparison of the lateral profiles of the magnetic flux density for case study 1 and case study 2.
The greater sensitivity of the magnetic profile to the new geometric arrangement can be explained by the direct dependence of this field on the current magnitude and the lateral distance between conductors and observation points. Since the HVDC pole currents are considerably larger than the HVAC system phase currents, small changes in the position of these poles produce appreciable variations in the location of the main maximum and in the width of the region of highest magnetic intensity. The presence of a shoulder or secondary maximum in the negative region of the corridor, visible in both cases, also confirms that the HVAC phases continue to make a significant contribution to the overall shape of the profile, although the dominant maximum is associated with the HVDC system.
Taken together, the comparison of Figure 9 and Figure 10 demonstrates that the line’s cross-sectional configuration simultaneously affects the distribution of the electric and magnetic fields, although not with the same intensity or through the same physical mechanisms. The electric field responds primarily to the spatial distribution of potential, while the magnetic field is governed by the current distribution and lateral proximity to the conductors. This difference explains why both profiles change when the geometry is modified, but they do so with distinct patterns. While the displacement and reconfiguration of local maxima and troughs are more clearly observed in the electric field, the modification of the main peak and the extent of the HVDC system’s influence zone is more evident in the magnetic field.
From an electromagnetic design perspective, this comparison confirms that the selection of the geometry of a hybrid HVAC–HVDC line should be considered an optimization variable and not solely a structural decision. The same electrical operating conditions can produce different electromagnetic environments depending on the lateral arrangement of the phases and poles. Therefore, comparative analysis between configurations is a useful tool for identifying arrangements with better field distribution within the corridor, especially in applications where it is necessary to control ground-level exposure levels or reduce potential interactions with adjacent infrastructure.
Consequently, the comparative analysis developed in this section strengthens the contribution of this work by demonstrating that the proposed methodology is not only capable of calculating electromagnetic fields in hybrid lines, but also of quantitatively discriminating the effect of geometric changes on the corridor’s behavior. This capability expands the practical scope of the method and positions it as a useful analytical tool for the evaluation and design of hybrid HVAC–HVDC configurations under electromagnetic compatibility criteria.
4.2. Comparison with Exposure Guideline Levels
To provide practical engineering context for the calculated electromagnetic field levels, the obtained electric field magnitudes and magnetic flux density values were compared with internationally recognized exposure reference levels, such as those recommended by the International Commission on Non-Ionizing Radiation Protection (ICNIRP).
The maximum electric field levels obtained in the analyzed hybrid configurations remain within the range typically reported for high-voltage overhead transmission corridors and are generally below the reference levels adopted for public exposure under power-frequency operating conditions. Similarly, the calculated magnetic flux density values fall within the range commonly observed in high-capacity transmission systems operating under nominal load conditions.
These results indicate that, although geometric variations in hybrid HVAC–HVDC transmission structures can produce measurable spatial redistribution of electromagnetic field intensity across the right-of-way, the evaluated configurations remain consistent with widely accepted environmental electromagnetic performance criteria. Therefore, the comparative analytical approach presented in this study may support preliminary corridor design decisions aimed at controlling ground-level electromagnetic exposure and improving electromagnetic compatibility with nearby infrastructure.
5. Conclusions
This study presented an analytical framework for evaluating the spatial distribution of electric field intensity and magnetic flux density in hybrid HVAC–HVDC transmission corridors. The proposed methodology integrates classical electromagnetic formulations within a unified engineering-oriented approach that enables comparative assessment of the influence of conductor geometric configuration on ground-level electromagnetic exposure conditions.
The results demonstrated that variations in the transverse arrangement of HVAC phase conductors and HVDC poles can produce measurable redistribution of electromagnetic field maxima across the right-of-way, even under identical electrical operating conditions. In particular, electric field profiles were shown to be strongly influenced by voltage level and capacitive coupling mechanisms, while magnetic flux density distributions were primarily governed by current magnitude, phase relationship, and spatial proximity effects.
The findings highlight the relevance of cross-sectional structural design as a practical parameter for improving electromagnetic compatibility performance in hybrid transmission infrastructures. From an engineering perspective, the analytical procedure proposed in this work may serve as a preliminary design-support tool for corridor planning studies, allowing identification of configurations that contribute to reducing localized electromagnetic exposure levels.
Although the analysis was conducted under steady-state quasi-static assumptions and did not explicitly consider corona-induced space-charge phenomena, tower shielding effects, or transient operating conditions, the methodology provides a consistent basis for first-order electromagnetic field estimation. Future research may focus on extending the present approach through FEM multiphysics simulations and EMT modelling in order to achieve higher-fidelity representation of hybrid transmission environments.
Overall, the integration of analytical electromagnetic field assessment with geometric design considerations constitutes a relevant contribution toward the optimization of next-generation hybrid HVAC–HVDC transmission corridors.
Future work will include validation through numerical simulation techniques (e.g., finite element methods) and, where possible, experimental measurements. This reinforces the applicability of the proposed methodology as a preliminary design-support tool for hybrid transmission corridor analysis.
Author Contributions
Conceptualization, J.L.A.M. and L.C.V.; methodology, J.L.A.M.; software, J.L.A.M.; validation, J.L.A.M., L.C.V. and J.G.V.-D.; formal analysis, J.L.A.M. and J.S.J.; investigation, J.L.A.M., J.C.V.V. and Y.A.G.Á.; resources, L.C.V.; data curation, J.L.A.M. and Á.D.F.N.; writing—original draft preparation, J.L.A.M.; writing—review and editing, L.C.V., J.G.V.-D. and O.I.B.N.; visualization, J.L.A.M. and Y.A.G.Á.; supervision, L.C.V.; project administration, L.C.V.; funding acquisition, L.C.V. All authors have read and agreed to the published version of the manuscript.
Funding
This research received no external funding.
Institutional Review Board Statement
Not applicable.
Informed Consent Statement
Not applicable.
Data Availability Statement
The minimum set of data necessary to reproduce the results may be provided by the corresponding author upon reasonable request for academic research purposes.
Conflicts of Interest
The authors declare no conflicts of interest.
Abbreviations
| HVAC | High-Voltage Alternating Current |
| HVDC | High-Voltage Direct Current |
| EMC | Electromagnetic Compatibility |
| EMI | Electromagnetic Interference |
| EMF | Electromagnetic Field |
| AC | Alternating Current |
| DC | Direct Current |
| ROW | Right-of-Way |
| FEM | Finite Element Method |
| EMT | Electromagnetic Transient |
| ICNIRP | International Commission on Non-Ionizing Radiation Protection |
| IEEE | Institute of Electrical and Electronics Engineers |
| IEC | International Electrotechnical Commission |
| CIGRE | International Council on Large Electric Systems |
References
- CIGRE JWG C4/B1/B2/B4-78; Interference Effects Between HVDC Circuits and Nearby Metallic Infrastructure. CIGRE: Paris, France, 2025.
- Karaca, E.; Kurt, U.; Düzenli, M. Analysis of hybrid AC/DC transmission system: A Turkey case study. IET Gener. Transm. Distrib. 2024, 18, 3017–3028. [Google Scholar] [CrossRef] [Scilit]
- Xing, J.; Wang, Z.; Zhang, T. Influence of ion-flow field on the design of hybrid HVAC and HVDC transmission lines with different configurations. Energies 2025, 18, 3657. [Google Scholar] [CrossRef] [Scilit]
- IEC TR 62681; Electromagnetic Performance of HVDC Overhead Transmission Lines. International Electrotechnical Commission: Geneva, Switzerland, 2022.
- Fathy, A.M.; El-Sayed, M.; Abdel-Latif, K. Numerical simulation of electromagnetic fields in HVDC transmission lines. SN Appl. Sci. 2025, 7, 1145. [Google Scholar] [CrossRef] [Scilit]
- Wróbel, Z.; Ziemba, R.; Markowska, R.; Mielnik, R. Electromagnetic impact of overhead high-voltage lines on buried signalling cables of railway traffic control systems. Energies 2024, 17, 2554. [Google Scholar] [CrossRef] [Scilit]
- Popoli, A.; Sandrolini, L.; Cristofolini, A. Reduction in the Electromagnetic Interference Generated by AC Overhead Power Lines on Buried Metallic Pipelines with Screening Conductors. Electricity 2021, 2, 316–329. [Google Scholar] [CrossRef] [Scilit]
- Burns & McDonnell. Alternating-Current Interference Mitigation Techniques for High-Voltage Transmission Line Operators; Burns & McDonnell: Kansas City, MO, USA, 2022; Available online: https://info.burnsmcd.com (accessed on 10 March 2026).
- U.S. Bureau of Ocean Energy Management (BOEM). SouthCoast Wind—HVDC EMF Assessment (Appendix P2); Bureau of Ocean Energy Management: Washington, DC, USA, 2024.
- ICNIRP. Guidelines for limiting exposure to time-varying electric and magnetic fields (1 Hz–100 kHz). Health Phys. 2010, 99, 818–836. [Google Scholar] [CrossRef] [Scilit] [PubMed]
- ICNIRP. Guidelines for limiting exposure to electromagnetic fields (100 kHz–300 GHz). Health Phys. 2020, 118, 483–524. [Google Scholar] [CrossRef] [Scilit] [PubMed]
- World Health Organization. Exposure to Extremely Low-Frequency Fields; WHO Press: Geneva, Switzerland, 2007. [Google Scholar]
- Bubu, P.E.; Eze, V.H.U.; Adie, A.E. Simulation and analysis of magnetic fields around high-voltage power lines using Python for enhanced safety and design insights. Sci. Rep. 2025, 15, 33975. [Google Scholar] [CrossRef] [Scilit]
- Wang, C.; Xu, S.; Li, W.; Wang, Y.; Shen, G.; Wang, S. Multi-physics coupled simulation and experimental investigation of alternating stray current corrosion of buried gas pipeline adjacent to rail transit system. Mater. Des. 2024, 247, 113394. [Google Scholar] [CrossRef] [Scilit]
- Fayazi, M.; Saffarian, A.; Joorabian, M.; Monadi, M. Analysis of induced components in hybrid HVAC/HVDC transmission lines on the same tower for various fault conditions. Electr. Power Syst. Res. 2024, 226, 109884. [Google Scholar] [CrossRef] [Scilit]
- Zhao, Y.; Zhang, W. Hybrid electric field analysis of HVAC and HVDC transmission lines in one corridor. High Volt. Eng. 2014, 40, 923–929. [Google Scholar] [CrossRef]
- Mehdi, A.; Hussain, A.; Song, J.S.; Kim, C.H. A robust unified data-driven protection scheme for hybrid AC/DC transmission lines. Electr. Power Syst. Res. 2024, 233, 110453. [Google Scholar] [CrossRef] [Scilit]
- AlAqil, M.A. Assessment of electromagnetic interference effects in high-voltage AC overhead lines adjacent to underground pipelines. PowerTech J. 2025, 3, 19. [Google Scholar] [CrossRef] [Scilit]
- Aguilar-Marin, J.L.; Vergara-Vázquez, J.C.; Padilla-Cantero, J.G.; Hernández-González, D. Methodology to calculate the intensity of the electric field generated in a double circuit high voltage alternating current overhead transmission line. J. Quant. Stat. Anal. 2020, 7, 1–8. [Google Scholar] [CrossRef] [Scilit]
- Deltuva, R.; Lukocius, R. Distribution of magnetic field in 400 kV double-circuit transmission lines. Appl. Sci. 2020, 10, 3266. [Google Scholar] [CrossRef] [Scilit]
- CIGRE. Guide to the Conversion of Existing AC Lines to DC Operation; CIGRE: Paris, France, 2014. [Google Scholar]
- Fisher, A.; Alvarez, J.; Gibson, N.L. Analysis of methods for the Maxwell–random Lorentz model. Results Appl. Math. 2020, 8, 100098. [Google Scholar] [CrossRef] [Scilit]
- Maruvada, P.S. Corona Performance of High-Voltage Transmission Lines; Taylor & Francis: New York, NY, USA, 2000. [Google Scholar]
- Carsimamovic, A.; Mujezinovic, A.; Bajramovic, Z.; Turkovic, I.; Kosarac, M.; Stankovic, K. Origin and mitigation of increased electric fields at high voltage transmission line conductors. Int. J. Electr. Power Energy Syst. 2019, 104, 134–149. [Google Scholar] [CrossRef] [Scilit]
- Helmer, C.; Jüngel, A. Analysis of Maxwell–Stefan systems for heat conducting fluid mixtures. Nonlinear Anal. Real World Appl. 2021, 59, 103263. [Google Scholar] [CrossRef] [Scilit]
- IEEE C95.6-2002; Standard for Safety Levels with Respect to Human Exposure to Electromagnetic Fields, 0–3 kHz. IEEE: Piscataway, NJ, USA, 2002.
- Aguilar-Marin, J.L.; Cisneros-Villalobos, L.; Vera-Dimas, J.G.; Sánchez-Jaime, J.; Saldarriaga-Noreña, H.A.; Herrera-Gutiérrez, H. Mitigation of magnetic field levels in bipolar transmission lines of 500 and 600 kV in HVDC. Energies 2025, 18, 5022. [Google Scholar] [CrossRef] [Scilit]
- Ehtaiba, J.M.; Elhabashi, S.M. Magnetic field around the new 400 kV overhead power transmission lines in Libya. In Proceedings of the WSEAS International Conference on Environment, Penang, Malaysia, 23–25 January 2010; pp. 134–139. [Google Scholar]
- Sun, X.; Huang, Q.; Hou, Y.; Jiang, L.; Pong, P.W. Noncontact operation-state monitoring technology based on magnetic-field sensing for overhead high-voltage transmission lines. IEEE Trans. Power Deliv. 2013, 28, 2145–2153. [Google Scholar] [CrossRef] [Scilit]
- Malicki, P.; Papenheim, S.; Kizilcay, M. Shielding failure analysis of a hybrid transmission line with AC and DC systems on the same tower. Electr. Power Syst. Res. 2018, 159, 2–8. [Google Scholar] [CrossRef] [Scilit]
- Tang, J.; Zeng, R.; Ma, H.; He, J.; Zhao, J.; Li, X.; Wang, Q. Analysis of Electromagnetic Interference on DC Line from Parallel AC Line in Close Proximity. IEEE Trans. Power Deliv. 2007, 22, 2401–2408. [Google Scholar] [CrossRef] [Scilit]

Disclaimer/Publisher’s Note: The statements, opinions and data contained in all publications are solely those of the individual author(s) and contributor(s) and not of MDPI and/or the editor(s). MDPI and/or the editor(s) disclaim responsibility for any injury to people or property resulting from any ideas, methods, instructions or products referred to in the content. |
© 2026 by the authors. Licensee MDPI, Basel, Switzerland. This article is an open access article distributed under the terms and conditions of the Creative Commons Attribution (CC BY) license.