


Featured Application
This work can be directly applied as a real-time diagnostic tool for durian farmers through a web-based or mobile application, enabling rapid identification of leaf diseases from field images. By providing accurate, near-instant feedback (≈0.54 s per image), the system supports early disease detection, reduces misdiagnosis, and guides appropriate treatment decisions. This application can be integrated into precision agriculture platforms or agricultural extension services to improve crop management, minimize unnecessary pesticide use, and enhance productivity and sustainability in Thailand’s durian industry.
Abstract
Durian (Durio zibethinus Murray) is Thailand’s most economically significant fruit export, yet foliar diseases pose a major threat to productivity and crop quality. Early-stage symptoms of several durian leaf diseases are visually similar, making reliable diagnosis difficult for farmers and even trained agronomists. This study aims to develop and evaluate an automated deep learning-based system for durian leaf disease classification under realistic field conditions. A dataset of 6119 leaf images representing six classes—Leaf_Healthy, Leaf_Colletotrichum, Leaf_Algal, Leaf_Phomopsis, Leaf_Blight, and Leaf_Rhizoctonia—was compiled from public datasets and field-collected samples. Six convolutional neural network (CNN) architectures—ConvNeXt, ResNet, DenseNet201, InceptionV3, EfficientNet-B3, and MobileNetV3—were benchmarked using a unified transfer-learning training protocol. Class imbalance was addressed using weighted cross-entropy loss, and performance was evaluated on a stratified held-out test set using accuracy, precision, recall, and F1-score metrics. The results show that ConvNeXt achieved the highest performance with 98.00% accuracy and a weighted F1-score of 0.98, followed by ResNet (96.82%) and DenseNet201 (96.09%), while efficiency-oriented models plateaued near 91%. Confusion matrix analysis revealed consistent misclassification among visually similar disease categories—Leaf_Algal, Leaf_Blight, and Leaf_Phomopsis—indicating biological similarity in lesion appearance rather than model limitations. The best-performing model was deployed as a publicly accessible web application using Gradio, enabling real-time disease diagnosis with an average inference time of approximately 0.54 s per image. Unlike prior studies, this work combines large-scale architecture benchmarking, class imbalance mitigation, and real-world deployment within a single unified framework. These findings demonstrate that modern CNN architectures can provide highly accurate and scalable disease detection tools, supporting precision agriculture by enabling early diagnosis, reducing inappropriate pesticide use, and improving decision-making for durian farmers.
1. Introduction
Durian (Durio zibethinus Murray) has become one of the most economically significant horticultural exports in Southeast Asia. In Thailand alone, export revenues from durian and durian products reached a cumulative value of 186,822.6 million baht between 2010 and 2019 and rose further to a record 124,000 million baht in 2022 [1]. This rapid expansion reflects accelerating global demand—particularly from Chinese and Southeast Asian markets—and highlights the central role of durian cultivation in supporting the livelihoods of smallholder farmers in eastern and southern Thailand. However, this economic success is increasingly threatened by plant diseases, particularly foliar diseases that directly impair photosynthesis and plant physiology, ultimately reducing both yield quantity and fruit quality [2,3]. When outbreaks are not diagnosed promptly, farmers frequently resort to precautionary pesticide application, a practice that can negatively affect environmental sustainability, human health, and long-term agricultural productivity [4].
A critical challenge in durian disease management lies in the difficulty of accurately diagnosing leaf diseases at early stages. Several economically damaging diseases—including anthracnose (Colletotrichum spp.), leaf blight, and algal leaf spot—exhibit highly similar visual symptoms such as brown lesions, marginal scorching, and necrotic spots on leaf surfaces [5]. Because these symptoms are visually overlapping, reliable diagnosis through unaided observation is difficult even for experienced farmers. The problem is further exacerbated by the limited availability of plant pathology specialists who can provide rapid, site-specific guidance across Thailand’s extensive durian cultivation regions. Consequently, delayed or incorrect diagnosis often leads to inappropriate treatment decisions and preventable crop losses at scale.
Recent advances in artificial intelligence (AI), particularly deep learning techniques, have demonstrated strong potential for addressing such diagnostic challenges in agriculture. Convolutional neural networks (CNNs) enable automated feature extraction from plant imagery and have become a dominant approach for plant disease identification tasks [6]. The landmark study by Mohanty et al. [7]. demonstrated that CNNs pre-trained on ImageNet could attain accuracy exceeding 99% on the PlantVillage dataset, establishing transfer learning as the essential strategy for this domain. Ferentinos [8] subsequently confirmed that multiple deep architectures generalise well across several crop–disease combinations when trained on sufficient, high-quality data, while noting that performance degrades substantially under field conditions compared to controlled imagery. Furthermore, the integration of deep learning models with web-based or mobile platforms has enabled accessible decision-support tools that extend expert-level diagnostic capabilities directly to farmers in the field [9,10]. Subsequent work has focused on filling the field-condition gap through augmentation strategies, ensemble approaches, and lightweight architectures suitable for mobile deployment [11].
Targeted research on durian leaf disease recognition is considerably sparser than the broader plant pathology literature. Sabarre et al. [12] proposed an early Android-based detection system using a custom CNN, establishing feasibility but limited to three disease classes on a small proprietary dataset. Boondach and Chaisiriprasert [13] demonstrated the value of CLAHE-based image enhancement as a preprocessing step for low-contrast field imagery when coupled with YOLOv8, while Piriyasupakij and Prasitphan [14] extended the scope to orchard-scale aerial surveillance via unmanned drones. On the dataset side, Nguyen et al. [15] published the first openly available durian leaf disease benchmark with documented pathological annotations. More recently, Daud et al. [16] evaluated Vision Transformer (ViT) architectures for durian disease control, and Mat Daud et al. [17] compared VGG, ResNet, and MobileNet under a transfer learning framework, while Chatthaicharoen et al. [5] applied Xception and Mask R-CNN, reporting improved lesion localisation capability.
A review of this literature reveals several persistent gaps. No published study has benchmarked more than three architectures for durian leaf disease under identical experimental conditions. None has applied explicit class imbalance correction beyond augmentation. No study has demonstrated a live, end-to-end deployment pipeline. ConvNeXt [18], which achieves state-of-the-art performance on fine-grained visual recognition tasks, has not yet been evaluated in this domain. To address these limitations, this study makes four primary contributions. First, it provides a systematic benchmark of six representative CNN architectures—ConvNeXt, ResNet, DenseNet201, InceptionV3, EfficientNet-B3, and MobileNetV3—under a unified training and evaluation framework, enabling a fair and comprehensive comparison not previously reported in durian disease classification research. Second, the study explicitly addresses class imbalance by using weighted cross-entropy loss, thereby improving recognition of minority disease classes that are often overlooked in prior work. Third, unlike many existing studies that rely on controlled datasets, this research uses field-condition imagery with natural variability, thereby providing a more realistic assessment of model performance in practical agricultural environments. Finally, the study demonstrates a complete end-to-end deployment pipeline through a publicly accessible web application, bridging the gap between laboratory model development and real-world precision agriculture applications. Collectively, these contributions advance both the methodological rigor and practical applicability of AI-driven plant disease diagnosis.
2. Materials and Methods
2.1. Dataset Description
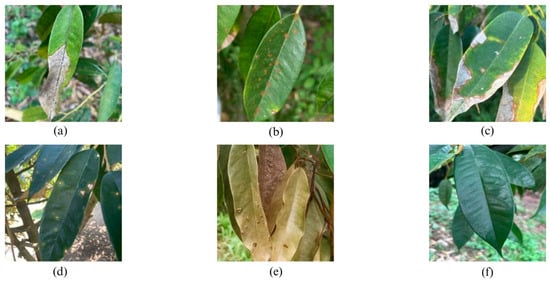
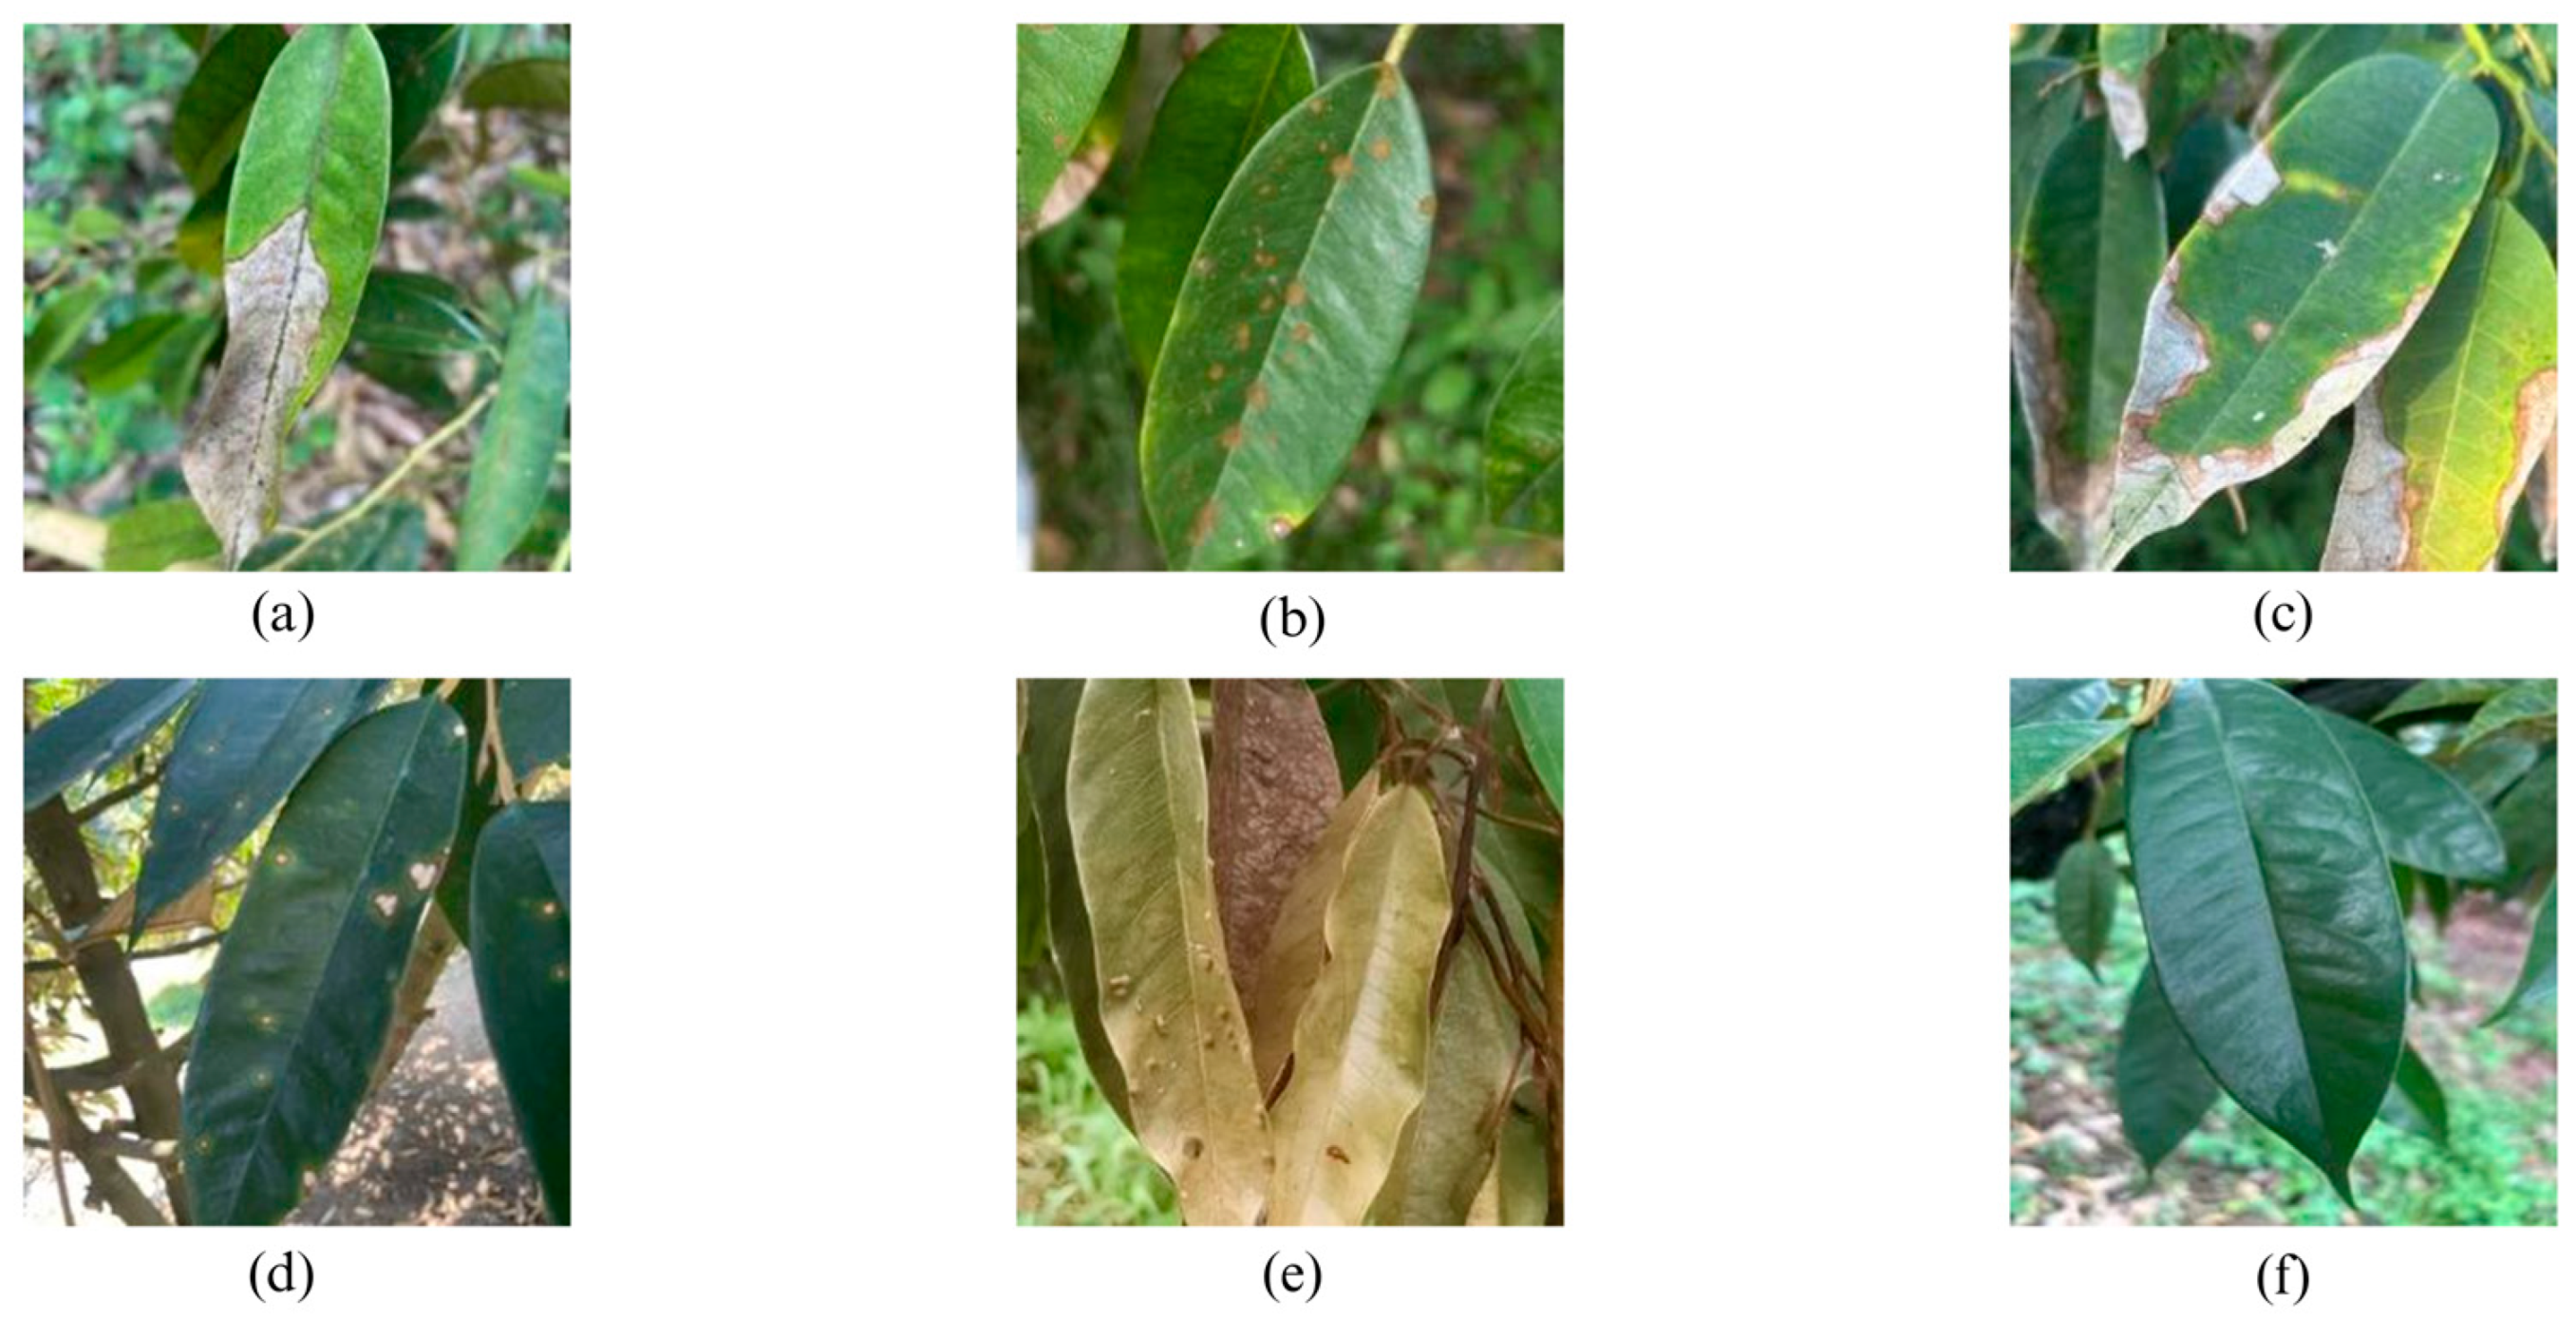
The dataset contains 6119 leaf images distributed across six classes: Leaf_Healthy, Leaf_Colletotrichum (Anthracnose), Leaf_Algal (Algal Leaf Spot), Leaf_Phomopsis, Leaf_Blight, and Leaf_Rhizoctonia. Images were aggregated from the publicly available Durian Leaf Disease Dataset [19] and the Vietnamese durian leaf disease benchmark [15], supplemented with field-collected specimens to improve the diversity of acquisition conditions. All images reflect natural in situ conditions with variation in illumination, camera angle, focal distance, and background complexity, representing realistic diagnostic scenarios rather than controlled studio conditions. Representative samples from each class are shown in Figure 1.
Figure 1.
Representative examples of durian leaf conditions: (a) leaf blight, showing necrotic le-sions and browning along the leaf surface; (b) algal leaf spot, characterized by small orange to brown circular spots; (c) Colletotrichum infection, presenting irregular ne-crotic patches with yellowish margins; (d) Phomopsis infection, exhibiting dark lesions and scattered spots; (e) Rhizoctonia infection, showing extensive browning and leaf decay; and (f) healthy leaf, displaying normal green coloration without visible symp-toms.
In addition to publicly available datasets, the authors sought to enhance diversity and better represent real-world conditions by collecting a subset of images. These field images were captured in durian orchards under natural lighting conditions using consumer-grade smartphone cameras. The data collection process intentionally included variation in illumination (e.g., direct sunlight, partial shade), camera angles, shooting distances, and background complexity to reflect practical diagnostic scenarios.
The collected images were manually screened to ensure adequate visual quality and clear depiction of leaf symptoms. Disease labels were assigned through visual inspection and cross-referenced with representative examples from the reference datasets to maintain annotation consistency across sources. This integration of field-collected and publicly available data improves the dataset’s ecological validity while preserving label reliability.
2.2. Data Partitioning and Class Imbalance Handling
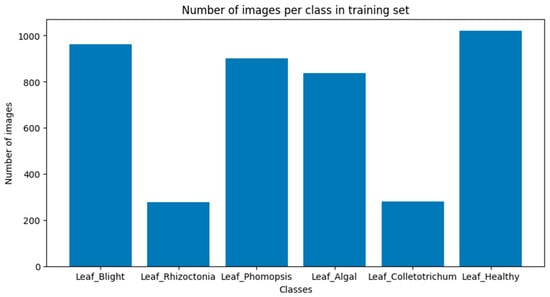
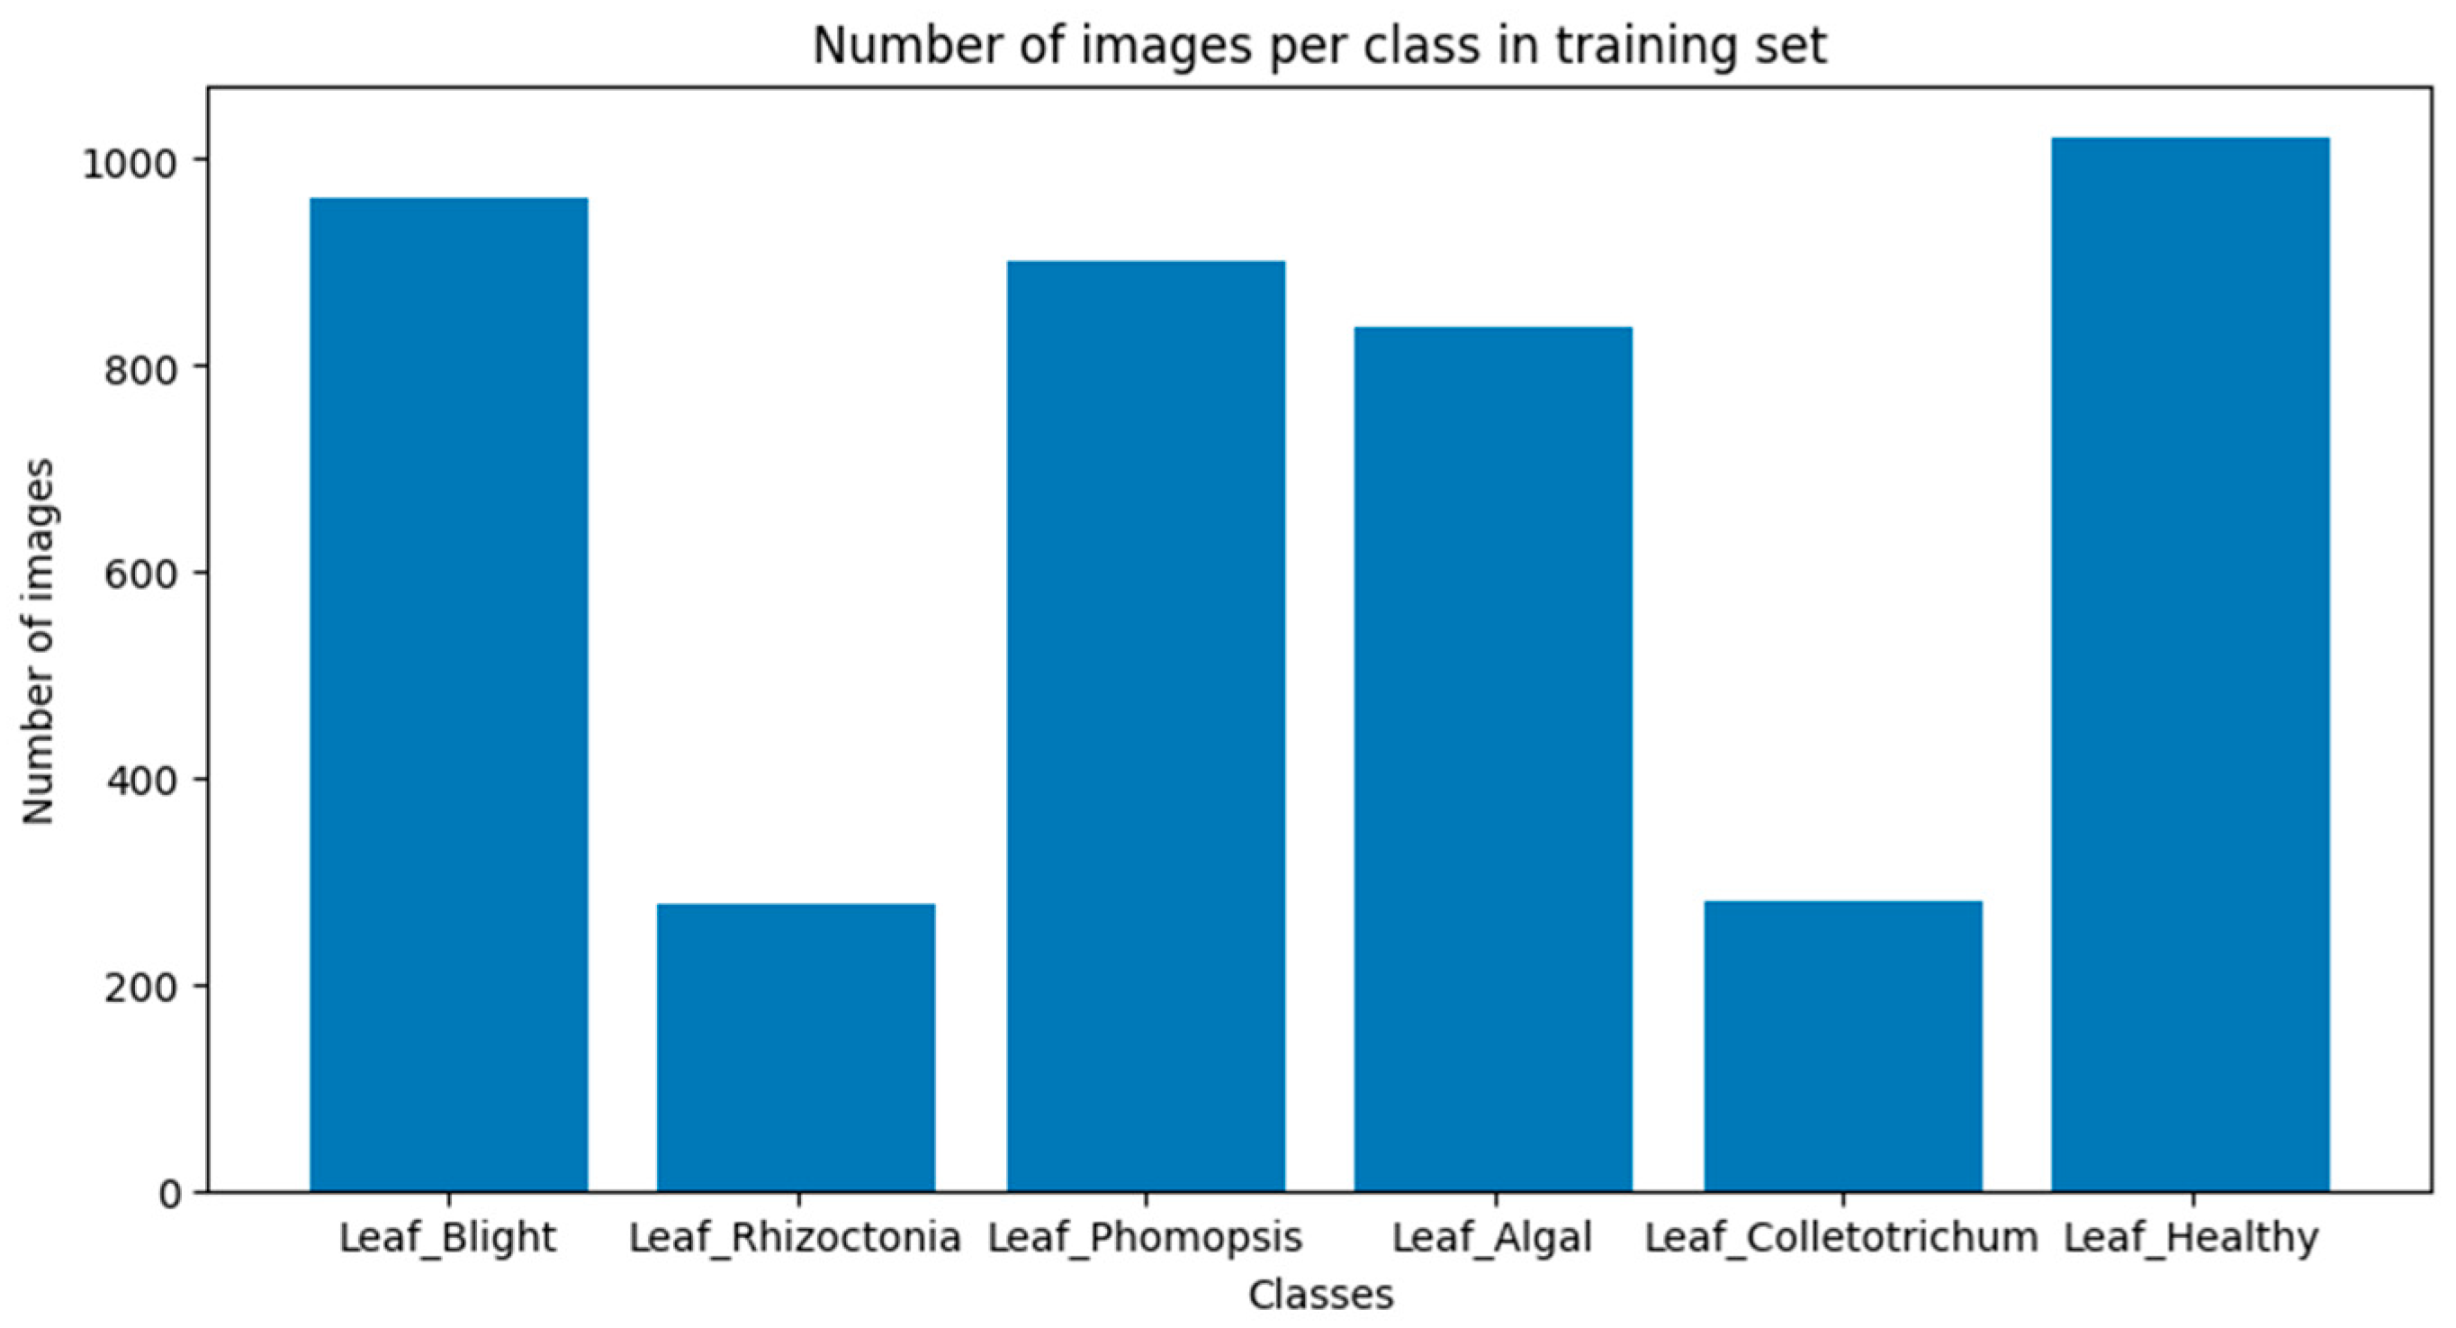
The dataset was partitioned into training (4279 images; 69.9%), validation (739 images; 12.1%), and test (1101 images; 18.0%) subsets using stratified random splitting to preserve class proportions across all three partitions. Per-class image counts indicate a marked class imbalance, with the majority classes Leaf_Healthy and Leaf_Blight containing approximately 3.7 times more images than the less frequent classes Leaf_Colletotrichum and Leaf_Rhizoctonia (approximately 400 images each).
To prevent the model from disproportionately optimising for majority classes, class-conditional weights were computed using the inverse-frequency formula:
where N is the total number of training samples, K is the number of classes, and nc is the count of class c. The resulting weights were applied to a weighted cross-entropy loss function [20]. Less frequent classes received substantially higher weights (Leaf_Colletotrichum: 2.547; Leaf_Rhizoctonia: 2.565) relative to majority classes (Leaf_Healthy: 0.699; Leaf_Blight: 0.741).
The use of weighted cross-entropy provides a principled mechanism to address class imbalance by assigning higher loss penalties to underrepresented classes. This encourages the model to prioritize minority disease categories during optimization, which is particularly important in agricultural applications where rare diseases may have a significant economic impact.
However, weighted loss does not increase the diversity or the number of minority-class samples. Instead, it rebalances gradient contributions during training. As a result, its effectiveness depends on the quality of the underlying data and may be limited when minority classes exhibit high intra-class variability or insufficient representation.
Figure 2 shows the distribution of training images across the six durian leaf disease classes in the training dataset (n = 4279). The dataset exhibits class imbalance, motivating the use of weighted cross-entropy loss during training. Unlike offline augmentation or oversampling approaches, this study preserves the original class distribution and addresses imbalance exclusively at the loss-function level.
Figure 2.
Class imbalance bar chart.
2.3. Image Preprocessing and Augmentation
All input images were resized to the architecture-specific input resolution using aspect-ratio-preserving padding (no squish distortion), then normalised using ImageNet channel statistics (mean = [0.485, 0.456, 0.406]; std = [0.229, 0.224, 0.225]). During training, stochastic data augmentation was applied on the fly to increase the diversity of input samples without physically expanding the dataset. The augmentation pipeline included random horizontal and vertical flips, random rotation (±30°), color jitter (brightness ±0.2, contrast ±0.2), and random resized crop.
It is important to note that this augmentation strategy does not alter the number of training images; the dataset size remains fixed at 6119 images, and the class distribution reported in Table 1 is unchanged. Instead, augmentation generates different transformed variants of existing images at each training iteration, thereby improving model generalization under varying field conditions.
Table 1.
Image distribution between classes and data splits.
Consequently, class imbalance was not mitigated through data resampling or synthetic data generation. Instead, it was explicitly addressed using a weighted cross-entropy loss function (Section 2.2), which assigns higher importance to minority classes during optimization.
2.4. CNN Architectures
Six architectures were selected to represent different architectural paradigms across the CNN landscape. ConvNeXt [18] represents the modernised pure-ConvNet paradigm, incorporating large-kernel (7 × 7) depthwise convolutions, inverted bottleneck blocks, and GELU activations inspired by Vision Transformer design principles. ResNet [21] provides the residual learning baseline, using shortcut connections to enable training of very deep networks through mitigating vanishing gradients. DenseNet201 [22] employs dense connectivity, in which each layer receives concatenated feature maps from all preceding layers, thereby promoting aggressive feature reuse. InceptionV3 [23] uses parallel multi-scale convolutional modules (1 × 1, 3 × 3, 5 × 5) to capture disease features across multiple spatial scales. EfficientNet-B3 [24] applies compound scaling to optimise network depth, width, and input resolution jointly. MobileNetV3 [25] employs depthwise factorized convolutions and neural network search to maximise accuracy per parameter for resource-limited deployment. In addition to classification performance, model complexity was assessed using the number of parameters and floating-point operations (GFLOPs), which are widely used indicators of computational cost and deployment feasibility, particularly for edge devices.
The selection of architectures was guided by two primary criteria: (i) representation of diverse CNN design paradigms; (ii) relevance to practical deployment scenarios. The chosen models span high-capacity architectures (ConvNeXt, Dense-Net201), classical residual learning (ResNet), multi-scale feature extraction (InceptionV3), and efficiency-oriented models (EfficientNet-B3, MobileNetV3).
Although more recent variants such as ConvNeXt V2 and EfficientNetV2 have been proposed, they were not included in this study due to their higher computational requirements and reliance on large-scale pretraining, which exceed the scope of this work. Instead, this study focuses on widely adopted, stable architectures with well-established pretrained weights to ensure reproducibility and fair comparison under a unified training protocol.
2.5. Training Protocol
All experiments were implemented in Python 3.10 using PyTorch 2.0.1 and the fastai library (version 2.7.12) [26]. All models used ImageNet-pretrained weights and followed a two-stage fine-tuning protocol: (1) training only the classification head for the initial five epochs with the backbone frozen; (2) unfreezing all layers for joint fine-tuning using a discriminative learning rate schedule with the learning rate determined by the fastai learning rate finder. Additional training settings included batch size = 10, mixed-precision training (FP16), and early stopping with a patience of 5 epochs based on validation loss. The batch size was selected based on GPU memory constraints when training high-capacity architectures (e.g., ConvNeXt and DenseNet201) on a single NVIDIA Tesla T4 GPU.
Although larger batch sizes (e.g., 16–32) are commonly recommended in deep learning practice, a smaller batch size was adopted to ensure stable training across all architectures under identical hardware conditions. This choice also ensured a fair comparison by maintaining consistent training configurations for all models.
2.6. Evaluation Metrics
Model performance was assessed exclusively on the held-out test set using four standard classification metrics, accuracy, precision, recall, and F1-score, reported at both macro-averaged and weighted-averaged levels [27,28]. Weighted averaging accounts for class frequency and is the primary ranking metric given the class imbalance. Confusion matrices were generated for both validation and test sets to examine systematic misclassification patterns. Model selection for deployment was based on weighted F1-score on the test set.
2.7. Web Application Deployment
The top-performing model was deployed as a publicly accessible web application via Gradio [29] and hosted on Hugging Face Spaces. Model weights were stored separately on Hugging Face Hub following a model–registry decoupling pattern [30], enabling model versioning independent of application code. The inference pipeline replicates the training preprocessing pipeline to ensure consistent predictions. The application outputs: (i) predicted disease class with label in both Thai and English; (ii) confidence score; (iii) a full per-class probability table; (iv) a brief agronomic description and management guidance for the predicted disease, designed to support farmers without specialist training.
3. Results and Discussion
3.1. Overall Classification Performance
Table 2 summarises the test-set performance of all six architectures. A clear performance stratification is observed: ConvNeXt achieved the highest accuracy (98.00%, weighted F1 = 0.98), followed closely by ResNet (96.82%) and DenseNet201 (96.09%). The remaining architectures—InceptionV3 (92.10%), EfficientNet-B3 (91.10%), and MobileNetV3 (90.83%)—clustered in a lower-performing tier, approximately 5–7 percentage points below the top group.
Table 2.
Test-set performance and model complexity comparison across all architectures.
Compared with prior studies, the proposed approach demonstrates clear advantages in both methodological design and practical applicability. For instance, Mohanty et al. [7] reported accuracy exceeding 99% on the PlantVillage dataset; however, their experiments were conducted on controlled images with uniform backgrounds, which often overestimate real-world performance. Similarly, Ferentinos [8] showed strong performance across multiple crops but highlighted performance degradation under field conditions. In the context of durian-specific research, Sabarre et al. [12] and Mat Daud et al. [17] evaluated a limited number of architectures (typically fewer than three). They relied on relatively small or less diverse datasets. In contrast, the present study evaluates six architectures under identical conditions using a larger field-condition dataset, providing a more robust and generalizable benchmark. Furthermore, while previous studies primarily relied on data augmentation to address class imbalance, this study incorporates weighted loss functions, resulting in more stable performance across minority classes. The integration of a deployable web-based system further distinguishes this work from prior research that remains largely at the experimental stage.
Beyond predictive performance, the results reveal a clear trade-off between model accuracy and computational complexity. ConvNeXt, while achieving the highest accuracy (98.00%), requires substantially higher computational resources (28.6 M parameters, 4.5 GFLOPs), making it more suitable for server-based deployment. In contrast, MobileNetV3 demonstrates significantly lower complexity (5.4 M parameters, 0.22 GFLOPs), indicating strong potential for deployment on edge devices such as smartphones or IoT systems, albeit with reduced accuracy (~90.83%). EfficientNet-B3 offers a balanced compromise between accuracy and efficiency. These findings highlight that model selection should be guided not only by predictive performance but also by deployment constraints, particularly in rural agricultural environments where computational resources and connectivity may be limited.
The results align with previous research demonstrating the effectiveness of deep learning for plant disease detection [7,8]. However, many prior studies relied on controlled datasets with uniform backgrounds and lighting conditions, which often overestimate real-world performance. The present study used field-condition imagery containing natural variation in illumination, camera angles, and background clutter, making the classification task more representative of real agricultural environments. The strong performance of the tested architectures therefore reinforces the practical feasibility of CNN-based disease identification systems for agricultural decision support.
The superior performance of ConvNeXt corroborates the architecture’s original assessment on fine-grained visual recognition tasks [18] and extends its demonstrated utility to plant pathology image classification. The 7 × 7 depthwise convolution kernels in ConvNeXt capture wider spatial context per layer than the 3 × 3 kernels dominant in ResNet and DenseNet, providing a structural advantage for detecting diffuse or irregular lesion patterns such as those characterising Leaf_Algal and Leaf_Blight. From an agricultural decision-support perspective, the 98.00% accuracy achieved by ConvNeXt is practically significant: applied to a 1000-image diagnostic workload, it implies only 20 misclassifications—a considerable improvement over the 90–100 errors expected from the efficiency-oriented architectures. For diseases with distinct management protocols (e.g., fungicide-responsive Anthracnose vs. copper-responsive Algal Leaf Spot), misclassification carries direct economic and environmental costs through inappropriate chemical application.
In contrast, the comparatively lower performance of InceptionV3, Efficient-Net-B3, and MobileNetV3 can be attributed to architectural constraints that limit their effectiveness in fine-grained disease classification under field conditions. InceptionV3 relies on parallel multi-scale convolutional filters; however, its fixed receptive-field combinations may not adequately capture the irregular, diffuse lesion patterns characteristic of durian leaf diseases, particularly under varying illumination and background noise. EfficientNet-B3, while highly parameter-efficient due to compound scaling, prioritizes a balance between depth, width, and resolution, which may constrain its capacity to learn the subtle texture variations needed to distinguish visually similar disease classes. MobileNetV3, designed for lightweight deployment, employs depthwise separable convolutions and aggressive parameter reduction, thereby significantly reducing its representational capacity. While effective for general object recognition tasks, this design is less suited for fine-grained classification problems where discriminative features are subtle and spatially complex.
Furthermore, all three architectures exhibit reduced robustness to background variability and noise in field-condition imagery, in contrast to their strong performance on benchmark datasets with cleaner visual characteristics. These findings suggest that architectures optimized primarily for efficiency may underperform in agricultural disease classification tasks that require high sensitivity to local texture and lesion morphology.
3.2. Per-Class F1-Score Analysis
Table 3 presents per-class F1-scores across all architectures. Leaf_Healthy was classified with near-perfect scores by all models (F1 ≥ 0.94), consistent with its visually unambiguous appearance—uniform green coloration, intact lamina, and no necrotic tissue. In contrast, Leaf_Colletotrichum consistently showed the lowest F1-scores (0.87–0.92 across architectures), attributable to both the scarcity of training samples (280 images) and visual overlap with Leaf_Blight at advanced disease stages.
Table 3.
Per-class F1-score by architecture on the test set.
Another key aspect of this study is the handling of class imbalance, a common challenge in agricultural datasets. Although weighted cross-entropy loss was applied to increase the contribution of minority classes during training, the results indicate that performance disparities persist. In particular, Leaf_Colletotrichum and Leaf_Rhizoctonia consistently exhibit lower F1-scores across all architectures [20]. This suggests that while class weighting may partially mitigate the effects of class imbalance, it does not fully resolve the issue [31].
While the use of weighted cross-entropy improved performance stability across minority classes, it also introduces potential trade-offs. In particular, assigning large weights to rare classes may increase the risk of overcompensation, leading to higher false-positive rates for visually similar disease categories. This is especially relevant in agricultural image classification, where inter-class visual similarity is high, and symptoms may overlap across disease types.
Furthermore, weighted loss alone cannot fully resolve class imbalance when limited data diversity constrains feature learning. In such cases, complementary strategies such as targeted data collection, class-balanced sampling, or synthetic data generation may be required. Therefore, weighted cross-entropy should be viewed as a partial yet effective solution within a broader imbalance-mitigation framework.
The remaining performance gap can be attributed to two primary factors. First, the limited number of training samples for minority classes constrains the model’s ability to learn robust feature representations. Second, these classes share visual similarities with other disease categories, increasing the difficulty of discrimination under real-world conditions. Therefore, the observed improvements should be interpreted as incremental rather than conclusive. A more definitive evaluation of imbalance handling would require controlled ablation studies comparing weighted and unweighted loss functions, as well as alternative strategies such as focal loss, oversampling, or synthetic data generation, which remain important directions for future research.
To quantitatively assess the impact of class imbalance handling, an ablation experiment was conducted to compare standard cross-entropy and weighted cross-entropy losses using the ConvNeXt architecture. As shown in Table 4, the use of weighted loss improves performance for minority classes, particularly Leaf_Colletotrichum and Leaf_Rhizoctonia, while maintaining competitive performance on majority classes. This confirms that class weighting contributes to more balanced classification, although it does eliminate performance disparities.
Table 4.
Comparison of per-class F1-scores with and without weighted cross-entropy loss (ConvNeXt).
3.3. Confusion Pattern Analysis
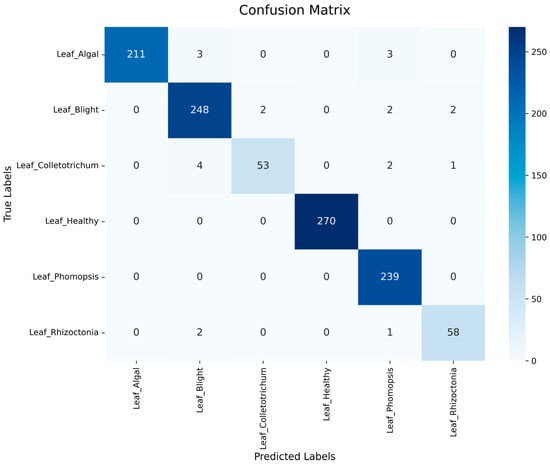
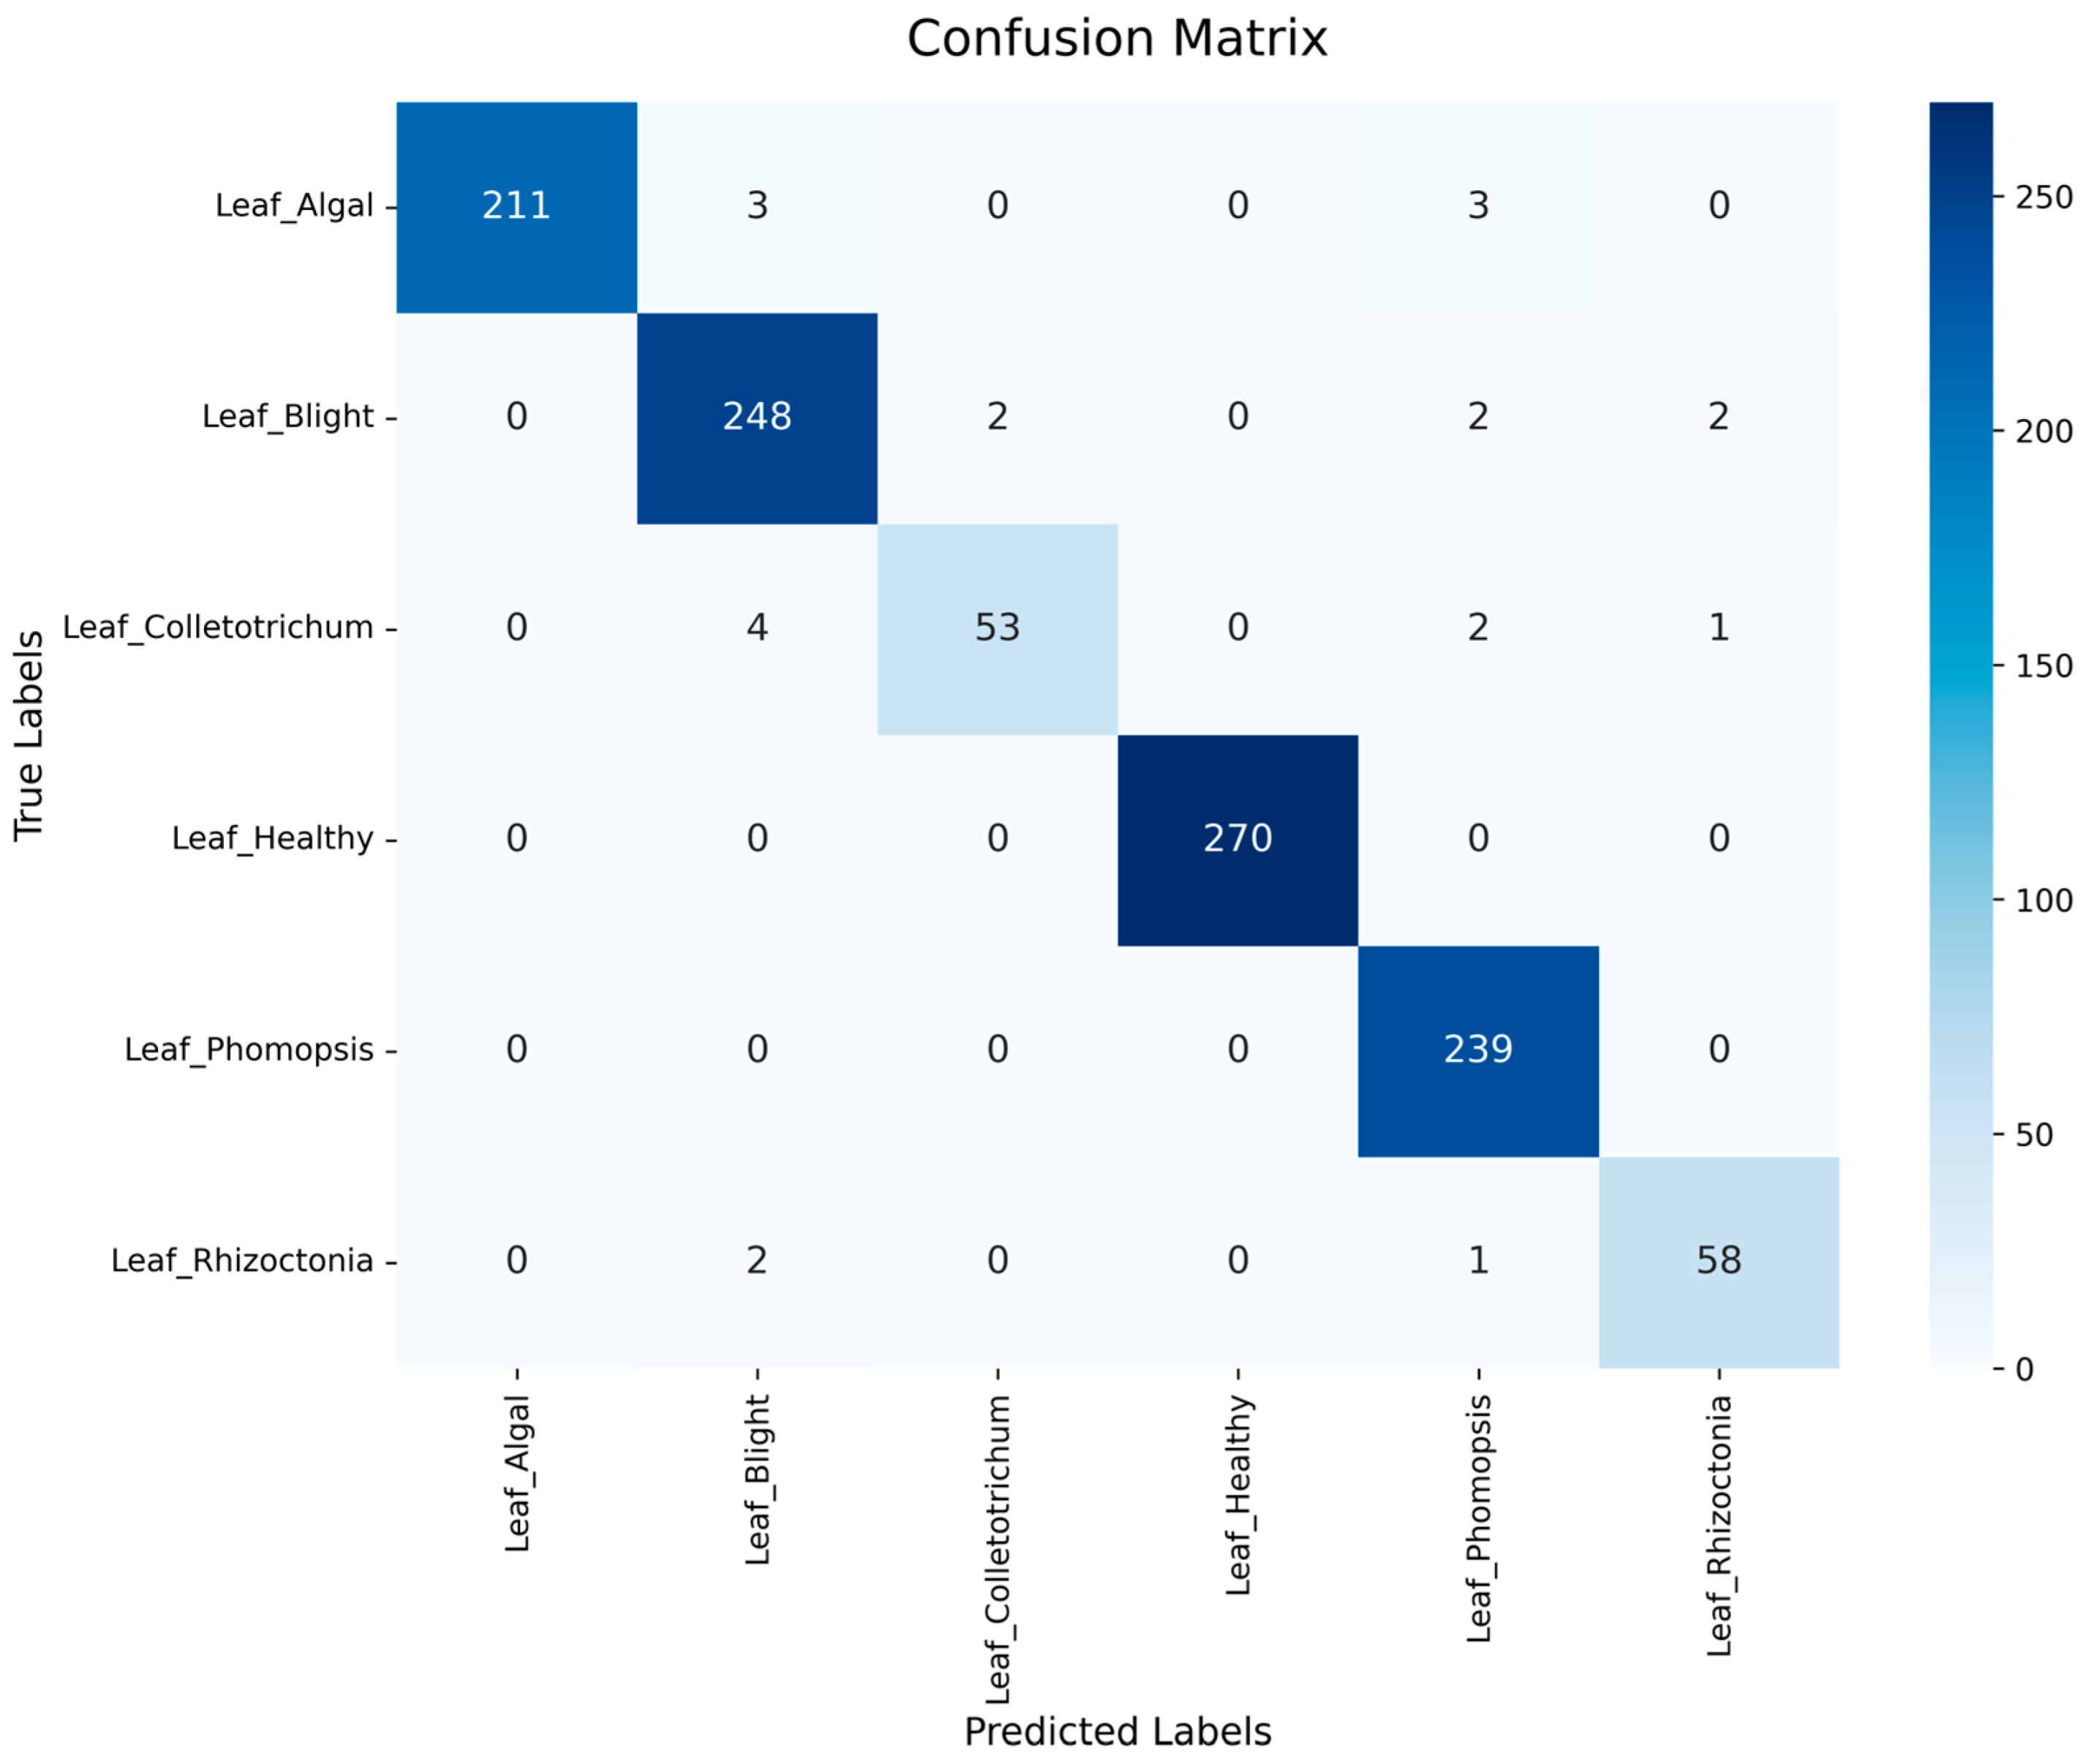
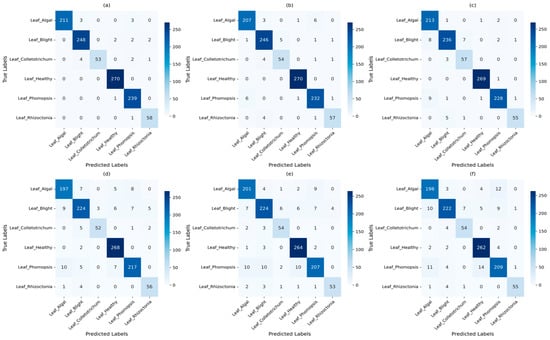
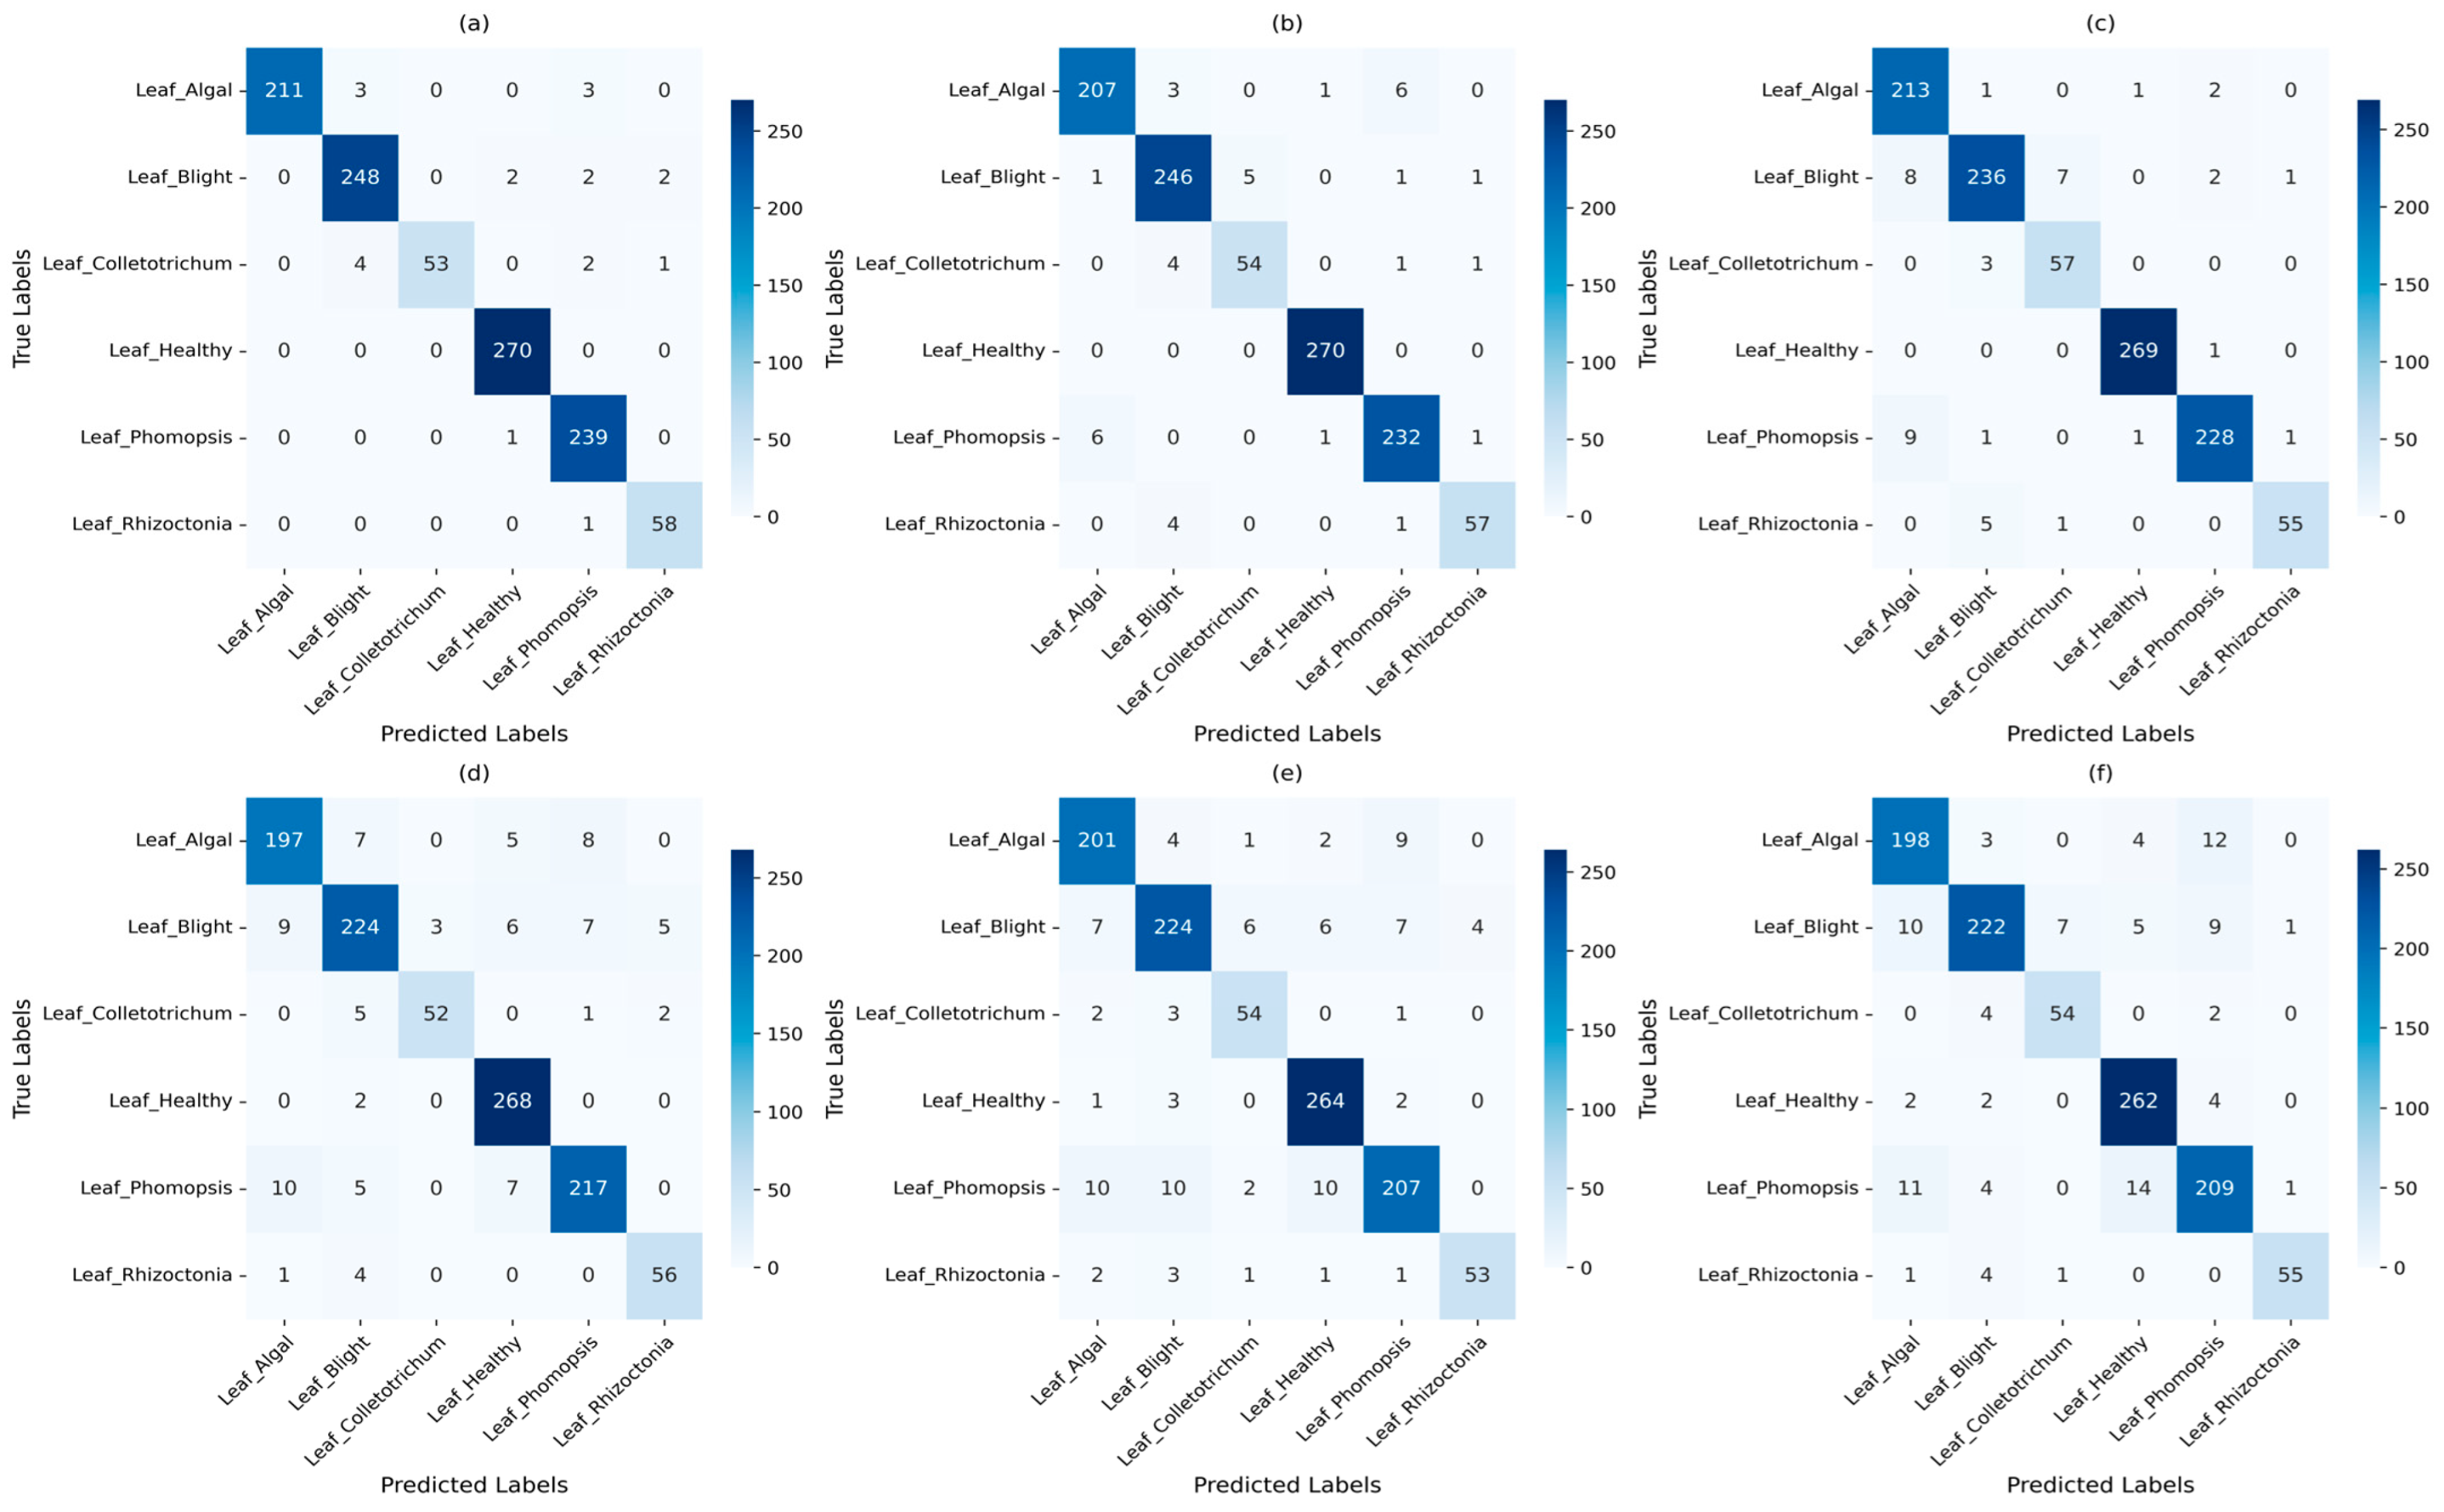
Confusion matrix analysis across all six architectures reveals a consistent misclassification cluster among Leaf_Algal, Leaf_Blight, and Leaf_Phomopsis. These three disease categories share similar visual characteristics, leading to classification ambiguity across models. As illustrated in Figure 3 and Figure 4, most predictions are concentrated along the diagonal, indicating strong overall classification performance. However, a small number of misclassifications occur within this cluster, reflecting the inherent visual similarity of these disease categories rather than model instability.
Figure 3.
Confusion matrix (ConvNeXt).
Figure 4.
Confusion matrices for six CNN architectures evaluated on the held-out test set: (a) ConvNeXt, (b) ResNet, (c) DenseNet201, (d) InceptionV3, (e) EfficientNet-B3, and (f) MobileNetV3.
The ConvNeXt model exhibits the most concentrated diagonal distribution, indicating fewer misclassifications than other architectures, whereas lightweight models such as MobileNetV3 exhibit a more dispersed error pattern. These observations are consistent with the quantitative results reported in Table 2 and Table 3.
The consistent confusion among these three classes across all six architectures is not a modelling failure but reflects genuine pathological ambiguity. As documented in plant pathology literature [2], diseases of distinct aetiology can produce macroscopically similar necrotic symptoms when photographs are taken in variable field lighting, at similar infection phases, or when secondary infections co-occur. This observation has a critical implication for dataset development: expanding datasets to include infection-stage-labelled images would likely reduce this confusion more effectively than further architecture optimisation alone.
Figure 3 Confusion matrix of the ConvNeXt model on the held-out test set (n = 1101). Rows represent true classes and columns represent predicted classes. Most predictions are concentrated along the diagonal.
Figure 4 illustrates that ConvNeXt and ResNet achieve the most consistent classification performance, with strong diagonal dominance indicating high per-class accuracy. In contrast, EfficientNet-B3 and MobileNetV3 exhibit more frequent misclassifications, particularly among visually similar disease classes such as Leaf_Blight and Leaf_Phomopsis, suggesting comparatively lower discriminative capability.
3.4. Training Convergence
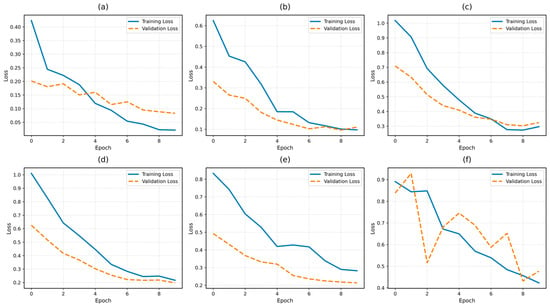
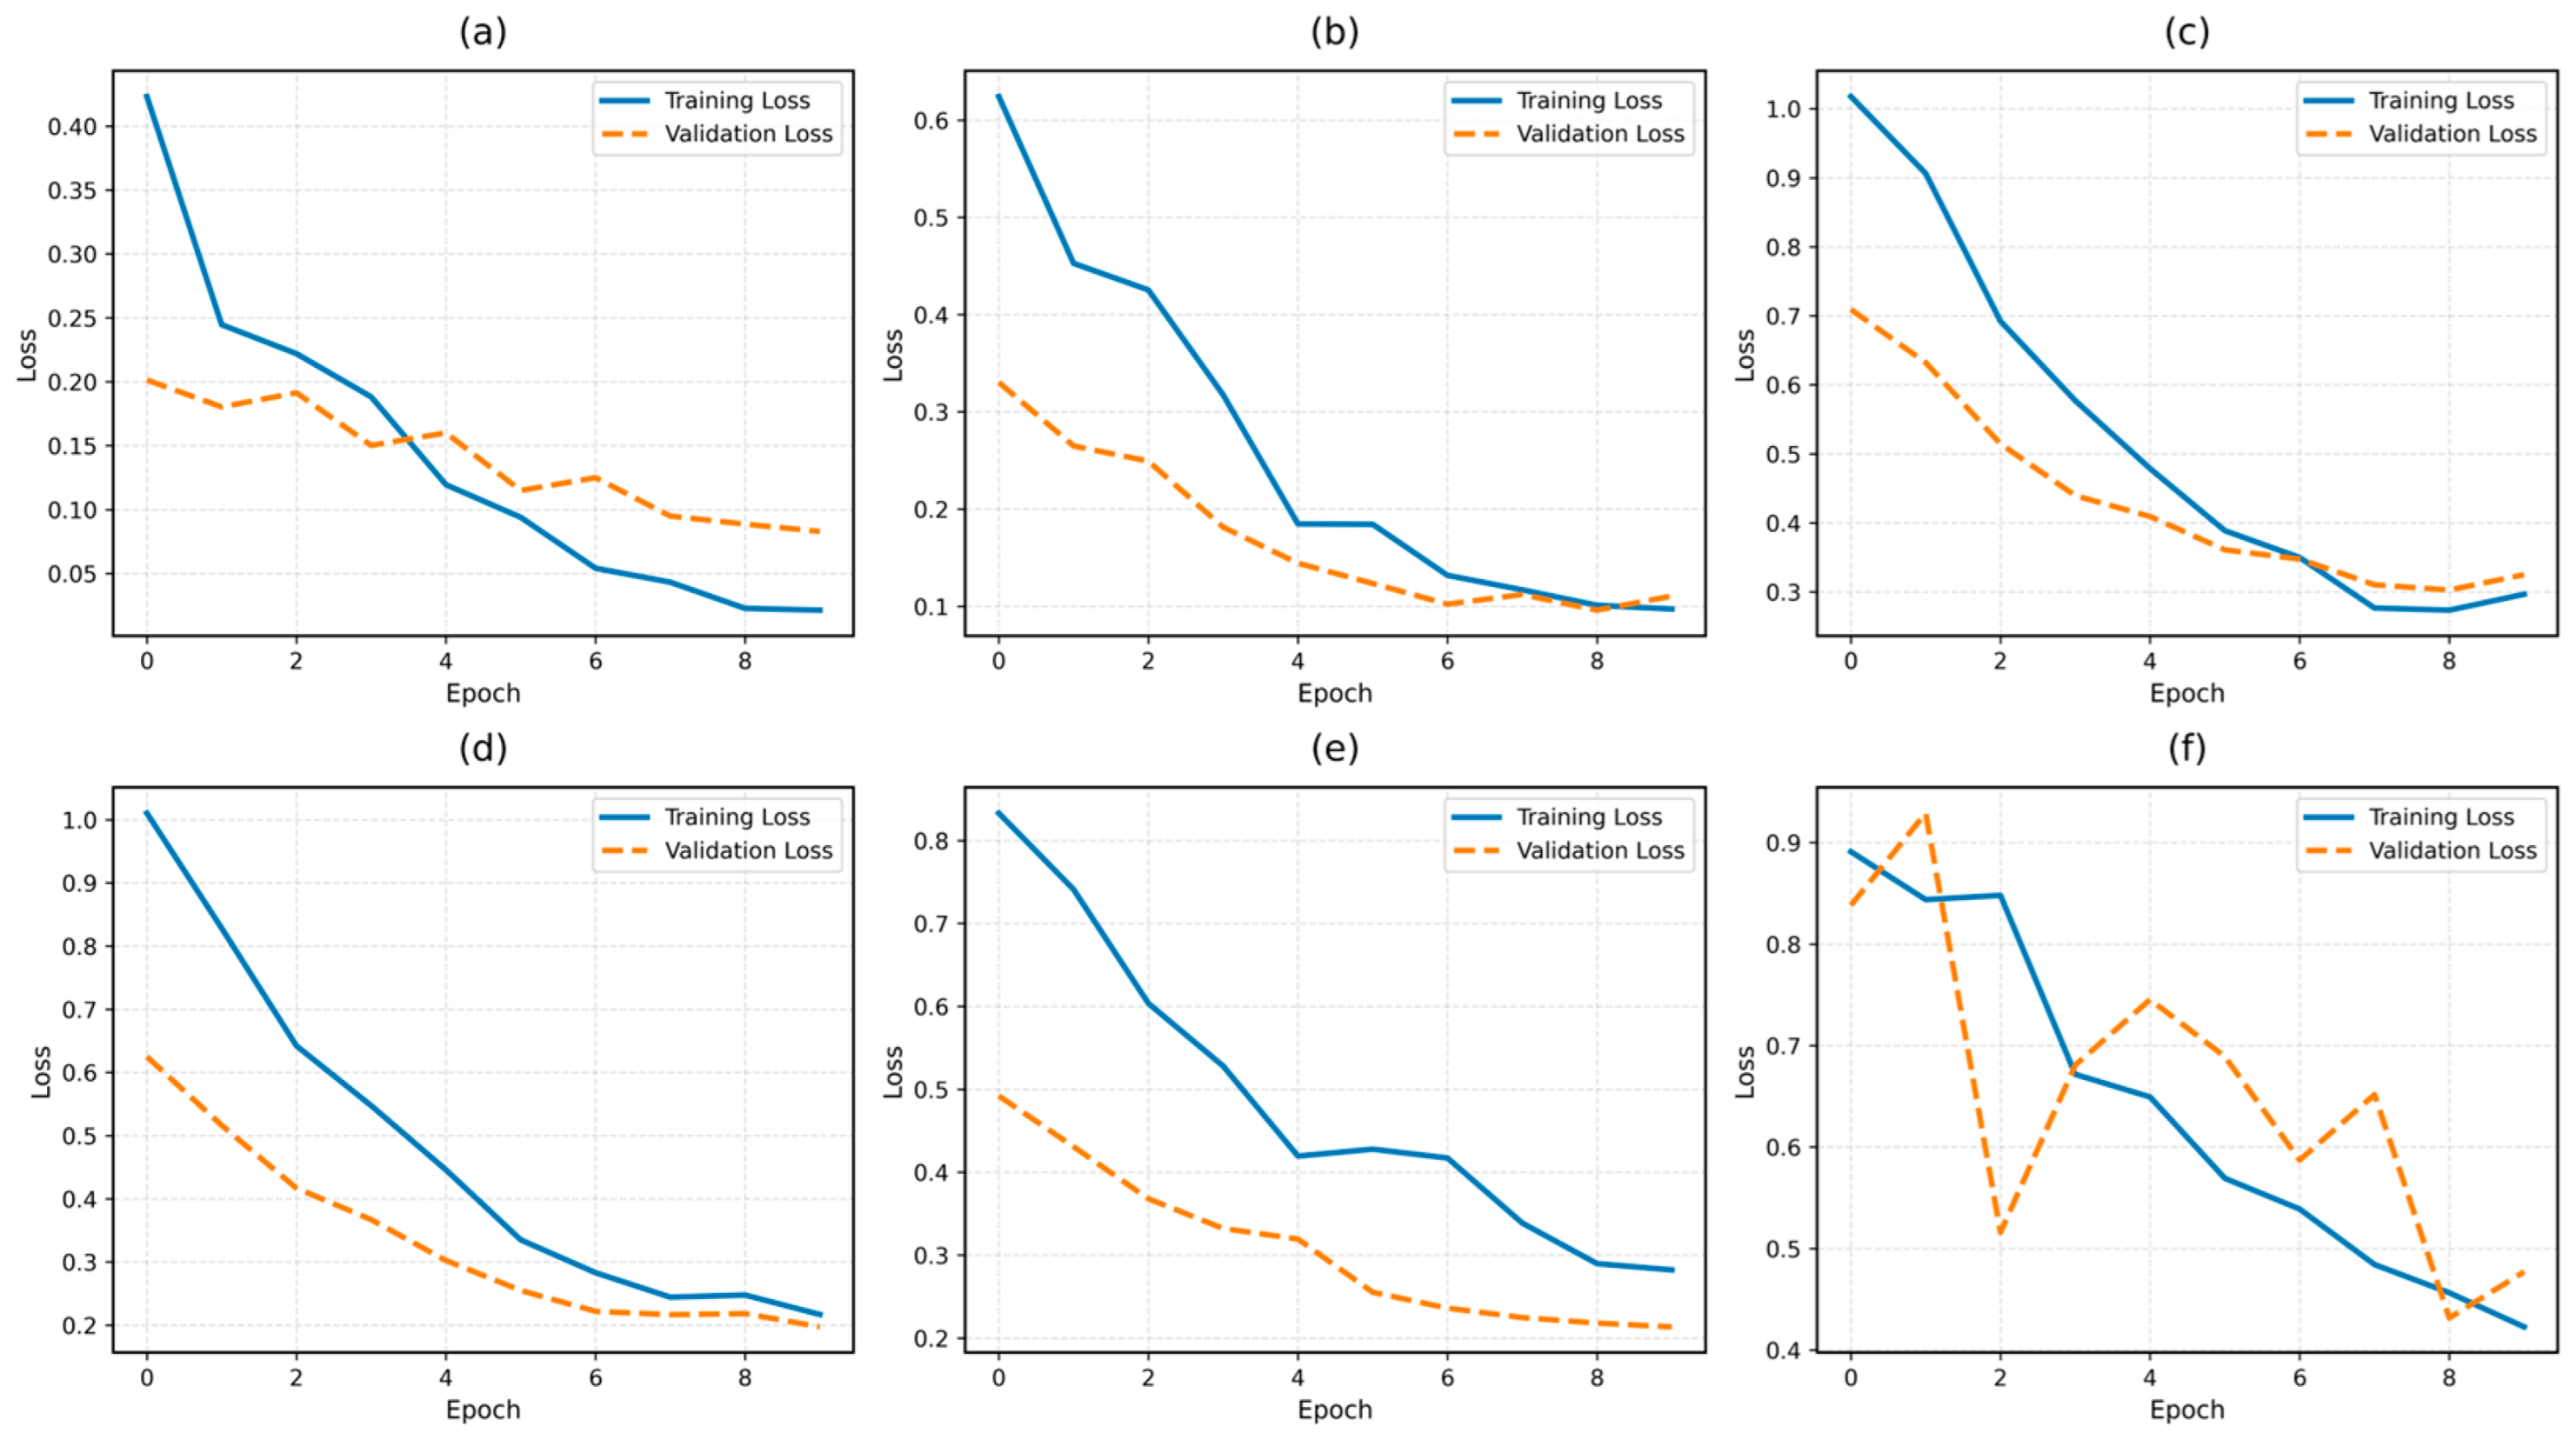
The training and validation loss trajectories for all six CNN architectures are illustrated in Figure 5. ConvNeXt and ResNet exhibited the most stable convergence trajectories, with validation loss declining monotonically and closely tracking training loss throughout fine-tuning—indicating low risk of overfitting. DenseNet201 showed greater early-epoch oscillation attributable to the gradient complexity of dense connectivity, but converged to a stable solution by the midpoint of training. EfficientNet-B3 and MobileNetV3 plateaued at substantially higher loss values (approximately 0.28–0.35 vs. 0.10–0.15 for ConvNeXt and ResNet), indicating a representational capacity limitation for this fine-grained texture classification task that cannot be resolved by extended training alone.
Figure 5.
Training and validation loss curves for all six CNN architectures. Solid lines represent training loss, and dashed lines represent validation loss.
Figure 5 illustrates the training (solid line) and validation (dashed line) loss curves for six CNN architectures across epochs: (a) ConvNeXt, showing rapid convergence and stable low validation loss; (b) ResNet, demonstrating consistent decline with minor fluctuations in later epochs; (c) DenseNet201, exhibiting gradual convergence with slight divergence between training and validation loss; (d) InceptionV3, showing steady improvement but higher final loss compared to top-performing models; (e) EfficientNet-B3, indicating slower convergence and relatively higher validation loss; and (f) MobileNetV3, displaying noticeable fluctuations in validation loss, suggesting less stable generalization. All models exhibit a rapid decrease in loss during the early training phase, particularly within the first 5–10 epochs, indicating efficient initial learning. However, convergence—defined as the stabilization of validation loss—is achieved progressively at later epochs and varies across architectures, rather than occurring at a single fixed point. ConvNeXt and ResNet demonstrate the most stable convergence behavior, with validation loss closely tracking training loss throughout fine-tuning, suggesting effective generalization and minimal overfitting. In contrast, EfficientNet-B3 and MobileNetV3 plateau at higher loss values (approximately 0.28–0.35), compared to the lower range observed in the top-performing models (approximately 0.10–0.15), indicating limitations in representational capacity for this fine-grained classification task.
3.5. Web Application Deployment and Efficiency–Accuracy Trade-Off
In this study, the primary deployment scenario is a server-based web application hosted on Hugging Face Spaces, where moderate computational resources are available. Nevertheless, the inclusion of MobileNetV3 enables analysis of performance under resource-constrained environments such as mobile or edge devices. The model-registry architecture enabled smooth model updates without requiring application redeployment. User interface evaluation confirmed that the three-component output design (predicted label, confidence score, per-class probability table) supported effective use by both non-expert farmers and specialist agronomists.
Beyond model accuracy, this study addresses a practical limitation frequently identified in precision agriculture research: the gap between laboratory model development and real-world deployment [29,30]. The system provides disease predictions along with confidence scores and agronomic guidance, enabling non-specialist users to interpret the results. The high diagnostic accuracy has important implications for crop management: early and accurate identification of foliar diseases allows farmers to apply targeted treatments rather than broad-spectrum pesticides, reducing chemical overuse and improving environmental sustainability.
The approximately 7% accuracy gap between ConvNeXt (98.00%) and MobileNetV3 (90.83%) raises a practical question for deployment contexts. For web-based deployment on server infrastructure—as demonstrated in this study—there is no practical incentive to use a lighter model, as ConvNeXt inference at 0.54 s per image is already well within farmer consultation response time. However, for offline edge deployment on Android or IoT devices without cloud connectivity—relevant for remote orchard settings in Thailand where internet access may be intermittent—MobileNetV3 or a knowledge-distilled version of ConvNeXt may be preferable. Future research should methodically assess this trade-off under embedded deployment constraints.
The application performs most reliably when images are captured under natural daylight conditions with adequate illumination, where leaf color, texture, and lesion boundaries are clearly distinguishable. In such conditions, the trained models can effectively extract discriminative features consistent with the training data distribution.
However, performance may degrade under challenging environmental conditions, including low-light environments, strong shadows, overexposure, or uneven illumination. Similarly, images with motion blur, partial occlusion (e.g., overlapping leaves), or highly cluttered backgrounds may reduce classification accuracy due to the loss of salient visual features.
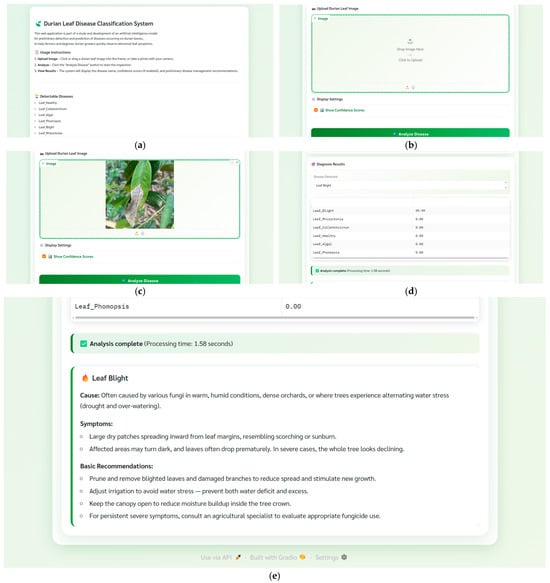
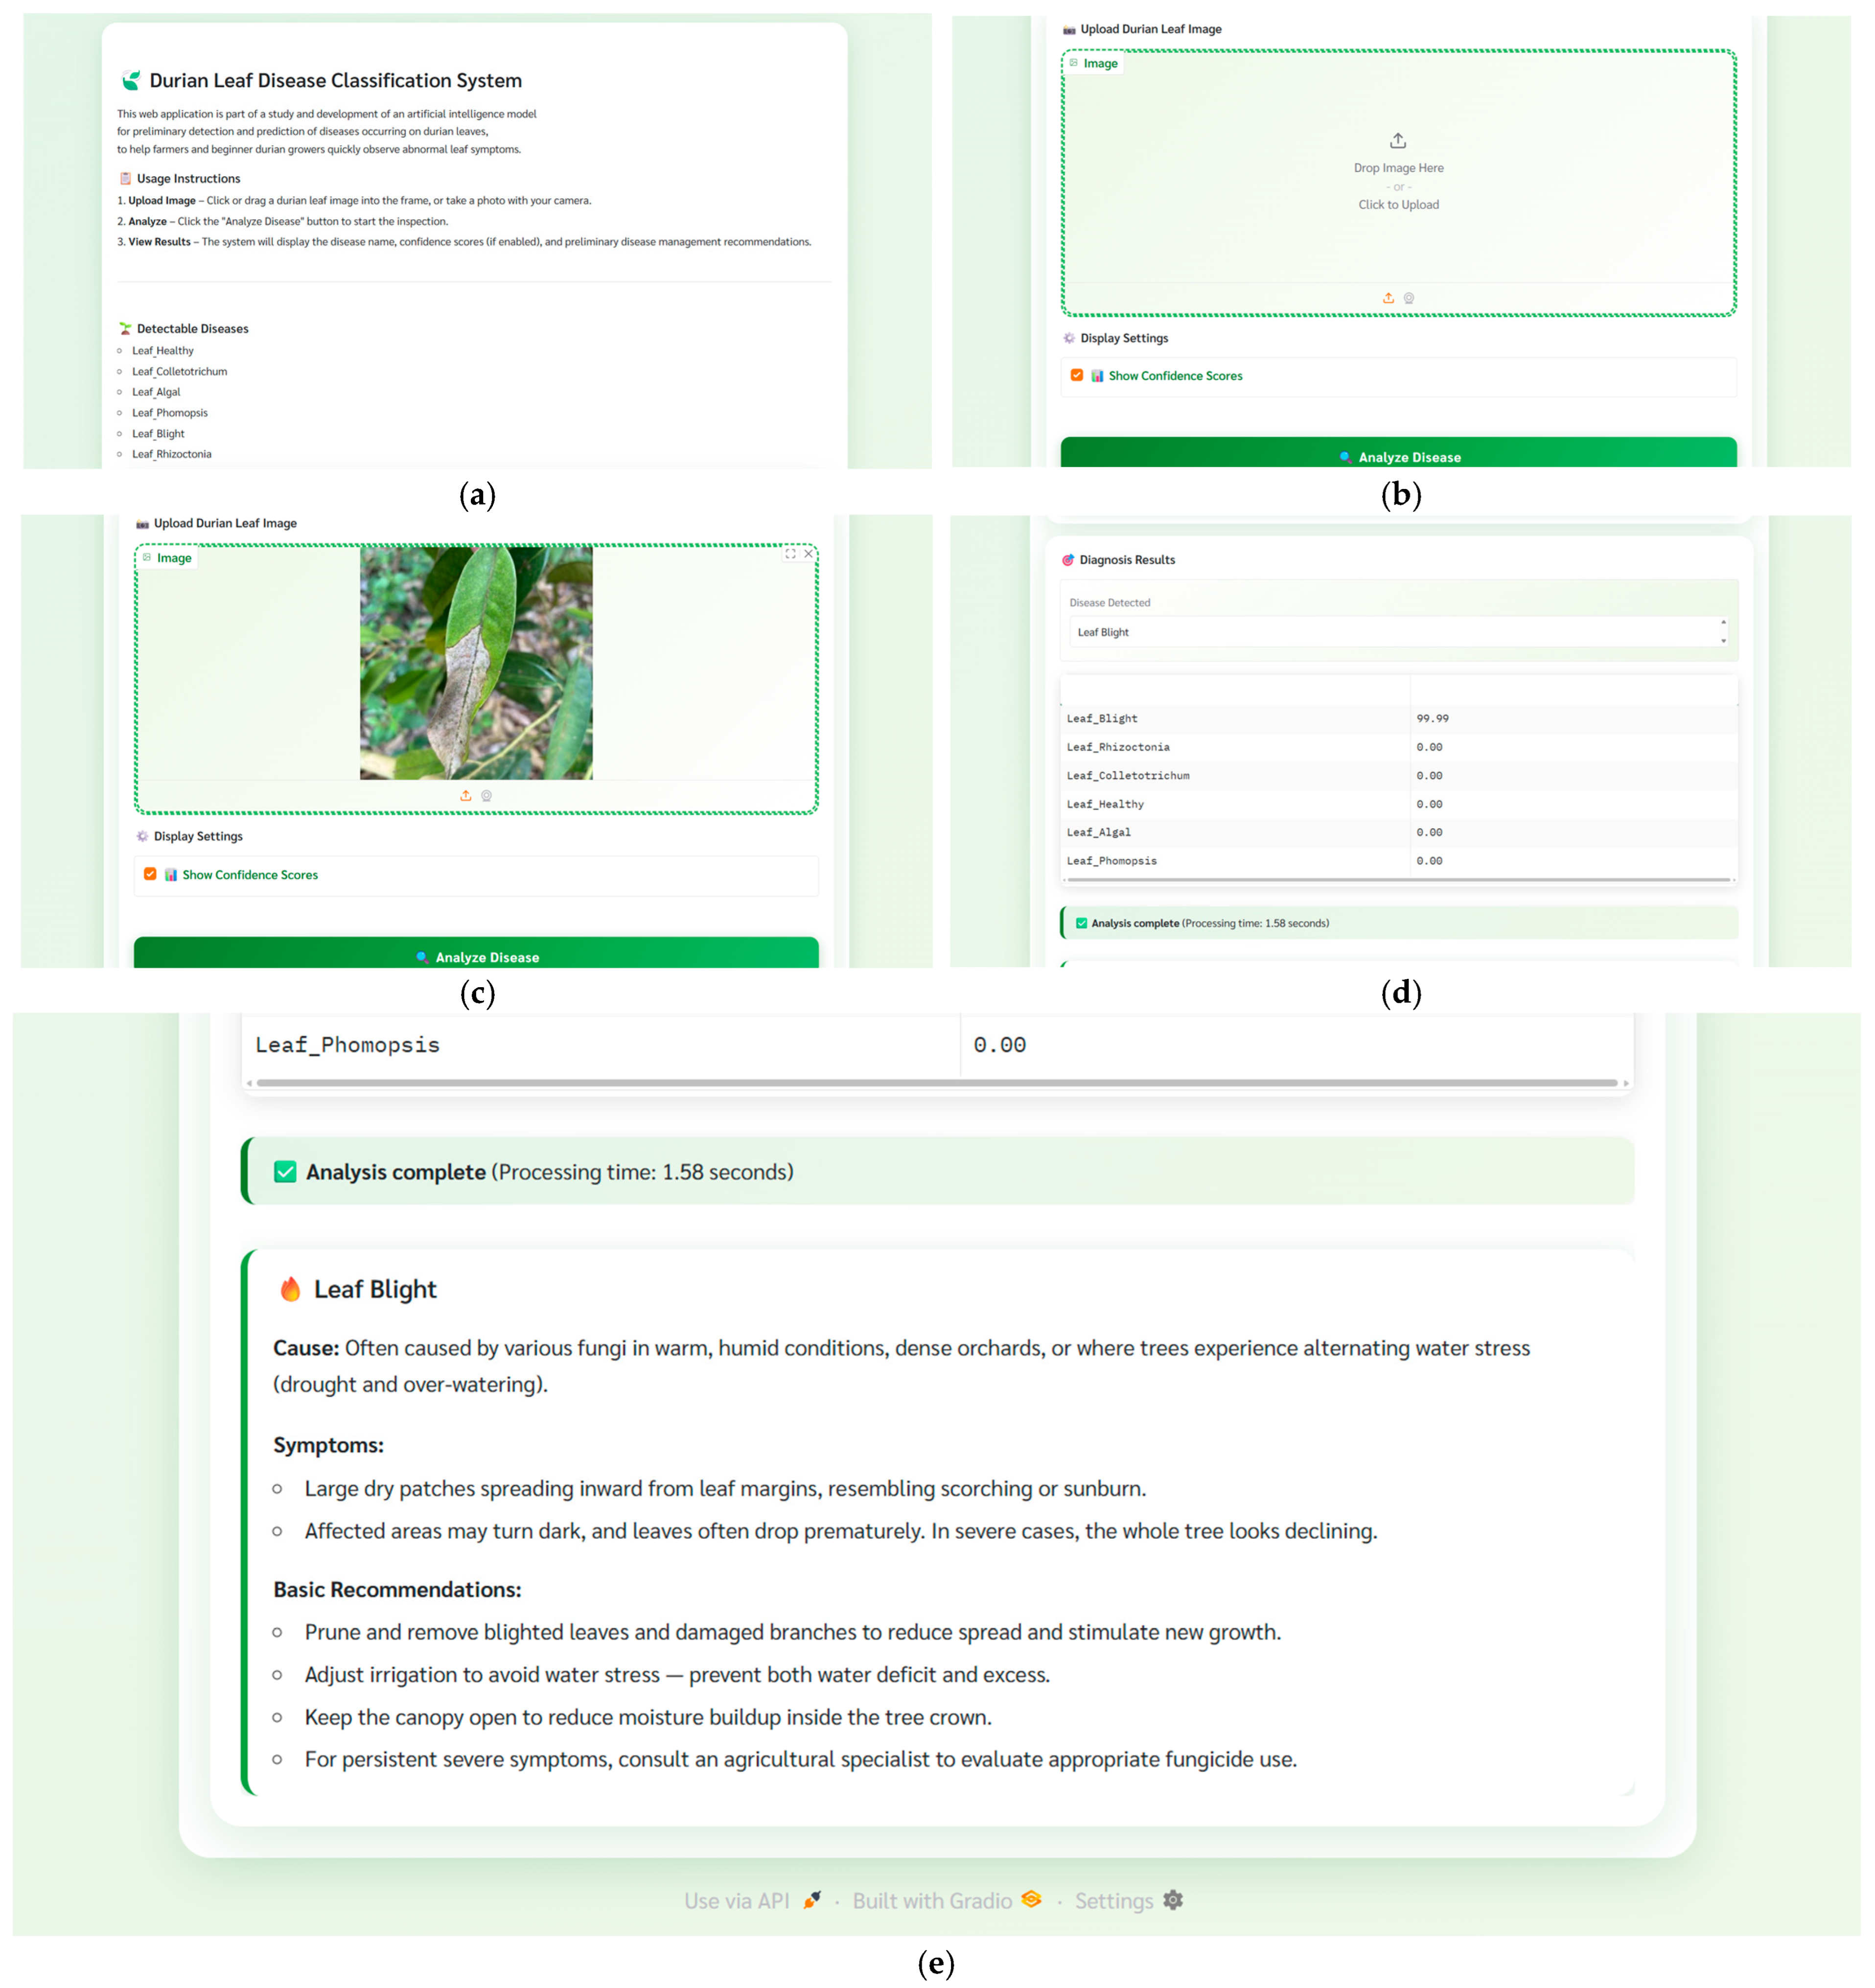
Figure 6 shows screenshots of the ConvNeXt-based durian leaf disease diagnostic web application deployed via Gradio on Hugging Face Spaces: (a) main interface with system overview; (b) image upload interface; (c) uploaded leaf image preview; (d) prediction output showing the diagnosed class, confidence score, and per-class probability distribution; (e) agronomic guidance panel. All interface elements have been translated into English for clarity and accessibility. The user interface was standardized in English to improve accessibility for international users and researchers.
Figure 6.
Web application interface: (a) system overview; (b) image upload; (c) image preview; (d) prediction with label and confidence; (e) agronomic guidance.
3.6. Web Application Evaluation
This section presents the evaluation of the proposed web-based durian leaf disease classification system through both expert and general user perspectives. The assessment aims to examine key dimensions, including usability, system performance, accuracy, and practical applicability, to determine the system’s overall effectiveness. By integrating feedback from domain experts and end users, this evaluation provides comprehensive insights into the system’s strengths and areas for further improvement in real-world deployment.
3.6.1. Expert Evaluation of System Performance
The results of the expert evaluation (n = 3) indicate that the proposed web-based durian leaf disease classification system achieved an overall satisfaction at a high level (M = 4.35, SD = 0.36). Among the evaluated dimensions, usability and ease of use received the highest rating (M = 4.72, SD = 0.35), reflecting the effectiveness of the system’s interface design in facilitating intuitive interaction. This suggests that the implementation of the Gradio framework successfully supports accessibility and user-centered design principles.
The system performance dimension was also rated at the highest level (M = 4.56, SD = 0.42), indicating that the system is capable of delivering rapid and stable responses. This finding is consistent with the experimental results reported earlier, where the system demonstrated an average processing time of 0.54 s per image, highlighting its suitability for real-time applications.
In contrast, the accuracy of disease classification (M = 3.87, SD = 0.42) and suitability for real-world organizational use (M = 3.67, SD = 0.58) received comparatively lower ratings, although both remained within the high level. These results suggest that while the system is functionally robust and user-friendly, further improvements are needed in classification precision and contextual adaptability for practical deployment. Expert feedback emphasized the need to expand disease categories and enhance model robustness when handling images with varying perspectives and environmental conditions.
3.6.2. General User Evaluation
The evaluation results from general users (n = 30) revealed an overall satisfaction at a high level (M = 4.11, SD = 0.53), indicating positive user perception toward the system. Among the five evaluated dimensions, system performance received the highest score (M = 4.22, SD = 0.58), suggesting that users perceived the system as responsive and stable during operation. This aligns with the expert evaluation, reinforcing the system’s technical reliability. The dimensions of ease of use (M = 4.16, SD = 0.60) and perceived benefits and intention to use (M = 4.12, SD = 0.54) were also rated highly, indicating that users found the system intuitive and beneficial for diagnosing durian leaf diseases. These findings demonstrate the system’s potential to support practical agricultural decision-making by reducing diagnostic time and uncertainty.
Although overall satisfaction received the lowest mean score (M = 4.01, SD = 0.60), it remained within the high level, suggesting that users generally accepted the system despite minor limitations. Similarly, accuracy and data quality (M = 4.06, SD = 0.61) were positively evaluated, reflecting user confidence in the system outputs.
3.7. Limitations
Several limitations should be acknowledged. First, although the dataset is the largest collection assembled for this task, it still draws heavily on two primary sources, limiting its geographic and seasonal diversity. Disease symptoms may vary with climate conditions, cultivation practices, and pathogen strains, potentially affecting model generalisability.
From a technical perspective, the system assumes input images of sufficient resolution and clarity, typically achievable with modern consumer-grade smartphone cameras. While the model generalizes well across typical mobile devices, performance may decline when using low-resolution sensors, heavily compressed images, or cameras with poor color fidelity. Additionally, variations in camera characteristics (e.g., white balance, exposure settings) may introduce distribution shifts relative to the training data.
These findings suggest that user guidance on image capture—such as ensuring adequate lighting, avoiding motion blur, and focusing clearly on the target leaf—can further improve system reliability in real-world deployment.
Second, while the deployed web application demonstrates the feasibility of real-world implementation, the system has not yet been evaluated through a formal field usability study with farmers. User acceptance, interpretability, and integration into existing agricultural workflows remain important topics for future research.
Third, the current system performs classification on individual leaf images and does not incorporate spatial context at the whole-tree or orchard level. Integrating object detection or segmentation approaches may enable more comprehensive disease monitoring across larger agricultural areas.
Future research should expand benchmarking to include ultra-lightweight architectures such as GhostNet, ShuffleNetV2, and SqueezeNet for low-power edge deployment. It should also examine larger batch sizes and gradient accumulation for efficiency, and explore robustness improvements through illumination-invariant augmentation and domain adaptation.
4. Conclusions
This study presented a comprehensive deep learning-based framework for classifying durian leaf diseases under real-world field conditions. Six representative convolutional neural network architectures—ConvNeXt, ResNet, DenseNet201, InceptionV3, EfficientNet-B3, and MobileNetV3—were systematically evaluated using a unified training and evaluation protocol on a dataset comprising 6119 images across six disease classes. The results demonstrated that ConvNeXt achieved the highest performance, with an accuracy of 98.00% and a weighted F1-score of 0.98, confirming its suitability for fine-grained plant disease recognition tasks.
From a methodological perspective, this study contributes a robust benchmarking framework that enables fair comparisons across architectures while incorporating class-imbalance handling via weighted loss functions. From a practical standpoint, deploying the best-performing model as a publicly accessible web application demonstrates the feasibility of translating deep learning models into real-world agricultural decision-support systems.
Despite these contributions, several limitations remain. The dataset, while diverse, remains limited in its geographic and seasonal variation, which may affect generalisability. In addition, the effectiveness of class imbalance mitigation strategies was not evaluated in controlled comparative experiments, and future work should explore alternative approaches, such as focal loss, resampling, and data augmentation. Furthermore, extending the system to support object detection or segmentation at the whole-plant or orchard level could enhance its applicability in large-scale agricultural monitoring.
Overall, the findings highlight the potential of modern CNN architectures to support precision agriculture by enabling accurate, rapid, and scalable disease diagnosis. Future research should focus on improving robustness under diverse environmental conditions and optimizing models for deployment in resource-constrained edge environments.
Author Contributions
Conceptualization, W.C. and R.K.; methodology, R.K., W.C., N.I.-O. and T.B.; software, R.K., W.C., N.I.-O. and T.B.; validation, W.C., N.I.-O. and T.B.; formal analysis, R.K., W.C., N.I.-O. and T.B.; investigation, R.K., W.C., N.I.-O. and T.B.; resources, R.K. and W.C.; data curation, R.K.; writing—original draft preparation, R.K., W.C., N.I.-O. and T.B.; writing—review and editing, R.K., W.C., N.I.-O. and T.B.; visualization, R.K., W.C., N.I.-O. and T.B.; supervision, W.C., N.I.-O. and T.B.; project administration, W.C. and T.B. All authors have read and agreed to the published version of the manuscript.
Funding
This research received no external funding.
Institutional Review Board Statement
Not applicable.
Informed Consent Statement
Not applicable.
Data Availability Statement
The datasets analyzed in this study are publicly available. The Durian Leaf Disease Dataset can be accessed at Durian Leaf Disease Dataset (https://www.kaggle.com/datasets/cthng123/durian-leaf-disease-dataset, accessed on 1 January 2025), and the Vietnamese durian leaf disease benchmark is available via Vietnamese durian leaf disease benchmark (https://doi.org/10.1016/j.dib.2022.108320, accessed on 1 January 2025). All code for data preprocessing, model training, evaluation, and explainability analysis is openly available on Google Colab (https://colab.research.google.com/drive/1LnJssd161-5OBD-Y-XPHiv3eT2Hu6nJH?usp=sharing, accessed on 2 January 2026). The deployed web application is accessible via Hugging Face Spaces (https://huggingface.co/spaces/Rapeepat7857/Durian-Leaf-Diseases-Classification, accessed on 2 January 2026). The repository includes version-controlled scripts, dependencies, and documentation to ensure full reproducibility of the results.
Acknowledgments
During the preparation of this work, the authors utilized ChatGPT (OpenAI, GPT-5.3) and Grammarly (Grammarly Inc., Premium version, web-based application) to enhance their English proficiency. All authors have reviewed and edited the manuscript after using these tools and take full responsibility for the final content. No individuals are acknowledged in this section without their prior consent.
Conflicts of Interest
The authors declare no conflicts of interest.
Abbreviations
The following abbreviations are used in this manuscript:
| CNN | Convolutional Neural Network |
| ViT | Vision Transformer |
| AI | Artificial Intelligence |
| FP16 | Half-Precision Floating Point |
| F1-score | Harmonic Mean of Precision and Recall |
| GFLOPs | Giga Floating Point Operations |
| IoT | Internet of Things |
| CLAHE | Contrast Limited Adaptive Histogram Equalization |
| YOLO | You Only Look Once |
References
- Money & Banking. Thai Durian Export Value 2022 Statistics. Available online: https://moneyandbanking.co.th/2023/41499/ (accessed on 1 January 2023).
- Agrios, G.N. Plant Pathology, 5th ed.; Elsevier Academic Press: Amsterdam, The Netherlands, 2005. [Google Scholar]
- Savary, S.; Ficke, A.; Aubertot, J.N.; Hollier, C. Crop Losses Due to Diseases and Their Implications for Global Food Production Losses and Food Security. Food Secur. 2012, 4, 519–537. [Google Scholar] [CrossRef] [Scilit]
- Popp, J.; Pető, K.; Nagy, J. Pesticide Productivity and Food Security: A Review. Agron. Sustain. Dev. 2013, 33, 243–255. [Google Scholar] [CrossRef] [Scilit]
- Chatthaicharoen, P.; Duangburong, S.; Phruksaphanrat, B. Classification of Durian Foliar Diseases by Xception and Mask R-CNN Models. Eng. Technol. Appl. Sci. Res. 2025, 15, 27653–27659. [Google Scholar] [CrossRef] [Scilit]
- LeCun, Y.; Bengio, Y.; Hinton, G. Deep Learning. Nature 2015, 521, 436–444. [Google Scholar] [CrossRef] [Scilit] [PubMed]
- Mohanty, S.P.; Hughes, D.P.; Salathé, M. Using Deep Learning for Image-Based Plant Disease Detection. Front. Plant Sci. 2016, 7, 1419. [Google Scholar] [CrossRef] [Scilit] [PubMed]
- Ferentinos, K.P. Deep Learning Models for Plant Disease Detection and Diagnosis. Comput. Electron. Agric. 2018, 145, 311–318. [Google Scholar] [CrossRef] [Scilit]
- Reddy, P.; Singh, J.; Rawat, G.S.; Shashikant; Habelalmateen, M.I.; Vani, M.S. Development and Testing of a CNN-Based Smart Web Application Deep Learning for Early Detection of Plant Diseases. In Proceedings of the 2nd International Conference on Advanced Computing and Communication Technologies (ICACCTech), Sonipat, India, 23–24 November 2024; IEEE: Piscataway, NJ, USA, 2024; pp. 319–324. [Google Scholar] [CrossRef] [Scilit]
- Shaikh, Q.; Bronkar, B.; Kazi, O.; Patel, A.; Kazi, S.B.; Sadruddin, S. Automated Tomato Leaf Disease Classification Using CNNs for Real-Time Field Application. In Proceedings of the 12th International Conference on Computing for Sustainable Global Development (INDIACom), New Delhi, India, 2–4 April 2025; IEEE: Piscataway, NJ, USA, 2025; pp. 1–6. [Google Scholar] [CrossRef] [Scilit]
- Paul, H.; Udayangani, H.; Umesha, K.; Lankasena, N.; Liyanage, C.; Thambugala, K.M. Maize Leaf Disease Detection Using Convolutional Neural Network: A Mobile Application Based on Pre-Trained VGG16 Architecture. N. Z. J. Crop Hortic. Sci. 2024, 53, 367–383. [Google Scholar] [CrossRef] [Scilit]
- Sabarre, A.; Navidad, A.; Torbela, D.S.; Adtoon, J.J. Development of Durian Leaf Disease Detection on an Android Device. Int. J. Electr. Comput. Eng. 2021, 11, 4962–4971. [Google Scholar] [CrossRef] [Scilit]
- Boondach, M.; Chaisiriprasert, P. Improving Durian Leaf Disease Detection Using LAB Color Space and CLAHE Technique with YOLOv8 Integration. In Proceedings of the 8th International Conference on Information Technology (InCIT), Chonburi, Thailand, 14–15 November 2024; IEEE: Piscataway, NJ, USA, 2024; pp. 162–167. [Google Scholar] [CrossRef] [Scilit]
- Piriyasupakij, J.; Prasitphan, R. Development of Self-Governing Drones to Detect Diseases on the Plant Leaves of Durian Trees. In Proceedings of the 27th International Computer Science and Engineering Conference (ICSEC), Khon Kaen, Thailand, 13–15 September 2023; IEEE: Piscataway, NJ, USA, 2023; pp. 258–265. [Google Scholar] [CrossRef] [Scilit]
- Nguyen, H.V.; Pham, T.H.; Tran, M.T. A Durian Leaf Image Dataset of Common Diseases in Vietnam for Agricultural Diagnosis. Data Brief 2022, 43, 108320. [Google Scholar] [CrossRef] [Scilit]
- Daud, M.M.; Abualqumssan, A.; Nor Rashid, F.A.; Md Saad, M.H.; Wan Zaki, W.M.D.; Mohd Satar, N.S. Durian Disease Classification Using Vision Transformer for Cutting-Edge Disease Control. Int. J. Adv. Comput. Sci. Appl. 2023, 14, 446. [Google Scholar] [CrossRef] [Scilit]
- Mat Daud, M.; Abualqumssan, A.; Rashid, F.; Md Saad, M.H. Durian Disease Classification Using Transfer Learning for a Disease Management System. J. Inf. Syst. Technol. Manag. 2023, 8, 67–77. [Google Scholar] [CrossRef] [Scilit]
- Liu, Z.; Mao, H.; Wu, C.-Y.; Feichtenhofer, C.; Darrell, T.; Xie, S. A ConvNet for the 2020s. In Proceedings of the IEEE/CVF Conference on Computer Vision and Pattern Recognition (CVPR), New Orleans, LA, USA, 18–24 June 2022; IEEE: Piscataway, NJ, USA, 2022; pp. 11966–11976. [Google Scholar] [CrossRef] [Scilit]
- Cthng123. Durian Leaf Disease Dataset. Available online: https://www.kaggle.com/datasets/cthng123/durian-leaf-disease-dataset (accessed on 1 January 2025).
- Johnson, J.M.; Khoshgoftaar, T.M. Survey on Deep Learning with Class Imbalance. J. Big Data 2019, 6, 27. [Google Scholar] [CrossRef] [Scilit]
- He, K.; Zhang, X.; Ren, S.; Sun, J. Deep Residual Learning for Image Recognition. In Proceedings of the IEEE Conference on Computer Vision and Pattern Recognition (CVPR), Las Vegas, NV, USA, 26 June–1 July 2016; IEEE: Piscataway, NJ, USA, 2016; pp. 770–778. [Google Scholar] [CrossRef] [Scilit]
- Huang, G.; Liu, Z.; Van der Maaten, L.; Weinberger, K.Q. Densely Connected Convolutional Networks. In Proceedings of the IEEE Conference on Computer Vision and Pattern Recognition (CVPR), Honolulu, HI, USA, 21–26 July 2017; IEEE: Piscataway, NJ, USA, 2017; pp. 2261–2269. [Google Scholar] [CrossRef] [Scilit]
- Szegedy, C.; Vanhoucke, V.; Ioffe, S.; Shlens, J.; Wojna, Z. Rethinking the Inception Architecture for Computer Vision. In Proceedings of the IEEE Conference on Computer Vision and Pattern Recognition (CVPR), Las Vegas, NV, USA, 26 June–1 July 2016; IEEE: Piscataway, NJ, USA, 2016; pp. 2818–2826. [Google Scholar] [CrossRef] [Scilit]
- Tan, M.; Le, Q.V. EfficientNet: Rethinking Model Scaling for Convolutional Neural Networks. In Proceedings of the 36th International Conference on Machine Learning (ICML), Long Beach, CA, USA, 9–15 June 2019; pp. 6105–6114. [Google Scholar]
- Howard, A.; Sandler, M.; Chu, G.; Chen, L.-C.; Chen, B.; Tan, M.; Wang, W.; Zhu, Y.; Pang, R.; Vasudevan, V.; et al. Searching for MobileNetV3. In Proceedings of the IEEE/CVF International Conference on Computer Vision (ICCV), Seoul, Republic of Korea, 27 October–2 November 2019; IEEE: Piscataway, NJ, USA, 2019; pp. 1314–1324. [Google Scholar] [CrossRef] [Scilit]
- Kaya, A.; Keceli, A.S.; Catal, C.; Yalic, H.Y.; Temucin, H.; Tekinerdogan, B. Analysis of Transfer Learning for Deep Neural Network Based Plant Classification Models. Comput. Electron. Agric. 2019, 158, 20–29. [Google Scholar] [CrossRef] [Scilit]
- Powers, D.M.W. Evaluation: From Precision, Recall, and F-Measure to ROC, Informedness, Markedness, and Correlation. J. Mach. Learn. Technol. 2011, 2, 37–63. [Google Scholar]
- Sokolova, M.; Lapalme, G. A Systematic Analysis of Performance Measures for Classification Tasks. Inf. Process. Manag. 2009, 45, 427–437. [Google Scholar] [CrossRef] [Scilit]
- Abid, A.; Abdalla, A.; Abid, A.; Khan, D.; Alfozan, A.; Zou, J.Y. Gradio: Hassle-Free Sharing and Testing of ML Models in the Wild. arXiv 2019, arXiv:1906.02569. [Google Scholar]
- Wolf, T.; Debut, L.; Sanh, V.; Chaumond, J.; Delangue, C.; Moi, A.; Cistac, P.; Rault, T.; Louf, R.; Funtowicz, M.; et al. Transformers: State-of-the-Art Natural Language Processing. In Proceedings of the 2020 Conference on Empirical Methods in Natural Language Processing: System Demonstrations (EMNLP), Online, 16–20 November 2020; Association for Computational Linguistics: Stroudsburg, PA, USA, 2020; pp. 38–45. [Google Scholar] [CrossRef] [Scilit]
- Shorten, C.; Khoshgoftaar, T.M. A Survey on Image Data Augmentation for Deep Learning. J. Big Data 2019, 6, 60. [Google Scholar] [CrossRef] [Scilit]

Disclaimer/Publisher’s Note: The statements, opinions and data contained in all publications are solely those of the individual author(s) and contributor(s) and not of MDPI and/or the editor(s). MDPI and/or the editor(s) disclaim responsibility for any injury to people or property resulting from any ideas, methods, instructions or products referred to in the content. |
© 2026 by the authors. Licensee MDPI, Basel, Switzerland. This article is an open access article distributed under the terms and conditions of the Creative Commons Attribution (CC BY) license.