


Abstract
Urban seismic vulnerability poses severe challenges for disaster preparedness in Lima, Peru, where a long-standing seismic gap increases risk to a metropolitan population of approximately ten million residents. This study presents an adaptive multi-objective optimization framework that dynamically adjusts shelter allocation priorities across earthquake intensity scenarios. The methodology integrates spatial data on population distribution, infrastructure vulnerability, and seismic hazard zones to optimize three competing objectives through the NSGA-III algorithm: inter-shelter spacing, population coverage, and safety. Model parameters were calibrated using controlled synthetic scenarios and subsequently validated with real-world data from Lima. Under the high-impact scenario used by the Municipality of Lima, the official set of 356 designated shelters was compared with an optimized configuration selected from 5855 potential sites under identical hazard and demand conditions. The optimized solution increased population coverage by 66.82% and reduced the average distance to critical resources by 24.55%, while reducing service gaps in peripheral districts. Scenario-adaptive optimization improved the robustness of shelter planning by producing configurations that were better aligned with operational priorities as hazard severity escalated, supporting more equitable access in a resource-constrained urban context. This research contributes an evidence-based decision-support tool for emergency management, translating multi-objective trade-offs into actionable shelter layouts for Lima.
1. Introduction
Earthquakes remain among the most disruptive hazards for large urban regions because they generate not only structural collapse and infrastructure damage but also rapidly evolving needs for evacuation, temporary accommodation, and emergency service access. Post-earthquake shelter planning is fundamentally a spatial allocation problem: the adequacy of a shelter system depends not only on the number of designated sites, but also on whether the right sites are activated for the right conditions. Yet most operational frameworks rely on a fixed, pre-designated set of locations regardless of earthquake intensity, implicitly assuming that a single configuration can serve equally well across events of very different scale and geography. The limitations of this assumption have been documented in recent disasters. After the Great East Japan Earthquake, shelter demand surpassed pre-designated capacity and additional facilities had to be improvised to accommodate peak occupancy of over 470,000 people [1]. In Türkiye, both the uneven spatial distribution of assembly points relative to population density [2] and the inability of deployed units to meet minimum quantity and quality standards after the Kahramanmaraş earthquakes [3] illustrate how static configurations fail when impact patterns deviate from planning assumptions. Taken together, these cases suggest that shelter systems configured for a single impact level are unlikely to remain adequate as earthquake severity escalates.
These limitations are particularly consequential for Lima, Peru, where the combination of severe seismic exposure and a scenario-invariant shelter baseline creates precisely the preparedness gap illustrated by the cases above. Lima Metropolitan Area is exposed to severe seismic hazard due to its location along the central Peruvian subduction zone and the long-standing seismic gap associated with the 1746 earthquake. Official scenario studies relevant to Lima indicate that the accumulated strain could produce a future event on the order of Mw 8.5–8.8 [4,5], while the historical and instrumental seismicity of the central Peruvian coast also indicates the plausibility of smaller but still disruptive events across a broad magnitude range [6,7]. Under such conditions, the scale of displacement, the geography of impact, and the operational priorities of response are expected to differ substantially across intensity levels. In Lima, shelter deployment is framed within the National Disaster Risk Management System (SINAGERD), while the official Safe Zones Map provides the baseline network of designated locations [5,8]. However, this baseline is scenario-invariant: it relies on a pre-established set of sites and does not include an explicit mechanism to re-prioritize shelter selection according to earthquake severity, spatial heterogeneity in risk and vulnerability, or proximity to critical services. A configuration that may be acceptable under one impact level can therefore become suboptimal under another, particularly in peripheral districts where access gaps and social vulnerability are often more pronounced.
The shelter-planning literature has advanced considerably, but the problem remains only partially addressed. Earlier studies focused on locating shelters under accessibility and capacity constraints, typically assuming fixed demand and static decision structures. Later work recognized that post-earthquake demand changes over time and proposed hierarchical systems to better match time-varying needs [9], while more recent research has incorporated multi-objective and robust formulations to handle uncertainty and competing planning goals [10,11]. Some studies have also begun to address post-disaster conditions and risk more explicitly: Moghri and Khalili noted that only a few studies account for post-disaster circumstances when identifying optimal shelter locations [12], Tang and Osaragi showed that much previous work prioritizes distance or cost while overlooking risk factors [13], and Tun et al. demonstrated that dynamic changes in evacuation demand significantly affect both the number and location of shelters to be opened [14]. Nevertheless, the literature still provides limited guidance on how changing earthquake severity can be translated into scenario-specific operational priorities—such as shifting emphasis from spatial dispersion in lower-intensity events to stronger coverage and safety requirements under catastrophic conditions. To address this gap, this study presents a scenario-adaptive multi-objective optimization framework for post-earthquake shelter planning in Lima across five earthquake intensity scenarios. The framework integrates geospatial data on vulnerable population, seismic risk and vulnerability, candidate shelter locations, and proximity to critical services, while NSGA-III identifies Pareto-efficient configurations that balance trade-offs among inter-shelter spacing, population coverage, and safety across escalating seismic intensities.
The main contributions of this work are: (i) a scenario-adaptive weighting scheme that systematically adjusts shelter planning priorities across five earthquake intensity levels; (ii) a multi-objective optimization framework integrating population demand, seismic vulnerability, and critical infrastructure proximity; and (iii) an interactive decision-support simulator enabling transparent benchmarking against the official municipal plan for Lima.
The remainder of this paper is organized as follows: Section 2 describes the research methods and study design. Section 3 presents the results across earthquake intensity scenarios. Section 4 discusses the main implications and limitations of the proposed framework. Finally, Section 5 concludes the paper with key findings and future research directions.
2. Materials and Methods
2.1. Study Area and Baseline Configuration
The study was conducted in the Lima Metropolitan Area, Peru, which was operationally grouped into four zones (Central, East, North, and South) to facilitate spatial reporting and planning interpretation.
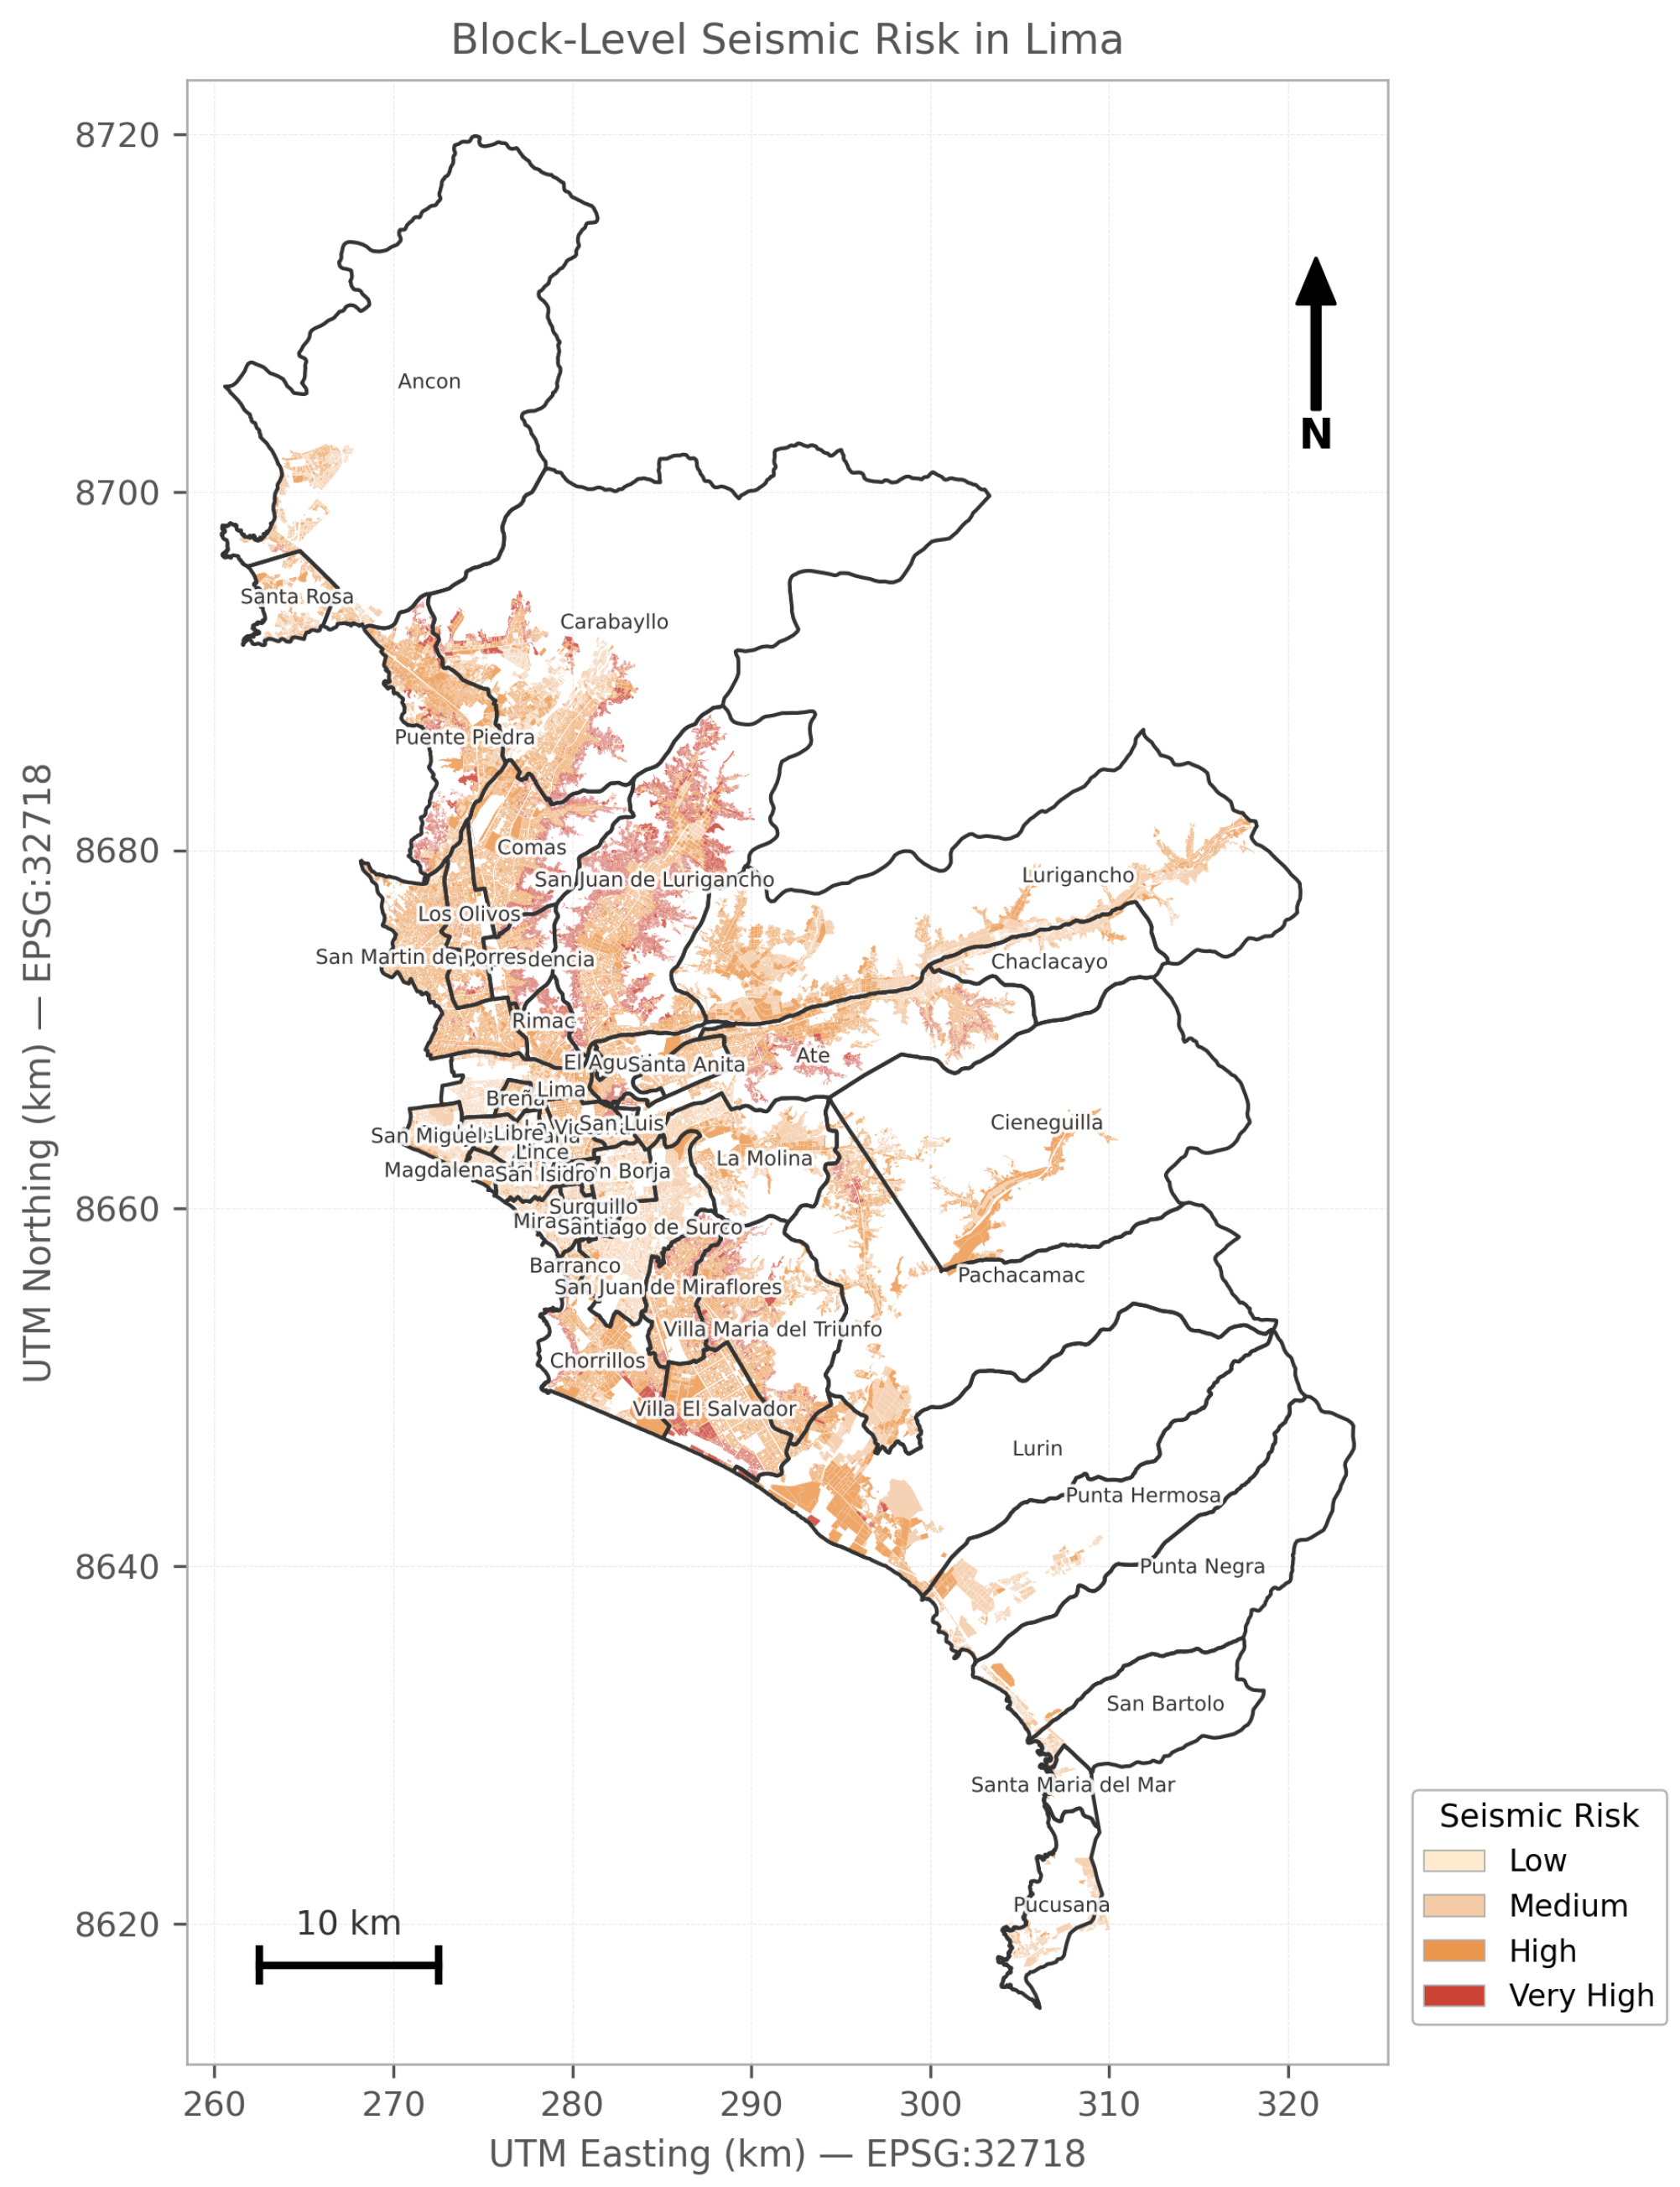
Figure 1 shows the spatial distribution of seismic risk at the block level across Lima Metropolitan Area, highlighting marked spatial heterogeneity relevant for shelter siting. The map represents seismic risk independently from seismic vulnerability and uses the four institutional risk classes provided in the IMP municipal geospatial database (low, medium, high, and very high) [8]. No additional reclassification of risk levels was applied in this study; the figure reproduces the official block-level categorization from the IMP geospatial database after harmonizing the spatial layers in a common projected coordinate system [8].
Figure 1.
Block-level seismic risk in Lima Metropolitan Area. City blocks are displayed using the four institutional risk classes provided by the IMP municipal geospatial database (low, medium, high, and very high). District boundaries are shown for spatial reference. Source: Authors’ own elaboration based on IMP block-level data and IGN district boundaries. Projection: WGS 84/UTM zone 18S (EPSG:32718).
For benchmarking purposes, the municipal contingency planning framework was adopted as the baseline configuration [5,8]. This framework designates 356 official shelter locations through the Safe Zones Map. These sites are unevenly distributed, with a marked concentration in central districts, while several peripheral districts remain comparatively underserved. This baseline was used to evaluate the optimized shelter configurations.
2.2. Scenario Design and Shelter Capacity
Five planning scenarios were considered (Mild, Moderate, Severe, Very Strong, and Disastrous), using moment magnitude (Mw) to represent progressively more demanding post-earthquake shelter conditions. The upper bound of the scenario design was anchored to the official Lima contingency framework and the INDECI/CEPIG seismic scenario for the central Peruvian coast, which identify a worst-case event of approximately Mw 8.8 with destructive intensities greater than VIII (MM) affecting Lima [4,5]. This upper-bound scenario is also consistent with scientific studies on the seismic gap along the central Peruvian coast, which indicate that the release of energy accumulated since the 1746 earthquake could generate a future event of approximately Mw 8.5–8.8 impacting Lima [7,15]. At the lower and intermediate ranges, the discretization was informed by the magnitude classes used in the municipal contingency plan, which distinguishes light tremors (4.0–4.9 Mw), moderate tremors (5.0–5.9 Mw), strong earthquakes (6.0–7.9 Mw), and great earthquakes (8.0–9.9 Mw) [5]. To obtain a more gradual adaptation of operational priorities, the 6.0–7.9 interval was subdivided into Severe (6.0–6.9) and Very Strong (7.0–7.9) scenarios. Rather than relying on a single reference event, this five-level discretization was adopted to represent progressively different impact levels and corresponding shelter-planning demands. In particular, the Disastrous scenario was defined to coincide with the official municipal worst-case scenario, thereby enabling direct benchmarking between the optimized shelter configurations and the baseline shelter network used by the Municipality of Lima under equivalent impact conditions.
The Mw ranges in Table 1 are consistent with Lima’s official contingency planning framework, while the subdivision of the 6.0–7.9 interval into Severe and Very Strong categories was introduced in this study to capture distinct shelter demands at intermediate intensities [4,5].
Table 1.
Planning-oriented seismic scenario discretization used to represent progressively increasing post-earthquake shelter demands.
Shelter capacity was estimated using 3.5 m2 per person as the minimum floor area per occupant, following the INDECI protocol for shelter installation in existing buildings [16]. This value is also consistent with international humanitarian guidance for covered living space in emergency shelter settings [17] and with prior shelter studies for Lima reporting a lower reference range of 3.5–4.5 m2 per person [18].
2.3. Scenario-Dependent Number of Selected Shelters
For each scenario s, the final number of selected shelters, denoted , corresponds to the size of the shelter set in the implementable configuration chosen from the Pareto-optimal solutions (the “best point”) using the normalized Euclidean distance to the ideal point (Section 2.10). This choice reflects (i) feasibility with respect to the capacity constraint, (ii) the operational need to scale the shelter inventory as intensity increases, and (iii) a practical computational budget (with an upper cap of 700 shelters). The resulting values are for Mild, Moderate, Severe, Very Strong, and Disastrous scenarios, respectively.
2.4. Data Sources and Preprocessing
Geospatial datasets were compiled from two public repositories. The Safe Zones Map, maintained by the Municipality of Lima, provides 356 officially designated emergency shelters. The Metropolitan Information System, managed by the Metropolitan Planning Institute (IMP), provides (i) candidate facilities (e.g., recreational and sports centers suitable as potential shelters) and (ii) block-level layers describing population density, seismic risk, seismic vulnerability, water coverage and healthcare centers, which were integrated using the common identifier . After preprocessing, the consolidated dataset comprised 5855 potential shelter locations, including the 356 official sites [5,8]. All layers were projected to WGS84/UTM zone 18S (EPSG:32718) and continuous variables were normalized to the range [0,1]. Additional details on spatial preprocessing, layer integration, and shelter-level indicator construction are provided in the Supplementary Material (Section S1).
2.5. Two-Phase Methodological Design
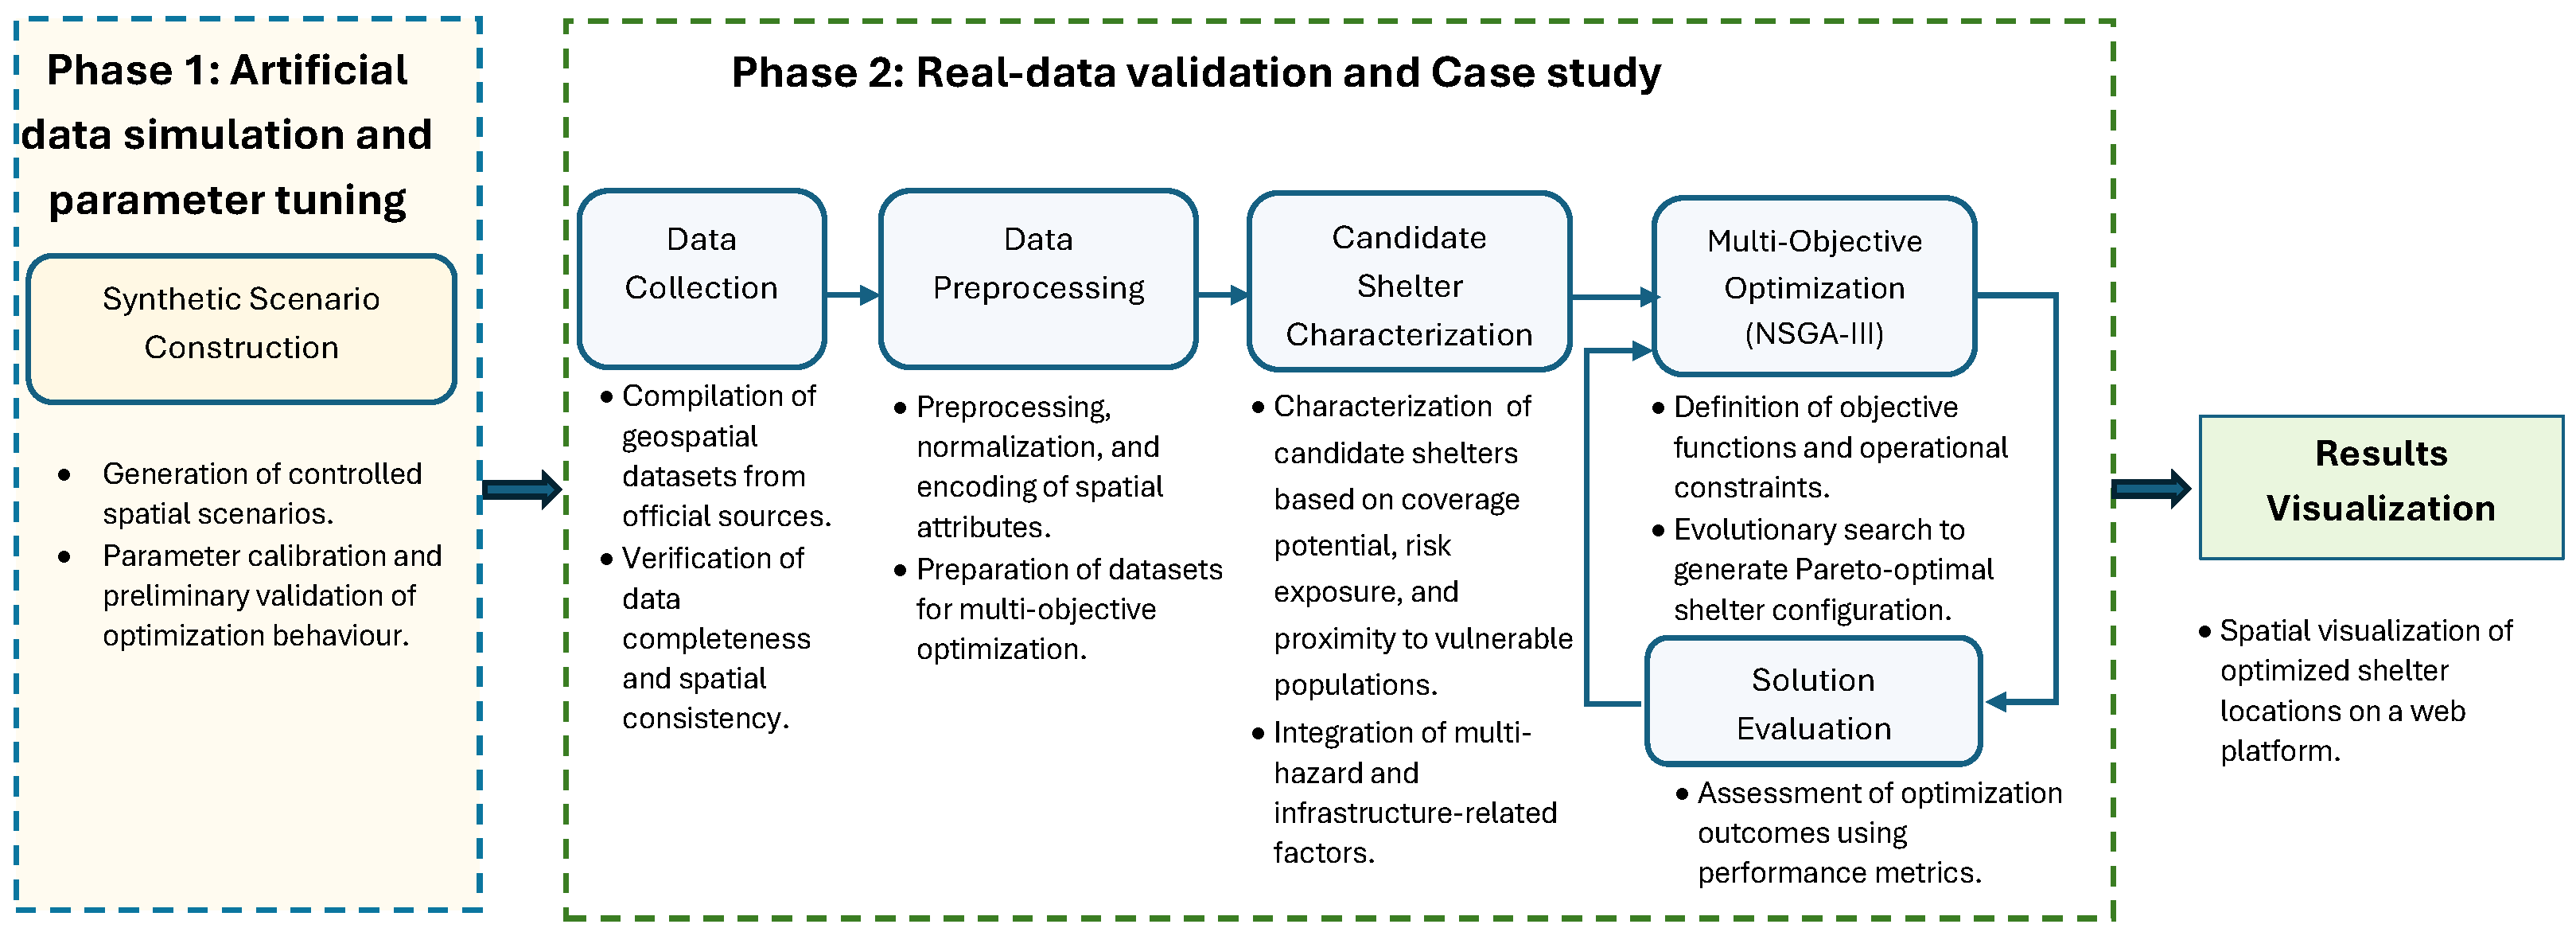
A two-phase design was adopted to improve robustness and support reproducibility. In Phase 1, synthetic spatial instances were generated to create controlled risk and demand patterns, enabling calibration of key optimization settings and stability checks of the search behavior. In Phase 2, the calibrated configuration was applied to the Lima case study to evaluate feasibility and decision value under real-world geospatial constraints and heterogeneous risk conditions across seismic intensity scenarios. Figure 2 summarizes the overall workflow from synthetic scenario construction to real-data optimization and result visualization. Details of Phase 1 and the synthetic scenario generation are provided in the Supplementary Material (Section S2).
Figure 2.
Two-phase workflow for scenario-adaptive shelter optimization: (Phase 1) synthetic scenario construction for parameter calibration and stability testing. (Phase 2) application to the Lima dataset for scenario-based optimization, evaluation and visualization.
2.6. Candidate Shelter Characterization
Each candidate shelter was characterized within a 1 km radius using: (i) the number of nearby city blocks (coverage potential), (ii) risk exposure based on normalized proximity to blocks with high seismic vulnerability and risk, and (iii) vulnerable population demand, computed as the total population residing in high-risk and high-vulnerability blocks within the defined radius. Additional spatial metrics used to define feasibility constraints included the distance to the nearest healthcare facility and the distance to the closest block with water supply coverage.
The 1 km radius was selected based on three complementary considerations. First, from a pedestrian accessibility perspective, a 1 km walking distance is broadly consistent with short-range emergency access thresholds reported in urban shelter-planning studies [10,19]. Second, under post-earthquake conditions, pedestrian accessibility becomes especially relevant because road disruption may limit motorized access, making a moderate catchment distance operationally preferable. Third, given the block-level resolution of the IMP dataset and the spatial structure of Lima Metropolitan Area, a 1 km radius captures a sufficiently representative set of nearby demand blocks without generating excessive overlap among shelter catchments. Together, these considerations make the 1 km radius a planning-relevant and operationally interpretable distance for shelter characterization in the Lima case study.
2.7. Problem Formulation
The emergency shelter location problem is formulated as a multi-objective optimization task, where denotes the set of selected shelters from N candidate sites, with . In the computational implementation, solutions were encoded as integer-valued priority vectors , where each component denotes the priority score assigned to candidate shelter i. For any solution , the selected shelter set was obtained by choosing the n candidate shelters with the highest scores. We define three objectives to be maximized:
where is the Haversine distance between shelters i and j. Objective promotes spatial dispersion by favoring configurations with larger pairwise distances. For , denotes the set of city blocks within 1 km of shelter i, and denotes the total vulnerable population in those blocks, counting each block at most once even if it falls within multiple shelter catchments. For the safety objective, and vulnerability- and risk-based terms, where and are the normalized vulnerability and risk indices associated with shelter i, is the number of city blocks within 1 km of shelter i, and k is an intensity-dependent parameter that increases sensitivity to nearby vulnerable blocks as earthquake intensity escalates.
- Two feasibility constraints were enforced:
2.8. Constraints and Optimization Statement
The feasibility constraints are the capacity constraint and the safety-buffer constraint defined in Section 2.6. The multi-objective problem was solved in a minimization setting over integer-valued priority vectors , where the shelter set is formed by the n candidate shelters with the highest scores:
subject to the capacity and minimum-distance constraints.
2.9. Scenario-Adaptive Weighting Scheme
Objective weights were designed to reflect intensity-dependent planning priorities. Three anchor configurations were specified to represent operationally distinct regimes: the Mild scenario emphasizes spatial dispersion (), the Severe scenario prioritizes population coverage (), and the Disastrous scenario prioritizes safety (). Intermediate scenarios (Moderate and Very Strong) were obtained by linear interpolation between adjacent anchors, followed by renormalization to ensure .
An intensity-dependent parameter k was used to increase the sensitivity of the safety objective as scenario intensity escalates. Let I denote the scenario intensity level; then k is computed as
with and . Table 2 reports the resulting weights and corresponding k values for all scenarios.
Table 2.
Scenario-specific objective weights and intensity parameter k. Anchor weights (Mild, Severe, Disastrous) were set by design; intermediate weights (Moderate, Very Strong) were obtained by linear interpolation between adjacent anchors and renormalized to sum to 1. The parameter k was computed using Equation (8) with and . Bold values indicate the dominant objective weight in each scenario.
To solve the problem in a minimization setting, objectives were transformed as for . This scaling preserves NSGA-III’s multi-objective search while biasing the optimization toward intensity-dependent operational priorities, in which coverage and safety progressively dominate over spacing as earthquake intensity increases.
2.10. Optimization Algorithm (NSGA-III)
NSGA-III was used to solve the multi-objective shelter siting problem because reference-direction selection preserves diversity across trade-off solutions and scales better than crowding-distance selection in higher-dimensional objective spaces [20,21]. We implemented NSGA-III in PyMOO using an integer-valued priority-based representation. For each solution, the selected shelter set was obtained by choosing the n candidate shelters with the highest decision scores.
Scenario intensity levels were set to Mild (), Moderate (), Severe (), Very Strong (), and Disastrous (). The corresponding safety-sensitivity parameter k was computed using Equation (8). Reference directions were generated using the Das–Dennis method (12 partitions). The algorithm used a population size of 200 and 500 generations, with simulated binary crossover (probability 0.9, ) and polynomial mutation (). Each scenario was solved in a single optimization run; solution stability was assessed through convergence curves reported in the Supplementary Material (Section S6, Figures S6–S8), which confirm consistent improvement trajectories without evidence of premature convergence. For each scenario, a single implementable configuration was selected from the non-dominated set using the normalized Euclidean distance to the ideal point [22]. Runtime and Pareto-set size are reported in the Supplementary Material (Section S7, Table S2).
3. Results
3.1. Scenario-Level Results
Table 3 summarizes the number of selected shelters and the resulting accommodation capacity across scenarios, alongside the estimated demand. As intensity increases, both the number of selected shelters and total capacity increase substantially, reflecting the adaptive response to growing emergency needs. For instance, the Mild scenario selects 129 shelters (capacity 107,416; demand 3,607,034), whereas the Disastrous scenario selects 603 shelters (capacity 1,300,104; demand 29,554,017). Under the high-impact scenario defined in the municipal contingency plan, the baseline comprises 356 official shelters (capacity 646,348; demand 20,000,000). Here, demand denotes the estimated population in need under each scenario, whereas capacity reflects accommodation space based on 3.5 m2/person; therefore, capacity does not imply full coverage of total demand.
Table 3.
Adjusted shelter statistics for different earthquake scenarios.
3.2. Spatial Patterns
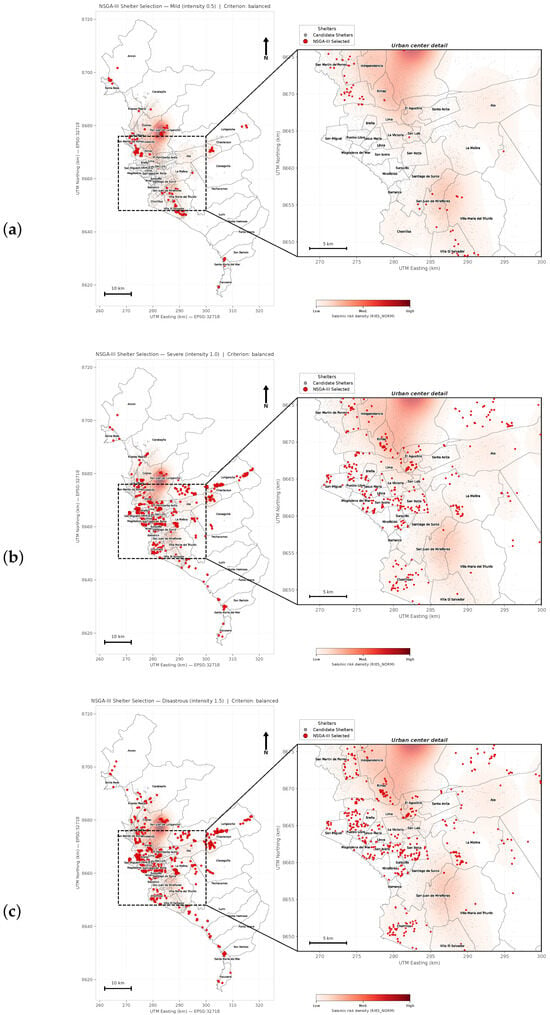
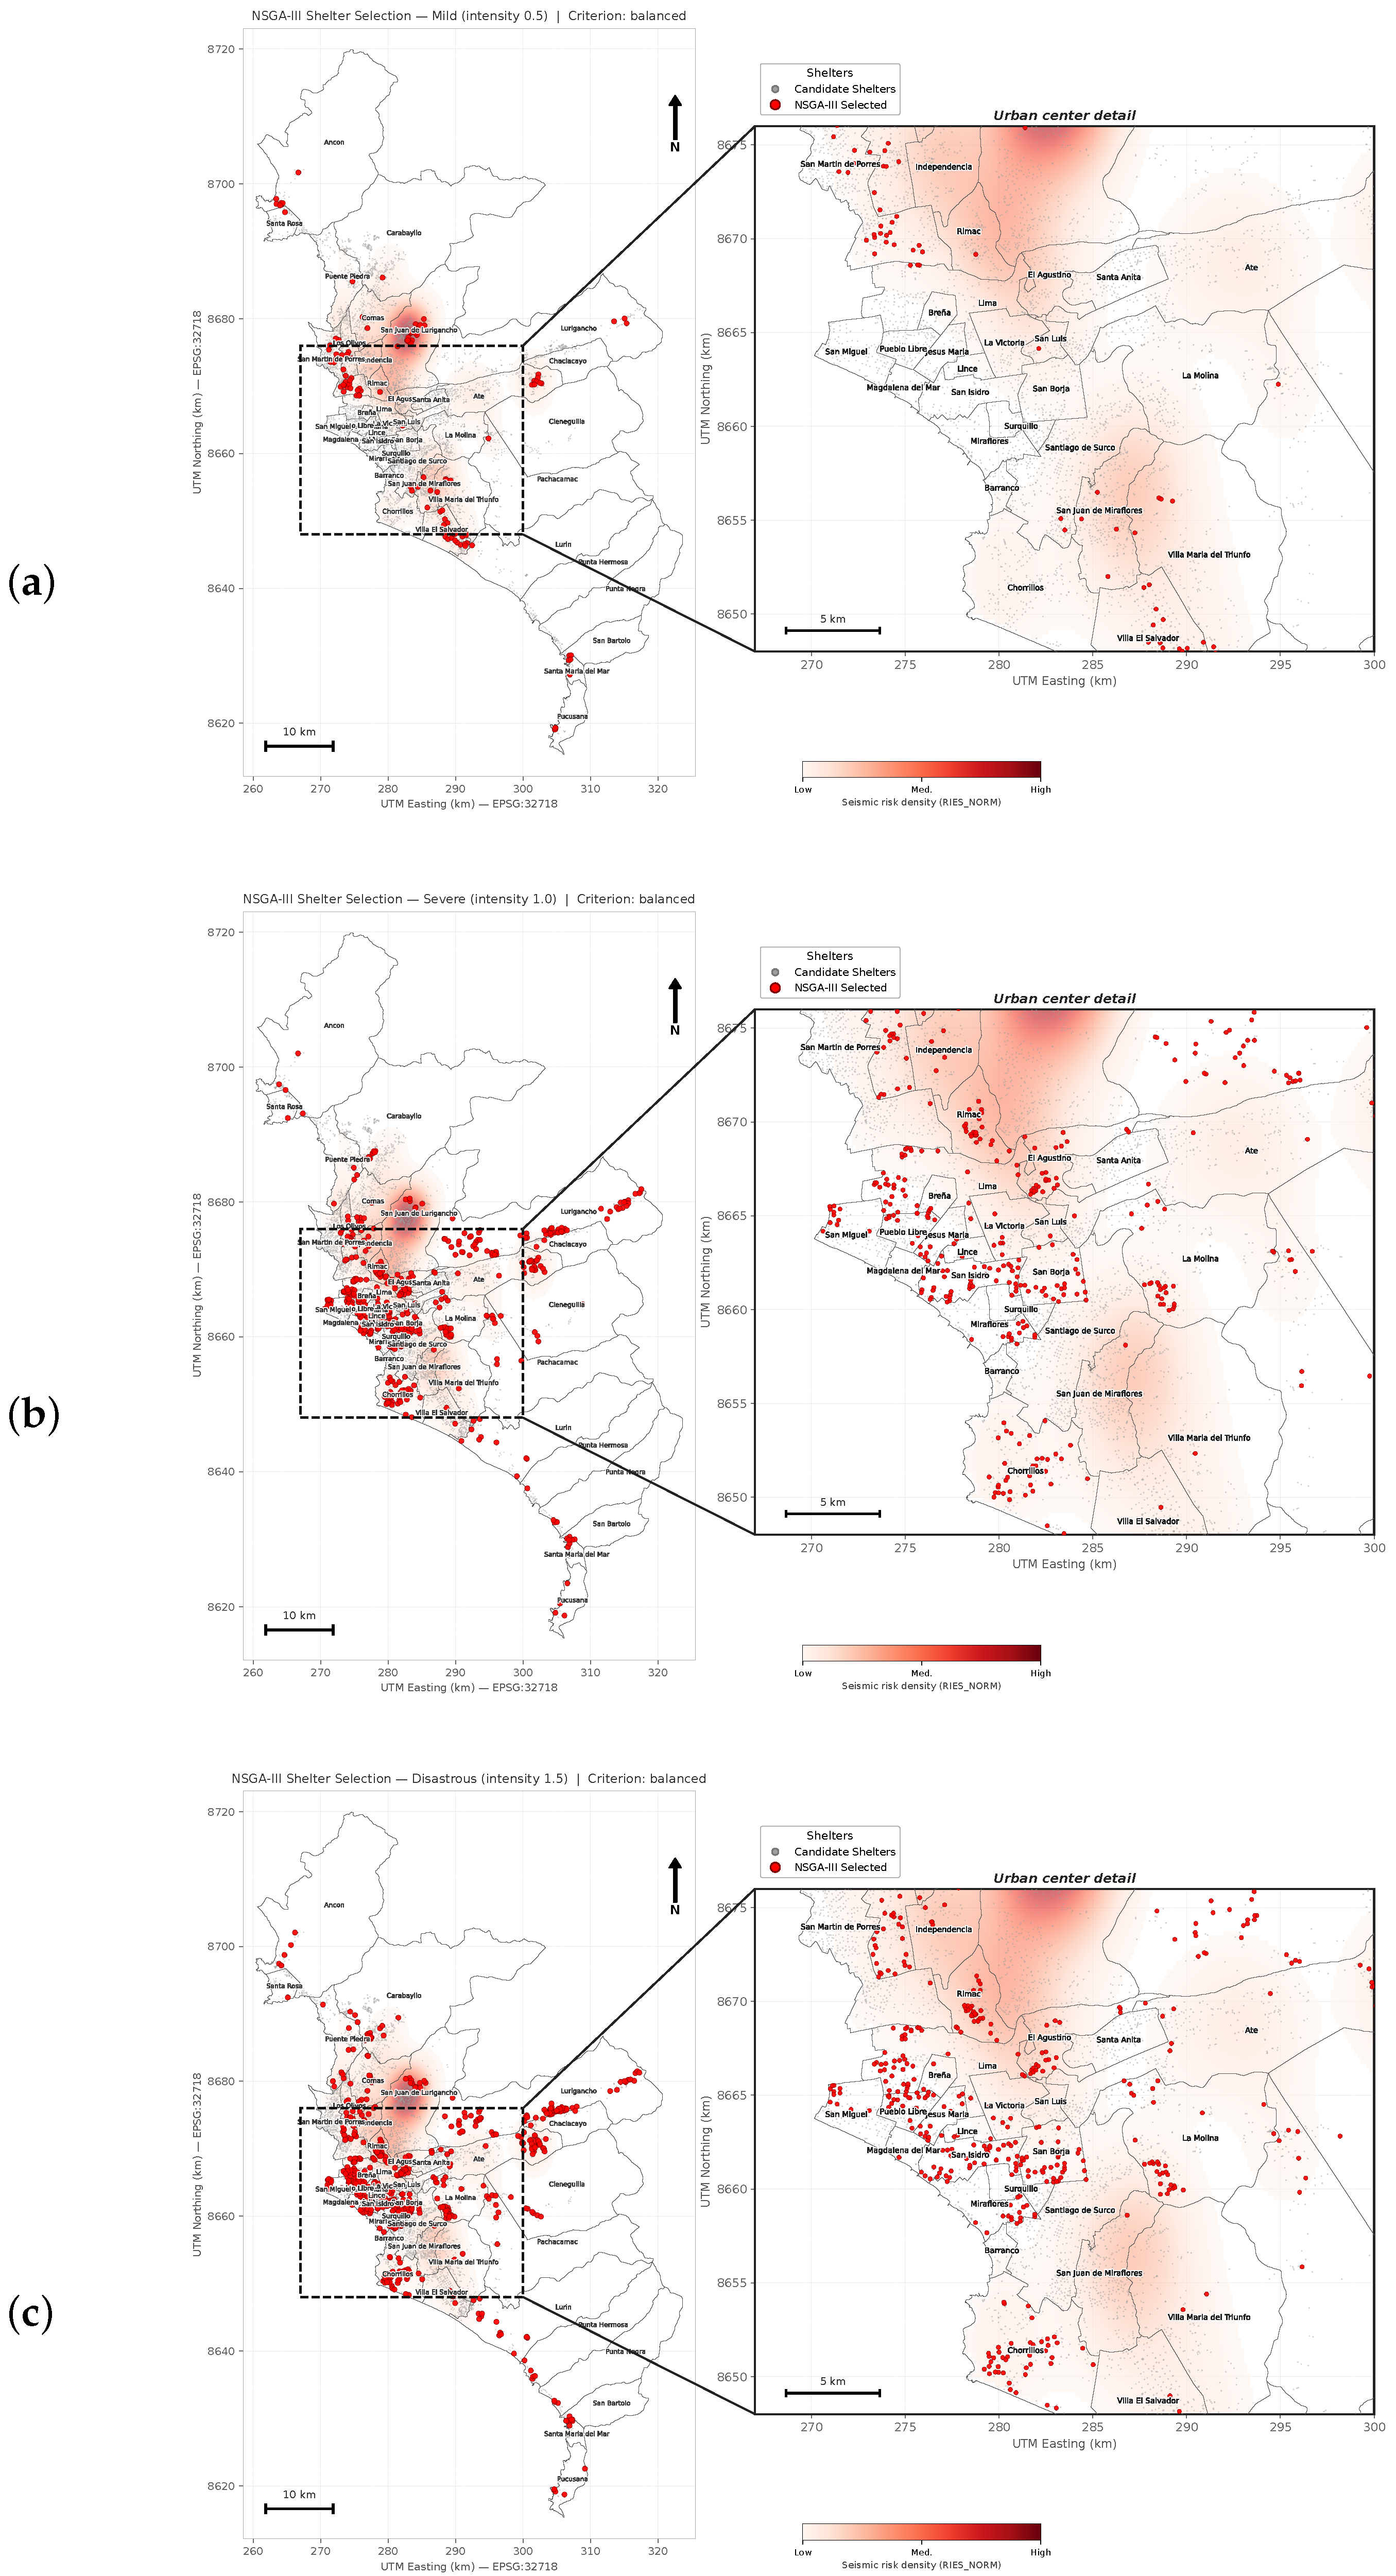
Figure 3 illustrates how shelter configurations evolve with increasing earthquake intensity. In the Mild scenario (panel a), selected shelters are more spatially dispersed to improve geographic distribution while still reflecting major population concentrations. In the Severe scenario (panel b; Mw 6.0–6.9), the configuration shifts toward higher-demand areas to strengthen coverage. Under the Disastrous scenario (panel c), shelter placement prioritizes safer locations and risk-sensitive redistribution, increasing presence in districts with higher seismic risk and higher estimated demand. Although the background shading in Figure 3 visualizes only seismic risk density (RIES_NORM), the optimization framework evaluates shelter safety using both seismic risk and seismic vulnerability, together with scenario-dependent filtering and feasibility constraints. Maps for the remaining scenarios (Moderate and Very Strong) are provided in the Supplementary Material (Section S3).
Figure 3.
Scenario-adaptive shelter configurations selected by NSGA-III across earthquake intensity scenarios in Lima, Peru. Each panel shows the main map and an enlarged urban-center view. Red points indicate selected shelters, gray points candidate shelters, and black lines district boundaries. Background shading represents seismic risk density (RIES_NORM) with darker red tones indicating higher concentration. Maps are projected in UTM Zone 18S (EPSG:32718). (a) Mild (intensity 0.5). (b) Severe (intensity 1.0). (c) Disastrous (intensity 1.5).
Benchmark Against the Municipal Plan
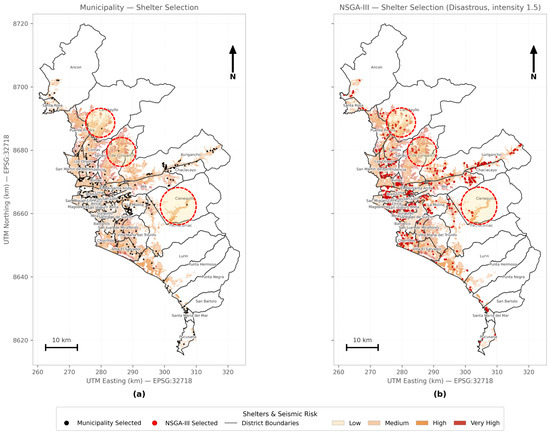
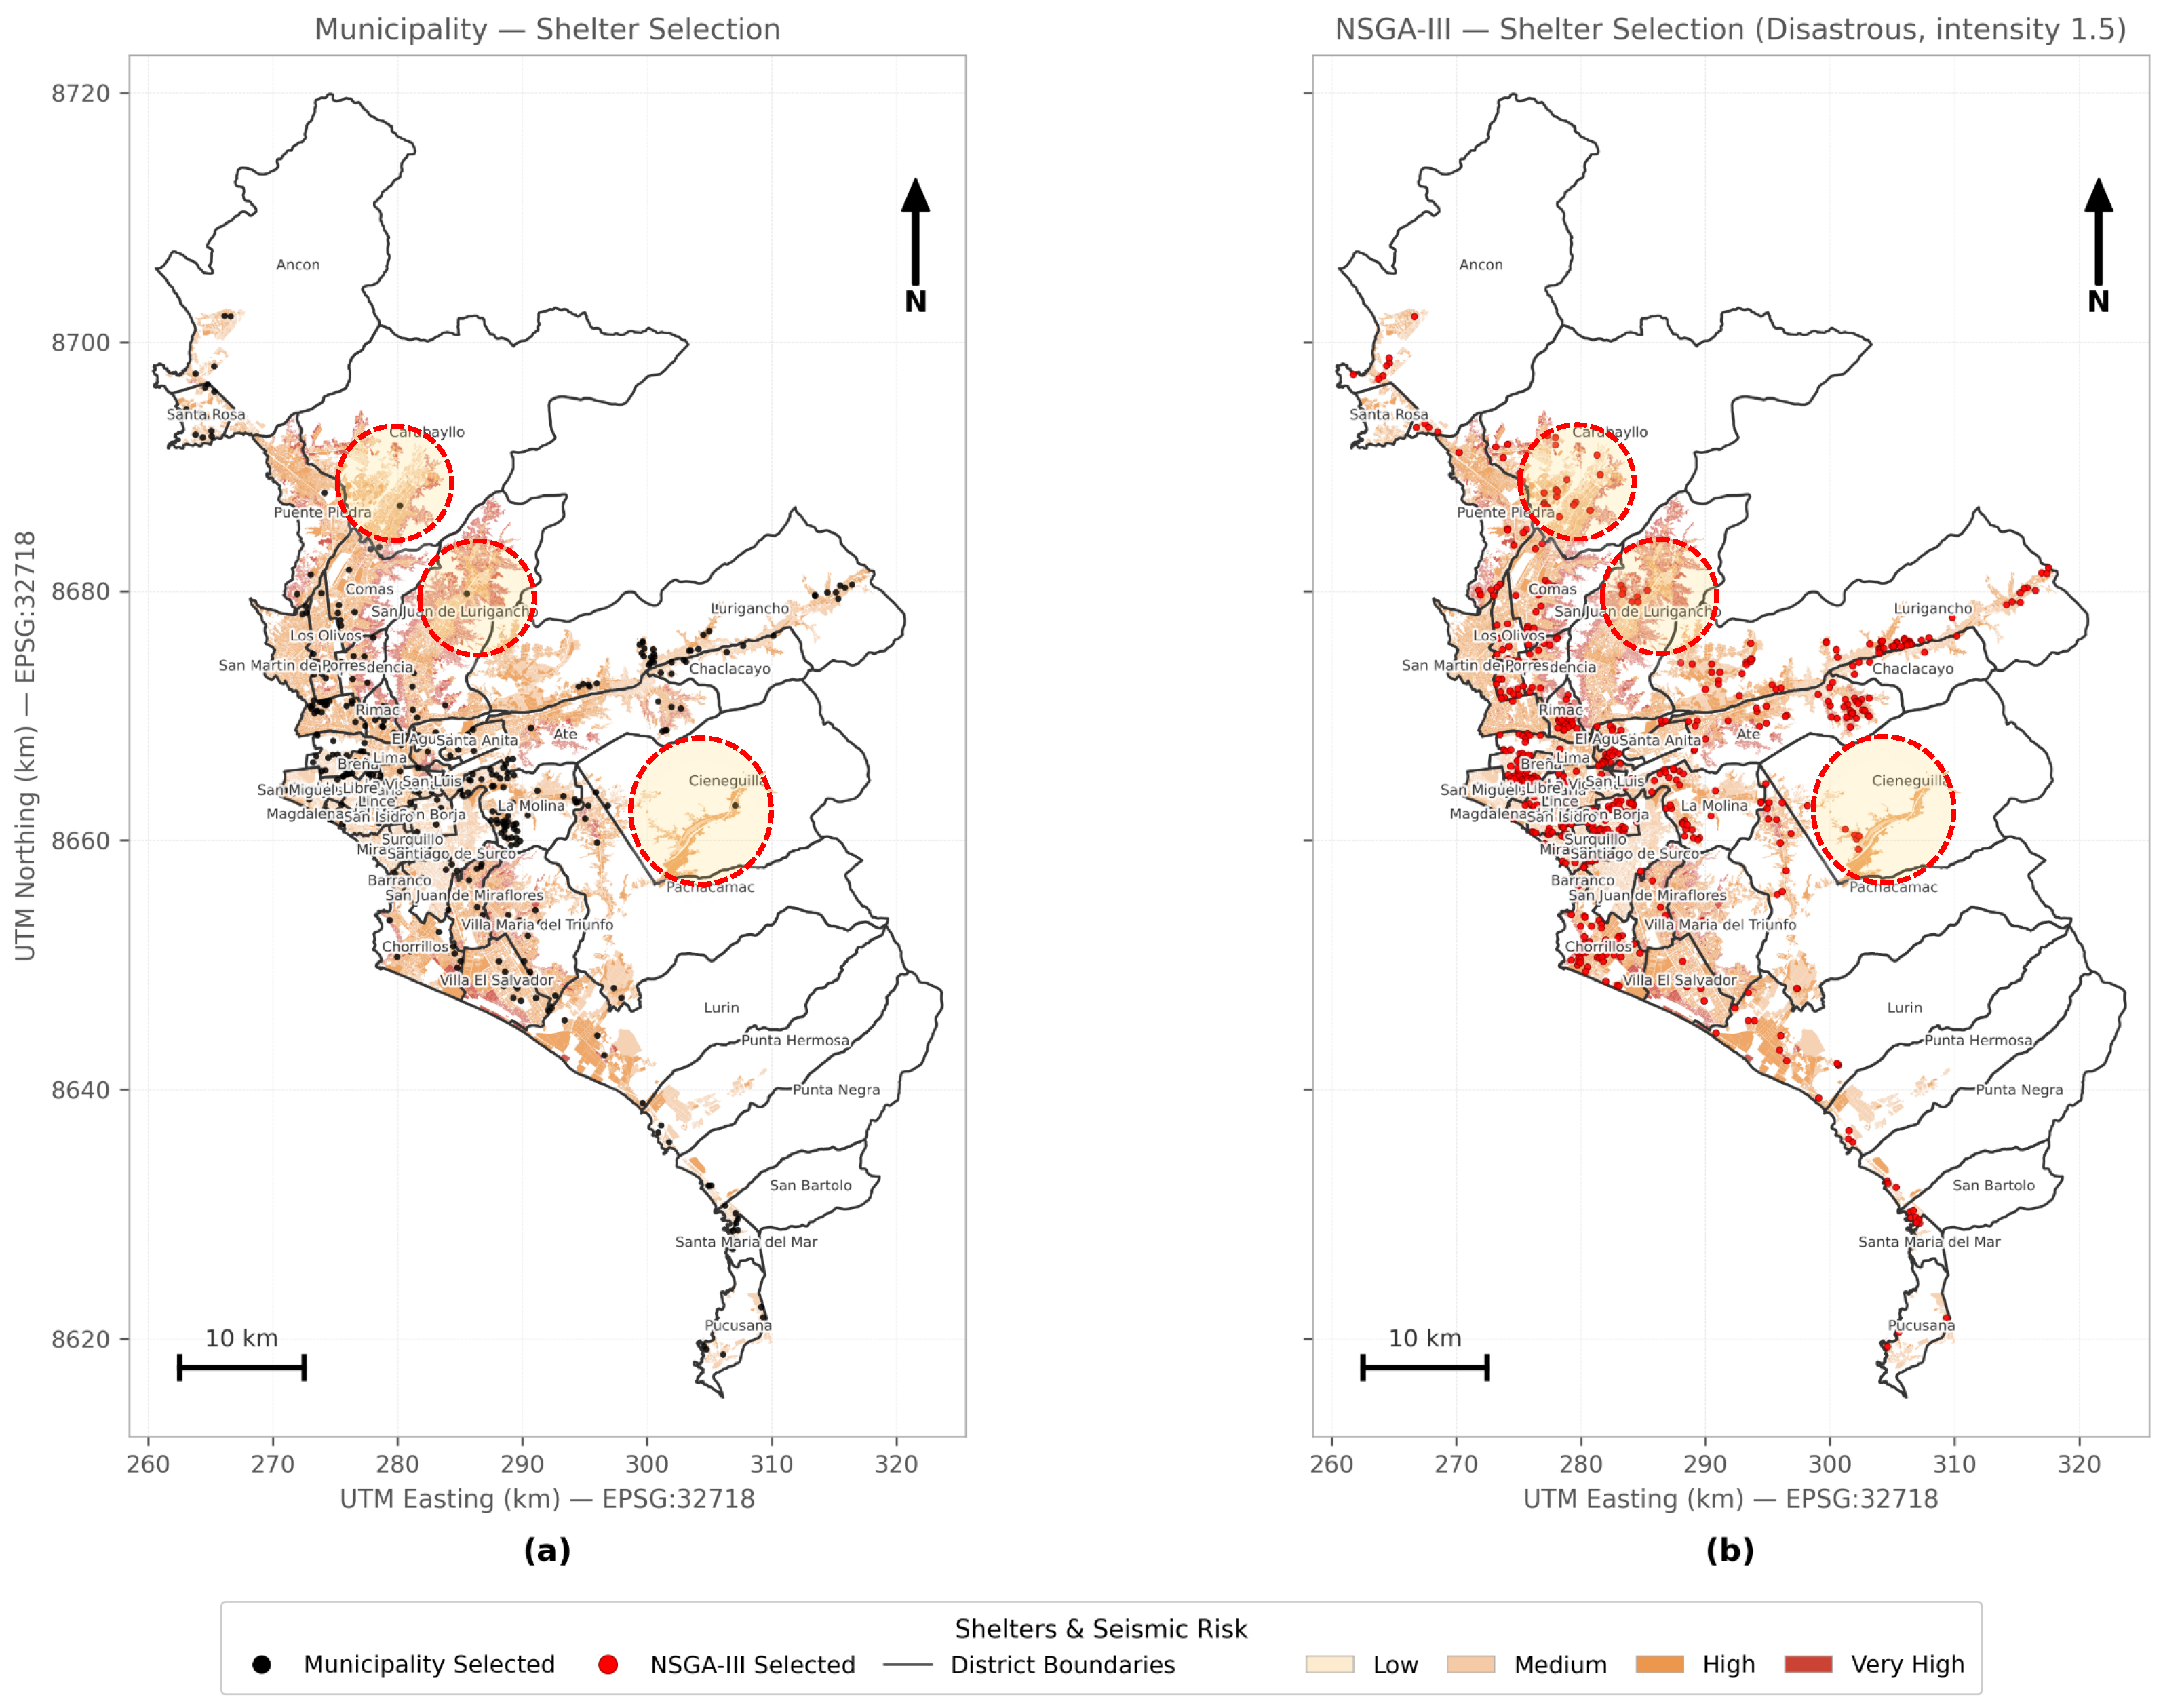
Figure 4 compares the static municipal baseline with the scenario-adaptive NSGA-III configuration under the same high-impact scenario. The municipal selection (panel a) is strongly concentrated in central districts, leaving several peripheral areas comparatively underserved. For example, in the highlighted area of San Juan de Lurigancho, the municipal baseline includes 1 shelter, whereas the optimized configuration selects 7.
Figure 4.
Benchmark against the municipal baseline under the high-impact scenario. (a) Official municipal shelter configuration. (b) Scenario-adaptive NSGA-III configuration for the Disastrous scenario. In both panels, the background shading corresponds to the same block-level seismic risk layer presented in Figure 1. Highlighted call-outs show districts where the optimized configuration increases local provision; in the highlighted San Juan de Lurigancho area, the municipal baseline includes 1 shelter, whereas NSGA-III selects 7.
Under this high-impact scenario, the optimized configuration increased population coverage by 66.82% and reduced the mean distance to critical resources (hospitals and water-covered blocks) by 24.55% relative to the municipal baseline. Additional municipal-versus-NSGA-III comparisons for the Moderate and Disastrous scenarios are provided in the Supplementary Material (Section S4, Figure S5), and zonal redistribution and overlap statistics are reported in Supplementary Material (Section S6, Table S1).
3.3. Evolution of Objective Priorities
Convergence curves show that NSGA-III adapts its search behavior as earthquake intensity increases: improvements are dominated by the inter-shelter spacing objective in the Mild scenario, shift toward population coverage under Moderate intensity, and become safety-driven in the Disastrous scenario. This pattern aligns with the scenario-specific weighting scheme and supports the robustness of the optimization process. Detailed evolution plots are provided in the Supplementary Material (Section S6, Figures S6–S8). Computational performance summaries are reported in the Supplementary Material (Section S7, Table S2).
3.4. Interpretation and Decision Support
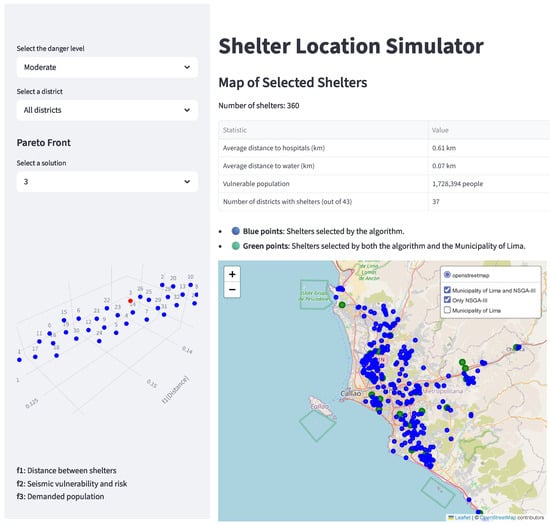
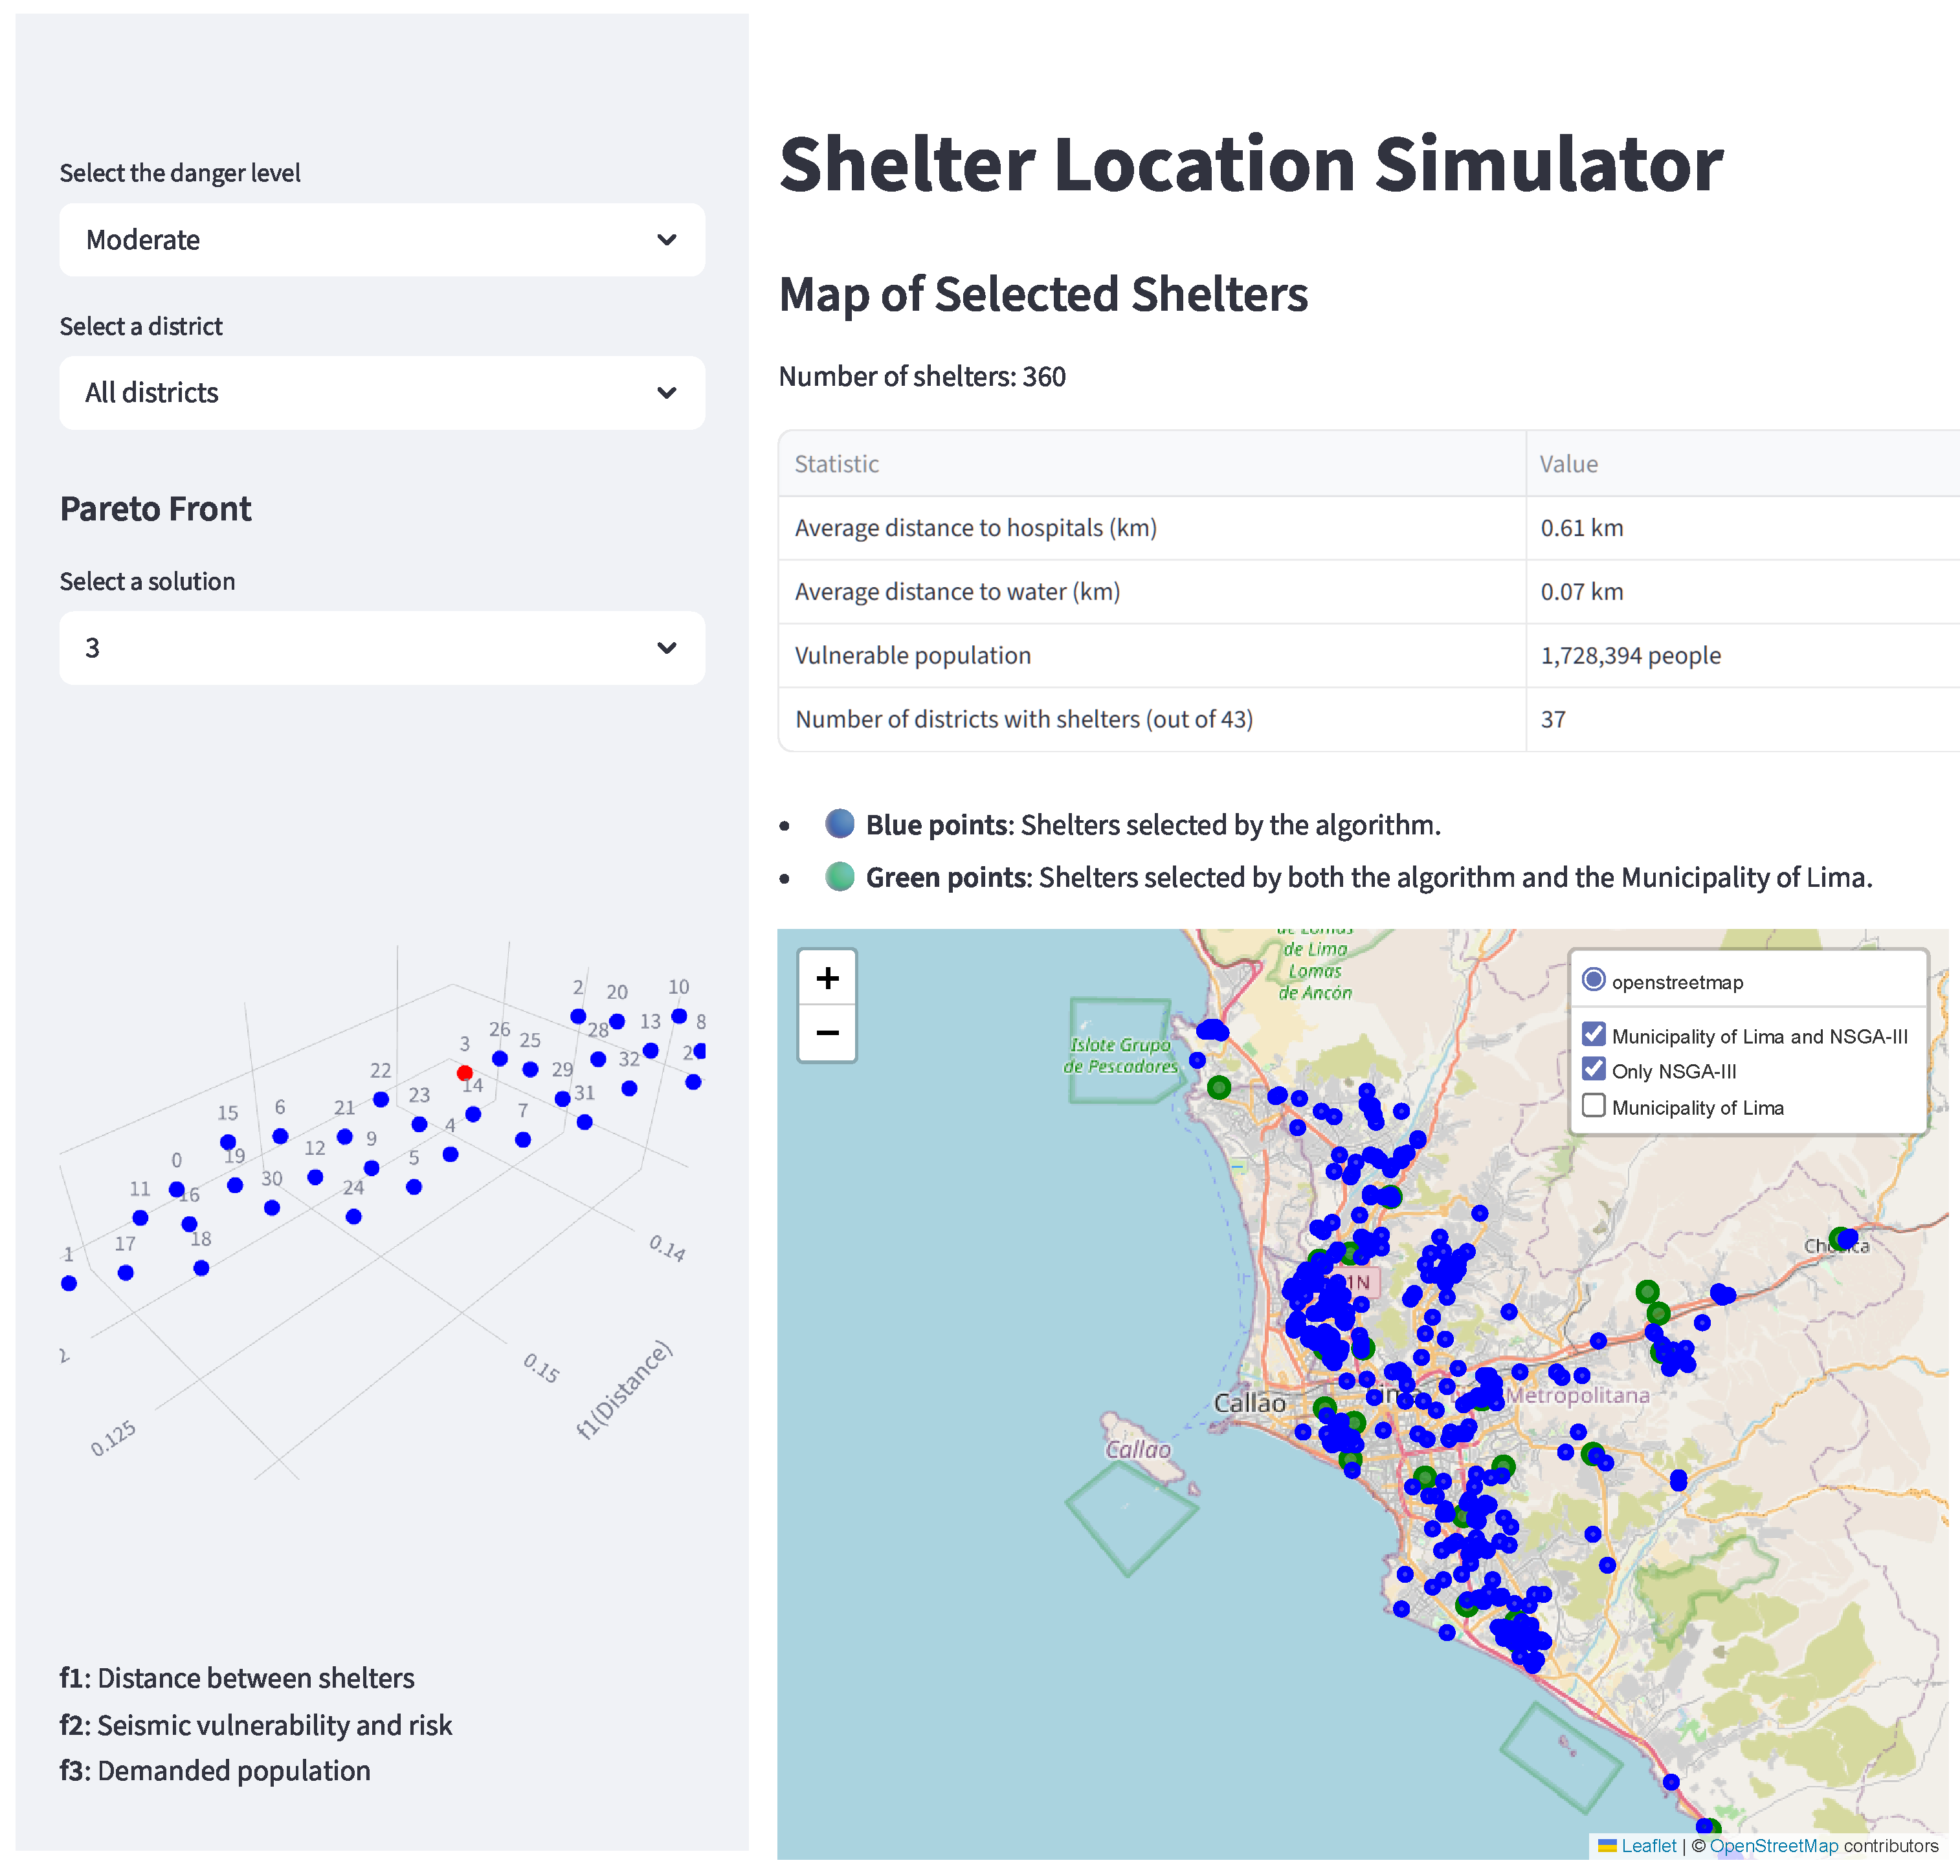
To facilitate interpretation and operational use of the optimization outputs, we developed the Shelter Location Simulator (Figure 5), an interactive interface for exploring Pareto-optimal shelter configurations across hazard scenarios. The tool allows users to filter solutions by scenario and district, visualize selected shelters on a georeferenced map, and inspect key indicators relevant to emergency management, such as distance to hospitals and water coverage, covered vulnerable population, and number of districts served. It also highlights overlap with the municipal baseline and displays the three-dimensional Pareto front for the Disastrous scenario, including the selected compromise solution. The simulator thus translates multi-objective results into interpretable planning alternatives.
Figure 5.
Shelter Location Simulator interface for exploring Pareto-optimal shelter configurations by scenario and district, including comparison with the municipal baseline.
To facilitate interpretation and operational use, an online Shelter Location Simulator was developed and made publicly available.
4. Discussion
The results indicate that the proposed framework not only improves numerical performance relative to the municipal baseline, but also exposes a structural limitation of fixed shelter planning under heterogeneous seismic impact. Under the official high-impact scenario used by the Municipality of Lima, the optimized configuration increased population coverage by 66.82% and reduced the average distance to critical resources by 24.55%, while also reducing service gaps in peripheral districts. These gains reflect more than simple numerical optimization: they suggest that shelter allocation becomes more spatially coherent when demand, vulnerability, and access to essential services are jointly considered under scenario-specific priorities. More specifically, the observed improvements appear to arise from three complementary mechanisms: improved spatial dispersion where appropriate, targeted placement near high-demand and high-vulnerability areas, and operational feasibility reinforced through proximity constraints to hospitals and water-covered blocks.
A key insight is that shelter planning priorities should not be treated as static. As earthquake intensity increases, the optimization shifts from emphasizing inter-shelter spacing, which supports broader geographic distribution under lower-intensity conditions, toward stronger coverage and safety-driven placement under severe and disastrous scenarios. This result is consistent with prior work showing that post-disaster shelter needs evolve over time and that fixed or unvarying demand assumptions can lead to less efficient shelter configurations [9,10,11,14]. In contrast, the municipal baseline relies on a fixed shelter inventory regardless of intensity, which helps explain the persistent service gaps observed in peripheral and high-vulnerability areas.
From an operational perspective, the consistently low overlap with the official shelter network (overall ≤6.45%) is especially revealing. The optimized solutions are not merely slight refinements of the current municipal configuration, but substantially different layouts that respond to changing impact conditions. This suggests that the value of the framework lies not only in improving efficiency, but also in questioning whether pre-designated shelter networks are appropriately aligned with the spatial structure of risk and demand in Lima. In this sense, the framework functions both as an optimization model and as a diagnostic tool for assessing the adequacy of existing contingency arrangements.
4.1. Policy Implications for Disaster Preparedness
The results have direct implications for contingency planning in seismic-prone metropolitan areas. First, they support the use of scenario-specific shelter inventories, allowing authorities to activate different subsets of shelters depending on the expected severity of the event rather than relying on a single fixed inventory [14]. In the present case, the number of selected shelters increases from 129 in the Mild scenario to 603 in the Disastrous scenario, indicating that intensity-dependent activation may be more appropriate than uniform deployment rules.
Second, the framework supports a more equitable spatial allocation of emergency resources. Even in the Moderate scenario, where the number of selected shelters is comparable to the municipal baseline, the optimized allocation redistributes capacity toward zones with greater vulnerability, higher demand, and weaker access to services. This finding is consistent with prior studies showing that emergency resources and shelter opportunities are often unevenly distributed across urban territory and that such imbalances become more problematic under disruptive event conditions [2,12,18].
Third, the interactive simulator strengthens practical applicability by translating Pareto-optimal solutions into an inspectable planning tool. Rather than functioning only as an academic optimization exercise, the framework can support municipal preparedness by enabling comparison with the official baseline, inspection of trade-offs, and exploration of spatial consequences before a disaster occurs. In this way, it can inform pre-event planning, training, and staged preparedness protocols while preserving transparency in decision support.
4.2. Methodological Considerations and Validation
The two-phase design, combining synthetic instances with real-world application, strengthens methodological robustness. The synthetic phase provides a controlled environment for checking optimization behavior, calibrating parameters, and verifying that the objective structure responds coherently across progressively more demanding scenarios before applying the framework to Lima’s more complex geospatial setting. While synthetic data cannot reproduce the full institutional, infrastructural, and behavioral complexity of a real urban emergency, they serve as a useful intermediate step for stability checking and preliminary validation.
The real-data phase is equally important because it shows that the framework remains interpretable and operationally meaningful under heterogeneous urban conditions. The fact that scenario-specific outputs follow a coherent progression in shelter counts, coverage patterns, and safety-sensitive allocation supports the internal validity of the adaptive weighting logic. At the same time, benchmarking against the official municipal baseline provides an external planning reference, allowing optimized outputs to be interpreted in relation to an existing contingency framework rather than in isolation.
4.3. Positioning Within the Disaster Management Literature
These findings reinforce a broader shift in the disaster management literature from static shelter siting toward more adaptive, uncertainty-aware, and equity-sensitive planning models [9,10,11,14]. Prior studies have emphasized accessibility, capacity, hierarchical shelter systems, and integrated location–allocation approaches, while more recent work has addressed uncertainty, robustness, and many-objective optimization [9,10,11]. However, many existing formulations still rely on fixed objective structures or do not explicitly translate changing hazard severity into differentiated operational priorities [9,11].
The present study contributes to this literature by linking scenario-adaptive planning logic to implementable shelter configurations. Its contribution is therefore not only algorithmic, but also conceptual: it shows how differentiated seismic impact levels can be converted into differentiated planning priorities and then into concrete spatial layouts that can be benchmarked against an official municipal plan. In this way, the framework extends previous work from generic optimization toward a more operational form of adaptive preparedness planning. It also aligns with vulnerability-sensitive perspectives that stress the need to combine physical exposure with socioeconomic and territorial inequalities in disaster management [12,18].
The improvements observed in Lima’s peripheral districts suggest that scenario-adaptive optimization can contribute not only to efficiency, but also to spatial equity in access to emergency shelter and associated services. This is especially relevant in unequal metropolitan contexts, where static planning schemes may reproduce or even intensify pre-existing territorial disparities.
4.4. Limitations and Generalizability
Several limitations should be considered when interpreting the results. First, the framework relies on static geospatial layers and does not explicitly represent post-event dynamics such as road blockage, facility downtime, cascading disruptions, or evacuation behavior. These factors may significantly affect real-world shelter accessibility and performance after a major earthquake.
Second, the adaptive weighting scheme remains a design choice informed by official references and planning logic. Although the scenario progression behaves coherently in the present case, different cities or agencies may require alternative priority structures depending on institutional objectives, hazard profiles, or infrastructure conditions. Third, the synthetic phase improves calibration and robustness, but cannot reproduce the full complexity of urban emergencies, including political constraints, informal response behavior, or real-time logistical bottlenecks.
Finally, the framework should be interpreted as a planning-support tool rather than a complete emergency management model. It is designed to improve ex ante shelter allocation and scenario comparison, not to replace detailed evacuation modeling, logistics coordination, or real-time crisis command. Even so, the structure of the framework is transferable to other seismically exposed cities, provided that local calibration is performed using comparable hazard, vulnerability, demand, and infrastructure data.
5. Conclusions
This study presented a scenario-adaptive multi-objective optimization framework for post-earthquake shelter planning in Lima, Peru. By integrating geospatial information on vulnerable population, seismic risk and vulnerability, and proximity to critical services, the framework generates shelter configurations whose priorities change with earthquake intensity, moving from broader spatial dispersion under lower-intensity conditions toward stronger population coverage and safety under severe and catastrophic scenarios. When benchmarked against the official municipal baseline under the high-impact scenario, the selected configuration achieved substantial improvements in population coverage and in access to critical resources, while also reducing service gaps in underserved peripheral districts.
Beyond these numerical gains, the main contribution of the study lies in showing that shelter planning should be treated as a scenario-dependent problem rather than as a fixed inventory exercise. The proposed framework demonstrates that differentiated impact levels can be translated into differentiated operational priorities and, in turn, into implementable shelter layouts. The associated simulator further strengthens practical applicability by enabling transparent comparison between optimized and official configurations and by making Pareto trade-offs interpretable for decision-makers.
Future work should extend the framework toward more operationally realistic and transferable settings. Key directions include incorporating time-varying disruption and accessibility (e.g., road damage, facility downtime, and dynamic demand), expanding the formulation to multi-hazard contexts (e.g., landslides, fires, and tsunami exposure), and integrating stakeholder-informed calibration of scenario priorities and constraints. Additional work may also improve transferability and computational efficiency through learning-based components that support rapid adaptation to other cities and planning doctrines.
Supplementary Materials
The following supporting information can be downloaded at: https://www.mdpi.com/article/10.3390/app16084043/s1. Supplementary Material (PDF): Sections S1–S7; Figures S1–S8; Tables S1–S2. Section S1: Spatial preprocessing and shelter characterization; Section S2: Synthetic data simulation (Phase 1); Section S3: Intermediate spatial outputs (Moderate and Very Strong scenarios); Section S4: Comparative shelter distributions (municipal vs. NSGA-III) under Moderate and Disastrous scenarios; Section S5: Zonal redistribution and overlap; Section S6: Evolution of objective priorities; Section S7: Computational performance; Figure S1: Synthetic risk distribution map for a disastrous earthquake scenario, showing sea risk zones (blue), soil risk zones (red), and central risk zones (green). NSGA-III selected shelters (yellow squares) are positioned to balance coverage while avoiding high-risk areas; Figure S2: Evolution of fitness values across generations for the three objective functions during optimisation in a disastrous earthquake scenario, demonstrating convergence toward an optimal solution; Figure S3: Evolution of fitness values across generations for the three objective functions during optimisation in a disastrous earthquake scenario, demonstrating convergence toward an optimal solution; Figure S4: Intermediate scenario outputs. (a) Moderate scenario: Selected shelters positioned in relation to population density patterns (background shading). (b) Very Strong scenario: Background shading highlights seismic risk concentration, illustrating the shift toward safety-oriented placement; Figure S5: Comparative shelter distribution. (a) Municipal selection and (b) NSGA-III optimisation under the Moderate scenario (background shading indicates seismic risk concentration). (c) Municipal selection and (d) NSGA-III optimisation under the Disastrous scenario (background shading indicates seismic vulnerability concentration); Figure S6: Evolution of objective functions in the Mild scenario (intensity 0.5), showing significant improvement in the distance objective over generations; Figure S7: Evolution of objective functions in the Disastrous scenario (intensity 1.5), revealing the dominance of the safety objective and reflecting the priority shift toward risk mitigation under extreme conditions; Figure S8: Evolution of objective functions in the Disastrous scenario (intensity 1.5), revealing the dominance of the safety objective and reflecting the priority shift toward risk mitigation under extreme conditions; Table S1: Comparison of emergency shelter selection by Lima zone and earthquake scenario (NSGA-III vs. municipal baseline), including overlap counts; Table S2: Summary of optimisation run-time and search outcomes by earthquake scenario.
Author Contributions
Conceptualization, S.E.; Methodology, S.E., A.S. and A.C.; Software, A.S. and S.E.; Formal analysis, S.E.; Data curation, A.S. and A.C.; Validation, S.E., A.S. and A.C.; Visualization, S.E., A.S. and A.C.; Writing—original draft, S.E.; Writing—review and editing, S.E., A.S. and A.C. All authors have read and agreed to the published version of the manuscript.
Funding
This research was supported by an internal research grant from the Vice Rectorate for Research (VRI) of Universidad del Pacífico, Lima, Peru (Project No. 3010108024).
Institutional Review Board Statement
Not applicable.
Informed Consent Statement
Not applicable.
Data Availability Statement
The datasets, source code, and online simulator supporting the findings of this study are publicly available through the https://github.com/Alexs23crypto/simulator_nsgaiii (accessed on 10 April 2026) and the https://simulatornsgaiii-ss7ubpdbwux5a539khqxyu.streamlit.app/ (accessed on 10 April 2026).
Acknowledgments
The authors acknowledge the support of the Vice Rectorate for Research (VRI) of Universidad del Pacífico.
Conflicts of Interest
The authors declare no conflicts of interest.
References
- Keicho, T. Evacuation Center Management; Knowledge Note 3–5, Global Facility for Disaster Reduction and Recovery (GFDRR); The World Bank: Washington, DC, USA, 2012; Available online: https://www.gfdrr.org/sites/default/files/publication/knowledge-note-japan-earthquake-3-5.pdf (accessed on 10 April 2026).
- Akar, A.; Akar, Ö; Konakoğlu, B. Analysis of emergency assembly points for post-earthquake disaster management: A case study of Erzincan, Türkiye. Nat. Hazards 2024, 120, 11791–11824. [Google Scholar] [CrossRef] [Scilit]
- Aslan, Z.; Demiröz, K.; Demiröz Yıldırım, S. An Examination of Temporary Shelter Units in Terms of Minimum Standards: The Case of the Kahramanmaraş Earthquake. Sustainability 2025, 17, 3587. [Google Scholar] [CrossRef] [Scilit]
- Instituto Nacional de Defensa Civil (INDECI); Centro Peruano Japonés de Investigaciones Sísmicas y Mitigación de Desastres (CISMID). Escenario Sísmico Para Lima Metropolitana y Callao: Sismo 8.8 Mw; Official Seismic Scenario Study: Lima, Peru, 2017. [Google Scholar]
- Municipalidad Metropolitana de Lima. Plan de Contingencia ante Sismo de Gran Magnitud Seguido de Tsunami de la Provincia de Lima 2021–2023; Gerencia de Gestión del Riesgo de Desastres, Subgerencia de Defensa Civil: Lima, Peru, 2021. [Google Scholar]
- Tavera, H. Análisis y Evaluación de los Patrones de Sismicidad y Escenarios sísmicos en el Borde Occidental del Peru; Instituto Geofísico del Peru: Lima, Peru, 2020. [Google Scholar]
- Tavera, H. Actualización del Escenario por Sismo, Tsunami y Exposición en la Región Central del Peru; Informe Técnico, Instituto Geofísico del Peru: Lima, Peru, 2017. [Google Scholar]
- Instituto Metropolitano de Planificación (IMP). Sistema de Información Metropolitana. Metropolitan Geospatial Platform Used for Candidate Facilities and Block-Level Layers. 2024. Available online: https://mmlimp.maps.arcgis.com/apps/webappviewer/index.html?id=ae3b2389664c4e199155e93a6aca9c25 (accessed on 10 April 2026).
- Li, H.; Zhao, L.; Huang, R.; Hu, Q. Hierarchical earthquake shelter planning in urban areas: A case for Shanghai in China. Int. J. Disaster Risk Reduct. 2017, 22, 431–446. [Google Scholar] [CrossRef] [Scilit]
- Zhao, L.; Li, H.; Sun, Y.; Huang, R.; Hu, Q.; Wang, J.; Gao, F. Planning Emergency Shelters for Urban Disaster Resilience: An Integrated Location-Allocation Modeling Approach. Sustainability 2017, 9, 2098. [Google Scholar] [CrossRef] [Scilit]
- Tang, K.; Osaragi, T. Multi-Objective Distributionally Robust Optimization for Earthquake Shelter Planning Under Demand Uncertainties. GeoHazards 2024, 5, 1308–1325. [Google Scholar] [CrossRef] [Scilit]
- Moghri, A.; Khalili, A. Investigating the influential post-disaster factors in determining the optimal location of shelters: A case study, Sarpol-e Zahab, Kermanshah province, Iran. Front. Archit. Res. 2022, 11, 846–864. [Google Scholar] [CrossRef] [Scilit]
- Tang, K.; Osaragi, T. Multi-Objective Evacuation Planning Model Considering Post-Earthquake Fire Spread: A Tokyo Case Study. Sustainability 2024, 16, 3989. [Google Scholar] [CrossRef] [Scilit]
- Tun, E.; Nishikiori, T.; Varghese, V.; Chikaraishi, M.; Seike, M.; Fujiwara, A. Emergency shelter location–allocation analysis with time–varying demand. Asian Transp. Stud. 2024, 10, 100152. [Google Scholar] [CrossRef] [Scilit]
- Pulido, N.; Aguilar, Z.; Tavera, H.; Chlieh, M.; Calderón, D.; Sekiguchi, T.; Nakai, S.; Yamazaki, F. Scenario Source Models and Strong Ground Motion for Future Mega-earthquakes: Application to Lima, Central Peru. Bull. Seismol. Soc. Am. 2015, 105, 368–386. [Google Scholar] [CrossRef] [Scilit]
- Instituto Nacional de Defensa Civil (INDECI). Protocolo para Instalación de Albergues; Dirección Nacional de Operaciones: Lima, Peru, 2006; Available online: https://portal.indeci.gob.pe/wp-content/uploads/2018/10/Protocolo-de-Albergues.pdf (accessed on 10 April 2026).
- The Sphere Association. The Sphere Handbook: Humanitarian Charter and Minimum Standards in Humanitarian Response; Sphere Association: Geneva, Switzerland, 2018. [Google Scholar]
- Instituto Nacional de Defensa Civil (INDECI); Programa de las Naciones Unidas para el Desarrollo (PNUD). Recursos de Respuesta Inmediata y de Recuperación Temprana ante la Ocurrencia de un Sismo y/o Tsunami en Lima Metropolitana y Callao, Technical Report; Instituto Nacional de Defensa Civil: Lima, Peru, 2011.
- Xu, J.; Yin, X.; Chen, D.; An, J.; Nie, G. Multi-criteria location model of earthquake evacuation shelters to aid in urban planning. Int. J. Disaster Risk Reduct. 2016, 20, 51–62. [Google Scholar] [CrossRef] [Scilit]
- Deb, K.; Pratap, A.; Agarwal, S.; Meyarivan, T. A fast and elitist multiobjective genetic algorithm: NSGA-II. IEEE Trans. Evol. Comput. 2002, 6, 182–197. [Google Scholar] [CrossRef] [Scilit]
- Deb, K.; Jain, H. An Evolutionary Many-Objective Optimization Algorithm Using Reference-Point-Based Nondominated Sorting Approach, Part I: Solving Problems With Box Constraints. IEEE Trans. Evol. Comput. 2014, 18, 577–601. [Google Scholar] [CrossRef] [Scilit]
- Audet, C.; Bigeon, J.; Cartier, D.; Le Digabel, S.; Salomon, L. Performance indicators in multiobjective optimization. Eur. J. Oper. Res. 2021, 292, 397–422. [Google Scholar] [CrossRef] [Scilit]

Disclaimer/Publisher’s Note: The statements, opinions and data contained in all publications are solely those of the individual author(s) and contributor(s) and not of MDPI and/or the editor(s). MDPI and/or the editor(s) disclaim responsibility for any injury to people or property resulting from any ideas, methods, instructions or products referred to in the content. |
© 2026 by the authors. Licensee MDPI, Basel, Switzerland. This article is an open access article distributed under the terms and conditions of the Creative Commons Attribution (CC BY) license.