


Abstract
X-ray free-electron lasers (XFELs) have revolutionized structural biology by enabling “diffraction-before-destruction” and capturing the ultrafast dynamics of life. However, the intrinsic sparsity and noise of XFEL diffraction snapshots, often complicated by multi-lattice overlaps, create a formidable computational bottleneck that limits data utilization and structural fidelity. Here, we present MCDPS-SFX, a robust indexing framework based on a reference-based, whole-pattern matching principle integrated with parallelized iterative refinement. By exhaustively sampling orientation space and progressively rejecting outliers, MCDPS-SFX significantly outperforms legacy algorithms—more than doubling crystal yields in heterogeneous datasets (e.g., 21,807 vs. 8792 for MOSFLM)—and achieves highly competitive yields comparable to state-of-the-art indexers, such as extracting over 90,000 lattices in the lysozyme benchmark. We demonstrate its efficacy on standard benchmarks and technically demanding G-protein-coupled receptor (GPCR) systems, including the rhodopsin–arrestin complex and the glucagon receptor. MCDPS-SFX consistently produces high-quality data statistics, enabling the high-resolution visualization of functionally critical, flexible regions such as phosphorylated receptor tails. Our results provide a powerful tool for enhancing the scientific output of XFEL experiments, offering a robust alternative for maximizing information recovery from weakly diffracting or overlapping crystalline samples.
1. Introduction
X-ray free-electron lasers (XFELs) have fundamentally transformed structural biology by harnessing ultrafast femtosecond pulses to operationalize the “diffract-before-destroy” paradigm, thereby bypassing traditional radiation damage limitations [1]. This breakthrough enables the high-resolution, room-temperature structural elucidation of delicate, radiation-sensitive systems in near-native physiological states [2,3]. Beyond static structures, the true potential of XFELs lies in time-resolved serial femtosecond crystallography (TR-SFX), which tracks sub-picosecond biological dynamics to synthesize four-dimensional “molecular movies” of fundamental processes, such as enzyme catalysis and multi-temperature kinetics [4,5,6,7,8]. Recently, the field has been significantly propelled by next-generation XFEL facilities featuring megahertz repetition rates, alongside synergistic advancements in exascale computing and automated microfluidic sample delivery, such as droplet-based injectors that minimize sample consumption [9,10,11]. These cutting-edge developments allow researchers to routinely capture transient conformational intermediates in challenging targets, such as membrane proteins and dynamic receptor–ligand complexes, establishing a new frontier in time-resolved structural biology and rational drug design [12,13].
Despite these remarkable capabilities, XFEL experiments present formidable computational bottlenecks. Single XFEL “still” exposures capture only a sparse and incomplete subset of reflections due to the exceptionally thin Ewald sphere constraint [14]. This analytical challenge is compounded by low “hit rates” (<10%) from stochastic sample delivery, generating a terabyte-scale data deluge that requires real-time triage via programs like Cheetah [15]. Furthermore, inherent wavelength dispersion (Δλ/λ ≈ 0.1–1%) and detector noise severely degrade the signal-to-noise ratio (SNR). Within standard data-reduction ecosystems like CrystFEL [16], indexing remains the primary rate-limiting and most fragile step, as lattice orientations must be determined from patterns that are simultaneously sparse, noisy, and bandwidth-broadened [17].
Historically, indexing algorithms were optimized for the dense reciprocal-space sampling of conventional rotation crystallography. Legacy programs—such as MOSFLM [18], XDS [19], and DirAx [20]—rely on identifying lattice periodicities through Fourier transforms or difference-vector clustering. While these methods are highly robust when hundreds of reflections are available per image, their underlying geometric assumptions collapse under XFEL conditions. In SFX, “still” images often contain fewer than 20 reflections and lack the rotational redundancy needed to resolve lattice ambiguities. Consequently, these traditional indexers exhibit high false-negative rates and frequently fail to process the sparse, bandwidth-broadened patterns typical of nanocrystalline samples [21].
Recognizing these gaps, the field has seen a surge in algorithms tailored to XFEL realities. Gildea et al. (2014) pioneered methods to deconvolve multi-lattice images, where overlapping diffraction from multiple microcrystals often confuses standard indexers [22]. Simultaneously, Brewster et al. (2015) [21] integrated sparse-indexing capabilities into the Computational Crystallography Toolbox (cctbx), enabling orientation determination from as few as five reflections by leveraging prior unit-cell information. Further diversifying the toolkit, Dejoie et al. (2015) [23] demonstrated the feasibility of indexing multi-crystal snapshots under the high-bandwidth (4%) “pink beam” conditions envisioned for SwissFEL.
Subsequent innovations have refined these concepts into more robust frameworks. TakeTwo [24] introduced a pairwise inter-spot vector strategy that excels when unit-cell priors are known. FELIX [25] adopted a Rodrigues–Frank space representation to navigate orientation space without singularities, while SPIND [26] and its extension SPIND-TC [27] optimized indexing for minimal-peak patterns and emerging two-color XFEL modes. Recent efforts like XGANDALF [28] have reframed indexing as a global gradient-descent problem, significantly improving success rates for noisy data. By employing principled robust optimization techniques resilient to outliers—rather than iterative gradient descent—TORO [29] achieves state-of-the-art indexing speeds in the kilohertz regime (≥2 kHz), directly addressing the massive throughput demands of modern megapixel detectors. Finally, pinkIndexer [30] has extended these advances to polychromatic and electron diffraction, addressing the unique challenges of wavelength dispersion and flat Ewald sphere geometries.
Taken together, these developments illustrate a shift from adapting synchrotron-era legacies to engineering bespoke frameworks for the XFEL era. However, a rigorous comparative assessment reveals that persistent limitations remain. While TakeTwo and SPIND exhibit high precision, their heavy reliance on accurate unit-cell priors restricts their utility for ab initio studies of novel or uncharacterized systems. Conversely, FELIX and XGANDALF successfully navigate multi-lattice or high-noise datasets, yet their significant computational overhead poses a bottleneck for real-time analysis at megahertz-repetition facilities. Furthermore, while pinkIndexer facilitates polychromatic diffraction, it remains sensitive to wavelength calibration and often falters when confronted with extreme sparsity. In practice, researchers must frequently toggle between disparate indexers or engage in tedious manual parameter tuning—an iterative process that introduces inefficiency, user bias, and reproducibility concerns into the data pipeline.
In this paper, we present a new algorithm, MCDPS-SFX (Multi-Crystal Data Processing Suite for Serial Femtosecond Crystallography), designed to robustly index both multi-crystal and sparse diffraction patterns encountered in X-ray free-electron laser experiments. The primary objective of MCDPS-SFX is to achieve higher indexing rates and more accurate structure-factor measurements, thereby significantly reducing measurement time, sample consumption, and experimental costs. The core of the algorithm relies on a reference-based, whole-pattern matching principle. By utilizing known unit-cell parameters and symmetry information, MCDPS-SFX determines crystal orientations by systematically looping through the entire orientation space [31,32]. The algorithm evaluates orientations using a scoring function based on the match rate between observed Bragg reflections and predicted peaks across the entire detector. Furthermore, it incorporates an iterative refinement strategy that optimizes orientation and lattice parameters while progressively identifying more reflections, a feature that makes it particularly resilient to outliers and effective for resolving overlapping lattices in multi-crystal hits. To maintain high efficiency despite the exhaustive search, orientation tasks are assigned to multiple computer cores for parallel processing.
2. Methods
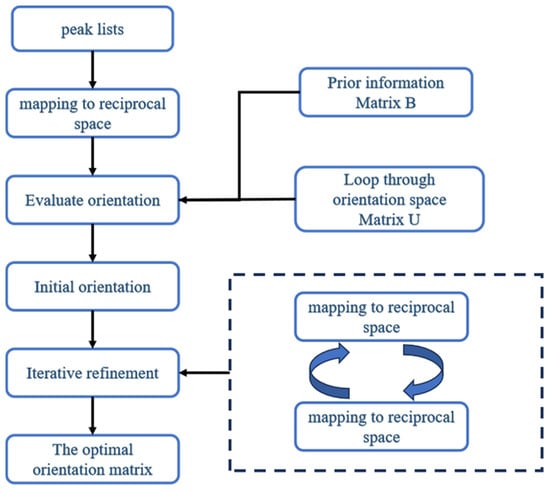
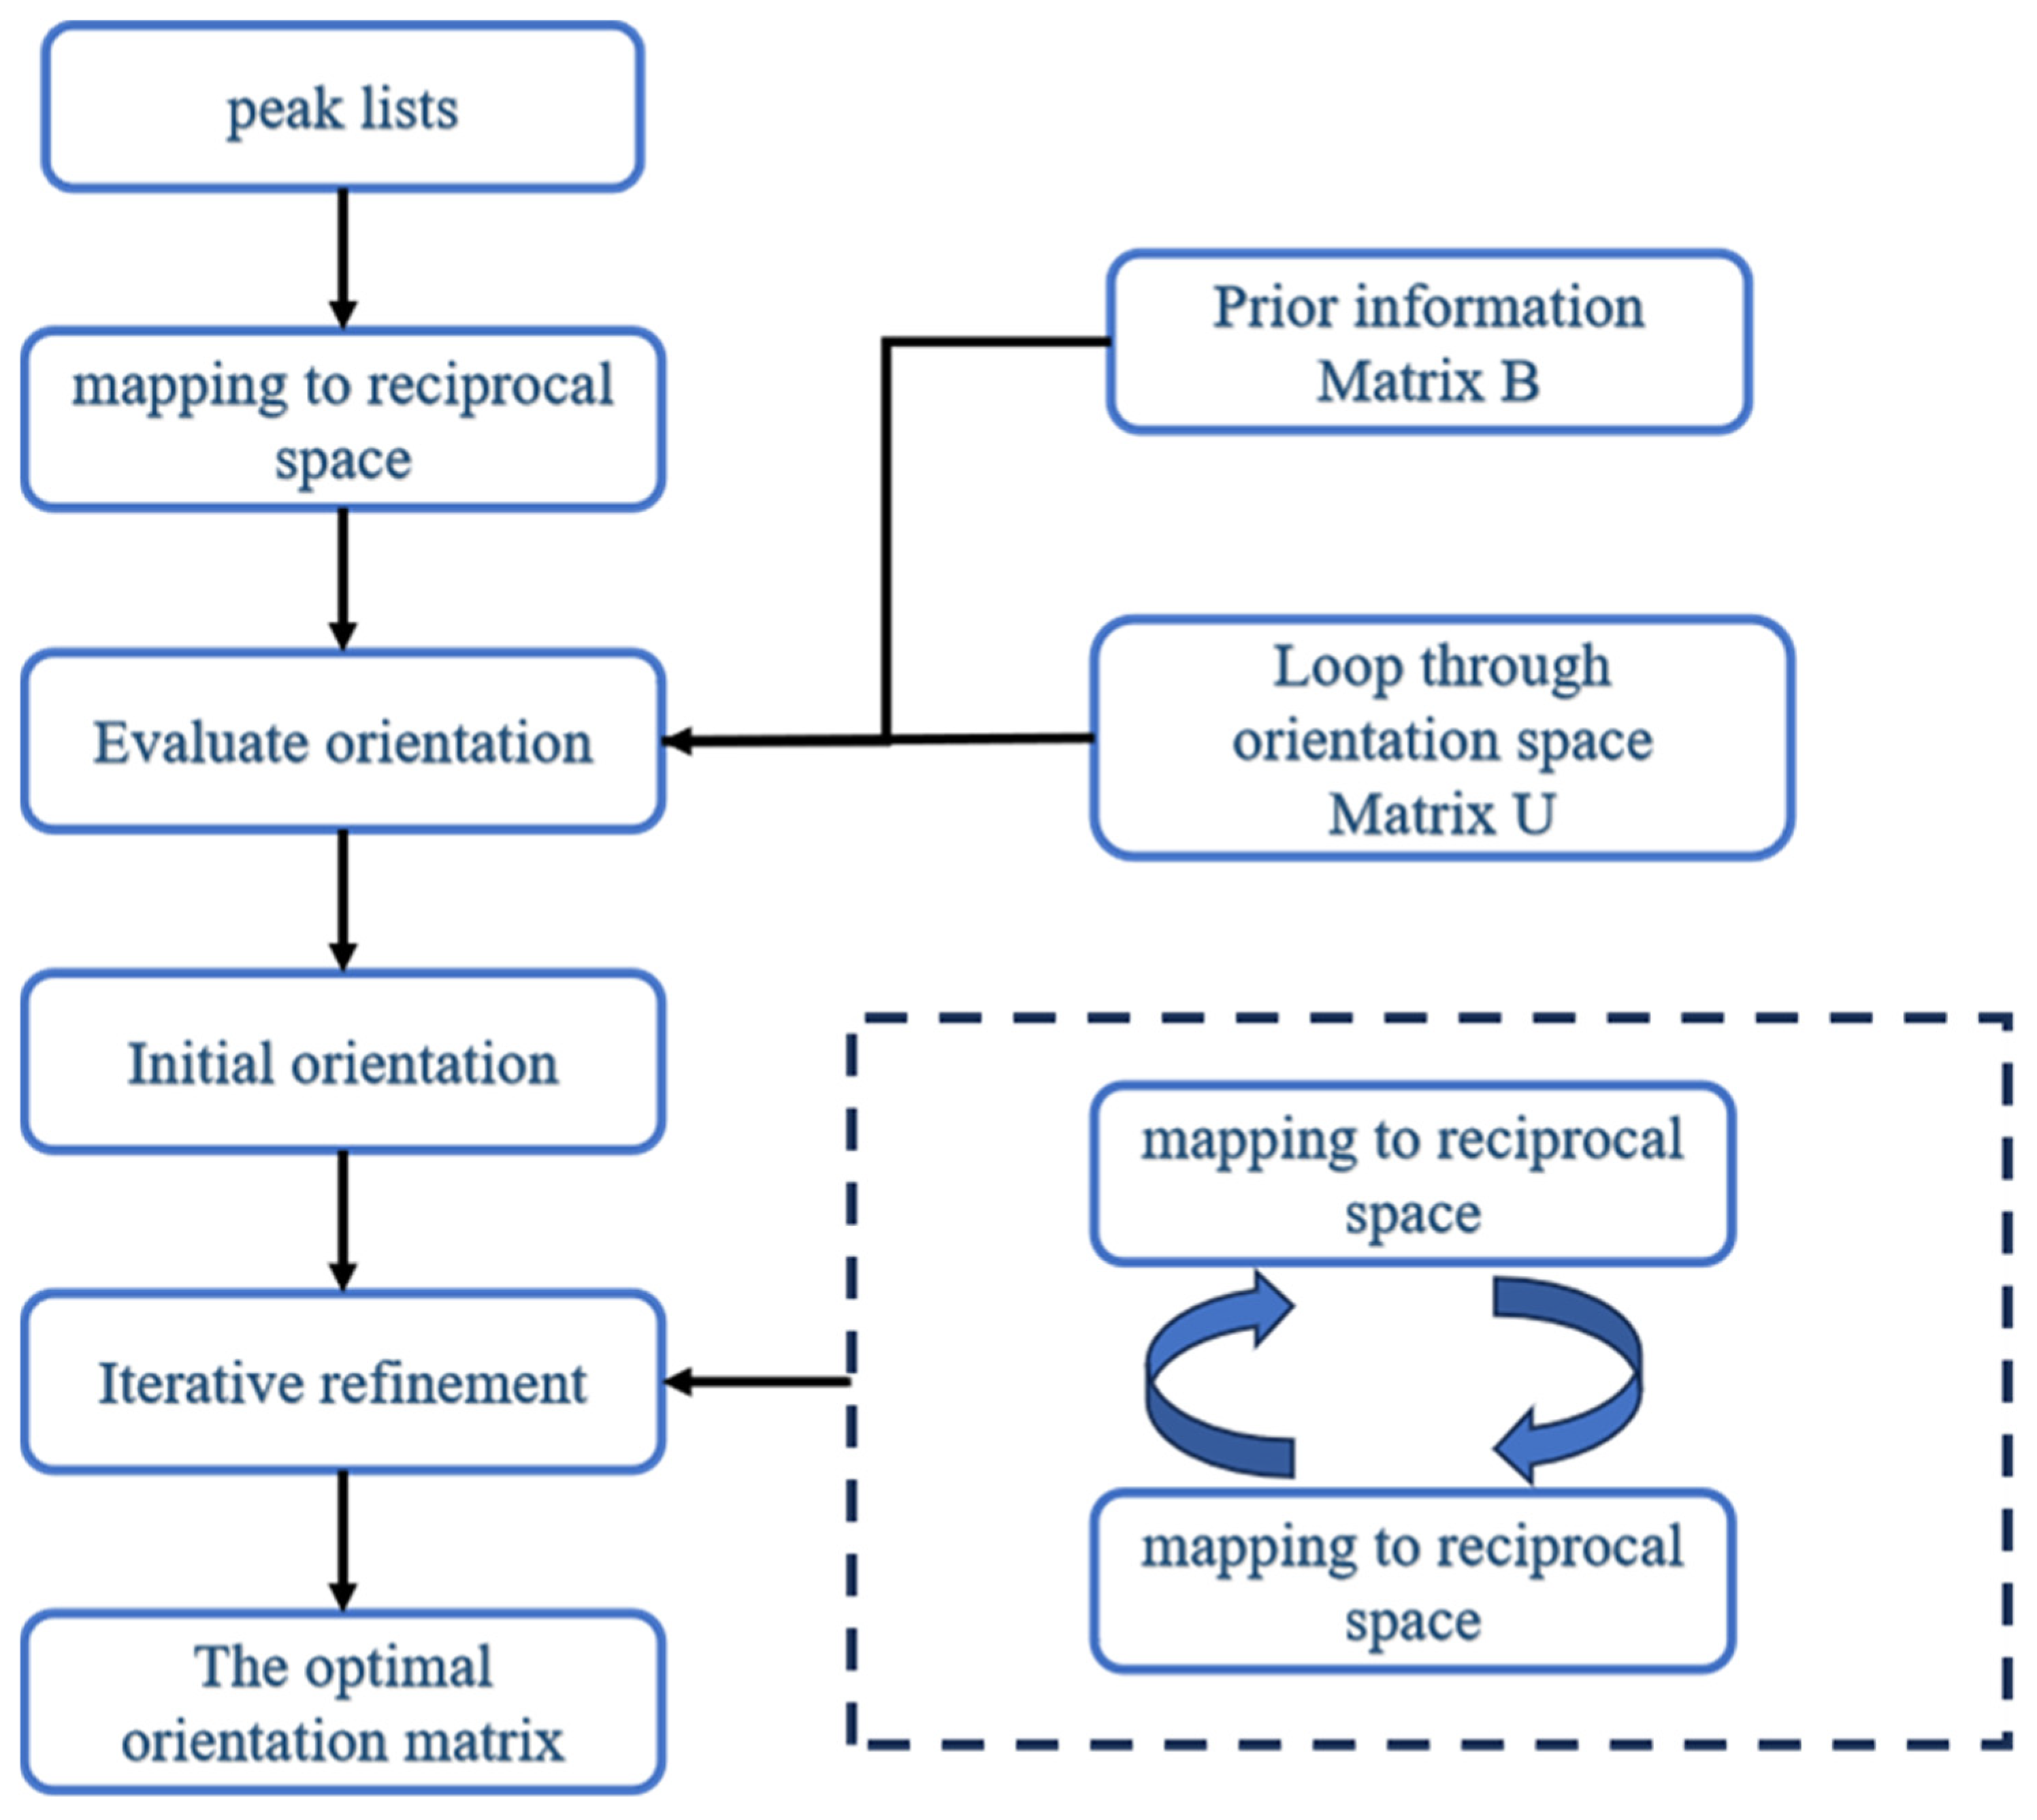
X-ray free-electron lasers can produce two types of diffraction patterns: multi-crystal diffraction patterns and sparse diffraction patterns. For the former, accurately identifying diffraction spots from the same lattice is crucial for successful structure determination. As for the latter, since peaks are sparsely distributed, it is tough to identify periodicity using Fourier methods. MCDPS-SFX can process both types of diffraction patterns. Relying on the known unit-cell parameters and symmetry information, it can determine each crystal’s orientation with respect to the laboratory coordinate system. The workflow of the algorithm is illustrated in Figure 1, and the detailed steps are elaborated as follows:
Figure 1.
Workflow of MCDPS-SFX.
- (a)
- Bragg peaks are identified using the ZAEF algorithm from the CrystFEL suite (version 0.10.1). Then, the positions of these peaks are transformed via a geometry file. Finally, the positions of these diffraction peaks are sorted in descending order of their intensities and written into a text file one by one.
- (b)
- When the number of diffraction peaks exceeds 100, select the first 100 peaks generated by the above process and save them as a text file. Then, transform the 2D detector coordinates into 3D reciprocal scattering vectors by the following equations:where x and y denote the 2D coordinates of each diffraction peak on the detector plane with respect to the beam center, D represents the distance from the sample to the detector and is the incident X-ray wavelength.
- (c)
- Create a list of unit vectors determined by two spherical polar coordinates ψ and φ, along with a self-rotation angle θ. To cover the entire orientation space while considering computational cost, the search directions of ψ and φ are evenly spaced within a hemisphere, similar to the method in MOSFLM. Specifically, ψ varies from 0 to π/2 in 0.03 rad steps, φ ranges from 0 to 2π with 0.03/sin ψ rad increments, and θ changes from 0 to 2π in 0.03 rad steps. For each three-angle group, its corresponding rotation can be represented by the Rodrigues’ matrix below:where s = sinθ, c = cosθ, and nx, ny, nz are the Cartesian components of the unit vector, expressed as:
- (d)
- For each of the unit vectors in step (b), compute a combined orientation matrix [UB] by directly multiplying the Rodrigues’ rotation matrix U with the orthogonalization matrix B. Matrix B links reciprocal basis vectors to the crystallographic Cartesian coordinate system. Then, use the Formula (4) below to determine the Miller indices of each observed peak from the combined orientation matrix and reciprocal scattering vectors.
- (e)
- The nearest Miller Index corresponding to each diffraction point is calculated using Formula (5). Then, using Formula (6), the difference between and is calculated. Finally, using Formula (7), it is determined whether the observed peak matches the predicted peak determined by U and B.
- (f)
- Iterate through all the orientations generated in step (c) and obtain the optimal orientation through the scoring function (8). Here, “all peaks” refers to the first 100 strongest diffraction peaks when the number of diffraction peaks exceeds 100, or all the diffraction peaks.
- (g)
- Iteratively refine: After determining an initial optimal orientation, the orientation parameters and specific lattice-related unit cells are iteratively optimized by minimizing the following objective function using the Simplex algorithm:Specifically, the Miller Indices corresponding to all observed diffraction points are calculated using the initial optimal orientation and then judged according to Formula (7). The points that pass the judgment are used for iterative refinement. Generally, the number of reflections that match the current lattice increases with the improvement of the parameters and will be further used in the next round of optimization after each optimization cycle, thereby further promoting more precise optimization. This alternating operation between optimization and supplementing reflections has the advantage that it can gradually identify more reflections that are not affected by outliers and is therefore particularly suitable for multi-crystal indexing. The entire optimization process will be repeated until a convergence state is reached (i.e., no new points can be added), or by default until the tenth cycle is completed.
- (h)
- Remove the matching peaks and use the remaining unidentified diffraction peaks to search for another orientation. Continue until the number of diffraction peaks is less than 10.
Since the proposed method is based on a whole-pattern matching principle, sampling the entire three-dimensional spatial domain consumes a significant amount of time. Moreover, the indexing speed is proportional to the number of observed reflections. To speed up the calculation process, first, the entire direction space is divided into different parts, and the direction space sampling tasks are assigned to multiple computer cores for parallel processing.
3. Results
3.1. The Feasibility of the Algorithm
To rigorously assess the robustness of our novel indexing algorithm, MCDPS-SFX, we applied it to two structurally and experimentally distinct SFX datasets collected at X-ray free-electron laser (XFEL) facilities. Dataset I: Achromobacter cycloclastes nitrite reductase (AcNiR). This copper-containing metalloenzyme catalyzes the reduction of nitrite to nitric oxide and serves as a model system for studying electron transfer in redox enzymes [33]. The dataset consists of 50,814 still-shot diffraction images collected at Diamond Light Source (UK). The crystals belong to the cubic space group P213 (a = b = c ≈ 97.6 Å). The dataset exhibits substantial heterogeneity, including a high proportion of multi-crystallite snapshots and patterns with low signal-to-noise ratios, which pose significant challenges for lattice indexing. These characteristics make it a stringent test case for evaluating the robustness of indexing algorithms under realistic and demanding conditions. Dataset II: Hen egg-white lysozyme. We used the seminal benchmark dataset from Boutet et al. [34], consisting of 59,287 diffraction images collected at the LCLS XFEL using 40 fs X-ray pulses at 9.4 keV. Lysozyme crystals adopt the tetragonal space group P43212 (a = b ≈ 78 Å, c ≈ 38 Å). Despite its status as a “model” system, this dataset spans a wide range of diffraction qualities—from strong, high-resolution patterns to extremely sparse images with fewer than 10 detectable Bragg peaks—making it an ideal testbed for evaluating algorithmic sensitivity and robustness.
All images were processed uniformly within the CrystFEL framework. Peak detection was performed using peakfinder8 with identical thresholding parameters across both datasets. Indexing was carried out in indexamajig under strictly consistent conditions: known reference unit-cell parameters were provided, orientation refinement was enabled, and spot integration employed a fixed profile radius of 3–5 pixels. We compared MCDPS-SFX against seven widely used algorithms: ASDF, DirAx, XDS, MOSFLM, TakeTwo, pinkIndexer, and XGANDALF.
As summarized in Table 1, MCDPS-SFX demonstrated superior performance across both datasets, identifying 95,354 crystals for lysozyme and 21,807 for AcNiR—exceeding even XGANDALF (87,572 and 21,277, respectively) and pinkIndexer (77,240 and 20,486). Notably, conventional indexers such as MOSFLM and XDS showed significantly reduced performance on AcNiR compared to lysozyme, underscoring the challenge of processing heterogeneous datasets. To further contextualize these results, we compared the indexing efficiency of MCDPS-SFX with the original findings reported by Boutet et al. In the initial publication, indexing rates of 18.4% (for 40 fs pulses) and 26.3% (for 5 fs pulses) were reported for the lysozyme dataset. By leveraging a reference-based whole-pattern matching strategy and resolving overlapping multi-lattice hits, MCDPS-SFX significantly increased the total crystal yield from the same benchmark data, demonstrating its capacity to maximize scientific output beyond the limits of conventional data-reduction pipelines.
Table 1.
Parameters and results for auto-indexing of AcNiR and lysozyme SFX data sets using indexamajig, calling various indexing subroutines.
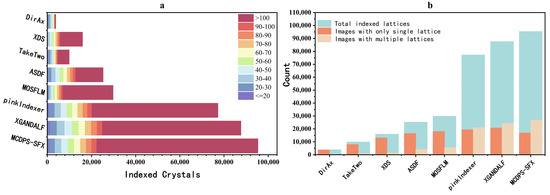
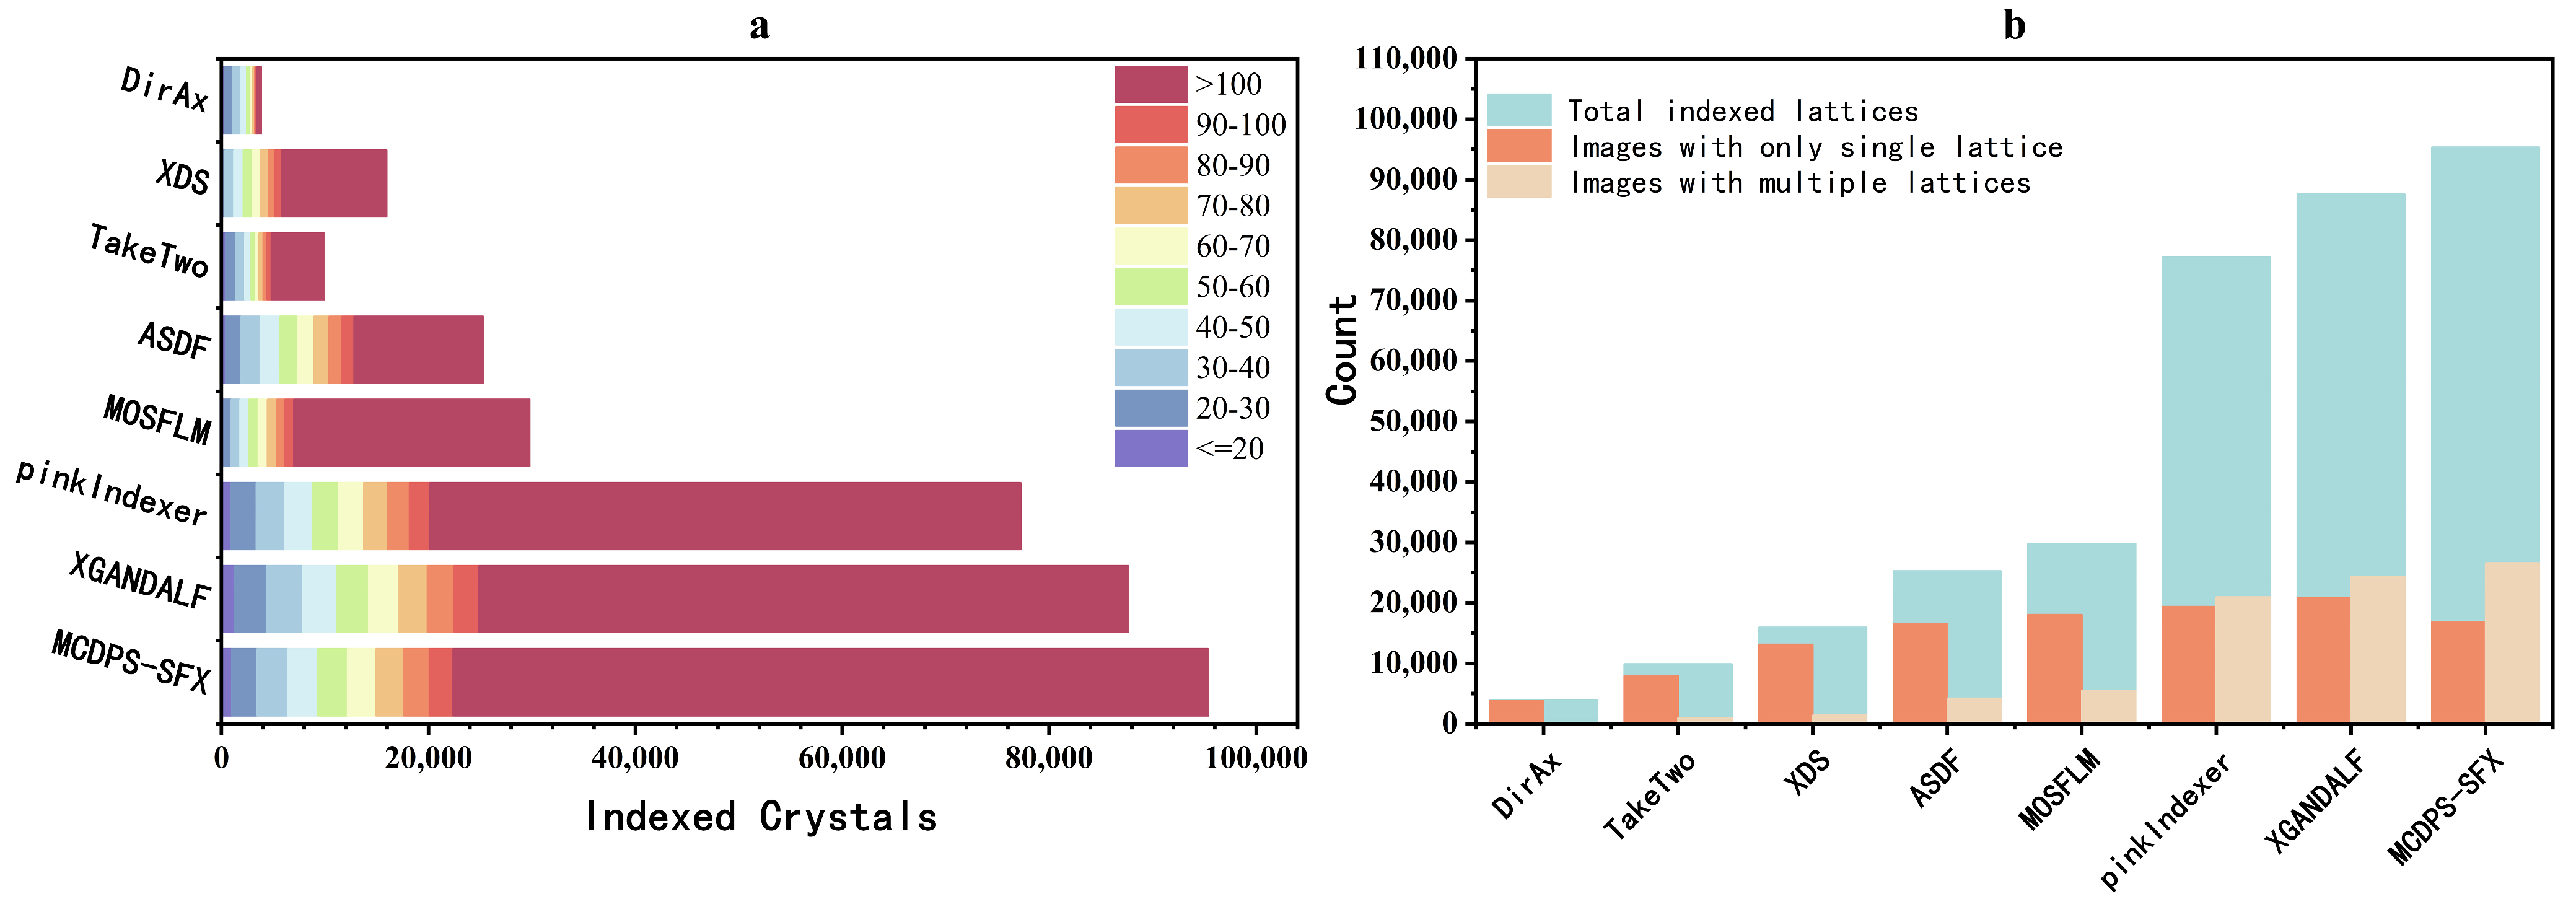
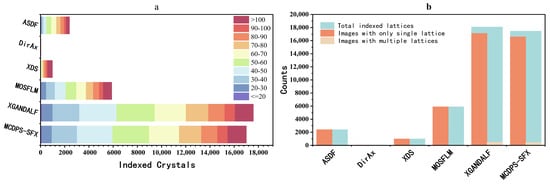
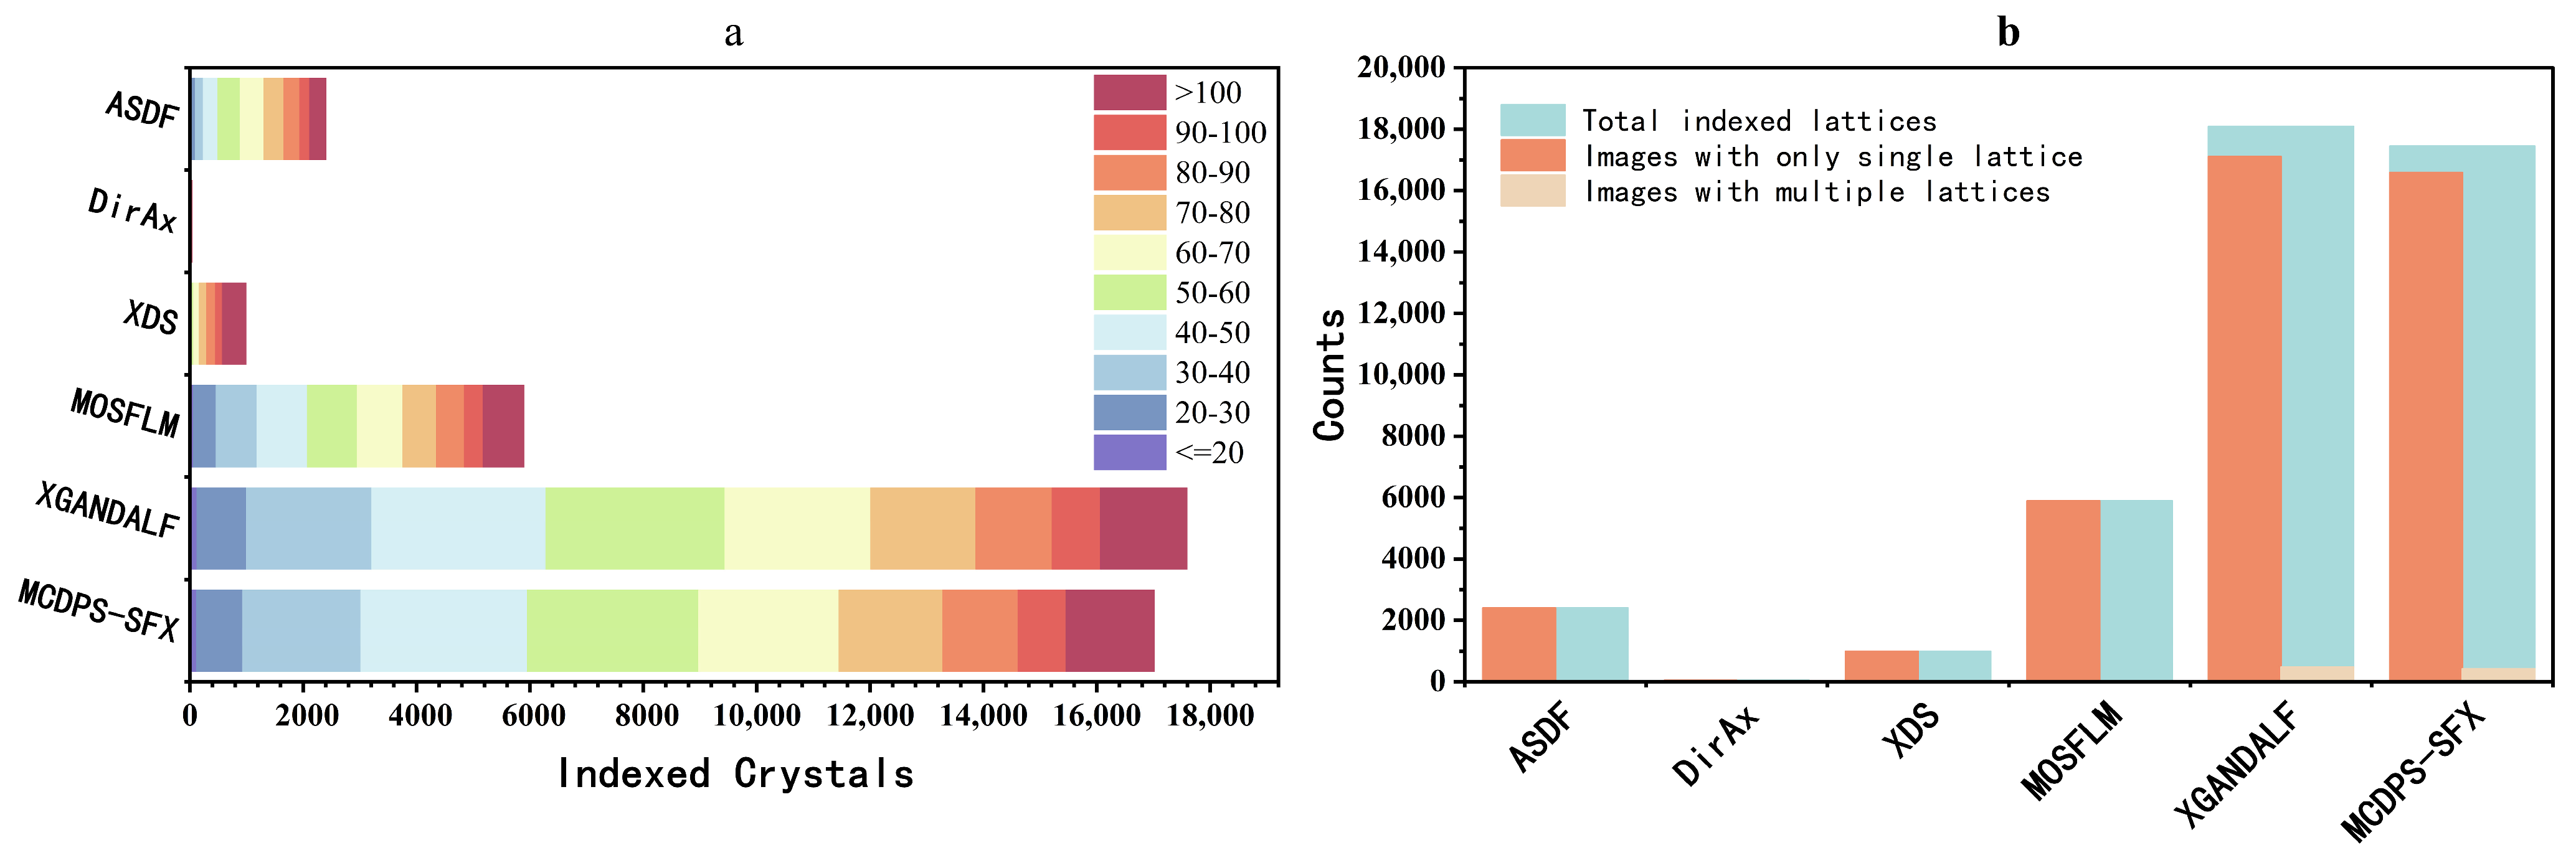
The distribution of indexed diffraction images across reflection count intervals (Figure 2a) reveals MCDPS-SFX’s exceptional capability in sparse diffraction pattern indexing. While XGANDALF achieved the highest count in the ≤20 reflections category (1269 images), MCDPS-SFX secured the second position (1015 images), substantially outperforming other algorithms (e.g., pinkIndexer: 950, MOSFLM: 244, XDS: 0). This demonstrates MCDPS-SFX’s robustness for weakly diffracting microcrystals. Crucially, MCDPS-SFX maintained superior performance across all reflection count ranges, culminating in the highest total indexed images, highlighting its comprehensive efficiency in processing both sparse and dense diffraction data.
Figure 2.
Comparative indexing performance on the lysozyme SFX dataset. (a) Distribution of indexed crystal hits binned by the number of reflections per image. The horizontal stacked bars represent different indexing algorithms (DirAx, XDS, TakeTwo, ASDF, MOSFLM, pinkIndexer, XGANDALF, and MCDPS-SFX). Colors indicate the reflection count intervals used for indexing, ranging from 20 (purple) to >100 (dark red). MCDPS-SFX demonstrates a superior total yield, particularly in capturing images with higher reflection counts. (b) Analysis of lattice composition across indexed images. The light blue bars represent the total indexed lattices. These are further categorized into Images with only a single lattice (orange bars) and images with multiple lattices (beige bars), commonly referred to as “multiplets.” MCDPS-SFX significantly outperforms existing methods in identifying multiple lattices within single diffraction patterns, contributing to its higher overall indexing rate.
The multi-lattice resolution capability of each algorithm (Figure 2b) further demonstrates MCDPS-SFX’s enhanced performance. It achieved the highest total number of indexed lattices (95,354), with 26,597 multi-lattice images (27.9% of the total), marginally exceeding XGANDALF (27.7%, 24,263/87,572). This superior performance in resolving overlapping diffraction patterns from multiple crystals in a single image, combined with strong single-lattice results (16,884 images), positions MCDPS-SFX as a balanced solution for both simple and complex diffraction scenarios.
The complementary strengths of MCDPS-SFX—robust sparse data indexing (Figure 2a) and superior multi-lattice resolution (Figure 2b)—address two critical challenges in SFX: maximizing data utilization from weakly diffracting crystals and accurately processing complex diffraction patterns. Supplementary analysis of the AcNiR dataset (Figure S1) confirms these findings, with MCDPS-SFX maintaining second-best performance in sparse indexing (1162 images with ≤20 reflections) and a consistent advantage in multi-lattice processing.
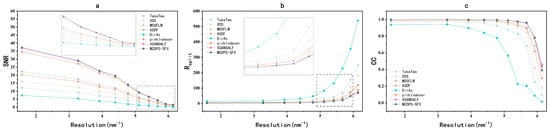
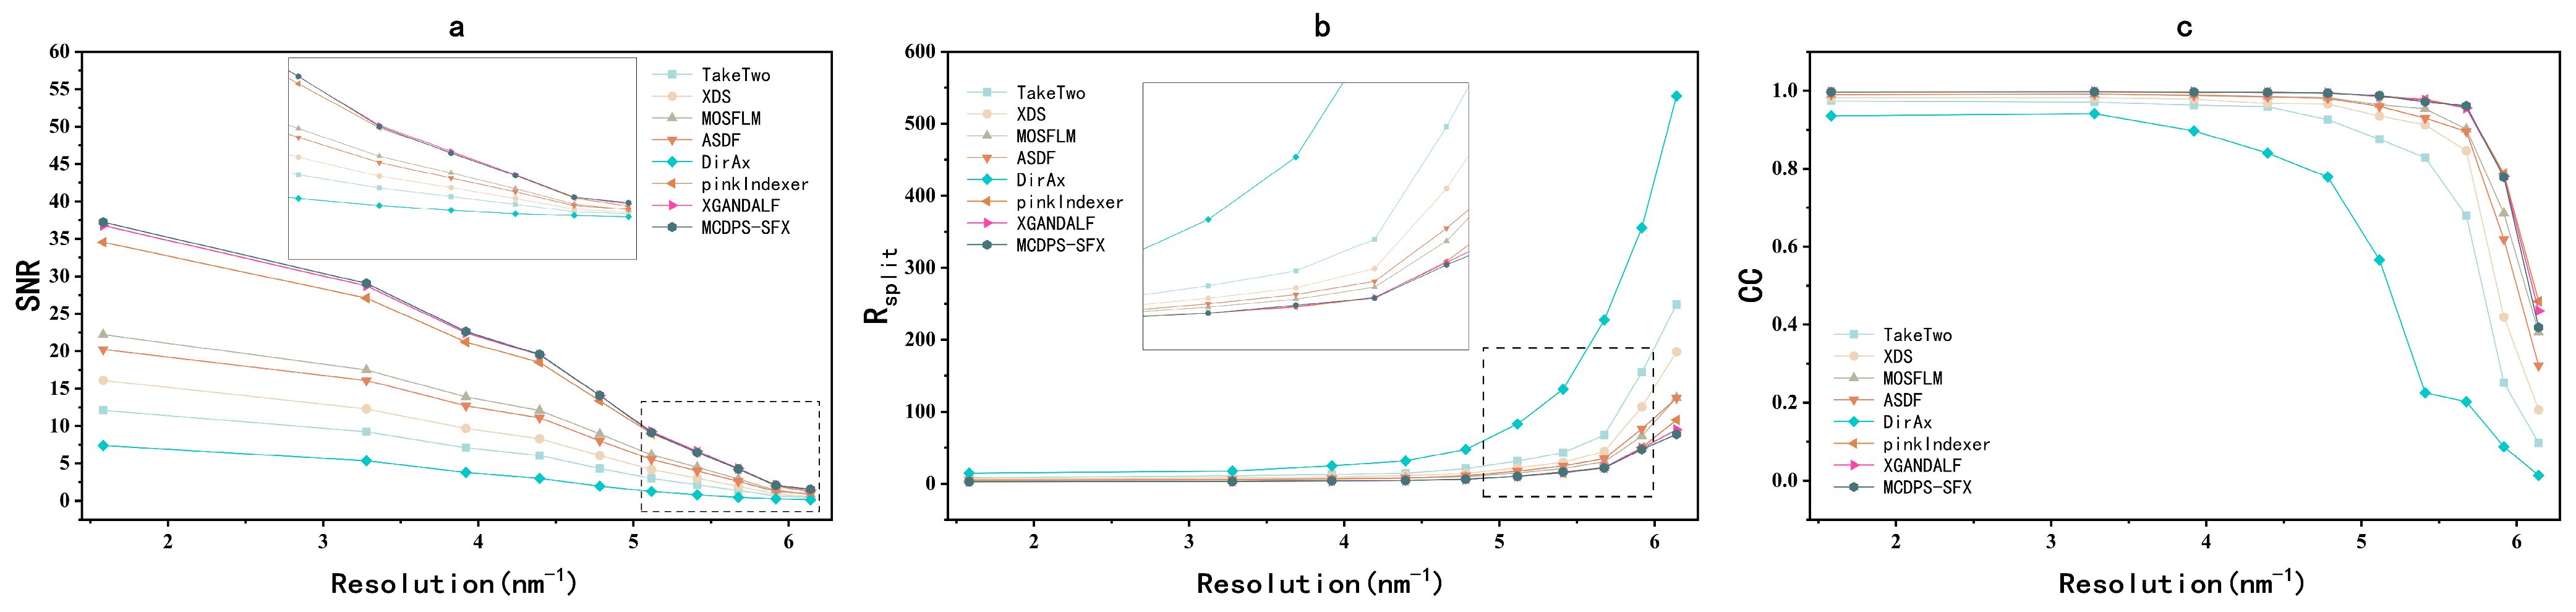
The quality of diffraction data generated by each algorithm (Figure 3) reveals MCDPS-SFX’s comprehensive advantage. The signal-to-noise ratio (SNR) as a function of resolution (Figure 3a) demonstrates MCDPS-SFX’s superior ability to extract reliable diffraction signals from noise, maintaining the highest SNR values across all resolution shells, particularly at low resolution (1.58–3.0 Å)—significantly higher than those of competing algorithms. This indicates MCDPS-SFX’s effectiveness in identifying and integrating weak reflections while minimizing noise contamination. The reproducibility of intensity measurements (Figure 3b), quantified by Rsplit, shows that MCDPS-SFX has minimal values throughout the resolution range (below 10 at low resolution, remaining below 30 at high resolution), contrasting sharply with DirAx and TakeTwo, which indicate poor reproducibility. The correlation between intensities from different images (Figure 3c) further demonstrates MCDPS-SFX’s sustained high correlation coefficient (CC) values (>0.90 at low resolution, declining gradually to ~0.4 at 6.14 Å), comparable to pinkIndexer and XGANDALF but significantly surpassing DirAx and TakeTwo.
Figure 3.
Evaluation of data quality metrics as a function of resolution for the lysozyme dataset. (a) Signal-to-noise ratio (SNR), (b) split-half R-factor (Rsplit), and (c) Pearson correlation coefficient (CC) plotted against resolution (reciprocal space units, nm−1). The metrics compare the performance of MCDPS-SFX with seven other indexing algorithms. Insets in (a,b) provide a magnified view of the high-resolution shells (ranging from approximately 5 to 6.2 nm−1), where the differences in data quality become more pronounced. MCDPS-SFX (dark green line) consistently maintains superior signal strength (higher SNR), better internal consistency (lower Rsplit), and higher reproducibility (CC) across the entire resolution range, particularly in the challenging high-resolution region.
To further contextualize the multi-lattice recovery performance, we compared our results with the FELIX algorithm [25], another global search indexer based on Rodrigues–Frank space. As summarized in their benchmark study, FELIX identified 44,465 crystals from a similar lysozyme dataset, achieving an Rsplit of 5.9% and structural refinement values of 0.213/0.248 (Rwork/Rfree). In contrast, MCDPS-SFX extracted 95,354 crystals from the benchmark data, representing more than double the crystal yield. This significant increase in data recovery was achieved while maintaining high structural fidelity, with Rwork/Rfree values of 0.188/0.199, demonstrating that MCDPS-SFX offers a more exhaustive and robust solution for maximizing information recovery from multi-lattice XFEL snapshots.
The combined metrics in Figure 3 highlight MCDPS-SFX’s comprehensive advantage in generating high-quality diffraction data: superior SNR, minimal Rsplit, and maximal CC across the entire resolution range. These results confirm that MCDPS-SFX not only indexes more crystals but also produces more reliable and consistent data, making it a robust choice for SFX experiments requiring high data fidelity. Supplementary analysis of the AcNiR dataset (Figure S2) further validates these findings across two distinct protein systems, demonstrating MCDPS-SFX’s generalizability and robustness in producing high-quality SFX datasets.
3.2. The Universality of the Algorithm
Having demonstrated that MCDPS-SFX achieves the highest data quality on standard test cases (lysozyme and AcNiR), we next tested its performance on two biologically critical and technically demanding GPCR systems: the rhodopsin–arrestin complex [35] and the full-length glucagon receptor (GCGR) [36]. These datasets feature extremely sparse Bragg peaks and strong background scattering—conditions that rigorously challenge the accuracy and robustness of indexing algorithms. Moreover, both systems contain functionally important but structurally flexible regions (e.g., the ECD–TMD linker in GCGR and the phosphorylated C-tail of rhodopsin), which require high-fidelity intensity data for reliable modeling.
The rhodopsin–arrestin dataset comprises 20,000 diffraction images collected at the SACLA XFEL facility using 25 fs X-ray pulses at 10.0 keV. The crystals belong to the orthorhombic space group P213 (a = 109.24 Å, b = 109.24 Å, c = 452.64 Å), with 37% of images containing fewer than 15 detectable Bragg peaks and 22% exhibiting signal-to-noise ratios below 2.0—conditions that render conventional indexing approaches highly unreliable. We applied MCDPS-SFX under identical processing conditions as previously described, and its performance is comprehensively illustrated in Figure 4.
Figure 4.
Benchmarking of indexing performance on the rhodopsin–arrestin dataset. (a) Distribution of indexed crystal hits categorized by reflection count intervals, ranging from 20 (purple) to >100 (dark red). The performance of MCDPS-SFX is compared with five other indexing algorithms. For this membrane protein complex dataset, MCDPS-SFX and XGANDALF exhibit comparable and dominant yields, significantly outperforming traditional methods such as MOSFLM, XDS, and ASDF. (b) Structural composition of indexed lattices classified by image complexity. The bars represent total indexed lattices (light blue), images with only a single lattice (orange), and images with multiple lattices (beige). On the rhodopsin–arrestin dataset, XGANDALF shows a marginal lead in the total number of recovered lattices, primarily driven by single-lattice hits. Nevertheless, MCDPS-SFX demonstrates highly competitive performance and robustness, effectively capturing diffraction data across various reflection densities and maintaining a high success rate for this challenging structural target.
The distribution of indexed diffraction patterns across reflection count intervals (Figure 4a) reveals MCDPS-SFX’s robust ability to recover weakly diffracting crystals. MCDPS-SFX indexed a significantly higher proportion of images with ≤20 reflections (critical for capturing sparse diffraction patterns from the phosphorylated C-tail containing S334, T336, and S338) compared to XDS (0 images) and MOSFLM (61 images). While XGANDALF achieved a slightly higher total index count (18,089 vs. 17,447), MCDPS-SFX demonstrated superior consistency in indexing the most challenging low-reflection regimes. Crucially, MCDPS-SFX maintained balanced performance across all reflection ranges, enabling reliable modeling of the flexible C-tail region essential for arrestin recruitment.
The multi-lattice indexing capability (Figure 4b) further highlights MCDPS-SFX’s strength in complex diffraction scenarios. It resolved 427 multi-lattice images (2.45% of the total indexed patterns), reflecting its ability to detect overlapping crystal orientations critical for capturing rhodopsin–arrestin conformational dynamics. This capability is particularly valuable for resolving interactions between arrestin residues (e.g., R19) and rhodopsin’s phosphorylated C-tail (S334, S338, K339), as supported by biochemical evidence of direct binding.
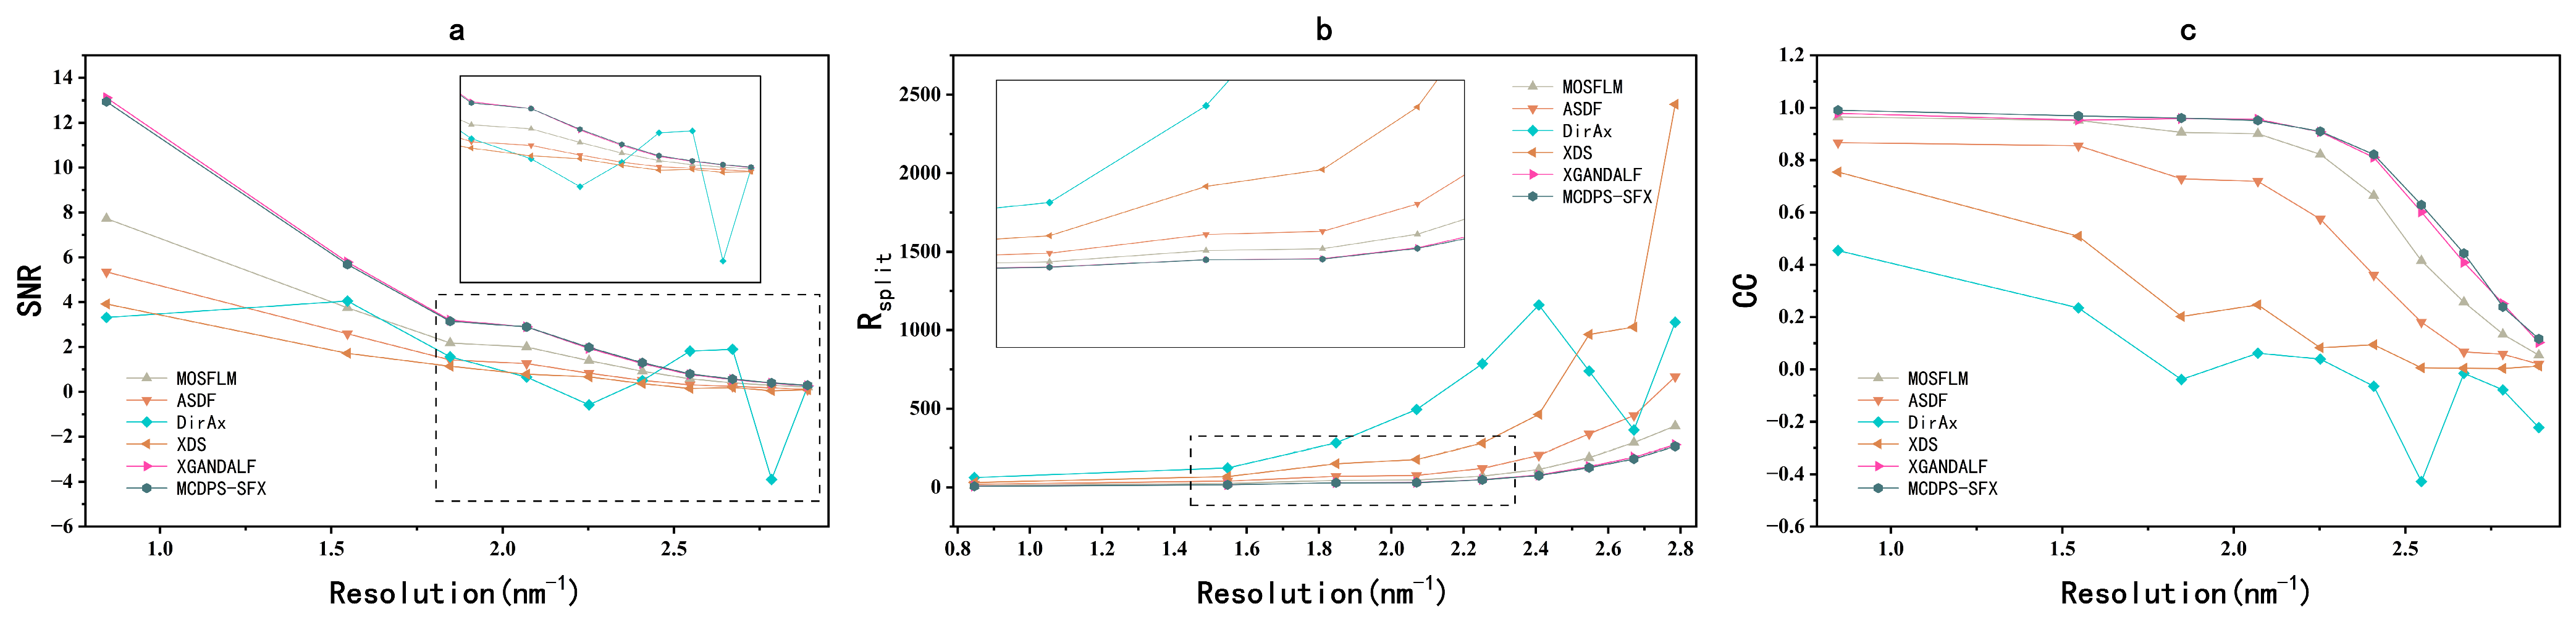
This data quality advantage manifests as a consistent, though modest, improvement over XGANDALF in key metrics (Rsplit and CC), which directly translates to structural resolution of functionally critical regions. MCDPS-SFX delivers a consistent, albeit subtle, performance edge over XGANDALF across all resolution shells—most critically in metrics defining structural interpretability (Rsplit and CC) (Figure 5b,c). While XGANDALF achieves a marginally higher SNR at low resolution (0.84 nm−1: 13.12 vs. 12.94), MCDPS-SFX maintains lower Rsplit (7.61% vs. 8.04%) and higher CC (0.9906 vs. 0.9788) throughout the resolution range. This advantage widens at higher resolutions, where MCDPS-SFX preserves CC > 0.11 (vs. XGANDALF: CC < 0.10 at 2.89 nm−1) and Rsplit < 370% (vs. XGANDALF: Rsplit > 400%). Crucially, this small but systematic improvement directly enables the resolution of functionally critical regions—such as the phosphorylated C-tail (S334/T336/S338)—that would remain ambiguous in XGANDALF-processed data due to signal degradation. The significant deviations and erratic fluctuations observed for the DirAx algorithm in Figure 5 are attributed to its exceptionally low indexing rate for the rhodopsin–arrestin complex. Due to the extreme sparsity of the diffraction snapshots, DirAx failed to yield a statistically representative number of reflections per resolution shell. This lack of data redundancy renders the calculated quality metrics highly sensitive to background noise and outliers, leading to the observed instability in SNR and CC values. This result highlights the fragility of legacy indexing methods when confronted with technically demanding GPCR systems, further underscoring the robustness of the MCDPS-SFX whole-pattern matching approach.
Figure 5.
Comparative evaluation of data quality metrics for the rhodopsin–arrestin complex dataset. (a) Signal-to-noise ratio (SNR), (b) split-half R-factor (Rsplit), and (c) Pearson correlation coefficient (CC) as functions of resolution (nm−1). The processing results of MCDPS-SFX (dark teal line with hexagons) are benchmarked against other common indexing programs, including XGANDALF (magenta, right-pointing triangles), MOSFLM (beige, upward triangles), ASDF (light orange, pentagons), XDS (orange, right-pointing triangles), and DirAx (cyan, diamonds). Insets in (a,b) provide a detailed view of the data behavior in the high-resolution shells (up to 2.8 nm−1). For this challenging membrane protein dataset, MCDPS-SFX and XGANDALF exhibit comparable and superior data quality across the entire resolution range.
To evaluate the practical impact of indexing precision on structural determination, we conducted full atomic refinement for the rhodopsin–arrestin complex using data processed by MCDPS-SFX. Compared with the original benchmark (PDB ID: 4ZWJ), the algorithm demonstrated a significant advantage in data recovery. In a subset of 20,000 images, it identified approximately 17,447 crystals (~87% yield), which outperforms the 84.8% peak indexing rate reported by Kang et al. [35]. Facilitated by higher data utilization, the structural resolution was significantly extended from 3.30 Å to 3.01 Å(Table 2). While the Clashscore was 1.81 (compared to 1.57 for the benchmark), the refined model maintains high structural fidelity and geometric consistency. These validation statistics can be independently verified by inputting the respective PDB files into the MolProbity functionality within the Phenix (version 1.15.2-3472) software suite.
Table 2.
Comparison of structural refinement and validation statistics for the rhodopsin–arrestin complex and GCGR between the original benchmarks and MCDPS-SFX.
Following our successful application of MCDPS-SFX to the rhodopsin–arrestin complex (an A-class GPCR model system), we extended this validation to the structurally distinct B-class glucagon receptor (GCGR). GCGR represents a critical therapeutic target in metabolic disorders, with its large extracellular domain (ECD) and dynamic ECD–transmembrane domain (TMD) interface presenting significant challenges for structural biology. Unlike rhodopsin, which serves as a canonical A-class GPCR model, GCGR’s unique architecture and physiological role in glucose homeostasis—particularly its involvement in diabetes and obesity pathophysiology—demand rigorous validation of data-processing algorithms across diverse GPCR families.
To contextualize MCDPS-SFX’s performance in GCGR processing, we present key metrics from the data-processing pipeline (Table 3). All algorithms processed identical datasets (91,653 images), but indexing efficiency varied: XGANDALF indexed 69,399 images (75.7%) and identified 74,478 crystals, outperforming MCDPS-SFX (63,984 images, 69.8%; 69,014 crystals) and MOSFLM (39,868 images, 43.5%; 39,936 crystals). Data consistency metrics revealed a nuanced distinction: while XGANDALF achieved a marginally lower Rsplit (13.28% vs. 13.67%), both MCDPS-SFX and XGANDALF maintained identical high CC values (0.99) across the full resolution range (30.13–3.00 Å), in contrast to MOSFLM’s degraded performance (Rsplit = 16.97%, CC = 0.98).
Table 3.
Indexing and merging statistics for the GCGR SFX data set comparing MCDPS-SFX, XGANDALF and MOSFLM.
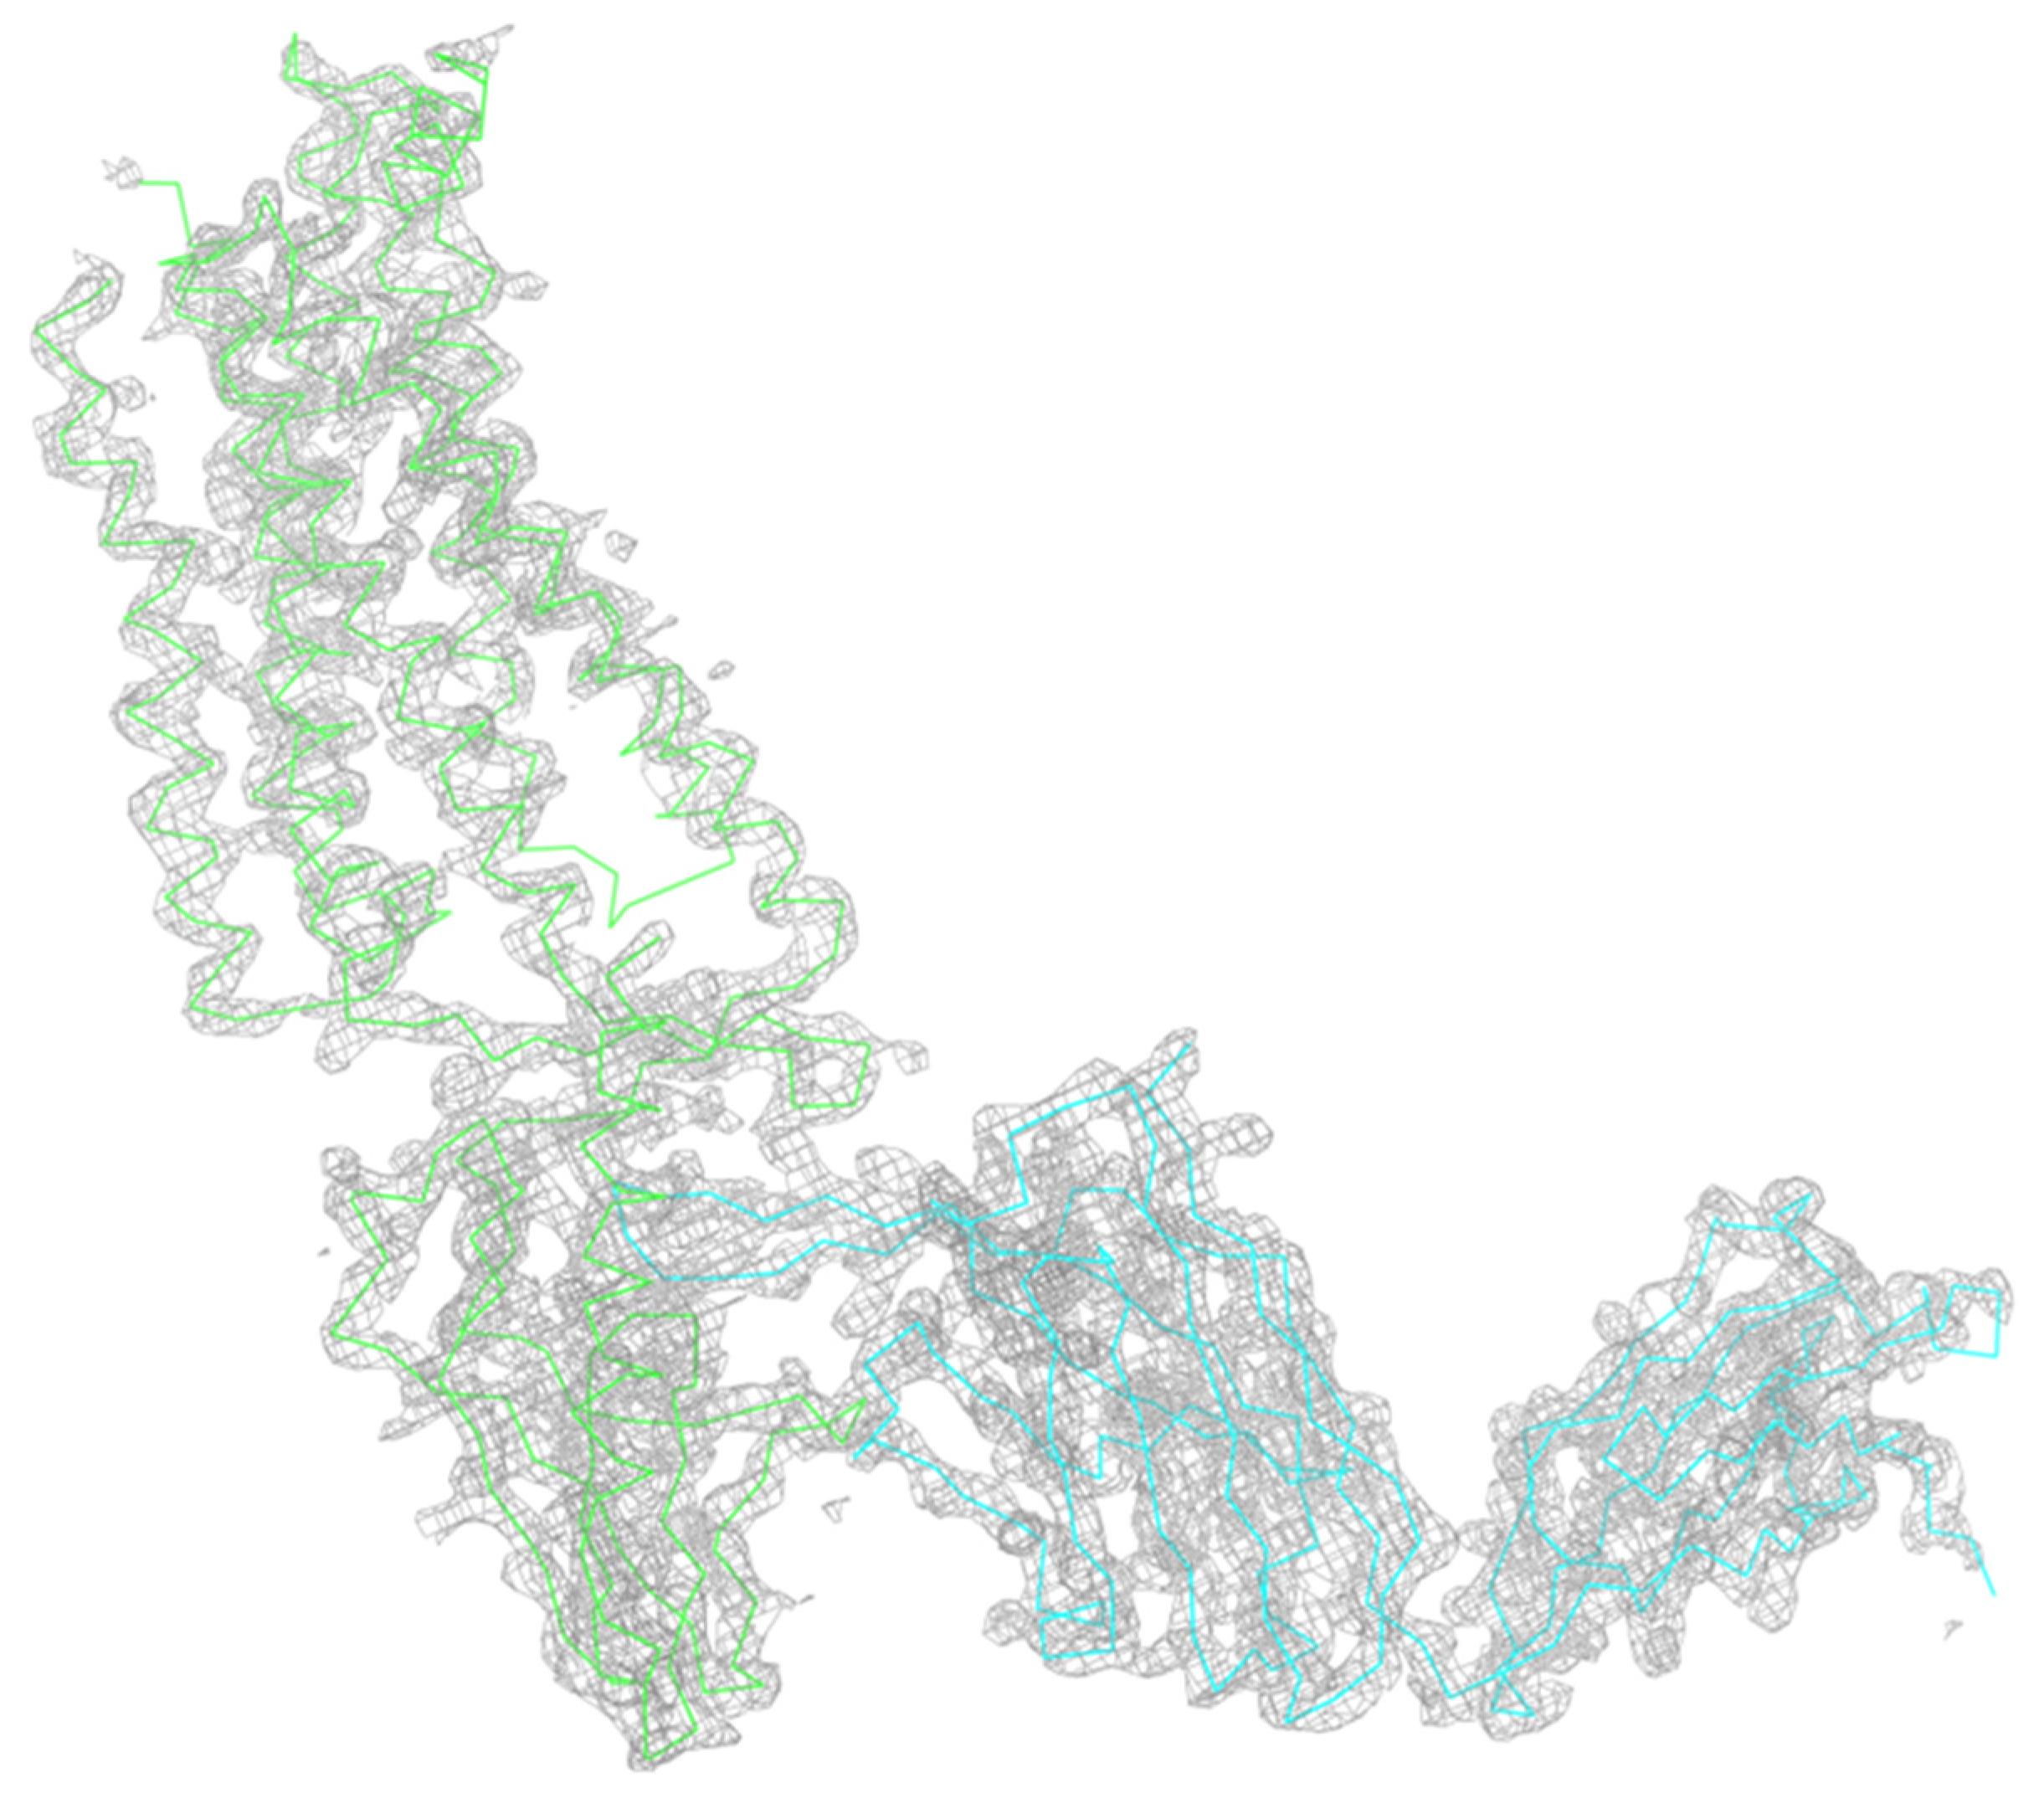
Critically, this data quality translated directly to structural resolution. The MCDPS-SFX-processed dataset yielded a refined electron density map with Rwork = 0.1701 and Rfree = 0.1891 (Figure 6), resolving GCGR’s ECD–TMD interface and ligand-binding pocket—regions essential for understanding glucagon signaling and designing diabetes therapeutics. Notably, MCDPS-SFX achieved this structural fidelity despite slightly lower indexing efficiency than XGANDALF, demonstrating that data consistency (Rsplit, CC) and structural quality (Rwork/Rfree) are more critical than raw indexing rates for resolving functionally relevant regions. This performance aligns with MCDPS-SFX’s consistent success in rhodopsin–arrestin analysis, confirming its robustness across structurally distinct GPCR families (A-class vs. B-class) without overstating absolute superiority.
Figure 6.
Representative electron density map of the glucagon receptor (GCGR) complex. The protein backbone is shown as a ribbon model, with the receptor and its associated components colored in green and cyan, respectively. The gray mesh represents the final 2Fo–Fc electron density map, contoured at 2.0 (or your specific value). The map shows a clear and continuous density for the seven-transmembrane (7TM) helices, demonstrating a high degree of correlation between the experimental data and the atomic model. This high-quality density highlights the structural integrity of the GCGR complex as resolved by the [MCDPS-SFX/XFEL] data-processing pipeline.
MCDPS-SFX also demonstrated excellent generalizability in processing data for the full-length glucagon receptor (GCGR), a more challenging Class B GPCR system. For the GCGR dataset (PDB ID: 5XEZ), MCDPS-SFX achieved an indexing rate of 69.8% (63,984 images), significantly exceeding the 63.0% (57,573 images) reported by Zhang et al. [36] in their seminal study. This improved data utilization translated directly into higher structural fidelity; the refined Rwork/Rfree values were 0.17/0.19, representing a measurable improvement over the 0.21/0.24 reported in the original study. These comparative results confirm that MCDPS-SFX is a powerful tool for enhancing both the quality and quantity of data extracted from challenging XFEL experiments. Consistent with the rhodopsin–arrestin analysis, the structural validation metrics for GCGR can be independently audited using the MolProbity tool in Phenix.
Finally, we benchmarked the computational cost of MCDPS-SFX on an Intel i9-10980XE workstation (Intel Corp., Santa Clara, CA, USA) (Table 4). While MCDPS-SFX is slower than XGANDALF due to its exhaustive search strategy, it remains faster than other global search methods like pinkIndexer on specific datasets (e.g., AcNiR), while delivering equivalent or superior indexing yields. This balance between processing speed and data output underscores the robustness of our framework for challenging experimental conditions.
Table 4.
Performance comparison of indexing algorithms (1000 diffraction images per dataset).
4. Conclusions
The transition from static snapshots to four-dimensional “molecular movies” requires an analytical pipeline capable of extracting every bit of information from fragile crystalline samples. MCDPS-SFX addresses the most vulnerable stage of this pipeline—indexing—by replacing legacy geometric assumptions with a resilient, reference-based matching strategy. Our comparative assessment confirms that MCDPS-SFX is not merely an incremental improvement but a robust solution to the twin challenges of data sparsity and multi-lattice complexity.
The successful determination of the GCGR ECD–TMD interface and the high-fidelity modeling of the rhodopsin C-tail underscore that data consistency and structural interpretability are more vital than raw indexing speed. By achieving superior signal extraction and minimal reproducibility error across diverse protein systems, MCDPS-SFX reduces the requisite sample volume and beam time—resources that remain the primary constraints of XFEL-based discovery. As megahertz-repetition rate facilities continue to push the boundaries of temporal resolution, bespoke frameworks like MCDPS-SFX will be essential to translate the terabyte-scale data deluge into profound insights into the fundamental processes of chemistry and biology.
Supplementary Materials
The following supporting information can be downloaded at: https://www.mdpi.com/article/10.3390/app16084020/s1.
Author Contributions
Conceptualization, Z.G.; Methodology, Q.W. and Z.G.; Validation, Q.W. and Z.G.; Resources, Y.-H.D.; Writing—original draft, Q.W.; Writing—review & editing, Z.G., Z.-Q.G. and Z.S. All authors have read and agreed to the published version of the manuscript.
Funding
This research was funded by the Strategic Priority Research Program of the Chinese Academy of Sciences (CAS), grant number XDB37040302. The APC was funded by the same grant.
Institutional Review Board Statement
Not applicable.
Informed Consent Statement
Not applicable.
Data Availability Statement
The data presented in this study are available in Coherent X-ray Imaging Data Bank at https://www.cxidb.org (accessed on 13 April 2026).
Acknowledgments
The authors would like to express their sincere gratitude to Tiankun Zhou from Diamond Light Source for generously providing the AcNiR dataset used in this study. His contribution was instrumental in the validation and benchmarking of the MCDPS-SFX algorithm.
Conflicts of Interest
The authors declare no conflict of interest.
References
- Doerr, A. Diffraction before destruction. Nat. Methods 2011, 8, 283. [Google Scholar] [CrossRef] [Scilit] [PubMed]
- Fraser, J.S.; van den Bedem, H.; Samelson, A.J.; Lang, P.T.; Holton, J.M.; Echols, N.; Alber, T. Accessing protein conformational ensembles using room-temperature X-ray crystallography. Proc. Natl. Acad. Sci. USA 2011, 108, 16247–16252. [Google Scholar] [CrossRef] [Scilit] [PubMed]
- Tenboer, J.; Basu, S.; Zatsepin, N.; Pande, K.; Milathianaki, D.; Frank, M.; Hunter, M.; Boutet, S.; Williams, G.J.; Koglin, J.E.; et al. Time-resolved serial crystallography captures high-resolution intermediates of photoactive yellow protein. Science 2014, 346, 1242–1246. [Google Scholar] [CrossRef] [Scilit] [PubMed]
- Kern, J.; Alonso-Mori, R.; Tran, R.; Hattne, J.; Gildea, R.J.; Echols, N.; Glöckner, C.; Hellmich, J.; Laksmono, H.; Sierra, R.G.; et al. Simultaneous Femtosecond X-ray Spectroscopy and Diffraction of Photosystem II at Room Temperature. Science 2013, 340, 491–495. [Google Scholar] [CrossRef] [Scilit]
- Pande, K.; Hutchison, C.D.M.; Groenhof, G.; Aquila, A.; Robinson, J.S.; Tenboer, J.; Basu, S.; Boutet, S.; DePonte, D.P.; Liang, M.N.; et al. Femtosecond structural dynamics drives the trans/cis isomerization in photoactive yellow protein. Science 2016, 352, 725–729. [Google Scholar] [CrossRef] [Scilit]
- Schlichting, I. Serial femtosecond crystallography: The first five years. IUCrJ 2015, 2, 246–255. [Google Scholar] [CrossRef] [Scilit]
- Murakawa, T.; Suzuki, M.; Fukui, K.; Masuda, T.; Mizohata, E.; Miyahara, I.; Kurauchi, I.; Murakami, T.; Matsunaga, H.; Montawa, Y.; et al. Real-time capture of domain movements during copper amine oxidase catalysis by mix-and-inject serial crystallography. Nat. Commun. 2025, 16, 11149. [Google Scholar] [CrossRef] [Scilit]
- Schulz, E.C.; Prester, A.; von Stetten, D.; Gore, G.; Hatton, C.E.; Bartels, K.; Leimkohl, J.P.; Schikora, H.; Ginn, H.M.; Tellkamp, F.; et al. Probing the modulation of enzyme kinetics by multi-temperature, time-resolved serial crystallography. Nat. Commun. 2025, 16, 6553. [Google Scholar] [CrossRef] [Scilit]
- Mous, S.; Poitevin, F.; Hunter, M.S.; Asthagiri, D.N.; Beck, T.L. Structural biology in the age of X-ray free-electron lasers and exascale computing. Curr. Opin. Struct. Biol. 2024, 86, 102808. [Google Scholar] [CrossRef] [Scilit]
- Paulson, L.; Narayanasamy, S.R.; Shelby, M.L.; Frank, M.; Trebbin, M. Advanced manufacturing provides tailor-made solutions for crystallography with x-ray free-electron lasers. Struct. Dyn. 2024, 11, 011101. [Google Scholar] [CrossRef] [Scilit]
- Stubbs, J.; Hornsey, T.; Hanrahan, N.; Esteban, L.B.; Bolton, R.; Maly, M.; Basu, S.; Orlans, J.; De Sanctis, D.; Shim, J.U.; et al. Droplet microfluidics for time-resolved serial crystallography. IUCrJ 2024, 11, 237–248. [Google Scholar] [CrossRef] [Scilit] [PubMed]
- Khusainov, G.; Standfuss, J.; Weinert, T. The time revolution in macromolecular crystallography. Struct. Dyn. 2024, 11, 020901. [Google Scholar] [CrossRef] [Scilit] [PubMed]
- Nango, E.; Iwata, S. Recent progress in membrane protein dynamics revealed by X-ray free electron lasers: Molecular movies of microbial rhodopsins. Curr. Opin. Struct. Biol. 2023, 81, 102629. [Google Scholar] [CrossRef] [Scilit]
- White, T.A.; Mariani, V.; Brehm, W.; Yefanov, O.; Barty, A.; Beyerlein, K.R.; Chervinskii, F.; Galli, L.; Gati, C.; Nakane, T.; et al. Recent developments in CrystFEL. J. Appl. Crystallogr. 2016, 49, 680–689. [Google Scholar] [CrossRef] [Scilit]
- Barty, A.; Kirian, R.A.; Maia, F.; Hantke, M.; Yoon, C.H.; White, T.A.; Chapman, H. Cheetah: Software for high-throughput reduction and analysis of serial femtosecond X-ray diffraction data. J. Appl. Crystallogr. 2014, 47, 1118–1131. [Google Scholar] [CrossRef] [Scilit]
- White, T.A.; Kirian, R.A.; Martin, A.V.; Aquila, A.; Nass, K.; Barty, A.; Chapman, H.N. CrystFEL: A software suite for snapshot serial crystallography. J. Appl. Crystallogr. 2012, 45, 335–341. [Google Scholar] [CrossRef] [Scilit]
- Trujillo, J.; Fung, R.; Shankar, M.K.; Schwander, P.; Hosseinizadeh, A. Filling data analysis gaps in time-resolved crystallography by machine learning. Struct. Dyn. 2025, 12, 014101. [Google Scholar] [CrossRef] [Scilit]
- Powell, H.R. The Rossmann Fourier autoindexing algorithm in MOSFLM. Acta Crystallogr. Sect. D-Biol. Crystallogr. 1999, 55, 1690–1695. [Google Scholar] [CrossRef] [Scilit]
- Kabsch, W. XDS. Acta Crystallogr. Sect. D-Biol. Crystallogr. 2010, 66, 125–132. [Google Scholar] [CrossRef] [Scilit]
- Duisenberg, A.J.M. Indexing in Single-Crystal Diffractometry with an Obstinate List of Reflections. J. Appl. Crystallogr. 1992, 25, 92–96. [Google Scholar] [CrossRef] [Scilit]
- Brewster, A.S.; Sawaya, M.R.; Rodriguez, J.; Hattne, J.; Echols, N.; McFarlane, H.T.; Cascio, D.; Adams, P.D.; Eisenberg, D.S.; Sauter, N.K. Indexing amyloid peptide diffraction from serial femtosecond crystallography: New algorithms for sparse patterns. Acta Crystallogr. Sect. D-Struct. Biol. 2015, 71, 357–366. [Google Scholar] [CrossRef] [Scilit]
- Gildea, R.J.; Waterman, D.G.; Parkhurst, J.M.; Axford, D.; Sutton, G.; Stuart, D.I.; Sauter, N.K.; Evans, G.; Winter, G. New methods for indexing multi-lattice diffraction data. Acta Crystallogr. Sect. D-Struct. Biol. 2014, 70, 2652–2666. [Google Scholar] [CrossRef] [Scilit]
- Dejoie, C.; Smeets, S.; Baerlocher, C.; Tamura, N.; Pattison, P.; Abela, R.; McCusker, L. Serial snapshot crystallography for materials science with SwissFEL. Acta Crystallogr. A-Found. Adv. 2015, 71, S53. [Google Scholar] [CrossRef] [Scilit]
- Ginn, H.; Ginn, H.M.; Roedig, P.; Kuo, A.; Evans, G.; Sauter, N.K.; Ernst, O.; Meents, A.; Mueller-Werkmeister, H.; Miller, D.; et al. TakeTwo: An indexing algorithm suited to still images with known crystal parameters. Acta Crystallogr. A-Found. Adv. 2016, 72, S195. [Google Scholar] [CrossRef] [Scilit]
- Beyerlein, K.R.; White, T.A.; Yefanov, O.; Gati, C.; Kazantsev, I.G.; Nielsen, N.F.-G.; Larsen, P.M.; Chapman, H.N.; Schmidt, S. FELIX: An algorithm for indexing multiple crystallites in X-ray free-electron laser snapshot diffraction images. J. Appl. Crystallogr. 2017, 50, 1075–1083. [Google Scholar] [CrossRef] [Scilit]
- Li, C.; Li, X.; Kirian, R.; Spence, J.C.H.; Liu, H.; Zatsepin, N.A. SPIND: A reference-based auto-indexing algorithm for sparse serial crystallography data. IUCrJ 2019, 6, 72–84. [Google Scholar] [CrossRef] [Scilit] [PubMed]
- Li, X.; Li, C.; Liu, H. SPIND-TC: An indexing method for two-color X-ray diffraction data. Acta Crystallogr. A-Found. Adv. 2020, 76, 369–375. [Google Scholar] [CrossRef] [Scilit] [PubMed]
- Gevorkov, Y.; Yefanov, O.; Barty, A.; White, T.A.; Mariani, V.; Brehm, W.; Tolstikova, A.; Grigat, R.-R.; Chapman, H.N. XGANDALF—Extended gradient descent algorithm for lattice finding. Acta Crystallogr. A-Found. Adv. 2019, 75, 694–704. [Google Scholar] [CrossRef] [Scilit]
- Gasparotto, P.; Barba, L.; Stadler, H.C.; Assmann, G.; Mendonça, H.; Ashton, A.W.; Janousch, M.; Leonarski, F.; Béjar, B. TORO Indexer: A PyTorch-based indexing algorithm for kilohertz serial crystallography. J. Appl. Crystallogr. 2024, 57, 931–944. [Google Scholar] [CrossRef] [Scilit] [PubMed]
- Gevorkov, Y.; Barty, A.; Brehm, W.; White, T.A.; Tolstikova, A.; Wiedorn, M.O.; Meents, A.; Grigat, R.-R.; Chapman, H.N.; Yefanov, O. pinkindexer—A universal indexer for pink-beam X-ray and electron diffraction snapshots. Acta Crystallogr. A-Found. Adv. 2020, 76, 121–131. [Google Scholar] [CrossRef] [Scilit]
- Zhou, Q.; Gao, Z.Q.; Dong, Z.; Jiang, Y.M.; She, Z.; Geng, Z.; Dong, Y.H. A reference-based multi-lattice indexing method integrating prior information correction and iterative refinement in protein crystallography. Acta Crystallogr. A-Found. Adv. 2021, 77, 277–288. [Google Scholar] [CrossRef] [Scilit] [PubMed]
- Geng, Z.; Hu, M.; She, Z.; Zhou, Q.; Gao, Z.; Dong, Y. An iterative refinement method combining detector geometry optimization and diffraction model refinement in serial femtosecond crystallography. Radiat. Detect. Technol. Methods 2018, 2, 28. [Google Scholar] [CrossRef] [Scilit]
- Horrell, S.; Antonyuk, S.V.; Eady, R.R.; Hasnain, S.S.; Hough, M.A.; Strange, R.W. Serial crystallography captures enzyme catalysis in copper nitrite reductase at atomic resolution from one crystal. IUCrJ 2016, 3, 271–281. [Google Scholar] [CrossRef] [Scilit]
- Boutet, S.; Lomb, L.; Williams, G.J.; Barends, T.R.M.; Aquila, A.; Doak, R.B.; Weierstall, U.; DePonte, D.P.; Steinbrener, J.; Shoeman, R.L.; et al. High-Resolution Protein Structure Determination by Serial Femtosecond Crystallography. Science 2012, 337, 362–364. [Google Scholar] [CrossRef] [Scilit]
- Kang, Y.Y.; Zhou, X.E.; Gao, X.; He, Y.Z.; Liu, W.; Ishchenko, A.; Barty, A.; Sathish, D.; Yefanov, O.; Han, G.W.; et al. Crystal structure of rhodopsin bound to arrestin by femtosecond X-ray laser. Nature 2015, 523, 561–567. [Google Scholar] [CrossRef] [Scilit] [PubMed]
- Zhang, H.; Qiao, A.; Yang, D.; Yang, L.; Dai, A.; De Graaf, C.; Reedtz-Runge, S.; Dharmarajan, V.; Zhang, H.; Han, G.W.J.N. Structure of the full-length glucagon class B G-protein-coupled receptor. Nature 2017, 546, 259–264. [Google Scholar] [CrossRef] [Scilit] [PubMed]

Disclaimer/Publisher’s Note: The statements, opinions and data contained in all publications are solely those of the individual author(s) and contributor(s) and not of MDPI and/or the editor(s). MDPI and/or the editor(s) disclaim responsibility for any injury to people or property resulting from any ideas, methods, instructions or products referred to in the content. |
© 2026 by the authors. Licensee MDPI, Basel, Switzerland. This article is an open access article distributed under the terms and conditions of the Creative Commons Attribution (CC BY) license.