


Abstract
Despite a plethora of studies in recent years focusing on the impact of nitrogen source addition on plant responses, there remains a lack of clarity regarding the differential utilization and distribution patterns of various nitrogen sources by Larix olgensis A. Henry seedlings. Specifically, the mechanisms by which ammonium nitrogen, nitrate nitrogen, and urea are differentially absorbed and distributed among different organs within the plant, as well as how these processes couple with rhizosphere soil microbial processes, still await elucidation. This study, conducted under field experimental conditions, employed a combination of 15N isotopic tracing, soil physicochemical property measurements, enzyme activity analysis, and microbial community functional analysis to investigate the effects of three nitrogen sources (NH4+, NO3−, and urea) and their varying addition levels on nitrogen absorption and distribution in Larix olgensis A. Henry seedlings. The results indicate that nitrogen source type significantly influences the nitrogen absorption rate and internal distribution patterns of plants. Within 24 h, seedlings preferentially absorb ammonium nitrogen and retain a higher proportion of newly absorbed nitrogen in their roots. The high ammonium chloride (GN) treatment group exhibited the highest 15N abundance in the root region, suggesting rapid root assimilation and short-term underground retention. By 48 h, the 15N abundance and AT% values in most organs across different treatment groups were significantly higher than those at 24 h, facilitating the transport of nitrate nitrogen and urea to stems and leaves, indicating a gradual shift in nitrogen distribution towards the aboveground parts. Moderate nitrogen addition improved soil nutrient conditions, altered pH and conductivity, enhanced nitrogen transformation processes related to urease and nitrate reductase, and increased microbial diversity and metabolic functions related to carbon metabolism, nitrogen metabolism, and energy metabolism. Soil pH, total nitrogen (TN), ammonium nitrogen (NH4+-N), and organic carbon (OC) are core environmental factors driving the differentiation of soil microbial community structure, with distinct specificity in the response of microbial groups across different taxonomic levels to soil physicochemical properties.
1. Introduction
The acceleration of the nitrogen cycle is one of the core issues of global environmental change. With the intensification of human production activities, the global nitrogen cycle has shown a significant acceleration trend, accompanied by excessive and unbalanced nitrogen deposition. Global nitrogen deposition reached 92.7 Tg N in 2020 and has stabilized since reaching its peak in 2015 [1,2]. Developing countries, especially those in low- and mid-latitude regions, have become new hotspots for nitrogen deposition. This change is highly correlated with per capita GDP and also shows a trend toward higher peak levels of reduced nitrogen deposition than oxidized nitrogen deposition [2]. In particular, in China, rapid industrial and agricultural development has led to a steady increase in nitrogen deposition, making it the third-largest region for nitrogen deposition outside of Europe and the United States. Among these, the northeastern region of China, due to its high energy consumption, has become a high-value area for nitrogen deposition. The widespread use of coal is one of the primary sources of nitrogen oxide emissions. While the global trend toward phasing out coal combustion may reduce nitrogen oxide emissions, it could also lead to other climate change issues in the short term, such as regional warming and an increase in extreme precipitation events [3]. The spatial distribution characteristics of nitrogen deposition provide a unique background for studying plant nitrogen uptake preferences and their influencing factors in regional ecosystems [4].
Nitrogen isotope techniques have broad application prospects in ecological research, with the abundance ratio of the two stable nitrogen isotopes 14N and 15N (15N/14N) forming the foundation of such research; changes in δ15N values can provide quantitative information about nitrogen utilization and its fate. This high-precision and sensitive 15N isotopic tracing technology is widely applied in studying plant nitrogen nutrition status, fertilizer nitrogen utilization efficiency, and the environmental impacts of nitrogen fertilizer application, and it has emerged as a core tool in modern agriculture and ecological research for tracking nitrogen flow pathways in ecosystems, identifying nitrogen pollution sources, and supporting the development of scientific nitrogen management strategies. It is also indispensable for quantifying plant nitrogen absorption and analyzing the correlations between nitrogen absorption and environmental factors such as soil conditions and climatic factors, providing crucial support for scientific research on the global nitrogen cycle and the efficient use of nitrogen fertilizers. Notably, in recent years, the application of nitrogen isotope technology in agriculture and forestry has continued to expand: it is not only used to study nitrogen fertilizer utilization efficiency, but also shows great potential in optimizing fertilization strategies and reducing environmental pollution, and plays a key role in improving nitrogen resource management and promoting the sustainable development of ecosystems—especially in areas with high nitrogen deposition, where its application value is particularly significant.
The yellow larch (Larix olgensis A. Henry) is a key afforestation tree species in China’s Northeast region and plays an important role in maintaining regional ecological stability and carbon sink functions [5]. There is a positive correlation between tree species diversity and ecosystem stability. As one of the main tree species in Northeast China, the rich biodiversity of the yellow-flowered larch contributes to enhancing ecosystem stability [6,7]. In recent years, the application of nitrogen isotope technology in agriculture and forestry has continued to expand. It is not only used to study nitrogen fertilizer utilization efficiency, but also shows great potential in optimizing fertilization strategies and reducing environmental pollution. This technology plays a key role in improving nitrogen resource management and promoting the sustainable development of ecosystems, especially in areas with high nitrogen deposition, where its application value is particularly significant. Plant nitrogen uptake preferences are influenced by multiple factors, including: (1) soil physical and chemical properties (pH, carbon-to-nitrogen ratio, enzyme activity); (2) microbial community structure (e.g., nitrogen-fixing bacteria, nitrifying bacteria functional groups); (3) the bioavailability of nitrogen forms. However, the absorption preferences of yellow larch for different nitrogen forms remain unclear, and the interaction mechanisms between this species and the soil microbial system have not been systematically studied. This knowledge gap limits the development of precise nitrogen management strategies for this tree species under high nitrogen deposition conditions.
Based on this, this study conducted a multi-dimensional analysis to investigate the effects of adding different amounts of urea, ammonium chloride, and sodium nitrate on soil’s physical and chemical properties, microbial community structure, and the contribution ratio of nitrogen absorption by different parts of Larix gmelinii seedlings. This study aims to reveal the physiological and ecological mechanisms driving nitrogen absorption preferences in temperate coniferous tree species, deepening our understanding of the “plant–soil–microbe” nitrogen coupling cycle. It provides a basis for optimizing nitrogen fertilizer management in artificial larch forests in northeastern regions with high nitrogen deposition, reducing the risk of nitrogen leaching, and enhancing the sustainability of forest ecosystems.
2. Materials and Methods
2.1. Field Trial
This study was conducted in a yellow flower larch forest located on the backside of Jilin Agricultural University in Changchun City, Jilin Province (geographic coordinates: 43°05′–45°15′ N, 124°18′–127°05′ E), with nitrogen addition experiments initiated in 2018. The experimental area is located at an elevation of 250–350 m and belongs to the North Temperate Zone continental monsoon climate region. The region experiences hot and humid summers with concentrated rainfall and suitable temperatures, while winters are cold and prolonged with low temperatures. The significant seasonal differences provide ideal climatic conditions for studying plant nitrogen uptake characteristics.
The experimental subjects were two-year-old seedlings of the yellow-flowered larch (Larix olgensis A. Henry). Yellow-flowered larch is highly adaptable and widely distributed in temperate–cold climates with moist soils in gray-brown forest soil zones. It thrives in deep, fertile, well-drained sandy loam soils, with an optimal soil pH of approximately 5. Its broad ecological adaptability facilitates the study of plant responses to different soil conditions and nitrogen forms.
This experiment employed a completely randomized block design. Experimental plots were established in a flat, uniformly soil-conditioned area within the yellow flower larch forest on the backside of Jilin Agricultural University. Each plot measured 5 m × 5 m, with a minimum 2 m-wide buffer zone between any two plots to prevent interference between different treatments. The buffer zones ensured the independence of nitrogen addition and the accuracy of treatment effects. Nitrogen addition treatments were set at three levels: 0 kg N·hm−2·yr−1 (control group), 10 kg N·hm−2·yr−1 (low level), and 20 kg N·hm−2·yr−1 (high level). There were three forms of nitrogen addition: urea (U), NH4Cl (A, ammonium nitrogen), and NaNO3 (N, nitrate nitrogen). The experiment included seven treatments: high urea (HU), low urea (LU), high NH4Cl (HA), low NH4Cl (LA), high NaNO3 (HN), low NaNO3 (LN), and the control group (CK), formerly denoted as GN, DN, GL, DL, GX, and DX respectively. Each treatment was replicated five times. Nitrogen application was conducted once a month. Before the experiment, litter on the soil surface was removed to minimize non-experimental factors. Two-year-old yellow larch seedlings were planted according to uniform standards to ensure consistency in initial conditions. PVC pipes with a diameter of 10 cm were inserted into the soil to a depth of 40 cm around the seedlings to form a physical barrier and prevent lateral nitrogen loss. For 15N-labeled nitrogen injection, four equidistant injection points were set around each seedling. Each injection point received 5 mL of 15N-labeled nitrogen solution. The injection points were approximately 3 cm from the seedling stem, with an injection depth of 10 cm. The syringe needle featured a four-sided side-hole structure to ensure uniform solution diffusion. Seedlings and their complete root systems were harvested at two time points, 24 h and 48 h after injection, and rhizosphere soil samples were collected synchronously: adhering soil (0–2 mm from root surface) was gently brushed off the root system using a sterile soft brush as rhizosphere soil, and bulk soil samples (0–20 cm soil layer, 10 cm away from seedling stems) were collected using a sterile soil auger, with three soil sub-samples mixed into one composite sample per plot. After sample collection, preliminary processing was conducted immediately. Soil samples were divided into two portions: one portion was fresh-stored at 4 °C for subsequent microbial community analysis and enzyme activity determination, and the other portion was air-dried at room temperature, ground, and sieved through 2 mm and 0.15 mm nylon sieves for soil physicochemical property testing. Seedling samples were rinsed to remove surface impurities and then separated into four parts: main stem, lateral stems, roots, and leaves. The 15N content of different parts was determined using an elemental analyzer and isotope ratio mass spectrometry (IRMS) to assess nitrogen absorption.
This experiment aims to study the nitrogen absorption preferences of yellow larch seedlings by adding different forms of nitrogen and using the 15N labeling method, explore differences in nitrogen utilization efficiency under different environmental conditions, and provide important data support for further in-depth exploration of the nitrogen absorption mechanism of yellow larch.
2.2. Soil Physical and Chemical Properties Testing
Soil pH was determined using a pHS-3C pH meter (manufactured by Shanghai Precision & Scientific Instrument Co., Ltd., Shanghai, China) at a soil-to-water ratio of 1:2.5 (v/v). Soil electrical conductivity (EC) was measured using a DDS-307 conductivity meter (manufactured by Shanghai INESA Scientific Instrument Co., Ltd., Shanghai, China). The content of water-soluble salt was determined by mass method. The content organic matter was determined by K2Cr2O7-H2SO4 plus heat capacity method. Total nitrogen was determined using the Kjeldahl digestion system (manufactured by FOSS Analytical A/S, Hillerød, Denmark). Ammonium nitrogen (NH4+) and nitrate nitrogen (NO3−) were determined using ion chromatography (ICS-6000, Thermo Fisher Scientific, Sunnyvale, CA, USA) [8,9].
2.3. Soil Enzyme Activity Test
Rhizosphere soil samples (0–2 mm from the root surface) collected and pre-treated as described in Section 2.1 were used for enzyme activity determination, with three technical replicates set for each soil sample. Soil enzyme activity was measured using a kit (Geruisi Bioengineering Co., Ltd., Nanjing, China) following the manufacturer’s standardized protocol [10]. Soil nitrite reductase can reduce NO2− to NO3 thereby reducing the amount of NO2− in the sample that participates in the diazotization reaction to form a pink compound. This pink substance has a maximum absorption peak at 540 nm, and the activity of soil nitrite reductase is determined by measuring changes in the absorbance at 540 nm. The soil urease assay kit uses the indophenol blue colorimetric method to determine the NH3-N produced by urease hydrolysis of urea. In a strongly alkaline medium, it reacts with hypochlorite and phenol to form the water-soluble dye indophenol blue, whose intensity is directly proportional to the NH3-N content in the solution. This substance has maximum light absorption at 578 nm, and its intensity is directly proportional to the NH3-N content in the solution, thereby determining the urease activity. Soil nitrate reductase catalyzes the reduction in nitrate to nitrite while inhibiting the degradation of the nitrite produced by nitrite reductase. Nitrite reacts with the corresponding color reagent to form a red azo compound; this substance has a maximum absorption peak at 540 nm, thereby determining the activity of soil nitrate reductase. Soil acid protease (S-ACPT) hydrolyzes casein under acidic conditions to produce tyrosine; tyrosine reacts with phenol in alkaline conditions to form a blue compound; this blue substance has a characteristic absorption peak at 680 nm, thereby determining the activity of the S-NPT enzyme. Since the substrate casein contains multiple amino acids, a control containing the substrate casein must be set during the detection process to subtract interfering background values and exclude false positives.
2.4. Assessment and Calculation of Plant Nitrogen Acquisition Pathways and Their Contributions
15N abundance in different parts of yellow larch seedlings, namely leaf, root, main stem, side stem, and whole plant samples, were collected and separated, and the 15N abundance in each part was determined using an elemental analyzer and isotope ratio mass spectrometry (IRMS) (IRMS, IsoPrime 100, Isoprime Ltd., Cheadle Hulme, Greater Manchester, UK) following the method described by Hu et al. (2024) [11] and Zhang et al. (2020) [12]. Calculation of nitrogen uptake rates and contribution ratios: Combining 15N-labeled data, we calculated the uptake rates of different nitrogen forms by yellow poplar seedlings and their distribution ratios in various plant organs. We clarified the contributions of different nitrogen forms (urea, ammonium nitrogen, nitrate nitrogen) to overall nitrogen uptake by the plant, providing a theoretical basis for optimizing nitrogen management. Plant nitrogen absorption efficiency and preference: Compare the absorption efficiency of different nitrogen forms to reveal the absorption preference characteristics of seedlings for specific nitrogen forms and explore how this preference changes at different growth stages.
2.5. Soil Microbial Community Structure
Fresh rhizosphere soil samples (0–2 mm from the root surface) collected and pre-stored at 4 °C as described in Section 2.1 were used for microbial community structure analysis; genomic DNA was extracted from 0.5 g of homogenized fresh soil per sample using the E.Z.N.A.® Soil DNA Kit (Omega Bio-tek, Norcross, GA, USA) following the manufacturer’s standard protocol, with three technical replicates for each sample. Sampling 1 μg of genomic DNA, the sample is randomly fragmented into segments of approximately 350 bp using a Covaris ultrasonic disruptor to construct the library. The entire library preparation is completed through steps including end repair, addition of A-tails, ligation of sequencing adapters, purification, and PCR amplification. After library construction, the integrity of the library fragments and the size of the inserted fragments are assessed using AATI analysis. If the insert size meets expectations, the accurate concentration of the effective library is quantified using Q-PCR (effective library concentration > 3 nM) to ensure the library quality. After the library passes the quality check, different libraries are pooled according to their effective concentrations and target data output requirements, and then subjected to PE150 sequencing.
Fastp v0.23.4 (https://github.com/OpenGene/fastp, accessed on 1 April 2026) was used for preprocessing raw data from the Illumina NovaSeq/HiSeq sequencing platform to obtain high-quality clean reads for subsequent bioinformatic analysis. Paired-end reads were discarded under the following conditions: when either read contained adapter contamination; when either read contained more than 10% ambiguous nucleotides (N); or when either read contained more than 50% low-quality bases (quality score < 5). To account for potential host contamination in the samples, clean reads were aligned to the host genome database to remove reads of host origin. Bowtie2 v2.4.5 (http://bowtie-bio.sourceforge.net/bowtie2/index.shtml, 1 April 2026) was used for this purpose with the following parameters: --end-to-end, --sensitive, -I 200, and -X 400 [13,14,15].
MetaGeneMark v3.61 (http://topaz.gatech.edu/GeneMark/, 1 April 2026) was used to predict open reading frames (ORFs) for scaftigs (≥ 500 bp) from each sample using default parameters [13,16,17,18], and predicted sequences shorter than 100 nt were removed from the final gene set [19,20,21,22,23]. For the ORF prediction results, CD-HIT software (http://www.bioinformatics.org/cd-hit/, 1 April 2026) is used to eliminate redundancy [24,25] and obtain the non-redundant initial gene catalog (the nucleic acid sequences encoded by successive non-redundant genes are called genes) [22], with parameter settings: -c 0.95, -G 0, -aS 0.9, -g 1, -d 0 [16,20]. Clean data of each sample is aligned to the initial gene catalog by using Bowtie2 to calculate the number of reads of the genes on each sample alignment, with parameter settings: --end-to-end, --sensitive, -I 200, -x 400 [16,20]. Genes with reads ≤ 2 in each sample are filtered out to finally determine the gene catalog (Unigenes) for subsequent analysis [22]. Based on the number of reads aligned and the length of the gene, the abundance of each gene in each sample is calculated by the following formula, in which r is the number of gene reads on alignment, and L is the length of gene [26,27,28]:
where r represents the number of reads aligned to the gene, and L represents the length of the gene.
Based on the abundance of each gene in the gene catalog in each sample, basic information statistics, core-pan gene analysis, correlation analysis between samples, and Venn diagram analysis of gene numbers are performed.
DIAMOND software (https://github.com/bbuchfink/diamond/, 1 April 2026) [26] is used for alignment of unigenes sequences with Micro_NR database, which includes sequences from bacteria, fungi, archaea, and viruses extracted from NCBI’s NR database (https://www.ncbi.nlm.nih.gov/). The alignment is performed using the blastp algorithm with a parameter setting of [14]. On the basis of the abundance tables at each taxonomy level, Krona analysis, relative abundance overview, and abundance clustering heat map are performed, combined with PCA (R ade4 package), PCoA (R ade4 package), and NMDS (R vegan package) analysis of dimension reduction [29]. Anosim analysis (R vegan package) is used to test the differences between groups. MetaGenomeSeq and LEfSe analysis are used to search for species differences between groups. MetaGenomeSeq analysis is used to perform permutation tests between groups on each taxonomy level and get a p-value. LEfSe software is used for LEfSe analysis (LDA Score is 4 by default) [30]. Finally, Random Forest analysis (R pROC and randomForest packages) is applied to select the species at species level by gradient and build a RandomForest model. Important species are screened out by MeanDecreaseAccuracy and MeanDecreaseGin, and then cross-validation (default 10-fold) is performed for each model and ROC curves are drawn.
DIAMOND software (https://github.com/bbuchfink/diamond/, 1 April 2026) is used to align unigenes with those in the functional database, with parameter settings: blastp, -e 1 × 10⁻⁵ [16,31]. Functional databases include KEGG database (http://www.kegg.jp/kegg/, 1 April 2026) [32,33], eggNOG database (http://eggnogdb.embl.de/#/app/home, 1 April 2026) [34], CAZy database (http://www.cazy.org/) [35], VFDB database (http://www.mgc.ac.cn/VFs/main.htm, 1 April 2026) and PHI database (http://www.phi-base.org/index.jsp, 1 April 2026). From the alignment results of each sequence, the best blast hit results are selected for subsequent analysis [16,36,37,38]. According to the alignment results, the relative abundance at different functional levels is calculated (the relative abundance at each functional level is equal to the sum of the relative abundance of genes annotated as that functional level) [13,16].
Unigenes are aligned to the CARD database (https://card.mcmaster.ca/) [39] using the Resistance Gene Identifier (RGI) software [40] provided by the CARD database (RGI built-in blastp, default evalue < 1 × 10⁻³⁰) [41]. According to the RGI alignment result and unigenes abundance information, the relative abundance of each ARO is calculated. Based on the abundance of ARO, the abundance histogram, abundance clustering heat map, abundance distribution circle map, ARO difference analysis between groups, resistance genes (unigenes annotated as ARO) and species attribution analysis of resistance mechanism are carried out (some AROs with long names are abbreviated as the first three words plus underlines). Mobile genetic elements (MGEs), unigenes were compared with the insertion sequence (isfinder), integrall and plasmid databases, respectively, to obtain abundance information. The annotated abundance information was further visualized, and the results of abundance histogram and relative abundance heat map were displayed.
This experiment involved three forms of nitrogen addition: urea (CO(NH2)2), NH4Cl, and NaNO3. There were seven treatments in the experiment: high CO(NH2)2, low CO(NH2)2, high NH4Cl, low NH4Cl, high NaNO3, low NaNO3, and a control group, designated GN, DN, GL, DL, GX, and DX, respectively.
2.6. Statistical Analyses
This study utilized SPSS 26.0 for data analysis and Origin 2021 software for plotting. Descriptive statistical analysis was conducted to obtain mean values and standard deviations (SDs) and significant differences, and to separately analyze the effects of different nitrogen forms and addition levels on soil physicochemical properties, soil enzyme activities, and soil microbial community structure, in order to determine whether there were significant differences between the treatment groups. Pearson correlation analysis was employed to identify the synergistic relationship between soil microbial community structure and soil physicochemical properties.
One-way analysis of variance (ANOVA) was performed for all determined soil physicochemical properties, soil enzyme activities, microbial alpha diversity indices, and 15N isotopic characteristics across different nitrogen forms and application rate treatments, followed by post hoc multiple comparison tests using Tukey’s HSD method at p < 0.05 to identify significant differences between individual treatment means; these rigorous statistical comparisons effectively quantified the discrete effects of nitrogen source type and application dosage while ensuring statistical reliability for inter-group variation interpretation throughout the dataset.
3. Results
3.1. Analysis of Plant Nitrogen Uptake Pathways and Contributions
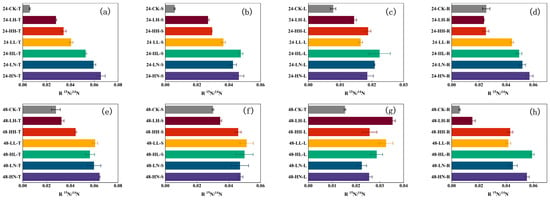
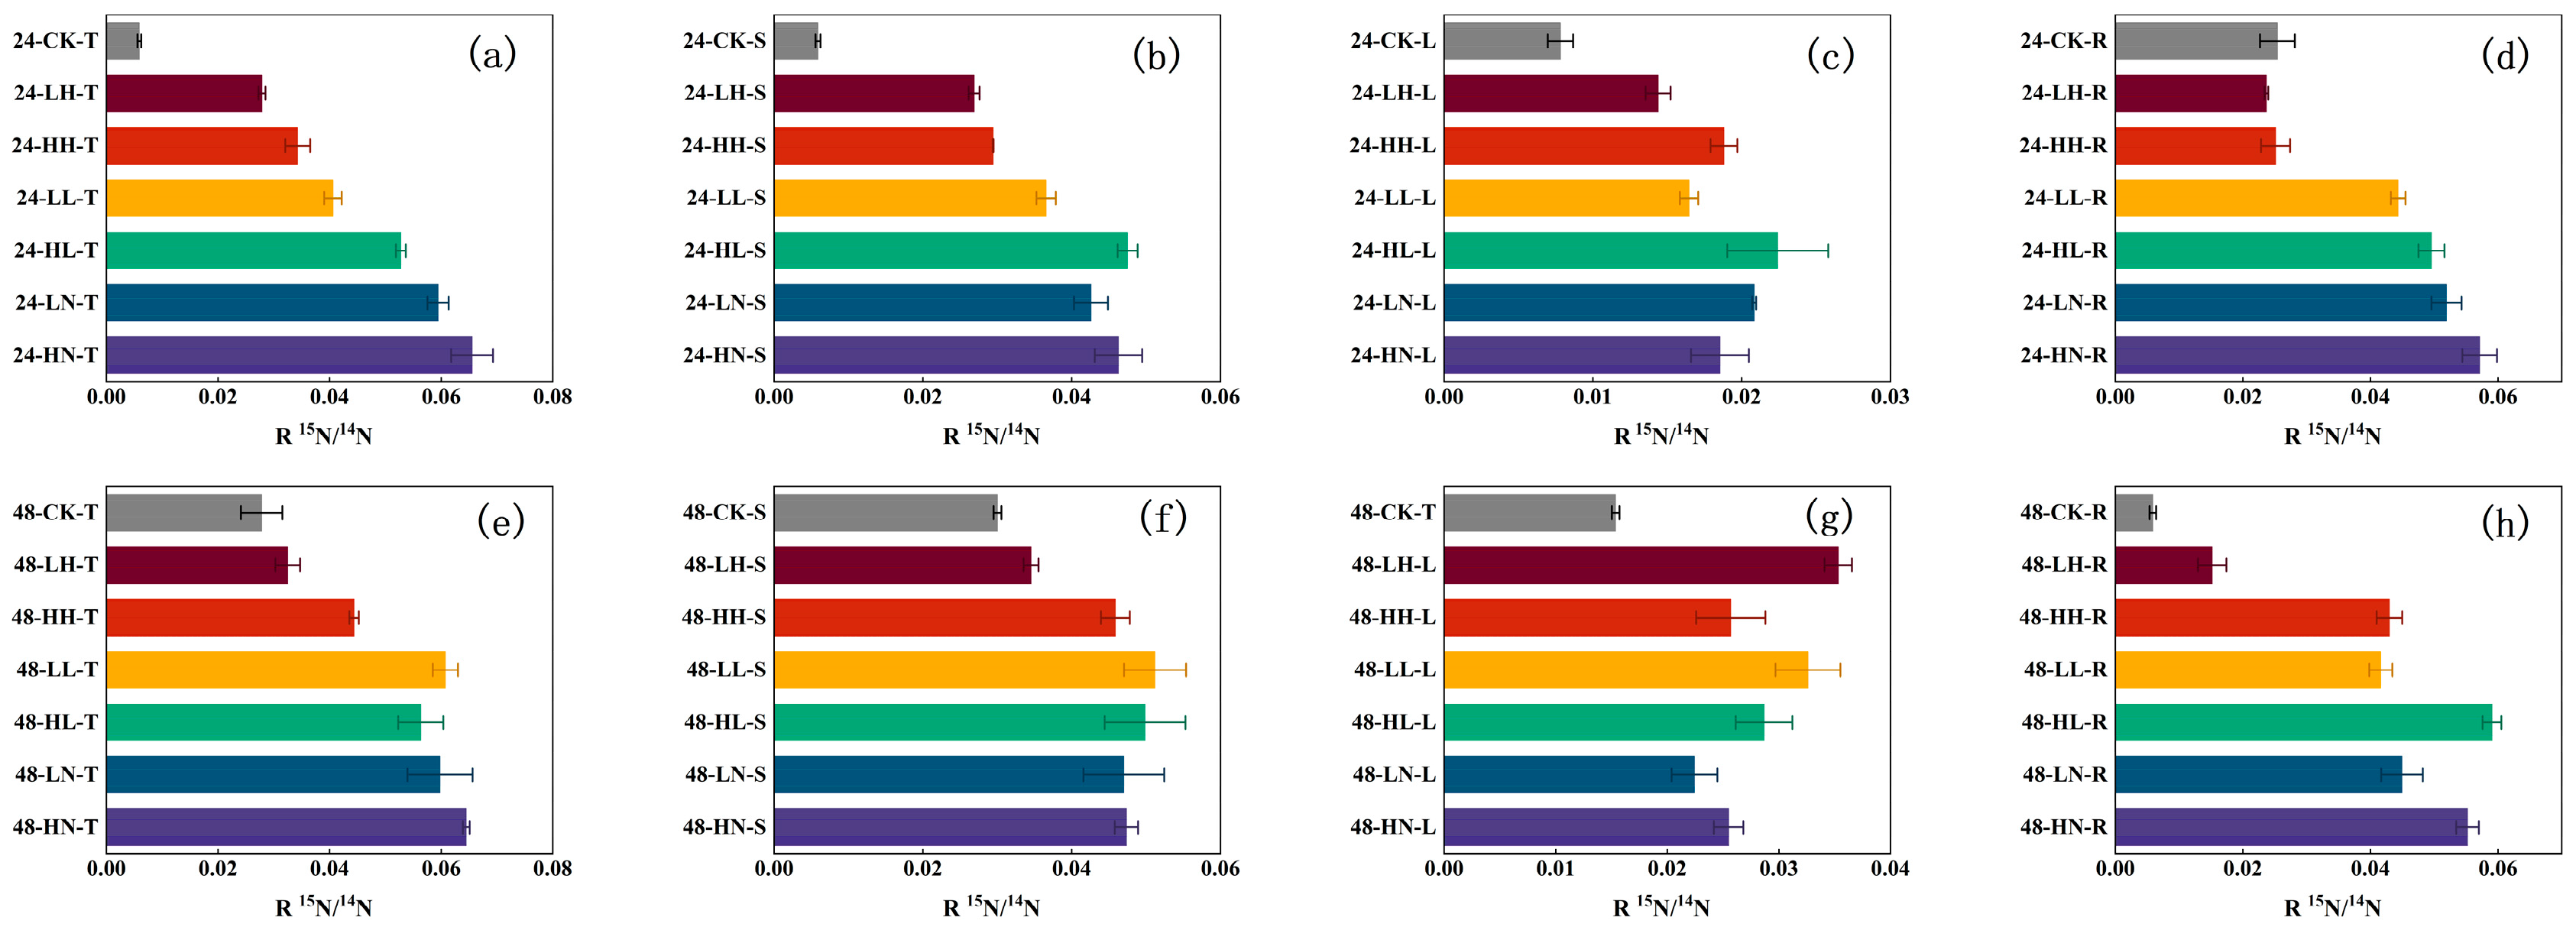
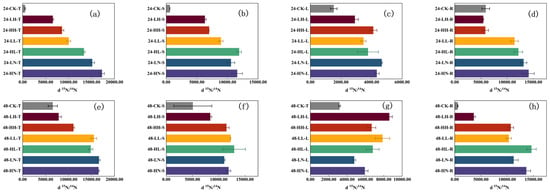
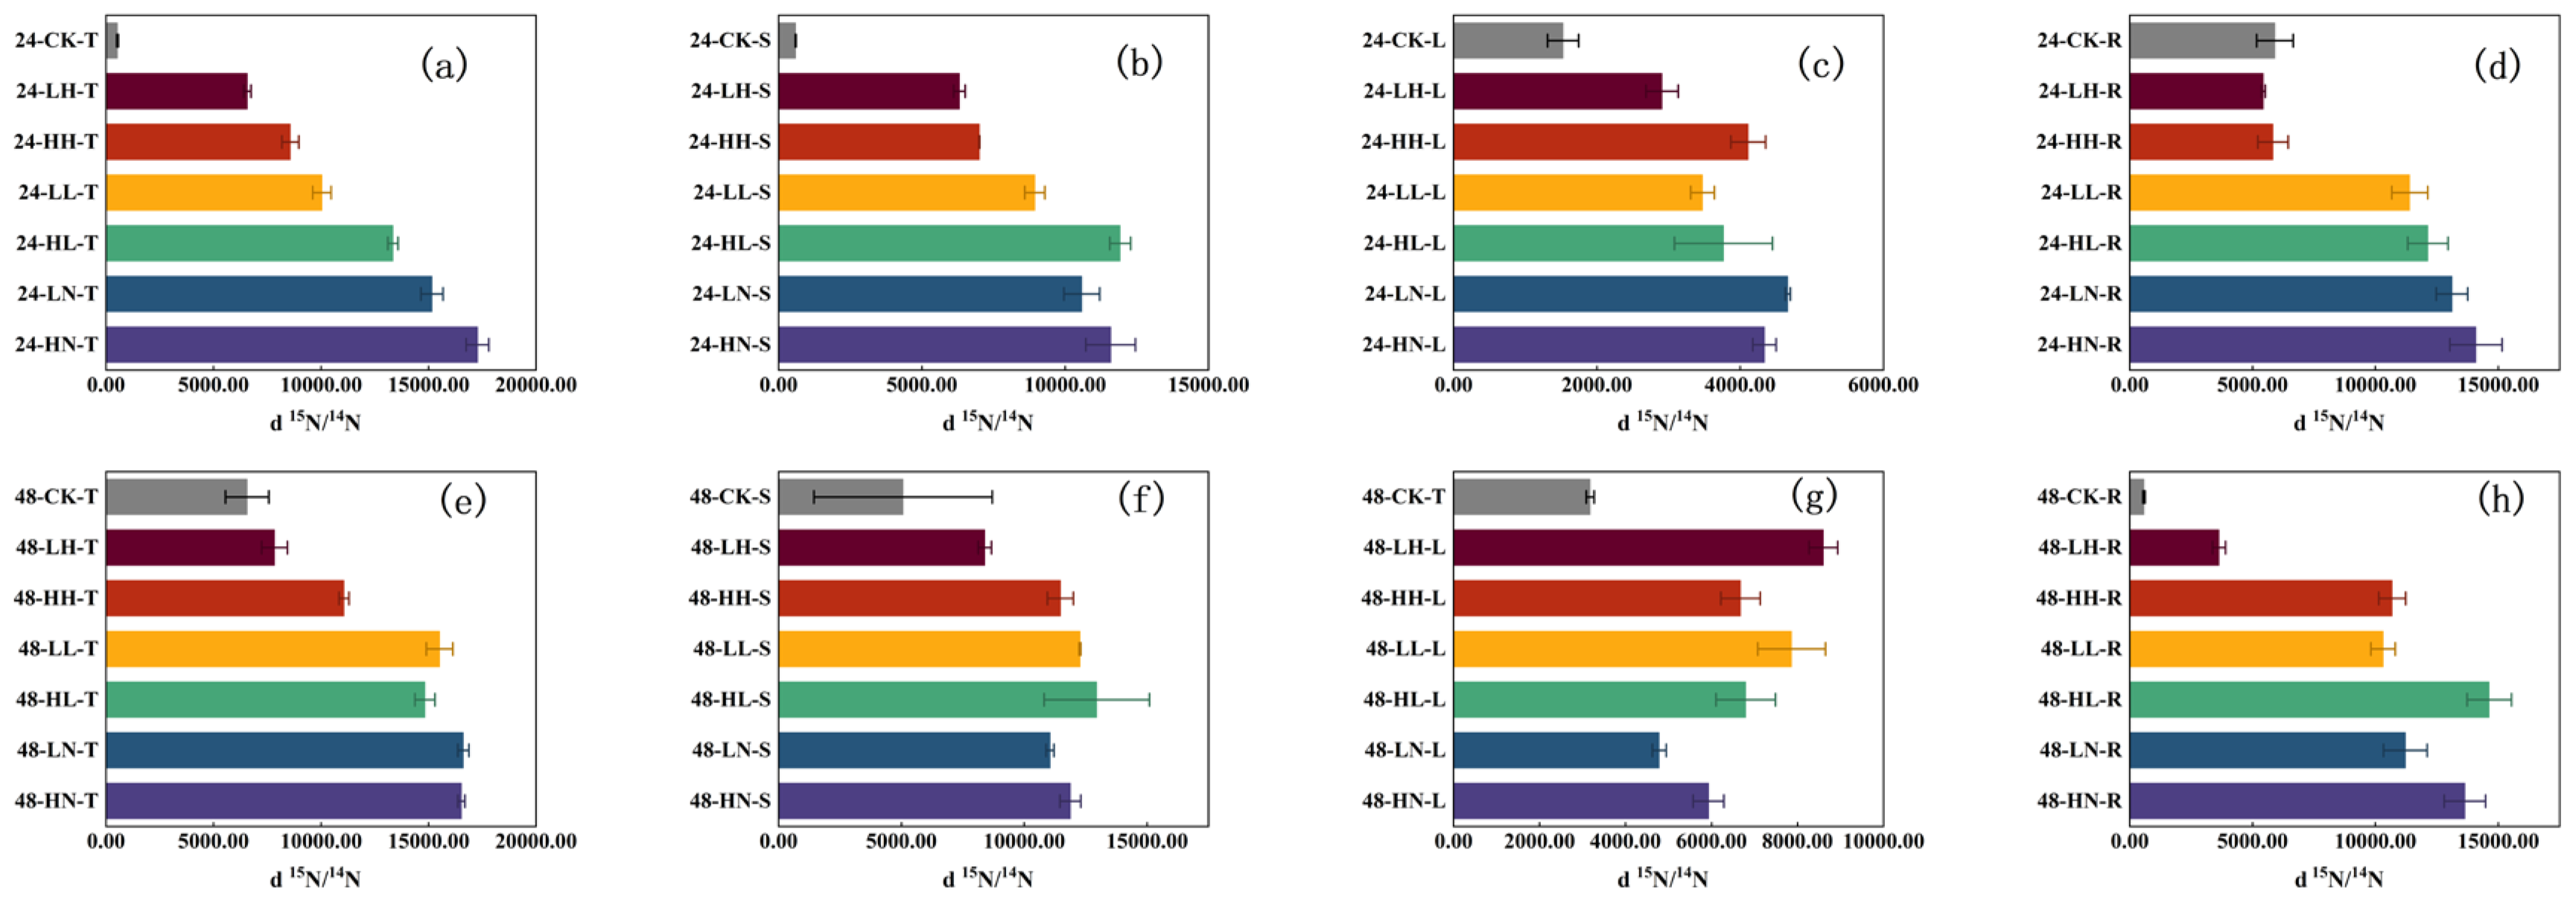
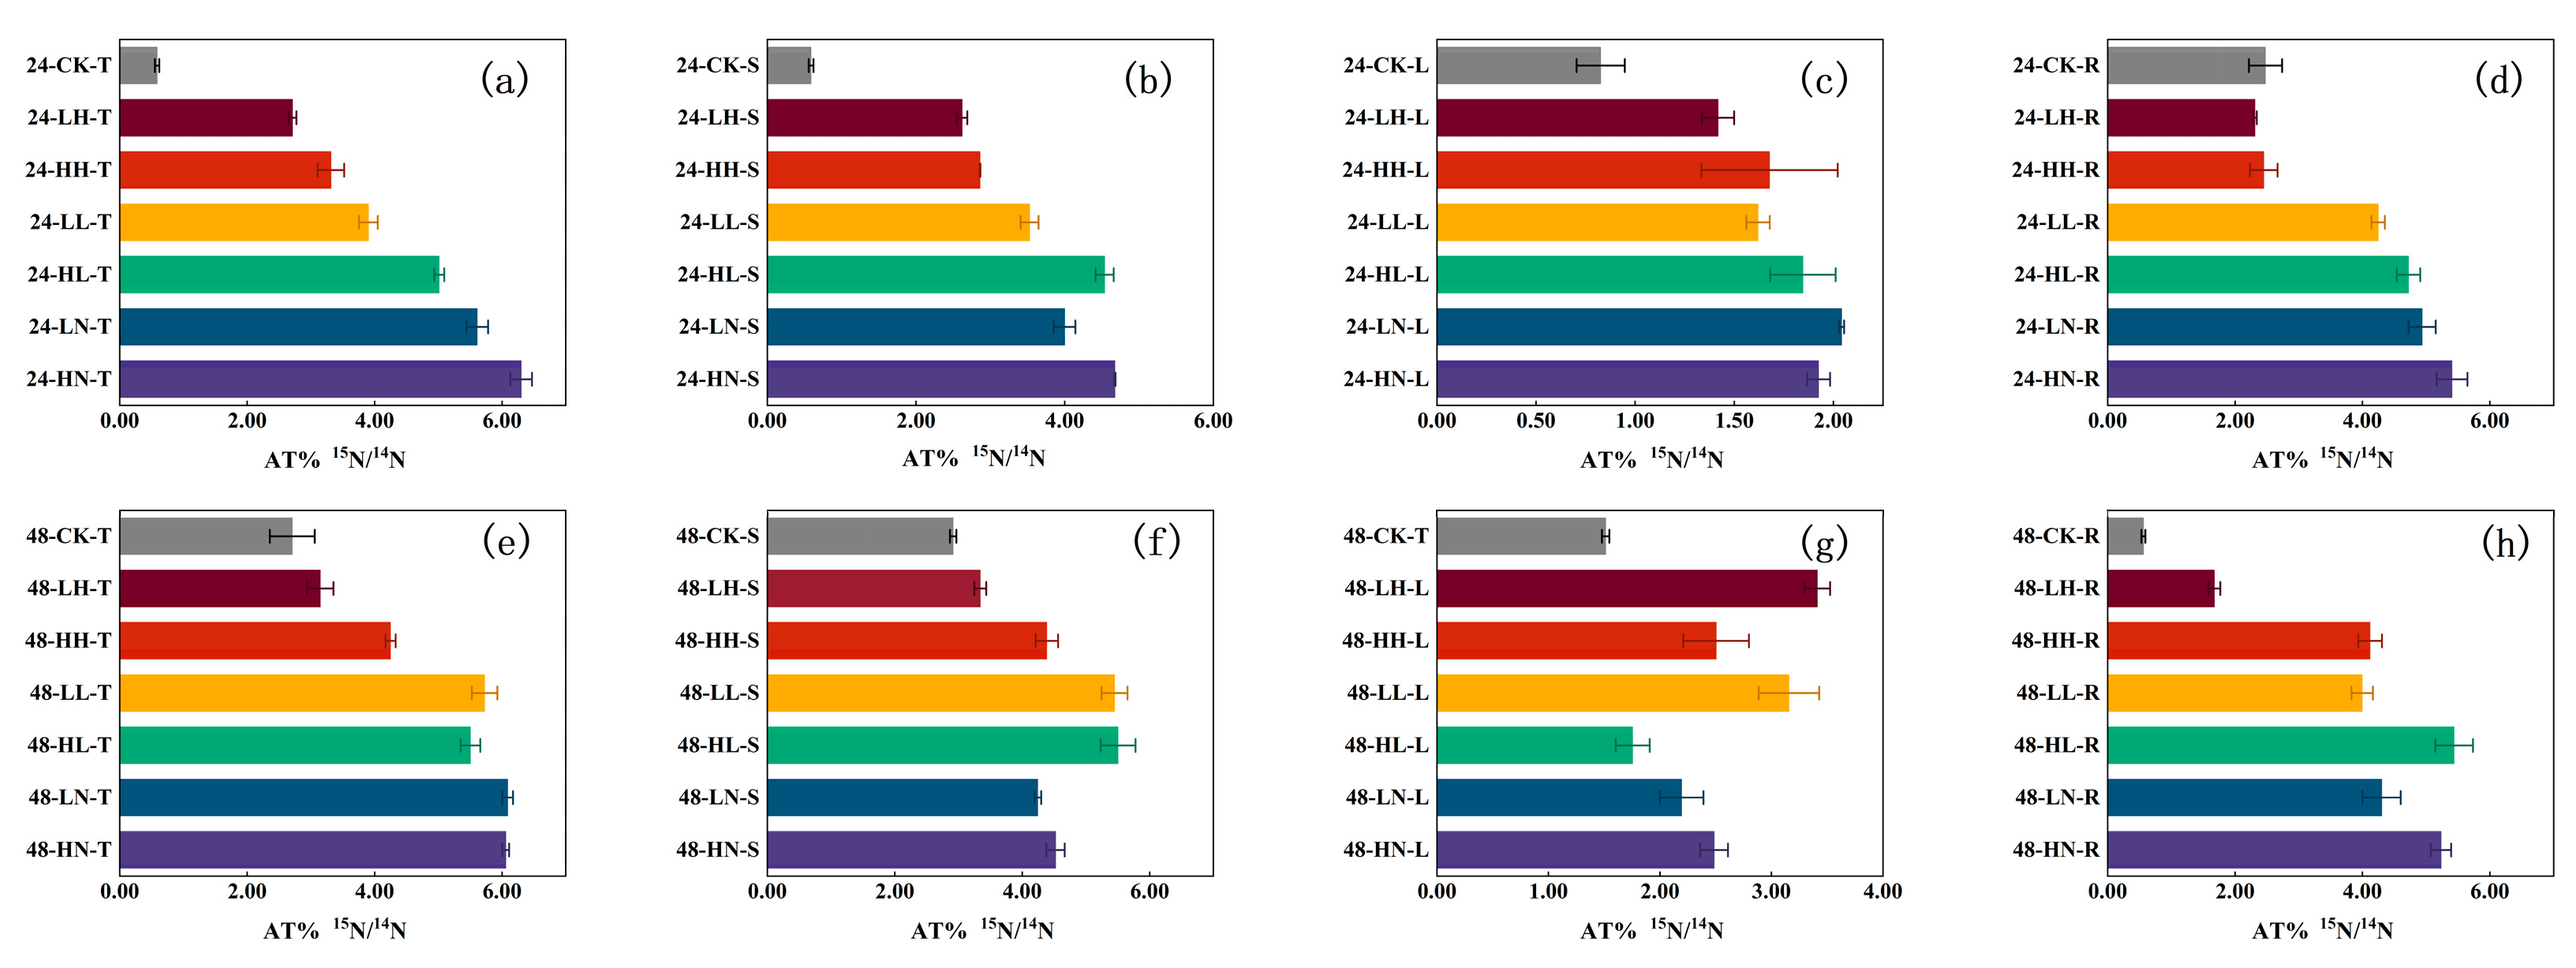
Figure 1, Figure 2 and Figure 3 illustrate the impact of various nitrogen sources and addition levels on the abundance and distribution of 15N in different parts of Larix olgensis A. Henry seedlings. Overall, nitrogen addition significantly elevated the abundance (R), δ15N values (d), and atomic percentage (AT%) of 15N in all seedling organs, notably increasing 15N levels in leaves, roots, trunks, and lateral branches. This phenomenon varied with time and plant tissue type. Under a 24 h turnover time (Figure 1a–d, Figure 2a–d and Figure 3a–d), treatments with GN, DN, and GL all significantly boosted the abundance of 15N in lateral roots, trunks, and lateral branches. Notably, the root treatment with ammoniacal nitrogen exhibited the most pronounced effect, indicating that seedlings can rapidly absorb NH4+-N and preferentially retain it in underground tissues. Conversely, treatments with GL and DN facilitated nitrogen transport to leaves, highlighting distinct differences in short-term distribution among various nitrogen sources. This further verifies the significant regulatory role of nitrogen source type and concentration on seedling nitrogen absorption pathways and distribution patterns.
Figure 1.
Effect of different treatments on the abundance of 15N. (a–d) δ15N values in different organs of Larix olgensis A. Henry seedlings at 24 h after 15N injection: (a) main stem (T), (b) lateral stems (S), (c) leaves (L), (d) roots (R); (e–h) δ15N values in different organs of Larix olgensis A. Henry seedlings at 48 h after 15N injection: (e) main stem (T), (f) lateral stems (S), (g) leaves (L), (h) roots (R). The abscissa represents different nitrogen addition treatments (CK, DX, GX, DL, GL, DN, GN); the ordinate represents the δ15N (‰) value of the plant organs.
Figure 2.
Effect of different treatments on δ 15N values. (a–d) δ15N values in different organs of Larix olgensis A. Henry seedlings at 24 h after 15N injection: (a) main stem (T), (b) lateral stems (S), (c) leaves (L), (d) roots (R); (e–h) δ15N values in different organs of Larix olgensis A. Henry seedlings at 48 h after 15N injection: (e) main stem (T), (f) lateral stems (S), (g) leaves (L), (h) roots (R). The abscissa represents different nitrogen addition treatments (CK, DX, GX, DL, GL, DN, GN); the ordinate represents the δ15N (‰) value of the plant organs.
Figure 3.
Effect of different treatments on atomic percentage. (a–d) 15N AT% in different organs of Larix olgensis A. Henry seedlings at 24 h after 15N injection: (a) main stem (T), (b) lateral stems (S), (c) leaves (L), (d) roots (R); (e–h) 15N AT% in different organs of Larix olgensis A. Henry seedlings at 48 h after 15N injection: (e) main stem (T), (f) lateral stems (S), (g) leaves (L), (h) roots (R). The abscissa represents different nitrogen addition treatments (CK, DX, GX, DL, GL, DN, GN); the ordinate represents the 15N atomic percentage (AT%) of the plant organs.
Under a 48 h turnover time (Figure 1e–h, Figure 2e–h and Figure 3e–h), the 15N abundance and ammonium nitrogen (AT%) values of most organs under different treatments were significantly higher than those at 24 h, indicating that newly absorbed nitrogen continued to be distributed within the seedling body. Notably, under DL treatment, the R and δ values of leaves and main stems significantly increased, suggesting that low-concentration nitrate nitrogen tends to accumulate in aboveground organs after absorption; it significantly enhanced nitrogen accumulation in leaves and stems, while GN treatment maintained the highest 15N level in roots, indicating that high ammonium nitrogen supply tends to promote root retention and restrict its upward transport. The results showed that plants preferentially absorb ammoniacal nitrogen in the short term, and after a long turnover time, nitrate nitrogen and urea are more conducive to nitrogen transport to the aboveground parts. Under GN treatment, the 15N content in roots remained at the highest level, indicating that high-concentration ammonium nitrogen may undergo intense assimilation in roots, leading to limited transport to the aboveground parts. The effective assimilation of ammonium nitrogen mainly occurs in plant roots, which may restrict nitrogen transport to the aboveground parts [42]. In roots, ammonium nitrogen is rapidly assimilated into glutamine and glutamate through the glutamine synthase (GS) and glutamate synthase (GOGAT) pathways. The accumulation of these amino acids in roots may limit nitrogen transport to the aboveground parts of the plant [43,44].
The changes in 15N abundance across different organs indicate that the root system is the primary site for nitrogen accumulation within 24 h, with ammonium nitrogen treatment showing particularly prominent effects. As time progresses, the proportion of 15N in the aboveground parts (leaves and main stem) increases, with this effect being particularly pronounced in nitrate nitrogen and urea treatments. This result is closely related to the mobility and transformation characteristics of nitrogen forms in soil: nitrate nitrogen (NO3−-N) is easily transported upward rapidly via transpiration flow (TF), while ammonium nitrogen (NH4+-N) is more readily fixed and assimilated in the roots. The assimilation of ammonium nitrogen in the roots primarily occurs through the action of glutamine synthase (GS) and glutamic acid synthase (GOGAT), which convert NH4+-N into organic nitrogen compounds [45]. This assimilation process not only helps to reduce the toxicity of NH4+-N, but also improves plant survival under low oxygen (LO) or flooded water (FW) conditions [46].
In terms of nitrogen uptake efficiency and preference, young yellow larch seedlings exhibit higher uptake intensity for NH4+-N in the short term (24 h), particularly with significant accumulation in the root system; however, over a longer time scale (48 h), NO3−-N and urea are more conducive to nitrogen transport and distribution to the aboveground parts. This suggests that under high nitrogen deposition conditions (HND), appropriately regulating the ratio of NH4+-N to NO3−-N can promote nutrient absorption while optimizing the internal nitrogen distribution pattern of plants, providing guidance for fertilization management.
3.2. The Impact of Nitrogen Addition on Soil Physicochemical Properties
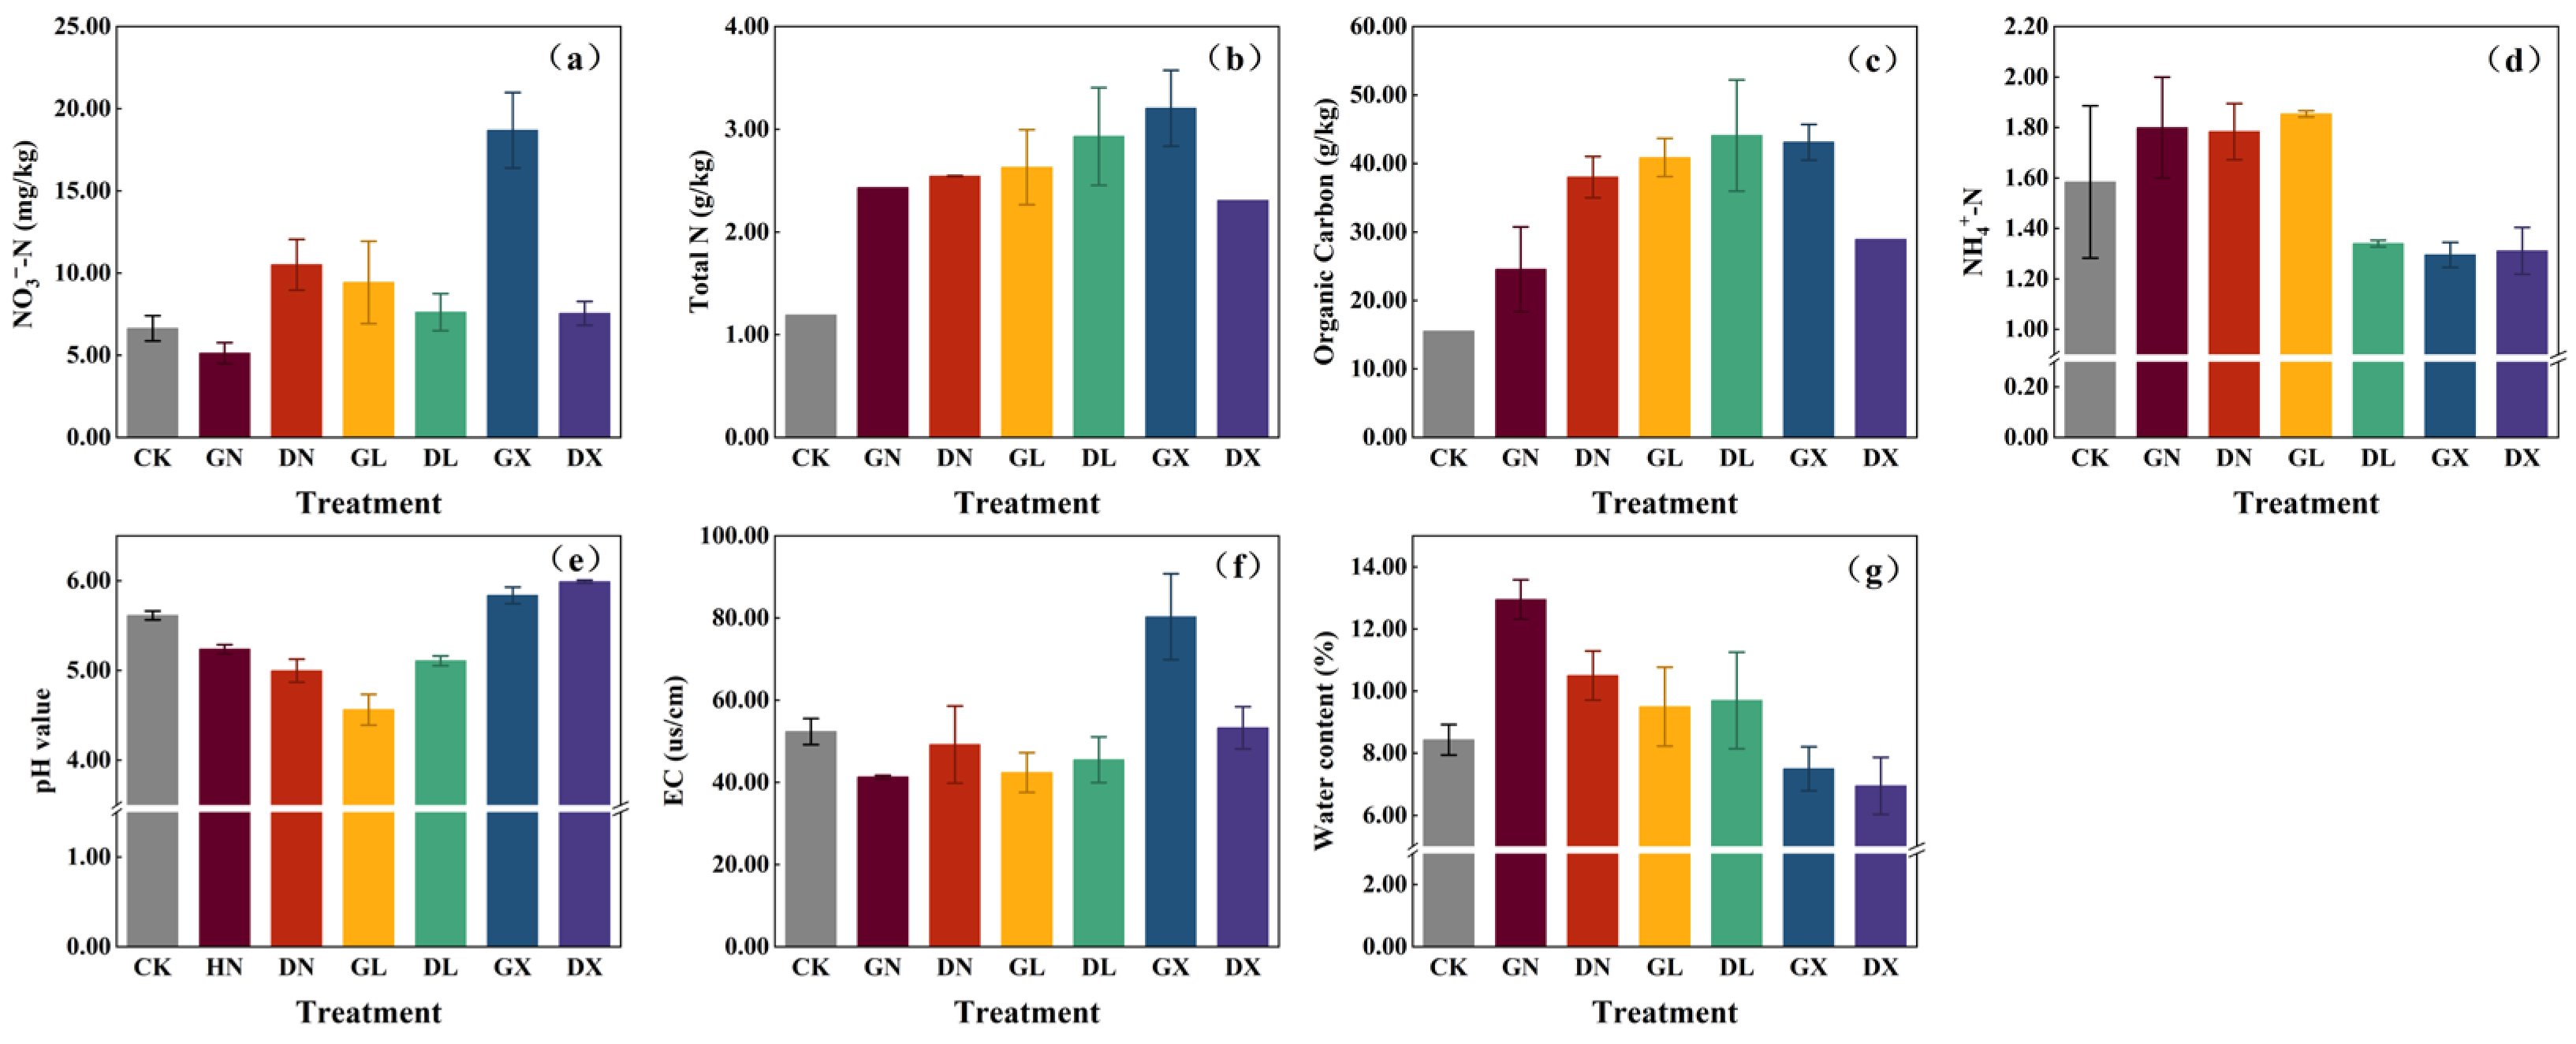
Nitrogen addition significantly affects soil carbon and nitrogen components, pH, conductivity, and moisture content, effectively improving soil nutrient status. The contents of soil organic carbon (SOC), total nitrogen (TN), NH4+-N, and NO3−-N generally increase with nitrogen addition, indicating that the application of exogenous nitrogen can effectively improve soil nutrient status (Figure 4). Among them, low-dose urea (DL) has the best effect on enhancing SOC, followed by high-dose sodium nitrate (GX) and low-dose urea (GL), both of which significantly increase compared to the control group (CK). The trend of TN change is similar to that of SOC, with GL showing the largest increase, a 181.70% increase compared to CK. High-dose urea (HL) has the most significant effect on enhancing NH4+-N, increasing it by 17.06% compared to CK. GX treatment has the most prominent increase in NO3−-N.
Figure 4.
Soil physicochemical property analysis chart. The chart displays the changes in key soil physicochemical properties under different nitrogen addition treatments (CK, GN, DN, GL, DL, GX, DX), including (a) nitrate nitrogen (NO3−-N, mg/kg), (b) total nitrogen (TN, g/kg), (c) soil organic carbon (SOC, g/kg), (d) ammonium nitrogen (NH4+-N, mg/kg), (e) soil pH value, (f) electrical conductivity (EC, µs/cm), and (g) soil water content (SWC, %). Each index is presented as an independent subplot with the abscissa for treatment groups and the ordinate for the corresponding property content/value; error bars represent the standard deviation of three biological replicates.
Low-concentration urea is more conducive to the accumulation of NH4+-N, while high-concentration sodium nitrate is more conducive to the enhancement of NO3−-N and TN. Studies have confirmed that the availability of nitrogen in soil controls the absorption of different nitrogen forms by plants, with most plants preferring to absorb NO3−-N rather than NH4+-N [47]. This may be closely related to nitrogen transformation, microbial utilization preference, and soil nitrogen cycling (SNC) [48]. In terms of soil pH and electrical conductivity (EC), low-dose sodium nitrate (DX) can significantly increase pH to alleviate acidification and maintain low EC; GX treatment can increase pH to alleviate acidic soil conditions, but it also leads to an increase in EC levels. Previous studies have found that the use of ionic liquids such as 1-alkyl-3-methylimidazolium nitrate ([Cnmim]NO3) also produces similar results, with soil conductivity significantly increasing with the increase in application rate, thereby increasing the risk of salt stress, which is consistent with the results of this study [49]. In terms of soil moisture content (SMC), high-dose ammonium chloride (GN) has the most significant effect on enhancing water retention, increasing it by 53.56% compared to CK. The SMC of GX and DX treatments is lower than that of CK, possibly due to the increased osmotic pressure and salt stress caused by the application of high-concentration NaNO3. Studies have shown that mixed forest belts can significantly enhance soil water retention and nutrient retention capabilities, with the increase in NH4+-N content being a key factor [10]. This is consistent with the results of this study.
3.3. Soil Enzyme Activity
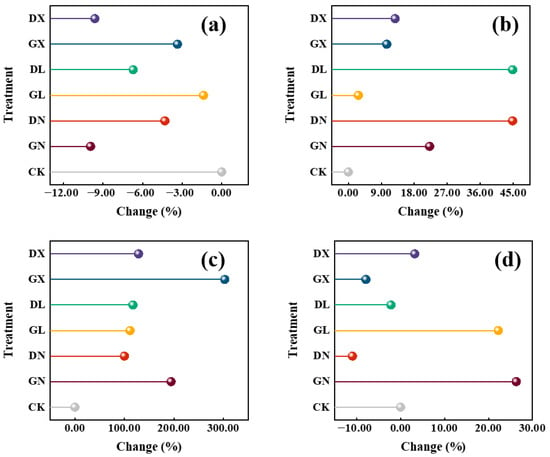
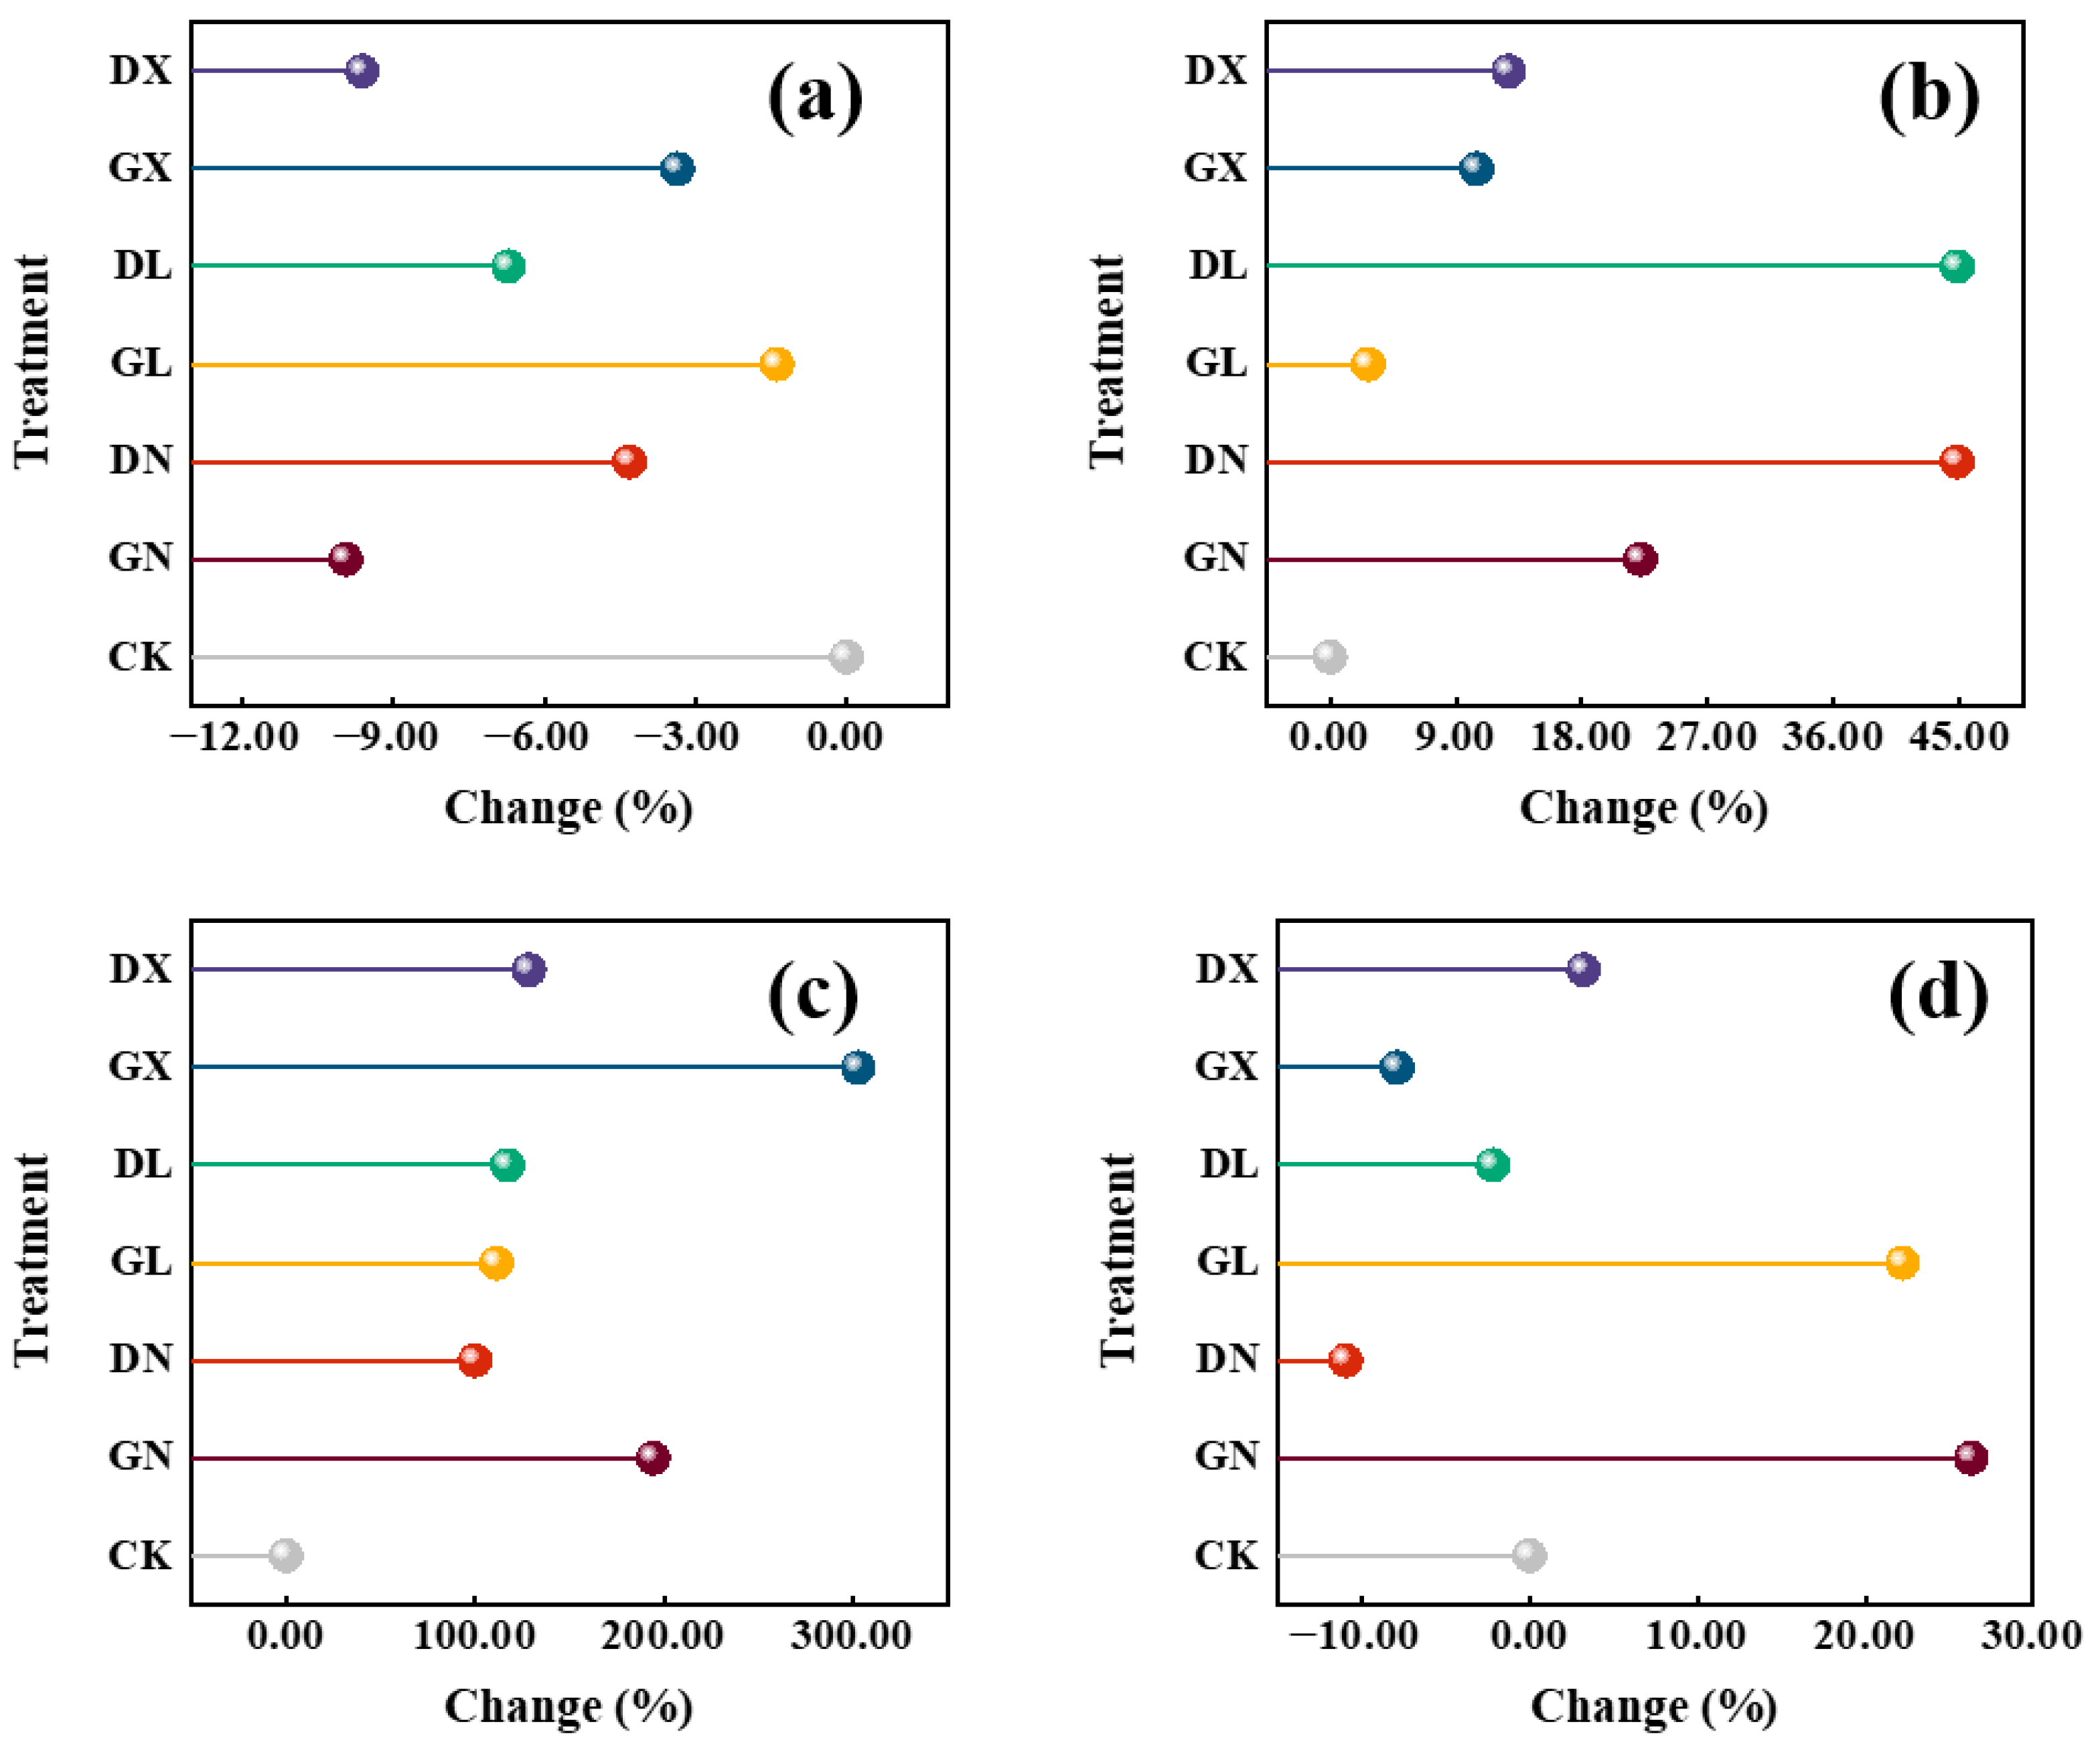
The effects of different nitrogen treatments on soil enzyme activity are shown in Figure 5. The soil enzymes involved in this study include nitrite reductase (Figure 5a), urease (Figure 5b), nitrate reductase (Figure 5c), and acid protease (Figure 5d). The results indicate that all treatments led to a decrease in soil nitrite reductase activity, with the GN treatment showing the greatest reduction, decreasing by 9.94% compared to the CK treatment. This result suggests that high levels of NH4+-N input may inhibit the enzymatic activity of the nitrite reduction step in the denitrification process (DP). Previous studies have used dimethyl sulfoxide (DMSO) as a selective inhibitor and found that it significantly reduces the gene expression and enzyme activity of NIR, which may be an important cause of the reduced nitrite reductase activity [6]. The urease activity in all treatments was higher than that in the CK treatment, with the smallest increase observed in the HL treatment (2.74%), and the highest increases in the DN and DL treatments, both at 44.83% [50,51,52]. This may be related to the promotion of urease synthesis and nitrogen mineralization rates by low-level nitrogen addition. The nitrate reductase activity in all treatments showed a significant increase, exceeding 100%. Among these, the GX treatment showed the most significant increase, approximately three times higher than the CK treatment. This indicates that high levels of nitrate nitrogen input significantly enhance soil nitrate reduction processes. Denitrification and dissimilatory nitrate reduction to ammonium (DNRA) are the primary nitrate reduction pathways, and the DNRA process dominates in these environments, significantly influencing nitrogen utilization efficiency and crop yields [53]. In addition, nitrate reductase activity may be affected by changes in atmospheric CO2 concentration, and elevated CO2 may regulate nitrate reductase activity via the nitric oxide (NO) pathway [54]. The activity of acid protease was significantly enhanced in HN and HL treatments, increasing by 26.32% and 22.22% respectively compared to the control (CK), indicating that these treatments may have enhanced the hydrolysis of organic nitrogen and the release of amino acids. From a functional perspective, urease (UE; EC 3.5.1.5) is a nickel-containing oligomerase that specifically catalyzes the hydrolysis of urea to release NH3 and CO2. Its activity is positively correlated with soil organic matter, total nitrogen, and available nitrogen content, reflecting nitrogen supply conditions. Urease activity in soil is closely related to organic matter content, meaning that soil fertility and health can be assessed through urease activity [55]. Nitrite reductase is a key enzyme in denitrification, and changes in its activity can reflect nitrogen conversion efficiency. Nitrite reductase plays an important role in the nitrogen cycle by catalyzing the reduction in nitrite to nitric oxide (NO) during denitrification [56]. Acidic proteases are widely involved in the degradation of soil organic nitrogen, and their activity directly affects the rate of soil nitrogen mineralization. The addition of various forms of nitrogen increased soil mineral nitrogen content and enhanced the activity of nitrate reductase and urease. The comprehensive results showed that there were significant differences in the regulation of enzyme activity by different nitrogen sources and application levels, which were closely related to nitrogen form, soil microbial community structure, and nitrogen cycling processes.
Figure 5.
Effect of different nitrogen additions on soil enzyme activities. (a) Soil nitrite reductase (NiR) activity change rate (%), (b) soil urease (UE) activity change rate (%), (c) soil nitrate reductase (NR) activity change rate (%), (d) soil acid protease (AP) activity change rate (%). The abscissa represents different nitrogen addition treatments (CK, DX, GX, DL, GL, DN, GN); the ordinate represents the percentage of enzyme activity change relative to the control group (CK). Positive values indicate an increase in enzyme activity, and negative values indicate a decrease; error bars represent the standard deviation of three biological replicates.
3.4. Analysis of Soil Microbial Diversity
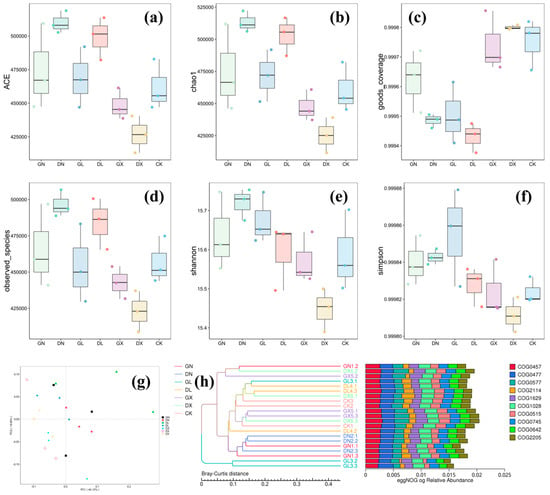
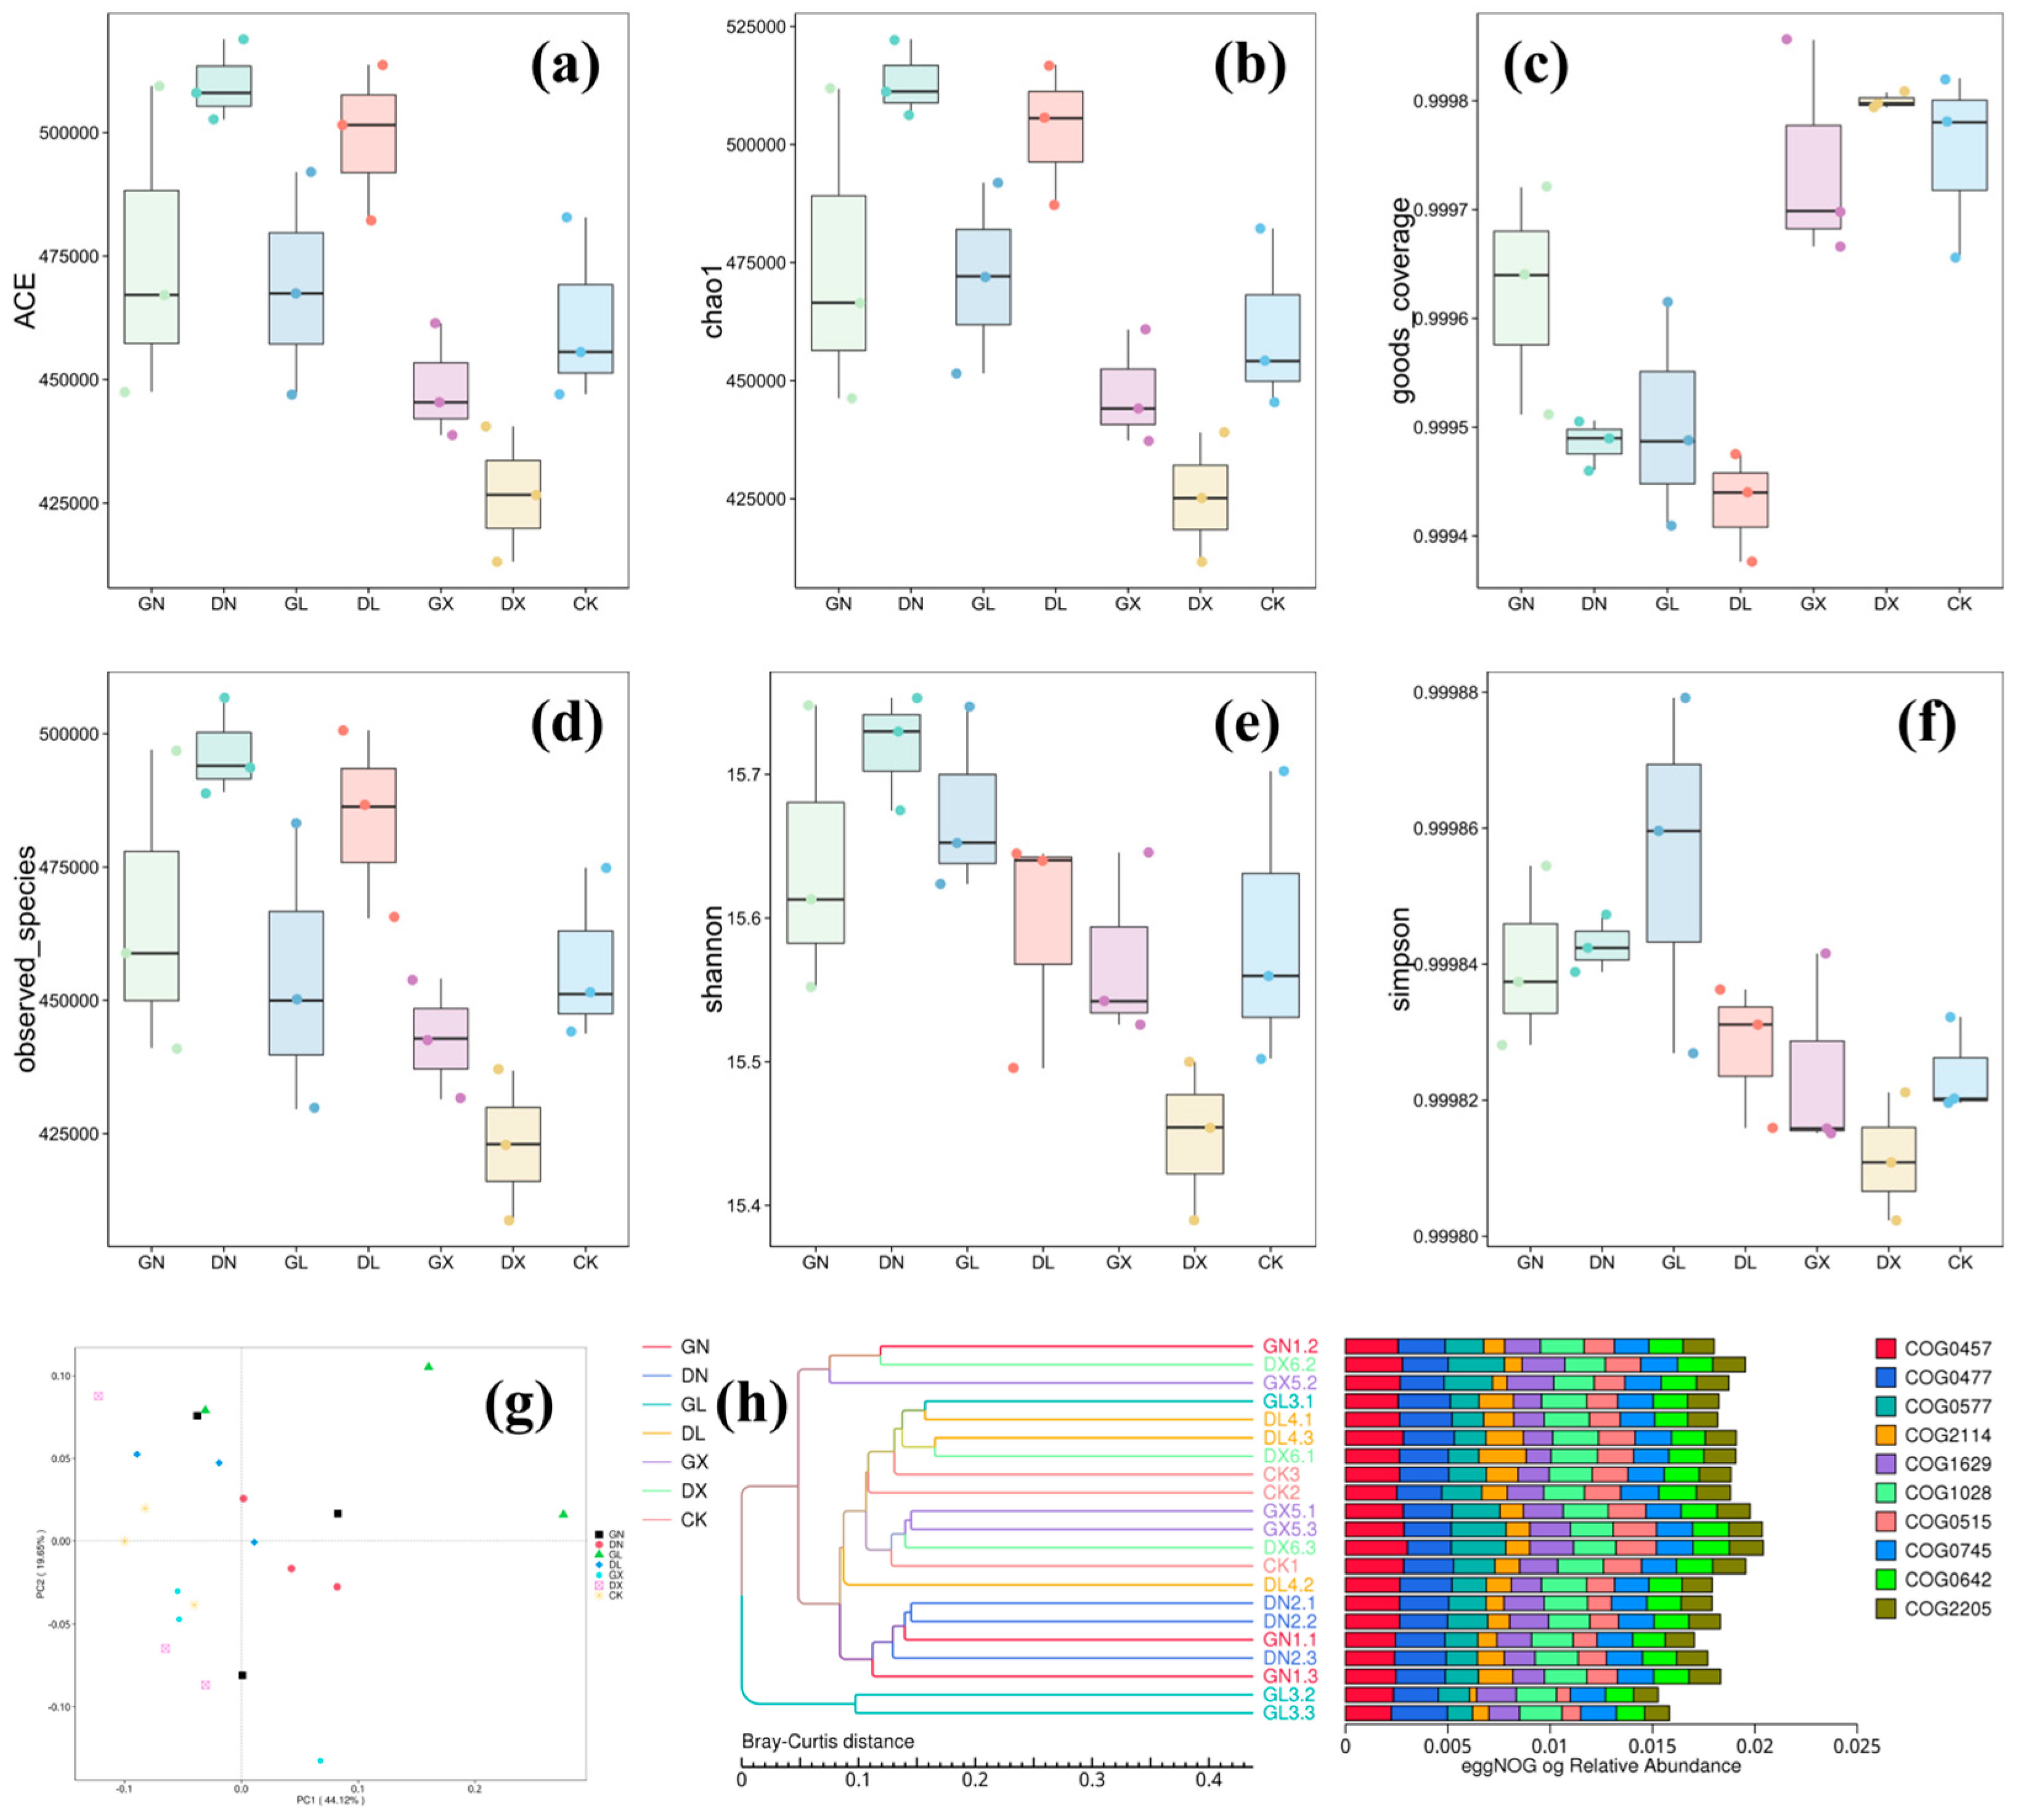
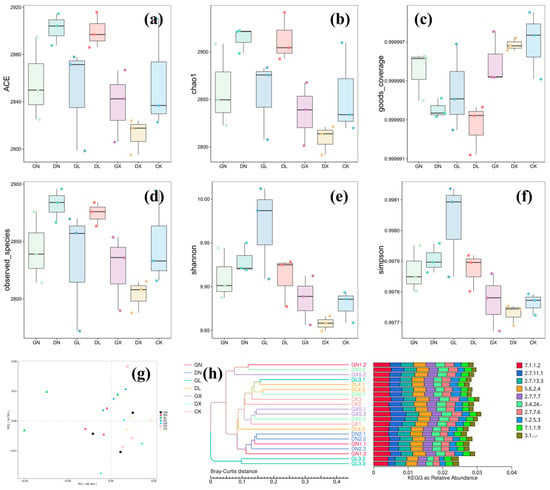
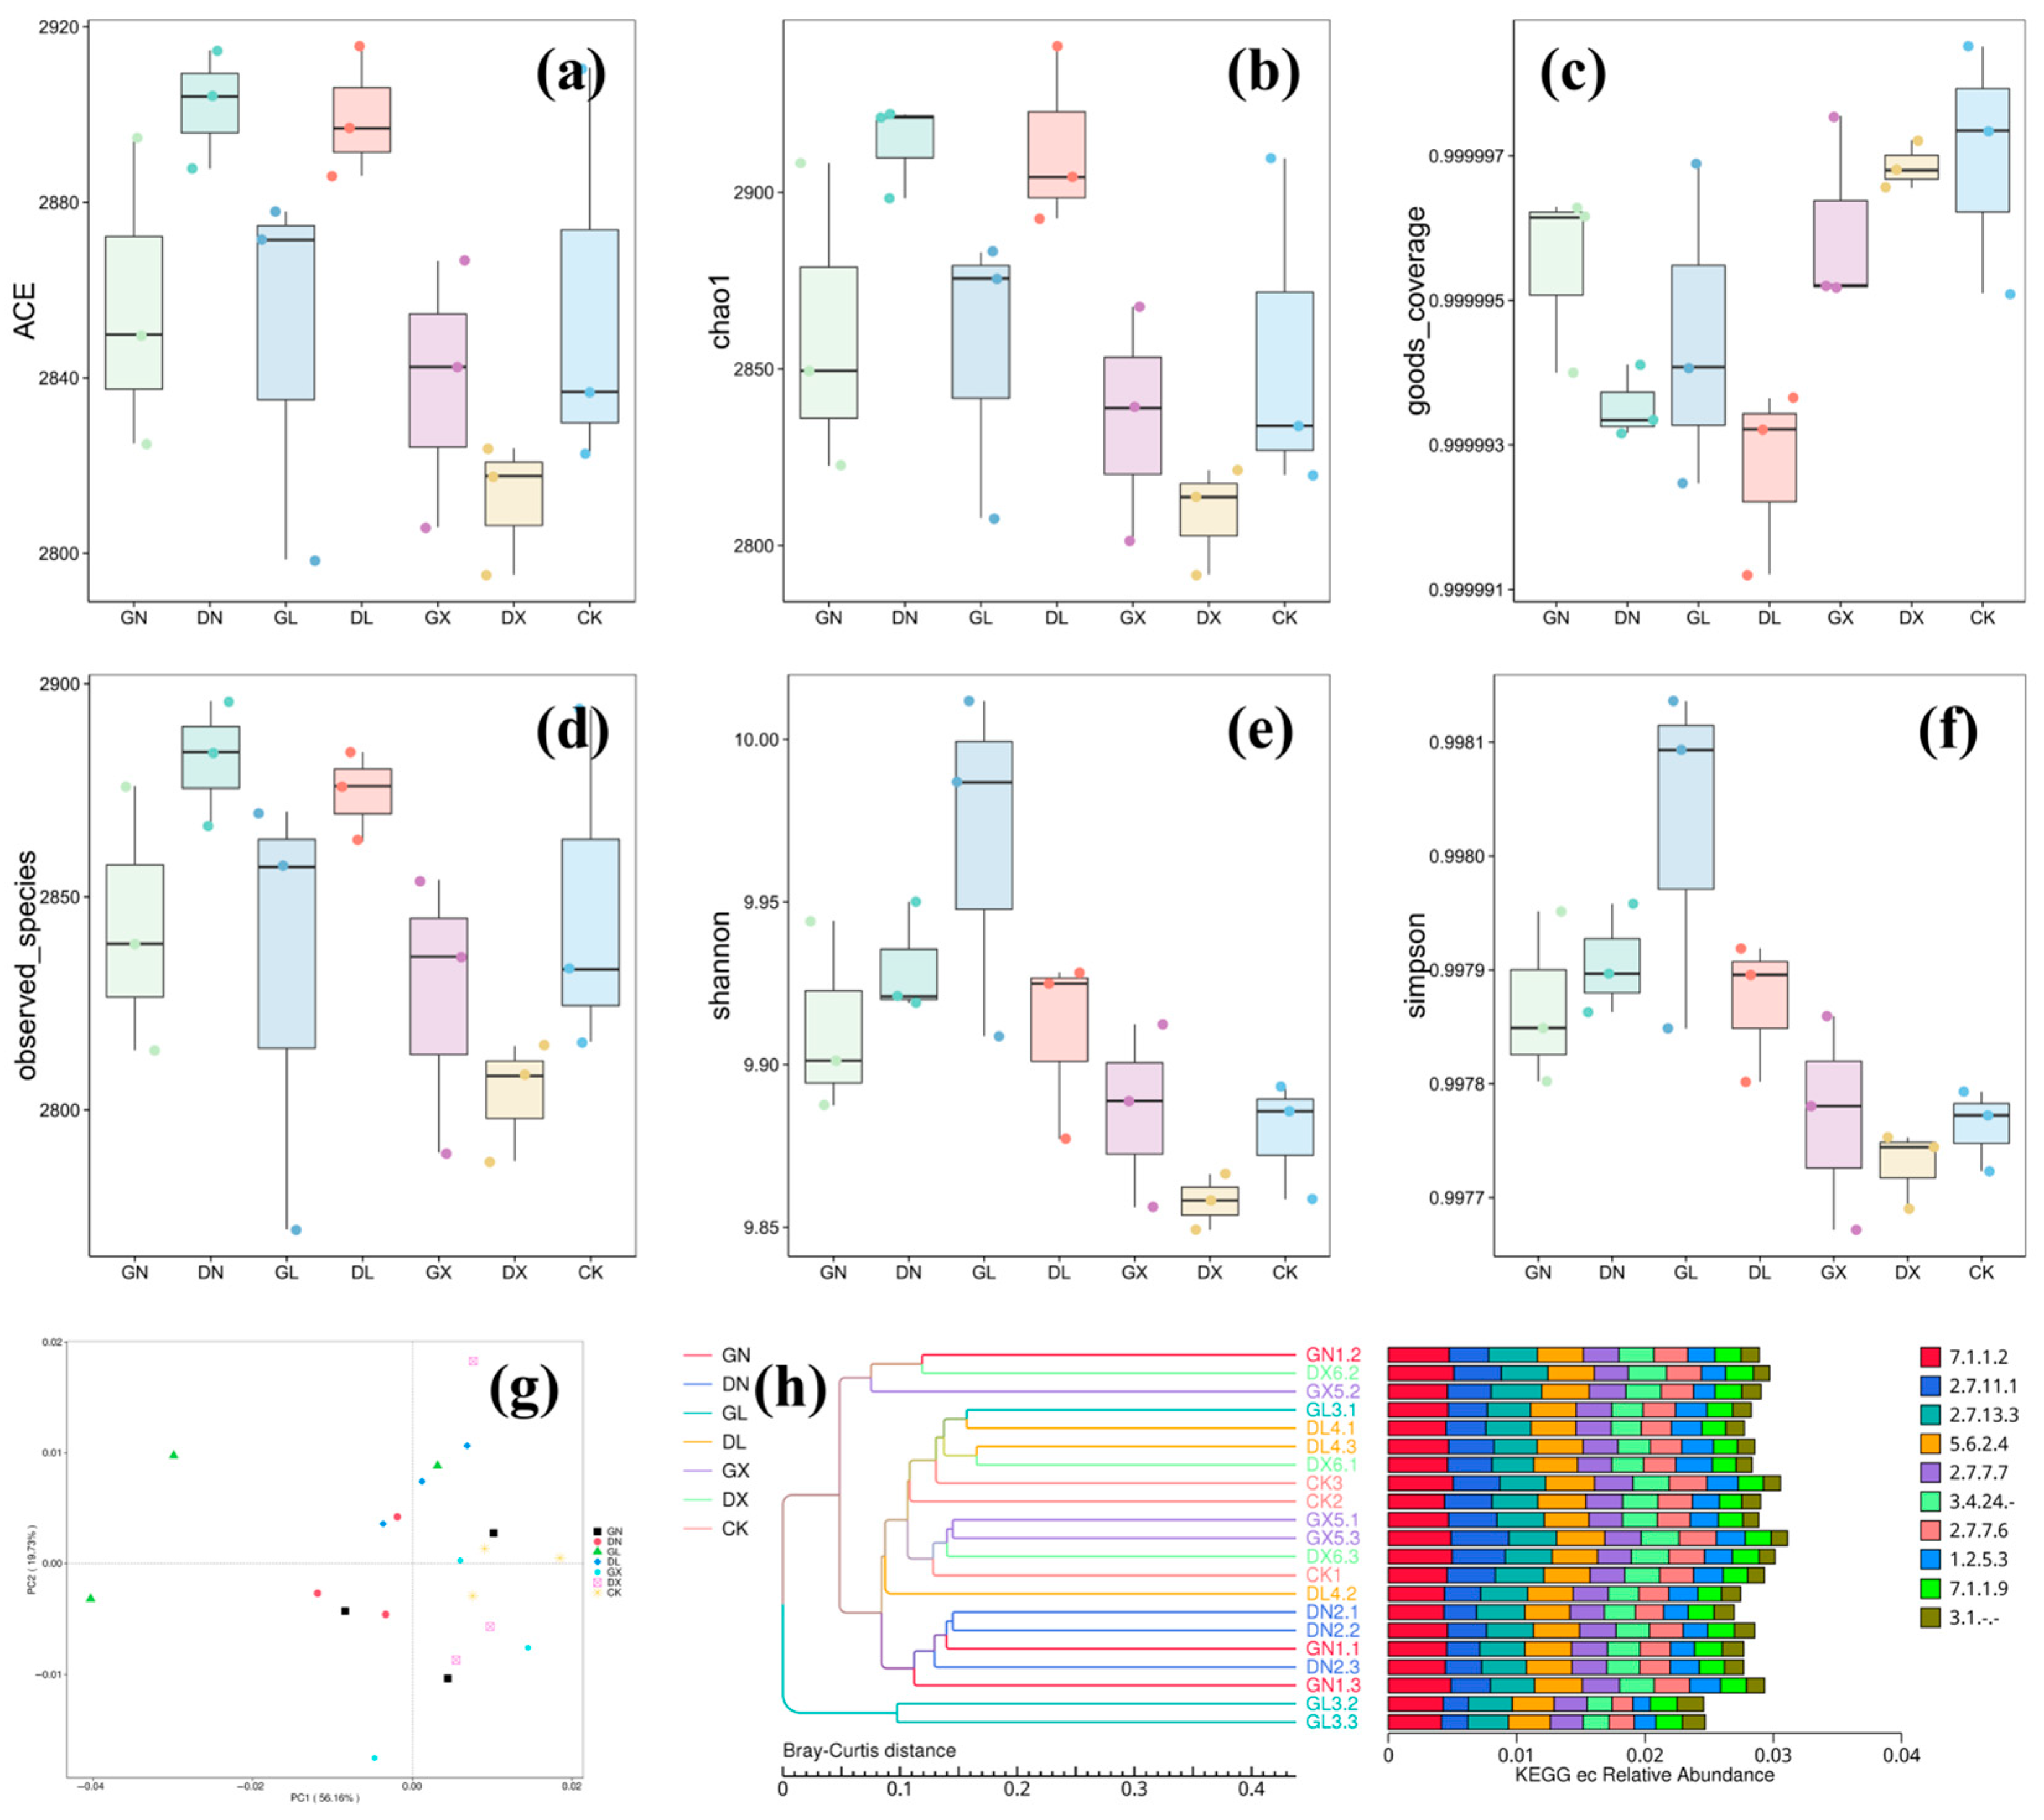
The effects of different nitrogen sources and addition levels on soil microbial communities are shown in Figure 6 and Figure 7. In the eggNOG functional annotation results (Figure 6a–f), the ACE, Chao1, and observed species indices for the DN and DL treatments were significantly higher than those for the CK treatment, indicating that the addition of small amounts of nitrogen helps to increase soil microbial species richness. Additionally, the Shannon and Simpson indices remained at high levels in the DN and GL treatments, indicating improvements in both community diversity and evenness. The diversity indices in the GX and DX treatments decreased significantly, suggesting that the addition of sodium nitrate may inhibit the growth of certain microbial groups, thereby reducing diversity. Previous studies have shown that in oil-containing bioreactors, sodium nitrate and sodium nitroprusside (SNP) act synergistically to effectively inhibit the activity of sulfate-reducing bacteria (SRB) [57]. β diversity analysis results are shown in Figure 4g, indicating significant differences in microbial community structure among different treatments. PCoA results show that the first principal component (PC1) and second principal component (PC2) cumulatively explain a large proportion of community variation. In the cluster analysis, treatments with the same nitrogen source type are relatively close in phylogenetic distance, suggesting that nitrogen source type is an important factor driving community structure differences. The eggNOG functional annotation results show that metabolism-related functions dominate in the COG functional classification. Among these, functions related to material metabolism and energy conversion, such as COG0477, COG2114, and COG2205, exhibit relatively higher relative abundances under DN and DL treatments, suggesting that high nitrogen concentrations enhance the metabolic potential of soil microorganisms.
Figure 6.
Effect of different treatments on soil microbial diversity (KEGG). (a) ACE index; (b) Chao1 index; (c) observed species index; (d) Simpson index; (e) Shannon index; (f) Relative abundance of core eggNOG functional categories (COG0477, COG2114, COG2205, etc.) under different treatments; (g) PCoA analysis of soil microbial community β-diversity (Bray–Curtis distance) based on eggNOG functional annotation, with PC1 and PC2 representing the first and second principal components, respectively, and the percentage indicating the explanatory rate of the principal component to community variation; different colors represent different nitrogen addition treatments (CK, DX, GX, DL, GL, DN, GN). All diversity indices are presented with error bars for the standard deviation of three biological replicates. (h) Hierarchical clustering dendrogram constructed with Bray–Curtis distance and heatmap of the relative abundance of core eggNOG functional orthologous groups (COGs, including COG0457, COG0477, COG0577, COG2114, COG2205, etc.) across all samples, in which the dendrogram illustrates the similarity of microbial functional profiles among samples, and the heatmap uses a color gradient from blue to red to represent the relative abundance of each COG, with blue indicating low abundance and red indicating high abundance, revealing the treatment-specific enrichment patterns of microbial functional traits. All α-diversity indices are presented as box plots with individual data points, reflecting the variation of three biological replicates for each treatment.
Figure 7.
Effect of different treatments on soil microbial diversity (eggNOG). (a) ACE index; (b) Chao1 index; (c) observed species index; (d) Simpson index; (e) Shannon index; (f) relative abundance of core KEGG enzyme commission (EC) functional categories (7.1.1.2, 2.7.11.1, etc.) under different treatments; (g) PCoA analysis of soil microbial community β-diversity (Bray–Curtis distance) based on KEGG functional annotation, with PC1 and PC2 representing the first and second principal components, respectively, and the percentage indicating the explanatory rate of the principal component to community variation; different colors represent different nitrogen addition treatments (CK, DX, GX, DL, GL, DN, GN). All diversity indices are presented with error bars for the standard deviation of three biological replicates. (h) hierarchical clustering dendrogram (constructed using Bray–Curtis distance) and heatmap showing the relative abundance of key KEGG EC functional categories across all soil samples, in which the dendrogram reflects the similarity of microbial functional profiles among different treatment replicates, and the heatmap employs a color gradient from blue to red to denote the relative abundance of EC functional categories (blue indicates low abundance, red indicates high abundance), thereby revealing the treatment-specific enrichment patterns of microbial functional traits. All α-diversity indices are presented as box plots with individual data points, reflecting the variability of three biological replicates for each treatment.
The KEGG functional annotation results (Figure 7a–f) were consistent with the eggNOG analysis trends. The ACE, Chao1, and Shannon indices were higher in the DN and DL treatments, while the GX and DX treatments had relatively lower values for these indices. PCoA and cluster analysis (Figure 7g–h) also indicated that different nitrogen source types led to significant changes in the community at the functional level. KEGG functional relative abundance results indicate that pathways related to nitrogen metabolism, carbon metabolism, and energy metabolism are more abundant in DN and DL treatments, while GX and DX treatments show relatively lower abundances.
Overall, low-concentration nitrogen addition, especially in DN and DL treatments, can effectively enhance the species diversity and metabolic capacity of soil microbial communities. These microbial changes may enhance rhizosphere nitrogen transformation and nutrient turnover, allowing absorbed nitrogen to be continuously transported from roots to shoots within 48 h. In summary, the nitrogen allocation pattern within plants is jointly regulated by nitrogen forms, root physiological requirements, and microbe-mediated rhizosphere processes. This is also why different nitrogen sources lead to different nitrogen absorption and distribution strategies in crops. Therefore, reasonably regulating the type and application level of nitrogen sources not only helps maintain soil microbial diversity but also promotes the stability and sustainability of their metabolic functions.
3.5. Soil Microbial Community Function
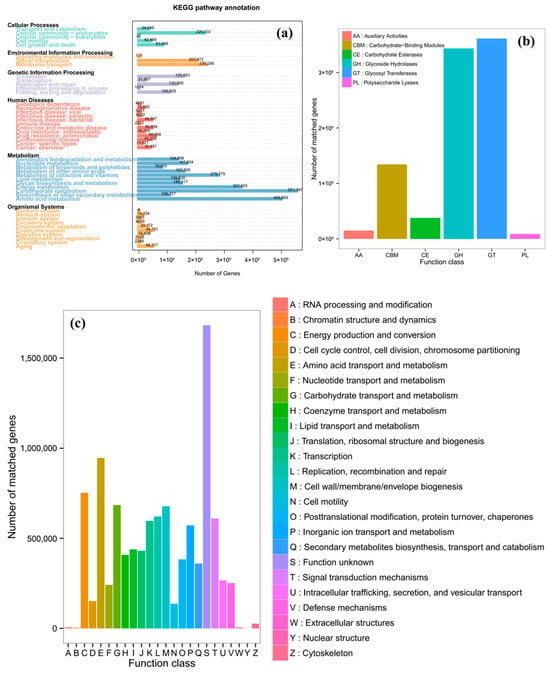
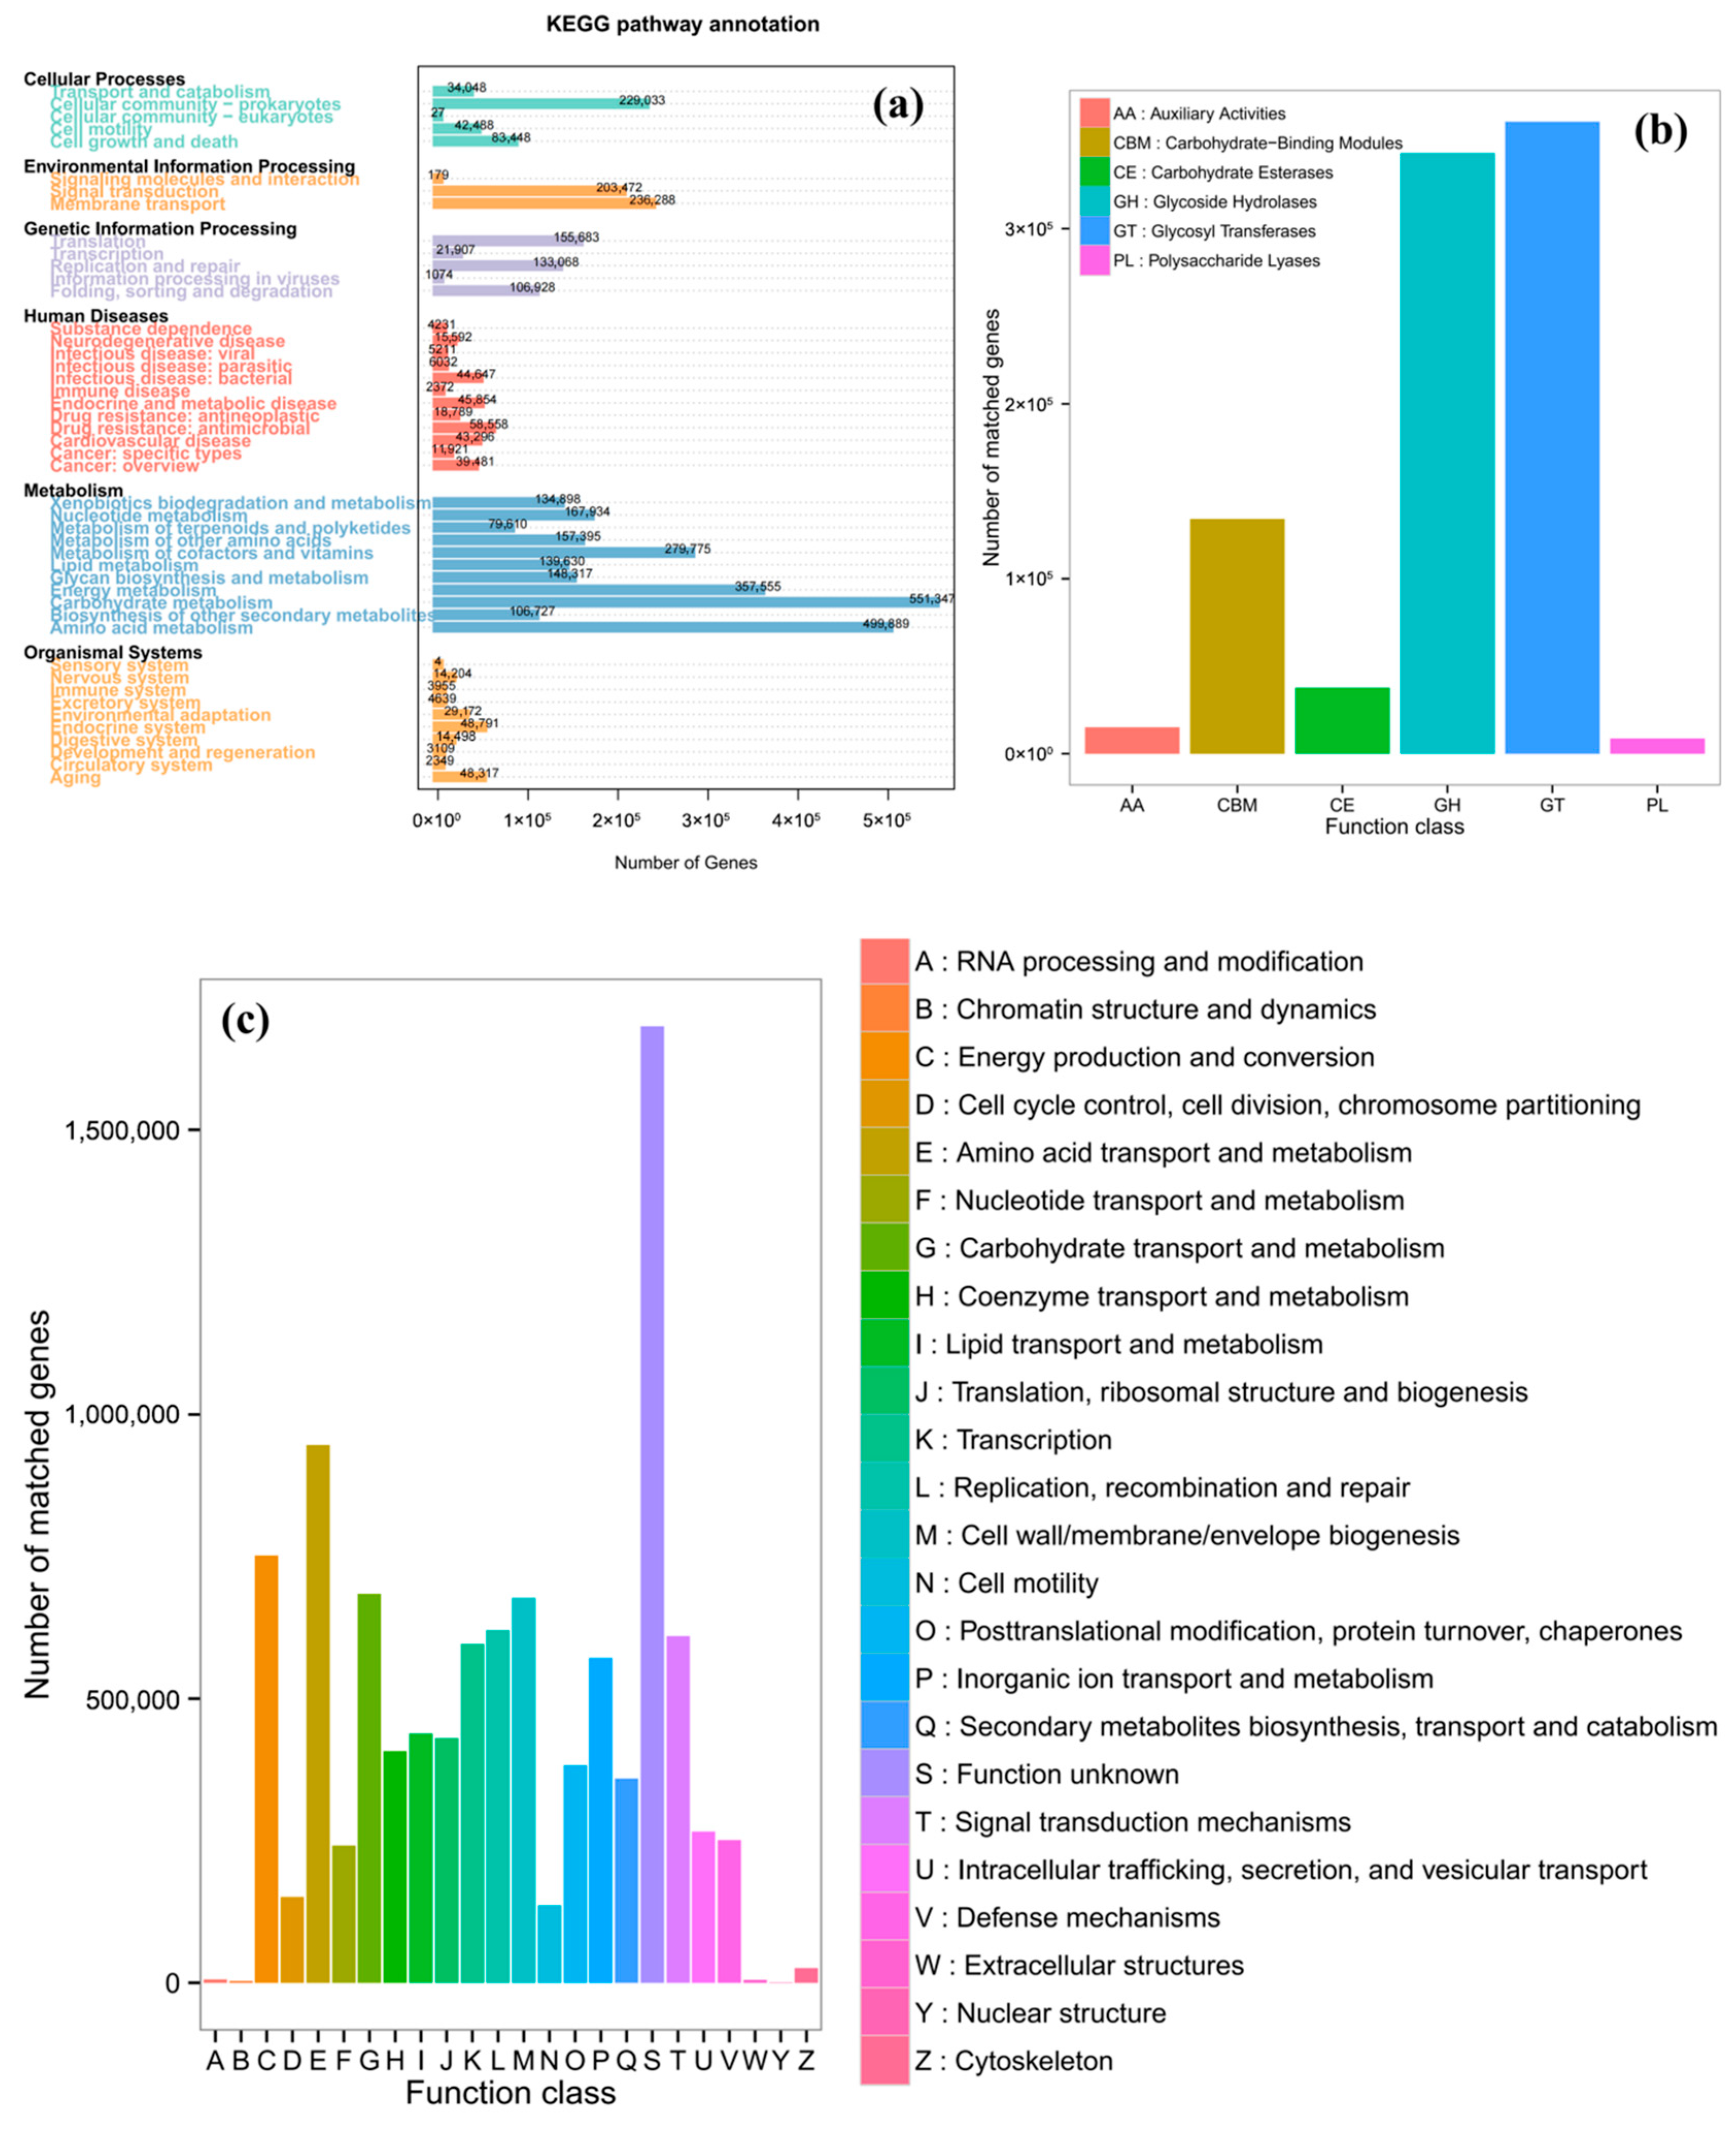
Different nitrogen sources and addition levels not only affect soil microbial diversity but also significantly alter their functional composition and potential metabolic capacity (Figure 8). As shown in the KEGG annotation results (Figure 8a), microbial functions are primarily concentrated in metabolism, including carbon metabolism, amino acid metabolism, energy metabolism, and coenzyme and vitamin metabolism, accounting for a significant proportion of the total annotated genes [58]. Next are environmental information processing (such as membrane transport and signal transduction) and cellular processes (such as cell movement, cell growth, and cell death). These studies indicate that soil microbial communities play a crucial role in maintaining carbon and nitrogen cycles and energy flow [59]. The application of nitrogen fertilizers can influence ecosystem multifunctionality by regulating soil microbial community diversity, thereby enhancing soil carbon nutrition function and crop productivity [10,60].
Figure 8.
Effects of different treatments on soil microbial community functions. (a) KEGG pathway annotation: The column chart shows the number of annotated genes in different KEGG functional categories, including metabolism, environmental information processing, genetic information processing, cellular processes, organismal systems and auxiliary activities (AA); the abscissa is the functional category, and the ordinate is the total number of annotated genes. (b) CAZy functional classification: The column chart shows the number of annotated genes in core CAZy families, including carbohydrate-binding modules (CBMs), carbohydrate esterases (CEs), glycoside hydrolases (GHs), glycosyltransferases (GTs) and polysaccharide lyases (PLs); the abscissa is the CAZy family, and the ordinate is the total number of annotated genes. (c) eggNOG functional classification: The column chart shows the number of annotated genes in 25 eggNOG functional classes (A–Z), with the abscissa for functional class codes and the ordinate for the total number of annotated genes; key functional classes include C (energy production and conversion), E (amino acid transport and metabolism), G (carbohydrate transport and metabolism). All data represent the sum of three biological replicates.
The results of CAZy functional classification (Figure 8b) indicated that glycoside hydrolases (GHs) and glycosyltransferases (GTs) were the main functions, followed by polysaccharide lyases (PLs) and carbohydrate binding modules (CBMs). These functional taxa are closely related to organic matter catabolism and polysaccharide metabolism.
The functional classification results of eggNOG (Figure 8c) show that microbial community functions are dominated by metabolism-related functions, including amino acid transport and metabolism (E), carbohydrate transport and metabolism (G), energy production and conversion (C), cofactor and vitamin metabolism (H), etc. In addition, information storage and processing functions such as transcription (K) and replication and repair (L) also account for a certain proportion.
Overall, nitrogen addition significantly regulates the functional structure of soil microbial communities, particularly enhancing functional potential related to nutrient cycling, energy metabolism, and organic matter degradation.
3.6. Correlation Analysis Between Soil Microorganisms and Soil Physicochemical Properties
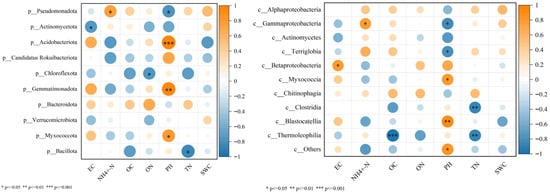
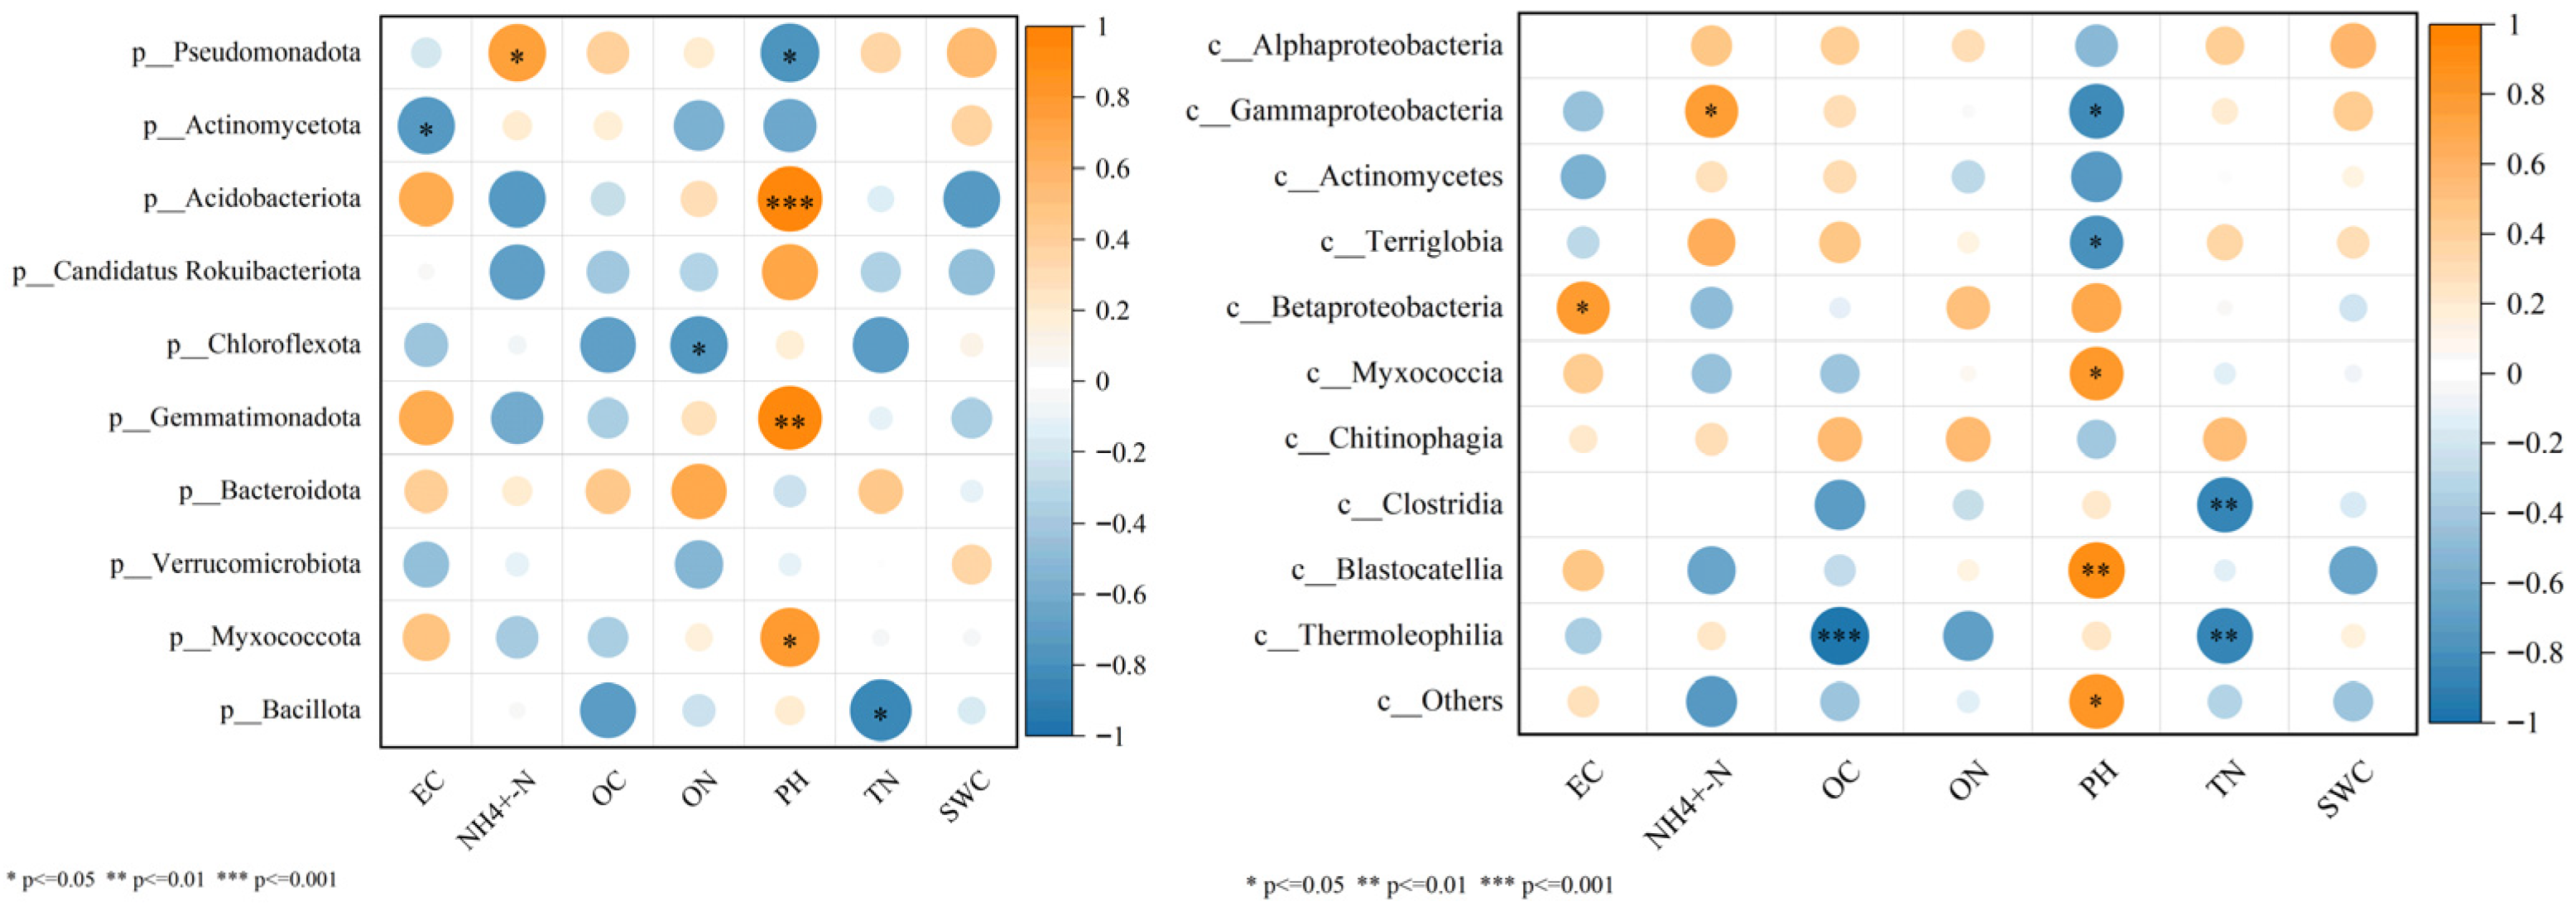
The correlation between soil microbial community structure and soil physicochemical properties is illustrated in the Figure 9. Soil pH, TN, (NH4+-N), and OC are the core environmental factors driving the differentiation of microbial community structure. Different taxonomic levels of microbial groups exhibit significant specificity in their response to environmental factors. p_Acidobacteriota shows a highly significant positive correlation with soil pH (p < 0.001), indicating that it is the most sensitive group to soil acidity and alkalinity. p_Gemmatimonadota has a significant positive correlation with pH (p < 0.01). p_Pseudomonadota has a significant positive correlation with (NH4+-N) (p < 0.05). (p_Myxococcota) has a significant positive correlation with soil pH (p < 0.05). p_Bacillota shows a significant negative correlation with TN (p < 0.05). p_Actinomycetota has a significant negative correlation with EC (p < 0.05). p_Chloroflexota has a significant negative correlation with ON (p < 0.05). c_Blastocatellia has a highly significant positive correlation with soil pH (p < 0.01). c_Gammaproteobacteria has a significant positive correlation with ammonium nitrogen (NH4+-N) (p < 0.05). c_Betaproteobacteria has a significant positive correlation with EC (p < 0.05). c_Myxococcacia has a significant positive correlation with soil pH (p < 0.05). c_Thermoleophilia has a highly significant negative correlation with OC (p < 0.001), indicating that it is the group most strongly responsive to soil organic carbon. Both c_Thermoleophilia and c_Clostridia have a highly significant negative correlation with TN (p < 0.01). c_Gammaproteobacteria and c_Terriglobia have significant negative correlations with soil pH (p < 0.05).
Figure 9.
Heat map depicting the Pearson correlation coefficients between soil microbial taxa and key soil physicochemical properties. The analysis focuses on dominant microbial taxa at the phylum (p_) and class (c_) levels, including the phyla Pseudomonadota, Actinomycetota, Acidobacteriota, Candidatus Rokubacteriota, Chloroflexota, Gemmatimonadota, Bacteroidota, Vercomicrobiota, Myxococcota, and Bacillota, and the classes Gammaproteobacteria, Blastocatellia, Thermoleophilia, alongside critical soil physicochemical properties (electrical conductivity [EC], pH, total nitrogen [TN], soil water content [SWC], and ammonium nitrogen [NH4+-N]). The abscissa lists the measured soil physicochemical properties, while the ordinate enumerates the microbial taxa; the color gradient from blue to red represents the magnitude and direction of the correlation coefficients, ranging from −1 (strong negative correlation) to 1 (strong positive correlation). The asterisk symbols denote the statistical significance of the correlation coefficients, with *** indicating a highly significant correlation at p ≤ 0.001, ** indicating a significant correlation at p ≤ 0.01, and * indicating a marginally significant or trending correlation at p ≤ 0.05; blank cells indicate no statistically significant correlation (p > 0.05). This visualization highlights the key environmental drivers shaping the distribution and abundance of dominant microbial communities within the rhizosphere soil of Larix olgensis A. Henry seedlings.
4. Conclusions
This study clarified the differential utilization of ammonium nitrogen (NH4+-N), nitrate nitrogen (NO3−-N) and urea by Larix olgensis A. Henry seedlings, and the coupling regulation of the plant–soil–microorganism nitrogen cycle under different nitrogen addition regimes. Larix olgensis seedlings show a time-dependent nitrogen absorption and allocation strategy: NH4+-N is rapidly assimilated and retained in roots within 24 h, while NO3−-N and urea are preferentially transported to aboveground organs at 48 h, driven by the GS-GOGAT pathway-mediated root assimilation of NH4+-N and the high mobility of NO3−-N in soil. Different nitrogen forms exert targeted effects on soil properties: high-concentration NaNO3 alleviates soil acidification and enriches nitrate pools, low-dose urea promotes NH4+-N accumulation, and high-concentration NH4Cl enhances soil water-holding capacity; moderate nitrogen addition upregulates urease and nitrate reductase activity, and low-concentration nitrogen input (urea/NH4Cl) significantly improves soil microbial diversity and the functional potential of carbon/nitrogen/energy metabolism. Soil pH, total nitrogen (TN), NH4+-N and organic carbon (OC) are confirmed as core drivers of microbial community differentiation, with microbial taxa at phylum and class levels showing taxon-specific responses to soil physicochemical factors.
For the artificial Larix olgensis forests in the high nitrogen deposition region of Northeast China, the recommended practical fertilization strategy is the combined application of low-concentration urea (10 kg N·hm−2·yr−1) and moderate nitrate nitrogen (10 kg N·hm−2·yr−1) in a 1:1 ratio. This regime matches the seedling’s time-dependent nitrogen absorption preference, improving nitrogen utilization efficiency by aligning root NH4+-N assimilation and aboveground NO3−-N transport; it also maintains soil microbial diversity and stable nitrogen transformation capacity, mitigates soil acidification and salt stress risks, and reduces nitrogen leaching. This fertilization practice can optimize the coupling efficiency of the plant–soil–microorganism nitrogen cycle, maintain soil fertility, and ultimately enhance the structural stability and carbon sink function sustainability of Larix olgensis artificial forest ecosystems. The findings provide a physiological and ecological basis for precise nitrogen management of temperate coniferous plantations under global nitrogen deposition change.
Author Contributions
Conceptualization, T.Q., L.Z. and S.Y.; methodology, T.Q., S.Y. and Y.L.; software, S.Y. and F.H.; validation, T.Q. and S.Y.; formal analysis, L.Z.; investigation, L.Z.; resources, L.Z. and T.Q.; data curation, S.Y. and Y.L.; writing—original draft preparation, T.Q. and S.Y.; writing—review and editing, all; visualization, S.Y.; supervision, L.Z.; project administration, L.Z.; funding acquisition, L.Z. and T.Q. All authors have read and agreed to the published version of the manuscript.
Funding
This research was funded by [Department of Science and Technology of Jilin Province] grant number [20260402003ZP].
Institutional Review Board Statement
Not applicable.
Informed Consent Statement
Not applicable.
Data Availability Statement
The original contributions presented in this study are included in the article. Further inquiries can be directed to the corresponding author.
Conflicts of Interest
The authors declare no conflicts of interest.
References
- Liu, L.; Xu, W.; Lu, X.; Zhong, B.; Guo, Y.; Lu, X.; Zhao, Y.; He, W.; Wang, S.; Zhang, X. Exploring global changes in agricultural ammonia emissions and their contribution to nitrogen deposition since 1980. Proc. Natl. Acad. Sci. USA 2022, 119, e2121998119. [Google Scholar] [CrossRef] [Scilit]
- Zhu, J.; Jia, Y.; Yu, G.; Wang, Q.; He, N.; Chen, Z.; He, H.; Zhu, X.; Li, P.; Zhang, F. Changing patterns of global nitrogen deposition driven by socio-economic development. Nat. Commun. 2025, 16, 46. [Google Scholar] [CrossRef] [Scilit]
- Ge, W.; Prime, N.S.; Smith, S.J.; Liu, J.; Ren, Y.; Zhou, Y.; Wu, H.; Wang, X.; Chen, G. The short-term comprehensive impact of the phase-out of global coal combustion on air pollution and climate change. Environ. Pollut. 2025, 367, 125669. [Google Scholar] [CrossRef] [Scilit]
- Wang, L.; Macko, S.A. Constrained preferences in nitrogen uptake across plant species and environments. Plant Cell Environ. 2011, 34, 525–534. [Google Scholar] [CrossRef] [Scilit]
- Wang, Z.-B.; Zhang, J.; Miao, Q.; Cao, H.-Y.; Xiong, F.; Lee, T.; El-Baz, A.; Xie, L.; Ni, S.-Q. Achieving stable partial denitrification by selective inhibition of nitrite reductase with the biosafe aprotic solvent DMSO. Environ. Sci. Technol. 2024, 58, 21242–21250. [Google Scholar] [CrossRef] [Scilit]
- Wang, X.-G.; Lyu, X.-T.; Xi, F.-M.; Liu, Z.-H.; Liang, Y.; Gao, T.; Sun, T.; Yu, D.-P.; Wang, C.; Ma, Q. Current status and research prospects of terrestrial ecosystem carbon sink in Northeast China. J. Appl. Ecol. 2024, 35, 2322–2337. [Google Scholar] [CrossRef] [Scilit]
- Zhang, J.; Jing, W.; Ji, K.; Zhang, Y. Soil characteristics and bacterial community characteristics of shelterbelts of different tree species in black soil region of China. Sci. Rep. 2025, 15, 8723. [Google Scholar] [CrossRef] [Scilit] [PubMed]
- Sun, R.; Zheng, H.; Yin, S.; Zhang, X.; You, X.; Wu, H.; Suo, F.; Han, K.; Cheng, Y.; Zhang, C. Comparative study of pyrochar and hydrochar on peanut seedling growth in a coastal salt-affected soil of Yellow River Delta, China. Sci. Total Environ. 2022, 833, 155183. [Google Scholar] [CrossRef] [Scilit]
- Yin, S.; Zhang, X.; Suo, F.; You, X.; Yuan, Y.; Cheng, Y.; Zhang, C.; Li, Y. Effect of biochar and hydrochar from cow manure and reed straw on lettuce growth in an acidified soil. Chemosphere 2022, 298, 134191. [Google Scholar] [CrossRef] [Scilit] [PubMed]
- Zhang, Y.; Luo, Z.; Li, L.; Nian, L.; Li, L.; Niu, Y.; He, R.; Liu, J. Nitrogen fertilization shapes soil microbial diversity and ecosystem multifunctionality by modulating soil nutrients. Microorganisms 2025, 13, 540. [Google Scholar] [CrossRef] [Scilit] [PubMed]
- Hu, C.-C.; Liu, X.-Y.; Driscoll, A.W.; Kuang, Y.-W.; Brookshire, E.J.; Lü, X.-T.; Chen, C.-J.; Song, W.; Mao, R.; Liu, C.-Q. Global distribution and drivers of relative contributions among soil nitrogen sources to terrestrial plants. Nat. Commun. 2024, 15, 6407. [Google Scholar] [CrossRef] [Scilit] [PubMed]
- Zhang, X.; Ward, B.B.; Sigman, D.M. Global nitrogen cycle: Critical enzymes, organisms, and processes for nitrogen budgets and dynamics. Chem. Rev. 2020, 120, 5308–5351. [Google Scholar] [CrossRef] [Scilit] [PubMed]
- Karlsson, F.H.; Fåk, F.; Nookaew, I.; Tremaroli, V.; Fagerberg, B.; Petranovic, D.; Bäckhed, F.; Nielsen, J. Symptomatic atherosclerosis is associated with an altered gut metagenome. Nat. Commun. 2012, 3, 1245. [Google Scholar] [CrossRef] [Scilit]
- Karlsson, F.H.; Tremaroli, V.; Nookaew, I.; Bergström, G.; Behre, C.J.; Fagerberg, B.; Nielsen, J.; Bäckhed, F. Gut metagenome in European women with normal, impaired and diabetic glucose control. Nature 2013, 498, 99–103. [Google Scholar] [CrossRef] [Scilit]
- Scher, J.U.; Sczesnak, A.; Longman, R.S.; Segata, N.; Ubeda, C.; Bielski, C.; Rostron, T.; Cerundolo, V.; Pamer, E.G.; Abramson, S.B. Expansion of intestinal Prevotella copri correlates with enhanced susceptibility to arthritis. eLife 2013, 2, e01202. [Google Scholar] [CrossRef] [Scilit]
- Li, J.; Jia, H.; Cai, X.; Zhong, H.; Feng, Q.; Sunagawa, S.; Arumugam, M.; Kultima, J.R.; Prifti, E.; Nielsen, T. An integrated catalog of reference genes in the human gut microbiome. Nat. Biotechnol. 2014, 32, 834–841. [Google Scholar] [CrossRef] [Scilit]
- Mende, D.R.; Waller, A.S.; Sunagawa, S.; Järvelin, A.I.; Chan, M.M.; Arumugam, M.; Raes, J.; Bork, P. Assessment of metagenomic assembly using simulated next generation sequencing data. PLoS ONE 2012, 7, e31386. [Google Scholar] [CrossRef] [Scilit]
- Oh, J.; Byrd, A.L.; Deming, C.; Conlan, S.; Kong, H.H.; Segre, J.A. Biogeography and individuality shape function in the human skin metagenome. Nature 2014, 514, 59–64. [Google Scholar] [CrossRef] [Scilit]
- Nielsen, H.B.; Almeida, M.; Juncker, A.S.; Rasmussen, S.; Li, J.; Sunagawa, S.; Plichta, D.R.; Gautier, L.; Pedersen, A.G.; Le Chatelier, E. Identification and assembly of genomes and genetic elements in complex metagenomic samples without using reference genomes. Nat. Biotechnol. 2014, 32, 822–828. [Google Scholar] [CrossRef] [Scilit]
- Qin, J.; Li, R.; Raes, J.; Arumugam, M.; Burgdorf, K.S.; Manichanh, C.; Nielsen, T.; Pons, N.; Levenez, F.; Yamada, T. A human gut microbial gene catalogue established by metagenomic sequencing. Nature 2010, 464, 59–65. [Google Scholar] [CrossRef] [Scilit] [PubMed]
- Sunagawa, S. Ocean plankton. Structure and function of the global ocean 402 microbiome. Science 2015, 348, 403. [Google Scholar] [CrossRef] [Scilit]
- Zeller, G.; Tap, J.; Voigt, A.Y.; Sunagawa, S.; Kultima, J.R.; Costea, P.I.; Amiot, A.; Böhm, J.; Brunetti, F.; Habermann, N. Potential of fecal microbiota for early-stage detection of colorectal cancer. Mol. Syst. Biol. 2014, 10, MSB145645. [Google Scholar] [CrossRef] [Scilit]
- Zhu, W.; Lomsadze, A.; Borodovsky, M. Ab initio gene identification in metagenomic sequences. Nucleic Acids Res. 2010, 38, e132. [Google Scholar] [CrossRef] [Scilit] [PubMed]
- Fu, L.; Niu, B.; Zhu, Z.; Wu, S.; Li, W. CD-HIT: Accelerated for clustering the next-generation sequencing data. Bioinformatics 2012, 28, 3150–3152. [Google Scholar] [CrossRef] [Scilit] [PubMed]
- Li, W.; Godzik, A. Cd-hit: A fast program for clustering and comparing large sets of protein or nucleotide sequences. Bioinformatics 2006, 22, 1658–1659. [Google Scholar] [CrossRef] [Scilit]
- Buchfink, B.; Xie, C.; Huson, D.H. Fast and sensitive protein alignment using DIAMOND. Nat. Methods 2015, 12, 59–60. [Google Scholar] [CrossRef] [Scilit] [PubMed]
- Cotillard, A.; Kennedy, S.P.; Kong, L.C.; Prifti, E.; Pons, N.; Le Chatelier, E.; Almeida, M.; Quinquis, B.; Levenez, F.; Galleron, N. Dietary intervention impact on gut microbial gene richness. Nature 2013, 500, 585–588. [Google Scholar] [CrossRef] [Scilit]
- Villar, E.; Farrant, G.K.; Follows, M.; Garczarek, L.; Speich, S.; Audic, S.; Bittner, L.; Blanke, B.; Brum, J.R.; Brunet, C. Environmental characteristics of Agulhas rings affect interocean plankton transport. Science 2015, 348, 1261447. [Google Scholar] [CrossRef] [Scilit]
- Le Chatelier, E.; Nielsen, T.; Qin, J.; Prifti, E.; Hildebrand, F.; Falony, G.; Almeida, M.; Arumugam, M.; Batto, J.-M.; Kennedy, S. Richness of human gut microbiome correlates with metabolic markers. Nature 2013, 500, 541–546. [Google Scholar] [CrossRef] [Scilit]
- Segata, N.; Izard, J.; Waldron, L.; Gevers, D.; Miropolsky, L.; Garrett, W.S.; Huttenhower, C. Metagenomic biomarker discovery and explanation. Genome Biol. 2011, 12, R60. [Google Scholar] [CrossRef] [Scilit]
- Feng, Q.; Liang, S.; Jia, H.; Stadlmayr, A.; Tang, L.; Lan, Z.; Zhang, D.; Xia, H.; Xu, X.; Jie, Z. Gut microbiome development along the colorectal adenoma–carcinoma sequence. Nat. Commun. 2015, 6, 6528. [Google Scholar] [CrossRef] [Scilit]
- Kanehisa, M.; Furumichi, M.; Tanabe, M.; Sato, Y.; Morishima, K. KEGG: New perspectives on genomes, pathways, diseases and drugs. Nucleic Acids Res. 2017, 45, D353–D361. [Google Scholar] [CrossRef] [Scilit]
- Kanehisa, M.; Goto, S.; Hattori, M.; Aoki-Kinoshita, K.F.; Itoh, M.; Kawashima, S.; Katayama, T.; Araki, M.; Hirakawa, M. From genomics to chemical genomics: New developments in KEGG. Nucleic Acids Res. 2006, 34, D354–D357. [Google Scholar] [CrossRef] [Scilit]
- Huerta-Cepas, J.; Szklarczyk, D.; Forslund, K.; Cook, H.; Heller, D.; Walter, M.C.; Rattei, T.; Mende, D.R.; Sunagawa, S.; Kuhn, M. eggNOG 4.5: A hierarchical orthology framework with improved functional annotations for eukaryotic, prokaryotic and viral sequences. Nucleic Acids Res. 2016, 44, D286–D293. [Google Scholar] [CrossRef] [Scilit] [PubMed]
- Cantarel, B.L.; Coutinho, P.M.; Rancurel, C.; Bernard, T.; Lombard, V.; Henrissat, B. The Carbohydrate-Active EnZymes database (CAZy): An expert resource for glycogenomics. Nucleic Acids Res. 2009, 37, D233–D238. [Google Scholar] [CrossRef] [Scilit] [PubMed]
- Qin, J.; Li, Y.; Cai, Z.; Li, S.; Zhu, J.; Zhang, F.; Liang, S.; Zhang, W.; Guan, Y.; Shen, D. A metagenome-wide association study of gut microbiota in type 2 diabetes. Nature 2012, 490, 55–60. [Google Scholar] [CrossRef] [Scilit]
- Qin, N.; Yang, F.; Li, A.; Prifti, E.; Chen, Y.; Shao, L.; Guo, J.; Le Chatelier, E.; Yao, J.; Wu, L. Alterations of the human gut microbiome in liver cirrhosis. Nature 2014, 513, 59–64. [Google Scholar] [CrossRef] [Scilit] [PubMed]
- Bäckhed, F.; Roswall, J.; Peng, Y.; Feng, Q.; Jia, H.; Kovatcheva-Datchary, P.; Li, Y.; Xia, Y.; Xie, H.; Zhong, H. Dynamics and stabilization of the human gut microbiome during the first year of life. Cell Host Microbe 2015, 17, 690–703. [Google Scholar] [CrossRef] [Scilit]
- Martínez, J.L.; Coque, T.M.; Baquero, F. What is a resistance gene? Ranking risk in resistomes. Nat. Rev. Microbiol. 2015, 13, 116–123. [Google Scholar] [CrossRef] [Scilit]
- Jia, B.; Raphenya, A.R.; Alcock, B.; Waglechner, N.; Guo, P.; Tsang, K.K.; Lago, B.A.; Dave, B.M.; Pereira, S.; Sharma, A.N. CARD 2017: Expansion and model-centric curation of the comprehensive antibiotic resistance database. Nucleic Acids Res. 2017, 45, D566–D573. [Google Scholar] [CrossRef] [Scilit]
- McArthur, A.G.; Waglechner, N.; Nizam, F.; Yan, A.; Azad, M.A.; Baylay, A.J.; Bhullar, K.; Canova, M.J.; De Pascale, G.; Ejim, L. The comprehensive antibiotic resistance database. Antimicrob. Agents Chemother. 2013, 57, 3348–3357. [Google Scholar] [CrossRef] [Scilit]
- Konishi, N.; Ishiyama, K.; Beier, M.P.; Inoue, E.; Kanno, K.; Yamaya, T.; Takahashi, H.; Kojima, S. Contributions of two cytosolic glutamine synthetase isozymes to ammonium assimilation in Arabidopsis roots. J. Exp. Bot. 2017, 68, 613–625. [Google Scholar] [CrossRef] [Scilit]
- Setién, I.; Vega-Mas, I.; Celestino, N.; Calleja-Cervantes, M.E.; González-Murua, C.; Estavillo, J.M.; González-Moro, M.B. Root phosphoenolpyruvate carboxylase and NAD-malic enzymes activity increase the ammonium-assimilating capacity in tomato. J. Plant Physiol. 2014, 171, 49–63. [Google Scholar] [CrossRef] [Scilit]
- Wang, H.; Tang, X.; Chen, J.; Shang, S.; Zhu, M.; Liang, S.; Zang, Y. Comparative studies on the response of Zostera marina leaves and roots to ammonium stress and effects on nitrogen metabolism. Aquat. Toxicol. 2021, 240, 105965. [Google Scholar] [CrossRef] [Scilit] [PubMed]
- Zayed, O.; Hewedy, O.A.; Abdelmoteleb, A.; Ali, M.; Youssef, M.S.; Roumia, A.F.; Seymour, D.; Yuan, Z.-C. Nitrogen journey in plants: From uptake to metabolism, stress response, and microbe interaction. Biomolecules 2023, 13, 1443. [Google Scholar] [CrossRef] [Scilit] [PubMed]
- Chen, Y.-N.; Ho, C.-H. CIPK15-mediated inhibition of NH4+ transport protects Arabidopsis from submergence. Heliyon 2023, 9, e20235. [Google Scholar] [CrossRef] [Scilit] [PubMed]
- Huang, L.; Li, M.; Zhou, K.; Sun, T.; Hu, L.; Li, C.; Ma, F. Uptake and metabolism of ammonium and nitrate in response to drought stress in Malus prunifolia. Plant Physiol. Biochem. 2018, 127, 185–193. [Google Scholar] [CrossRef] [Scilit]
- Liu, J.; Wu, N.; Wang, H.; Sun, J.; Peng, B.; Jiang, P.; Bai, E. Nitrogen addition affects chemical compositions of plant tissues, litter and soil organic matter. Ecology 2016, 97, 1796–1806. [Google Scholar] [CrossRef] [Scilit]
- Zhou, T.; Wang, J.; Ma, Z.; Du, Z.; Zhang, C.; Zhu, L.; Wang, J. Effects of 1-alkyl-3-methylimidazolium nitrate on soil physical and chemical properties and microbial biomass. Arch. Environ. Contam. Toxicol. 2018, 74, 577–586. [Google Scholar] [CrossRef] [Scilit]
- Liu, M.; Xu, X.; Wanek, W.; Sun, J.; Bardgett, R.D.; Tian, Y.; Cui, X.; Jiang, L.; Ma, Z.; Kuzyakov, Y. Nitrogen availability in soil controls uptake of different nitrogen forms by plants. New Phytol. 2025, 245, 1450–1467. [Google Scholar] [CrossRef] [Scilit]
- Liu, S.; Chen, B.; Wang, K.; Wang, J.; Wang, K.; Suo, Y.; Yang, X.; Zhu, Y.; Zhang, J.; Lu, M. Unveiling the impact of biodegradable polylactic acid microplastics on meadow soil health. Environ. Geochem. Health 2025, 47, 45. [Google Scholar] [CrossRef] [Scilit]
- López-Sánchez, R.; Rebollar, E.A.; Gutiérrez-Ríos, R.M.; Garciarrubio, A.; Juarez, K.; Segovia, L. Metagenomic analysis of carbohydrate-active enzymes and their contribution to marine sediment biodiversity. World J. Microbiol. Biotechnol. 2024, 40, 95. [Google Scholar] [CrossRef] [Scilit] [PubMed]
- Pan, H.; Qin, Y.; Wang, Y.; Liu, S.; Yu, B.; Song, Y.; Wang, X.; Zhu, G. Dissimilatory nitrate/nitrite reduction to ammonium (DNRA) pathway dominates nitrate reduction processes in rhizosphere and non-rhizosphere of four fertilized farmland soil. Environ. Res. 2020, 186, 109612. [Google Scholar] [CrossRef] [Scilit] [PubMed]
- Zhang, R.; Du, S. Properties of nitrogen fertilization are decisive in determining the effects of elevated atmospheric CO2 on the activity of nitrate reductase in plants. Plant Signal. Behav. 2016, 11, 893–904. [Google Scholar] [CrossRef] [Scilit] [PubMed]
- Marukhyan, S.S.; Hovhannisyan, V.A.; Gasparyan, V.K. Urease combined with CdSe quantum dots as an enzyme sensor for quantitative detection of some metals in water. Spectrochim. Acta Part A 2025, 326, 125186. [Google Scholar] [CrossRef] [Scilit]
- Barman, S.; Saha, P.; Dey, A. Second-sphere interaction allows selective reduction of nitrite to NO or ammonia by synthetic iron porphyrins. J. Am. Chem. Soc. 2025, 147, 23145–23159. [Google Scholar] [CrossRef] [Scilit]
- Fida, T.T.; Voordouw, J.; Ataeian, M.; Kleiner, M.; Okpala, G.; Mand, J.; Voordouw, G. Synergy of sodium nitroprusside and nitrate in inhibiting the activity of sulfate reducing bacteria in oil-containing bioreactors. Front. Microbiol. 2018, 9, 981. [Google Scholar] [CrossRef] [Scilit]
- Sudakov, K.; Rana, A.; Faigenboim-Doron, A.; Gordin, A.; Carmeli, S.; Shimshoni, J.A.; Cytryn, E.; Minz, D. Diverse effects of Bacillus sp. NYG5-emitted volatile organic compounds on plant growth, rhizosphere microbiome, and soil chemistry. Microbiol. Res. 2025, 295, 128089. [Google Scholar] [CrossRef] [Scilit]
- Qiu, D.; Wang, X.; Jiang, K.; Gong, G.; Bao, F. Effect of microbial fertilizers on soil microbial community structure in rotating and continuous cropping Glycyrrhiza uralensis. Front. Plant Sci. 2025, 15, 1452090. [Google Scholar] [CrossRef] [Scilit]
- Liu, J.; Yu, Z.; Gong, Y.; Chen, J.; Zhou, L.; Zhang, W.; Jia, L. Fertilization Induced Soil Microbial Shifts Show Minor Effects on Sapindus mukorossi Yield. Microorganisms 2025, 13, 173. [Google Scholar] [CrossRef] [Scilit]
Disclaimer/Publisher’s Note: The statements, opinions and data contained in all publications are solely those of the individual author(s) and contributor(s) and not of MDPI and/or the editor(s). MDPI and/or the editor(s) disclaim responsibility for any injury to people or property resulting from any ideas, methods, instructions or products referred to in the content. |
© 2026 by the authors. Licensee MDPI, Basel, Switzerland. This article is an open access article distributed under the terms and conditions of the Creative Commons Attribution (CC BY) license.