


Abstract
Groundwater drainage-induced karst collapse is a major geohazard in coal-mining regions of central Hunan, threatening residential safety and infrastructure. This study focuses on the Tuoshan minefield in the Jinzhushan mining area by integrating multi-source field data, including surveys of 170 collapse points, long-term groundwater monitoring at six boreholes, and high-density electrical geophysics. A topographically corrected MODFLOW seepage-field model is developed and calibrated for 2014 (RMSE = 0.32 m; NSE = 0.85) and validated for 2015–2016 (RMSE = 0.41 m; NSE = 0.81). To address the large groundwater-level simulation errors commonly encountered in subtropical hilly karst mining settings, the model incorporates a topographic correction, improving simulation accuracy by 12% relative to an uncorrected model. The simulations capture rapid “steep rise–slow fall” groundwater dynamics: Heavy rainfall (>100 mm/day) raises groundwater levels by 2.8–3.1 m within 2–3 days, whereas pumping (200 m3/h) causes a 1.9–2.2 m decline within one week. A 1.2 km drawdown funnel forms and overlaps with 89% of collapse points, indicating that seepage-field evolution and groundwater-level decline control collapse clustering, with soil suffusion and soil–water–rock interaction acting as key amplifying processes. Based on Terzaghi’s effective stress principle and the Theis solution, a collapse prediction formula is derived and validated using measured events (accuracy = 87.5%), and a region-specific critical hydraulic gradient (in = 0.85) is determined, lower than values reported for North China. The proposed workflow provides quantitative thresholds and model-based guidance for karst collapse prevention in subtropical mining areas.
1. Introduction
Central Hunan is characterized by extensive karst landscapes. Large-scale groundwater extraction during coal mining frequently triggers karst collapse, resulting in damage to surface structures and infrastructure. Clarifying the characteristics of seepage fields and collapse mechanisms is therefore critical for developing targeted hazard mitigation strategies [1,2]. Current research on mining-induced karst collapse has deeply elucidated the coupling mechanism between groundwater level dynamics and collapse, confirming that effective stress changes and soil cave instability caused by groundwater level decline are the core triggers of collapse [3,4]. However, significant challenges remain in groundwater simulation and prediction in karst areas. Karst aquifers exhibit a dual-medium structure of fractures and conduits, where groundwater flow encompasses both Darcian flow (in matrix fractures) and conduit flow (in karst conduits). Additionally, influenced by factors such as rainfall infiltration and fault water conductivity, the spatiotemporal heterogeneity of flow fields is extremely high [5,6]. Although the MODFLOW model is widely used for groundwater simulation [7], applying a standard (uncorrected) MODFLOW setup in subtropical hilly karst mining areas can lead to large errors due to strong heterogeneity and topographic effects [8]. This limitation leads to large errors in groundwater level simulation, hindering accurate support for collapse risk prediction.
The effectiveness of hydrological models (including those for landslide and collapse prediction) relies on rigorous validation criteria, such as the standard proposed by Moriasi et al. (2007), where an NSE > 0.8 indicates “good” performance [9,10]. However, this standard is rarely applied in karst seepage simulation for subtropical mining areas, and parameterization schemes for “fracture-conduit” dual-medium systems are lacking. This further restricts the applicability of cross-regional models and the accuracy of collapse prediction [5]. Recent studies have focused on the dynamic impact of rainfall on karst systems (e.g., rainfall infiltration intensifies groundwater level fluctuations and induces soil cave instability [3,11]), but they fail to fully integrate the regulatory role of geological structures (e.g., faults) on flow fields. As a result, simulation results cannot accurately reflect actual karst seepage characteristics [12,13,14].
Despite substantial progress in understanding mining-induced karst collapse, important gaps remain for subtropical hilly mining areas such as central Hunan. First, few studies quantitatively link transient groundwater drawdown to the spatial clustering and triggering thresholds of collapses under rapid drainage and possible vacuum/suffusion effects [15,16]. Second, multi-source field evidence (collapse inventory, long-term borehole heads, and geophysics) is rarely integrated to jointly constrain transient seepage-field models and to validate predictive formulations. Third, topographic controls are often simplified in regional MODFLOW simulations, while steep terrain may amplify discretization-related wetting/drying and “staircase” errors, affecting the delineation of drawdown funnels and risk zones [17,18,19,20]. To bridge these gaps, this study combines systematic field surveys, monitoring, geophysics, and a MODFLOW-based transient model, and derives an effective-stress-informed collapse prediction equation to provide quantitative guidance for collapse prevention [21]. The novelty of applying MODFLOW in the Tuoshan minefield is that we (i) incorporate topographic correction and topography-zoned infiltration/recharge parameterization to reduce terrain-related simulation errors in steep subtropical settings, and (ii) represent the karst dual-medium conceptual model and fault-controlled flow within an equivalent porous-media framework constrained by multi-source field observations. This enables quantitative delineation of the drawdown funnel and engineering-usable thresholds for collapse prevention.
Accordingly, this study aims to (1) develop a MODFLOW seepage-field model for the Tuoshan mine-field by integrating multi-source field data, (2) reveal groundwater-level evolution patterns under natural and mining conditions, and (3) establish a karst collapse prediction formula and determine key critical thresholds.
2. Study Area
Geographical Formations and Hydrogeological Conditions
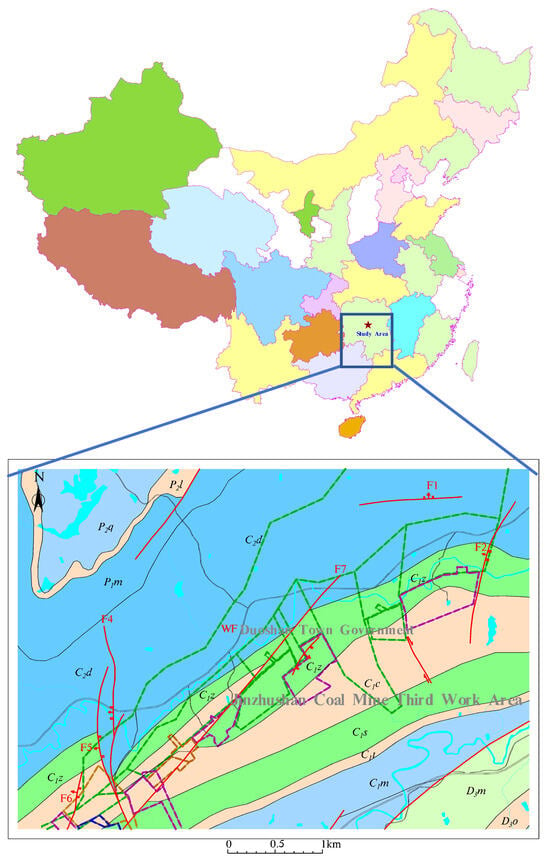
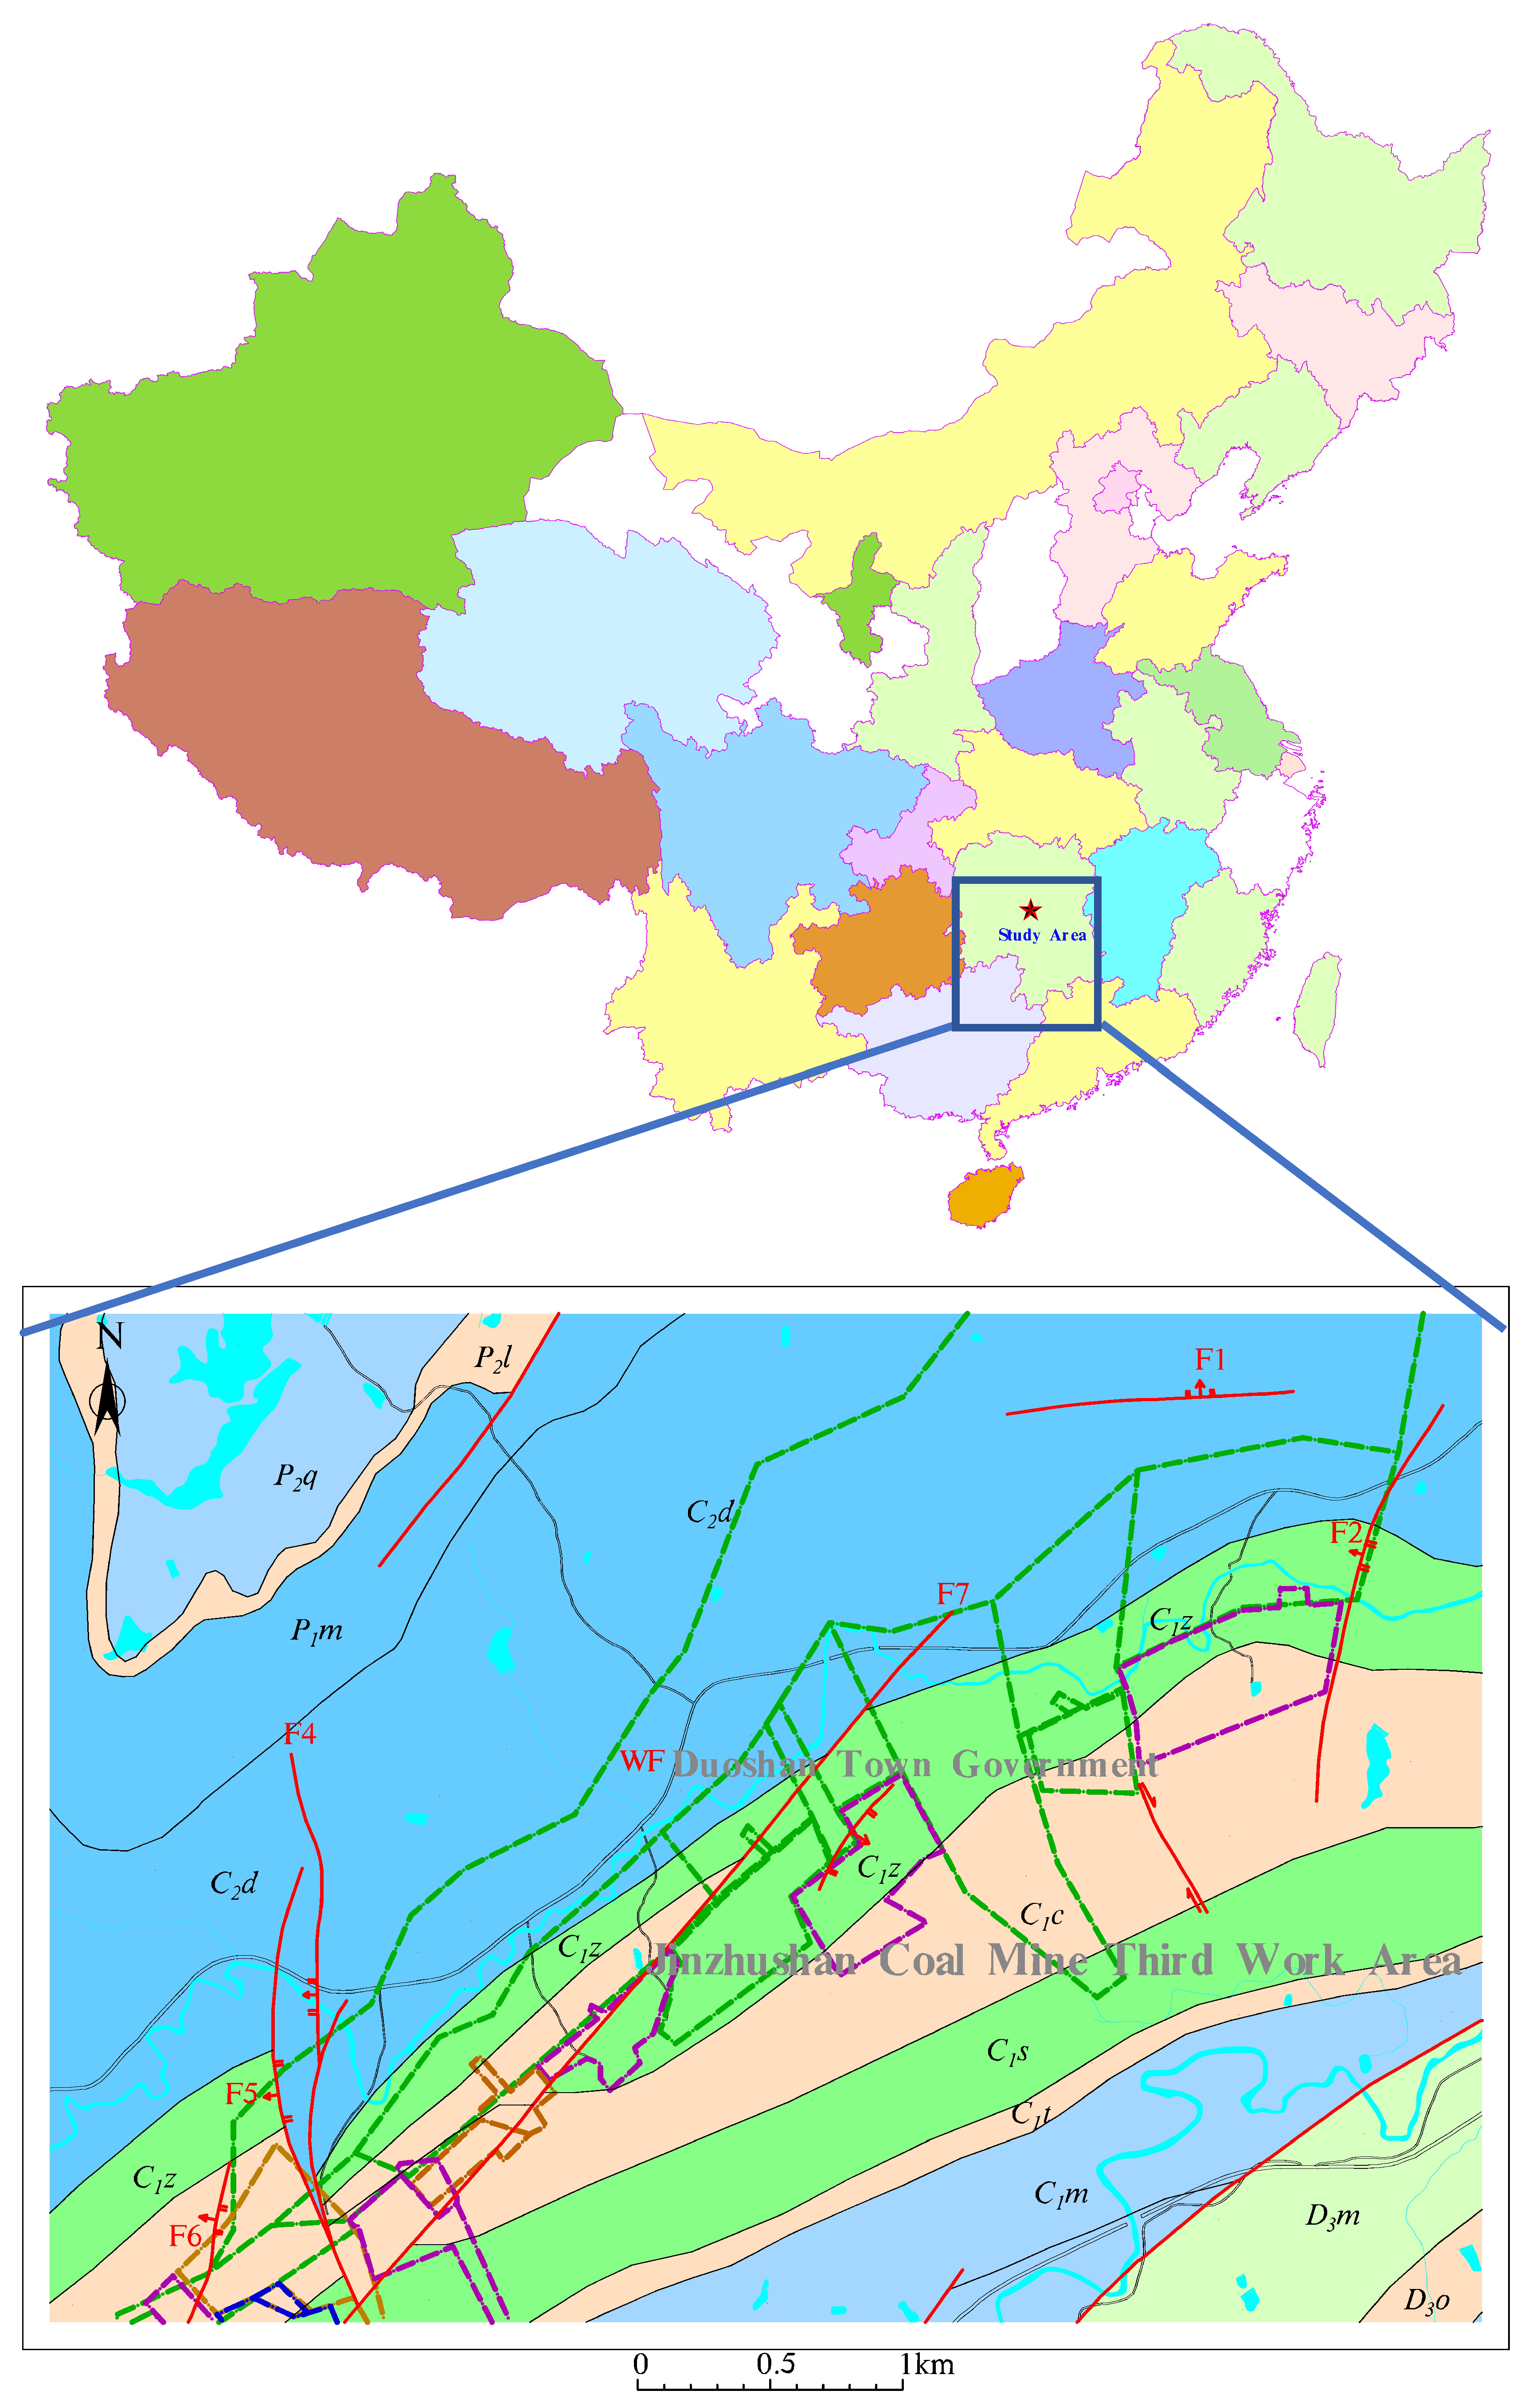
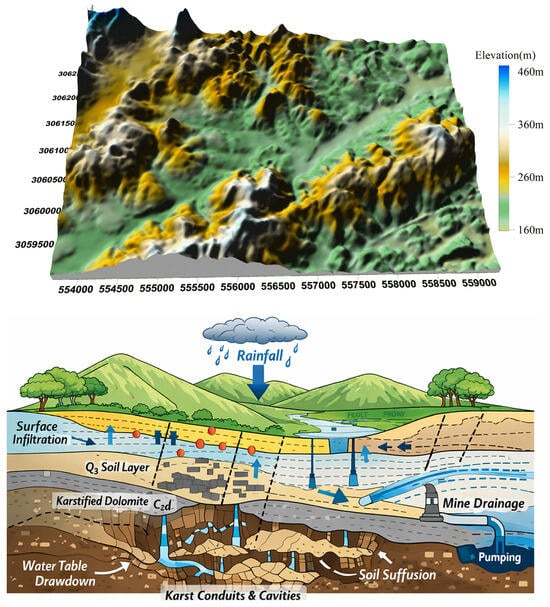
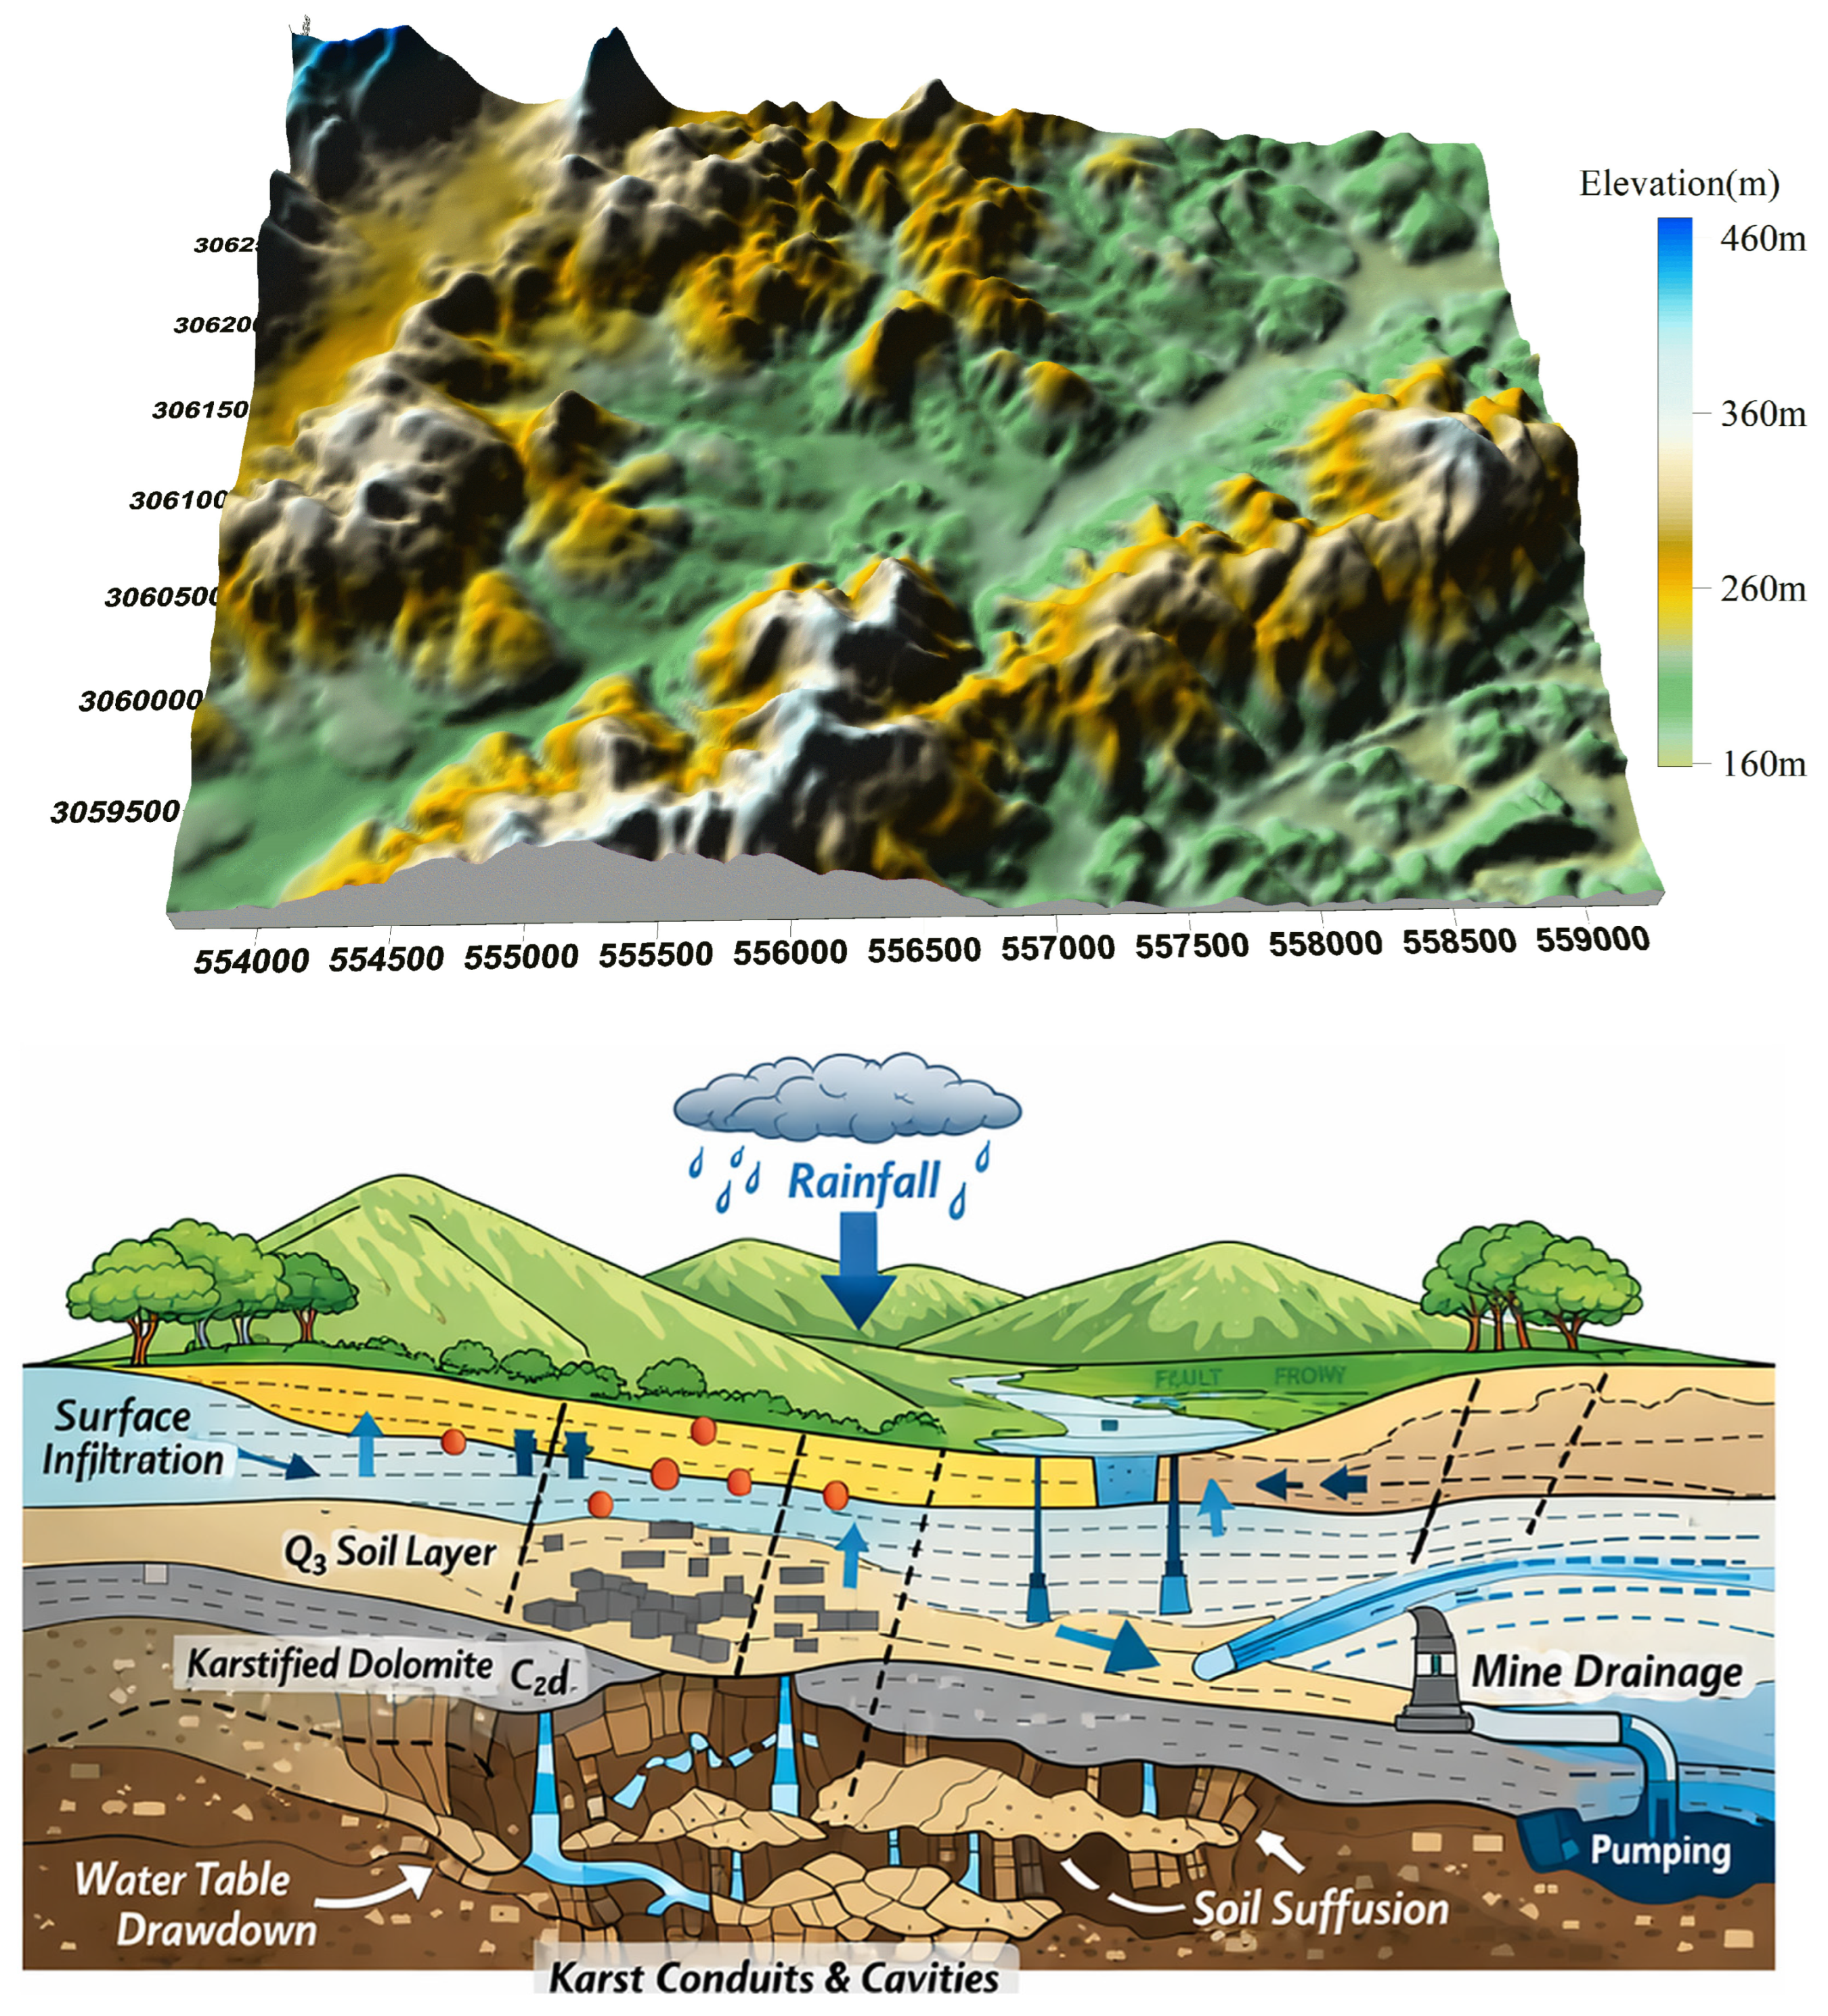
The Tuoshan mine-field, part of the Jinzhushan mining area, is situated in central Hunan (111°35′–111°42′ E, 27°40′–27°45′ N). Its complex geological structure and well-developed karst features make it representative of subtropical hilly mining regions prone to karst hazards. Key geographical landmarks include the Liangxi River to the west and Provincial Highway S312 to the south, with mining activities concentrated in the northeastern sector (Figure 1). For GIS mapping and numerical modeling, spatial datasets are presented in a consistent projected coordinate system (Easting/Northing, m), which is used in Figure 2 and Table 1.
Figure 1.
Mine Distribution Map of the Study Area. Note: Shows 15 coal mines, Liangxi River (water level 175.2–178.6 m), and S312 Provincial Highway; red dots mark collapse-prone zones. the Tuoshan mine-field (111°35′–111°42′ E, 27°40′–27°45′ N), with an inset showing the study area within Hunan Province, China.
Figure 2.
3D Topographic Map of the Study Area. (Note: Elevation range 173–207 m; blue areas denote valleys, brown areas denote hills; the coordinate grid follows the same projected system as Table 1 and the color scale bar indicates elevation (m).). Conceptual hydrogeological model shows rainfall recharge and infiltration through the cover, fracture/fault-controlled groundwater flow within the karstified dolomite, and mine-drainage-dominated discharge (pumping), highlighting water-table drawdown and soil suffusion that can trigger cover instability and karst collapse.
Table 1.
Attributes of Karst Collapse Points in Tuoshan Mine-field. Coordinates are reported as Easting (X), Northing (Y), and Elevation (Z) in meters. Occurrence time was compiled from mine operation/safety records and field verification during the hazard survey campaign (2010–2016).
Monthly average water level data of the Liangxi River (20142016) were sourced from the Lengshuijiang Hydrological Bureau, ranging from 175.2 to 178.6 m (local datum), and were used to define constant head boundaries in the MODFLOW model [22,23].
Note: Field surveys (including investigations of 170 karst collapse points and the installation of six monitoring boreholes) were conducted with official permission from the No. 418 Geological Brigade of the Hunan Bureau of Geology and Mineral Exploration, ensuring compliance with local geological survey regulations.
The main strata in the study area include Quaternary silty clay (Q4), Carboniferous Dapu Formation (C2d) [24,25] dolomite, and Ceshui Formation (C1c) [26] quartz sandstone. The C2d dolomite, the primary aquifer, features well-developed karst fractures (fracture rate >15% via core logging; calculated as the cumulative length of core intervals showing visible/open fractures or broken/fractured core segments divided by the total logged core length, ×100%) that facilitate groundwater flow. The C1c quartz sandstone acts as a relatively impermeable layer, restricting vertical groundwater movement.
The Q4 silty clay, characterized by fine texture and water-retention capacity, exhibits low cohesion (18–58.8 kPa) and an internal friction angle (8.7–15.6°). Its stability is highly sensitive to groundwater level fluctuations: Rapid drawdown reduces pore water pressure, increasing effective stress and causing compaction; sudden rises saturate the clay, lowering shear strength and elevating collapse risk [22,27,28,29].
Groundwater chemistry data from borehole ZK87 (2014–2016) show pH values of 6.2–6.8 (weakly acidic) and dissolved carbonate concentrations of 120–180 mg/L. Comparison of core logging data between 2014 and 2020 indicates an annual dissolution rate of ~0.12 mm/year for C2d dolomite (calculated from repeated core logging as , where is the average increase in the thickness of the dissolution-altered/solution-enlarged interval identified in the logs between 2014 and 2020, and = 6 years), confirming the role of chemical weathering in karst development [30].
3. Data Collection and Methodology
3.1. Data Collection
3.1.1. Karst Collapse Point Survey
From 2019 to 2020, 170 karst collapse points were surveyed using Trimble Juno T41 handheld GPS (planar error ±2 m, elevation error ±5 m) for positioning, and Leica DISTO D2 laser rangefinders (accuracy ±1 mm) for measuring diameter and depth. Three readings were taken per point, with outliers removed via the Grubbs’ test (α = 0.05). An ArcGIS 10.8 spatial database was established, including attributes such as collapse number, coordinates (X/Y/Z), occurrence time, diameter, depth, overburden thickness, and surrounding lithology (Table 1).
3.1.2. Groundwater Monitoring
Six monitoring boreholes (ZK57, ZK87, ZK82, ZK74, ZK92, ZK81) were installed along karst development zones and fault zones in Qinglong Village, targeting the C2d karst fracture aquifer. Automated monitoring (10 min intervals) was implemented using Solinst Levelogger Edge sensors (accuracy ±0.01 m), with data quality controlled via the 3σ criterion. The integrity of 2015 data from ZK87 reached 92%, and missing data were supplemented by linear interpolation.
Soil moisture monitoring was conducted to calibrate rainfall infiltration coefficients: Decagon 5TM sensors (accuracy ±2%) were installed at a depth of 0.5 m in three representative zones (bare bedrock, hilly area, valley plain), with measurements recorded at 1 h intervals from 2014 to 2016. Stratigraphic columns of typical boreholes (e.g., ZK87) were plotted, marking monitored water level depth and layer hydraulic conductivity (Figure 2). Here, the 0.5 m sensors were used to constrain near-surface infiltration and the recharge coefficient; percolation to the water table was evaluated indirectly by matching the observed groundwater-head response in the boreholes during calibration/validation. The conceptual model directly guided the numerical modeling choices described in Section 3. The Q4 cover, karstified C2d dolomite, and underlying strata were treated as the primary hydro-stratigraphic units and discretized into the seven-layer MODFLOW model to capture vertical contrasts in infiltration and karst development. Rainfall recharge was assigned using zoned infiltration parameters consistent with topography and surface conditions, reflecting the spatially variable recharge pathways illustrated in Figure 2 Fracture/fault zones were represented by differentiated hydraulic properties (conduit-like vs. barrier-like behavior) to reproduce the observed heterogeneous seepage field and its response to mine drainage. Mine drainage/pumping was implemented as the dominant discharge boundary to simulate the drawdown funnel and associated collapse-prone conditions.
3.1.3. Meteorological and Geophysical Exploration Data
Rainfall data (1999–2016) were sourced from Duoshan Station (57778) of the Lengshuijiang Meteorological Bureau. Missing data were supplemented via Kriging interpolation using data from the adjacent Lianyuan Station (57779), with a spherical variogram model (range 8.5 km, sill 250 mm2) selected based on cross-validation (RMSE = 8.2 mm). The long-term series was used to characterize interannual variability and define representative recharge statistics, while the 2014–2016 segment was used directly in the transient calibration/validation against groundwater monitoring.
High-density electrical resistivity surveys were conducted using the WGMD-3 system (electrode spacing 5 m, detection depth 30–50 m). Resistivity <50 Ω·m was classified as strongly karst-developed, 50–200 Ω·m as moderately developed, and >200 Ω·m as weakly developed (referencing GB 50021-2009) [31]. The A–A′ profile map (Figure 3) shows spatial correspondence between collapse points and strongly karst-developed zones. A total of resistivity profiles was acquired (including the representative A–A′ line), and each profile was inverted using a 2D smoothness-constrained least-squares inversion in the instrument package; iterations were stopped when the RMS misfit stabilized (typically <1%).
Figure 3.
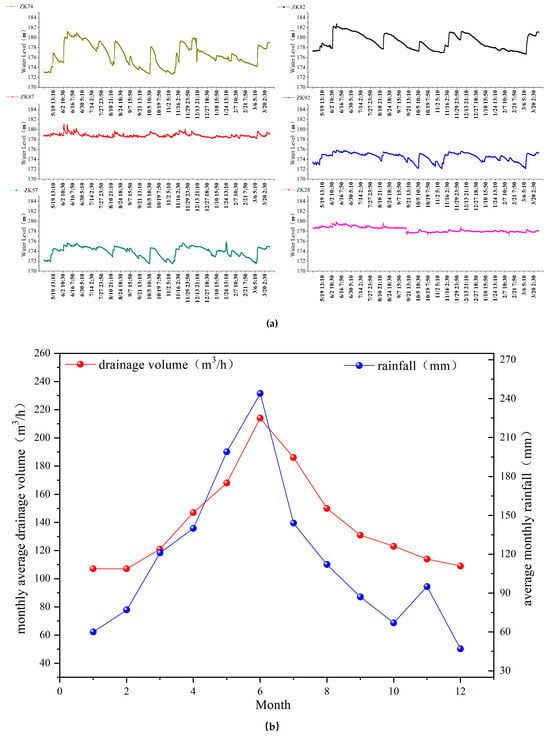
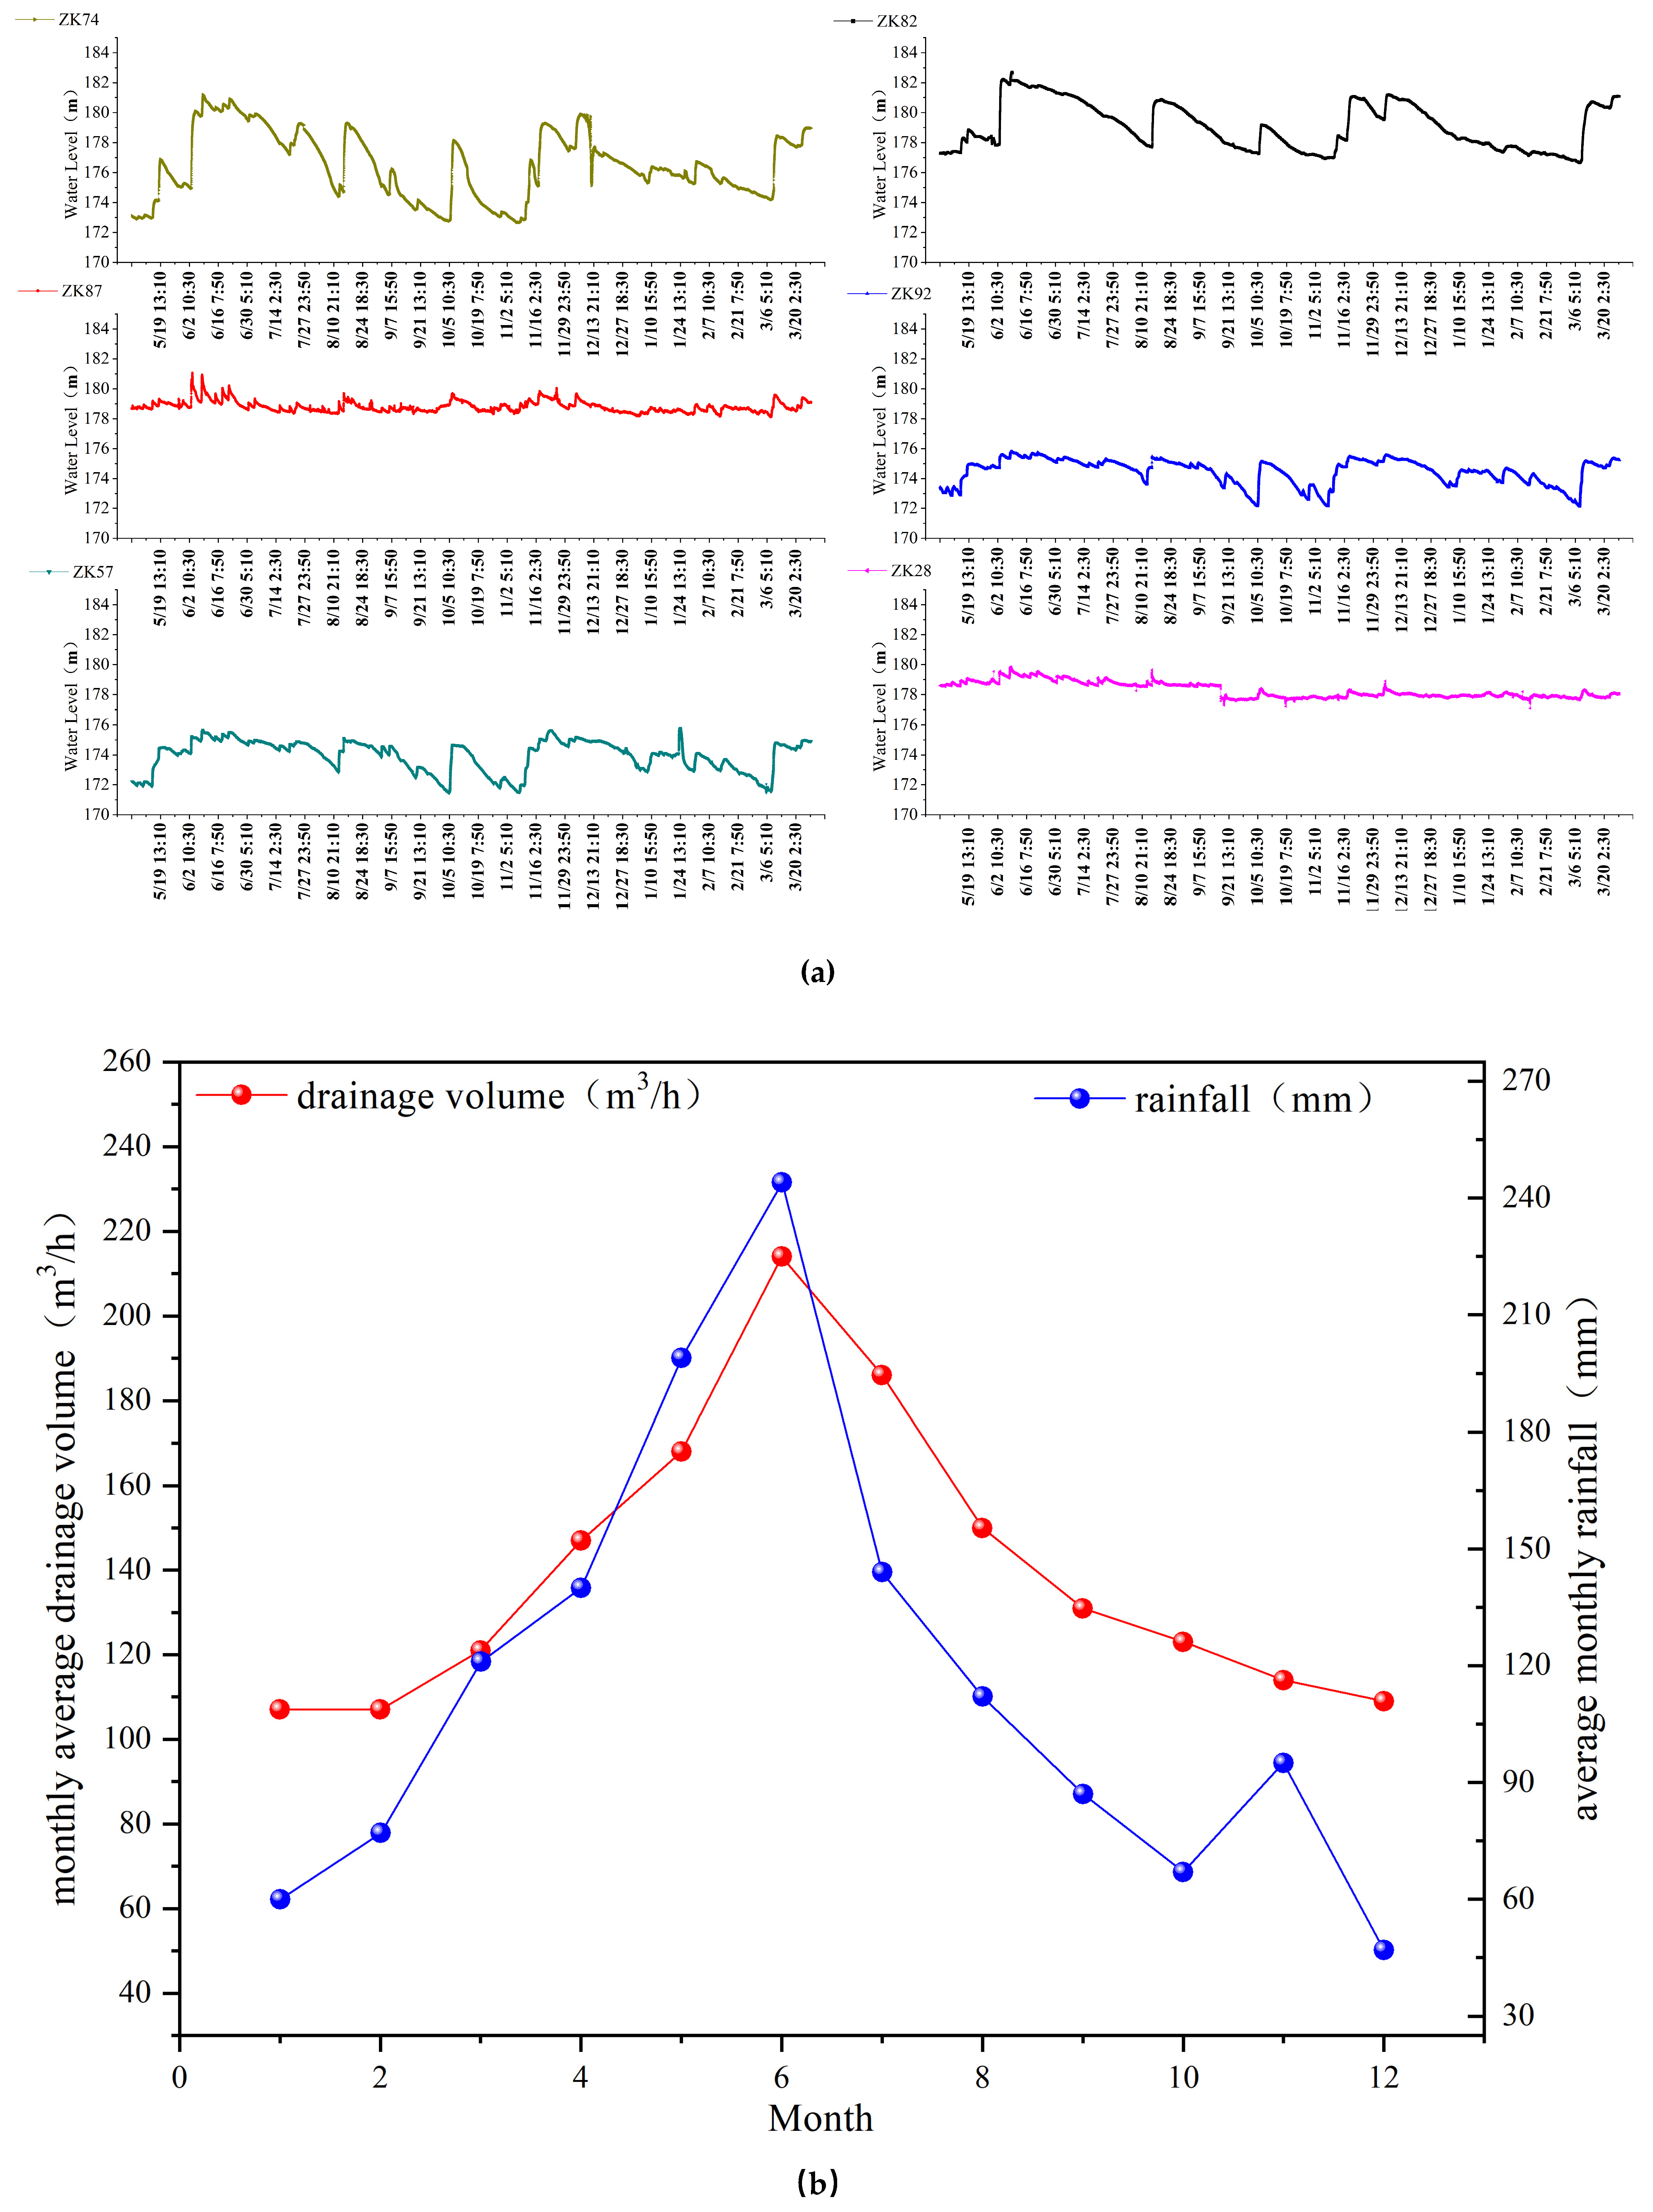
(a) Automatic Monitoring Curve of Groundwater. (Note: ZK87, ZK57, ZK82 water level fluctuations; (b) Blue curve mark rainfall periods (>100 mm/day), red curve mark mining pumping periods (200 m3/h); sensors: Solinst Levelogger Edge, accuracy ±0.01 m.).
3.1.4. Laboratory Test Data
Indoor direct shear tests on undisturbed Q4 silty clay samples (50 mm diameter) yielded cohesion values of 18–58.8 kPa and internal friction angles of 8.7–15.6°. Permeability tests (constant head method) showed that Q4 silty clay had a permeability coefficient of 5.2 × 10⁻³ m/s, while C2d dolomite (from single-hole pumping tests with recovery method at ZK87) had a permeability coefficient of 0.042 m/s. For C2d dolomite, K was interpreted from a single-well pumping and recovery test at ZK87 using the Theis recovery (Cooper–Jacob straight-line) method to estimate transmissivity (T), and then converted using K = T/b, where b is the tested saturated thickness. The obtained K (0.042 m/s) represents an effective conductivity of a highly karstified fracture–conduit interval rather than an intact dolomite matrix. Core logging of C2d dolomite revealed numerous cavities (1–5 cm diameter) and fractures, confirming well-developed karst (Table 2). In addition, the indoor direct shear tests were performed on undisturbed Q4 silty clay cylinders (50 mm diameter) under multiple normal stresses following the standard direct-shear procedure; the reported cohesion (18–58.8 kPa) and friction angle (8.7–15.6°) represent the measured range. Permeability tests were conducted using the constant-head method with replicate measurements, and the reported K values represent the mean of repeated tests. For C2d dolomite, K was obtained from single-well pumping and recovery tests at ZK87 using the Theis recovery (Cooper–Jacob) method and converted by K = T/b; the test was repeated three times (error < 5%).
Table 2.
Laboratory Test Results of Key Strata.
3.2. Methodology
3.2.1. MODFLOW Model Construction
The model was built using GMS 10.0, with simulation area coordinates ranging from X: 19,553,694 to 19,559,272 m and Y: 3,059,003 to 3,063,000 m. Grid independence tests showed that a 20 m × 20 m grid (297 columns × 200 rows) balanced accuracy and efficiency: its water level simulation error (<5%) was comparable to that of a 10 m × 10 m grid (2.1% vs. 1.8%), while reducing computational time by 60%.
Vertically, the model was divided into seven layers based on karst development intensity: Upper layers (2–3) as shallow karst zones, middle layers (4–5) as vertical infiltration zones, and lower layers (6–7) as underground runoff zones. Hydraulic conductivity values were assigned based on field and laboratory data (Table 3), with water-conducting faults assigned a 10-fold higher value (0.42 m/s) and water-blocking faults a 10-fold lower value (0.0042 m/s). To represent the matrix–fracture/conduit dual-medium concept, the C2d dolomite was parameterized using zoned hydraulic properties (karstified intervals versus less-karstified matrix) within an equivalent porous-media (EPM) framework.
Table 3.
Permeability Coefficients of Various Strata.
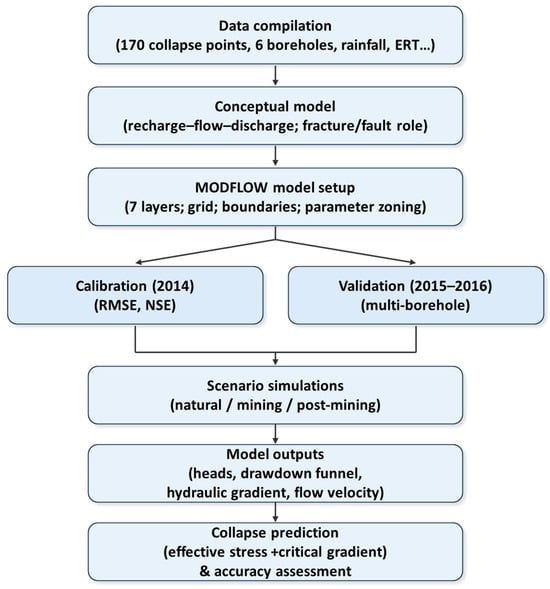
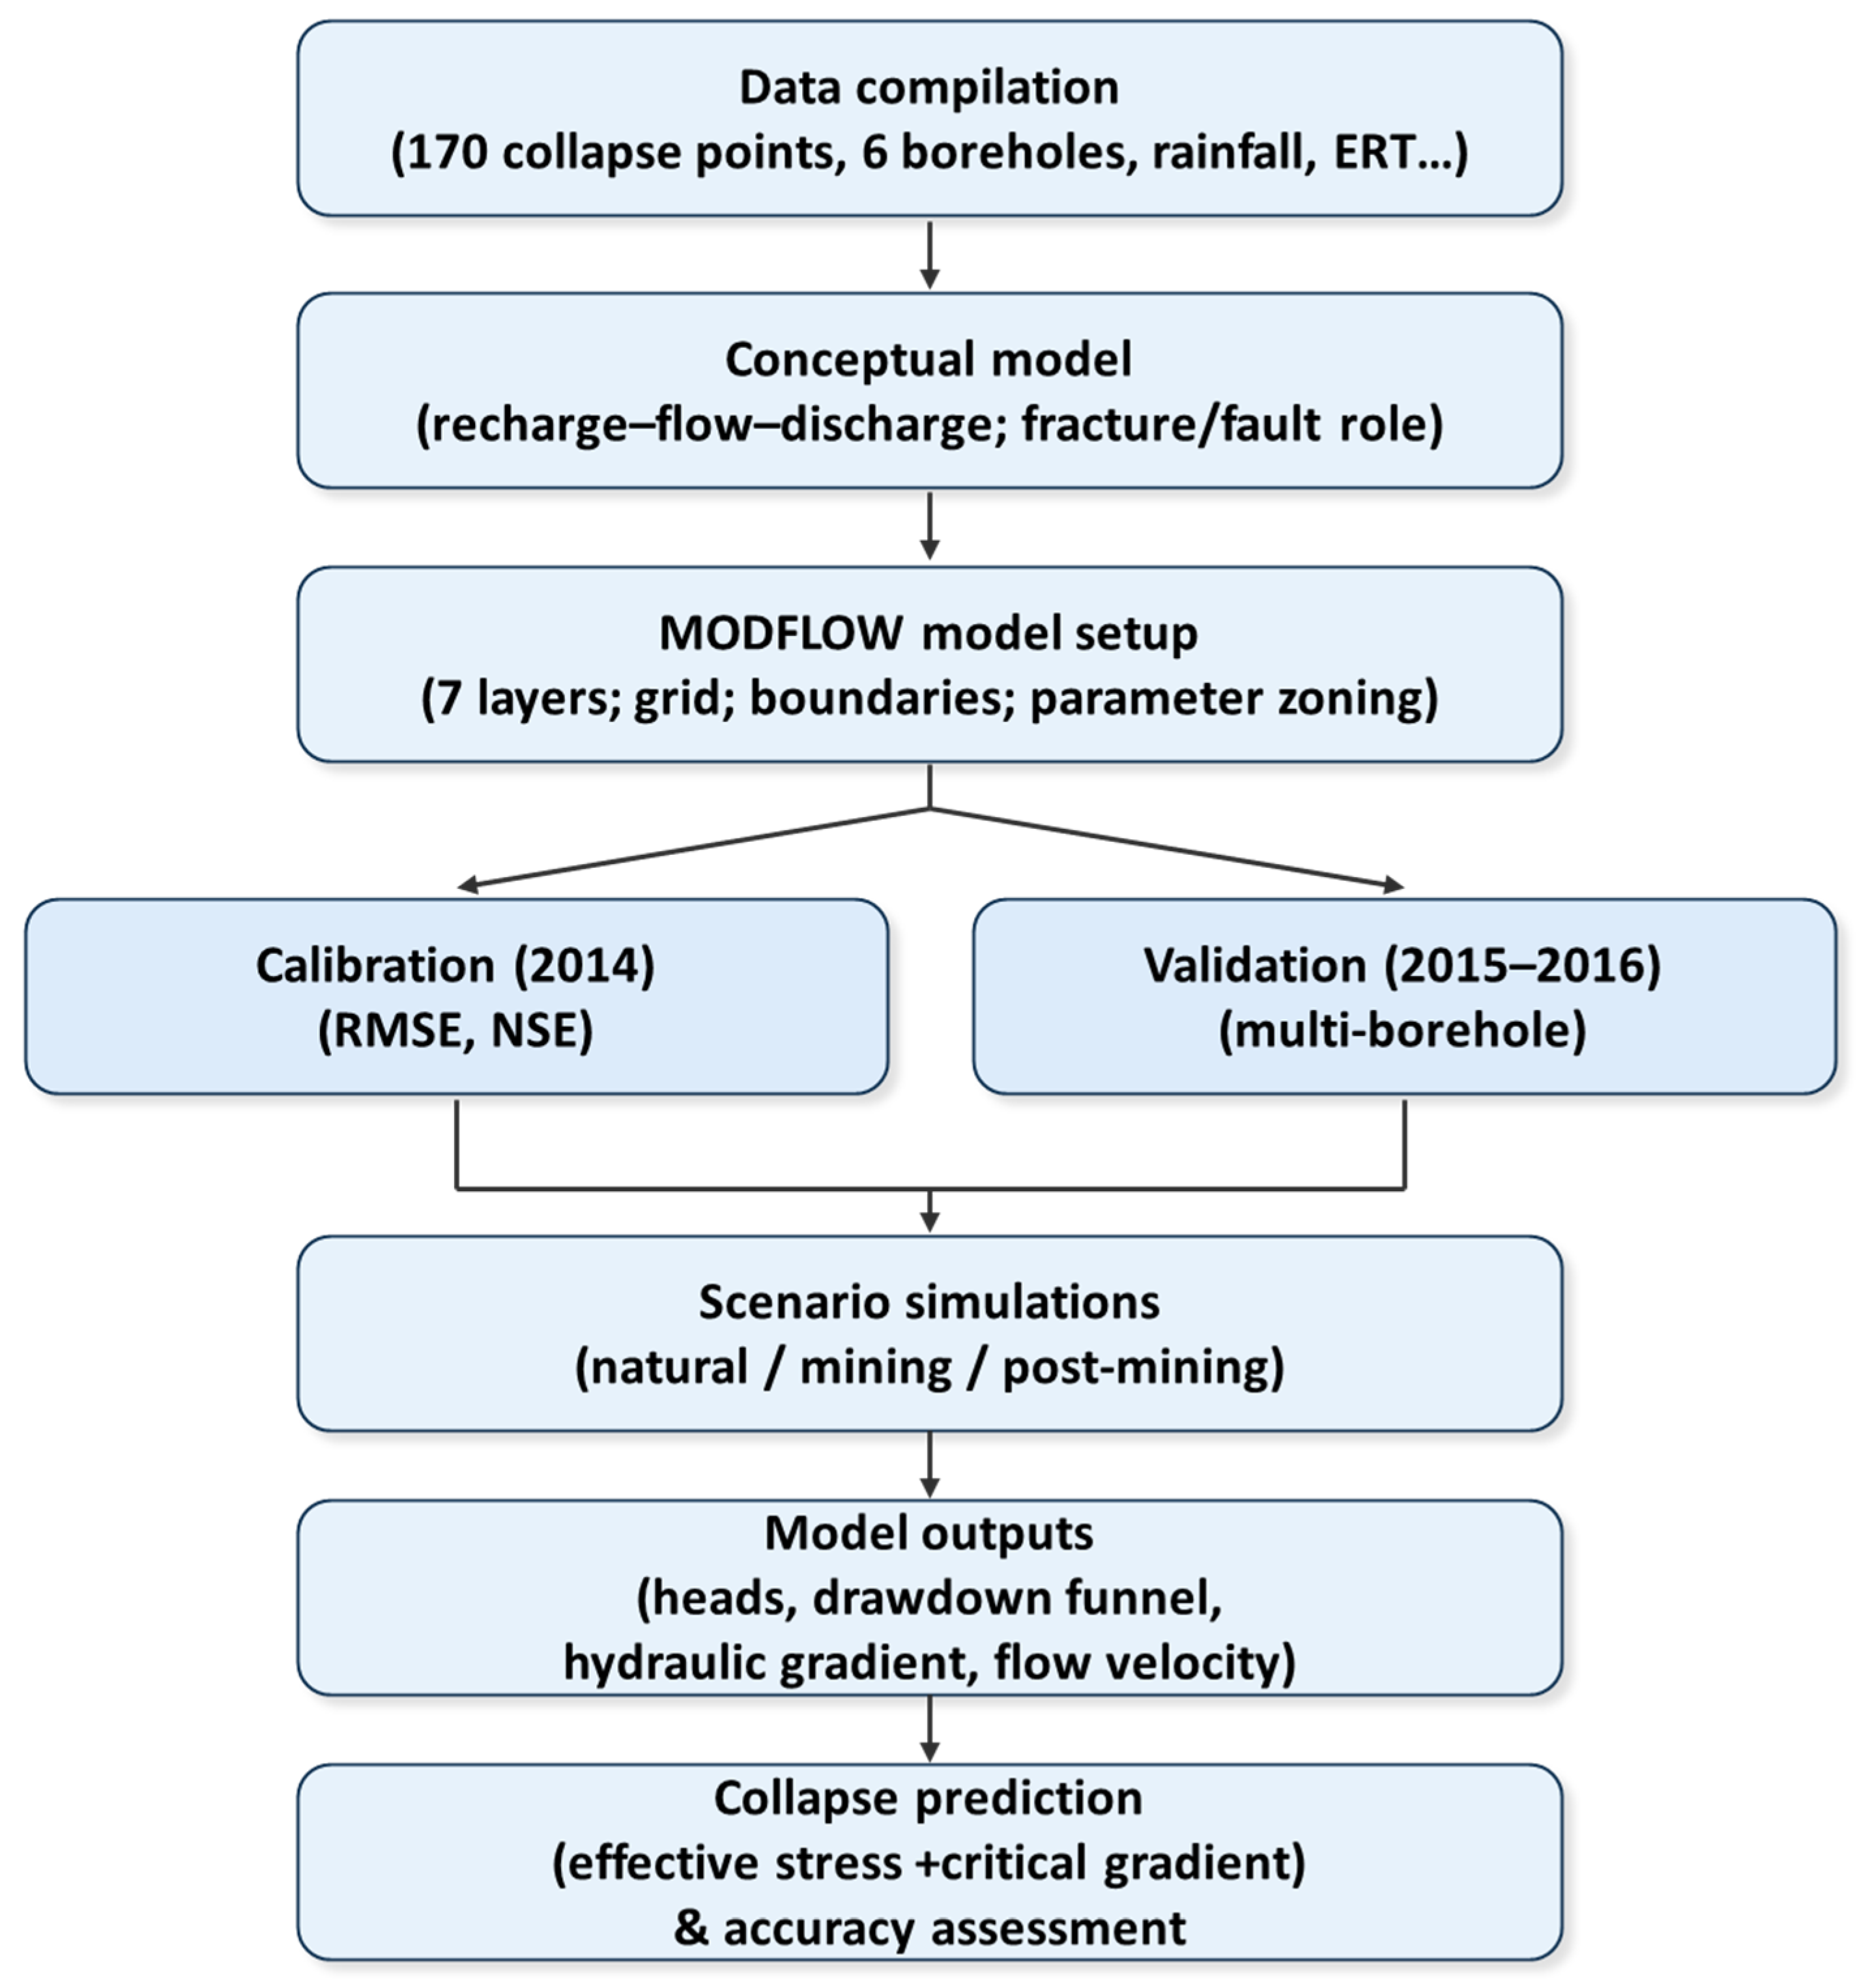
Figure 4 summarizes the end-to-end workflow used in this study. We first compiled multi-source datasets, including the inventory of 170 collapse points, groundwater levels from six boreholes, long-term rainfall records, ERT profiles, and laboratory hydro-mechanical measurements, and then synthesized these observations into a site-specific conceptual model that defines the recharge–flow–discharge processes and the controlling role of fractures/faults. Based on this conceptualization, a seven-layer MODFLOW model was constructed with appropriate grid discretization, boundary conditions, and parameter zoning consistent with the mapped hydrostratigraphic units and structural features. Model parameters were estimated through a transient calibration against the 2014 groundwater records (quantified using RMSE and NSE) and subsequently validated using the independent multi-borehole dataset for 2015–2016. The calibrated model was then applied to scenario simulations representing natural, mining, and post-mining conditions to quantify key outputs, including hydraulic head distribution, drawdown-funnel geometry, hydraulic gradients, and flow velocities. Finally, these physically based model outputs were integrated with effective-stress considerations and the critical hydraulic gradient criterion to derive the collapse-prediction formulation.
Figure 4.
Workflow of MODFLOW modeling adopted in this study.
Boundary Conditions:
Lateral boundaries: The western boundary (Liangxi River) was set as a constant head boundary, using monthly average water levels (175.2–178.6 m) verified by trend analysis to have an annual variation of <2% (standard deviation 0.31 m). The eastern boundary (groundwater divide) was also set as a constant head boundary (182.5–185.0 m), based on 2014–2016 static water level data from 6 monitoring boreholes (ZK57, ZK87, etc.) with a spatial variation of <3% (no significant seasonal fluctuations) verified by Kriging interpolation. The northern and southern boundaries were set as no-flow boundaries, constrained by regional reverse faults (low water conductivity, K = 0.0042 m/s) with groundwater exchange <0.01 m3/d.
Vertical boundaries: Bounded by the C1c quartz sandstone (impermeable layer, K = 3.6 × 10⁻⁷ m/s), verified via core permeability tests and borehole water level observations to have no vertical groundwater exchange.
Rainfall infiltration coefficients were zoned into three categories and seven subzones (Table 4), calibrated using soil moisture data: Bare bedrock zones (I1–I3) had lower coefficients (0.05) due to low water retention, while valley plain zones (III1–III3) had higher values (0.25) due to thicker soil cover. Calibration was validated via soil moisture balance, where simulated infiltration matched measured soil moisture increments (RMSE = 0.03 m3/m3). MODFLOW provides a robust transient groundwater-flow framework and allows calibration/validation against long-term head observations, which matches the objective of this study (delineating seepage-field evolution and drawdown-funnel development under drainage). However, because the karst aquifer is represented here using an equivalent porous-media (EPM) approach, the model does not explicitly simulate turbulent conduit flow and rapid preferential transport in well-developed conduits; therefore, the results should be interpreted as effective, minefield-scale behavior.
Table 4.
Rainfall Infiltration Coefficient Zoning.
3.2.2. Model Calibration and Validation
The calibration in 2014 used data from ZK57 and ZK87, adjusting hydraulic conductivity and rainfall infiltration coefficients to achieve RMSE = 0.32 m and NSE = 0.85. The validation during 2015–2016 used multi-borehole data, yielding RMSE = 0.41 m and NSE = 0.81 (R2 = 0.91 for ZK87, R2 = 0.88 for ZK57). Per Moriasi et al. (2007), NSE > 0.8 and RMSE < 0.5 m indicate “good” model performance, confirming the model’s reliability.
Sensitivity analysis via the Sobol method showed the following parameter influence ranking: mining pumping rate Q (S = 0.72, 40.5% variance contribution) > C2d aquifer K (S = 0.58, 32.1%) > rainfall infiltration α (S = 0.31, 17.8%) > fault K (S = 0.25, 9.6%) (Table 5). Note: Sensitivity Index (S) ranges from 0 to 1, with S > 0.5 indicating high sensitivity to model output.
Table 5.
Precondition Parameters for Collapse Prediction Model.
3.2.3. Collapse Prediction Model
Based on Terzaghi’s effective stress principle and the Theis solution for transient pumping-induced drawdown, the collapse prediction formulation is derived and presented below in accordance with the journal template. Terzaghi’s effective stress can be written as:
where σ′ is effective stress, is total stress, and is pore-water pressure. As ( is the unit weight of water and h is hydraulic head), a decrease in h reduces u and increases σ′. For a given location, the drawdown is defined as the decline in hydraulic head relative to the pre-drainage state:
The pumping-induced drawdown can be estimated using the Theis solution for a confined aquifer:
where is drawdown (m), is pumping/drainage rate (m3/s), is transmissivity (m2/s), is the Theis well function, r is radial distance (m), t is time since pumping started (s), and is the aquifer storage coefficient (–). Using ( is hydraulic conductivity, is aquifer thickness), Equation (3) provides the drawdown scaling with (). Following previous studies [22,23,32,33], the expected number of collapse events is assumed to increase exponentially with drainage-driven drawdown, so that varies linearly with . Thus, the collapse prediction formula is expressed as:
where is the predicted number of karst collapse events (dimensionless count), K is hydraulic conductivity (m/s), is aquifer thickness (m), is pumping/drainage rate (m3/s), is drawdown at the target location (m) defined by Equation (2) (note that S here denotes drawdown, not the storage coefficient), n is the soil cave filling rate (–), is the well radius (m), is the effective rainfall infiltration term adopted in this study (Table 5), and is the initial groundwater level (m) prior to drainage (Table 5). Parameter values in Equation (4) were determined based on the preconditions detailed in Table 5. Validation using 2014–2015 measured data (32 actual collapse events, 28–35 predicted events) yielded an accuracy of 87.5–90.6% (conservatively 87.5%). The critical hydraulic gradient (in) was calculated using the shear strength parameters of Q4 silty clay as:
where is the submerged unit weight of the soil (kN/m3), is the internal friction angle (°), and is the slope angle (°). Using = 18 kN/m3, = 9.81 kN/m3, and = 30°, the calculated = 0.85; values exceeding this threshold indicate a high collapse risk.
4. Results and Analysis
4.1. Karst Collapse Distribution Characteristics
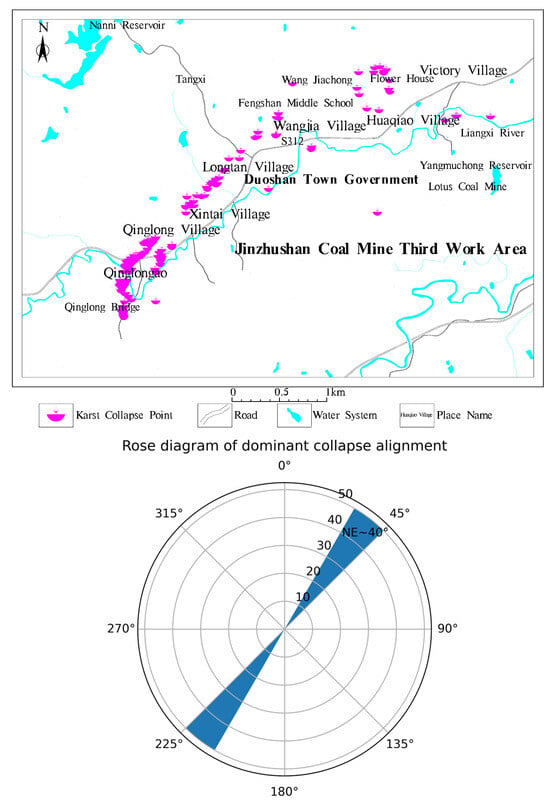
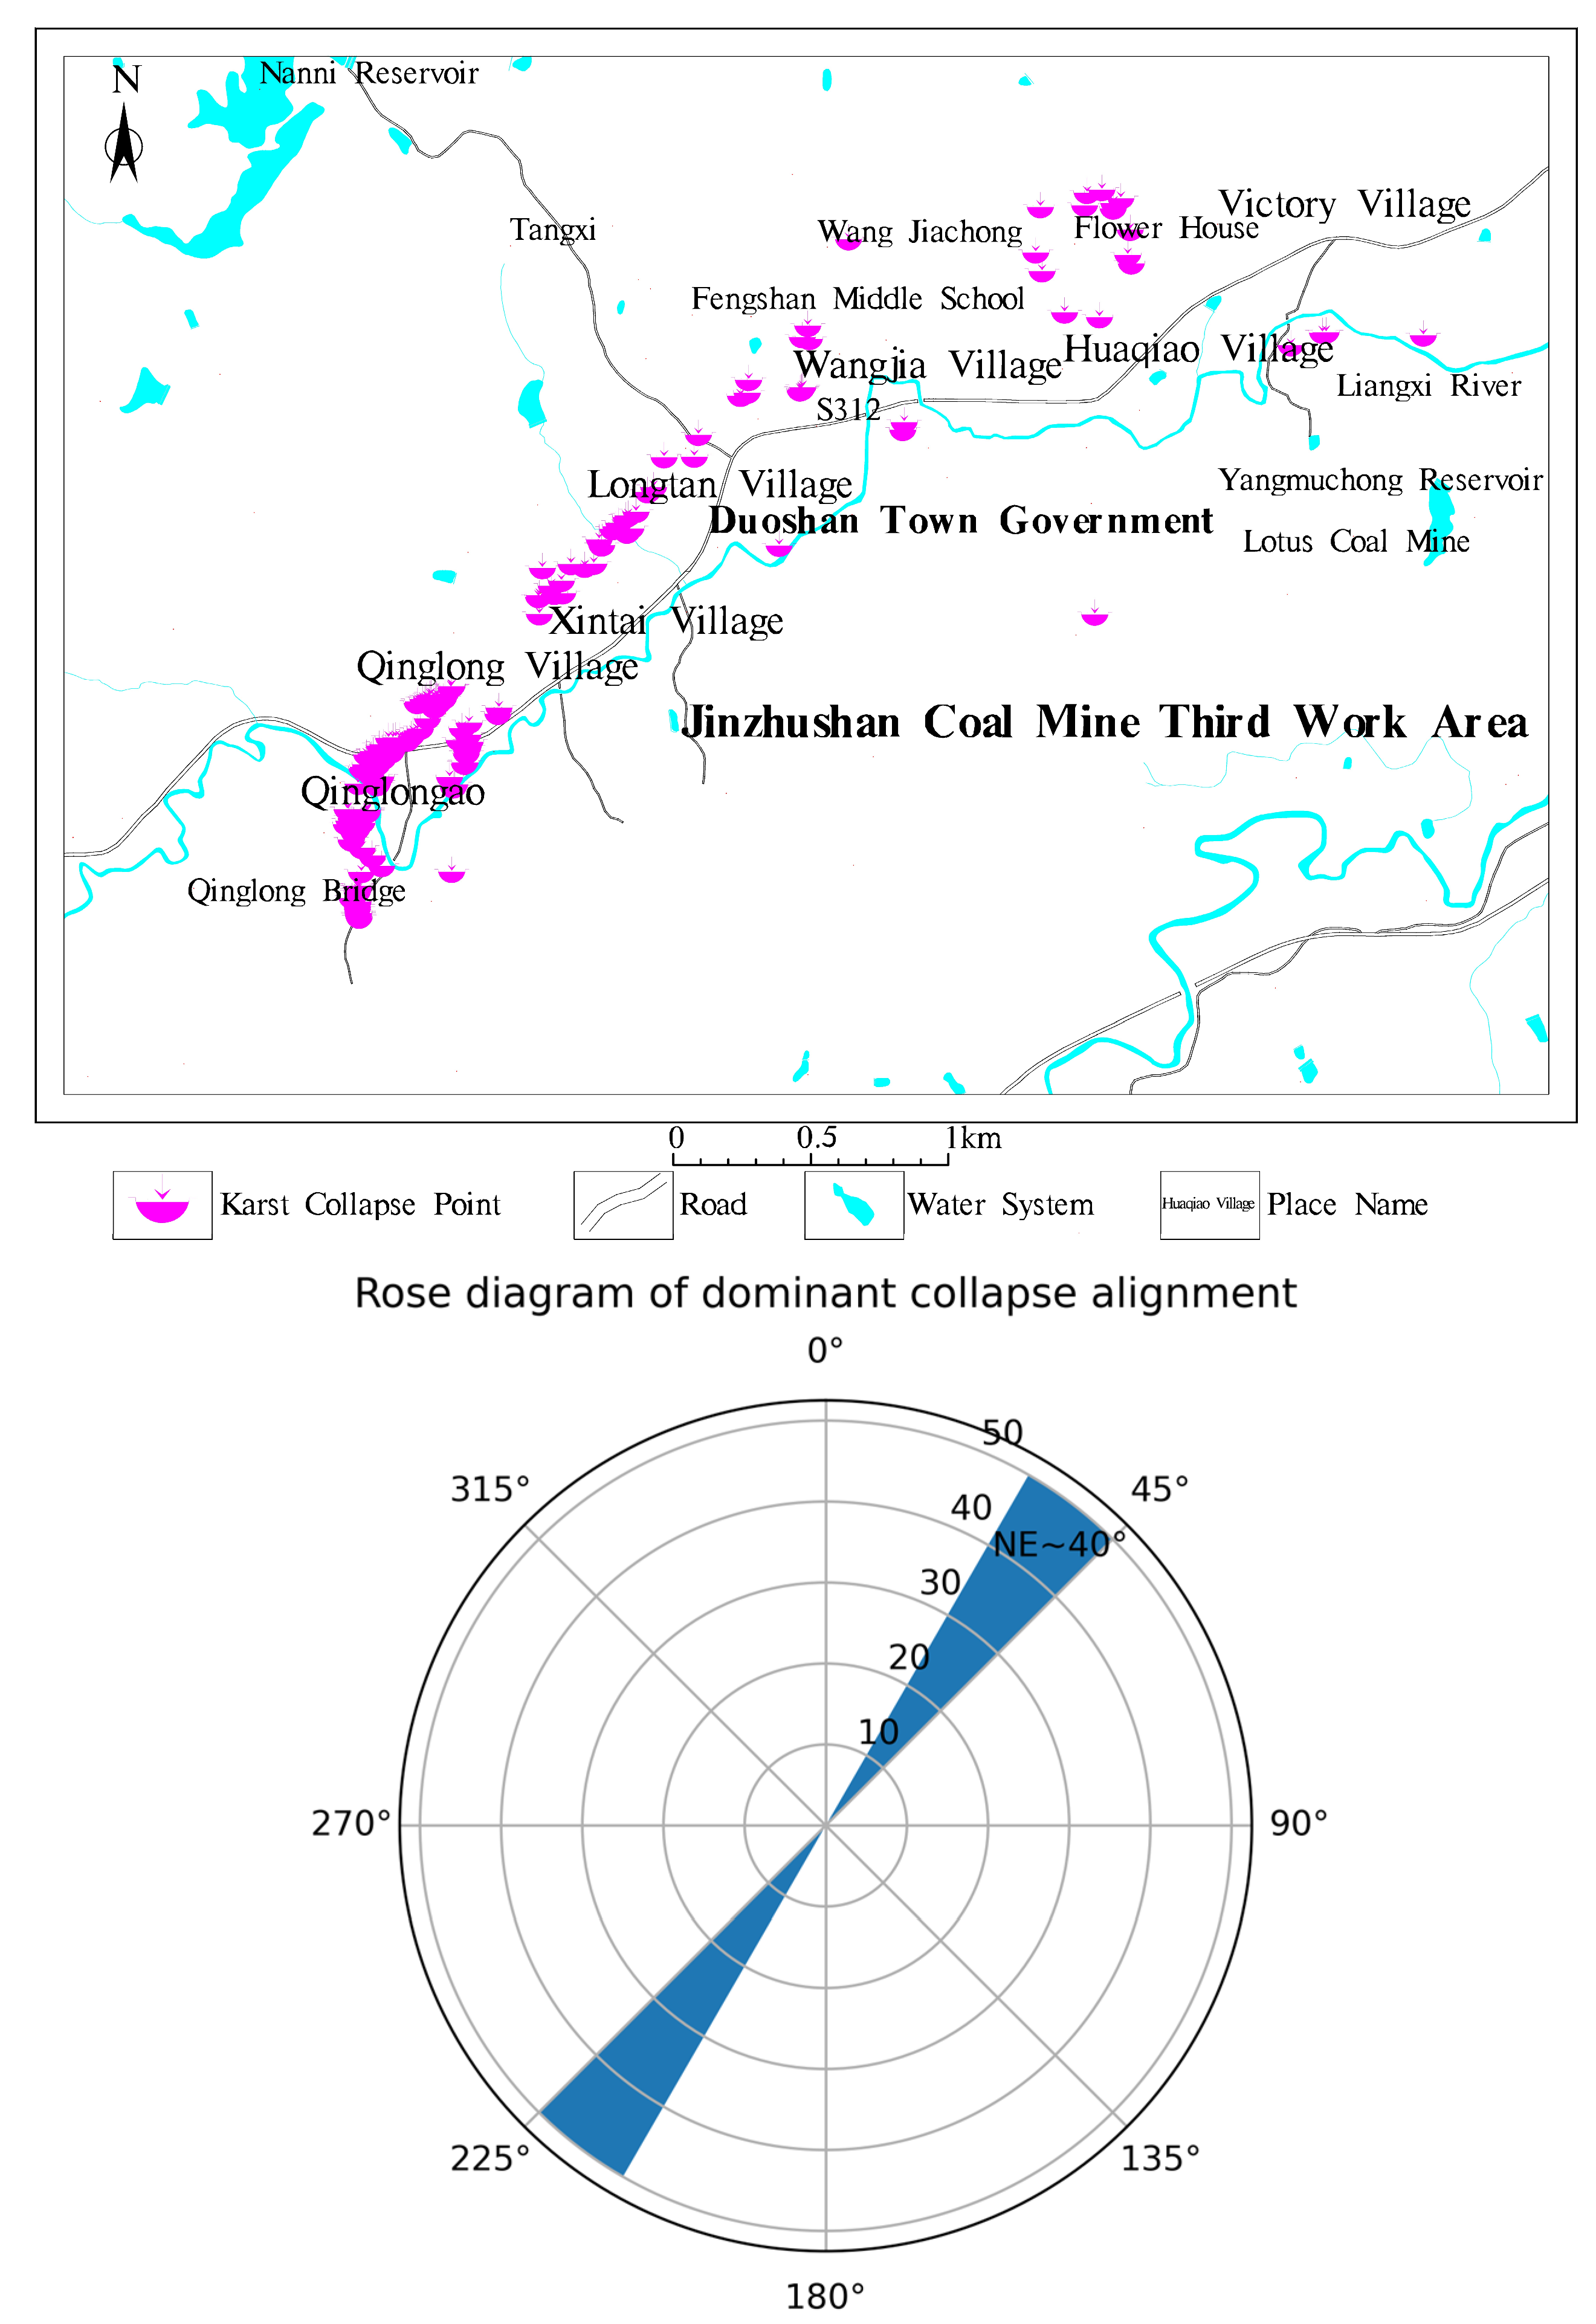
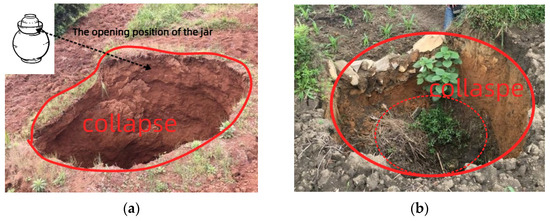
Collapses were concentrated in Q4 silty clay with a thickness of 2.0–14.0 m, with 62% occurring in layers 6–10 m thick. Diameters ranged from 1.0 to 51.2 m, and depths from 0.3 to 9.7 m. Collapse clusters showed a linear distribution along the NE 40° direction, consistent with NE-trending faults (Figure 3), forming a 7400 m long zone. A rose diagram of the dominant azimuth extracted from the collapse inventory is provided to quantitatively show the preferred NE trend (Figure 4).
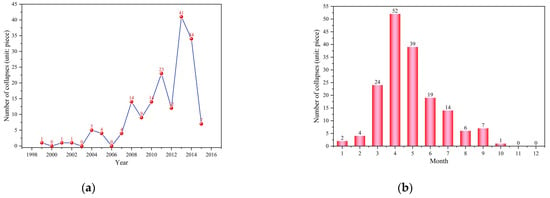
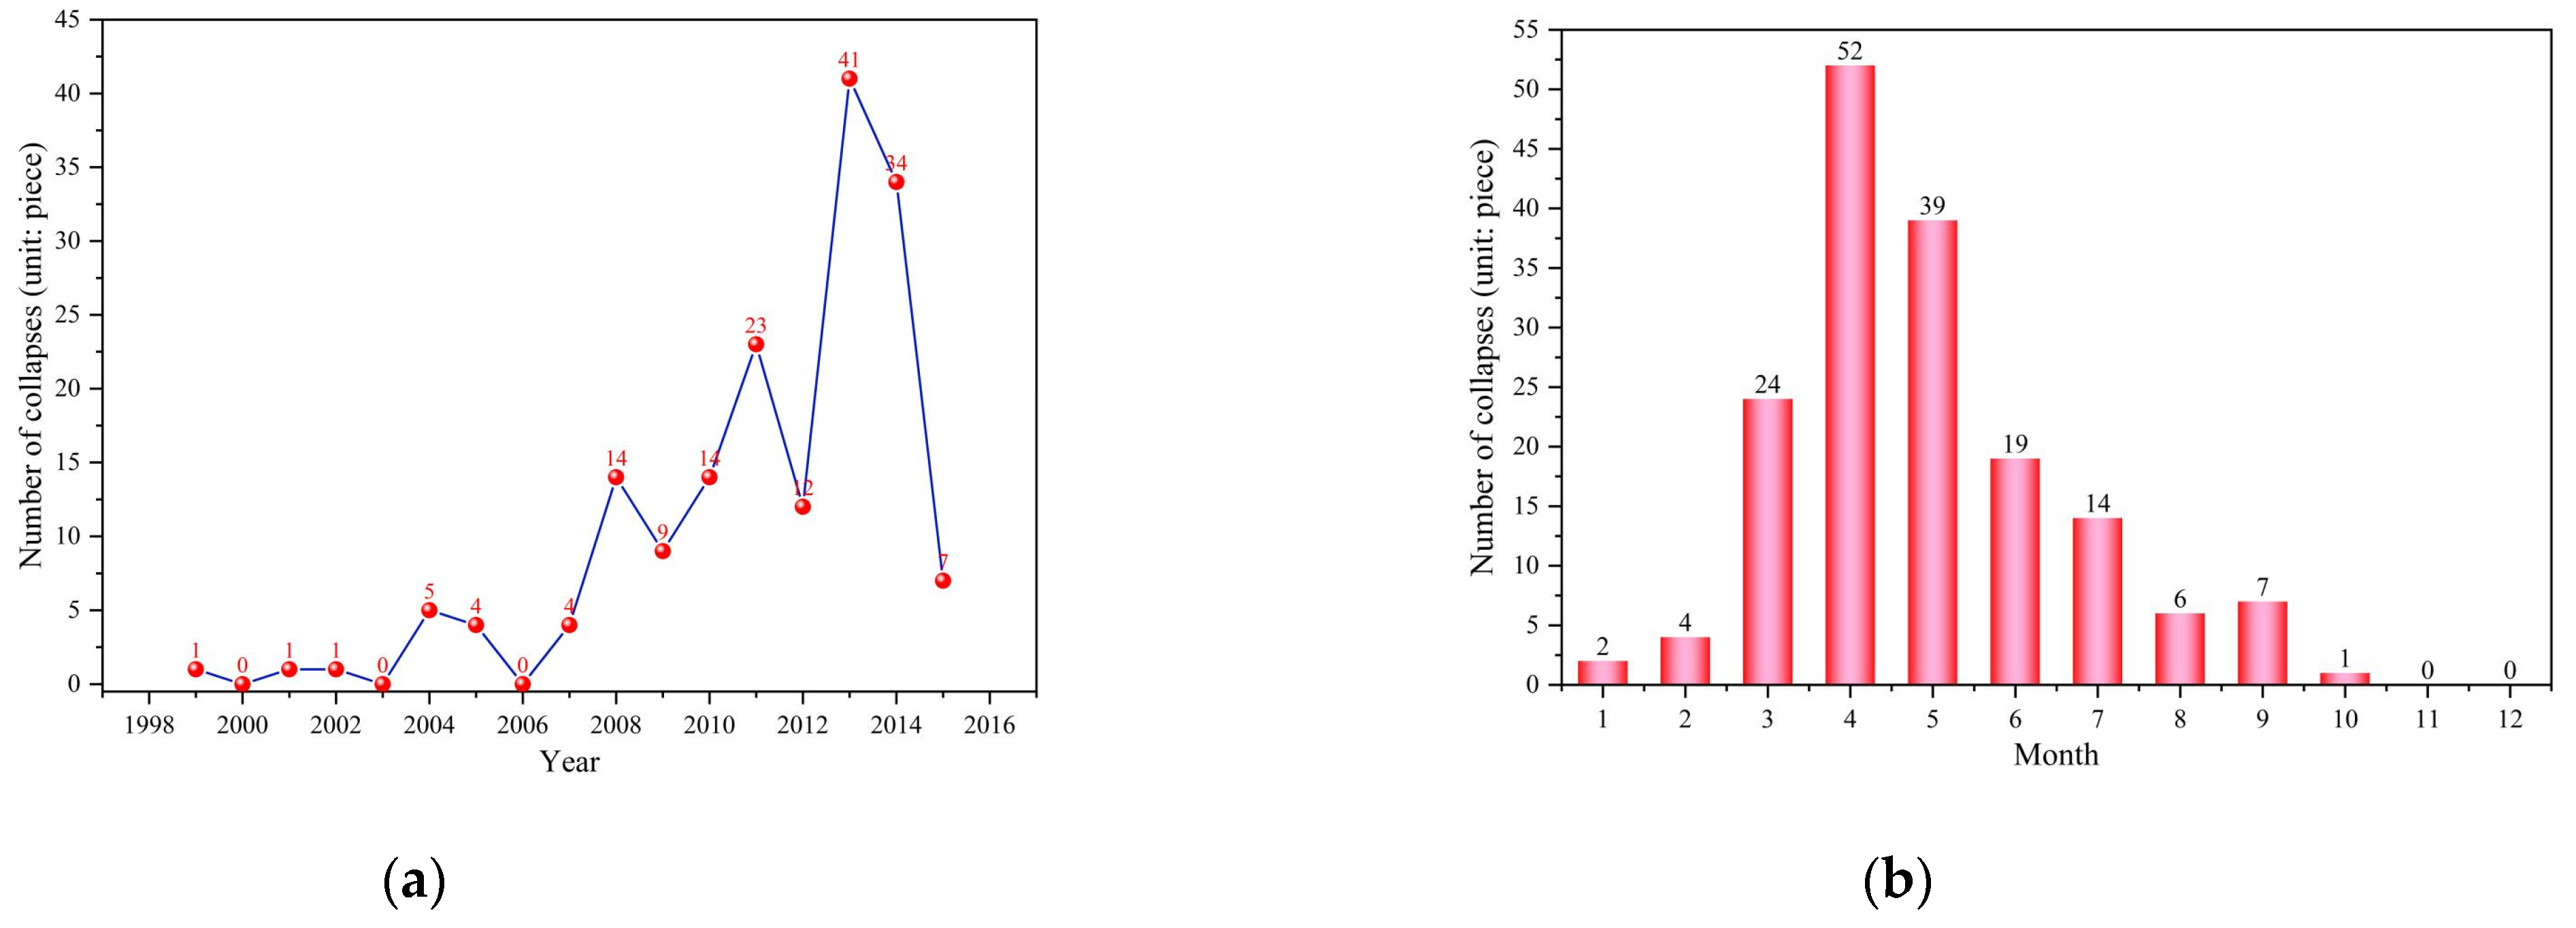
Planar shapes of collapses included circular, elliptical, and beaded forms; cross-sections evolved from altar-shaped (early stage: steep upper part, gentle lower part), to columnar (middle stage: vertical walls), to funnel-shaped (late stage: wide upper part, narrow lower part) (Figure 5). Temporally, collapses peaked in 2013 (41 events) and during months 3–7 (65% of annual total), coinciding with rainy seasons (Figure 6).
Figure 5.
Distribution of Collapse Points. Note: NE 40° linear distribution; dark zones denote strongly karst-developed areas (<50 Ω·m), and dark zones mark NE-trending faults.
Figure 6.
Temporal Distribution of Collapses. (a) Line chart of collapse number by year (x-axis: 2010–2016); (b) histogram of collapse number by month. (Note: Error bars represent ±1 standard deviation; n = 3 replicates per time unit.).
4.2. Seepage Field Simulation Results
Groundwater levels exhibited “steep rise, slow fall” behavior: heavy rainfall (>100 mm/day) caused a 2.8–3.1 m rise within 2–3 days; mining pumping (200 m3/h) led to a 1.9–2.2 m drop within 1 week. A 1.2 km diameter drawdown funnel formed in Qinglong Village, overlapping with 89% of collapse points (Figure 7). Long-term mining caused a gradual decline in groundwater levels, with an average annual drawdown of 0.8 m.
Figure 7.
Three-Stage Evolution of Karst Collapse Pits. (a) Early altar-shaped (TX-PS-979, depth 5.1 m); (b) middle columnar (TX-PS-980, depth 6.3 m).
Comparative Analysis of Seepage Field Evolution (Figure 8):
Figure 8.
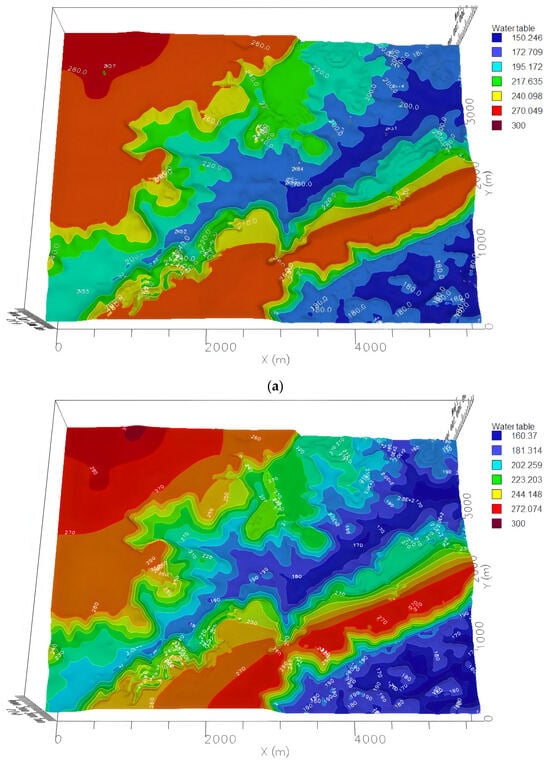
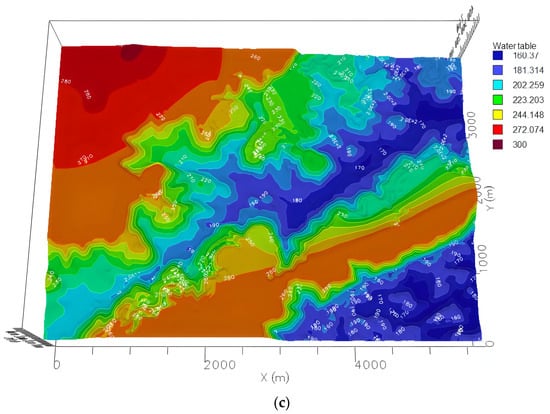
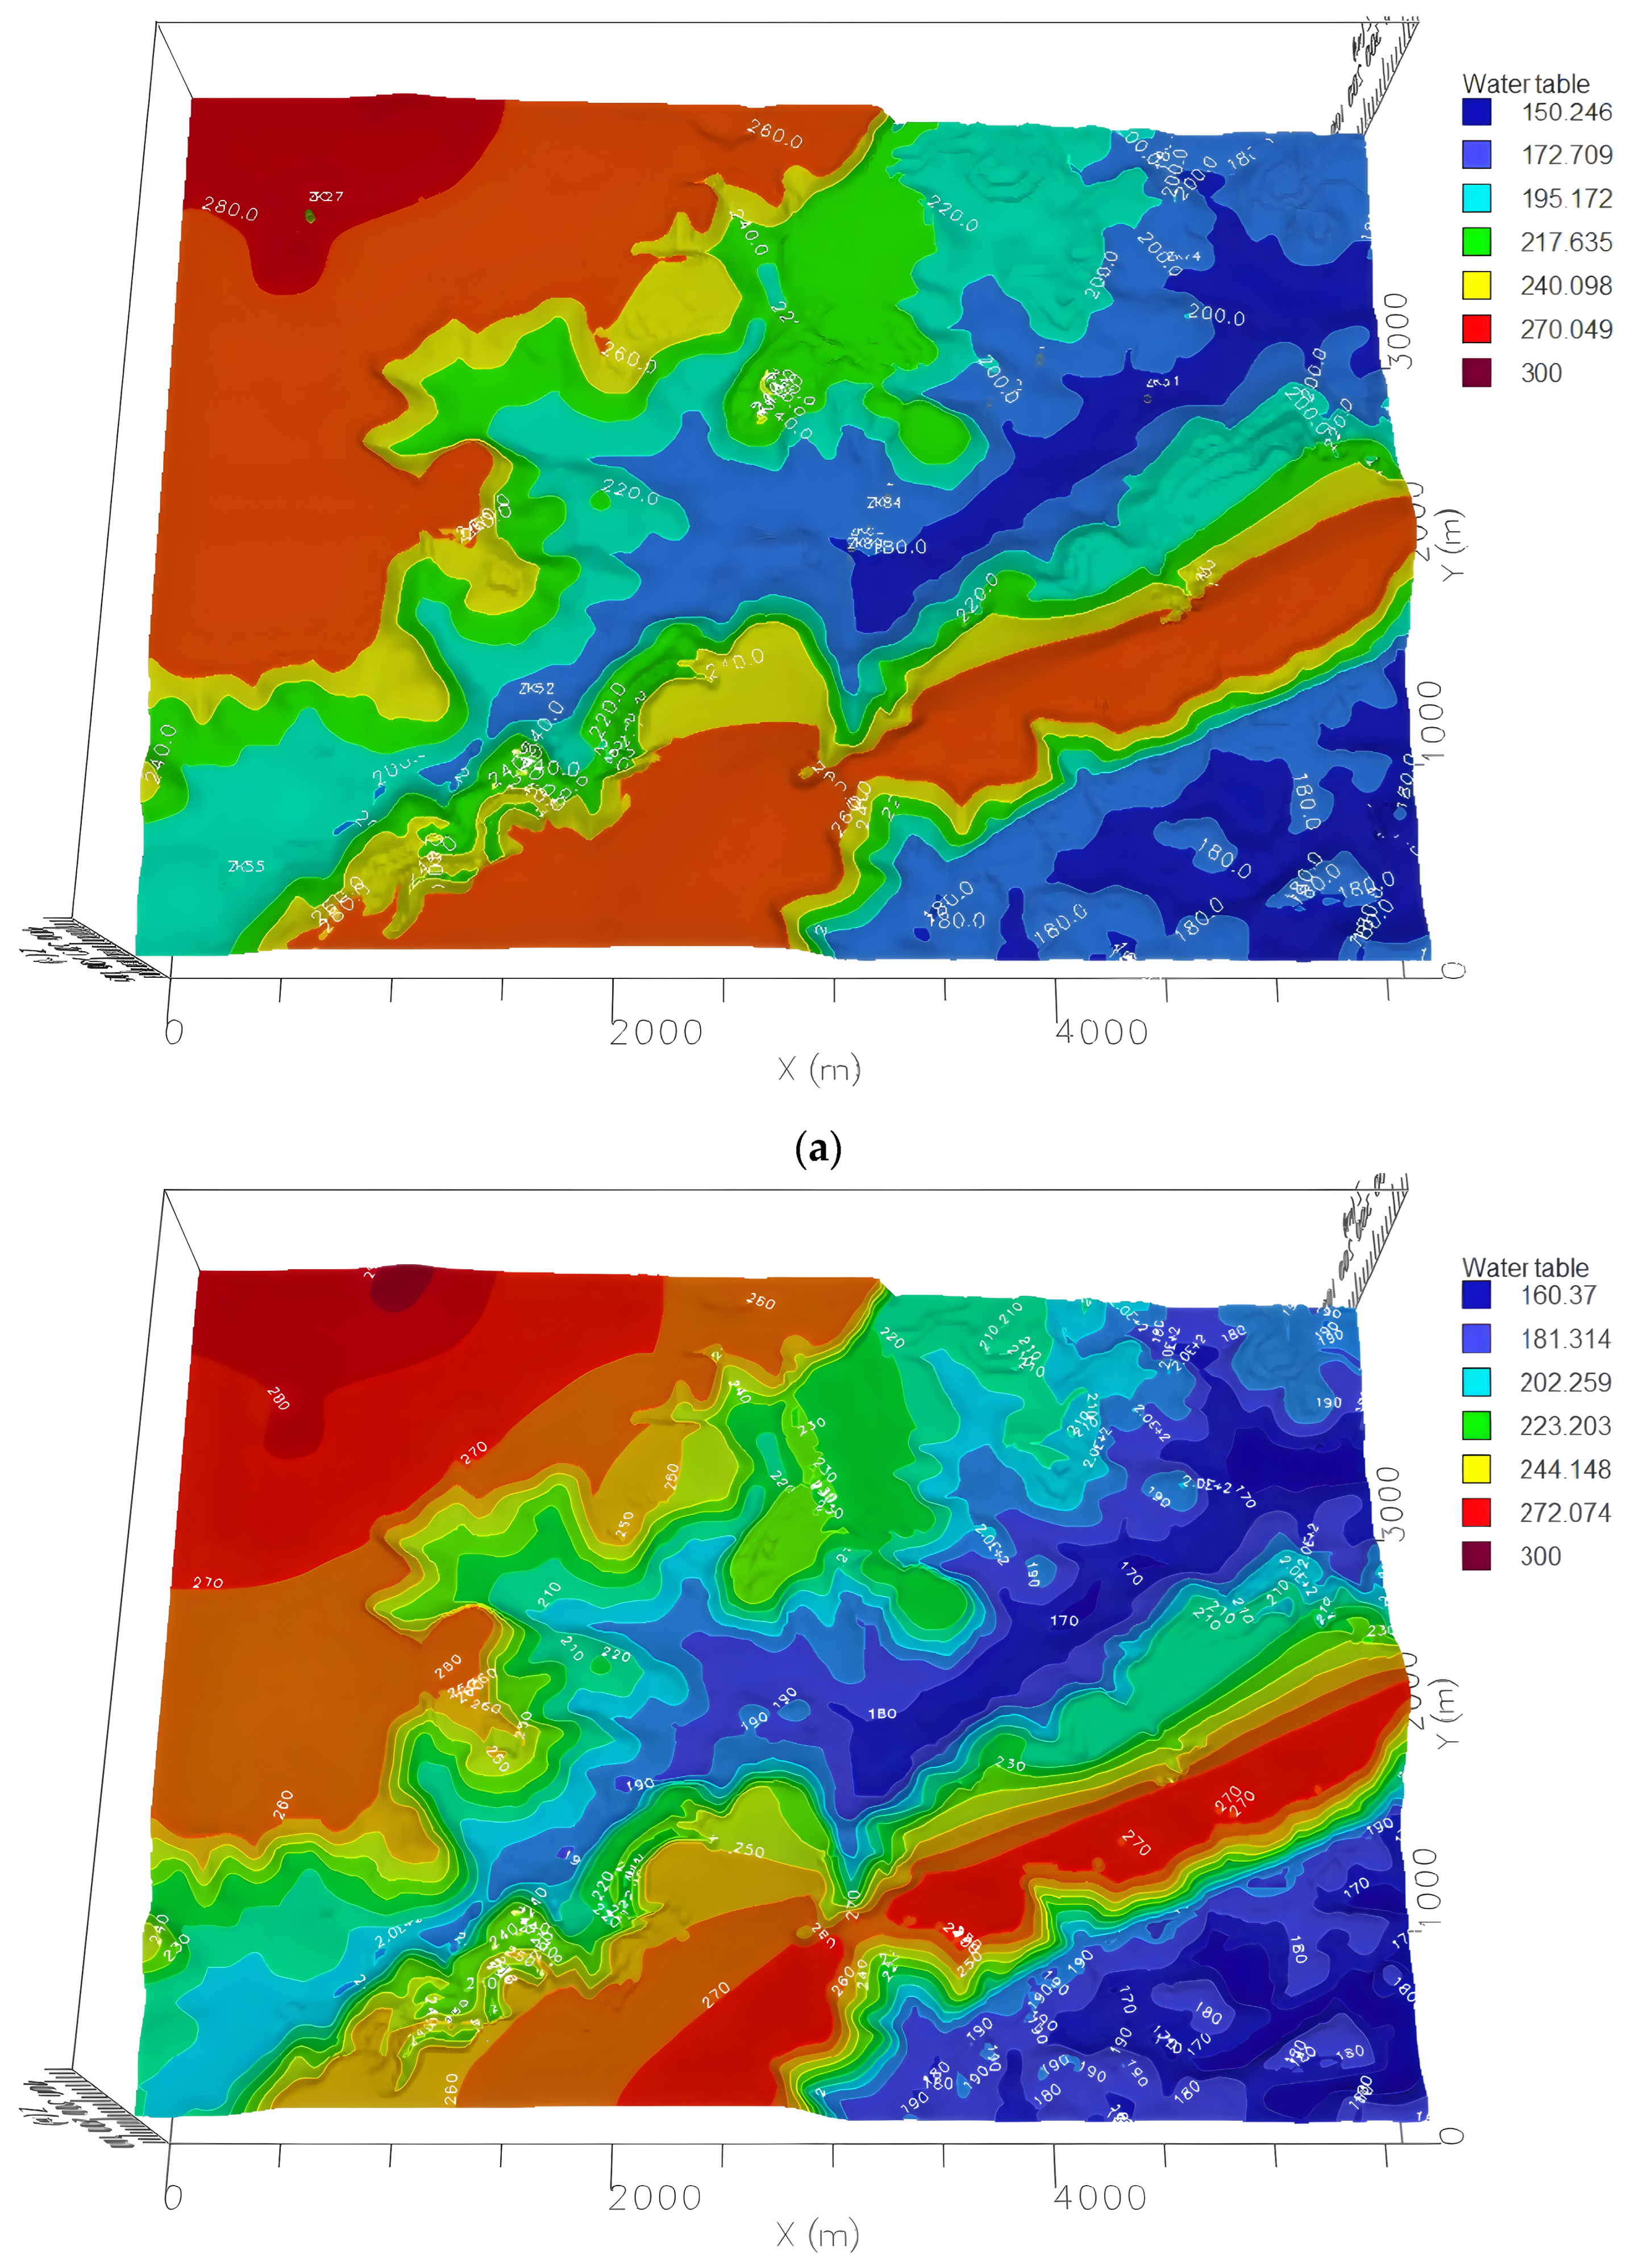
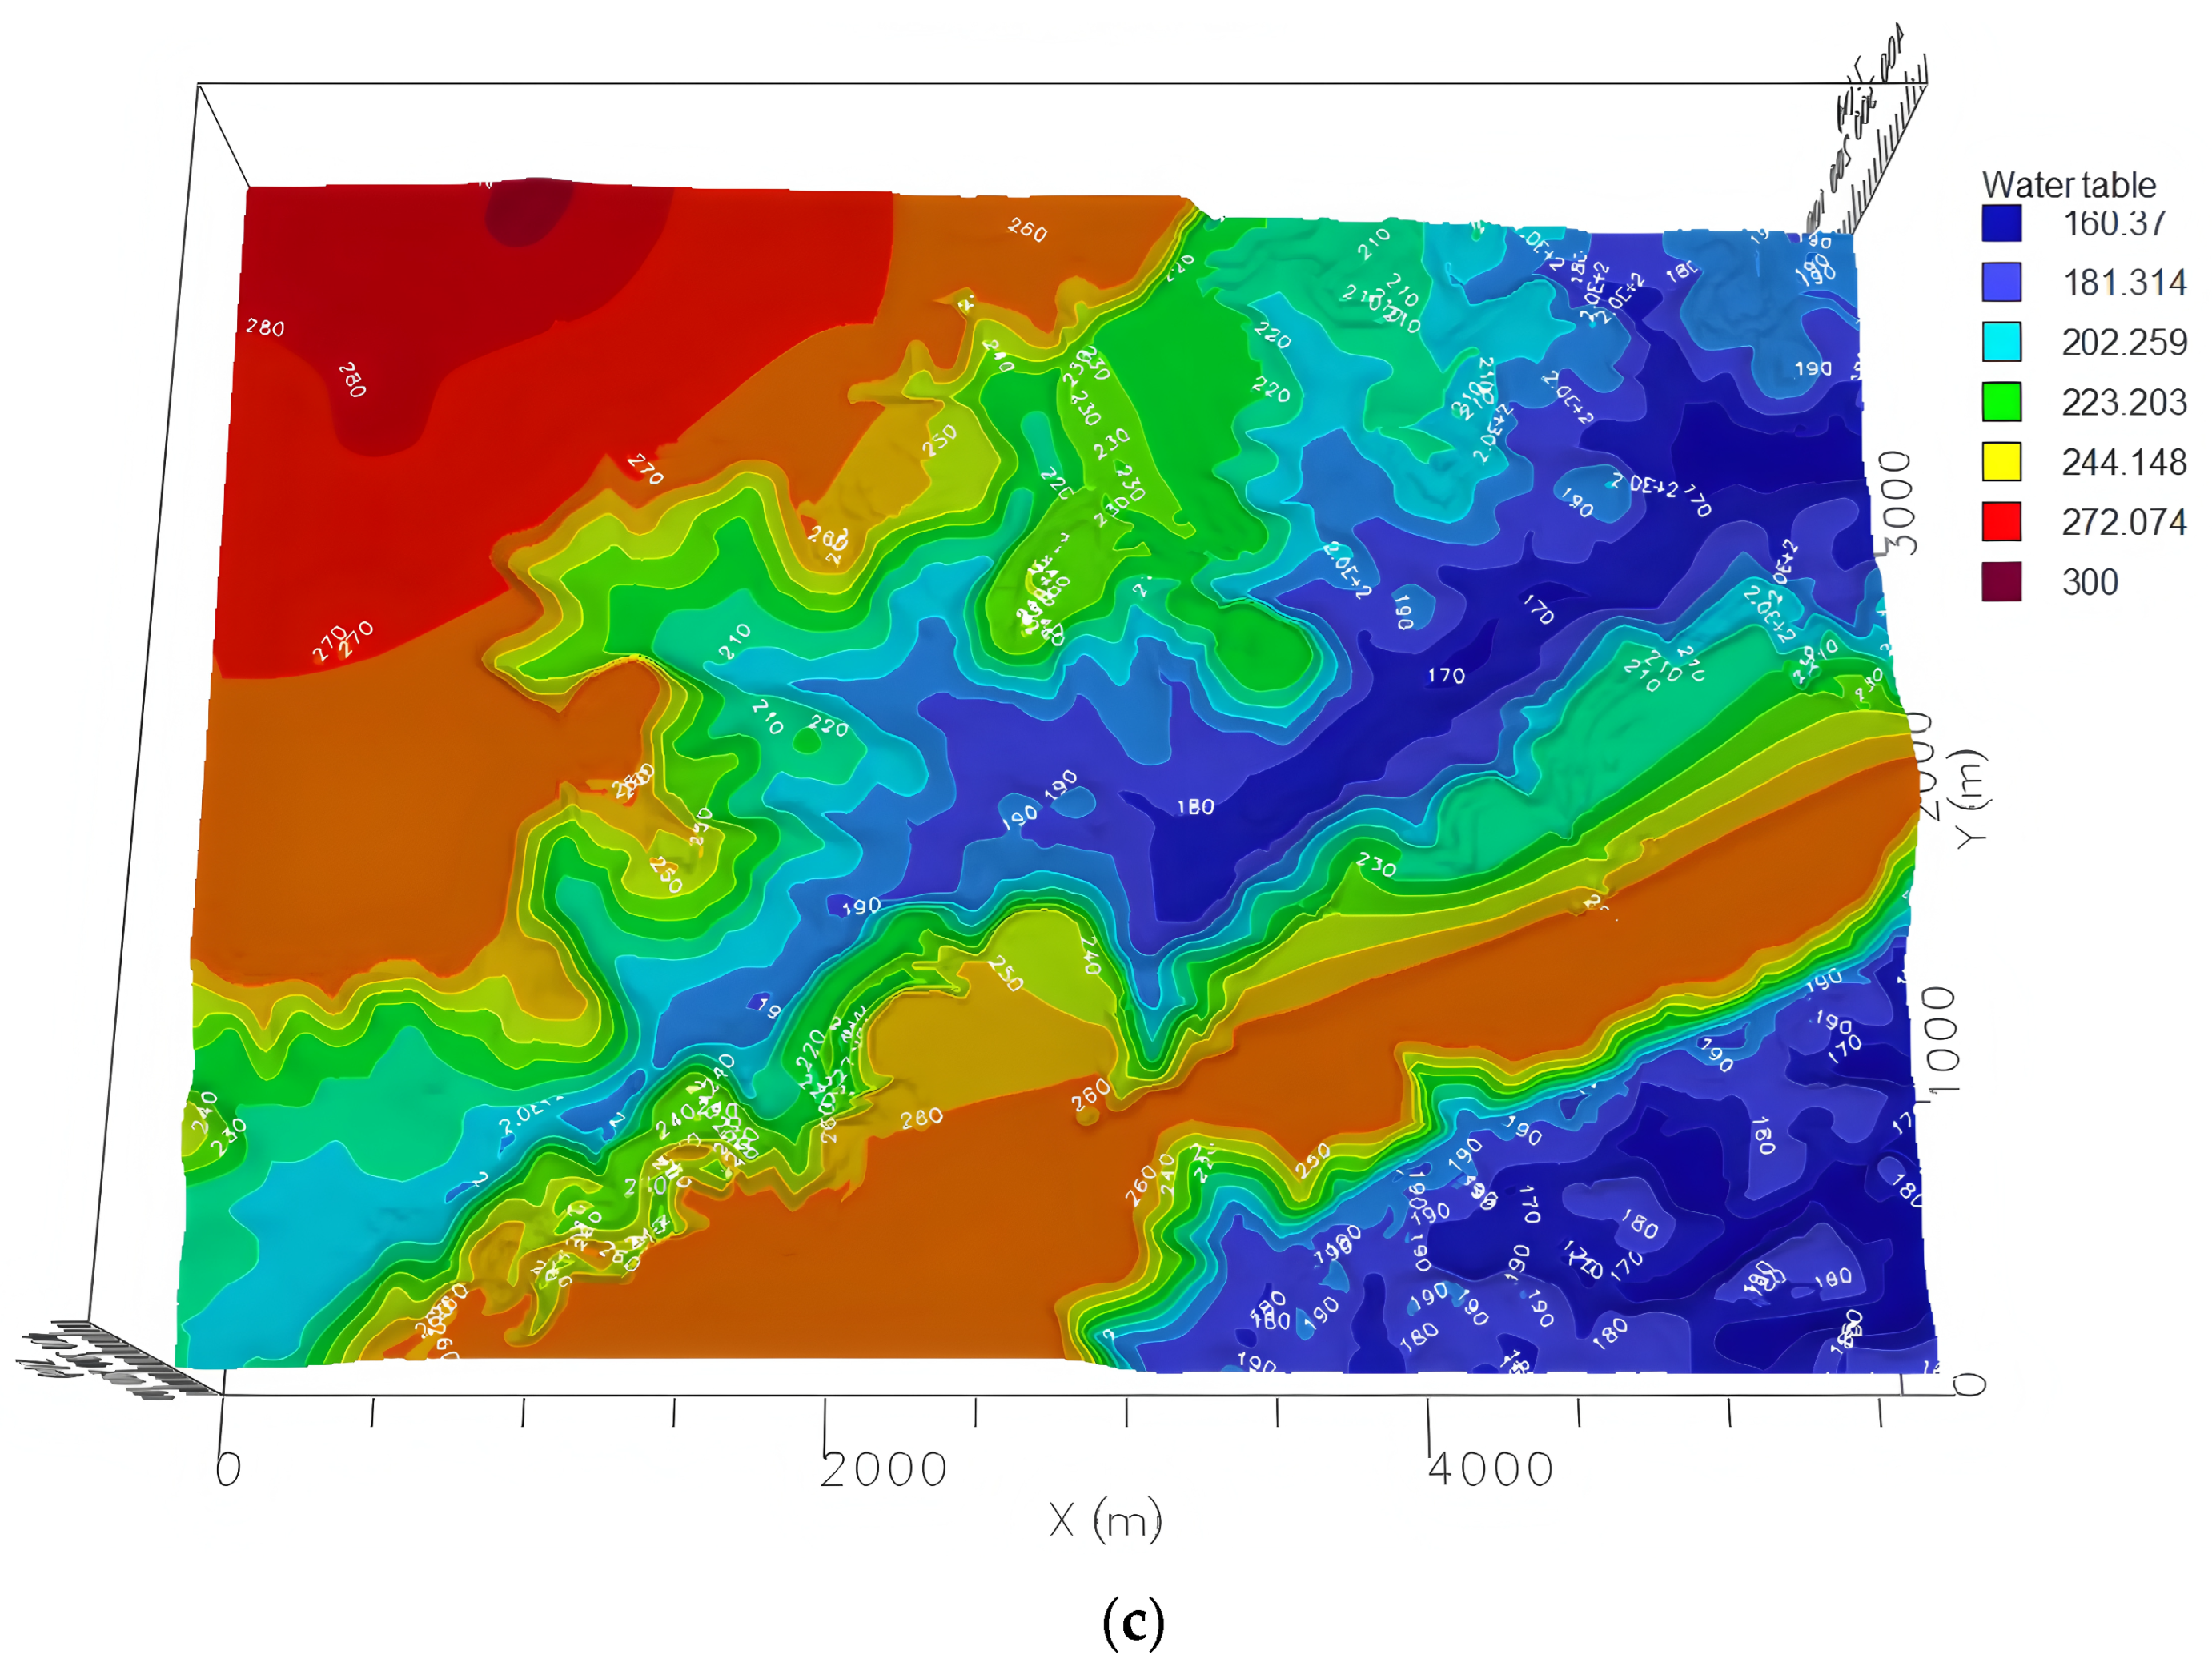
Evolution of Groundwater Seepage Field in Qinglong Village. (a) Natural seepage field; (b) seepage field after 1 year of mining drainage; (c) seepage field 5 years after stopping pumping. Note: Color gradients represent water level elevation (m); black lines denote drawdown funnel boundaries.
Figure 8a (Natural seepage field): Without mining interference, groundwater levels were generally gentle (178.5–182.5 m), with groundwater flow following a “recharge-discharge” natural cycle along the Liangxi River. Karst fracture flow was dominated by Darcian flow, with no significant water level mutation zones, and soil caves remained stable (no collapse records).
Figure 8b (Seepage field after 1 year of mining): Sustained pumping led to the formation of a drawdown funnel in Qinglong Village with a central water level of 176.2 m—4.3 m lower than the natural state. Flow direction shifted from “natural cycle” to “convergence toward the mining area,” and fault water conductivity was enhanced (water level gradient at water-conducting faults reached 0.025 m/m), inducing accelerated fracture flow (1.2–1.8 m/d). This resulted in fine particle loss in Q4 silty clay (soil cave expansion rate of 0.12 mm/year), with 19 collapse events occurring during this stage (36% of total collapses). Here, the reported flow velocity refers to the Darcy velocity (specific discharge) computed from MODFLOW outputs (, where and are the modeled specific-discharge components). The soil-cave expansion rate was estimated from repeated core logging as ( = 6 years), using the measured increase in dissolution/solution-enlarged features as a proxy for cavity enlargement.
Figure 8c (Seepage field 5 years after stopping mining): After ceasing mining, groundwater levels recovered slowly (average annual recovery of 0.3 m), and the drawdown funnel shrank to 0.5 km in diameter. Flow gradually returned to a natural cycle, but formed soil caves could not be fully closed, leading to three delayed collapses (due to residual stress release of soil cave roofs).
The topographically corrected model improved simulation accuracy by 12% compared to the uncorrected model. The largest reduction in RMSE was observed in valley plain zones (from 0.52 m to 0.38 m), confirming the regulatory role of topography in karst seepage for subtropical mining areas; thick Q4 silty clay (6–10 m) in valley zones enhances rainfall infiltration (infiltration coefficient 0.25), intensifying groundwater level fluctuations that require focused characterization in the model [23,32].
4.3. Analysis of the Karst Collapse Mechanism
Groundwater level decline is the primary driver of collapse, with its impact highly coupled with seepage field evolution. Following Terzaghi’s effective stress principle (Equation (1)), the drawdown-driven increase in vertical effective stress was estimated under a 1D vertical-loading assumption in the cover layer. As shown in Figure 8, the water level drop in the drawdown funnel reached 4.3 m after 1 year of mining, increasing effective stress from 18 kPa to 35 kPa (94% increase). This caused the compaction of Q4 silty clay (compaction rate 0.5–1.2 mm/year, 2–3 times higher than in low-collapse areas). Meanwhile, the loss of water support in karst soil caves induced soil collapse—a process spatially overlapping with 89% of collapse points within the 1.2 km funnel, confirming the controlling role of seepage field evolution in collapse.
where σv and σ′v are the total and effective vertical stresses (kPa), u is pore-water pressure (kPa), γsat is the saturated unit weight of Q4 silty clay (kN/m3), is the unit weight of water (9.81 kN/m3), z is depth (m), and h is hydraulic head (m). Δσ′ᵥ was computed from the modeled drawdown (Δh) at collapse-prone locations.
Soil cave expansion is driven by the synergistic effect of “flow-chemistry”: Figure 8b shows that fracture flow velocity during mining reached 1.2–1.8 m/d, 3–4 times higher than the natural state (0.3–0.5 m/d). High-velocity flow intensified fine particle loss in Q4 silty clay (silt content in collapse pit fill <5%, far lower than 15–20% in intact soil layers). Additionally, weakly acidic groundwater (pH 6.2–6.8) accelerated the dissolution of C2d dolomite (annual dissolution rate 0.12 mm/year), expanding soil cave volume by an average of 0.05 m3 per year and further weakening soil stability [32,33,34].
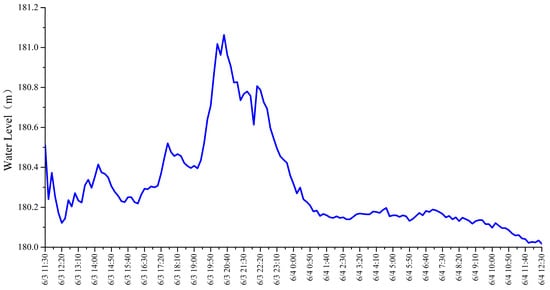
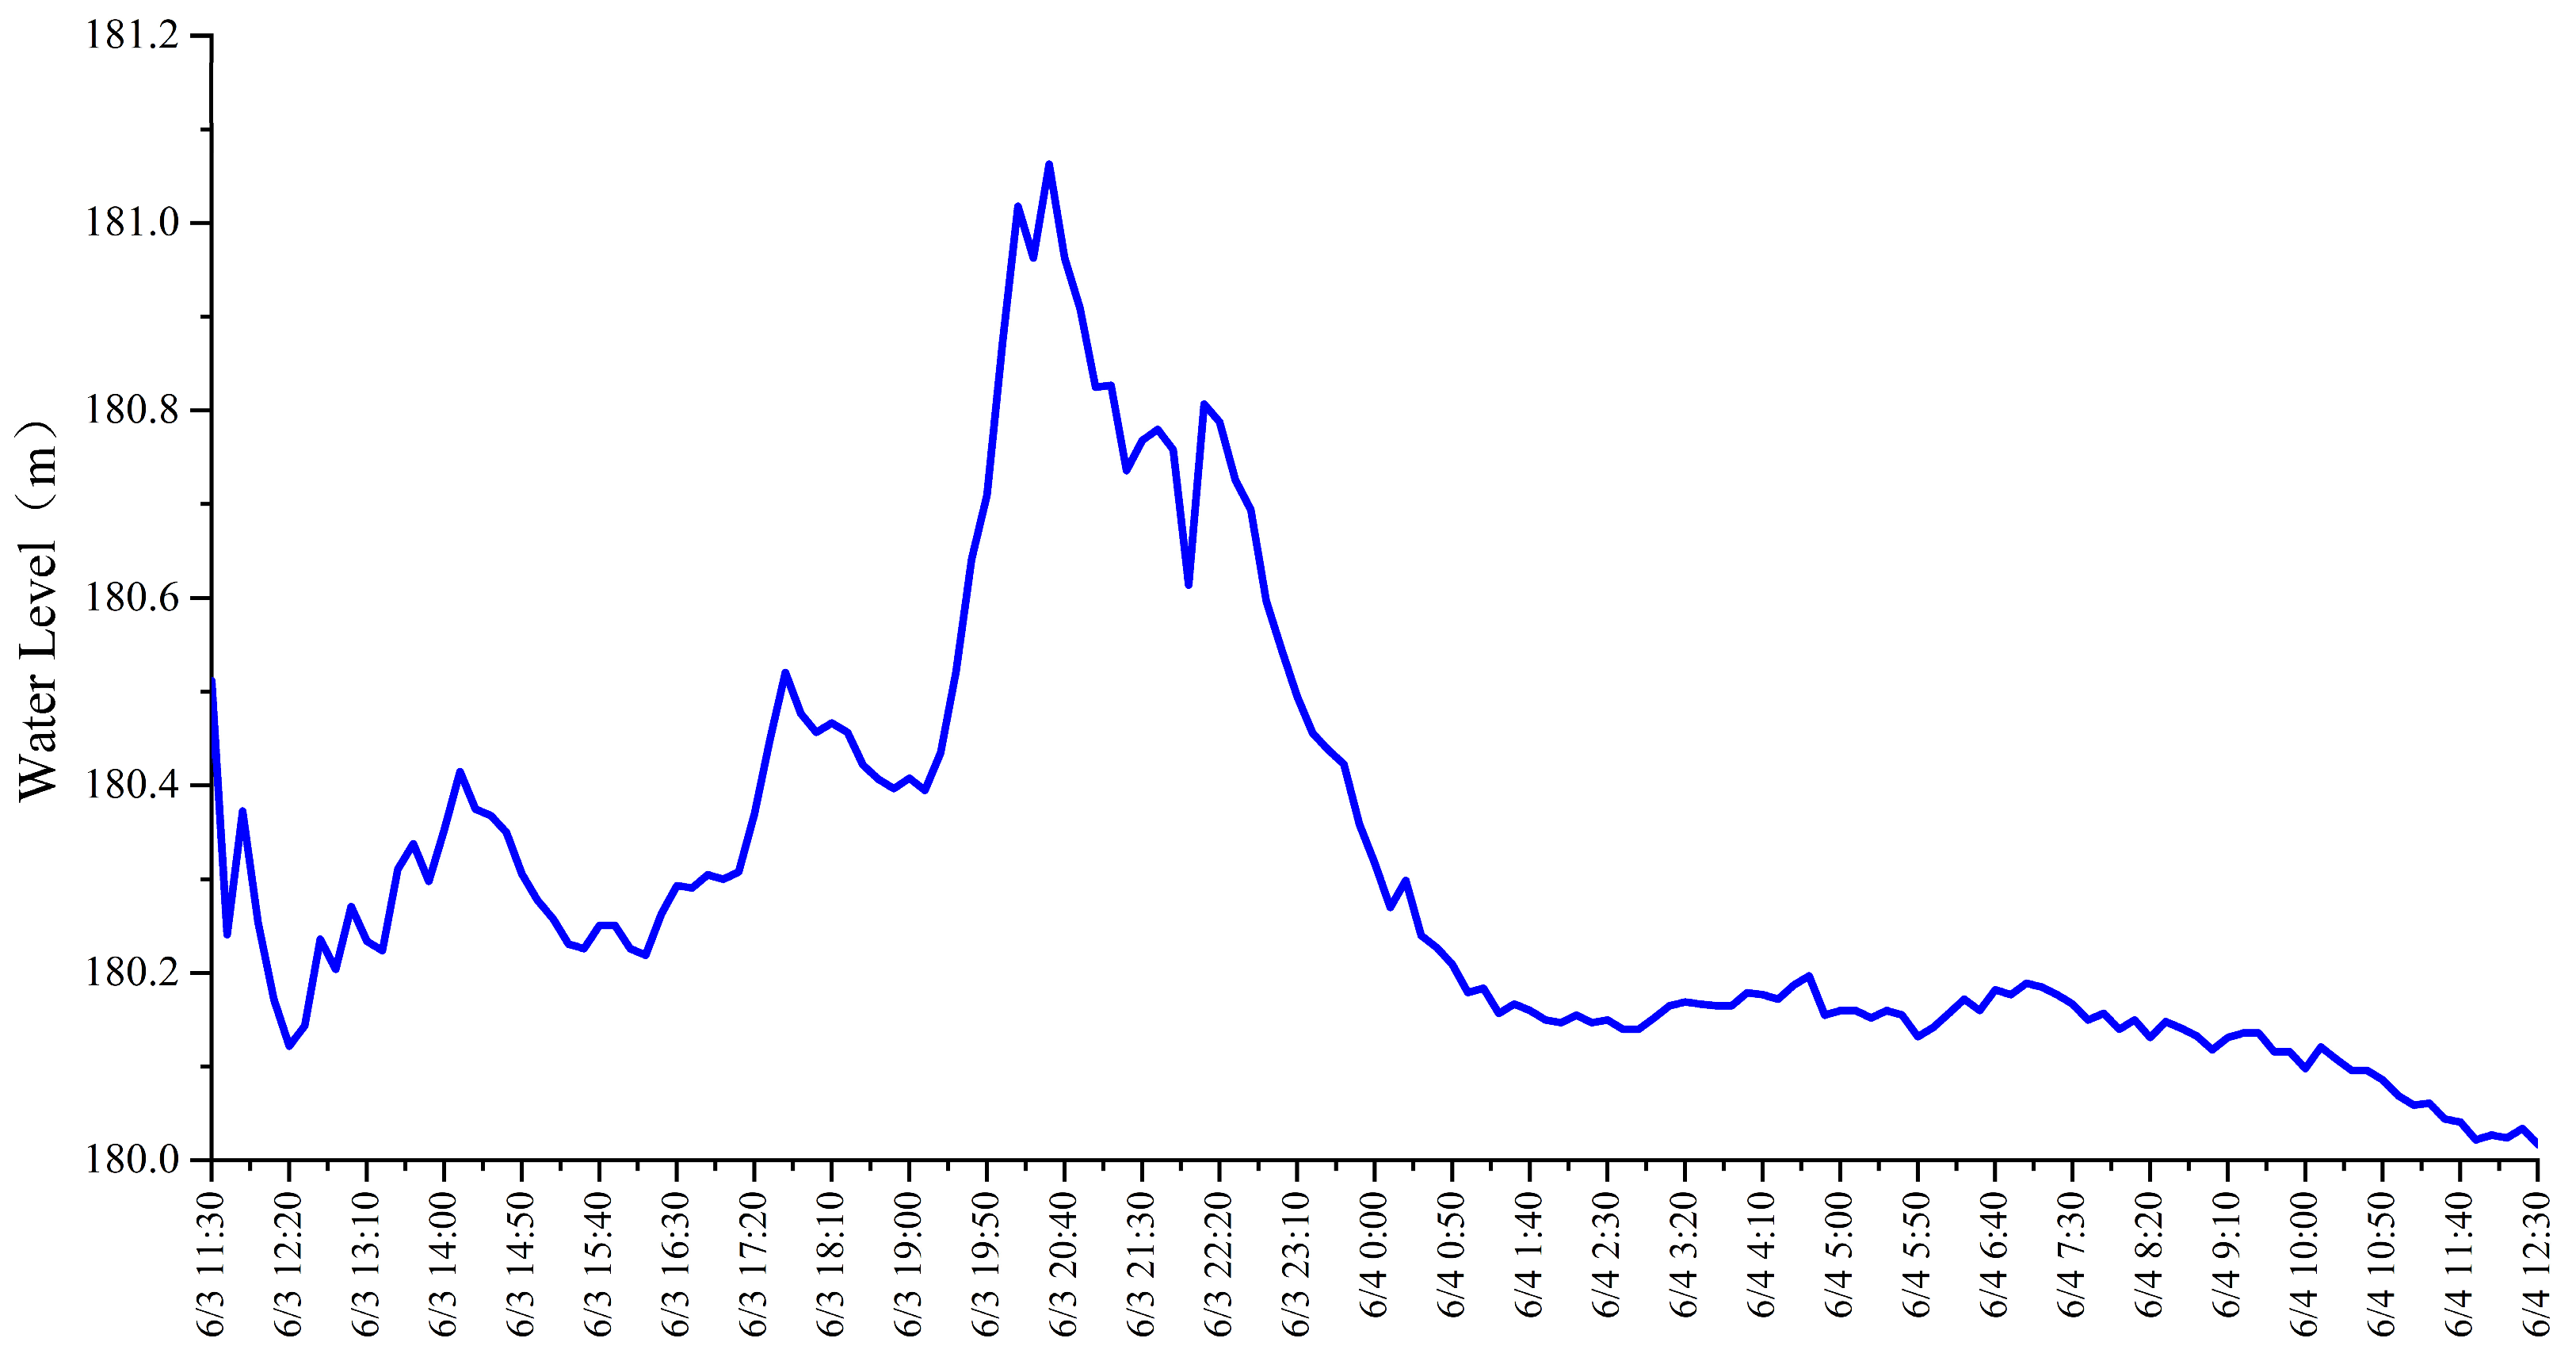
The rainfall-mining synergistic effect amplifies collapse risk through seepage field fluctuations: Heavy rainfall causes a sudden 2.8–3.1 m rise in groundwater levels (Figure 9), saturating Q4 silty clay (cohesion decreasing from 58.8 kPa to 18 kPa). Subsequent mining pumping leads to a sudden 1.9–2.2 m drop in water levels within 1 week, with fluctuations exceeding 5 m, surpassing the shear strength threshold of the soil. This stage corresponds to the collapse peak (19 events) in Figure 8b, with collapses occurring 1–2 weeks after water level drop (the lag period is attributed to the need for stress accumulation on soil cave roofs) [34,35,36,37].
Figure 9.
ZK87 Monitoring Curve shows heavy rainfall causes a sudden rise in groundwater levels.
The region-specific critical hydraulic gradient (in = 0.85) is lower than the 1.12 reported in North China. This difference stems from the lower cohesion of Q4 silty clay in central Hunan (18–58.8 kPa vs. 35–70 kPa in North China). As shown in Figure 8, the seepage field gradient in central Hunan mining areas is larger (reaching 0.025 m/m during mining), making it easier to exceed the critical gradient and trigger collapse. This conclusion provides key threshold parameters for regional collapse prevention [22,23,27]. From an engineering perspective, these quantitative results can be directly translated into operational controls for mine drainage and early warning. First, the model-based drawdown funnel (1.2 km diameter) and the hydraulic-gradient threshold (i > in = 0.85) can be used to delineate high-risk zones for targeted monitoring and land-use restrictions. Second, the observed response magnitudes (2.8–3.1 m rise after >100 mm/day rainfall and 1.9–2.2 m decline within one week under pumping) indicate that large-amplitude water-level fluctuations should be avoided; thus, phased pumping and limiting rapid drawdown (e.g., <2 m/week) are recommended to reduce collapse triggering. Finally, the 1–2-week lag between drawdown and peak collapses suggests that intensified inspections should be scheduled immediately after strong pumping periods, especially along NE-trending faults and in areas with thick (6–10 m) Q4 cover.
4.4. Evaluation of the Collapse Prediction Model
Model accuracy was evaluated by comparing the predicted number of collapse events () with the observed collapse inventory () within the same evaluation window (2014–2015). The observed collapse count ( = 32) was taken from field-verified records, and was calculated from Equation (4) using the parameter set in Table 5. We quantify accuracy using a relative-count metric: Accuracy (%) = . Using = 32 and the model-predicted range = 28–35, the resulting accuracy is 87.5–90.6%. This level of agreement is comparable to reported performance in related collapse-prediction studies. The remaining mismatch (9–13%) is mainly attributed to (i) not explicitly accounting for C2d micro-fractures (<2 cm) in the equivalent porous-media representation and (ii) sudden changes in pumping rate (e.g., pumping rate increased to 250 m3/h in October 2016), which can locally shift drawdown and lead to over- or under-predicted collapse counts. Future improvements will integrate ground-penetrating radar data (to map micro-fractures) and real-time pumping monitoring [15,23,24,25,26]. The parameter sensitivity analysis results are shown in Table 6.
Table 6.
Parameter Sensitivity Analysis Results.
4.5. Discussion and Limitations
Our results are consistent with previous studies showing that mine drainage can generate a pronounced drawdown funnel and accelerate karst-collapse occurrence by increasing hydraulic gradients and effective stress in the overburden. Compared with reported cases in North China and other mining regions, the critical hydraulic gradient identified here (in = 0.85) is lower, indicating higher drawdown sensitivity of the local subtropical residual soils and cover materials. In addition, the model performance (NSE = 0.85 for calibration and 0.81 for validation) and the prediction accuracy (87.5–90.6%) fall within the range commonly achieved in recent groundwater-driven hazard assessments, supporting the reliability of the proposed workflow for practical risk zoning.
This study also has limitations. MODFLOW represents the karst aquifer as an equivalent porous medium with zoned hydraulic properties; therefore, localized conduit-dominated flow and short-term transient processes may not be fully captured. Moreover, the monitoring network is limited to six boreholes and collapse timing is constrained by field reports and mine records. Future work should integrate denser monitoring/ERT constraints and, where data allow, dual-permeability or conduit-flow representations to reduce uncertainty and improve transferability.
5. Conclusions
This study delivers a field-constrained, topography-aware groundwater–collapse assessment framework for subtropical hilly karst mining areas. By integrating a collapse inventory, long-term groundwater monitoring, geophysical exploration, and a calibrated MODFLOW seepage-field model, we translate drainage- and rainfall-driven groundwater dynamics into quantitative, engineering-usable collapse-risk indicators.
A minefield-scale drawdown funnel (~1.2 km in diameter) forms readily under drainage and spatially overlaps with 89% of the mapped collapse points, indicating that drainage-driven head decline is the dominant first-order control on collapse clustering in the Tuoshan minefield. The topographically corrected MODFLOW model reproduces the observed “steep rise, slow fall” groundwater-level dynamics with good performance (RMSE = 0.32 m and NSE = 0.85 for calibration; RMSE = 0.41 m and NSE = 0.81 for validation). In this work, the karst dual-medium conceptual model (matrix + fracture/conduit network) is represented using an equivalent porous-media (EPM) parameterization with zoned properties; thus, results should be interpreted as effective, minefield-scale seepage behavior rather than conduit-scale hydraulics. We derived a physics-informed collapse prediction formulation based on effective stress and transient drawdown, and evaluated its performance against the observed collapse inventory, yielding an accuracy of 87.5–90.6% for the 2014–2015 evaluation window. A region-specific critical hydraulic gradient (in = 0.85) was also obtained, which is lower than values reported for North China, highlighting the higher susceptibility of the local Q4 silty clay cover under rapid drawdown.
Mining operations should adopt phased pumping strategies, adjusting rates based on real-time groundwater monitoring (e.g., suspending pumping if levels drop >2 m/week). Land-use planning should avoid high-risk zones (NE fault zones, areas with 6–10 m thick Q4) for infrastructure development. For emergency response, the three-stage collapse evolution (altar-shaped → columnar → funnel-shaped) can be used to identify secondary risk areas—altar-shaped pits indicate early-stage risk, requiring immediate monitoring. In addition, the calibrated seepage-field model provides an operational basis for risk zoning: areas located within the 1.2 km drawdown funnel and/or satisfying i > in (0.85) should be prioritized for denser monitoring and mitigation measures (e.g., pumping reduction, drainage re-routing, or grouting where feasible). Given the observed 1–2 week lag after rapid drawdown, post-pumping inspections and warnings should be maintained during this lag window, particularly following extreme rainfall. Future work will couple hydrogeochemical evolution and conduit-scale flow processes with denser monitoring/ERT constraints to further reduce uncertainty and improve transferability, as follows: (i) Integrate machine learning techniques (e.g., random forest) with MODFLOW to improve prediction accuracy in micro-fracture-affected zones; (ii) Study grouting and geosynthetic reinforcement technologies for karst cavity stabilization, with field trials planned in Qinglong Village; (iii) Assess climate change impacts (extreme rainfall/drought) on seepage fields using CMIP6 projections for central Hunan [22,32,33,34].
Author Contributions
Conceptualization, Y.C.; Methodology, Y.C.; Investigation, Y.C.; Data curation, Y.C. and Z.Z.; Writing—original draft, Y.C.; Writing—review & editing, Z.Z. and G.L.; Supervision, Z.Z. and G.L.; Project administration, G.L.; Funding acquisition, G.L. All authors have read and agreed to the published version of the manuscript.
Funding
This research received no external funding.
Institutional Review Board Statement
Not Applicable.
Informed Consent Statement
Not Applicable.
Data Availability Statement
Data are available from the corresponding author upon reasonable request.
Conflicts of Interest
The authors declare no conflict of interest.
References
- Chen, Q.; Wu, Q. Study on the management of karst collapse in mining area. Geotech. Investig. Surv. 2008, 6, 31–35. [Google Scholar]
- Jiang, X.; Dai, J.; Lei, Q. An overview on karst collapse mechanism in China. Carbonates Evaporites 2024, 39, 71. [Google Scholar] [CrossRef] [Scilit]
- Zhai, G.; Dai, J.; Chen, G.; Pan, Z.; Liang, C.; Liu, Z.; Jiang, X. Mechanism mode and prevention and control measures of karst collapses induced by foundation pit excavation. Carbonates Evaporites 2024, 39, 88. [Google Scholar] [CrossRef] [Scilit]
- Gao, Z.; Xu, G.; Li, H.; Su, D.; Liu, Y. Bed Separation Formation Mechanism and Water Inrush Evaluation in Coal Seam Mining Under a Karst Cave Landform. Processes 2023, 11, 3413. [Google Scholar] [CrossRef] [Scilit]
- Al Khoury, I.; Boithias, L.; Labat, D. A Review of the Application of the Soil and Water Assessment Tool (SWAT) in Karst Watersheds. Water 2023, 15, 954. [Google Scholar] [CrossRef] [Scilit]
- Zhang, J.; Genty, D.; Sirieix, C.; Verdet, C.; Mateo, S.; Devaux, L.; Sgubin, G.; Bujan, S.; Minster, B.; Régnier, E.; et al. Data-model comparisons of isotopic and hydrological variabilities of the karstic vadose zone above Villars Cave, SW-France based on 20 years’ monitoring record. Chem. Geol. 2023, 642, 121802. [Google Scholar] [CrossRef] [Scilit]
- Raheem, A.; Ahmad, I.; Arshad, A.; Liu, J.; Rehman, Z.; Shafeeque, M.; Rahman, M.; Saifullah, M.; Iqbal, U. Numerical Modeling of Groundwater Dynamics and Management Strategies for the Sustainable Groundwater Development in Water-Scarce Agricultural Region of Punjab, Pakistan. Water 2024, 16, 34. [Google Scholar] [CrossRef] [Scilit]
- Gaur, S.; Mimoun, D.; Graillot, D. Advantages of the analytic element method for the solution of groundwater management problems. Hydrol. Process. 2011, 25, 3426–3436. [Google Scholar] [CrossRef] [Scilit]
- Ahmad, S.; Jia, H.; Ashraf, A.; Yin, D.; Chen, Z.; Ahmed, R.; Israr, M. A Novel GIS-SWMM-ABM Approach for Flood Risk Assessment in Data-Scarce Urban Drainage Systems. Water 2024, 16, 1464. [Google Scholar] [CrossRef] [Scilit]
- Castellanos-Osorio, G.; López-Ballesteros, A.; Pérez-Sánchez, J.; Senent-Aparicio, J. Disaggregated monthly SWAT+ model versus daily SWAT+ model for estimating environmental flows in Peninsular Spain. J. Hydrol. 2023, 623, 129837. [Google Scholar] [CrossRef] [Scilit]
- Wang, X.; Hu, S.; Lian, B.; Wang, J.; Zhan, H.; Wang, D.; Liu, K.; Luo, L.; Gu, C. Formation mechanism of a disaster chain in Loess Plateau: A case study of the Pucheng County disaster chain on August 10, 2023, in Shaanxi Province, China. Eng. Geol. 2024, 331, 107463. [Google Scholar] [CrossRef] [Scilit]
- Wang, S.; Chen, L.; Su, Z.; Dong, H.; Ma, B.; Zhao, B.; Lu, Z.; Zhang, M. Differential Characteristics of Conjugate Strike-Slip Faults and Their Controls on Fracture-Cave Reservoirs in the Halahatang Area of the Northern Tarim Basin, NW China. Minerals 2024, 14, 688. [Google Scholar] [CrossRef] [Scilit]
- Hao, Y.; Bell, R.; Rao, Y.; Fan, R.; Wang, Y. Prediction of Permian karst reservoirs in the Yuanba gas field, northern Sichuan Basin, China. Mar. Pet. Geol. 2023, 154, 106319. [Google Scholar] [CrossRef] [Scilit]
- Xu, Z.; Zhang, Z.; Cao, C.; Wu, Z.; Dong, T. Progressive assessment of water inrush disasters in pre-construction and construction phases based on Chinese tunnels research. Carbonates Evaporites 2024, 39, 50. [Google Scholar] [CrossRef] [Scilit]
- Li, G.; Zhou, W. Sinkholes in karst mining areas in China and some methods of prevention. Eng. Geol. 1999, 52, 45–50. [Google Scholar] [CrossRef] [Scilit]
- Xiao, X.; Gutiérrez, F.; Guerrero, J. The impact of groundwater drawdown and vacuum pressure on sinkhole development. Physical laboratory models. Eng. Geol. 2020, 279, 105894. [Google Scholar] [CrossRef] [Scilit]
- Zhang, X.; Jiao, J.J.; Guo, W. How Does Topography Control Topography-Driven Groundwater Flow? Geophys. Res. Lett. 2022, 49, e2022GL101005. [Google Scholar] [CrossRef] [Scilit]
- Harbaugh, A.W. MODFLOW-2005: The U.S. Geological Survey Modular Ground-Water Model—The Ground-Water Flow Process; U.S. Geological Survey Techniques and Methods 6-A16; USGS: Reston, VA, USA, 2005. [Google Scholar]
- Niswonger, R.G.; Panday, S.; Ibaraki, M. MODFLOW-NWT, a Newton Formulation for MODFLOW-2005; U.S. Geological Survey Techniques and Methods 6-A37; USGS: Reston, VA, USA, 2011; Volume vii, 44p. [Google Scholar]
- Panday, S.; Langevin, C.D.; Niswonger, R.; Ibaraki, M.; Hughes, J.D. MODFLOW-USG Version 1: An Unstructured Grid Version of MODFLOW for Simulating Groundwater Flow and Tightly Coupled Processes Using a Control Volume Finite-Difference Formulation; U.S. Geological Survey Techniques and Methods 6-A45; USGS: Reston, VA, USA, 2013; Volume vii, 68p. [Google Scholar]
- Prince, K.R.; Galloway, D.L.; Leake, S.A. (Eds.) U.S. Geological Survey Subsidence Interest Group Conference Edwards Air Force Base, Antelope Valley, California, November 18–19, 1992; Abstracts and Summary; U.S. Geological Survey Open-File Report; USGS: Reston, VA, USA, 1995; pp. 94–532. [Google Scholar]
- Chen, X.; Xue, M.; Song, Y. Analysis of the Influence of Groundwater Level Fluctuation on Karst Soil Cave Collapse. Geofluids 2023, 2023, 7540561. [Google Scholar] [CrossRef] [Scilit]
- Chen, X.; Gao, X.; Li, H.; Xue, M.; Gan, X.; Song, Y. Model Test Analysis of Groundwater Level Fluctuations on Karst Cover Deformation Taking the Monolithic Structure of Guilin as an Example. Appl. Sci. 2023, 13, 1747. [Google Scholar] [CrossRef] [Scilit]
- Xiao, Y.J.; Liu, X.H. Research on the relation between geological structure and karst collapse in doulishan coal-mining district. Earth Environ. 2005, S1, 247–250. [Google Scholar]
- Shi, Y.; Xiang, X.; Yao, G. Primary Characteristics and Occurrence of Karst Collapse in Shiyu Coal Mine. J. Guizhou Univ 2009, 26, 51–55. [Google Scholar]
- Wang, P.; Wu, Y.; Li, S.; Jiang, G.; Yuan, D.; Yang, J.; Guo, C.; Yue, F.; Yuan, P.; Wu, H.; et al. Development Characteristics and Controlling Factors of Karst Aquifer Media in a Typical Peak Forest Plain: A Case Study of Zengpiyan National Archaeological Site Park, South China. Water 2024, 16, 3486. [Google Scholar] [CrossRef] [Scilit]
- Liu, X.; Chen, H.; Gong, B.; Jiang, G.; Wang, J. Formation process of cover collapse sinkholes related to groundwater level decline in karst areas. J. Mt. Sci. 2024, 21, 3832–3846. [Google Scholar] [CrossRef] [Scilit]
- Xiao, X.; Xu, M.; Ding, Q.; Kang, X.; Xia, Q.; Du, F. Experimental study investigating deformation behavior in land overlying a karst cave caused by groundwater level changes. Environ. Earth Sci. 2018, 77, 64. [Google Scholar] [CrossRef] [Scilit]
- Gao, M.; Li, X.; Qian, J.; Wang, Z.; Hou, X.; Fu, C.; Ma, J.; Zhang, C.; Li, J. Hydrogeochemical Characteristics and Evolution of Karst Groundwater in Heilongdong Spring Basin, Northern China. Water 2023, 15, 726. [Google Scholar] [CrossRef] [Scilit]
- Chen, X.; Guo, R.; Tang, L.; Zhang, X. Study on Ground Collapse of Covered Karst Soil Caves by Sudden Drop of Groundwater. Adv. Civ. Eng. 2021, 2021, 7796401. [Google Scholar] [CrossRef] [Scilit]
- GB 50021—2009; Code for Investigation of Geotechnical Engineering. China Architecture & Building Press: Beijing, China, 2012.
- Liu, Y.; Zhu, J.; Liu, Q.; Yuan, A.; He, S.; Bai, Y. Mechanism Analysis of Delayed Water Inrush from Karst Collapse Column during Roadway Excavation Based on Seepage Transition Theory: A Case Study in PanEr Coal Mine. Energies 2022, 15, 4987. [Google Scholar] [CrossRef] [Scilit]
- Cao, Z.; Ren, Y.; Wang, Q.; Yao, B.; Zhang, X. Evolution Mechanism of Water-Conducting Channel of Collapse Column in Karst Mining Area of Southwest China. Geofluids 2021, 2021, 6630462. [Google Scholar] [CrossRef] [Scilit]
- Cao, Z.; Zhang, S.; Li, Z.; Du, F.; Huang, C.; Wang, W. Numerical research on disastrous mechanism of seepage instability of karst collapse column considering variable mass effect. Sci. Rep. 2024, 14, 13900. [Google Scholar] [CrossRef] [Scilit]
- Wu, Y.; Cao, Z.; Li, Z.; Du, F.; Wang, W.; Zhai, M.; Hong, Z.; Xue, Y. Seepage evolution characteristics and water inrush mechanism in collapse column under mining Influence. Sci. Rep. 2024, 14, 5862. [Google Scholar] [CrossRef] [Scilit]
- Zhang, J.; Li, Q.; Cao, Z.; Wen, J.; Chi, M.; Du, W.; Ma, Z.; Yang, Y.; Guo, J.; Zhao, H. Analysis method of mining seepage field. J. China Coal Soc. 2023, 48, 3628–3645. [Google Scholar]
- Tan, S.; Yin, J.X.; Wang, X.Y. Forming Conditions and Zonation of Susceptibility of Karst Collapse in Meitanba Mining Area in Hunan Province. Coal Geol. Explor. 2009, 37, 39–42+46. [Google Scholar]

Disclaimer/Publisher’s Note: The statements, opinions and data contained in all publications are solely those of the individual author(s) and contributor(s) and not of MDPI and/or the editor(s). MDPI and/or the editor(s) disclaim responsibility for any injury to people or property resulting from any ideas, methods, instructions or products referred to in the content. |
© 2026 by the authors. Licensee MDPI, Basel, Switzerland. This article is an open access article distributed under the terms and conditions of the Creative Commons Attribution (CC BY) license.