


Abstract
Understanding how the internal structure of precipitation events evolves and responds to antecedent thermal conditions is essential for revealing the mechanisms of extreme precipitation in plateau-margin mountainous regions. Using hourly precipitation and air temperature data from 14 national reference meteorological stations in the Hehuang Valley during the warm seasons (May–September) of 2015–2024, this study constructed an event-based precipitation database and introduced the inter-event maximum temperature (Tmax_inter) as an indicator of antecedent thermal accumulation. The Theil–Sen slope estimator, Mann–Kendall trend test, K-means clustering, and binary logistic regression were applied to examine changes in precipitation-event structure and their nonlinear response to antecedent high temperature. Results show that warm-season precipitation was characterized by fluctuating frequency but increasing intensity. Precipitation events were classified into three types—uniform, front-peaked, and rear-peaked—with the proportion of uniform events decreasing and the proportions of front-peaked and rear-peaked events increasing. Tmax_inter was significantly positively associated with extreme precipitation occurrence: for every 1 °C increase in Tmax_inter, the odds of extreme precipitation increased by 13.4% (OR = 1.134, 95% CI: 1.10–1.17, p < 0.001). These findings provide a reference for extreme precipitation risk identification and disaster prevention in plateau-margin mountainous areas.
1. Introduction
Against the backdrop of global warming, the intensity and frequency of extreme precipitation events have continued to increase worldwide [1], making them one of the core issues in studies of regional hydrological cycles and disaster risk [2]. According to the Clausius–Clapeyron (C–C) relationship, the moisture-holding capacity of the atmosphere increases by approximately 7% for every 1 °C rise in temperature [3], providing a fundamental physical constraint for the intensification of extreme precipitation.
A large body of research has examined the relationship between temperature and extreme precipitation at daily, hourly, and even finer temporal scales, and has extensively explored how precipitation intensity changes with rising temperature [4,5,6]. These studies have shown that the rarer the precipitation extreme, the greater its projected relative increase in the future, and that the temperature sensitivity of extreme precipitation exhibits pronounced spatial heterogeneity across continents and climate zones [7]. In particular, in regions with complex topography and at high elevations, precipitation responses to warming may deviate from simple Clausius–Clapeyron scaling. In high-altitude areas, warming-induced shifts in precipitation phase from snow to rain may further amplify liquid extreme precipitation, with enhancement rates reaching approximately 15% per degree Celsius [8,9]. The influence of rising temperature on short-duration extreme precipitation depends not only on the increase in atmospheric moisture-holding capacity, but also on convective development, local dynamic lifting, and topographic effects [10]. Recent studies have further suggested that, under warming conditions, the temporal structure and spatial organization of extreme rainstorm events themselves may also be reorganized [11], indicating that changes in extreme precipitation are manifested not only as being “stronger”, but also as becoming “more structurally complex” [12]. Nevertheless, existing studies have focused mainly on statistical relationships for extreme precipitation at fixed temporal scales, while relatively limited attention has been paid to the internal temporal structure of individual precipitation events and to antecedent thermal accumulation. In this study, the term “internal structure of precipitation events” refers primarily to the temporal distribution pattern of rainfall within a single event, namely, the temporal organization of the event hyetograph. In plateau-margin mountainous valley regions, such differences in internal structure are relevant not only to the formation mechanisms of precipitation events themselves, but may also substantially influence surface runoff generation, slope response, and the triggering of secondary disasters [13]. During the interval between two successive precipitation events, high temperature may exert an important modulatory effect on the extremity of subsequent precipitation by enhancing surface evapotranspiration, increasing atmospheric moisture content, and altering convective instability. However, this process still lacks targeted observational evidence and quantitative statistical verification. Existing studies have mostly adopted concurrent daily mean or daily maximum temperature as indicators [14], whereas the inter-event maximum temperature, a thermal indicator more closely linked to the precipitation process, has rarely been introduced. As a result, the possible nonlinear response between antecedent high temperature and extreme precipitation remains insufficiently understood.
Located on the northeastern margin of the Tibetan Plateau, the Hehuang Valley exhibits both plateau and mountainous characteristics and is one of the regions most sensitive and vulnerable to climate change [15]. Situated in the transitional zone between the northeastern Tibetan Plateau and the Loess Plateau, it serves not only as an important water conservation area in the upper reaches of the Yellow River, but also as a densely populated and urbanized corridor [16]. The region is characterized by strong topographic relief, where the westerlies and monsoonal circulation intersect, resulting in highly complex precipitation formation mechanisms. Although total precipitation is not particularly large, both interannual and seasonal variability are pronounced. Once extreme precipitation occurs, it can readily trigger secondary disasters such as flash floods, landslides, and debris flows, thereby threatening regional ecological security and socioeconomic development [17,18]. Therefore, a detailed event-scale characterization of the evolution of the internal structure of warm-season precipitation processes in the Hehuang Valley, together with an analysis of the influence of antecedent thermal conditions on extreme precipitation, is of great significance for understanding the formation mechanisms of extreme precipitation in plateau-margin mountainous areas and for improving regional disaster prevention and mitigation capacity.
Against this background, this study takes the Hehuang Valley as the study area and uses hourly precipitation and air temperature data from 14 national reference meteorological stations during the warm seasons (May–September) from 2015 to 2024 to construct an event-based precipitation database. Based on event identification, the study analyzes the evolutionary characteristics of precipitation-event types and further examines temporal and spatial differences in precipitation events. Meanwhile, the inter-event maximum temperature (Tmax_inter) is introduced as an indicator of antecedent thermal accumulation to quantitatively investigate its effect on the probability of extreme precipitation occurrence. The aim is to provide high-temporal-resolution scientific evidence for studies of extreme precipitation change and disaster-risk early warning in a typical valley region on the northeastern margin of the Tibetan Plateau.
2. Study Area Overview
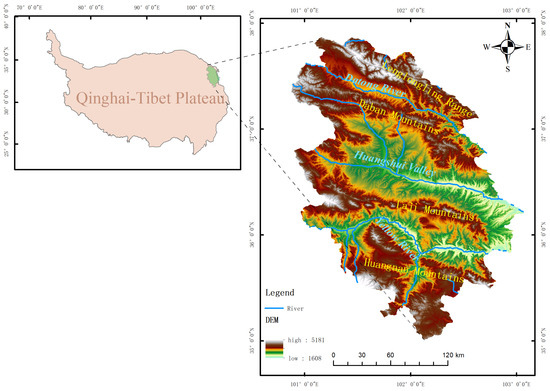
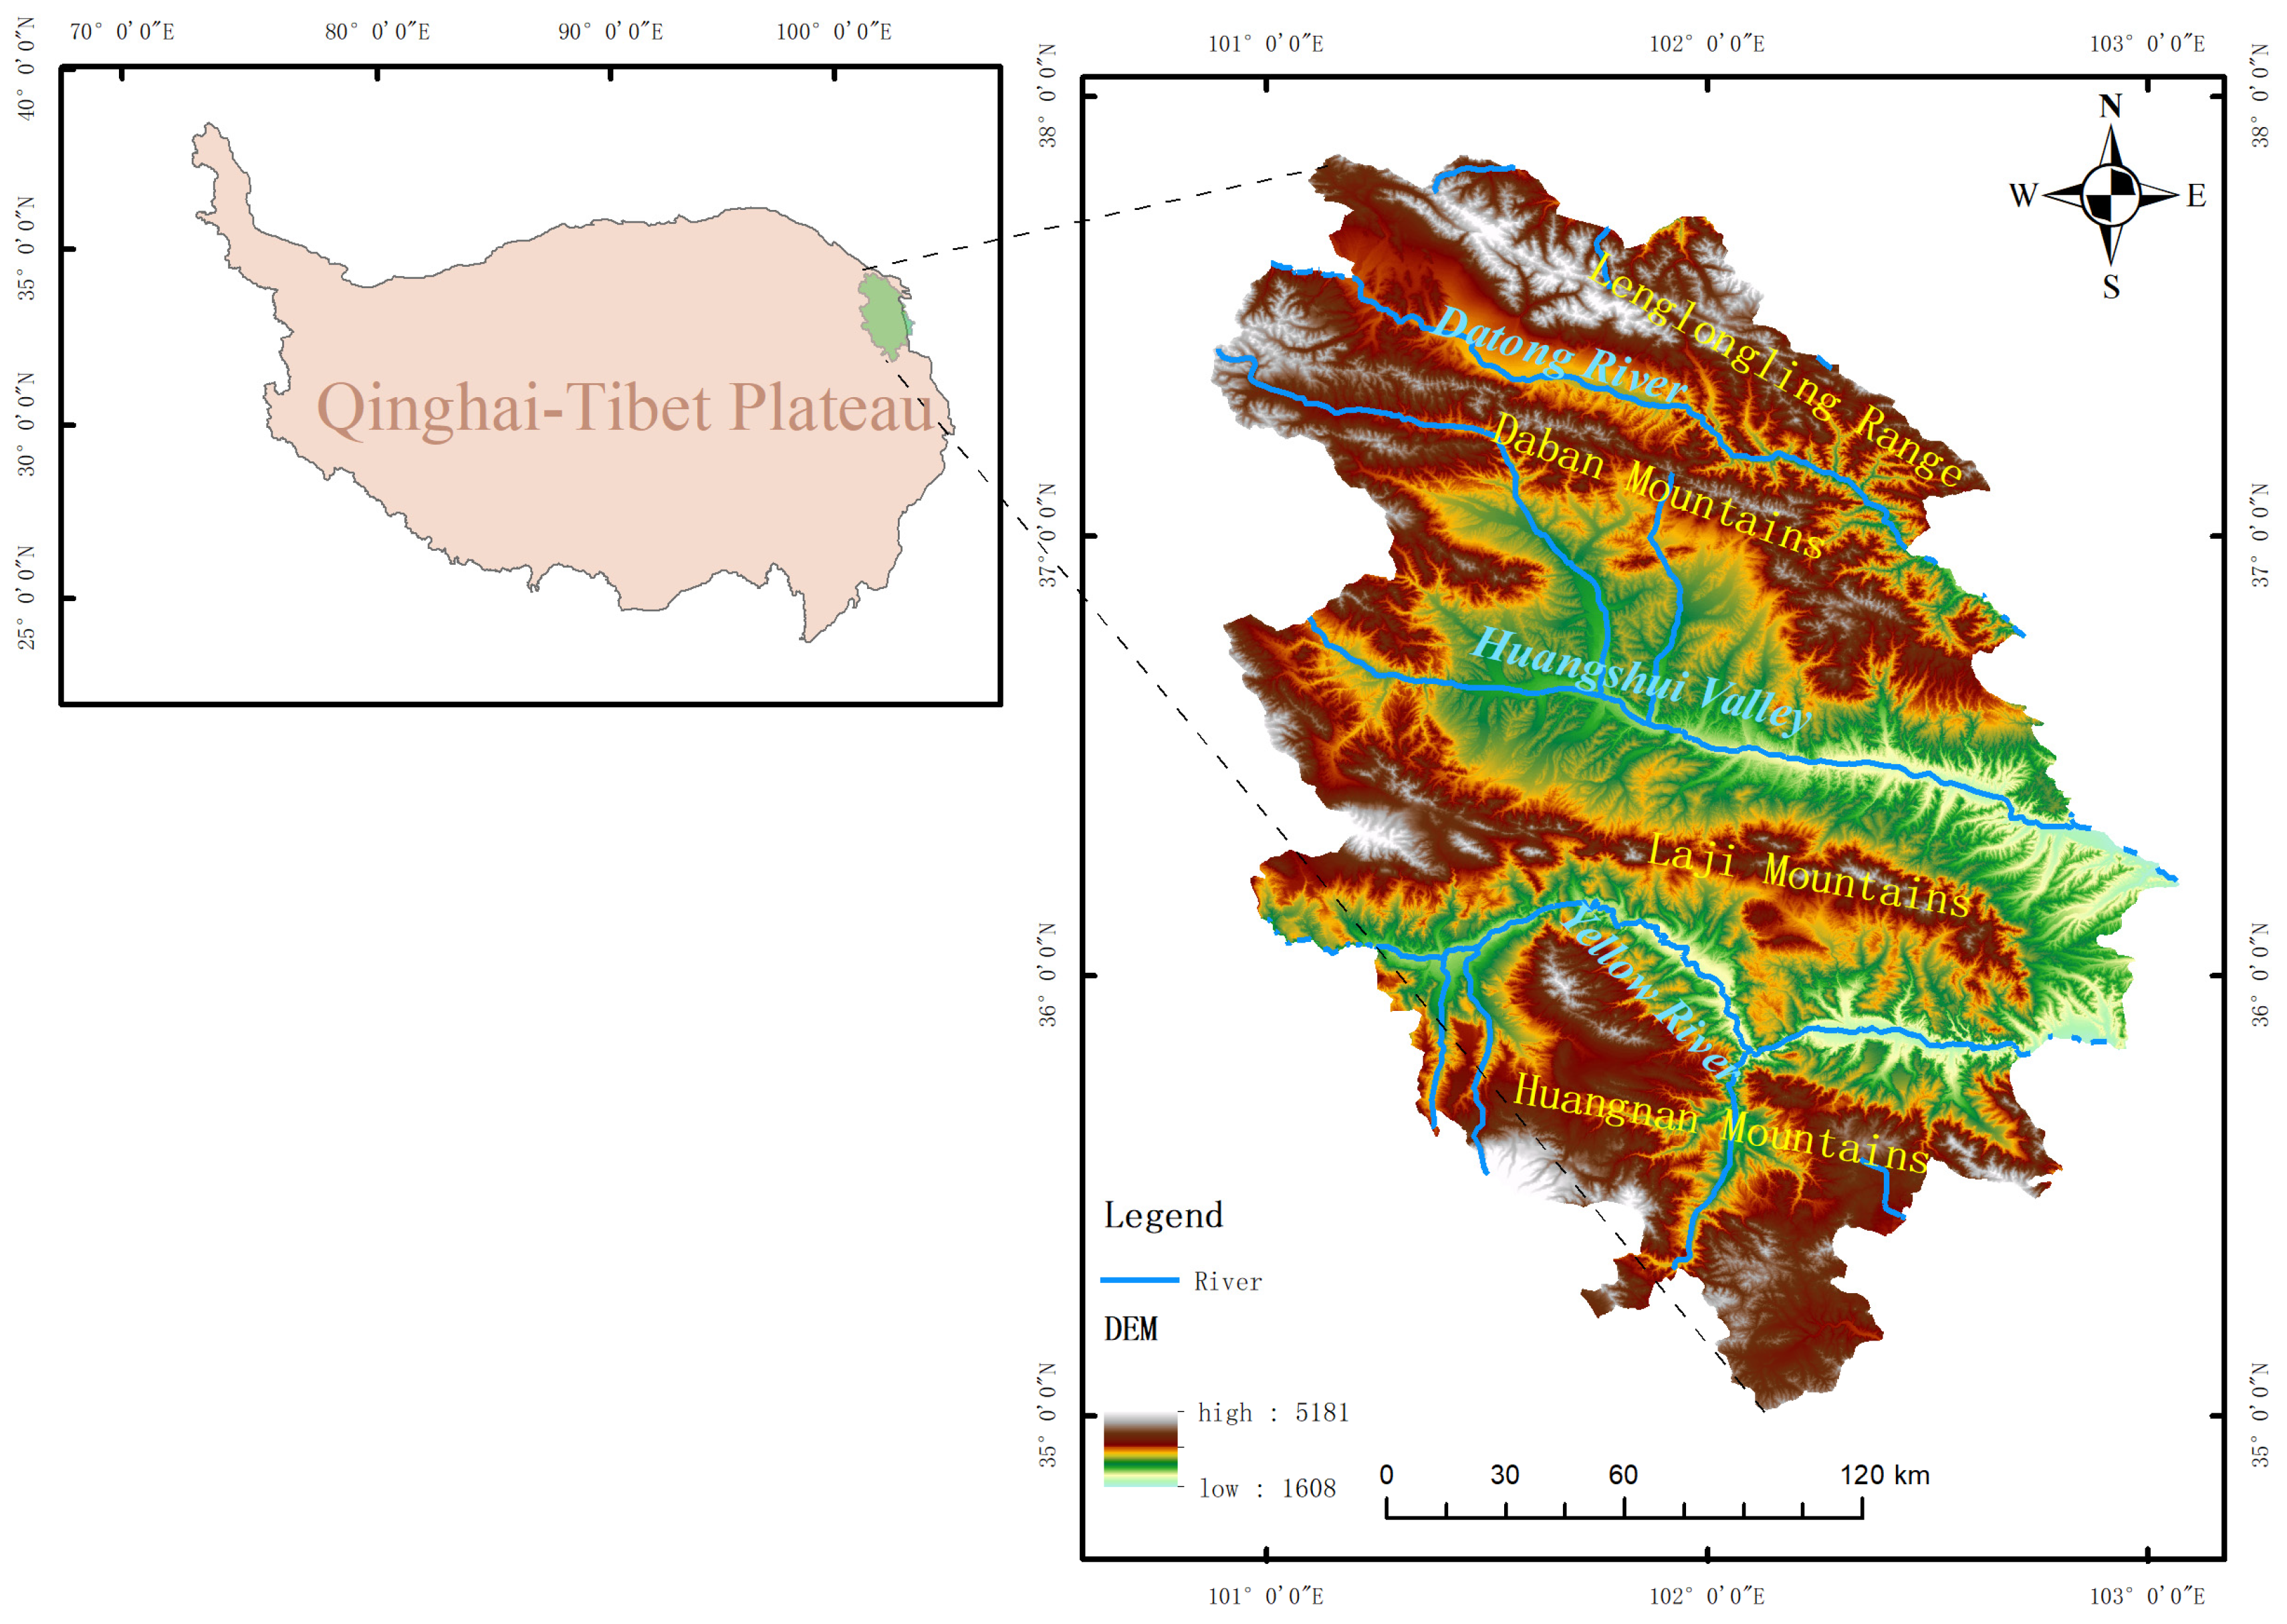
The Hehuang Valley, located on the northeastern margin of the Tibetan Plateau (TP) and the eastern section of the Qilian Mountains, serves as a pivotal transition zone between the Loess Plateau and the TP. This high-altitude alluvial valley, formed by the Yellow River and its primary tributary, the Huangshui River, possesses a distinctive geomorphological structure described as “four mountain ranges flanking three valleys”. From north to south, these features include the Lenglongling Range, the Datong River Valley, the Daban Mountains, the Huangshui Valley, the Laji Mountains, the Yellow River Valley, and the Huangnan Mountains [19] (Figure 1). The elevation of the valley floor ranges from approximately 2200 to 2800 m, whereas the surrounding northern and southern mountains frequently exceed 3000 m, with peaks reaching above 5000 m. This substantial topographic relief creates complex dynamical conditions for regional atmospheric circulation and land-surface processes. The regional climate is classified as a plateau-temperate continental climate, characterized by low mean annual temperatures (typically 3–8 °C) and pronounced diurnal and seasonal thermal fluctuations. Mean annual precipitation is relatively modest and spatially heterogeneous, ranging from 300 to 500 mm at the valley floor [20]. It exhibits a distinct increasing gradient from northwest to southeast and from upstream to downstream, reflecting the integrated control of orographic effects and moisture transport. Precipitation is highly seasonal, predominantly concentrated in the summer (May–September); under the coupled influence of the East Asian Summer Monsoon (EASM) and the mid-latitude Westerlies, summer rainfall accounts for a significant portion of the annual total [21]. In the context of global warming, the intensification of extreme precipitation events has been observed across the traditionally arid regions of Northwest China [22,23]. When acting upon the widely distributed unconsolidated Tertiary and Quaternary sediments, these extreme events frequently trigger geological hazards such as landslides and debris flows, posing severe threats to the region [24,25].
Figure 1.
Overview of the study area (The base map was generated using Shuttle Radar Topography Mission (SRTM) data with a 30 m resolution, sourced from https://earthexplorer.usgs.gov, accessed on 10 March 2026).
3. Data and Methods
3.1. Data Sources and Preprocessing
This study used hourly precipitation and air temperature data from 14 national meteorological stations in the Hehuang Valley during the warm seasons (May–September) of 2015–2024 to construct an event-based precipitation database. During preprocessing of the original data, missing values in the hourly series at each station were first examined. The results show that, among 1,222,843 total records, 5403 hourly precipitation observations were missing, corresponding to a missing rate of 0.44%, while 5728 hourly temperature observations were missing, corresponding to a missing rate of 0.47%. Prior to event identification, missing values were filled using linear interpolation to ensure the continuity of the hourly time series and to avoid disruptions affecting event separation and the extraction of inter-event temperature. Basic information for the 14 national meteorological stations in the Hehuang Valley is summarized in Table 1.
Table 1.
Basic information of the 14 national meteorological stations in the Hehuang Valley, including station ID, geographic coordinates, elevation, and valid data years.
Identification of precipitation events: In this study, an event-based approach was adopted to identify warm-season hourly precipitation processes. Previous studies have shown that separating continuous precipitation series based on a minimum rain-free interval is a commonly used method for precipitation-event identification [26]. Among these methods, a 6 h dry interval has been widely used in hourly- and event-scale hydrological analyses [27], although the specific threshold may vary with regional climatic background and research objectives. Based on previous applications of event-separation methods, and considering the intermittent and highly convective characteristics of warm-season precipitation in the Hehuang Valley, this study defined the onset of an event as the time when hourly precipitation reached 1.0 mm [28]. When precipitation remained below 1.0 mm for six consecutive hours after a precipitation process, the preceding event was considered to have ended [29].
Identification of extreme precipitation events: Given that the Hehuang Valley is located in an arid to semi-arid region on the margin of the Tibetan Plateau, where terrain is complex and precipitation background varies substantially, the direct use of a uniform absolute threshold to define extreme precipitation would reduce comparability among stations. Therefore, a percentile-threshold method was adopted to define extreme precipitation events. Specifically, all identified precipitation events at each station during the study period were ranked according to total event precipitation, and events exceeding the 95th percentile were classified as extreme precipitation events, while the remaining events were classified as non-extreme events [30,31]. This method follows the relative-threshold approach commonly used in studies of extreme climate indices and is more suitable for study areas with pronounced regional differences in precipitation climatology.
Inter-event Maximum Temperature (Tmax_inter): The inter-event maximum temperature is defined as the maximum temperature recorded during the dry interval between two successive precipitation events.
3.2. Research Methodology
3.2.1. Trend Analysis
To reveal the temporal variation characteristics of precipitation amount and precipitation intensity in the study area, as well as the significance of their trends, this study employed a combination of the Theil–Sen slope estimator and the Mann–Kendall (MK) trend test for trend analysis [32,33]. The Theil–Sen slope estimator is a non-parametric method for trend estimation characterized by high computational efficiency and low sensitivity to measurement errors and outliers, and it is widely used in the analysis of long-term time series [34]. The Mann–Kendall trend test is a rank-based non-parametric statistical method that does not require the data to follow a specific distribution and is highly robust to outliers, making it suitable for assessing the significance of trends in time series of natural geographic variables such as meteorological and hydrological elements [35]. By calculating the MK statistic Z and its corresponding significance level (p-value), the statistical reliability of trends in precipitation amount and precipitation intensity can be evaluated. The combination of these two methods allows trend analysis to quantify the magnitude of change through Sen’s slope while using the MK test to reduce the influence of data distribution characteristics on significance assessment, thereby improving the scientific rigor and reliability of the results [36].
3.2.2. Cluster Analysis
This study adopted a two-step approach to classify precipitation events. First, uniform events were identified using the peak-to-mean ratio (PMR), which is defined as the ratio of the maximum hourly precipitation intensity within a precipitation event to the mean hourly precipitation intensity over the duration of that event, i.e.,
where PMR denotes the peak-to-mean ratio, is the maximum hourly precipitation intensity within an event, and is the mean hourly precipitation intensity over the event duration. When PMR ≤ 1.30, the event is classified as a uniform event.
Second, for the remaining events with pronounced peaks, the relative peak position was used as the clustering variable, and K-means clustering (k = 2, n_init = 50) was applied to classify them into front-peaked and rear-peaked types [37]. The quality and stability of the clustering results were further evaluated using the silhouette coefficient, Davies–Bouldin index, Calinski–Harabasz index, and adjusted Rand index (ARI).
3.2.3. Logistic Regression Analysis
To deeply explore the nonlinear modulation mechanism of Tmax_inter on the occurrence of extreme precipitation events (EPEs), this study introduces a binary logistic regression model for quantitative analysis. Given that “extreme precipitation” and “non-extreme precipitation” are binary categorical variables, conventional linear regression is inadequate for directly characterizing the relationship between their occurrence probability and temperature. The logistic regression model establishes a nonlinear mapping between the independent variable and the dependent variable (the probability of EPE occurrence) [38]. The dependent variable Y is defined to represent the categorical property of a precipitation event as follows:
The Tmax_inter is selected as the primary explanatory variable (independent variable X). Letting P denote the probability of an extreme precipitation event occurring, defined as P = P (Y = 1/X), the logistic regression model can be expressed as:
In these equations, P/(1 − P) represents the odds, defined as the ratio of the probability of an extreme event occurring to the probability of it not occurring. The term is the intercept, while denotes the regression coefficient, which characterizes both the direction and the magnitude of the impact of temperature fluctuations on the odds of extreme precipitation occurrence.
4. Analysis Results
4.1. Increase in Precipitation Intensity
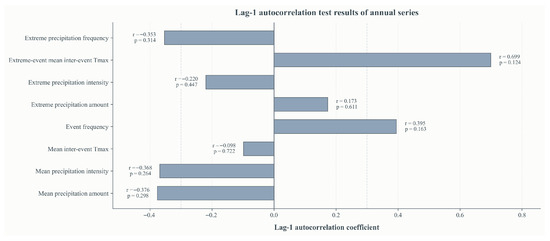
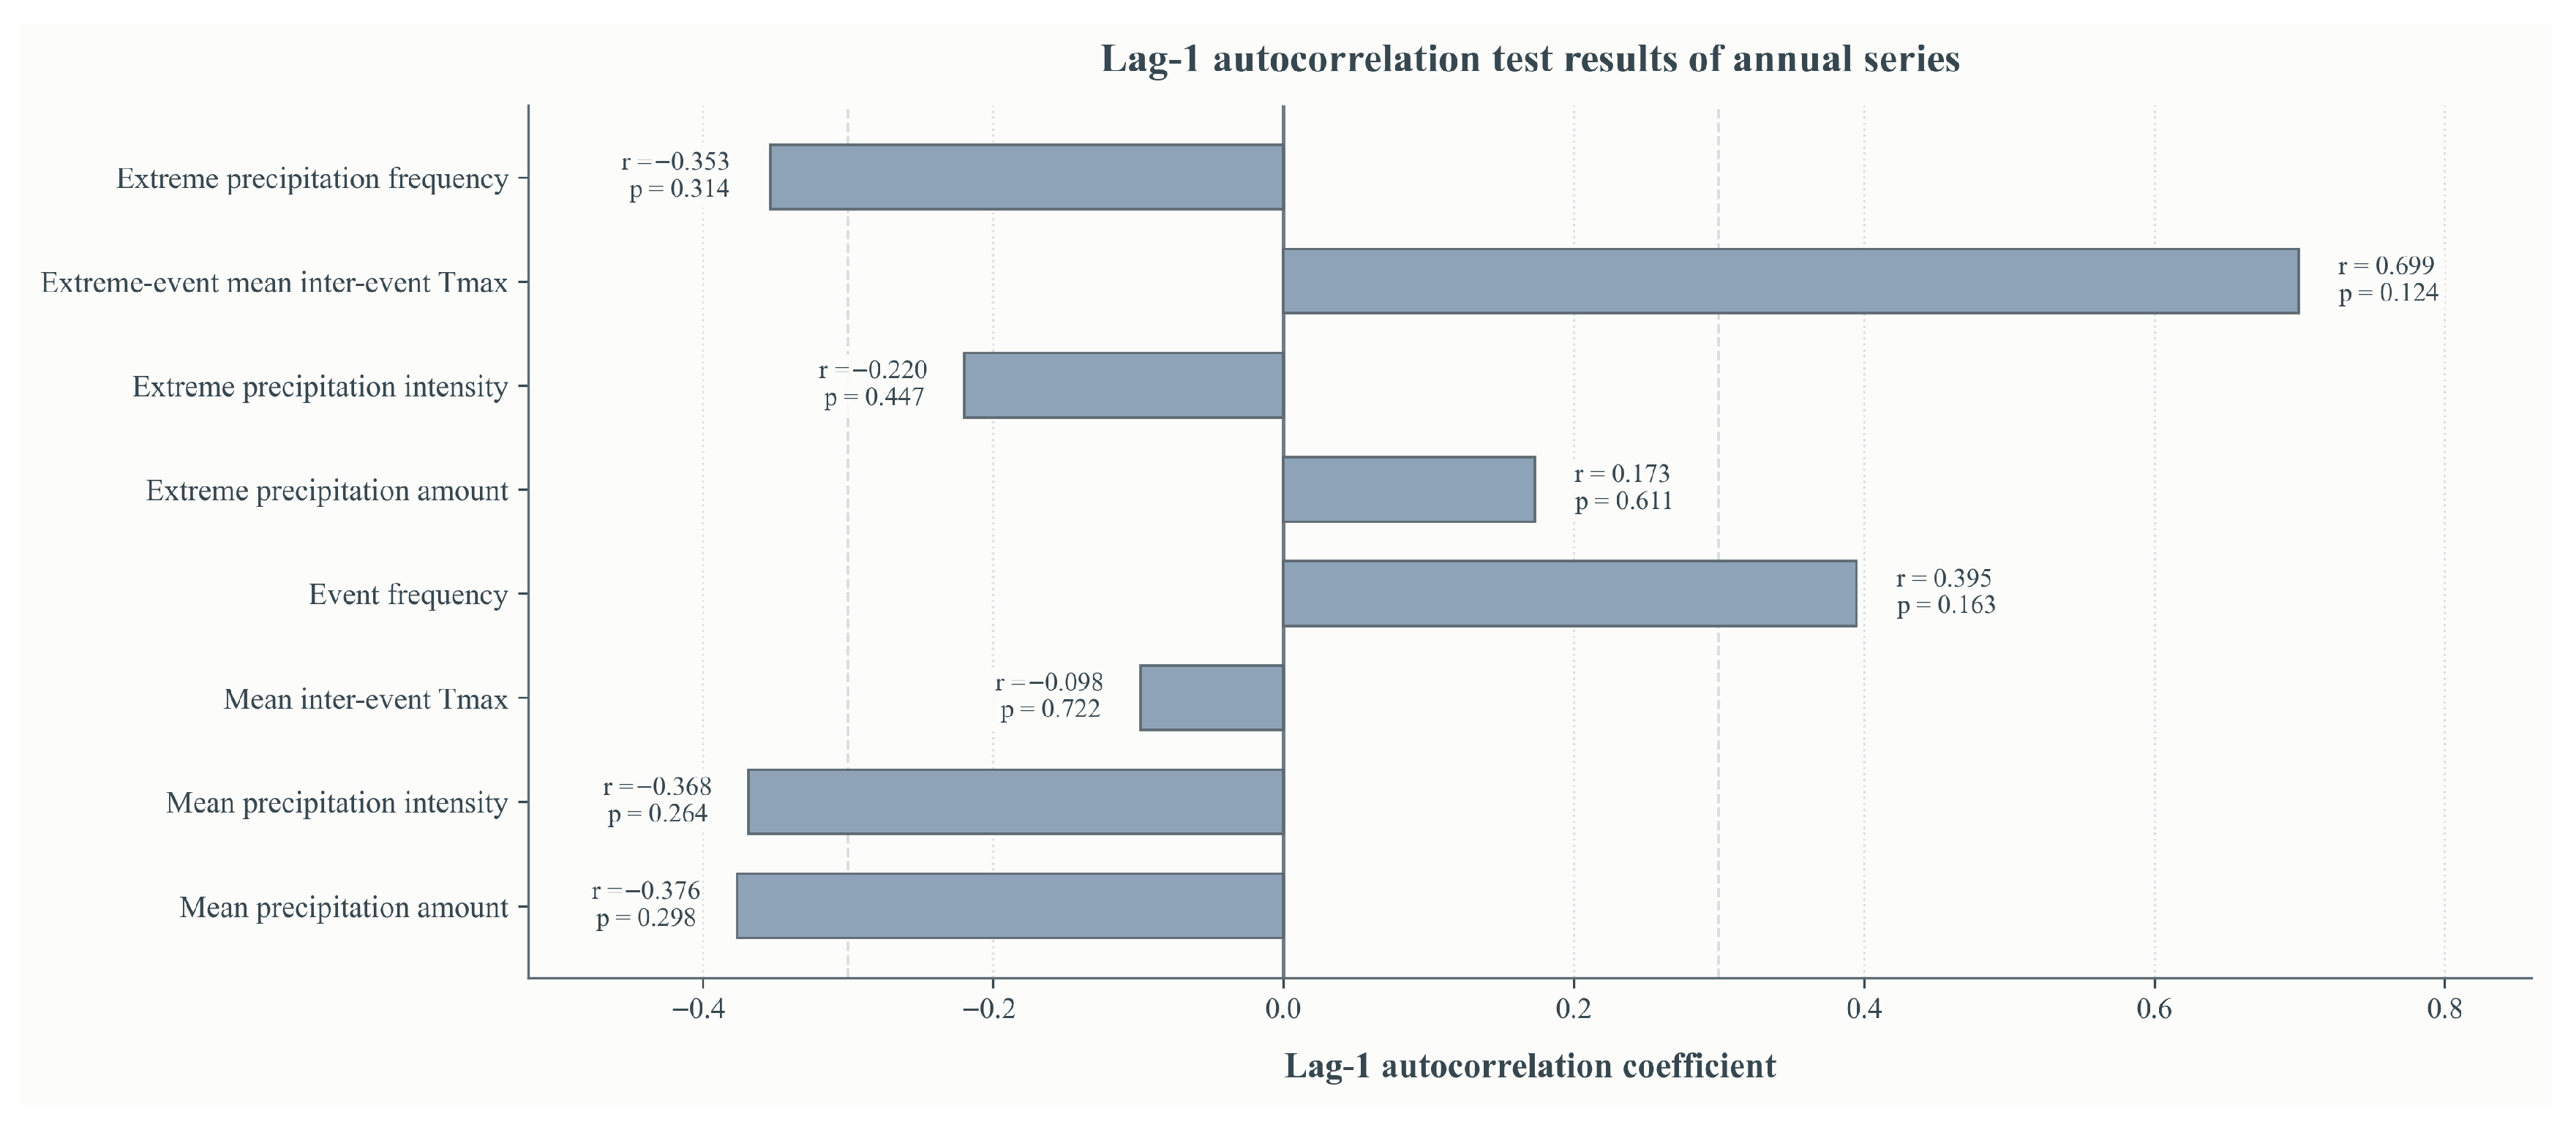
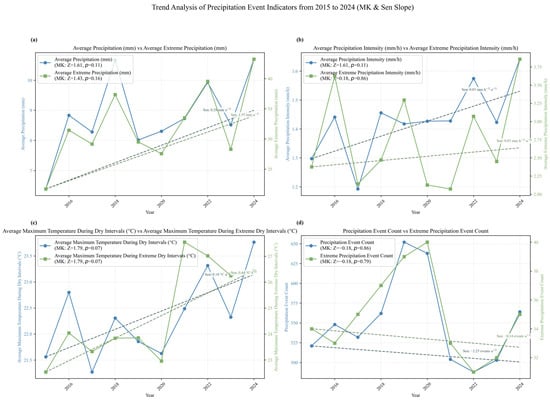
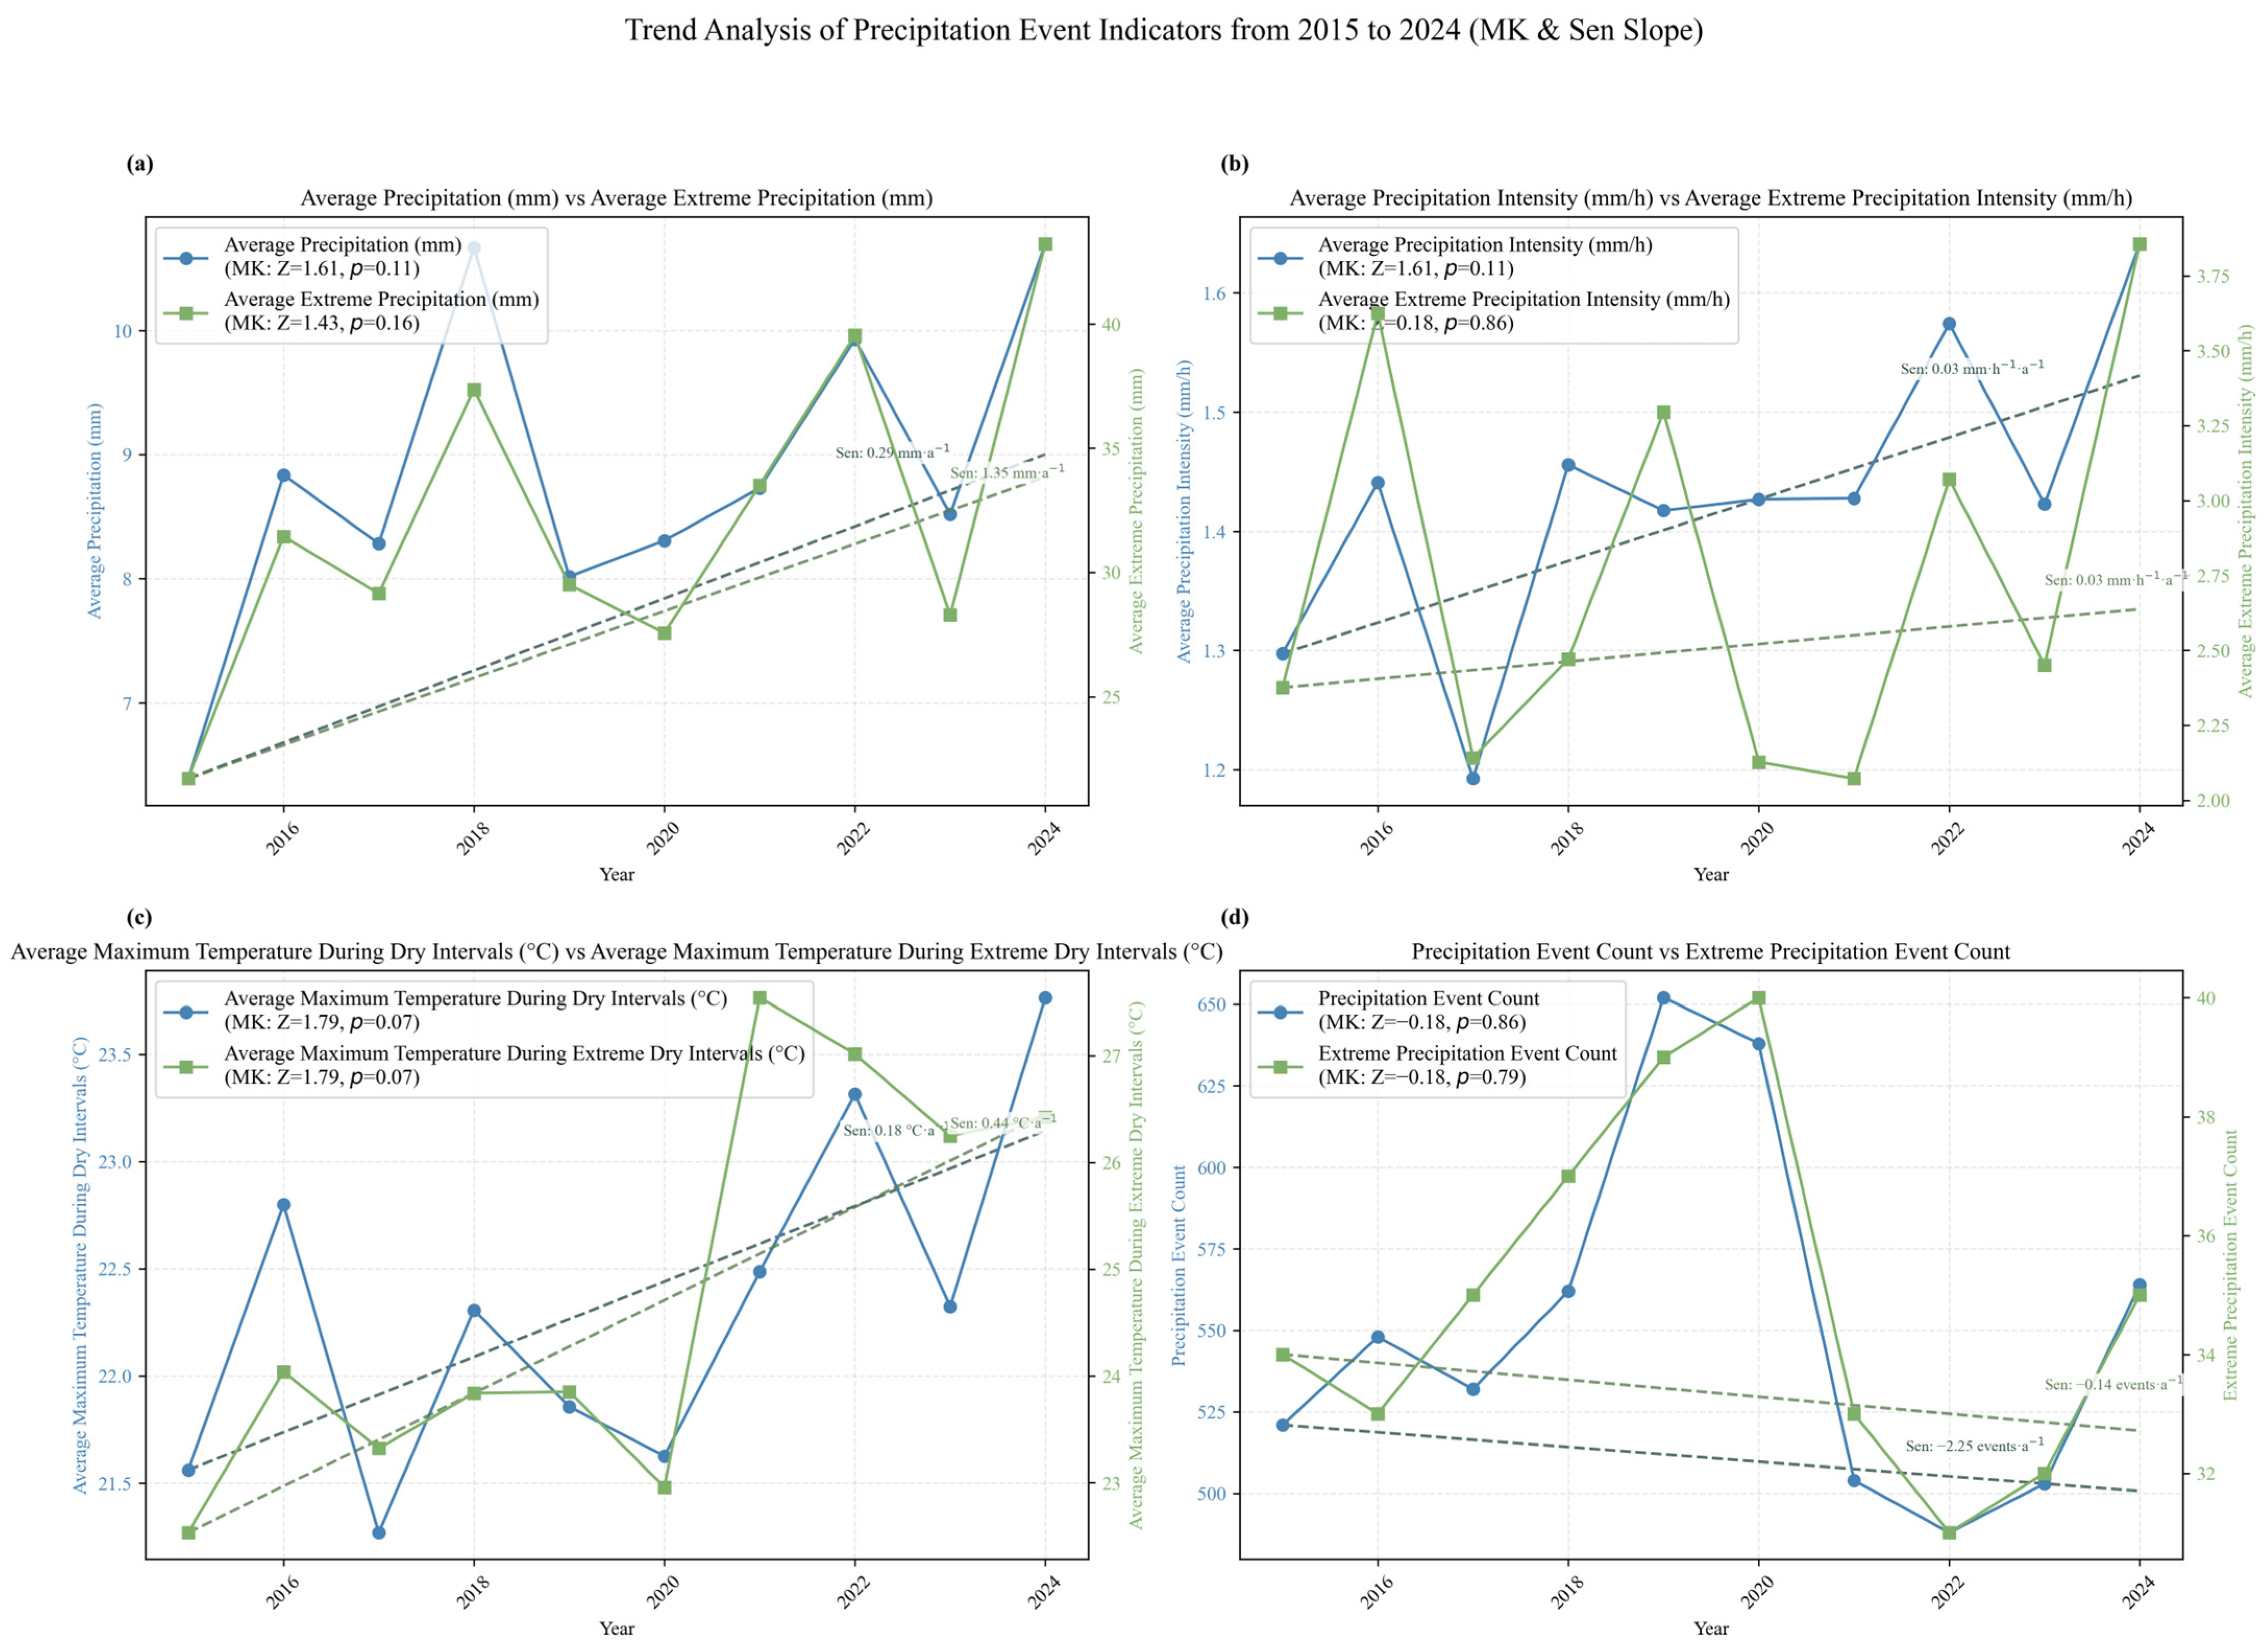
Based on hourly precipitation observations in the Hehuang Valley from 2015 to 2024, the Mann–Kendall trend test and Sen’s slope estimator were applied to conduct a long-term comparative analysis of the mean state of precipitation events (mean precipitation amount, mean precipitation intensity, mean inter-event maximum temperature, and precipitation frequency) and their corresponding extreme state (mean extreme precipitation amount, mean extreme precipitation intensity, mean extreme inter-event maximum temperature, and extreme precipitation frequency) (Figure 2). In addition, to examine whether temporal dependence existed in the interannual series, the eight annual series mentioned above were further subjected to a lag-1 autocorrelation test, and their significance was assessed using the Ljung–Box test. The results show that no significant first-order autocorrelation was detected in any of the series (all p > 0.05), indicating that serial correlation had only a limited influence on the trend test results. On this basis, the variation characteristics of each indicator were further analyzed.
Figure 2.
Results of the autocorrelation tests.
In terms of precipitation amount (Figure 3a), the mean precipitation amount of all precipitation events showed an increasing tendency (Z = 1.61, p = 0.11), although it did not pass the 0.05 significance level test. The Sen’s slope of the mean precipitation amount for extreme events was 1.35 mm·a−1 (Z = 1.43, p = 0.152), which was larger than that of all events, but likewise did not reach statistical significance. In terms of trend magnitude, the precipitation amount of individual extreme events exhibited a relatively stronger increasing tendency.
Figure 3.
Interannual variations in precipitation event indicators in the Hehuang Valley during 2015–2024. (a) Mean precipitation amount of all precipitation events (blue, left y-axis, mm) and extreme precipitation events (green, right y-axis, mm). (b) Mean precipitation intensity of all events (blue, left y-axis, mm·h−1) and extreme events (green, right y-axis, mm·h−1). (c) Mean maximum temperature during dry intervals for all events (blue, left y-axis, °C) and extreme events (green, right y-axis, °C). (d) Counts of all precipitation events (blue, left y-axis, events) and extreme precipitation events (green, right y-axis, events). Dashed lines denote Sen’s slope trends for the corresponding series.
In terms of precipitation intensity (Figure 3b), the mean intensity of all events also showed an increasing tendency (Z = 1.61, p = 0.11), although its statistical significance was limited. By contrast, the MK test result for extreme precipitation intensity was Z = 0.18, p = 0.86, indicating that, over the ten-year period, extreme precipitation intensity did not exhibit a clear monotonic trend but instead showed pronounced interannual fluctuations.
The inter-event maximum temperature showed a relatively more evident upward tendency (Figure 3c). Although neither the inter-event maximum temperature of all events nor that of extreme events passed the 0.05 significance level test, their Sen’s slopes were both positive. In particular, the warming rate of the inter-event maximum temperature preceding extreme precipitation events was 0.44 °C·a−1, higher than the 0.18 °C·a−1 observed for all events. This suggests that extreme precipitation events are more likely to occur under stronger antecedent thermal conditions.
The frequency of precipitation events showed a weak decreasing tendency (Figure 3d). The Sen’s slopes for both the frequency of all precipitation events and that of extreme precipitation events were negative, and the corresponding MK test Z values were also negative, although their statistical significance was weak (p > 0.05). Combined with the aforementioned changes in precipitation amount and intensity, these results suggest that, during the study period, regional precipitation processes may have shifted from a relatively high-frequency, low-intensity pattern toward a relatively low-frequency, high-intensity pattern.
4.2. Changes in Precipitation Types
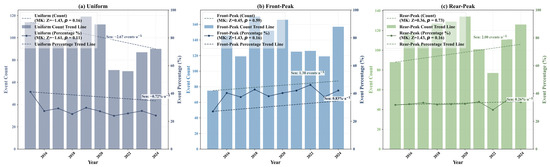
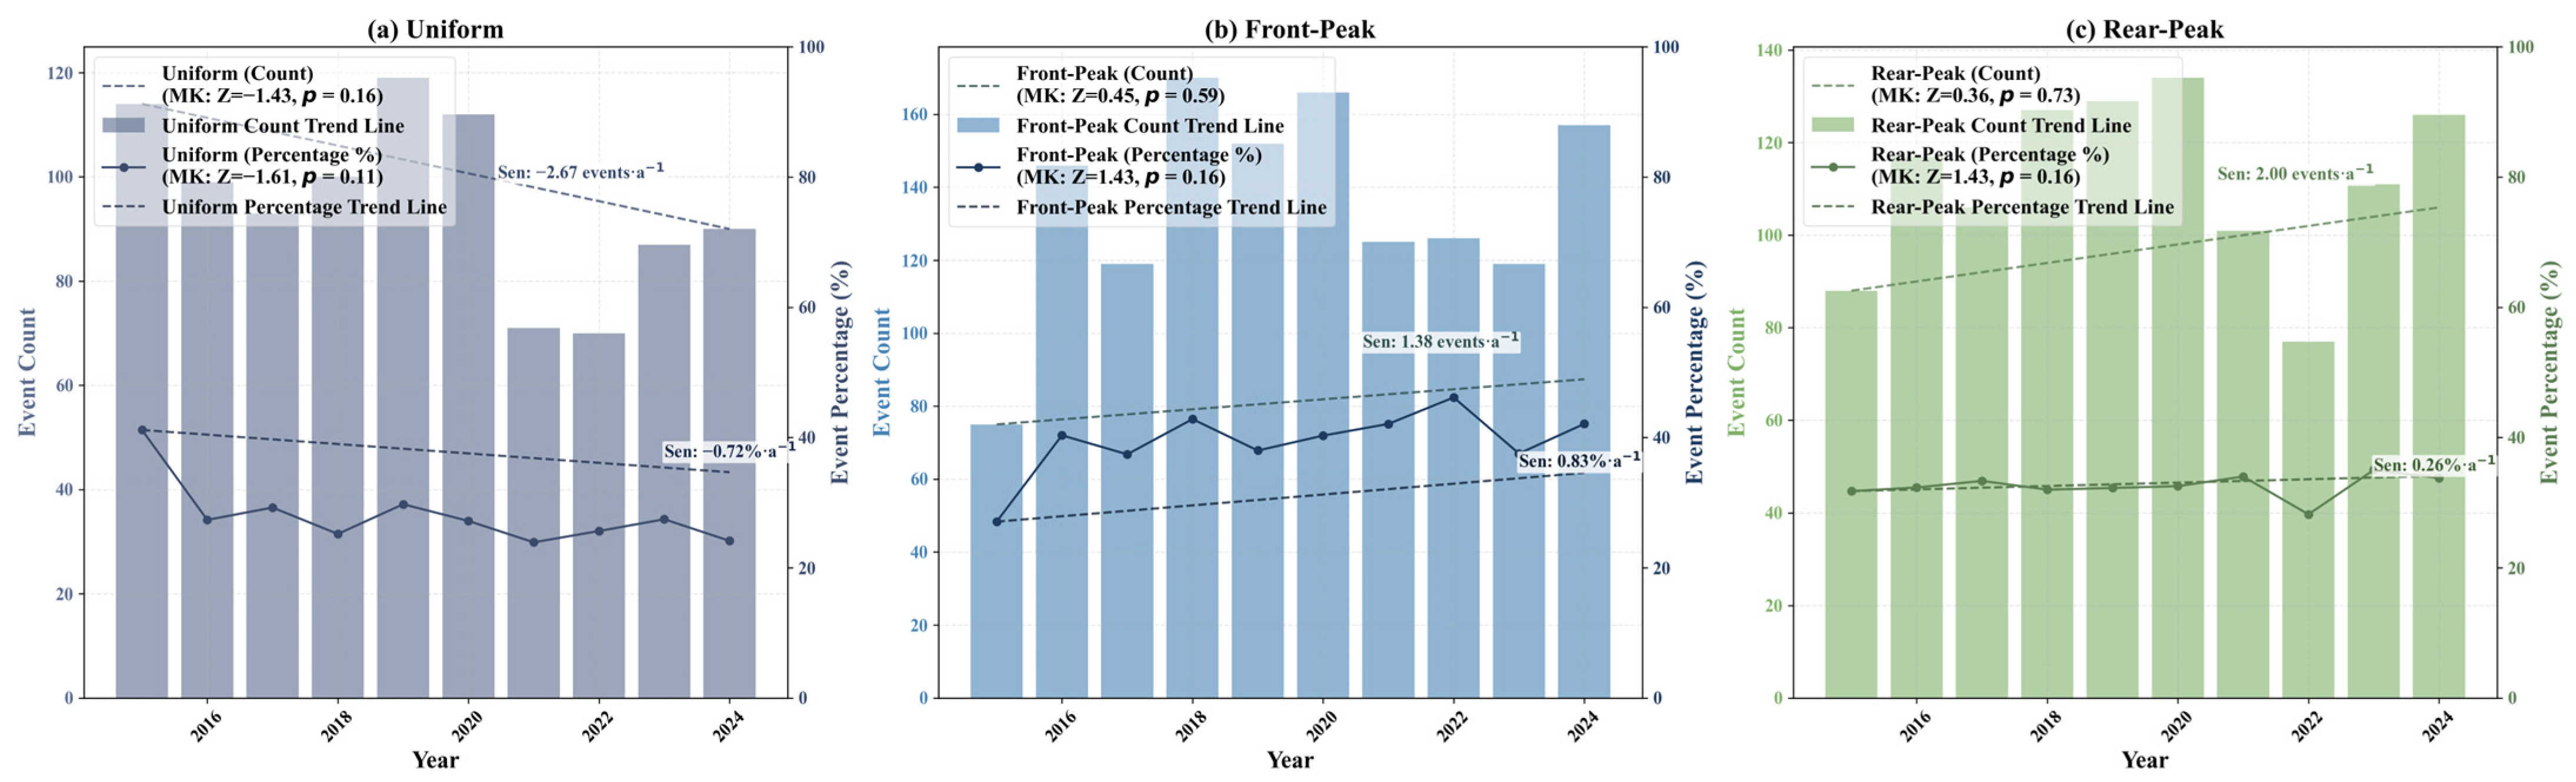
Based on the two-step precipitation-event classification results, warm-season precipitation events were divided into three types—uniform, front-peaked, and rear-peaked—and the interannual variations in the number and proportion of each type during 2015–2024 were analyzed (Figure 4). In the second step, K-means clustering (k = 2) was applied only to events with pronounced peaks to distinguish front-peaked from rear-peaked events. The clustering quality evaluation indicated that the k = 2 solution had good separation and compactness (silhouette coefficient = 0.68, Davies–Bouldin index = 0.45, and Calinski–Harabasz index = 9219.04). In addition, the pairwise adjusted Rand index (ARI) from 30 repeated runs was consistently 1.00, indicating that the clustering results were stable and reliable. Therefore, k = 2 was adopted to classify peaked events into front-peaked and rear-peaked types.
Figure 4.
Interannual variations in the counts and proportions of warm-season precipitation-event types in the Hehuang Valley during 2015–2024. (a) Uniform events; (b) front-peaked events; (c) rear-peaked events. In each panel, the bars denote annual event counts (left y-axis, unit: events), and the solid line with markers denotes annual event proportions (right y-axis, unit: %). The dashed line shows the Sen’s slope trend for counts, whereas the dash-dotted line shows the Sen’s slope trend for proportions. The legends also report the corresponding Mann–Kendall test results (Z and p-value) for both counts and proportions.
Overall, all three precipitation types exhibited certain interannual fluctuations, but their directions of change were not consistent, suggesting that the internal temporal distribution structure of warm-season precipitation events in the Hehuang Valley has been undergoing adjustment. The number of uniform events showed an overall decreasing trend, with a Sen’s slope of −2.67 events·a−1 and Mann–Kendall test results of Z = −1.43 and p = 0.16. Their proportion also declined, with a Sen’s slope of −0.72%·a−1, Z = −1.61, and p = 0.11. Although these trends did not reach the 0.05 significance level, the results indicate that relatively flat precipitation events without pronounced internal peaks have generally decreased over the past decade, implying a weakening of uniformity in regional precipitation processes. The number of front-peaked events showed a weak increasing trend, with a Sen’s slope of 1.38 events·a−1, Z = 0.45, and p = 0.59, while their proportion also increased, with a Sen’s slope of 0.83%·a−1, Z = 1.43, and p = 0.16. This suggests that some precipitation events have become more likely to reach their peak in the early stage of the event, indicating an enhancement of front-loaded rainfall release, although the change did not reach statistical significance. Rear-peaked events also showed an increasing trend in number, with a Sen’s slope of 2.00 events·a−1, Z = 0.36, and p = 0.73, while their proportion had a Sen’s slope of 0.26%·a−1, Z = 1.43, and p = 0.16. Although the increasing trends in both number and proportion were not statistically significant, they still suggest that the main rainfall peak of some events has shifted later in the event duration, with a corresponding increase in rear-concentrated precipitation processes.
4.3. Nonlinear Response of Precipitation to Temperature
The preceding analysis demonstrates that extreme precipitation in the Hehuang Valley is characterized by intensification and a structural shift toward non-uniform patterns. According to the principles of atmospheric thermodynamics, surface heating serves as a critical precursory factor driving the development of deep moist convection (DMC). To verify this mechanism, this study adopts the Tmax_inter as a thermodynamic indicator. Violin plots (Figure 5) are utilized to characterize the morphological evolution of its probability distribution, and a binary logistic regression model (Figure 6) is integrated to quantify the nonlinear modulation of Tmax_inter on the occurrence of extreme precipitation.
Figure 5.
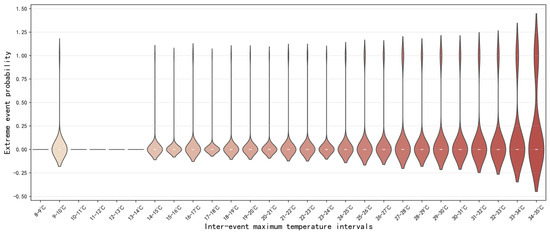
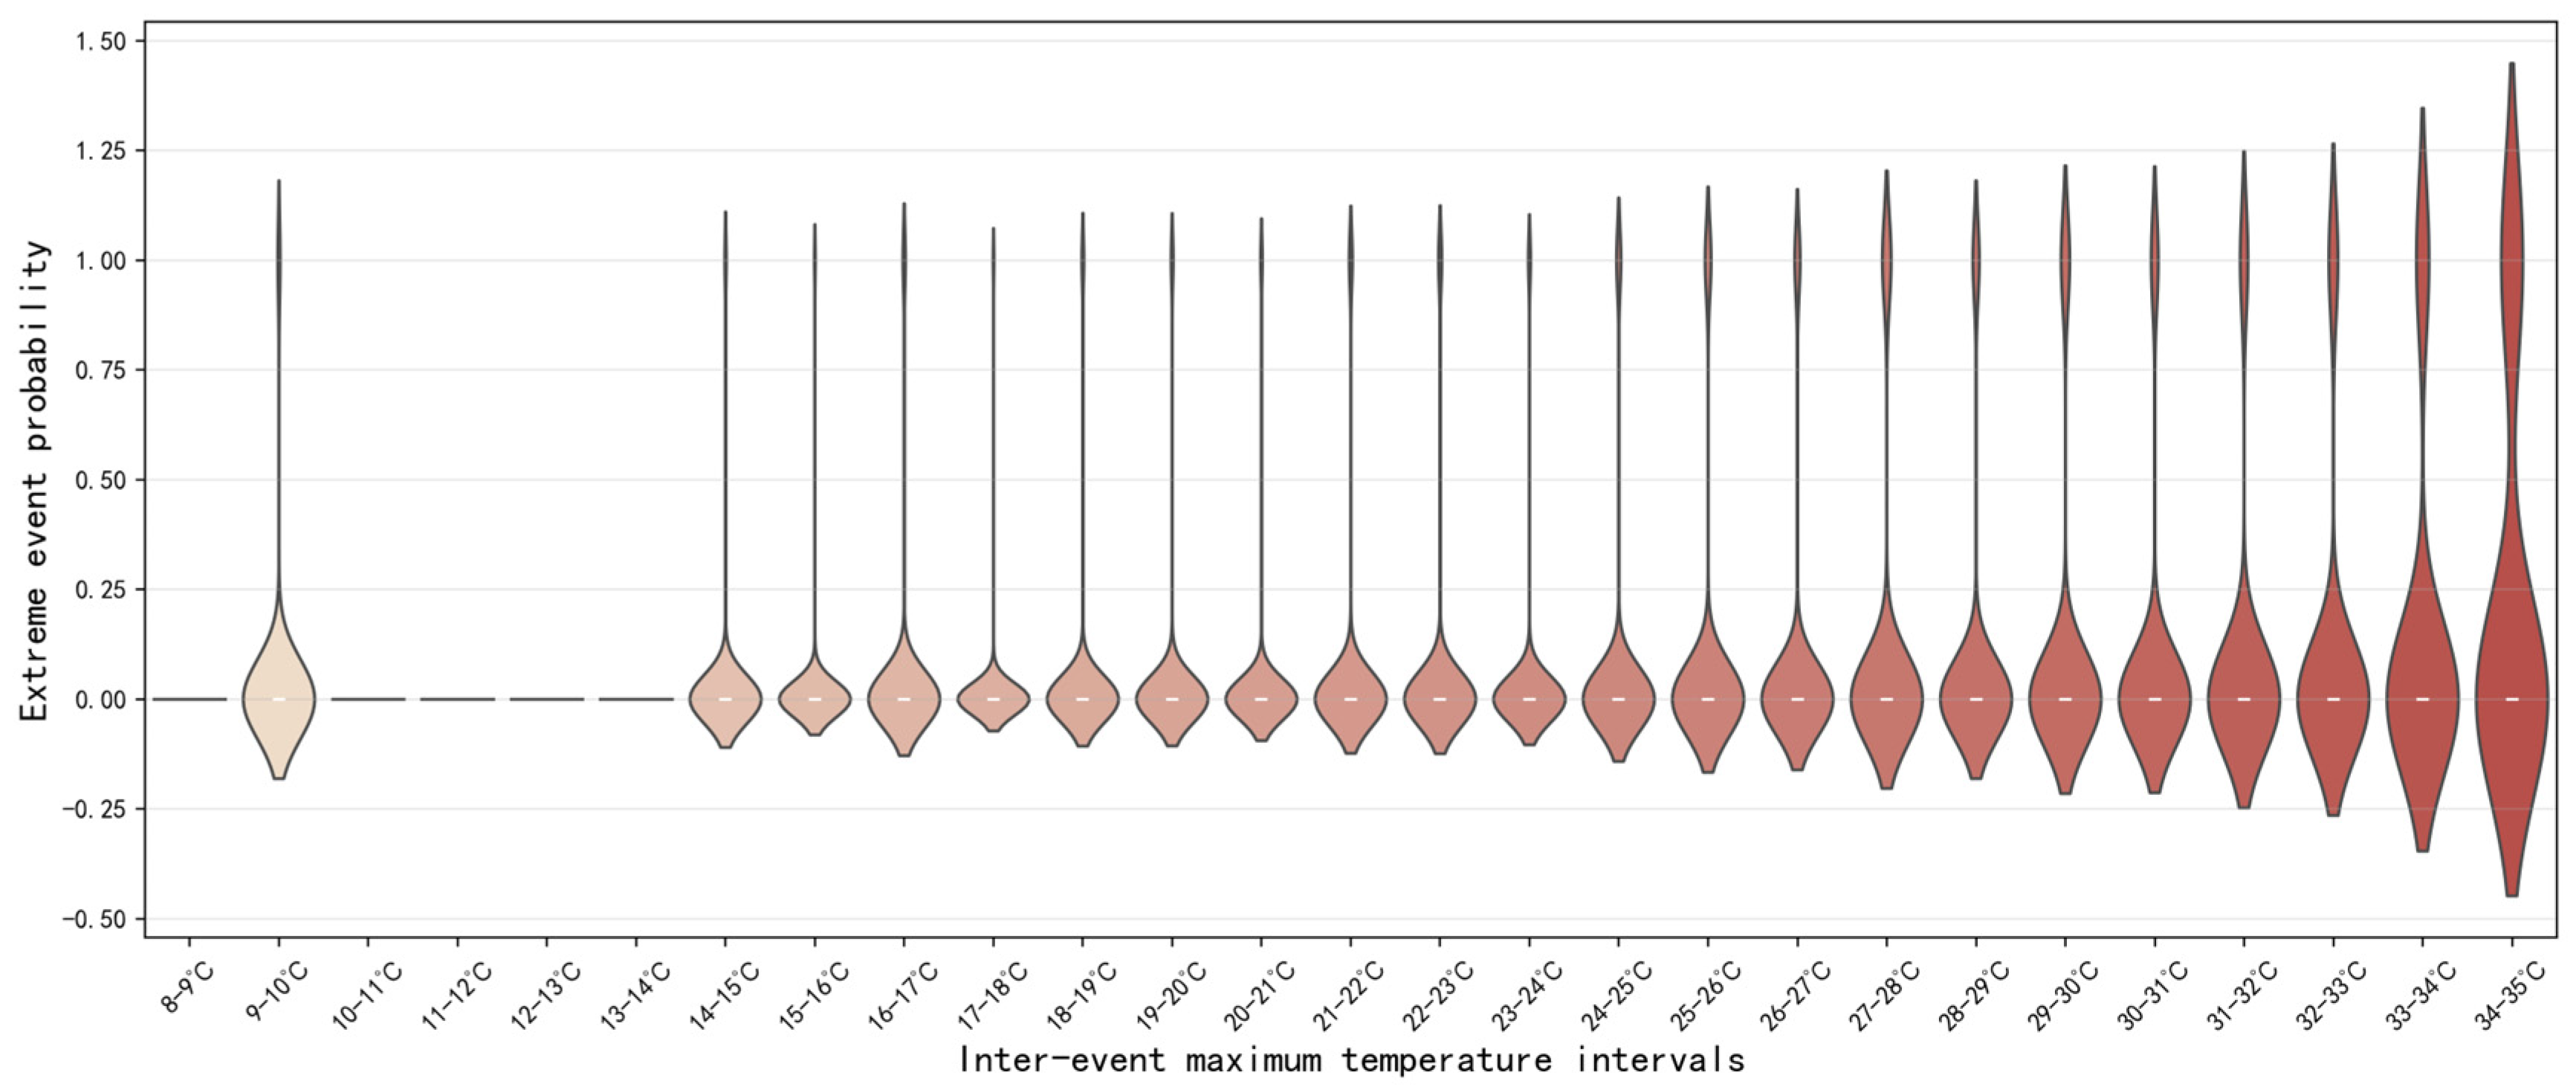
Violin plots of the probability distribution of extreme precipitation occurrence across 1 °C intervals of inter-event maximum temperature. The slight extension of some violins below 0 or above 1 is a kernel-density smoothing artefact and does not represent actual probabilities beyond the valid range of 0–1.
Figure 6.
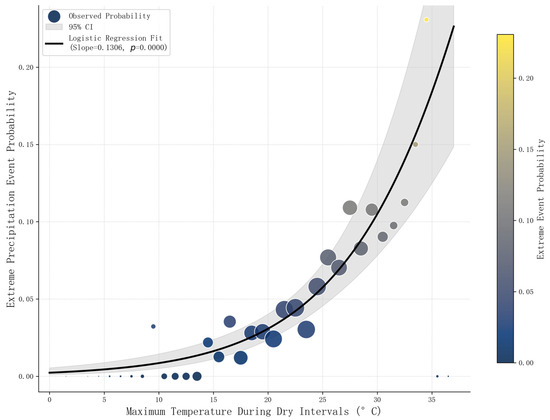
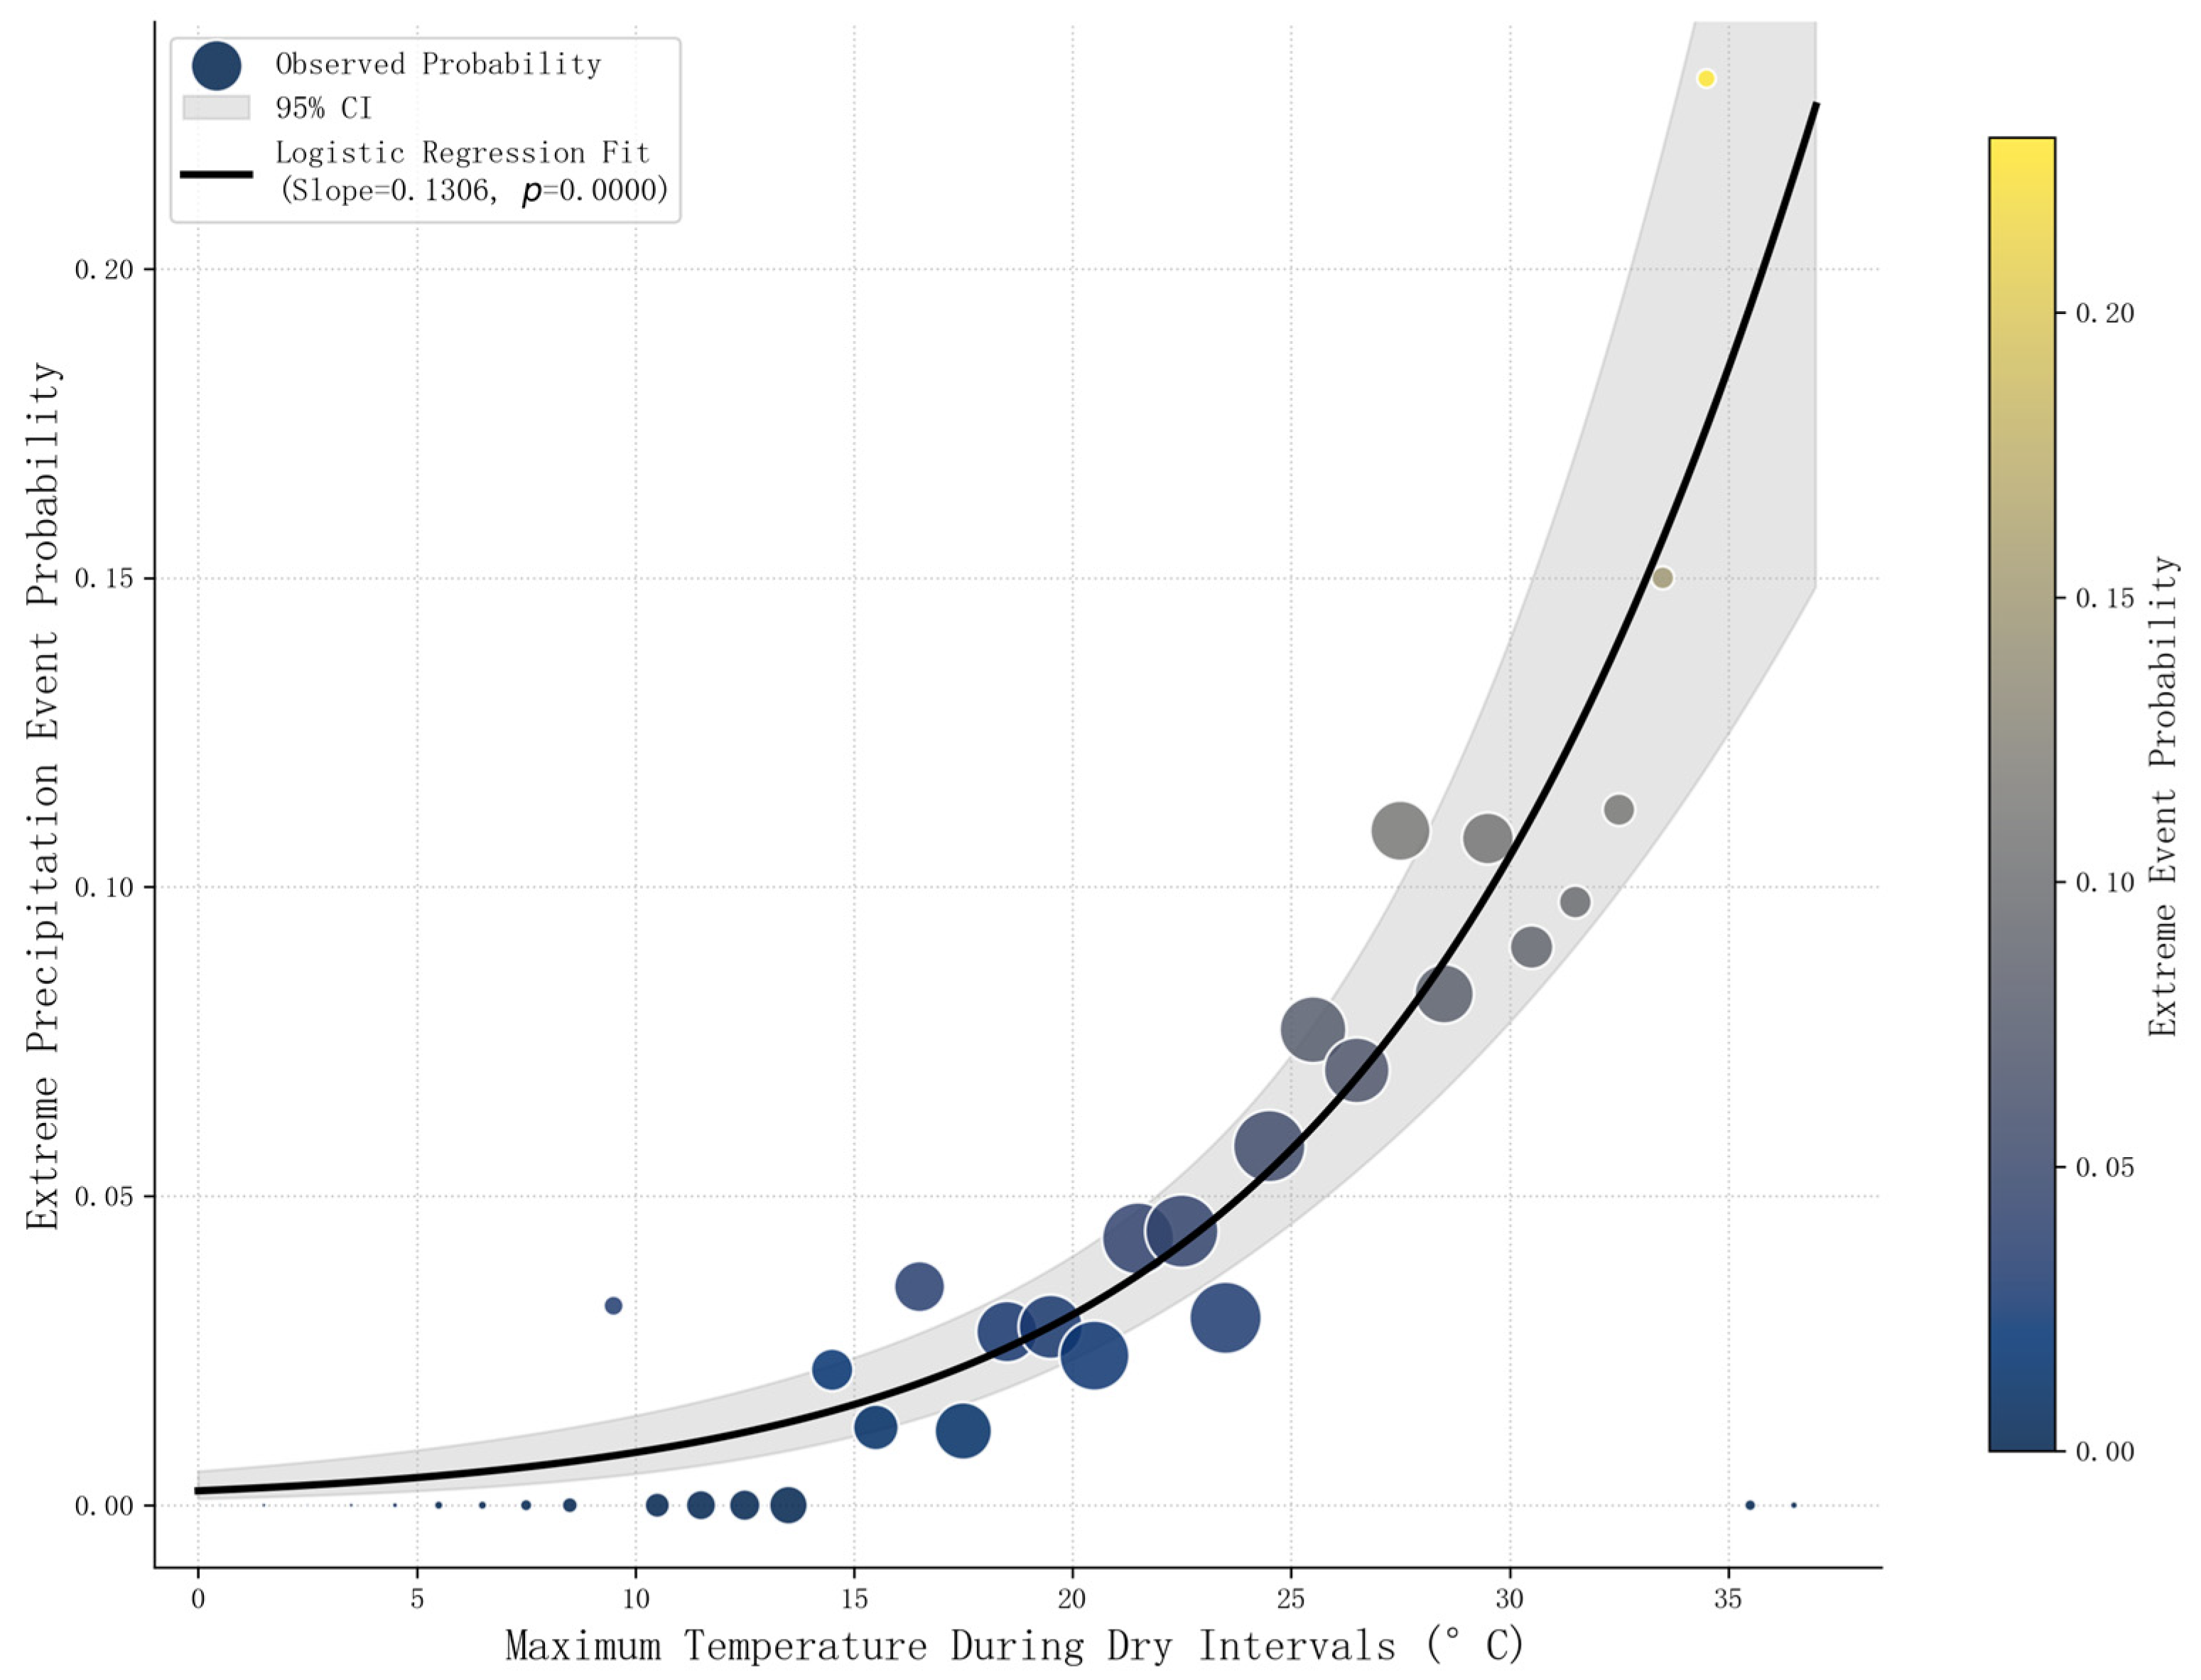
Event-level logistic regression between inter-event maximum temperature and extreme precipitation occurrence probability. Observed probabilities are shown as bubbles for each 1 °C Tmax_inter interval; bubble size is proportional to the number of events in each interval, and bubble colour indicates the observed probability. The solid line shows the fitted logistic regression curve, and the shaded band indicates its 95% confidence interval.
Figure 5 employs violin plots to illustrate the density distribution characteristics of extreme precipitation probability across different intervals of Tmax_inter, The figure intuitively demonstrates that antecedent Tmax_inter exerts a significant modulatory effect on the occurrence probability of extremes. When Tmax_inter is low (<20 °C), the violin shapes are extremely compressed and closely aligned with the zero baseline, with the probability distribution highly concentrated in the low-value range. This indicates that under insufficient thermal conditions, atmospheric stratification remains relatively stable, hindering the development of the intense convection required for extreme precipitation. As Tmax_inter crosses the 20 °C threshold, the morphology of the probability distribution undergoes a marked transformation. The violin plots stretch significantly in the vertical direction, and the center of gravity of the distribution gradually shifts upward. This vertical elongation represents a substantial increase in the dispersion of the probability distribution, implying that the accumulating thermal energy begins to erode atmospheric stability. Consequently, both the likelihood and the uncertainty of extreme precipitation occurrence increase simultaneously. In the high-temperature intervals exceeding 30 °C, the distribution morphology exhibits a prominent “long-tail” characteristic, with the bulk of the probability density shifting toward the positive/higher-value range. This suggests that under high thermal backgrounds, extreme precipitation events transition from occasional stochastic occurrences to high-frequency response events characterized by a high degree of physical determinism.
To overcome the discreteness inherent in bin-based statistics, an event-level logistic regression analysis was conducted using a total of 5498 precipitation events during the warm seasons of 2015–2024. The results show that the inter-event maximum temperature was significantly positively associated with the probability of extreme precipitation occurrence. After estimation using station-clustered robust standard errors, the regression coefficient of inter-event maximum temperature was 0.1306 (p < 0.001), corresponding to an odds ratio (OR) of 1.134, with a 95% confidence interval of 1.10–1.17. This indicates that, with other conditions held constant, each 1 °C increase in inter-event maximum temperature was associated with an average 13.4% increase in the odds of an extreme precipitation event. As shown in Figure 6, the fitted event-level logistic regression curve exhibited an overall monotonic upward pattern, indicating that the empirical probability of extreme precipitation generally increased with stronger antecedent thermal conditions. The gray shaded area in the figure represents the 95% confidence interval of the fitted curve, which is overall continuous and smooth, suggesting good statistical stability of this positive relationship.
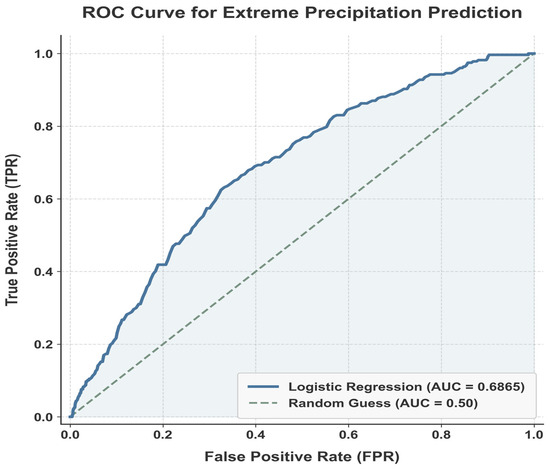
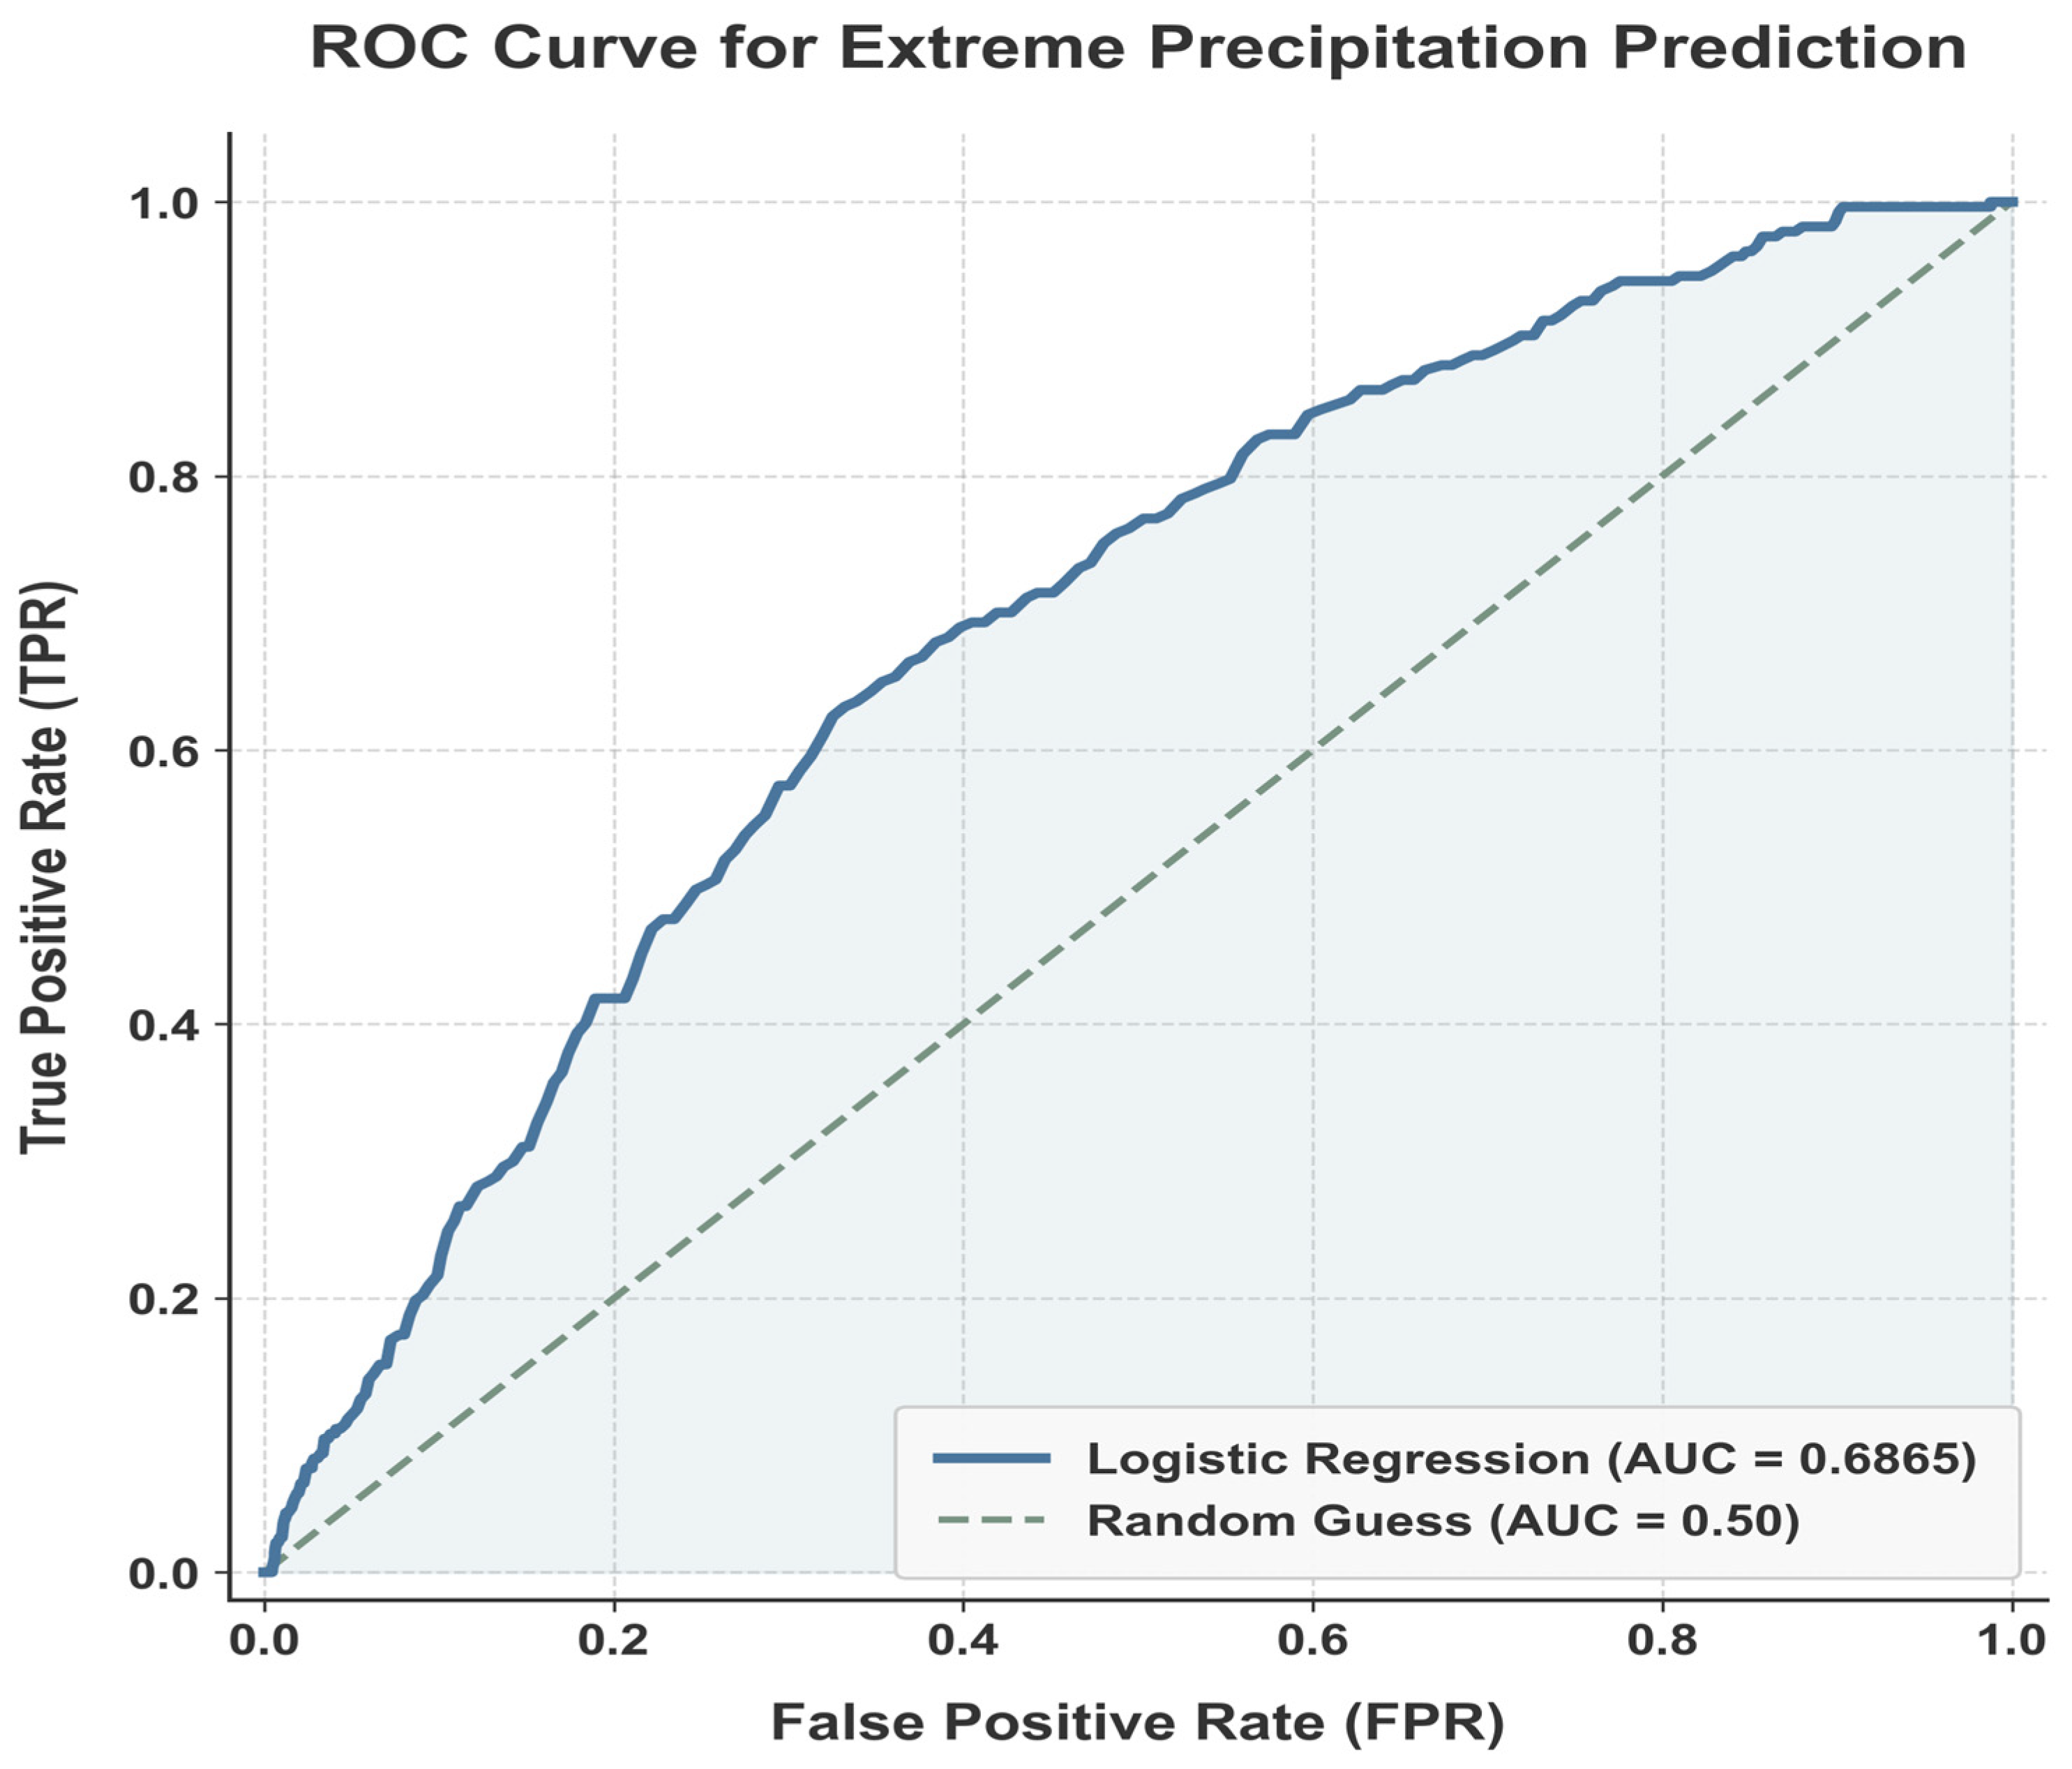
Model evaluation results show that the area under the ROC curve (AUC) based on the full sample was 0.6865, with a 95% confidence interval of 0.65–0.71. The 5-fold cross-validated AUC was 0.68 ± 0.02, and the results varied only slightly across folds, indicating that the model had relatively stable but overall limited discriminatory ability. At the optimal threshold corresponding to the Youden index, the model sensitivity was 0.63 and the specificity was 0.67, indicating that the inter-event maximum temperature alone, as a single thermal indicator, could provide a certain degree of discriminatory information for extreme precipitation events, although its explanatory power remained limited (Figure 7). To test the robustness of these results, a sensitivity model including station fixed effects and year fixed effects was further constructed. The results show that the temperature term remained significantly positive, with a regression coefficient of 0.1839, corresponding to an OR of 1.2 and a 95% confidence interval of 1.16–1.24 (p < 0.001). This indicates that the positive relationship between inter-event maximum temperature and the probability of extreme precipitation occurrence was not simply driven by differences among stations or by interannual variability, but instead showed good statistical robustness. Overall, extreme precipitation events in the Hehuang Valley were more likely to occur under stronger antecedent thermal conditions, and antecedent warming exerted a stable positive influence on the probability of extreme precipitation occurrence. This is consistent with the overall agreement between the observed probability points, calculated for 1 °C temperature intervals, and the fitted logistic regression curve. Although the probability of extreme precipitation was generally higher in the higher-temperature range, some local fluctuations remained. These fluctuations were more evident at the high-temperature end, mainly because of the reduced sample size within those temperature intervals.
Figure 7.
ROC curve for extreme precipitation prediction.
5. Discussion
This study examines the internal structure of warm-season precipitation processes in the Hehuang Valley from an event-based perspective, as well as their response to antecedent thermal conditions. The results show that the most prominent feature of warm-season precipitation change in the study area over the past decade is not a marked increase in precipitation frequency, but rather an enhancement in the intensity of individual events and an adjustment in the intra-event temporal distribution from relatively even patterns toward more peak-concentrated ones. The number and proportion of uniform events generally decreased, whereas the proportions of front-peaked and rear-peaked events increased, indicating that the internal organization of warm-season precipitation processes in the Hehuang Valley has undergone a certain degree of reorganization. Although most of these trends did not reach strict statistical significance, their directions are broadly consistent with previous studies suggesting that, under warming conditions, extreme precipitation may become not only “stronger” but also characterized by a reorganization of its internal temporal structure [12]. In plateau-margin mountainous valley regions, such changes have important hydrological and hazard implications: when precipitation peaks are released over shorter periods, rainfall intensity per unit time becomes greater, surface infiltration–runoff conversion accelerates, and slope and channel flow responses become more intense, thereby increasing the likelihood of amplifying secondary disaster risks such as flash floods, landslides, and debris flows [39].
From a possible physical perspective, the Hehuang Valley possesses both plateau and mountain-valley characteristics, and its local thermal and dynamic processes are highly complex. Antecedent high temperature may provide a more favorable thermal background for subsequent heavy precipitation events by enhancing surface evapotranspiration, increasing the moisture-holding capacity of near-surface air, and altering boundary-layer thermal stability [1,40]. The inter-event maximum temperature introduced in this study is intended to characterize such antecedent thermal accumulation during the interval between successive precipitation events. The logistic regression results show that for every 1 °C increase in Tmax_inter, the odds of extreme precipitation occurrence increase by approximately 13.4%, indicating a stable positive statistical relationship between antecedent thermal accumulation and the probability of extreme precipitation occurrence. This suggests that, at the event scale, Tmax_inter is more effective than concurrent temperature indicators in characterizing the thermal background before extreme precipitation occurs, and it also provides new observational evidence for understanding the relationship between antecedent warming and subsequent extreme precipitation. However, this relationship should still be interpreted with caution. The model AUC in this study was 0.6865, and the 5-fold cross-validation results also indicate that the model has relatively stable but overall limited discriminatory ability. Therefore, Tmax_inter is better regarded as a thermal indicator for identifying extreme precipitation risk rather than as a complete predictive tool. The formation of extreme precipitation is still fundamentally controlled by multiple interacting factors, including moisture transport, convective triggering, circulation background, and topographic lifting [10].
Several limitations of this study should be emphasized. First, the data period only covers the warm seasons from 2015 to 2024. Although this is sufficient to support event-scale analysis and short-term statistical comparisons, it is still insufficient for drawing strong conclusions about long-term climatic trends in regional extreme precipitation. Therefore, expressions such as “enhancement” or “adjustment” in this paper should be understood as indications of change during the past decade rather than as robust long-term climatic evolution. Second, this study is based on data from 14 national meteorological stations, which can reasonably capture regional-scale characteristics but may still be insufficient to fully represent small-scale differences in a region with complex terrain. Third, the event-identification threshold, dry-interval setting, and two-step classification framework may influence the classification results of some events. Finally, relative humidity, moisture flux, convective available potential energy, and large-scale circulation background were not incorporated into a unified model. Therefore, the discussion of extreme precipitation formation mechanisms in this study remains mainly based on statistical associations and physical inference. Future work combining longer time series, reanalysis data, and multi-source remote sensing products, together with multivariable modeling that includes thermal, moisture, and dynamic factors, would help to more comprehensively reveal the formation mechanisms and regional differences in extreme precipitation in plateau-margin mountainous areas.
Despite these limitations, the results of this study still provide useful implications for disaster prevention and mitigation in the Hehuang Valley and similar plateau-margin mountainous valley regions. On the one hand, the shift in precipitation events from uniform to more peak-concentrated non-uniform patterns suggests that the key determinant of hazard risk is no longer simply the total rainfall amount, but also the timing of the rainfall peak within an event and the mode of short-duration rainfall release. Therefore, it is necessary to incorporate event hyetograph characteristics into monitoring and warning systems for flash floods and geological hazards. On the other hand, the stable positive relationship between Tmax_inter and the probability of extreme precipitation occurrence suggests that high-temperature conditions during inter-event periods may serve as an auxiliary indicator for identifying high-risk weather backgrounds in operational practice. When combined with short-term forecasting, radar echoes, and moisture monitoring, this information may support more forward-looking warnings for warm-season severe convective weather and related secondary disasters. In densely populated and urbanized valley areas, such a chain-based understanding linking “antecedent thermal background–precipitation event structure–hazard response” may provide a more targeted scientific basis for flood-control scheduling, geological hazard inspection, and risk prevention during critical periods.
6. Conclusions
Based on high-resolution meteorological observation data from 2015 to 2024 in the Hehuang Valley, this study systematically analyzed the spatiotemporal differentiation of precipitation processes at the event scale and quantified the nonlinear influence of antecedent thermal conditions on extreme precipitation. The primary conclusions are summarized as follows:
1. During 2015–2024, warm-season precipitation in the Hehuang Valley was generally characterized by fluctuating frequency and increasing intensity. The internal structure of precipitation events showed a tendency to shift from relatively uniform temporal distribution toward more peak-concentrated patterns, specifically reflected in a decrease in the proportion of uniform events and increases in the proportions of front-peaked and rear-peaked events.
2. The inter-event maximum temperature was significantly positively associated with the probability of extreme precipitation occurrence. Logistic regression results show that for every 1 °C increase in Tmax_inter, the odds of extreme precipitation occurrence increased by approximately 13.4%, indicating a stable positive statistical relationship between antecedent thermal accumulation and extreme precipitation occurrence. Overall, at the event scale, Tmax_inter may serve as an auxiliary antecedent thermal indicator for identifying extreme precipitation risk in plateau-margin mountainous regions.
Author Contributions
Conceptualization, W.T. and F.L.; methodology, W.T. and W.M.; validation, Q.C., H.L. and J.Z.; formal analysis, W.T. and J.L.; resources, F.L.; data curation, W.T. and H.L.; writing—original draft preparation, W.T.; writing—review and editing, F.L., W.M., Q.Z., Q.C., H.L., J.Z. and J.L.; visualization, W.T. and J.Z.; supervision, F.L.; project administration, F.L. and Q.Z.; funding acquisition, F.L. and Q.C. All authors have read and agreed to the published version of the manuscript.
Funding
This research was funded by the Key Basic Research Program of Qinghai Province, grant number 2024-ZJ-904-01; and the “Research on the Process and Mechanism of the Impact of Meteorological Disasters on the Ecological Environment” project, grant number 2019YFA0606902. The APC was funded by the “Research on the Process and Mechanism of the Impact of Meteorological Disasters on the Ecological Environment” project, grant number 2019YFA0606902.
Institutional Review Board Statement
Not applicable.
Informed Consent Statement
Not applicable.
Data Availability Statement
The hourly precipitation data presented in this study are not publicly available due to confidentiality restrictions, but can be obtained upon reasonable request by applying to the relevant meteorological departments. The Shuttle Radar Topography Mission (SRTM) DEM data used for spatial analysis are openly available and can be sourced from the USGS EarthExplorer (https://earthexplorer.usgs.gov, accessed on 10 March 2026.). The analysis scripts used in this study are available from the corresponding author upon reasonable request.
Conflicts of Interest
The authors declare no conflicts of interest. The funders had no role in the design of the study; in the collection, analyses, or interpretation of data; in the writing of the manuscript; or in the decision to publish the results.
Abbreviations
The following abbreviations are used in this manuscript:
| C–C | Clausius–Clapeyron |
| DEM | Digital Elevation Model |
| DMC | Deep Moist Convection |
| EASM | East Asian Summer Monsoon |
| EDW | Elevation-Dependent Warming |
| EPEs | Extreme Precipitation Events |
| Tmax_inter | Inter-event Maximum Temperature |
| TP | Tibetan Plateau |
References
- Moustakis, Y.; Onof, C.J.; Paschalis, A. Atmospheric convection, dynamics and topography shape the scaling pattern of hourly rainfall extremes with temperature globally. Commun. Earth Environ. 2020, 1, 11. [Google Scholar] [CrossRef] [Scilit]
- Cui, P.; Wang, Y.; Zhang, G.T.; Zhang, Z.T.; Lei, Y.; Wang, H.; Wang, J.; Hao, J.S.; Zhu, H. Disaster risk prevention under climate change: Current status, challenges, and scientific issues. Adv. Clim. Chang. Res. 2025, 21, 449–460. [Google Scholar]
- Pall, P.; Allen, M.R.; Stone, D.A. Testing the Clausius–Clapeyron constraint on changes in extreme precipitation under CO2 warming. Clim. Dyn. 2006, 28, 351–363. [Google Scholar] [CrossRef] [Scilit]
- Da Silva, N.A.; Haerter, J.O. Super-Clausius–Clapeyron scaling of extreme precipitation explained by shift from stratiform to convective rain type. Nat. Geosci. 2025, 18, 382–388. [Google Scholar] [CrossRef] [Scilit] [PubMed]
- Ghausi, S.A.; Zehe, E.; Ghosh, S.; Tian, Y.; Kleidon, A. Thermodynamically inconsistent extreme precipitation sensitivities across continents driven by cloud-radiative effects. Nat. Commun. 2024, 15, 10669. [Google Scholar] [CrossRef] [Scilit] [PubMed]
- Lenderink, G.; van Meijgaard, E. Increase in hourly precipitation extremes beyond expectations from temperature changes. Nat. Geosci. 2008, 1, 511–514. [Google Scholar] [CrossRef] [Scilit]
- Bird, L.J.; Bodeker, G.E.; Clem, K.R. Sensitivity of extreme precipitation to climate change inferred using artificial intelligence shows high spatial variability. Commun. Earth Environ. 2023, 4, 469. [Google Scholar] [CrossRef] [Scilit]
- Ombadi, M.; Risser, M.D.; Rhoades, A.M.; Varadharajan, C. A warming-induced reduction in snow fraction amplifies rainfall extremes. Nature 2023, 619, 305–310. [Google Scholar] [CrossRef] [Scilit]
- Peleg, N.; Koukoula, M.; Marra, F. A 2 °C warming can double the frequency of extreme summer downpours in the Alps. npj Clim. Atmos. Sci. 2025, 8, 216. [Google Scholar] [CrossRef] [Scilit]
- Gu, L.; Yin, J.; Gentine, P.; Wang, H.M.; Slater, L.J.; Sullivan, S.C.; Chen, J.; Zscheischler, J.; Guo, S. Large anomalies in future extreme precipitation sensitivity driven by atmospheric dynamics. Nat. Commun. 2023, 14, 3197. [Google Scholar] [CrossRef] [Scilit]
- Fowler, H.J.; Lenderink, G.; Prein, A.F.; Westra, S.; Allan, R.P.; Ban, N.; Barbero, R.; Berg, P.; Blenkinsop, S.; Do, H.X.; et al. Anthropogenic intensification of short-duration rainfall extremes. Nat. Rev. Earth Environ. 2021, 2, 107–122. [Google Scholar] [CrossRef] [Scilit]
- Ghanghas, A.; Sharma, A.; Merwade, V. Unveiling the evolution of extreme rainfall storm structure across space and time in a warming climate. Earths Future 2024, 12, e2024EF004675. [Google Scholar] [CrossRef] [Scilit]
- Fan, L.; Lehmann, P.; Zheng, C.; Or, D. Rainfall Intensity Temporal Patterns Affect Shallow Landslide Triggering and Hazard Evolution. Geophys. Res. Lett. 2020, 47, e2019GL085994. [Google Scholar] [CrossRef] [Scilit]
- Wang, R.J.; Huang, D.Q. Characteristics of compound heatwaves and precipitation extremes of warming season in China from 1979 to 2024. Adv. Earth Sci. 2025, 40, 974–986. [Google Scholar]
- Yang, D.; Song, J.P.; Yang, Z.S.; Chen, D.J. Spatiotemporal dynamics of land use transition on the Qingzang Plateau over the past 120 years. Geogr. Res. 2025, 44, 2080–2102. [Google Scholar]
- Xu, B.; Mao, X.F.; Li, J.M.; Tang, W.J.; Wei, X.Y. Constructing ecological security pattern of the Hehuang Valley based on MSPA and circuit theory. Ecol. Sci. 2025, 44, 161–170. [Google Scholar]
- Tian, W.; Liu, F.; Zhou, Q.; Ma, W.; Chen, Q.; Zhi, Z.; Zhang, Z.; Zhang, Q. Analysis of the causes of giant landslide clustering in the upper reaches of the Yellow River since the Holocene. Geoenviron. Disasters 2026, 13, 1. [Google Scholar] [CrossRef] [Scilit]
- Cui, P.; Guo, X.J.; Jiang, T.H.; Zhang, G.T.; Jin, W. Disaster effect induced by Asian Water Tower change and mitigation strategies. Bull. Chin. Acad. Sci. 2019, 34, 1313–1321. [Google Scholar]
- Zhang, Z.X. Geography of Qinghai; Qinghai People’s Publishing House: Xining, China, 2004; pp. 62–210. [Google Scholar]
- Cheng, Y.; Zhao, W.; Jiao, J.; Zhang, L.; Cao, X.; Chen, T.; Li, J.; Zhang, Z. Soil conservation effect of cropland use change in the Yellow River-Huangshui River Valley over the past 20 years. Sci. Soil Water Conserv. 2023, 21, 55–63. [Google Scholar]
- Li, H.H.; Huang, Y.M.; Guo, W.; Hou, H.Y.; Fan, M.Y.; Qi, X.P.; Jia, P.H.; Guo, Q.B. Influence of land use and land cover patterns on water quality at different spatio-temporal scales in Hehuang Valley. Environ. Sci. 2022, 43, 4042–4053. [Google Scholar]
- Wang, G.; Wang, D.; Trenberth, K.; Erfanian, A.; Yu, M.; Bosilovich, M.G.; Parr, D. The peak structure and future changes of the relationships between extreme precipitation and temperature. Nat. Clim. Chang. 2017, 7, 268–274. [Google Scholar] [CrossRef] [Scilit]
- Ma, M.; Tang, J.; Ou, T.; Chen, D. Subdaily Extreme Precipitation and Its Linkage to Global Warming Over the Tibetan Plateau. J. Geophys. Res. Atmos. 2023, 128, e2023JD039062. [Google Scholar] [CrossRef] [Scilit]
- Ma, W.; Liu, F.; Zhou, Q.; Chen, Q.; Zhang, C.; Liu, F.; Li, Y.; Zhao, P. Estimation of critical rainfall for flood disasters in the Qinghai-Tibet Plateau. J. Resour. Ecol. 2021, 12, 600–608. [Google Scholar] [CrossRef] [Scilit]
- Liang, Y.; Zhao, J.; Wei, Z.; Lai, Q.; Zhang, Z.; Chen, H.; Dong, J. Deformation characteristics and triggering mechanisms of the Huzhu landslide in Qinghai: An “air–space–ground–subsurface” perspective. Landslides 2025, 22, 3705–3723. [Google Scholar] [CrossRef] [Scilit]
- Tu, A.; Zeng, J.; Liu, Z.; Zheng, H.; Xie, S. Effect of minimum inter-event time for rainfall event separation on rainfall properties and rainfall erosivity in a humid area of southern China. Geoderma 2023, 431, 116332. [Google Scholar] [CrossRef] [Scilit]
- Cao, S.; Diao, Y.; Wang, J.; Liu, Y.; Raimondi, A.; Wang, J. KDE-based rainfall event separation and characterization. Water 2023, 15, 580. [Google Scholar] [CrossRef] [Scilit]
- Wang, W.; Yin, S.; Xie, Y.; Nearing, M.A. Minimum inter-event times for rainfall in the eastern monsoon region of China. Trans. ASABE 2019, 62, 9–18. [Google Scholar] [CrossRef] [Scilit]
- Brasil, J.B.; Guerreiro, M.S.; Andrade, E.M.; Palácio, H.A.Q.; Medeiros, P.H.A.; Ribeiro Filho, J.C. Minimum rainfall inter-event time to separate rainfall events in a low latitude semi-arid environment. Sustainability 2022, 14, 1721. [Google Scholar] [CrossRef] [Scilit]
- Jia, X.; Liu, F.; Dong, W.; Chen, X.; Qian, Q. Amplified summer extreme precipitation over the Tibetan Plateau in the early 21st century. npj Clim. Atmos. Sci. 2025, 8, 390. [Google Scholar] [CrossRef] [Scilit]
- Ombadi, M.; Nguyen, L.; Gaur, S.; Gronewold, A.; Reich, P.B. Increased dependency on extreme precipitation in a warmer climate. Water Resour. Res. 2026, 62, e2025WR042627. [Google Scholar] [CrossRef] [Scilit]
- Wessels, K.J.; van den Bergh, F.; Scholes, R.J. Limits to detectability of land degradation by trend analysis of vegetation index data. Remote Sens. Environ. 2012, 125, 10–22. [Google Scholar] [CrossRef] [Scilit]
- Che, T.; Hao, X.H.; Dai, L.Y.; Li, H.Y.; Huang, X.D.; Xiao, L. Snow cover variation and its impacts over the Qinghai-Tibet Plateau. Bull. Chin. Acad. Sci. 2019, 34, 1247–1253. [Google Scholar]
- Zhao, Z.L.; Jiang, X.; Su, Y.; Yin, L.J.; Luo, T.; Zhao, W.Q.; Luo, J.H. Analysis of vegetation changes and influencing factors in Guiyang city over the past 33 years based on the kNDVI and OPGD model. Environ. Sci. 2025, 46, 5839–5849. [Google Scholar]
- Peng, T.; Fan, Y.Y.; Yi, X.Y. Spatio-temporal characteristics of precipitation concentration in typical basins of southwestern Hubei during recent 30 years. Water Sav. Irrig. 2025; in press.
- Ke, J.H.; He, W.T.; Huang, W.Q.; Luo, R.B. Research on the multidimensional evolution patterns of extreme heat events in China. Geogr. Res. 2025, 44, 1755–1769. [Google Scholar]
- Wartalska, K.; Kaźmierczak, B.; Nowakowska, M.; Kotowski, A. Analysis of hyetographs for drainage system modeling. Water 2020, 12, 149. [Google Scholar] [CrossRef] [Scilit]
- Zhang, H.R.; Yu, B.; Xu, P.; Zeng, F.X. Analysis of landslide susceptibility in the upper reaches of the Yellow River based on logistic regression model. Yellow River 2025, 47, 35–39. [Google Scholar]
- Roohi, M.; Dehghani, J.; Irani, M.; Mina, P. A comprehensive review of flood damage in mountainous regions: Challenges, solutions, and advanced management technologies. Discov. Geosci. 2025, 3, 59. [Google Scholar] [CrossRef] [Scilit]
- Rao, X.; Zhang, J.; Chen, T. Coupling of Land Surface Thermodynamics With Atmospheric Dynamics Effect on Summer Extreme Precipitation in the Northern Tibetan Plateau. J. Geophys. Res. Atmos. 2025, 130, e2025JD044632. [Google Scholar] [CrossRef] [Scilit]

Disclaimer/Publisher’s Note: The statements, opinions and data contained in all publications are solely those of the individual author(s) and contributor(s) and not of MDPI and/or the editor(s). MDPI and/or the editor(s) disclaim responsibility for any injury to people or property resulting from any ideas, methods, instructions or products referred to in the content. |
© 2026 by the authors. Licensee MDPI, Basel, Switzerland. This article is an open access article distributed under the terms and conditions of the Creative Commons Attribution (CC BY) license.