


Abstract
This study introduces a novel unsupervised framework, ICR-LLS, for detecting pathological gait patterns using instantaneous center of rotation (ICR) trajectories of the shank in the sagittal plane. ICR trajectories were computed from two-dimensional kinematic data captured at the lateral femoral epicondyle and lateral malleolus for both shanks, producing four-dimensional multivariate time series for each gait trial. Pairwise trajectory dissimilarities were quantified using circularly aligned Dynamic Time Warping (DTW), preserving temporal and spatial structure. The resulting dissimilarity matrix was embedded into a three-dimensional space using a force-directed network layout, enabling intuitive visualization of inter-subject gait relationships. Density-based clustering (DBSCAN), enhanced with a consensus-based ensemble approach, was employed to automatically identify clusters representing typical (healthy) gait patterns and outliers corresponding to pathological deviations. The framework is evaluated on a public dataset comprising individuals with Parkinson’s disease (PD) and healthy controls, achieving a normalized mutual information (NMI) of 0.449 and a Separation-to-Compactness Ratio (SCR) of 6.754, indicating a meaningful cluster structure. In addition, classification-oriented metrics yield an accuracy of 90%, sensitivity of 70%, and specificity of 96.7%, supporting the method’s effectiveness in distinguishing pathological gait. By combining minimal 2D kinematic inputs with unsupervised learning, ICR-LLS provides an interpretable framework for the exploratory analysis of gait variability, and although further validation is required, the findings suggest that ICR trajectories may serve as a meaningful biomechanical descriptor for characterizing pathological locomotion.
1. Introduction
Parkinson’s disease (PD) is a chronic and progressive neurodegenerative disorder that primarily affects motor function. It is caused by the degeneration of dopaminergic neurons in the substantia nigra, leading to hallmark motor symptoms such as tremor, rigidity, bradykinesia, and postural instability. Among these, gait disturbances and impaired postural control are particularly prominent and often appear early in the disease course, even before other symptoms become fully evident [1].
To monitor PD progression, clinicians frequently rely on standardized rating scales. The Hoehn and Yahr scale classifies PD severity into five stages based on motor symptoms and functional independence [2], while the Unified Parkinson’s Disease Rating Scale (UPDRS) provides a more detailed multidimensional assessment, including motor function, cognitive and emotional changes, activities of daily living, and treatment side effects, with higher scores indicating more severe impairment [3]. Although these tools are widely used in clinical settings, they are inherently subjective and may lack the sensitivity to capture early or subtle motor impairments.
A distinct motor manifestation of PD is the so-called parkinsonian gait, characterized by a stooped posture, reduced arm swing, stumbling steps, and overall instability [4]. These gait abnormalities not only reflect the severity of motor dysfunction, but also contribute significantly to the risk of falls. It is estimated that approximately 70% of PD patients experience at least one fall annually, and 39% suffer recurrent falls. Importantly, recurrent falls are associated with a median survival of just six years [5]. Beyond causing physical injuries such as fractures, falls also lead to fear of falling again, increased caregiver burden, more frequent hospital visits, and gradual loss of independence.
Given the central role of gait dysfunction in PD, gait analysis has emerged as a valuable tool for both diagnosis and disease monitoring. By quantifying changes in spatiotemporal parameters such as stride length, gait speed, and variability, it is possible to detect subtle motor deficits that may not be apparent during a clinical examination [6]. As a result, gait analysis is increasingly being used to complement traditional assessment methods, providing objective information on the functional impact of the disease and supporting the development of targeted interventions.
Although standard spatiotemporal metrics provide useful information, locomotion disorders, particularly in neurodegenerative conditions such as PD, often involve a complex interplay of neurological and musculoskeletal impairments, including involuntary movements, partial paralysis, and balance deficits [7]. These complexities highlight the need for analytical methods capable of distinguishing pathological gait patterns from normal ones with greater precision. Traditional approaches often rely on the comparison of key gait parameters with normative datasets obtained from healthy controls [8]. For basic measurements such as walking speed or step length, simple numerical comparisons may be sufficient. However, as the dimensionality and variability of gait data increase, more advanced analytical tools are required.
To address this challenge, researchers have explored various strategies aimed at capturing the complexity of gait dynamics. An approach involves the use of geometric distance-based similarity metrics to analyze multidimensional gait data. For instance, Lee et al. [9] collected data using sensors placed on the head, waist, and legs as participants engaged in daily activities such as walking, standing, and climbing stairs. Their method used these measurements to compute gait similarity and detect deviations from typical movement patterns. In a related effort, Ramakrishnan et al. [10] proposed a Comprehensive Gait Asymmetry Metric (CGAM), which applies a modified Mahalanobis distance to examine gait features derived from both motion capture and force plate data. Their results demonstrated that CGAM is effective in identifying asymmetries, offering a more sensitive assessment of gait abnormalities than conventional metrics.
Another widely used strategy involves skeletal modeling, in which simplified representations of the human body are created by tracking anatomical landmarks over time [11]. These models allow for the computation of frame-by-frame distance metrics or statistical descriptors, such as covariance matrices of joint angles, to identify deviations from typical movement patterns. For instance, Khokhlova et al. proposed a classification framework based on flexion angles obtained from Kinect data, using the K-nearest neighbors algorithm to detect abnormalities without requiring prior segmentation of the gait cycle [12].
With the increasing availability of high-dimensional gait data, machine learning techniques have gained prominence in the classification of pathological movements. Algorithms such as neural networks [13], support vector machines [14], and random forests [15] have achieved a strong performance in distinguishing between healthy and impaired gait, especially in applications related to PD and post-stroke rehabilitation [16]. These models are capable of handling both binary classification problems (e.g., healthy versus pathological) and multiclass problems involving multiple neurological conditions [17]. Beyond classification, other approaches have focused on modeling the temporal dynamics of gait. For instance, Chen et al. [18] proposed a method that integrates hidden Markov models with machine learning techniques to capture and recognize abnormal gait patterns over time, providing a more nuanced understanding of gait variability in neurological disorders.
While supervised models are powerful, they rely on labeled data and may not generalize well to new or ambiguous cases. In contrast, unsupervised learning methods can reveal hidden structures in gait data without the need for predefined categories [19,20]. Several studies have applied clustering techniques to characterize gait. Chantraine et al. [21] employed a dual clustering strategy to capture knee movement trajectories across multiple planes, allowing for a detailed characterization of joint dynamics. Similarly, Mulroy et al. [22] applied non-hierarchical clustering to classify stroke patients based on spatiotemporal and kinematic gait features observed during the recovery process, revealing different rehabilitation trajectories between subgroups of patients. These unsupervised approaches demonstrate the potential of clustering to capture meaningful distinctions in motor function.
Despite significant advances in gait analysis, some biomechanical parameters remain insufficiently studied. One of these is the instantaneous center of rotation (ICR), which defines the point around which a segment rotates at a specific instant in time. The ICR has been widely used in biomechanical research to study joint stability [23], the relationship between tissue abnormalities and mechanical changes, and lumbar spine mechanics, particularly in relation to load-dependent variations during lifting tasks [24]. However, its application to gait analysis, especially for capturing continuous segmental rotations during locomotion, has been largely neglected. Prior studies have primarily focused on isolated joint mechanics or specific motor tasks without addressing the dynamic evolution of the ICR throughout the gait cycle. To our knowledge, no research has yet examined the trajectories of ICR in the lower extremities as markers of gait dysfunction. This represents an important gap, as ICR trajectories may offer valuable insights into intersegmental coordination and subtle motor control deficits during walking, which are characteristic of PD-related gait impairments.
Building on this gap, our previous study [25] introduced ICR trajectories as a meaningful biomechanical descriptor to assess gait dynamics. Motivated by these findings, the present study proposes an unsupervised framework to detect pathological gait patterns by analyzing the ICR trajectories of the shank in the sagittal plane. Using pairwise dissimilarity measures, ICR trajectories are embedded into a 3D space via a self-organizing algorithm, creating a topological representation of gait similarity. Subsequent cluster analysis uncovers groups of consistent gait patterns and isolates outliers that may potentially indicate pathological gait. The proposed methodology, named Instantaneous Center of Rotation of Lower Limb Segments (ICR-LLS), is validated on publicly available kinematic datasets to distinguish Parkinsonian gait from healthy controls. By leveraging this underutilized biomechanical descriptor, the proposed ICR-LLS methodology offers a novel, data-driven framework to improve the detection of subtle motor control impairments in PD through an unsupervised learning approach without relying on labeled data.
2. ICR-LLS Methodology
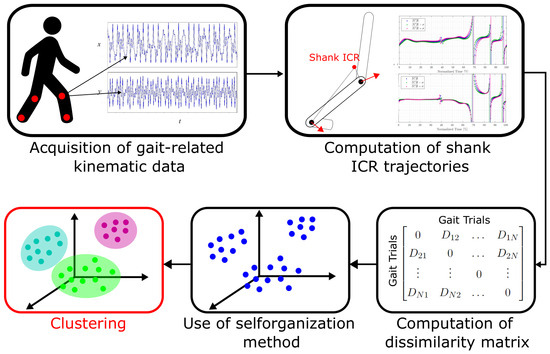
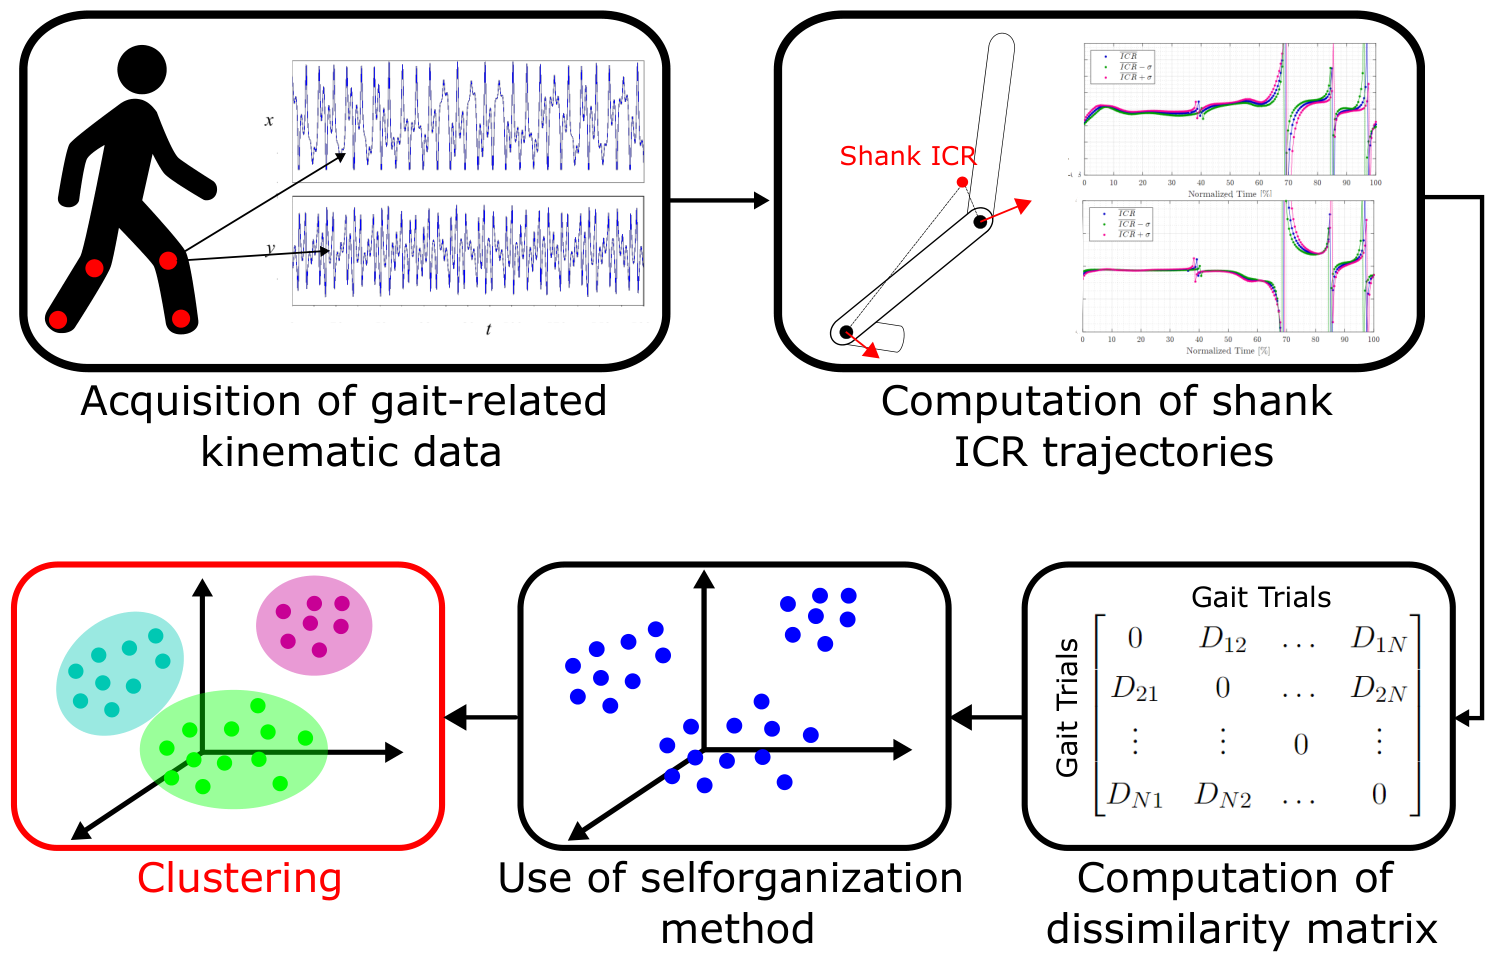
An overview of the ICR-LLS methodology is presented in Figure 1. The framework uses ICR trajectories of the shank in the sagittal plane during gait as input data and applies data-driven techniques to uncover intrinsic gait patterns and group trials with similar kinematic behavior.
Figure 1.
Flow chart of the ICR-LLS methodology illustrating the main processing stages.
The following subsections describe each stage of the framework in detail.
2.1. Computation of Shank ICR Trajectories
During walking, the center of mass (CoM) of the body progresses along the direction of locomotion, while individual skeletal segments undergo planar motion resulting from the combined translation and rotation of rigid bodies. For a segment that undergoes planar motion, its instantaneous kinematic behavior can be fully described by its ICR, defined as the point in the plane about which the segment is momentarily rotating at a given instant.
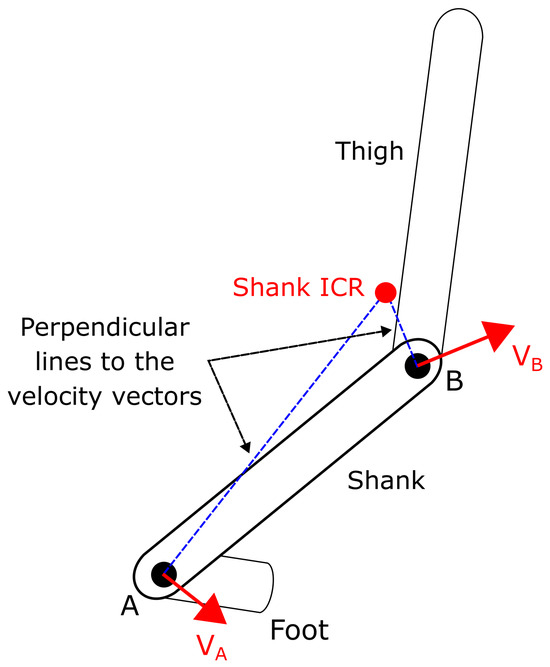
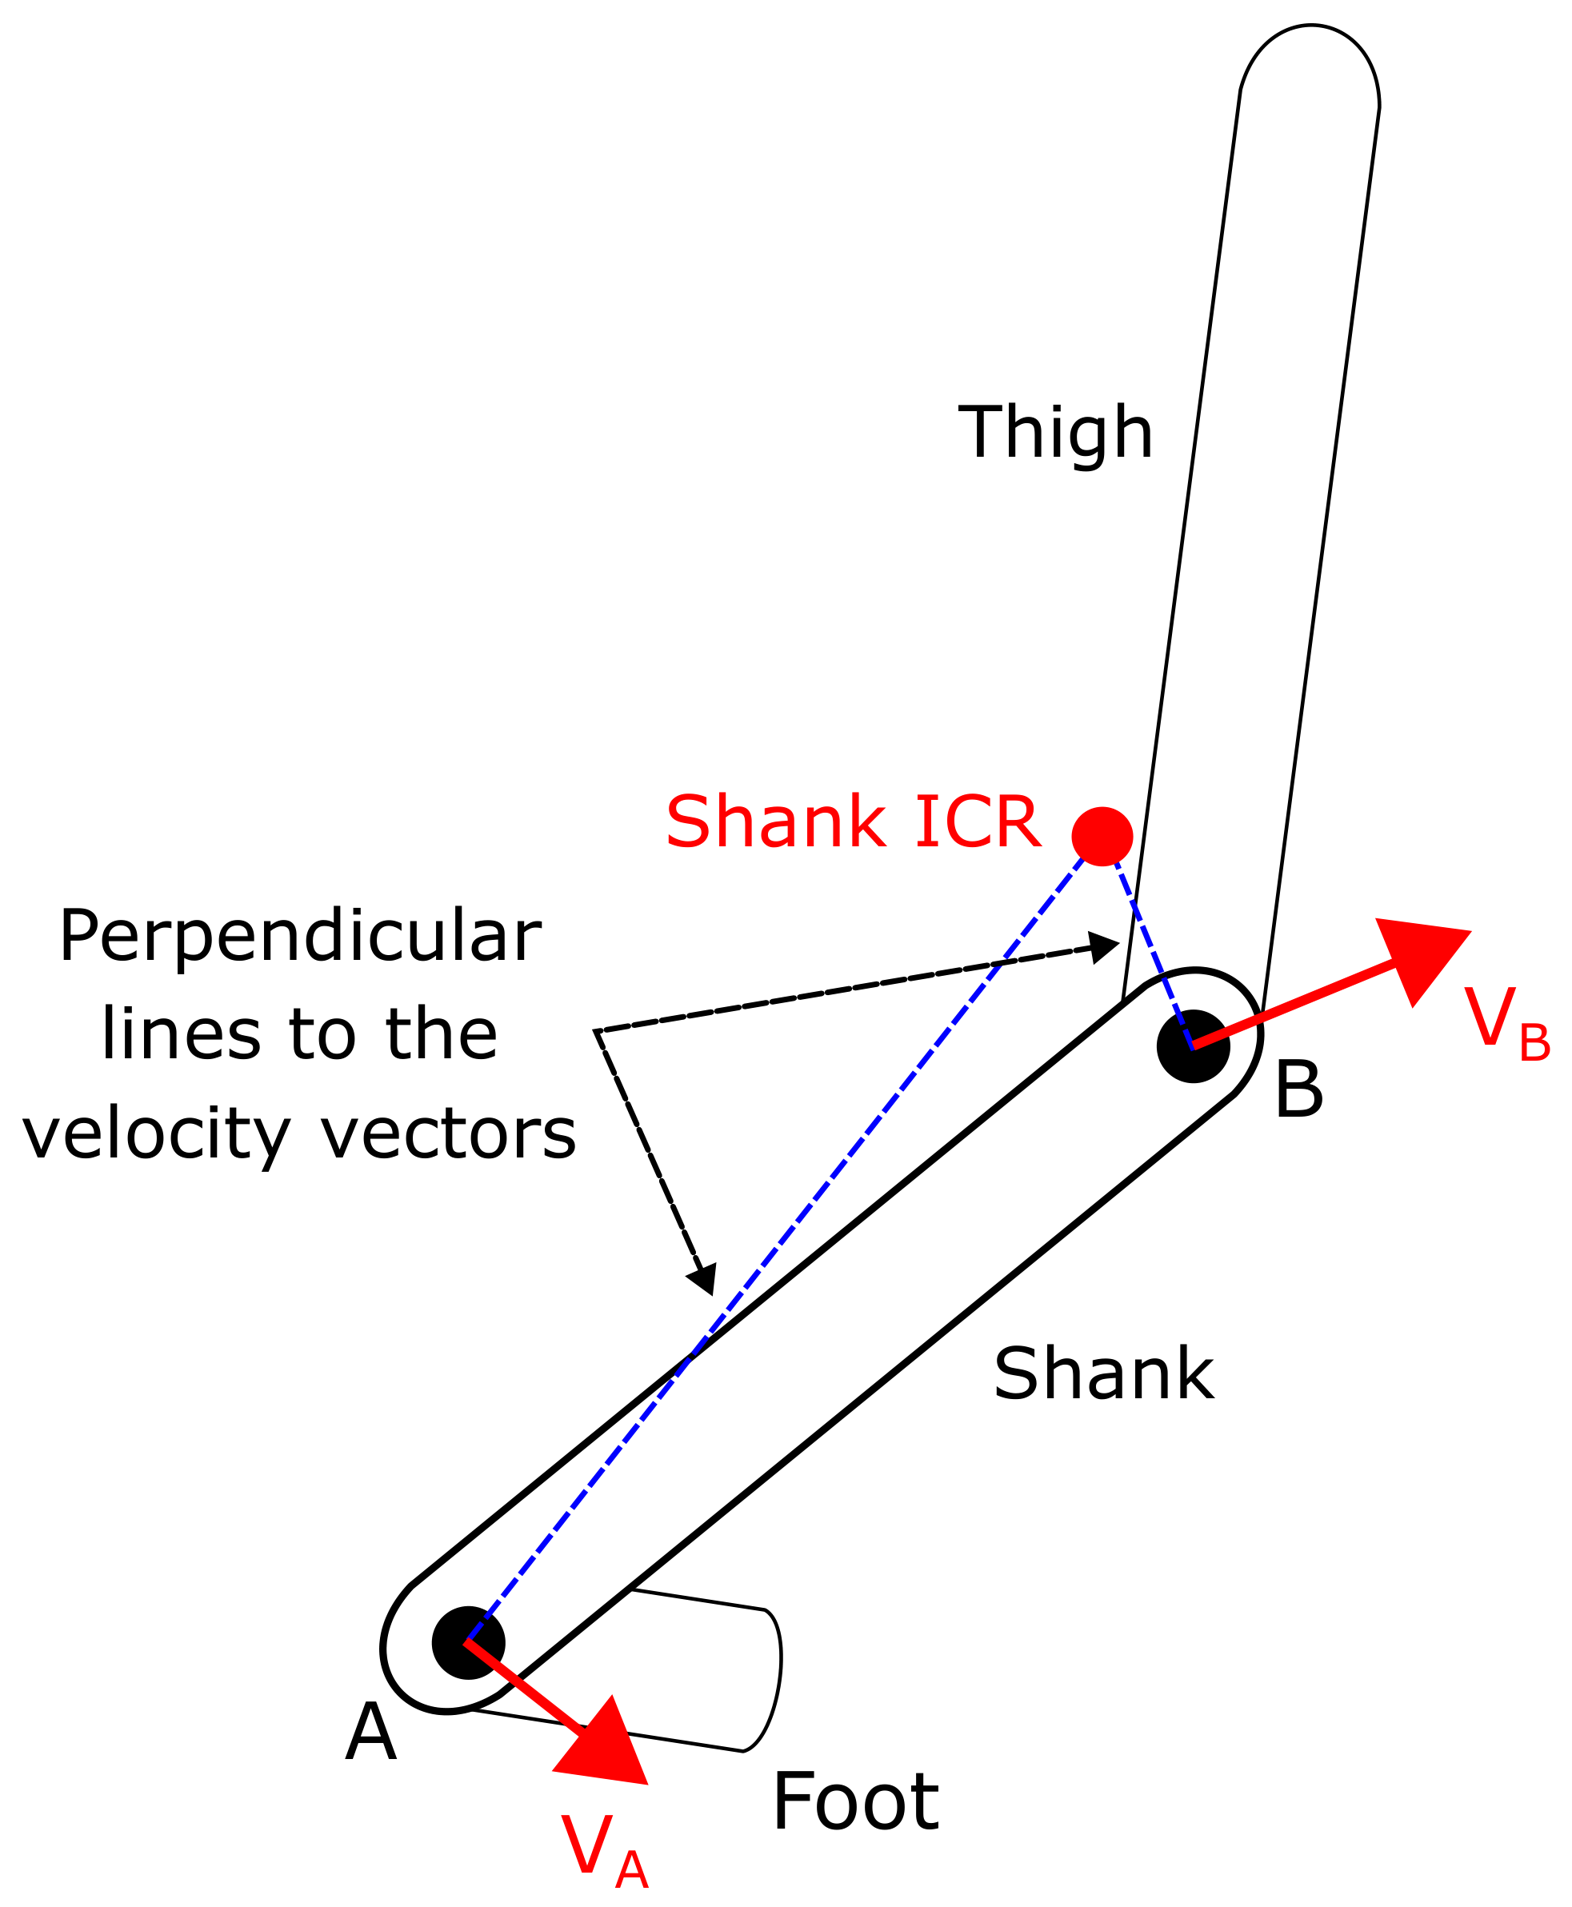
To determine the ICR of a body segment, it is necessary to estimate the instantaneous velocity vectors of two distinct points on the segment. From each point a straight line perpendicular to its corresponding velocity vector is constructed. These perpendicular lines originate at the locations of the selected points and represent all possible positions of the instantaneous center of rotation consistent with the observed motion. The intersection of the two perpendicular lines uniquely defines the ICR at that instant, as illustrated in Figure 2.
Figure 2.
Determination of the ICR for the shank segment.
The computational procedure for estimating ICR trajectories follows the methodology described in our previous work [25]. Building on these findings, the present study focuses on the shank segment, as its ICR trajectory provides a compact representation of lower-limb motion that integrates both rotational and translational components of segmental dynamics. Unlike conventional joint angles or segment orientations, which describe motion at individual joints, the shank ICR captures relative intersegmental motion, thereby summarizing coordination patterns across the lower limb.
Using preprocessed gait data, including the positions and velocities of markers placed at the lateral femoral epicondyle and the lateral malleolus, the ICR trajectories of both shanks were calculated in the sagittal plane for each gait trial. For a given trial, a multivariate time series was constructed by concatenating the horizontal and vertical components of the ICR trajectories of the left and right shanks. As a result, each gait trial is represented as a four-dimensional time-series matrix, capturing the spatiotemporal evolution of shank rotation throughout the gait cycle.
where i refers to the gait trial of a given subject, and correspond to the ICR trajectories of the right shank along the x and y axes, respectively, and and correspond to the ICR trajectories of the left shank along the x and y axes, respectively.
2.2. Pairwise Comparison of ICR Trajectories
A higher degree of variability between two gait-related time-series is associated with an increased likelihood that at least one of the corresponding gait patterns exhibits atypical or pathological characteristics. Consequently, pairwise comparisons between multivariate ICR trajectories were made in the time domain to quantify gait dissimilarity.
In the proposed pipeline, ICR trajectories are compared without amplitude normalization, thereby preserving their original spatial scale. To account for temporal misalignments arising from stride-to-stride variability, each pair of trajectories is first circularly aligned using cross-correlation.
Let and denote two multivariate ICR trajectories of equal length N, where each sample represents the horizontal and vertical ICR components of the left and right shanks at time step n.
The circular cross-correlation is defined as follows:
where denotes the complex conjugate and is the lag.
The optimal lag that maximizes is then used to align Y to X via a circular shift:
Following circular time alignment, trajectory dissimilarity is quantified using Dynamic Time Warping (DTW), which accommodates non-linear temporal deformations while preserving the spatial structure of the trajectories.
For sequences X and , the cumulative DTW distance matrix is recursively defined as follows:
where denotes the Euclidean norm in , ensuring that all four components of each sample are taken into account.
The optimal warping path is obtained by backtracking from to along the minimal cumulative cost path.
The DTW distance between the trajectories is then calculated as the sum of squared Euclidean distances along the warping path:
This combination of circular alignment and DTW compensates for global phase shifts prior to assessing trajectory dissimilarity, yielding a robust measure that preserves the original spatial scale of the ICR trajectories.
All pairwise DTW distances are assembled into a symmetric dissimilarity matrix.
where denotes the DTW-based dissimilarity between gait trials i and j.
2.3. Embedding of ICR Trajectories in a Low-Dimensional Space
The gait data were modeled as a fully connected weighted network, where each node represents an individual gait trial, and edge weights encode pairwise DTW-based dissimilarities. To obtain an interpretable low-dimensional representation, a force-directed layout algorithm was employed to embed the data in a Euclidean space [26].
Within this framework, nodes are treated as physical particles subjected to repulsive and attractive forces, both defined as functions of pairwise dissimilarity between gait trials i and j and their current spatial positions and .
The magnitude of the repulsive force between nodes i and j is defined as:
while the magnitude of the attractive force is given by:
where C controls the strength of repulsion, K denotes the natural spring length, and and are tuning parameters that regulate the influence of dissimilarity. Both forces act along the unit vector connecting nodes i and j, ensuring that the interactions are directionally consistent in the embedding space.
Due to the fully connected nature of the network, every pair of nodes simultaneously experiences both attractive and repulsive interactions. Through iterative position updates, the system evolves toward a configuration that minimizes the overall potential energy, computed as the sum of squared forces acting on all nodes.
The resulting embedding preserves the relational structure encoded in the dissimilarity matrix: gait trials exhibiting higher similarity are positioned closer together, whereas more dissimilar trials are spatially separated. This low-dimensional representation, therefore, provides an intuitive and unsupervised visualization of the relationships among gait patterns.
2.4. Cluster Analysis
To identify latent structures within the low-dimensional representation of the gait-related data, Density-Based Spatial Clustering of Applications with Noise (DBSCAN) is applied to the resulting embedding. DBSCAN detects dense regions of points while explicitly modeling noise, making it well suited to identify atypical gait patterns without requiring a predefined number of clusters [27].
Within this framework, the clustering procedure is designed to identify a compact reference group representing typical (healthy) gait patterns, while trials that exhibit pathological or atypical gait are treated as outliers. These outliers capture deviations from normative behavior rather than forming a uniform pathological category, reflecting the inherent heterogeneity of gait disorders.
Cluster performance was quantitatively evaluated using Normalized Mutual Information (NMI), which measures the agreement between cluster assignments and known clinical labels , and is given by:
where denotes mutual information and denotes Shannon entropy. The NMI values range from 0, indicating that there is no correspondence, to 1, representing perfect alignment with the truth of the ground.
In addition to evaluating agreement with external labels, the internal structure of the clusters was examined using the Separation-to-Compactness Ratio (SCR). This metric captures both the cohesion of individual clusters and the distinction between different clusters. Specifically, the compactness of a cluster is defined as the average distance of its members to the centroid of the cluster, while the separation between clusters is quantified as the minimum Euclidean distance between the centroids of all pairs of clusters:
where represents a data point within the cluster , represents a data point in the set of outliers O, is the centroid of the cluster , denotes the number of points in that cluster and denotes the number of outliers.
The SCR is then expressed as:
High SCR values indicate compact and well separated clusters, providing a label-independent assessment of cluster quality.
It is important to note that, in this study, DBSCAN is formulated as an anomaly detection approach in which healthy controls form a unique dominant cluster () and pathological cases are primarily identified as outliers. Within this framework, SCR quantifies the separation between outliers and healthy clusters in relation to their internal compactness, providing a meaningful indicator of abnormality despite the presence of noise points.
3. Case Study
3.1. Dataset
To evaluate the proposed framework, two publicly available gait datasets were employed. This section describes the original characteristics of the datasets as provided by their respective authors; the specific selection of participants and the variables used in this study are detailed in the subsequent subsection.
The first dataset [28] was obtained from the Laboratory of Biomechanics and Motor Control at the Federal University of ABC (Brazil) and includes gait recordings from 26 individuals diagnosed with PD, with a mean age of 66.3 years. During data acquisition, participants walked on a 20-m walkway at a comfortable, self-selected speed while motion was captured using a 12-camera Raptor-4 system (Motion Analysis Corp., Rohnert Park, CA, USA) operating at 150 Hz. A total of 44 reflective markers were placed according to the recommendations of the International Society of Biomechanics (ISB), including 26 markers on the lower limbs and 18 on the upper body. Each participant performed 20 walking trials across two sessions: one in the dopaminergic ON state and one after at least 12 h of withdrawal from medication (OFF state).
The second dataset [29] was provided by the Multidisciplinary Motor Center Antwerp (MMCA) and includes gait recordings from a heterogeneous cohort of 138 neurologically intact individuals (aged 21 to 86 years) and 50 individuals post-stroke (aged 19 to 85 years). Motion capture was performed using an 8-camera Vicon T10 (Vicon Motion Systems Ltd, Oxford, UK) system operating at 100 Hz.
3.2. Data Processing
To allow a comparative analysis between groups, data from 30 neurologically intact healthy participants and 10 individuals diagnosed with PD in the OFF medication state were selected from the original datasets. The primary inclusion criterion was to ensure comparable demographic distributions between groups, particularly in terms of age, to minimize possible confounding effects. The healthy group spans an age range of 52 to 86 years, while the PD group spans 44 to 81 years, with substantial overlap between distributions. Sex was not used as a stratification variable.
From the MMCA dataset, only neurologically intact participants were retained, while all post-stroke individuals were excluded from further analysis.
Table 1 summarizes the demographic and anthropometric characteristics of all participants included in the study, including age, gender, body mass, height, and body mass index (BMI), as well as their corresponding clinical state (Healthy or PD).
Table 1.
Sample demographics.
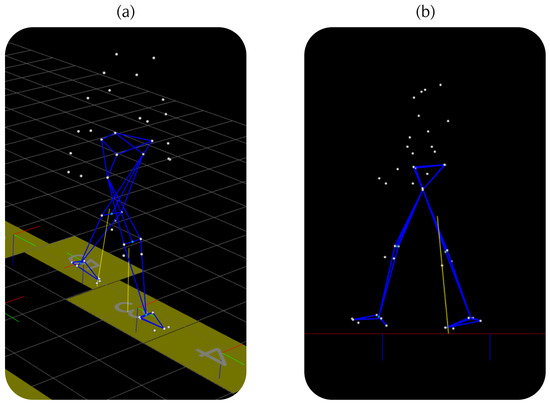
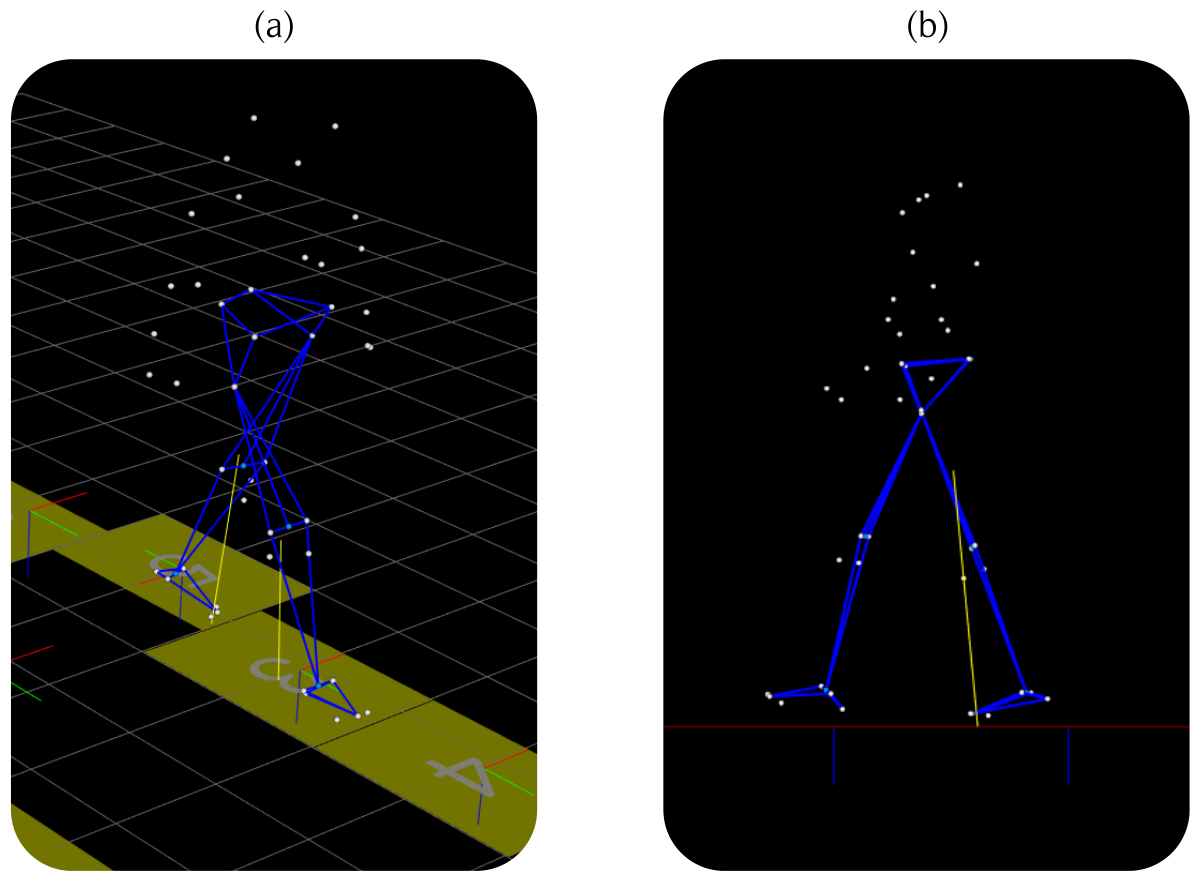
Raw motion capture data, stored in C3D format, were imported into the open-source software Mokka 0.6.2 (INRIA, France) for initial visualization and quality inspection. The Sagittal-plane coordinates of the anatomical markers were subsequently exported and processed in MATLAB R2025b (MathWorks, Natick, MA, USA). Figure 3 shows the set of markers included in the selected datasets.
Figure 3.
Processing of the kinematic data contained in the selected data sets using Mokka. (a) Isometric view. (b) Sagittal Plane.
Two anatomical landmarks, the lateral femoral epicondyle and the lateral malleolus, were selected bilaterally due to their consistent presence across biomechanical models in both datasets. Gait cycles were segmented using the vertical displacement of the hip marker as a reference. Each gait cycle exhibits three local minima in the vertical hip trajectory corresponding to key events of the stride. These minima were automatically detected by analyzing the slope of the trajectory, allowing for precise identification of the boundaries of the gait cycle. Then each segmented cycle was interpolated to 200 samples to ensure temporal consistency between cycles. Within each cycle, marker trajectories were averaged to obtain representative motion patterns. The numerical differentiation of these averaged trajectories yielded marker velocities, which were subsequently smoothed using a moving average filter over three samples and then used to compute the ICR trajectories of the shank following the procedure described in Section 2.1.
To remove the dependence of the ICR trajectories on the global reference frame used during the gait trials, the ICR trajectories were expressed relative to the center of mass of the body (COM), producing normalized trajectories defined as follows:
In this representation, values close to zero indicate that the instantaneous center of rotation is located near the COM.
3.3. Results
3.3.1. Shank ICR Trajectories
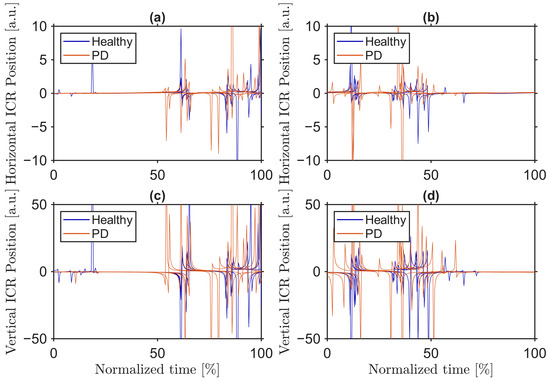
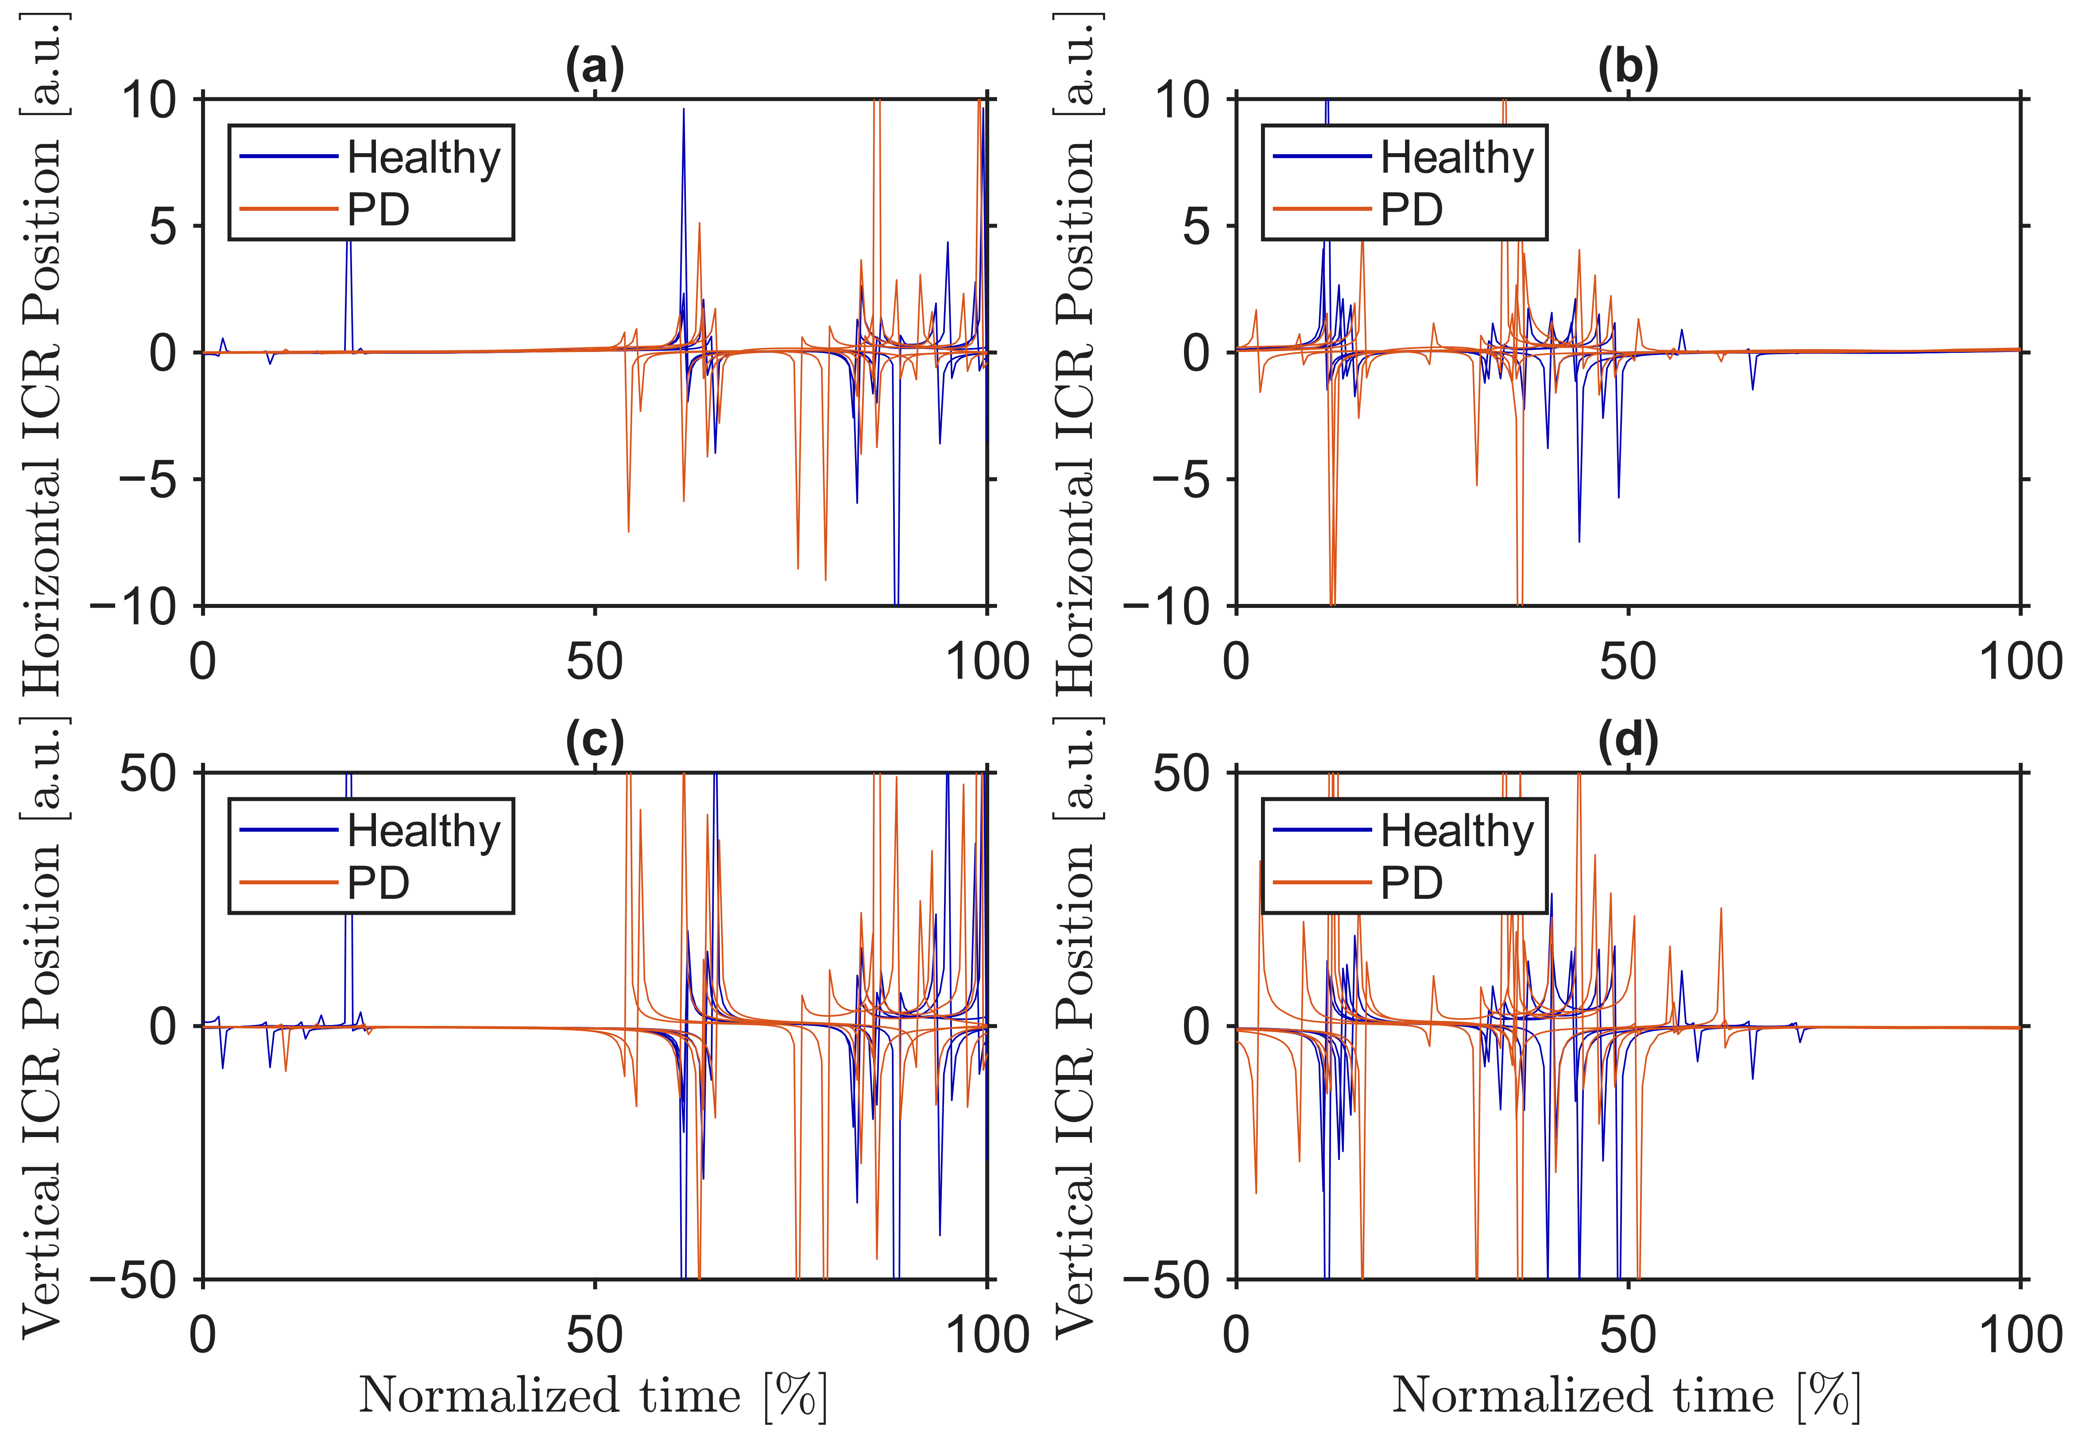
Figure 4 shows the preprocessed shank ICR trajectories in Cartesian coordinates for five individuals with PD and five healthy controls, randomly selected. Each trajectory represents the average behavior over multiple gait cycles for both the left and right legs during overground walking trials. The graph scales were adjusted to emphasize the specific shape of the trajectory.
Figure 4.
Comparison of shank ICR trajectories. (a) Horizontal axis—left leg. (b) Horizontal axis—right leg. (c) Vertical axis—left leg. (d) Vertical axis—right leg.
Vertical ICR values reach substantially larger magnitudes than horizontal values, particularly in subjects with PD. In these participants, several peaks exceed the range displayed, reflecting higher amplitudes compared to healthy controls. Additionally, in both groups, there are portions of the gait cycle in which the ICR approaches zero, indicating that it is located near the center of mass of the body.
Although the overall trajectory patterns are broadly similar between the groups, PD subjects exhibit more pronounced asymptotic patterns and greater variability, especially along the vertical axis. These observations suggest a reduced rotational excursion of the shank in PD, reflecting a more rigid lower-limb movement compared to healthy controls.
3.3.2. Dissimilarity Matrix
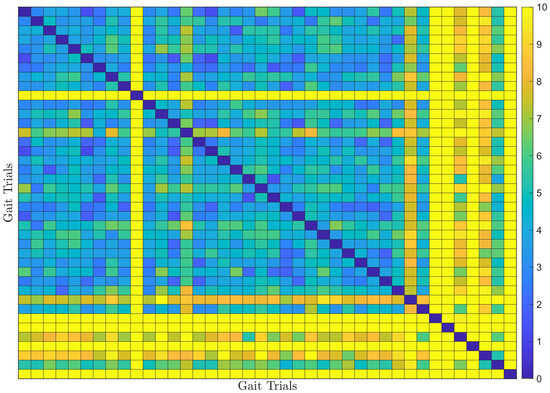
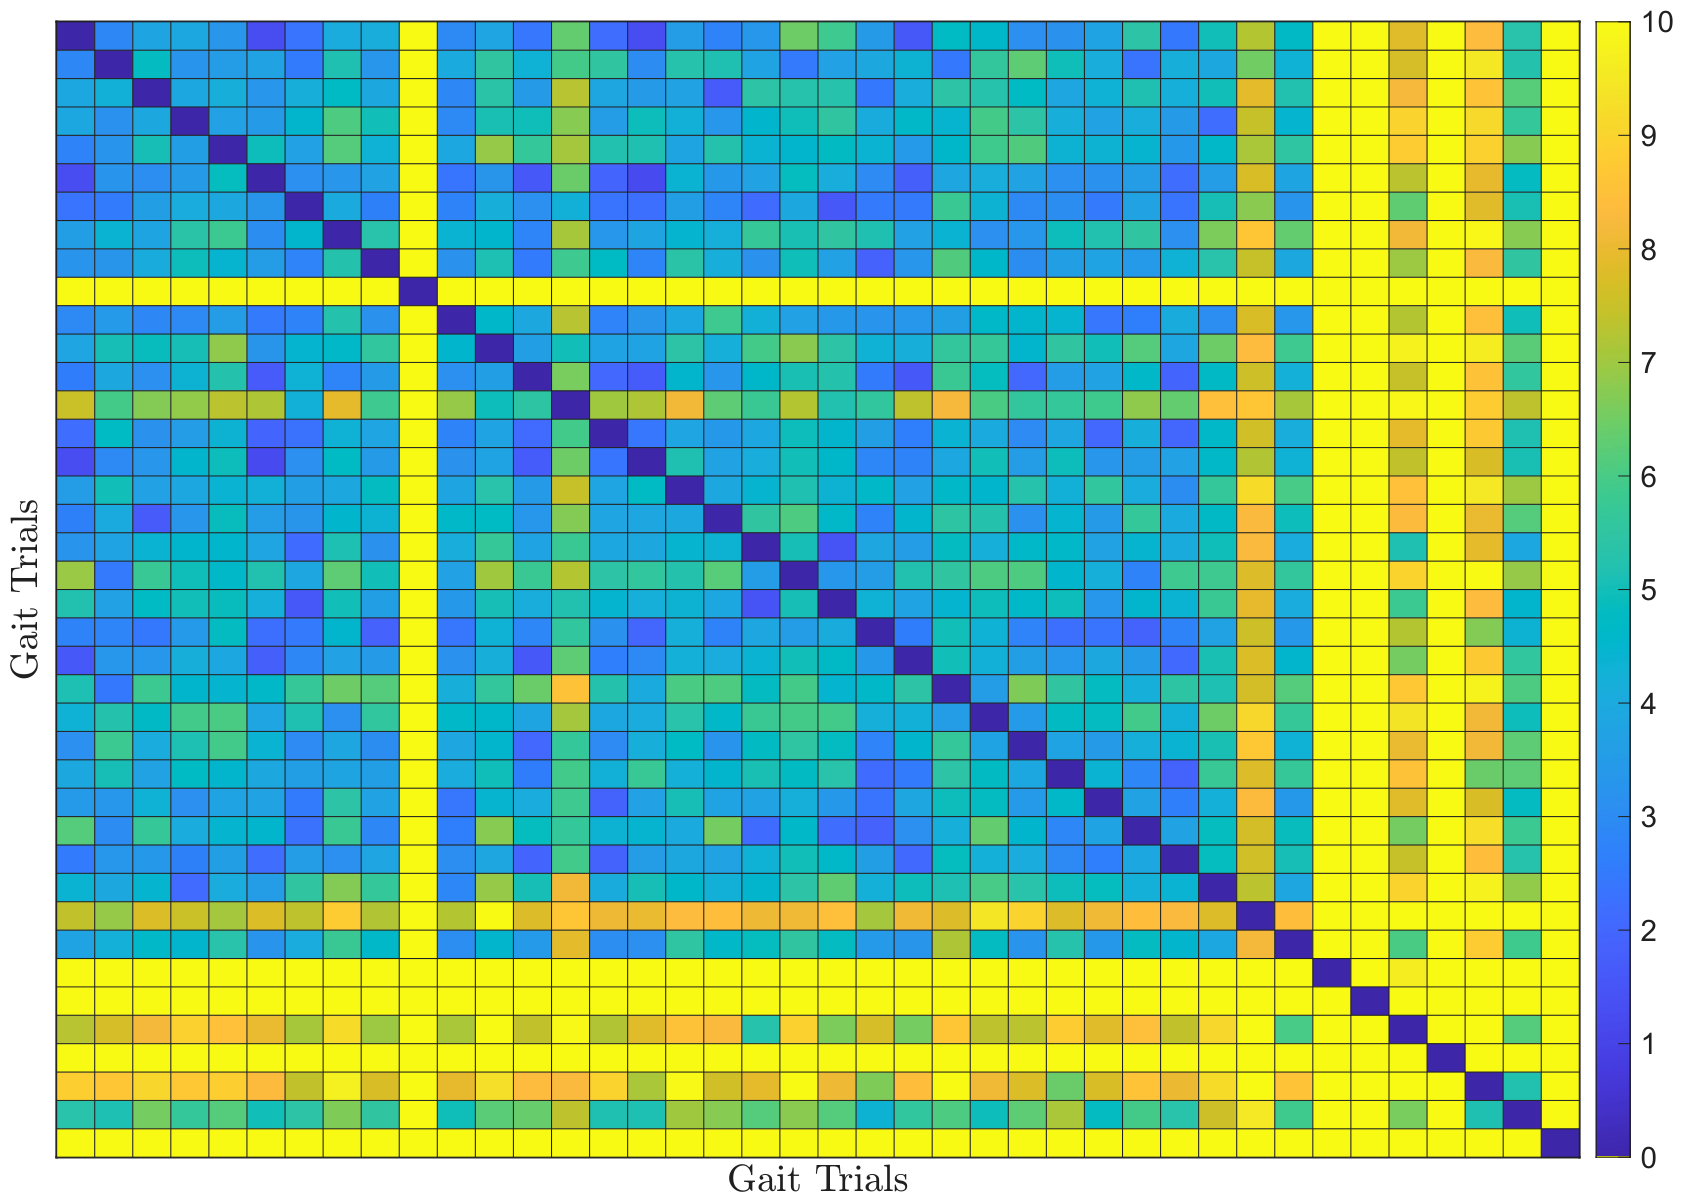
Figure 5 shows the dissimilarity matrix computed from pairwise comparisons of the ICR trajectories of the shank for individuals with and without PD using DTW-based dissimilarity.
Figure 5.
Dissimilarity matrix of shank ICR trajectories computed using DTW-based pairwise comparisons.
The matrix reveals patterns that partially support the initial hypothesis of the study. Comparisons among healthy controls, located in the upper-left corner, are predominantly of a cool color, indicating a high similarity in gait patterns. Comparisons between healthy controls and PD patients, represented in off-diagonal blocks (lower-left and upper-right corners), show warmer colors, reflecting greater divergence between the two groups. In particular, comparisons among PD patients, in the lower-right corner, exhibit the warmest colors, indicating substantial variability within this group despite a common diagnosis. This suggests that while some PD patients show gait patterns similar to healthy controls, others show pronounced deviations, highlighting the presence of outliers and heterogeneity in pathological gait.
3.3.3. Self-Organized Network
The DTW-based dissimilarity matrix was employed to construct a force-directed self-organizing network in which each node represents an individual gait trial. The network embedding was generated using MATLAB’s built-in force-directed layout algorithm, which determines node positions through an iterative force-relaxation process. This implementation follows the general force-directed principles outlined in the previous section while internally handling model parameters and numerical settings within the optimized computational framework of MATLAB.
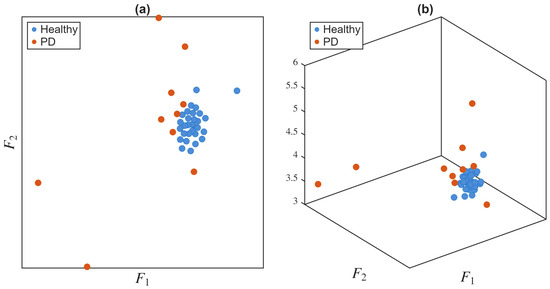
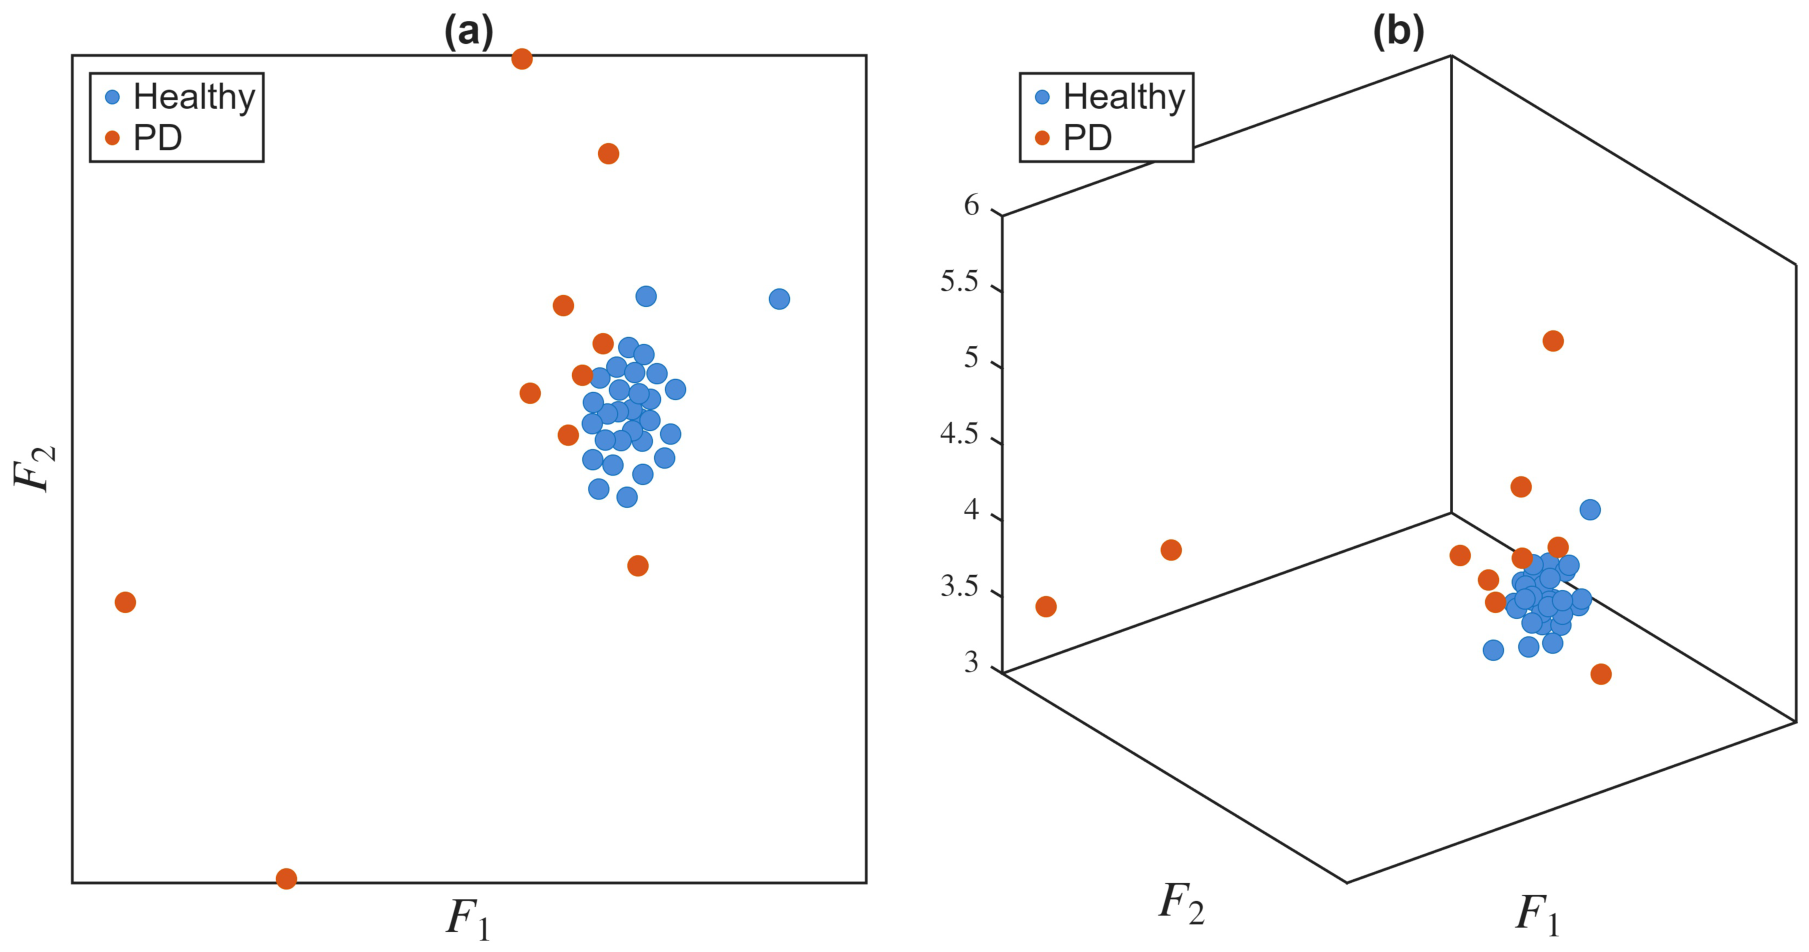
Two network representations were obtained: a two-dimensional layout and a three-dimensional layout, as illustrated in Figure 6. In both cases, node positions were computed through an iterative simulation consisting of 3,000,000 iterations, providing a stable and well-structured spatial organization of the network.
Figure 6.
Self-organized network representation of gait trials. (a) Two-dimensional embedding. (b) Three-dimensional embedding.
Both embeddings demonstrate a clear separation between the groups. In the two-dimensional layout, nodes corresponding to healthy gait trials form a compact cluster, reflecting low intra-group variability. Gait trials performed by individual with PD are usually located outside of this central cluster and often appear as outliers; although some form smaller subgroups, indicating partial similarity between certain patients.
Given the pronounced differentiation evident in the two-dimensional embedding and the compactness of the healthy cluster, subsequent analyzes focus on the two-dimensional layout, which offers a simpler and equally informative representation of the relationships between gait trials.
3.3.4. Clustering
To automate the detection of natural groupings in gait data, we applied density-based clustering using the DBSCAN algorithm on the DTW-derived graph.
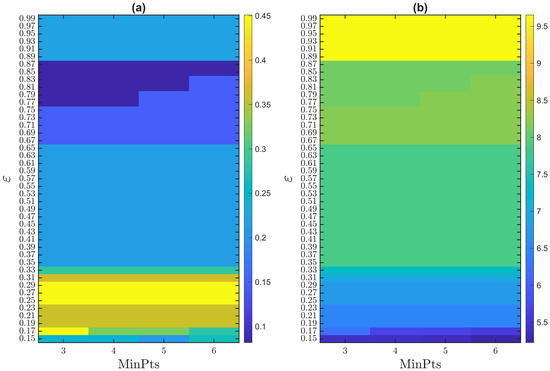
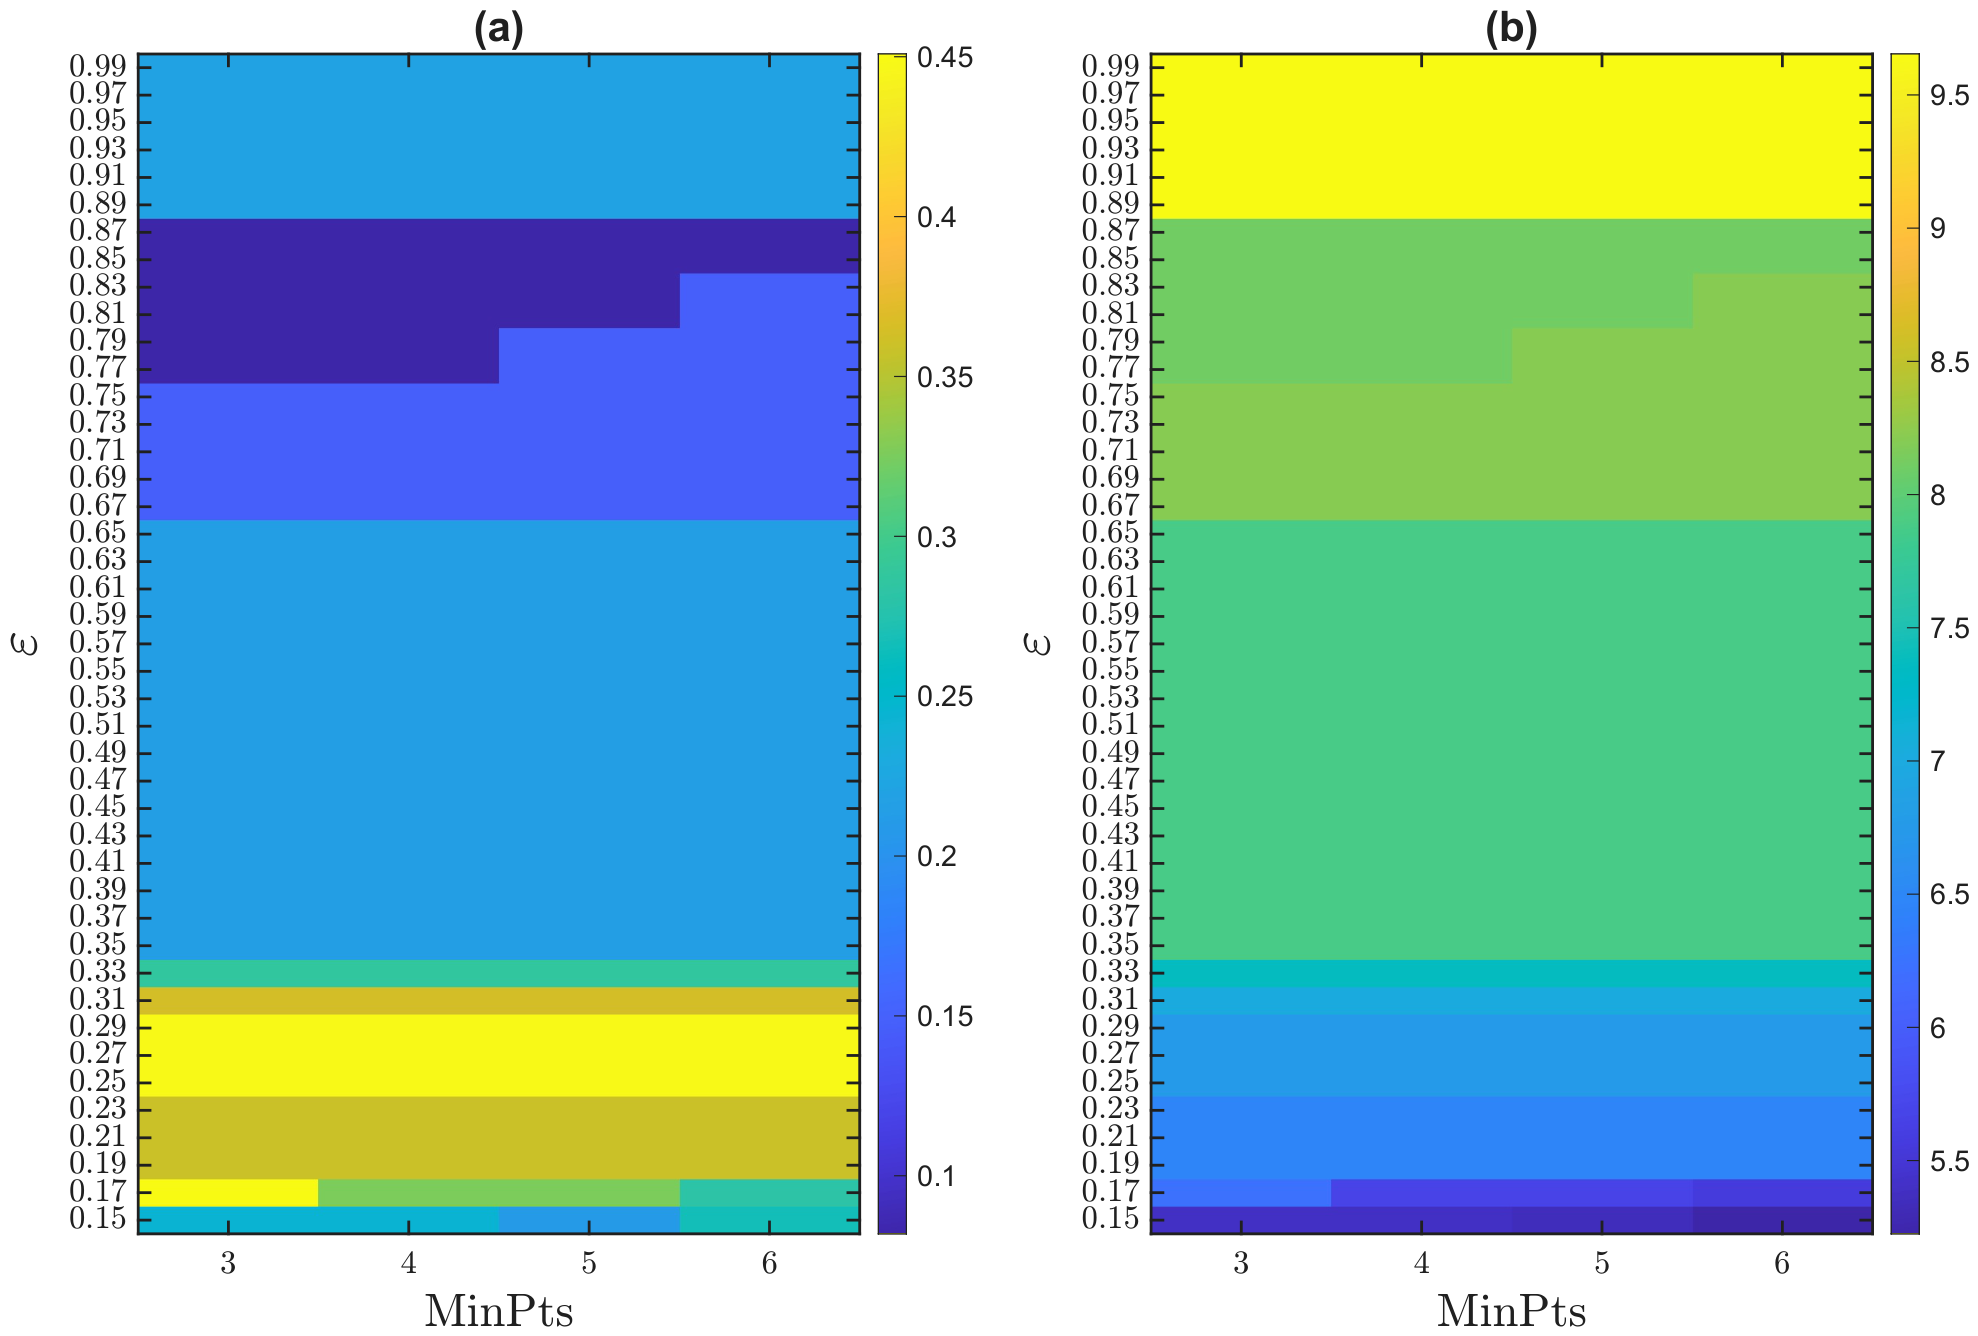
A systematic grid search was performed to explore the effects of two DBSCAN hyperparameters: the neighborhood radius () and the minimum number of points per cluster (MinPts). Each configuration was evaluated using NMI and SCR, excluding trivial solutions that consist of a single cluster with no separation. Figure 7 shows the resulting performance grid and reveals a clear inverse relationship between NMI and SCR: parameter settings that maximize agreement with the ground truth do not necessarily yield the most compact and well-separated clusters.
Figure 7.
DBSCAN hyperparameter grid search results: (a) NMI and (b) SCR.
This inverse trend suggests that clusters with higher internal cohesion and separation may not recognize all individuals from the same clinical group, particularly in heterogeneous PD samples. Based on the grid search, we identified configurations that maximized NMI and SCR separately, serving as representatives for further cluster inspection.
Figure 8 shows the DBSCAN clustering result for the configuration achieving the highest NMI (, MinPts = 5). The clusters correspond well to the clinical labels, featuring a compact healthy cluster and correctly identifying outliers with atypical gait patterns of PD. Misclassifications occur mainly among patients with PD, reflecting the heterogeneity of pathological gait, and a few healthy controls were also misclassified.
Figure 8.
DBSCAN clustering outcome using hyperparameters that maximize NMI: (a) ground-truth labels, (b) identified clusters.
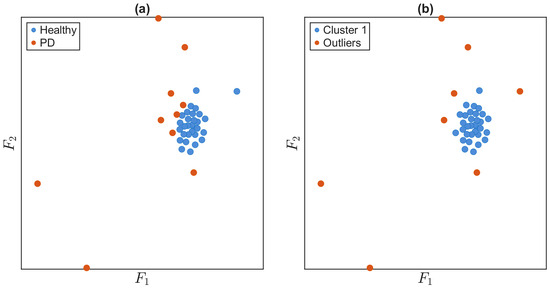
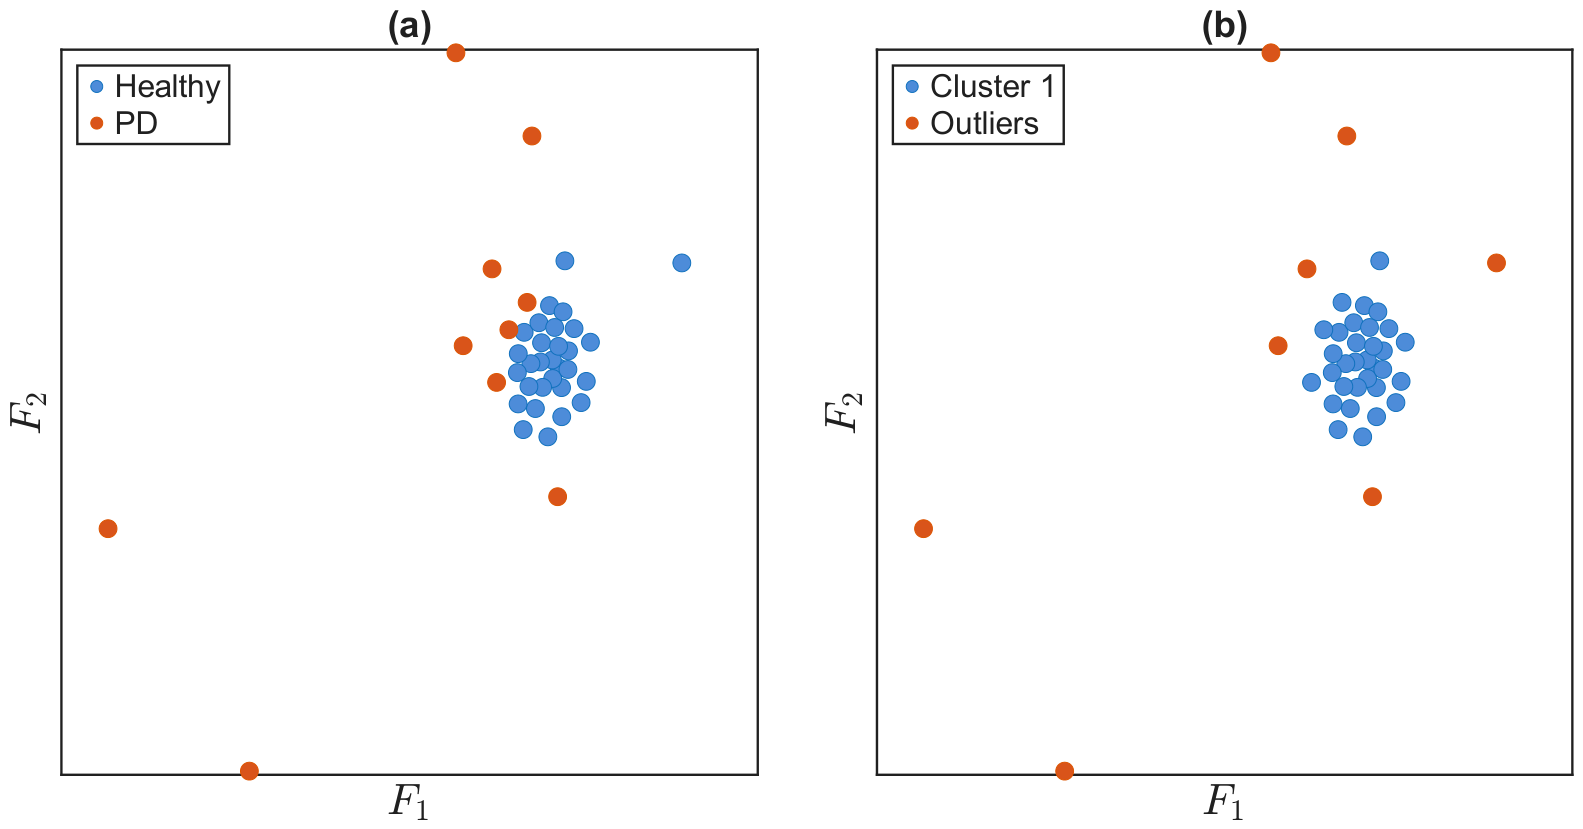
Figure 9 shows the clusters obtained from the configuration that maximized SCR (). Although clusters exhibit greater internal cohesion and separation, several subjects in PD groups are not fully recognized, reflecting the trade-off between cluster compactness and agreement with clinical labels.
Figure 9.
DBSCAN clustering outcome using hyperparameters that maximize SCR: (a) ground-truth labels, (b) identified clusters. Compactness and separation are improved, but some clinical labels are not fully captured.
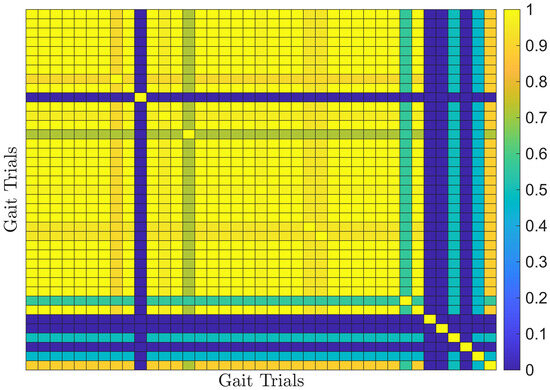
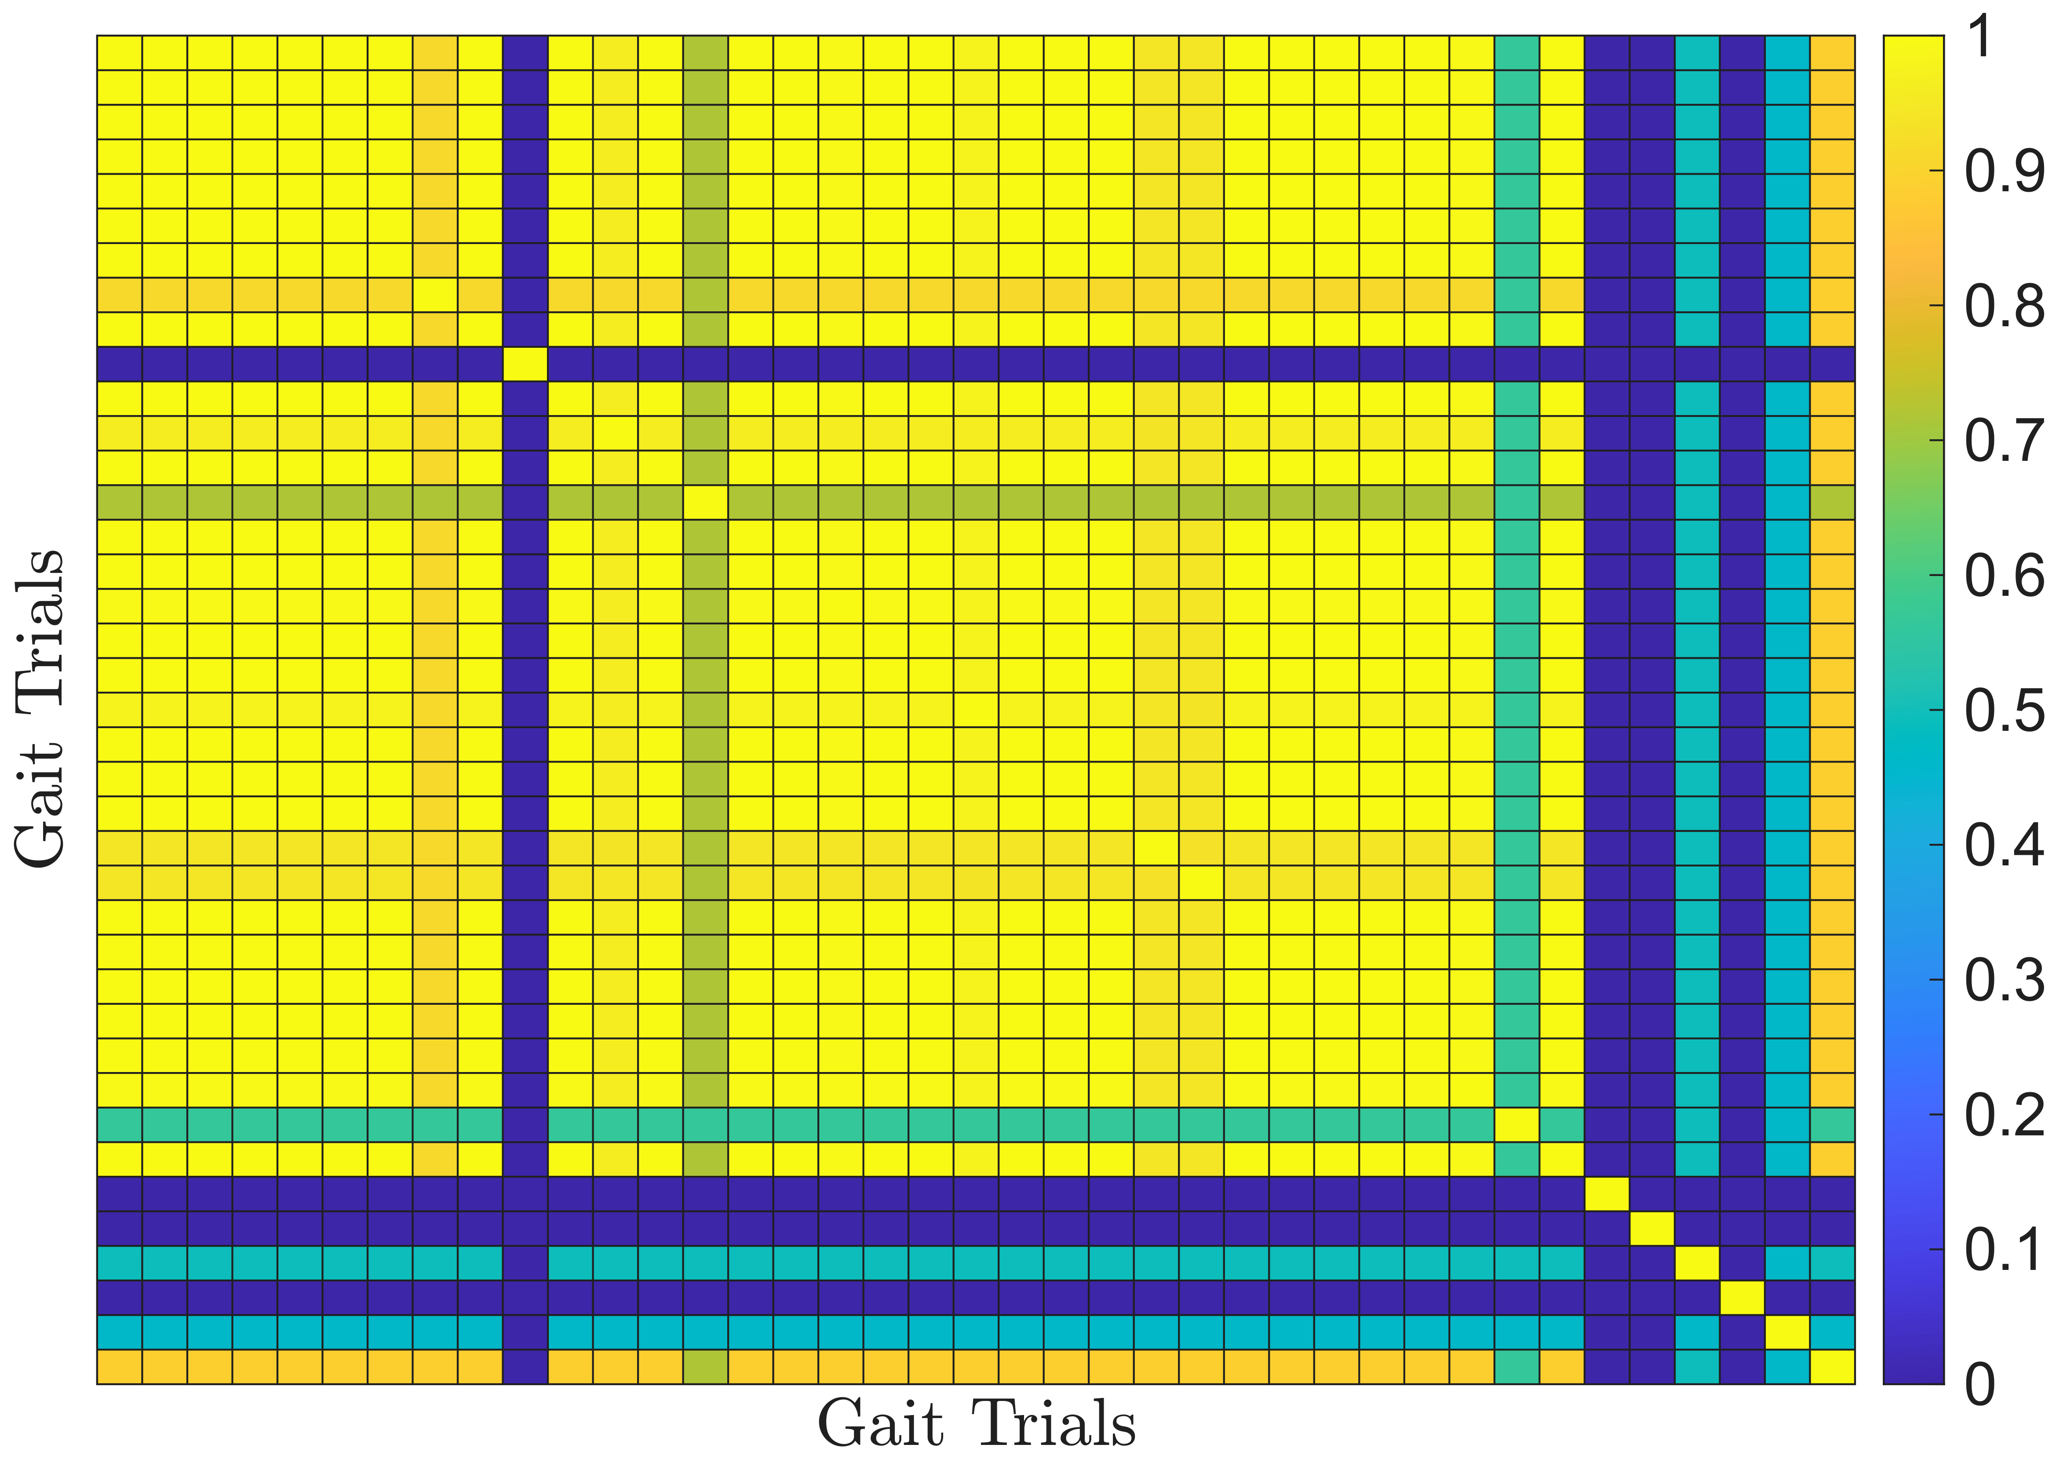
To improve cluster robustness and mitigate hyperparameter sensitivity, we applied a consensus-based ensemble approach. DBSCAN was repeatedly applied across the hyperparameter grid and a co-association matrix was computed, indicating the fraction of runs in which each pair of subjects was assigned to the same cluster. Hierarchical agglomerative clustering was then applied to the co-association matrix to derive the final consensus clustering. Figure 10 shows the resulting co-association matrix.
Figure 10.
Co-association matrix obtained from repeated DBSCAN runs. High co-association values indicate consistently clustered healthy controls, whereas the more heterogeneous gait patterns of PD participants result in lower and more variable co-association values.
The consensus clustering effectively stabilized cluster assignments, particularly for healthy controls, while isolating pathological gait patterns as outliers. Figure 11 shows the resulting clusters and outliers.
Figure 11.
DBSCAN consensus clustering outcome: (a) ground-truth labels, (b) identified clusters. A balanced solution, where the most of healthy controls form a coherent cluster, while PD subjects are predominantly detected as outliers.
3.4. Performance Evaluation of the ICR-LLS Methodology
To assess the performance of the proposed ICR-LLS methodology, a benchmarking strategy was adopted. Since most existing studies on Parkinsonian gait analysis rely on supervised classification models trained on labeled data, a direct comparison with the proposed unsupervised framework is not straightforward. To address this, two complementary evaluation approaches were considered. First, the clustering results were evaluated using standard classification metrics, allowing comparison with supervised methods reported in the literature. Second, to provide a more direct and methodologically consistent comparison, a baseline analysis was conducted on the same dataset using conventional gait features within the same clustering framework.
3.4.1. Benchmark Against Supervised Learning Methods Reported in the Literature
For the purpose of comparison with supervised learning approaches, clustering outcomes are mapped to clinical labels and evaluated using standard classification metrics. Within this framework, pathological subjects are treated as anomalies (outliers), while healthy controls define the reference group (normal). Consequently, true positives correspond to pathological subjects correctly identified as outliers, true negatives to healthy controls correctly assigned to the main cluster, false positives to healthy controls incorrectly labeled as pathological, and false negatives to pathological subjects that remain within the healthy cluster.
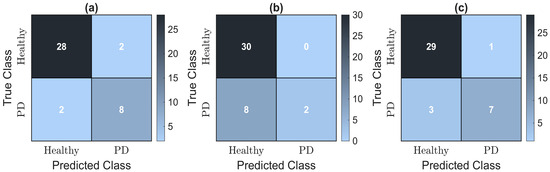
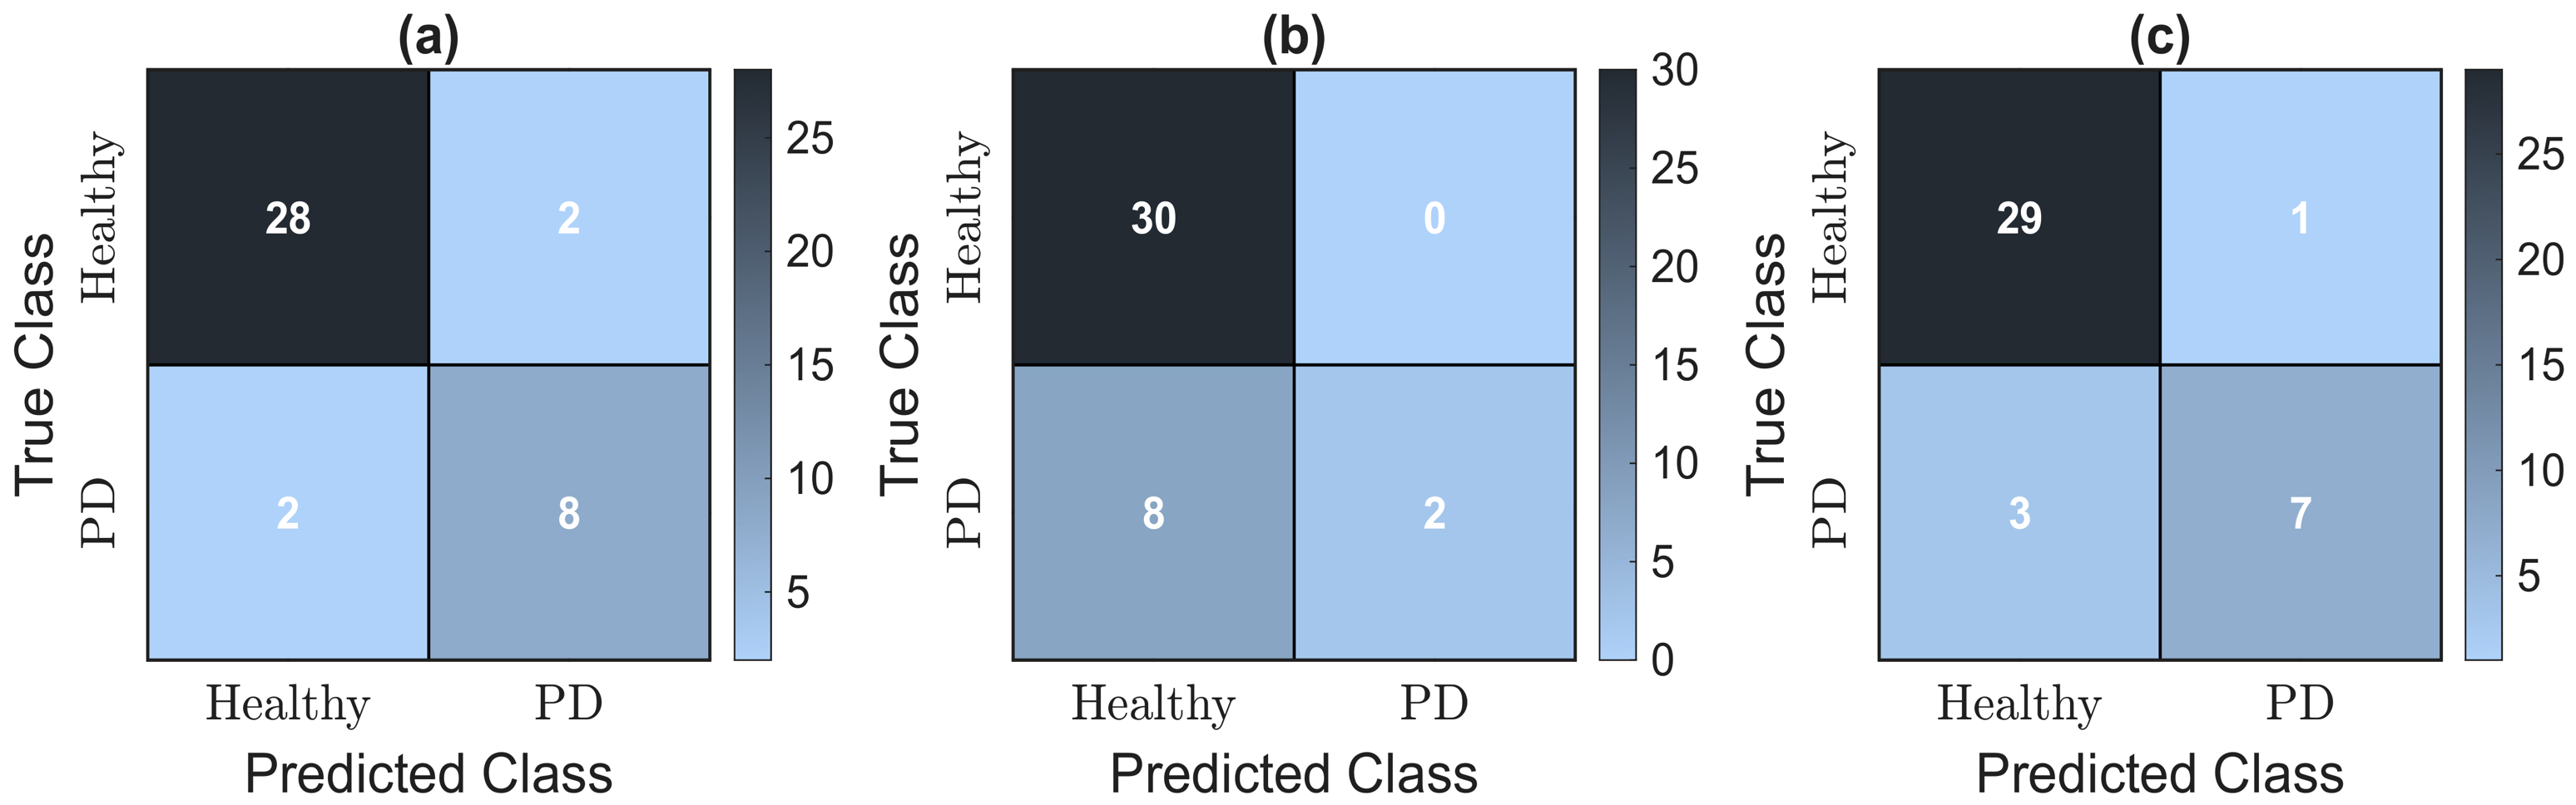
Confusion matrices are computed for the three analyzed configurations: (i) maximum NMI, (ii) maximum SCR, and (iii) consensus solution. Figure 12 presents the corresponding results.
Figure 12.
Confusion matrices comparing clustering outcomes with ground-truth labels for healthy and PD subjects. (a) Max NMI. (b) Max SCR. (c) Consensus approach.
Table 2 summarizes the quantitative performance of the three configurations.
Table 2.
Clustering performance metrics for the evaluated configurations.
Maximizing NMI yields the highest agreement with clinical labels, resulting in balanced performance with high accuracy (90%) and sensitivity (80%) and good specificity (93.3%). However, this configuration does not explicitly prioritize separation between the main cluster and outliers.
In contrast, maximization of SCR promotes highly compact and well-separated structures, but at the expense of detection performance, as reflected by very low sensitivity (20%) and reduced accuracy (80%). Although specificity and precision reach their maximum values (100% and 100%, respectively), the low F1-score (33.3%) indicates a strong bias towards correctly identifying the majority (healthy) class while failing to detect most pathological cases.
The consensus configuration provides the best trade-off between both criteria. It achieves strong agreement with clinical labels (NMI = 0.449) while preserving structural organization (SCR = 6.754). This results in robust overall performance, with high accuracy (90%), good sensitivity (70%), high specificity (96.7%) and the best balance between precision (87.5%) and F1-score (77.8%).
Table 3 situates the performance of the proposed ICR-LLS methodology in the context of previous studies that addressed the classification of PD based on gait data.
Table 3.
Comparison of the ICR-LLS methodology results with previous studies on PD classification.
Compared to previous studies, higher performance values are generally reported, particularly in terms of accuracy and sensitivity, with many methods exceeding 95%. However, these approaches are predominantly based on supervised learning and rely on ground reaction forces or three dimensional kinematic data, whereas the proposed methodology operates using a reduced set of kinematic inputs within an unsupervised framework.
3.4.2. Benchmark Against Conventional Gait Feature Representations
For a fair comparison, the same dataset was analyzed using a conventional gait representation based on joint kinematics. Instead of ICR trajectories, knee joint flexion/extension angles from both lower extremities were considered, as they provide a representative description of the gait dynamics of the sagittal-plane, analogous to the ICR representation based on the shank.
From these signals, conventional spatiotemporal and kinematic features were extracted, including maximum knee flexion, range of motion (ROM), cadence of both lower limbs. Subsequently, the same clustering framework was applied using DBSCAN. As in the proposed methodology, a grid search was performed on the DBSCAN parameters, evaluating both NMI and SCR to identify optimal configurations, and a consensus strategy was employed to obtain a robust solution. The grid search identified with MinPts = 3 as the optimal configuration to maximize NMI, while the optimal configuration of SCR was obtained at with MinPts = 3.
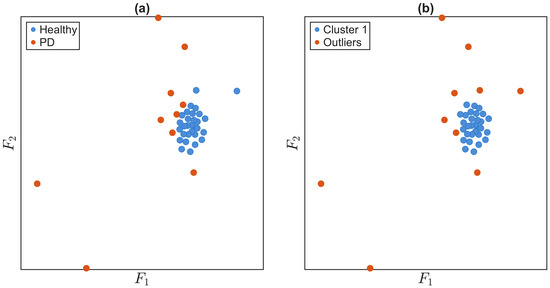
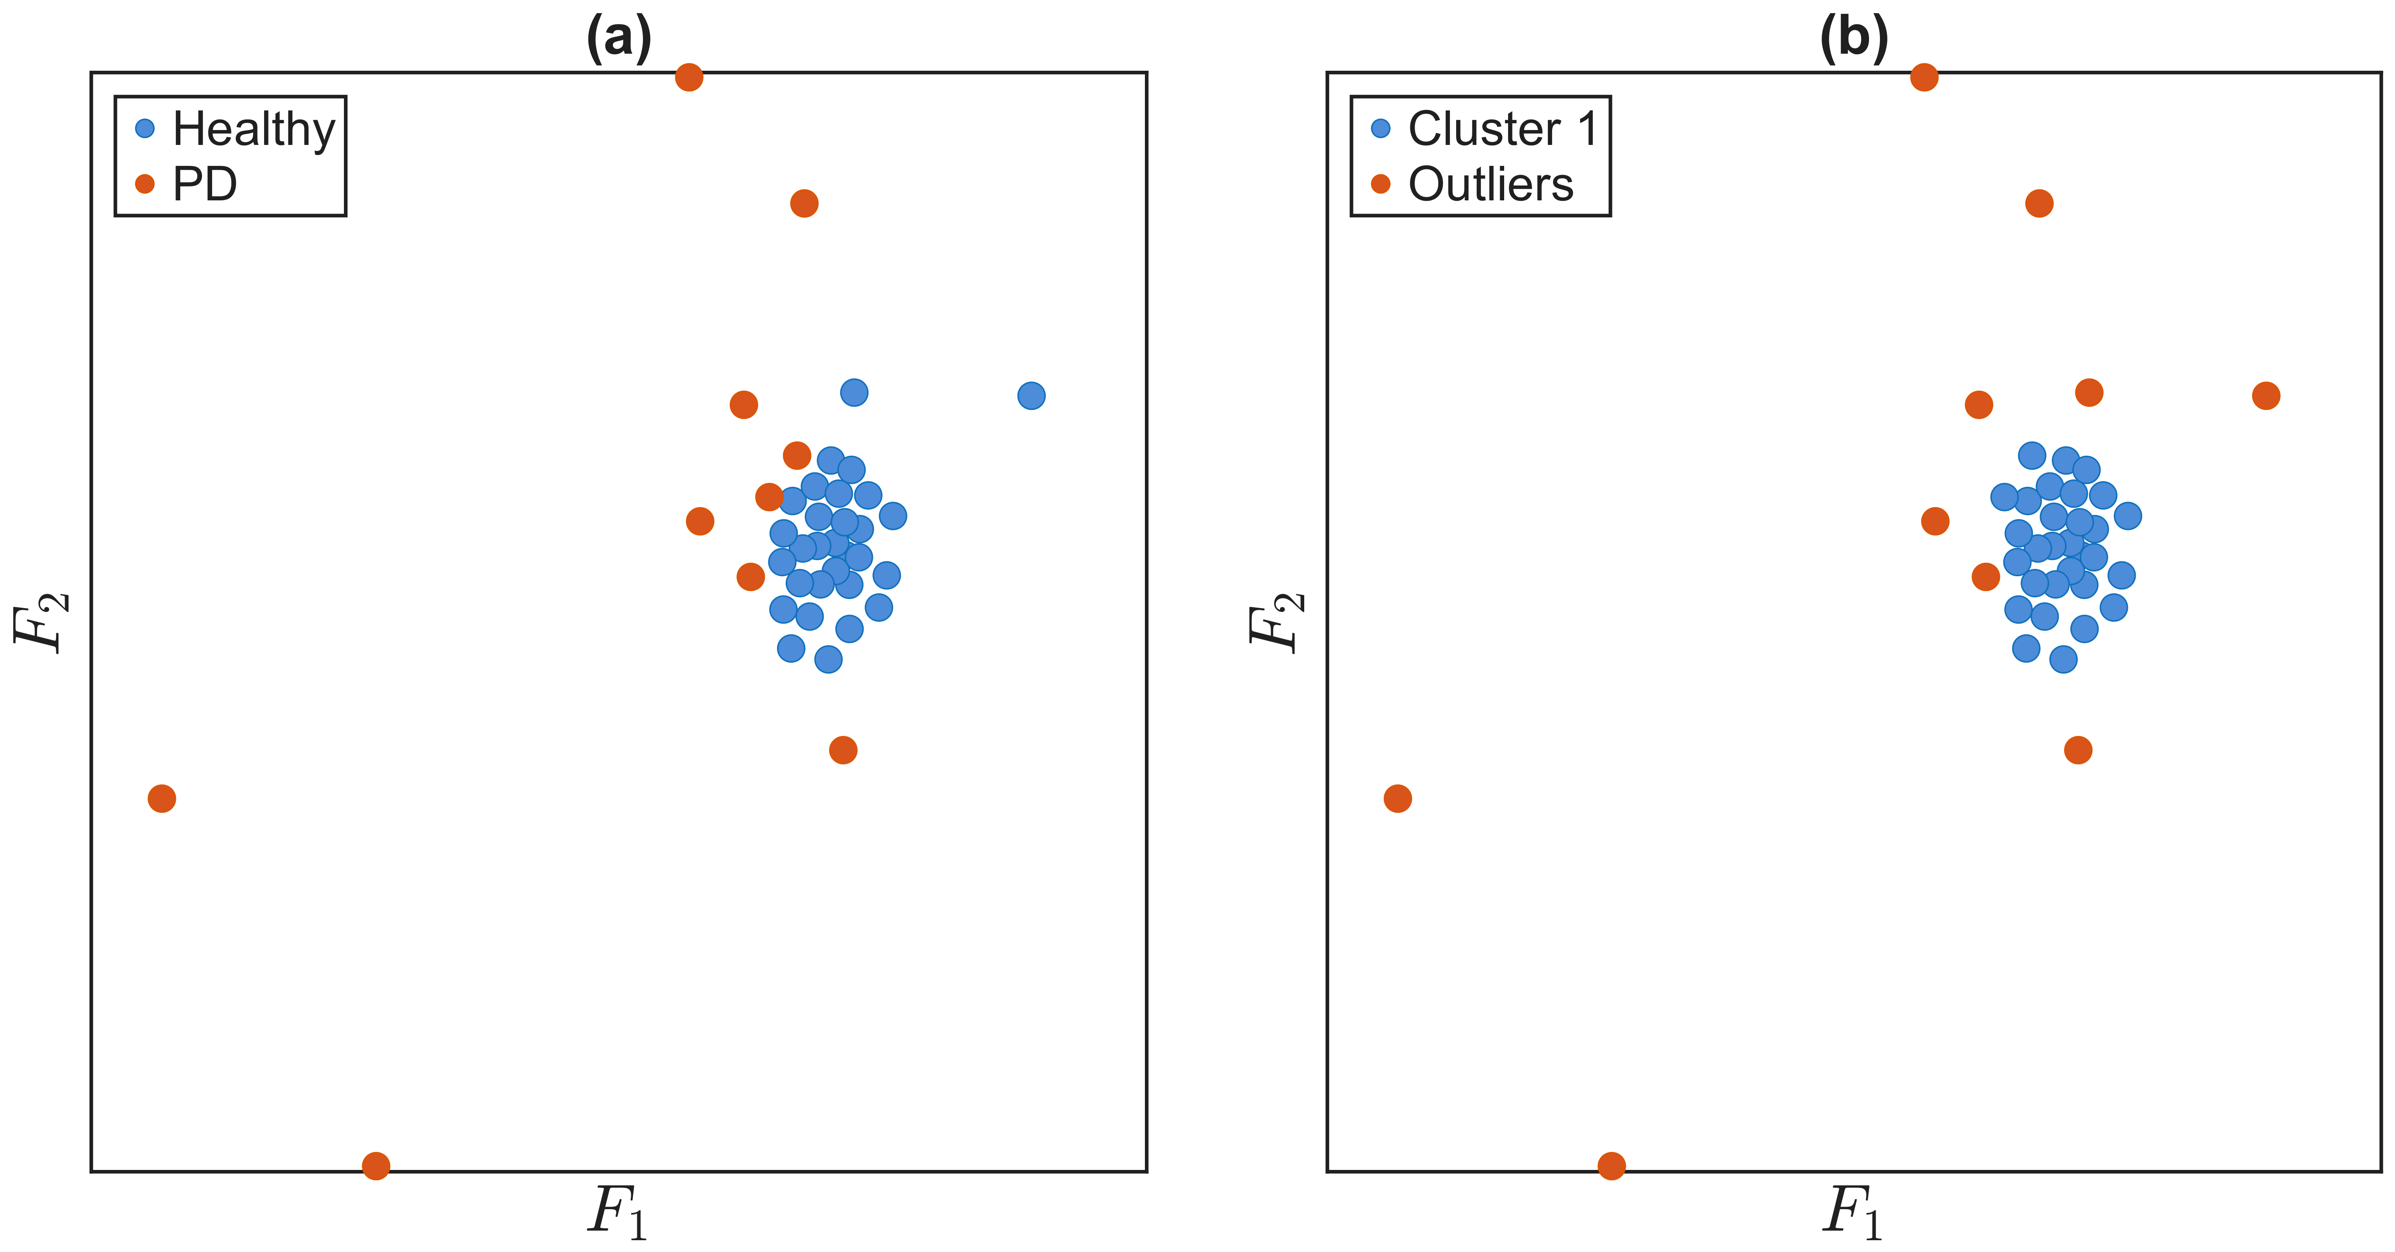
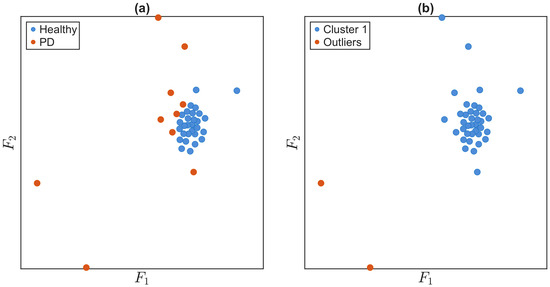
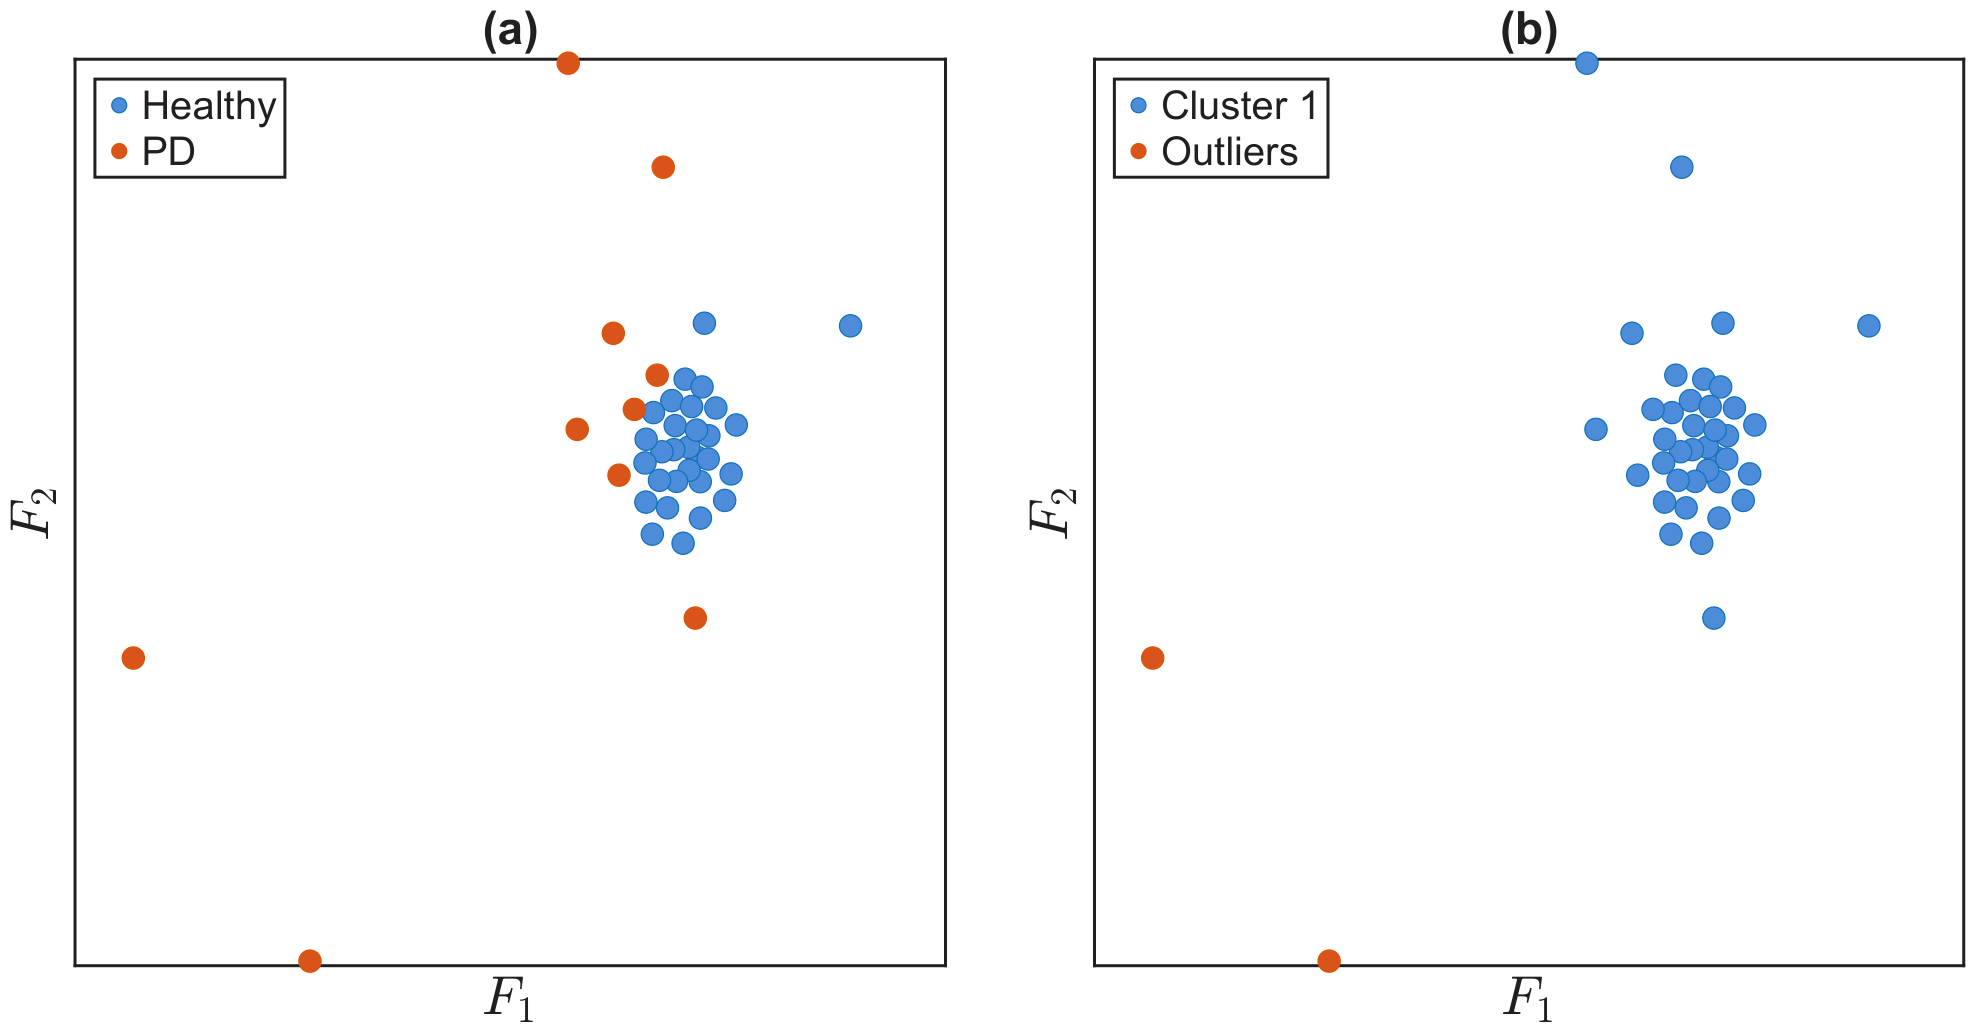
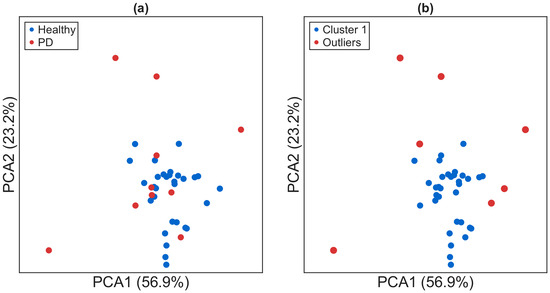
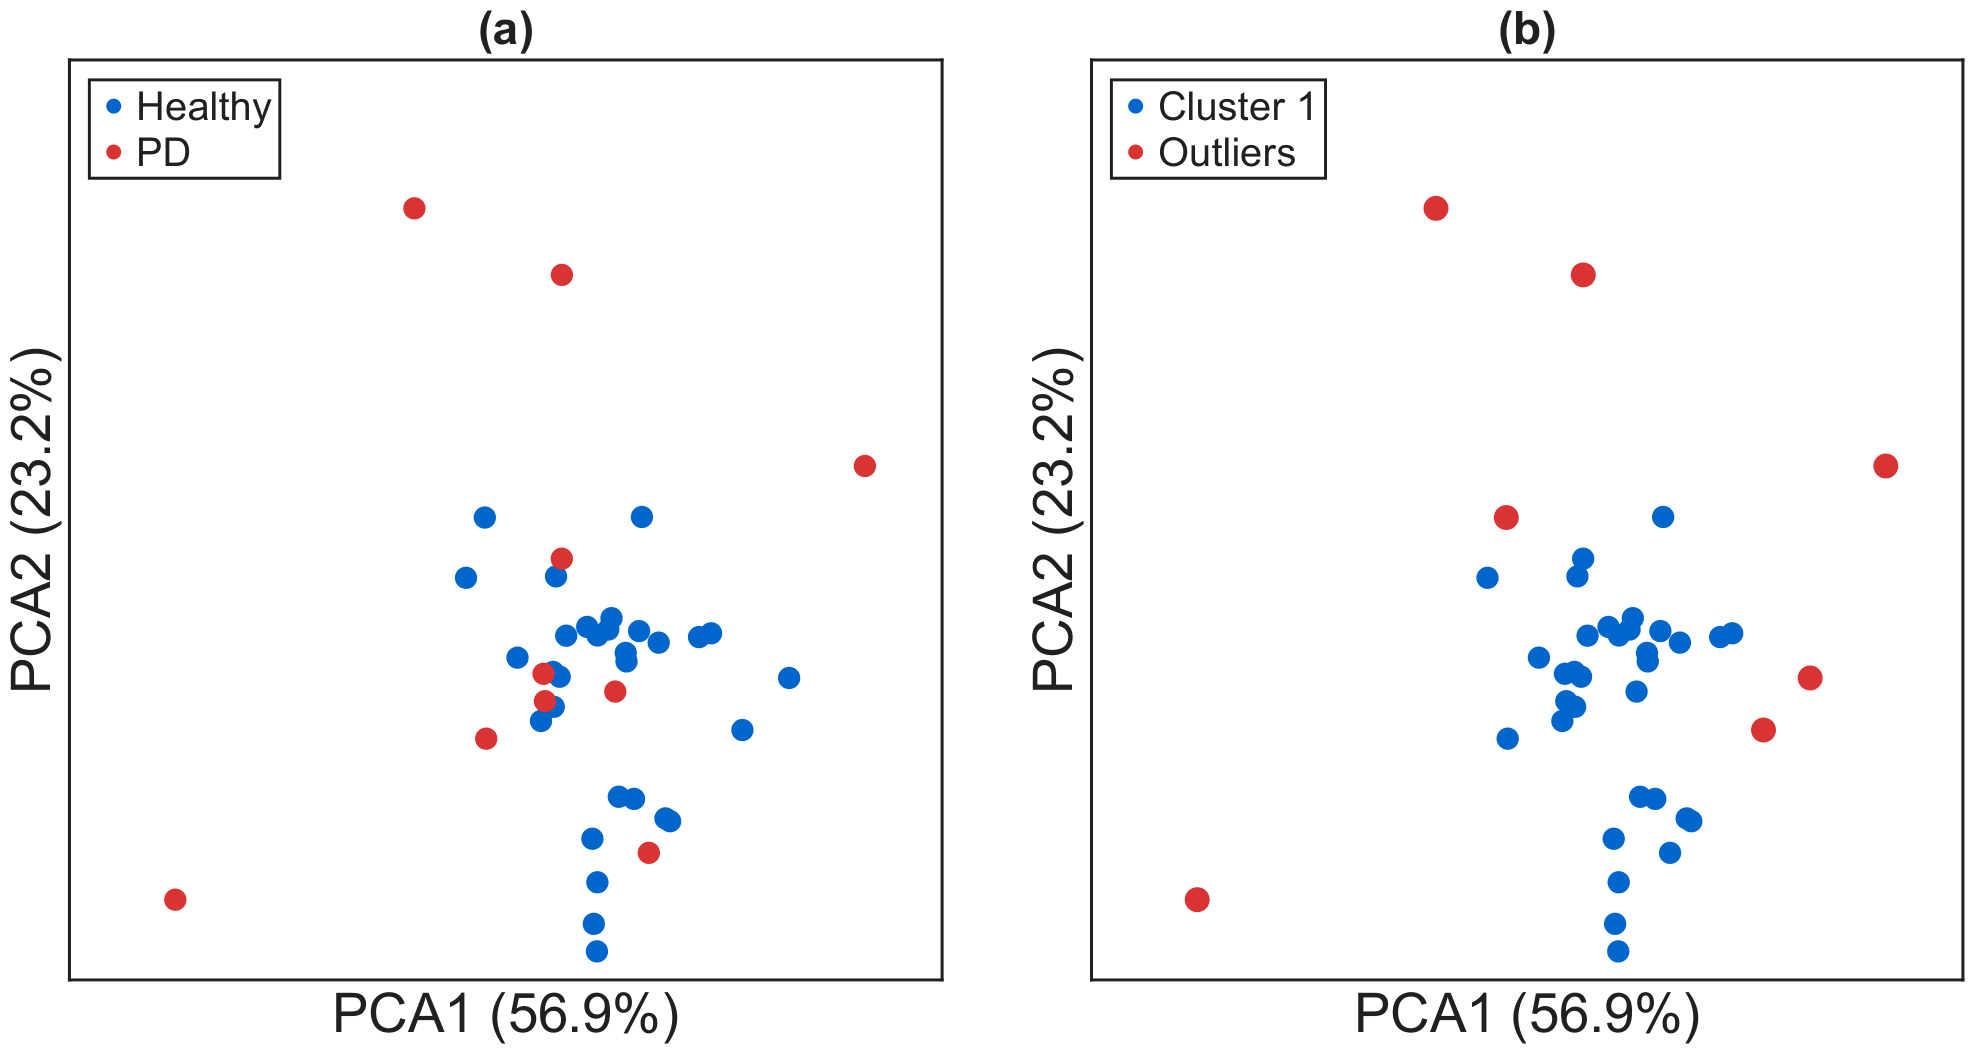
Figure 13 shows the clustering structure obtained in the PCA-reduced feature space. Although a degree of class separability can be observed between healthy controls and PD subjects, the resulting configuration exhibits a markedly weaker discriminative structure compared to the proposed representation. Notably, a non-negligible number of PD subjects are embedded within the region primarily associated with the healthy cluster, which significantly complicates their identification as outliers. Furthermore, the cluster corresponding to healthy controls does not display a well-defined compact geometry; instead, it suggests the presence of intra-cluster heterogeneity, as evidenced by the emergence of two partially separable subregions within the same cluster.
Figure 13.
DBSCAN consensus clustering outcome using conventional gait-based features: (a) ground truth labels, (b) identified clusters. Healthy controls form a compact cluster, while PD subjects are predominantly detected as outliers.
Finally, Table 4 summarizes the quantitative results of the benchmark between the proposed ICR-LLS methodology and the conventional baseline based on gait features in all the evaluated configurations. Since both methods are unsupervised, a direct comparison using clustering validity metrics is possible. In addition, classification-oriented performance measures have been reported to provide a more comprehensive evaluation of the ability of each approach to separate healthy and pathological gait patterns in an anomaly-detection setting.
Table 4.
Performance comparison between ICR-LLS methodology and the conventional gait feature-based approach.
The baseline based on conventional gait features consistently underperforms the proposed ICR-LLS approach in all configurations. The Max NMI solution achieves moderate agreement with clinical labels (NMI = 0.367) and high specificity (100.0%), but limited sensitivity (40.0%), indicating a bias toward correctly identifying healthy controls while not detecting a substantial portion of pathological cases. In contrast, the Max SCR configuration prioritizes structural separation (SCR = 9.100) at the expense of clinical relevance, resulting in very low specificity (6.7%) and accuracy (27.5%), as well as a reduced F1-score (38.3%), suggesting an unstable and clinically non-interpretable clustering solution. The consensus configuration provides a more balanced behavior, improving overall robustness (77.5%) and specificity (90.0%), but still exhibits limited sensitivity (40.0%) and a lower F1-score (47.1%) compared to the ICR-LLS method.
These results indicate that, under the same clustering framework, the baseline using conventional gait features yields weaker separability and reduced robustness, while the proposed ICR-LLS representation consistently provides a more balanced detection of pathological patterns and a more stable healthy cluster structure.
4. Discussion
The results of this study demonstrate that the ICR-LLS methodology effectively captures clinically relevant differences in gait patterns between individuals with PD and healthy controls, providing both quantitative and qualitative insight into locomotor alterations. Analysis of ICR trajectories (Figure 4) revealed that PD subjects exhibit increased vertical displacement amplitudes, asymmetrical trajectories and, in some cases, asymptotic trajectory shapes, as well as irregular phase timing. The presence of asymptotic behavior is particularly meaningful from a biomechanical perspective, as it arises when the segment undergoes predominantly translational motion with a reduced rotational component. This condition is consistent with increased joint stiffness, particularly in the knee, where limited flexion and extension reduce rotational excursion and cause the shank to behave more as a rigid segment. These features are consistent with well-documented motor impairments in PD, including rigidity, bradykinesia, and impaired intersegmental coordination. Since the ICR reflects both rotational and translational components of segment motion, these alterations indicate a change in coordinated lower-limb mechanics rather than isolated joint abnormalities.
In contrast, healthy controls exhibit smoother, more periodic, and spatially consistent trajectories with lower intragroup variability, reflecting stable intersegmental coordination and efficient biomechanical control. This contrast highlights the ability of ICR trajectories to encode underlying biomechanical constraints and neuromuscular control strategies associated with both normal and pathological gait.
These observations are further supported by the DTW-based dissimilarity matrix (Figure 5), where healthy controls consistently present low pairwise dissimilarities, indicating homogeneous gait patterns. In contrast, PD participants exhibit higher intra-group variability, reflecting the heterogeneous manifestation of the disease. In particular, some individuals show gait patterns close to normality, while others show pronounced deviations, suggesting that PD-related gait impairment exists along a continuum rather than as a strictly binary condition.
The self-organized low-dimensional network layout provides an intuitive visualization of these differences (Figure 6). Healthy controls form a compact cluster, reflecting highly uniform gait patterns, while PD subjects are more dispersed, forming small subgroups or appearing as outliers. This dispersion highlights the ability of ICR-LLS to detect gait deviations and to identify subpopulations of PD patients whose gait remains partially preserved. Such granularity is difficult to achieve with conventional binary classification approaches and supports the use of unsupervised representations for exploratory gait analysis.
Clustering analyzes using DBSCAN highlight an inherent trade-off between intrinsic cluster structure and external agreement with clinical labels. From a methodological perspective, optimizing for NMI favors solutions that align with known diagnostic categories, which in this controlled setting results in a dominant healthy cluster and subjects with PD primarily identified as outliers. However, in unsupervised clinical scenarios, where ground-truth labels are unavailable, the validity of the cluster must be based on internal structure-based criteria. In this context, metrics such as the SCR provide a more appropriate assessment of cluster quality, as they quantify cohesion and separation independently of clinical annotations. Nevertheless, maximizing SCR alone may bias the solution toward globally compact structures, potentially reducing sensitivity to subtle or early-stage gait abnormalities by favoring homogeneous cluster formation over the detection of rare deviations.
This trade-off between structural compactness and sensitivity to atypical patterns motivates the use of a consensus-based clustering strategy. By aggregating multiple DBSCAN solutions across parameter settings, the proposed approach mitigates hyperparameter sensitivity and stabilizes cluster assignments. Importantly, this ensemble formulation allows the method to maintain robustness in identifying consistent patterns of gait deviation while maintaining sensitivity to heterogeneous pathological manifestations, which is essential in unsupervised clinical analysis where disease boundaries are not explicitly defined.
To contextualize these findings, Table 5 summarizes clinical scores (UPDRS-II, UPDRS-II walking subscore, UPDRS-III, UPDRS-III walking subscore and Hoehn & Yahr stage) for subjects with PD during OFF-state walking trials, along with their ICR-LLS classification results.
Table 5.
Clinical characteristics of subjects with medically diagnosed PD in the OFF medication state and corresponding classification outcomes obtained using the ICR-LLS methodology.
Analysis of Table 5 indicates that inconsistencies between clinical diagnosis and ICR-LLS assignments are predominantly observed in participants with mild gait impairments. Specifically, subjects 31, 33, and 39 were assigned to the healthy cluster despite a clinical diagnosis of PD. These individuals exhibit relatively low UPDRS-II and UPDRS-III walking subscores (1–2), indicating subtle gait alterations. Their Hoehn & Yahr stages (2–3) correspond to mild-to-moderate disease severity, suggesting that their kinematic deviations during OFF-state walking were not sufficiently pronounced to be detected as pathological by the ICR-LLS framework. In contrast, subjects correctly classified as PD, including 32, 34, 35, 36, 37, 38, and 40, showed more pronounced gait deviations that were effectively captured by the ICR-LLS methodology.
To assess whether the structures identified from the ICR trajectories during gait exhibit statistically significant differences in clinical variables, we employed the Mann–Whitney U test, a non-parametric method suitable for comparing two independent groups when normality cannot be assumed. Although the ICR-LLS framework inherently produces a dominant cluster (corresponding to healthy controls) and a set of outliers (primarily associated with PD), for statistical analysis these subsets are interpreted as two distinct groups. This allows a review of whether the distributions of clinical variables differ significantly between the normative cluster and the anomalous population detected.
The analysis did not reveal significant differences between the groups for age () and BMI (), indicating that the separation is not driven by demographic factors. In contrast, statistically significant differences were observed for clinical measures associated with motor impairment in PD, including UPDRS-II (), UPDRS-III (), UPDRS-II walking (), UPDRS-III walking () and Hoehn & Yahr stage ().
These findings demonstrate that, although derived from an unsupervised anomaly detection framework, the partition induced by ICR-based clustering aligns with clinically significant differences in the severity of motor symptoms. In this sense, the combination of a dominant cluster and outliers can be interpreted as an implicit separation between normative and pathological gait patterns.
Most previous studies (Table 3) report very high accuracy, sensitivity, and specificity, often exceeding 95%, particularly those relying on ground reaction forces or three-dimensional kinematics. These results reflect the strong discriminative power of high-dimensional biomechanical features combined with supervised learning frameworks optimized for classification. By contrast, the ICR-LLS methodology adopts a fundamentally different approach. Rather than relying on GRFs or high-dimensional 3D kinematics, it analyzes two-dimensional shank ICR trajectories using unsupervised, data-driven methods. Despite reduced data dimensionality and the absence of supervised training, the method achieves high specificity (96.7%) and a competitive F1-score (77.8%), indicating a strong ability to correctly identify healthy controls while maintaining a balanced trade-off between precision and recall in detecting pathological gait patterns associated with PD.
The moderate sensitivity (70%) reflects the intrinsic trade-off of the proposed anomaly-detection framework. In contrast to supervised classifiers that often maximize overall accuracy, ICR-LLS prioritizes the reliable identification of the normative (healthy) gait pattern, which results in fewer false positives but a higher number of false negatives. Analysis of misclassified participants reveals that these individuals exhibit only subtle gait deviations in clinical assessments, placing them near the boundary between normal and pathological locomotion. This suggests that the method is conservative in labeling pathological cases, focusing on clear deviations from typical gait behavior.
A direct comparison with a conventional gait feature-based baseline further highlights the contribution of the proposed representation. By applying the same clustering framework (DBSCAN algorithm) to standard sagittal-plane features, the resulting clusters can be directly contrasted with those derived from ICR trajectories, allowing a rigorous assessment of their relative ability to discriminate between PD and healthy controls. As presented in Table 4, the conventional gait feature-based approach consistently underperformed the ICR-LLS method, exhibiting weaker separability. This is also illustrated in Figure 13, where several gait trials from individuals with PD appear highly intermingled with the control group, making them difficult to separate using clustering methods.
From a practical perspective, ICR-LLS offers important advantages in terms of applicability and interpretability. Unlike GRF-based methods that require force plates or 3D motion capture systems, the proposed framework relies on a limited number of sagittal-plane landmarks, allowing compatibility with simplified acquisition systems such as monocular video setups. This facilitates deployment in clinical and outpatient settings and supports longitudinal monitoring. Additionally, the self-organized network representation provides an intuitive visualization of gait variability, capturing the heterogeneity inherent in PD without imposing rigid class boundaries.
Nevertheless, several limitations should be acknowledged. The exclusive focus on 2D shank kinematics may not fully capture multi-planar or compensatory movements, potentially limiting sensitivity for certain gait phenotypes. In addition, current validation is restricted to a controlled scenario involving healthy controls and individuals with PD. Extending the framework to other neurological conditions, such as stroke or multiple sclerosis, introduces additional complexity, as these populations exhibit high intra-class variability and may not conform to a single-cluster-plus-outliers structure. Therefore, generalization to multi-pathology scenarios remains an open challenge and an important direction for future research.
Future work will focus on integrating additional biomechanical features, extending the framework to larger and more heterogeneous datasets, and exploring longitudinal analyzes to support early detection and personalized disease monitoring.
5. Conclusions
This study introduced and evaluated a novel unsupervised learning framework, ICR-LLS, designed to detect pathological gait patterns using instantaneous center of rotation trajectories derived from minimal two-dimensional kinematic data. The central aim was to determine whether subtle and overt gait deviations could be captured without relying on high-dimensional signals such as ground reaction forces or full 3D motion capture. To this end, the proposed methodology integrates four sequential components: computation of shank ICR trajectories, pairwise comparison through DTW-based dissimilarity measures, embedding of inter-subject relationships into a self-organized low-dimensional space, and density-based clustering using DBSCAN, followed by quantitative evaluation.
When applied to a publicly available dataset, the framework differentiated between Parkinsonian and healthy gait patterns, achieving an NMI of 0.449 and an SCR of 6.754, indicating a well-structured clustering organization. For benchmarking purposes, standard classification metrics were also calculated, yielding an accuracy of 90%, a sensitivity of 70%, and a specificity of 96.7%. Misclassifications were predominantly observed in individuals with mild motor symptoms, as reflected in lower UPDRS-II scores, suggesting that the method is sensitive to the gradation of gait alterations rather than to strict binary diagnostic categories. These results indicate that ICR trajectories capture biomechanical variability associated with PD, particularly in more pronounced cases, while also highlighting the challenges inherent in detecting subtle early-stage deviations.
Beyond the specific application to PD, this work establishes a methodological foundation for investigating gait patterns through unsupervised analysis of compact kinematic descriptors. By combining interpretability, scalability, and modest acquisition requirements compatible with single-camera setups, the ICR-LLS framework may support future research aimed at objective gait characterization across neurological and musculoskeletal conditions. Nevertheless, further validation in larger, clinically heterogeneous cohorts is necessary before considering translational or clinical implementation.
Author Contributions
Conceptualization, L.M.A. and M.S.; methodology, L.M.A.; software, L.M.A.; validation, L.M.A. and M.S.; formal analysis, L.M.A. and M.S.; investigation, M.S.; resources, L.M.A. and M.S.; data curation, L.M.A. and M.S.; writing—original draft preparation, L.M.A. and M.S.; writing—review and editing, L.M.A. and M.S.; visualization, L.M.A.; supervision, L.M.A. and M.S.; project administration, L.M.A. and M.S.; funding acquisition, L.M.A. All authors have read and agreed to the published version of the manuscript.
Funding
This research project was partly supported by the “Excellence Initiative—Research University” program for the AGH University of Krakow, and by the AGH University of Krakow as part of the statutory research project No. 16.16.120.773.
Data Availability Statement
The data presented in this study are openly available in A public data set of walking full-body kinematics and kinetics in individuals with Parkinson’s disease at 10.3389/fnins.2023.992585, and A full-body motion capture gait dataset of 138 able-bodied adults across the life span and 50 stroke survivors that can be found: https://www.nature.com/articles/s41597-023-02767-y, accessed on 16 April 2026, reference number [28,29].
Conflicts of Interest
The authors declare no conflicts of interest.
References
- Marsden, C.D. Parkinson’s disease. J. Neurol. Neurosurg. Psychiatry 1994, 57, 672–681. [Google Scholar] [CrossRef] [Scilit]
- Hoehn, M.M.; Yahr, M.D. Parkinsonism: Onset, progression and mortality. Neurology 1967, 17, 427. [Google Scholar] [CrossRef] [Scilit]
- Movement Disorder Society Task Force on Rating Scales for Parkinson’s Disease. The Unified Parkinson’s Disease Rating Scale (UPDRS): Status and recommendations. Mov. Disord. 2003, 18, 738–750. [CrossRef] [Scilit]
- Guo, Y.; Yang, J.; Liu, Y.; Chen, X.; Yang, G.Z. Detection and assessment of Parkinson’s disease based on gait analysis: A survey. Front. Aging Neurosci. 2022, 14, 916971. [Google Scholar] [CrossRef] [Scilit]
- Allen, N.E.; Schwarzel, A.K.; Canning, C.G. Recurrent Falls in Parkinson’s Disease: A Systematic Review. Park. Dis. 2013, 2013, 906274. [Google Scholar] [CrossRef] [Scilit]
- Kim, S.M.; Kim, D.H.; Yang, Y.; Ha, S.W.; Han, J.H. Gait Patterns in Parkinson’s Disease with or without Cognitive Impairment. Dement. Neurocogn. Disord. 2018, 17, 57. [Google Scholar] [CrossRef] [Scilit]
- Kim, W.; Kim, Y. Abnormal Gait Recognition based on Integrated Gait Features in Machine Learning. In Proceedings of the 2021 IEEE 45th Annual Computers, Software, and Applications Conference (COMPSAC); IEEE: New York, NY, USA, 2021; pp. 1683–1688. [Google Scholar] [CrossRef] [Scilit]
- Holden, M.K.; Gill, K.M.; Magliozzi, M.R. Gait Assessment for Neurologically Impaired Patients. Phys. Ther. 1986, 66, 1530–1539. [Google Scholar] [CrossRef] [Scilit]
- Lee, S.; Shin, S. Gait Signal Analysis with Similarity Measure. Sci. World J. 2014, 2014, 136018. [Google Scholar] [CrossRef] [Scilit]
- Ramakrishnan, T.; Lahiff, C.A.; Reed, K.B. Comparing Gait with Multiple Physical Asymmetries Using Consolidated Metrics. Front. Neurorobot. 2018, 12, 2. [Google Scholar] [CrossRef] [Scilit]
- Wang, Y.; Zou, Q.; Tang, Y.; Wang, Q.; Ding, J.; Wang, X.; Shi, C.J. SAIL: A Deep-Learning-Based System for Automatic Gait Assessment from TUG Videos. IEEE Trans. Hum.-Mach. Syst. 2022, 52, 110–122. [Google Scholar] [CrossRef] [Scilit]
- Khokhlova, M.; Migniot, C.; Dipanda, A. Kinematic Covariance Based Abnormal Gait Detection. In Proceedings of the 14th International Conference on Signal-Image Technology & Internet-Based Systems (SITIS); IEEE: New York, NY, USA, 2018; pp. 691–696. [Google Scholar] [CrossRef] [Scilit]
- Kidziński, Ł.; Yang, B.; Hicks, J.L.; Rajagopal, A.; Delp, S.L.; Schwartz, M.H. Deep neural networks enable quantitative movement analysis using single-camera videos. Nat. Commun. 2020, 11, 4054. [Google Scholar] [CrossRef] [Scilit]
- Khera, P.; Kumar, N. Role of machine learning in gait analysis: A review. J. Med. Eng. Technol. 2020, 44, 441–467. [Google Scholar] [CrossRef] [Scilit]
- Bayat, A.; Bayat, A.H.; Ghasemi, A.S. Classifying Human Walking Patterns using Accelerometer Data from Smartphone. Int. J. Comput. Sci. Mob. Comput. 2017, 612, 78–83. [Google Scholar]
- Cicirelli, G.; Impedovo, D.; Dentamaro, V.; Marani, R.; Pirlo, G.; D’Orazio, T.R. Human Gait Analysis in Neurodegenerative Diseases: A Review. IEEE J. Biomed. Health Inform. 2022, 26, 229–242. [Google Scholar] [CrossRef] [Scilit]
- Wang, L.; Sun, Y.; Li, Q.; Liu, T.; Yi, J. Two Shank-Mounted IMUs-Based Gait Analysis and Classification for Neurological Disease Patients. IEEE Robot. Autom. Lett. 2020, 5, 1970–1976. [Google Scholar] [CrossRef] [Scilit]
- Chen, M.; Huang, B.; Xu, Y. Human Abnormal Gait Modeling via Hidden Markov Model. In Proceedings of the 2007 International Conference on Information Acquisition (ICIA), Jeju, Republic of Korea, 8–11 July 2007; pp. 517–522. [Google Scholar] [CrossRef] [Scilit]
- Kim, H.; Kim, Y.H.; Kim, S.J.; Choi, M.T. Gait Clustering Analysis in Patients after Stroke using Gait Kinematics Data. In Proceedings of the 2021 21st International Conference on Control, Automation and Systems (ICCAS), Jeju, Republic of Korea, 12–15 October 2021; pp. 1405–1409. [Google Scholar] [CrossRef] [Scilit]
- Molina Arias, L.; Smoleń, M. Comparative Evaluation of ECG and Motion Signals in the Context of Activity Recognition and Human Identification. Sensors 2025, 25, 6040. [Google Scholar] [CrossRef] [Scilit]
- Chantraine, F.; Schreiber, C.; Pereira, J.A.C.; Kaps, J.; Dierick, F. Classification of Stiff-Knee Gait Kinematic Severity after Stroke Using Retrospective k-Means Clustering Algorithm. J. Clin. Med. 2022, 11, 6270. [Google Scholar] [CrossRef] [Scilit]
- Mulroy, S.; Gronley, J.; Weiss, W.; Newsam, C.; Perry, J. Use of cluster analysis for gait pattern classification of patients in the early and late recovery phases following stroke. Gait Posture 2003, 18, 114–125. [Google Scholar] [CrossRef] [Scilit]
- Montgomery, S.C.; Moorehead, J.D.; Davidson, J.S.; Lowe, D.; Dangerfield, P.H. A new technique for measuring the rotational axis pathway of a moving knee. Knee 1998, 5, 289–295. [Google Scholar] [CrossRef] [Scilit]
- Aiyangar, A.; Zheng, L.; Anderst, W.; Zhang, X. Instantaneous centers of rotation for lumbar segmental extension in vivo. J. Biomech. 2017, 52, 113–121. [Google Scholar] [CrossRef] [Scilit]
- Iwaniec, M.; Molina Arias, L.; Iwaniec, J. Characterization of Human Gait by Means of the Trajectory of the Instantaneous Centers of Rotation of Lower Limb Segments in the Sagittal Plane. IEEE Access 2025, 13, 27438–27448. [Google Scholar] [CrossRef] [Scilit]
- Meyers, A.; Buqammaz, M.; Yang, H. Cross-recurrence analysis for pattern matching of multidimensional physiological signals. Chaos 2020, 30, 123125. [Google Scholar] [CrossRef] [Scilit]
- Gao, C.X.; Dwyer, D.; Zhu, Y.; Smith, C.L.; Du, L.; Filia, K.M.; Bayer, J.; Menssink, J.M.; Wang, T.; Bergmeir, C.; et al. An overview of clustering methods with guidelines for application in mental health research. Psychiatry Res. 2023, 327, 115265. [Google Scholar] [CrossRef] [Scilit]
- Shida, T.K.F.; Costa, T.M.; de Oliveira, C.E.N.; de Castro Treza, R.; Hondo, S.M.; Los Angeles, E.; Bernardo, C.; dos Santos de Oliveira, L.; de Jesus Carvalho, M.; Coelho, D.B. A public data set of walking full-body kinematics and kinetics in individuals with Parkinson’s disease. Front. Neurosci. 2023, 17, 992585. [Google Scholar] [CrossRef] [Scilit]
- Van Criekinge, T.; Saeys, W.; Truijen, S.; Vereeck, L.; Sloot, L.H.; Hallemans, A. A full-body motion capture gait dataset of 138 able-bodied adults across the life span and 50 stroke survivors. Sci. Data 2023, 10, 852. [Google Scholar] [CrossRef] [Scilit]
- Lee, S.H.; Lim, J.S. Parkinson’s disease classification using gait characteristics and wavelet-based feature extraction. Expert Syst. Appl. 2012, 39, 7338–7344. [Google Scholar] [CrossRef] [Scilit]
- Daliri, M.R. Chi-square distance kernel of the gaits for the diagnosis of Parkinson’s disease. Biomed. Signal Process. Control 2013, 8, 66–70. [Google Scholar] [CrossRef] [Scilit]
- Ertuğrul, Ö.F.; Kaya, Y.; Tekin, R.; Almalı, M.N. Detection of Parkinson’s disease by Shifted One Dimensional Local Binary Patterns from gait. Expert Syst. Appl. 2016, 56, 156–163. [Google Scholar] [CrossRef] [Scilit]
- Açıcı, K.; Erdaş, ÇB.; Aşuroğlu, T.; Toprak, M.K.; Erdem, H.; Oğul, H. A Random Forest Method to Detect Parkinson’s Disease via Gait Analysis. In Engineering Applications of Neural Networks; Springer International Publishing: Berlin/Heidelberg, Germany, 2017; Volume 744, pp. 609–619. [Google Scholar] [CrossRef] [Scilit]
- Aşuroğlu, T.; Açıcı, K.; Erdaş, ÇB.; Toprak, M.K.; Erdem, H.; Oğul, H. Parkinson’s disease monitoring from gait analysis via foot-worn sensors. Biocybern. Biomed. Eng. 2018, 38, 760–772. [Google Scholar] [CrossRef] [Scilit]
- Zeng, W.; Liu, F.; Wang, Q.; Wang, Y.; Ma, L.; Zhang, Y. Parkinson’s disease classification using gait analysis via deterministic learning. Neurosci. Lett. 2016, 633, 268–278. [Google Scholar] [CrossRef] [Scilit]
- Zhao, A.; Qi, L.; Li, J.; Dong, J.; Yu, H. A hybrid spatio-temporal model for detection and severity rating of Parkinson’s disease from gait data. Neurocomputing 2018, 315, 1–8. [Google Scholar] [CrossRef] [Scilit]
- Noella, R.S.N.; Gupta, D.; Priyadarshini, J. Diagnosis of Parkinson’s disease using Gait Dynamics and Images. Procedia Comput. Sci. 2019, 165, 428–434. [Google Scholar] [CrossRef] [Scilit]
- Ghaderyan, P.; Fathi, G. Inter-limb time-varying singular value: A new gait feature for Parkinson’s disease detection and stage classification. Measurement 2021, 177, 109249. [Google Scholar] [CrossRef] [Scilit]
- Liu, X.; Li, W.; Liu, Z.; Du, F.; Zou, Q. A dual-branch model for diagnosis of Parkinson’s disease based on the independent and joint features of the left and right gait. Appl. Intell. 2021, 51, 7221–7232. [Google Scholar] [CrossRef] [Scilit]
- Aşuroğlu, T.; Oğul, H. A deep learning approach for parkinson’s disease severity assessment. Health Technol. 2022, 12, 943–953. [Google Scholar] [CrossRef] [Scilit]
- Ricciardi, C.; Amboni, M.; Santis, C.D.; Improta, G.; Volpe, G.; Iuppariello, L.; Ricciardelli, G.; D’Addio, G.; Vitale, C.; Barone, P.; et al. Using gait analysis’ parameters to classify Parkinsonism: A data mining approach. Comput. Methods Programs Biomed. 2019, 180, 105033. [Google Scholar] [CrossRef] [Scilit]
- Park, H.; Shin, S.; Youm, C.; Cheon, S.M.; Lee, M.; Noh, B. Classification of Parkinson’s disease with freezing of gait based on 360° turning analysis using 36 kinematic features. J. Neuroeng. Rehabil. 2021, 18, 177. [Google Scholar] [CrossRef] [Scilit]
- Ajay, J.; Song, C.; Wang, A.; Langan, J.; Li, Z.; Xu, W. A pervasive and sensor-free Deep Learning system for Parkinsonian gait analysis. In Proceedings of the 2018 IEEE EMBS International Conference on Biomedical & Health Informatics (BHI); IEEE: New York, NY, USA, 2018; pp. 108–111. [Google Scholar] [CrossRef] [Scilit]
- Guayacán, L.C.; Martínez, F. Visualising and quantifying relevant parkinsonian gait patterns using 3D convolutional network. J. Biomed. Inform. 2021, 123, 103935. [Google Scholar] [CrossRef] [Scilit] [PubMed]
- Sun, H.; Ye, Q.; Xia, Y. Predicting freezing of gait in patients with Parkinson’s disease by combination of Manually-Selected and deep learning features. Biomed. Signal Process. Control 2024, 88, 105639. [Google Scholar] [CrossRef] [Scilit]
- Zhang, Y.; Yan, W.; Yao, Y.; Ahmed, J.B.; Tan, Y.; Gu, D. Prediction of Freezing of Gait in Patients With Parkinson’s Disease by Identifying Impaired Gait Patterns. IEEE Trans. Neural Syst. Rehabil. Eng. 2020, 28, 591–600. [Google Scholar] [CrossRef] [Scilit]

Disclaimer/Publisher’s Note: The statements, opinions and data contained in all publications are solely those of the individual author(s) and contributor(s) and not of MDPI and/or the editor(s). MDPI and/or the editor(s) disclaim responsibility for any injury to people or property resulting from any ideas, methods, instructions or products referred to in the content. |
© 2026 by the authors. Licensee MDPI, Basel, Switzerland. This article is an open access article distributed under the terms and conditions of the Creative Commons Attribution (CC BY) license.