


Abstract
Background: Well-being in the elderly is shaped by complex emotional and social factors. Early identification of individuals at risk for reduced well-being may support timely preventive or supportive interventions. This study examined whether emotional intelligence indicators collected at baseline can predict well-being status 5 months later using explainable machine learning models. Methods: A cohort of elderly participants aged 60 to 89 years completed emotional intelligence measures at baseline, and well-being was assessed 5 months later using the POMS questionnaire. Four machine learning algorithms, Logistic Regression (LR), Support Vector Machines (SVM), Random Forest (RF), and Extreme Gradient Boosting (XGBoost), were developed using 5-fold stratified cross-validation. Model performance was evaluated through accuracy, precision, recall, F1-score, ROC AUC, and normalized confusion matrices. SHapley Additive exPlanations (SHAP) were applied to interpret the contribution and directionality of each predictor. Results: XGBoost achieved the highest predictive performance (accuracy = 0.789; F1 = 0.778) and demonstrated balanced classification across well-being categories. SVM also performed robustly (accuracy = 0.760), while LR showed reduced sensitivity for detecting those with poorer well-being. SHAP analysis identified self-control, emotionality, sociability, self-motivation, and well-being components as the most influential predictors. Lower emotionality, higher sociability, and higher self-control scores were linked to a greater probability of favorable well-being outcomes. Conclusions: The findings demonstrate the feasibility of using explainable machine learning models to predict 5-month well-being status within this sample of older adults using emotional intelligence indicators. XGBoost provided the strongest and most balanced performance, while SHAP analysis clarified how specific emotional intelligence dimensions influenced predictions. These findings suggest that interpretable machine learning approaches may support future efforts toward early recognition of older adults who may be at risk for reduced well-being and guide personalized intervention strategies.
1. Introduction
Well-being in later life is increasingly recognized as a multidimensional construct encompassing emotional, psychological, and subjective components that are essential for healthy aging. Public health frameworks emphasize the promotion of well-being not only as an outcome in its own right but also as a contributor to resilience, longevity, and overall population health [1]. Accumulating evidence suggests that positive psychological functioning, including higher life satisfaction and a stronger sense of purpose, predicts physical health outcomes independently of mental health disorders such as depression, highlighting the broader role of well-being in aging trajectories [2,3,4]. Moreover, mental health has been shown to causally contribute to healthy aging and extended lifespan, underscoring its relevance beyond the absence of psychological distress [5,6,7]. Despite growing interest across disciplines, research on well-being is challenged by a lack of conceptual consensus, as terms such as psychological well-being, mental well-being, and subjective well-being are often used interchangeably, with varying operational definitions [8,9]. This conceptual ambiguity complicates the selection of appropriate measures and targets for research and intervention [10]. Recent efforts have therefore called for unified frameworks that integrate key dimensions such as life satisfaction, purpose, and positive emotions to advance clarity and comparability across studies [11,12].
Emotional intelligence has emerged as a pivotal psychological asset for promoting well-being in older adulthood, as it enables individuals to recognize, interpret, and manage emotions in ways that enhance coping, social engagement, and life satisfaction. Foundational work underscores how emotional intelligence supports resilience amid common aging challenges, such as loss, health decline, and social isolation [13,14,15]. More recent research affirms these links and extends them within multidimensional models of healthy aging that integrate psychological, emotional, and social components [16,17,18]. For example, Razaghi et al. [19] found that emotional intelligence was strongly associated with psychological well-being in older adults, with physical activity significantly mediating this relationship. Contemporary studies also highlight how emotional and identity-related motivations shape engagement in health-promoting behaviors, illustrating that older adults’ emotional experiences influence activity participation and, in turn, psychological outcomes [20]. Bibliometric analyses further reveal a global research trend toward understanding psychological resilience, life satisfaction, and social participation as key pathways linking emotional processes and mental health in aging populations [21]. Additionally, adaptive emotion regulation strategies typical of later life, such as increased cognitive reappraisal, contribute to greater emotional stability and well-being [22,23]. Together, these findings position emotional intelligence as a core determinant of emotional balance and overall well-being in later life.
Machine learning (ML) offers new opportunities to investigate complex emotional and psychological determinants of well-being. Unlike traditional statistical models, ML algorithms can capture nonlinear relationships, interactions among predictors, and subtle patterns that might otherwise go undetected. For example, large-scale analyses of subjective well-being data using tree-based ML algorithms have demonstrated improved predictive performance compared with conventional regression approaches and have helped identify key drivers of life satisfaction such as health status, social relationships, and socioeconomic conditions [24]. Similarly, recent research applying artificial intelligence methods to large multinational samples of older adults has identified numerous predictors of subjective well-being spanning social, physical, and psychological domains, highlighting the multidimensional nature of well-being in later life [25]. Beyond large-scale population studies, ML techniques have also been applied to healthy aging research to uncover hidden patterns in resilience, whole-person health, and community-based health data. For instance, analyses of large-scale health datasets have shown that machine learning can reveal complex interactions between physical, psychosocial, and behavioral factors associated with healthy aging outcomes [26]. In addition, recent reviews focusing specifically on older adults indicate that various ML algorithms, including random forest, support vector machines, and gradient boosting methods, have demonstrated promising predictive performance in modeling health-related indices such as successful aging, quality of life, and life satisfaction [27].
More recently, the development of explainable artificial intelligence (XAI), such as SHapley Additive exPlanations (SHAP), has allowed researchers to combine predictive accuracy with transparency, thereby improving the interpretability of ML models in psychological and health-related domains. These tools enable a clearer understanding of how specific emotional intelligence features contribute to well-being outcomes while preserving the ability of ML to model complex data structures. Recent systematic reviews emphasize that XAI is becoming a central requirement for trustworthy deployment of machine learning systems in healthcare, particularly in clinical decision support environments where transparency and interpretability are critical [28,29]. Furthermore, contemporary overviews of ML in medicine highlight the importance of balancing predictive performance with clinical usability and decision-making integration [30,31].
Despite these advancements, few studies have applied explainable ML approaches to predict future well-being in the elderly using detailed emotional intelligence indicators [24,32]. Most existing research relies on traditional regression-based methods or cross-sectional designs, limiting the ability to uncover nuanced predictive patterns or provide interpretable, individualized insights. To address this gap, the present study develops and evaluates explainable machine learning models capable of forecasting 5-month well-being status from baseline emotional intelligence measures in older adults. Rather than proposing a novel algorithmic architecture, the contribution of this work lies in integrating predictive modeling with transparent SHAP-based interpretability within a prospective framework. This approach enables not only classification accuracy assessment but also individualized explanation of how emotional intelligence components contribute to predicted outcomes. By combining predictive performance with interpretability, the study aims to provide a clinically meaningful and practically applicable framework for early identification of elderly individuals at risk for reduced well-being. Given the exploratory nature of the sample, the study should be considered a proof-of-concept contribution requiring further validation.
2. Materials and Methods
2.1. Study Design
The objective of this study was to construct and evaluate interpretable machine learning models capable of predicting well-being status five months after baseline in older adults aged 60 to 89 years. At the initial assessment, emotional intelligence measures were collected and used as candidate predictors for forecasting later well-being outcomes. Well-being status at the 5-month follow-up was determined using a questionnaire that measures mood states. To generate the binary outcome variable, we computed the median of the POMS questionnaire score within the sample. Participants scoring at or below the median were categorized as having better well-being (class 1: 34 participants), whereas those with scores above the median were assigned to the poorer well-being group (class 0: 33 participants). The median threshold was used to ensure balanced class distributions for ML classification, which is particularly important when working with relatively small datasets. This procedure resulted in two nearly balanced outcome classes (34 vs. 33 participants), reducing the risk of class imbalance during model training. In addition, the POMS instrument does not provide universally established clinical cut-off values for defining high versus low well-being in community-dwelling older adults. Therefore, the sample-based median offered a neutral and data-driven criterion for outcome categorization [33].
Prior to their participation, the participants were thoroughly informed about the study procedures through both verbal explanation and written documentation. Written consent was obtained from each participant. The study protocol was reviewed and approved by the Research Ethics Committee of Democritus University of Thrace (approval number: 6118/29-28/09/2022).
2.2. Participants
The sample of the present study consisted of 67 older adults with a mean age of 69.67 ± 5.47 years, recruited from Open Care Centers for the Elderly (KAPI) in Komotini, Greece. Among the participants, 16 were men and 51 were women. In terms of educational background, the largest proportion were primary school graduates (37.2%), while a significant number held a university degree (19.8%) or a high school diploma (20.9%). Concerning marital status, most participants were married (65.1%) or widowed (26.7%), with smaller percentages being single (4.7%) or divorced (3.5%). Finally, 38.1% of participants reported having a health problem, while the remaining 61.9% did not.
The gender distribution (51 women and 16 men) reflects typical participation patterns in local Open Care Centers for the Elderly (KAPI), where female attendance is generally higher. This imbalance should be considered when interpreting the generalizability of the study findings.
2.3. Measurements
Emotional intelligence: Emotional intelligence was assessed using the Trait Emotional Intelligence Questionnaire–Short Form (TEIQue-SF) of Petrides and Furnham [34]. The instrument comprises 30 self-report items rated on a seven-point Likert scale (1 = strongly disagree to 7 = strongly agree). Example items include: “On the whole, I’m a highly motivated person,” “I generally believe that things will work out fine in my life,” and “Generally, I do not find life enjoyable.” The Greek adaptation of the questionnaire was translated and validated by Petrides, Pita, and Kokkinaki [35].
Well-being: The participants anonymously completed the self-report questionnaire “Profile of Mood States” (POMS) [36], which assesses either momentary emotional states or an individual’s general mood disposition. The instrument consists of 37 items beginning with the prompt “How do you feel right now?” and is organized into six subscales: (1) Tension (6 items, e.g., anxious), (2) Depression (8 items, e.g., sad), (3) Anger (7 items, e.g., irritated), (4) Vigor (6 items, e.g., full of life), (5) Fatigue (5 items, e.g., exhausted), and (6) Confusion (5 items, e.g., confused). Items are rated on a five-point Likert-type scale (0 = not at all to 4 = extremely). The Greek version used in this study was specifically adapted for the Greek population by Zervas et al. [37].
The internal consistency of the instruments within the present sample was examined using Cronbach’s alpha. For the TEIQue-SF dimensions, reliability coefficients were α = 0.60 for the well-being dimension, α = 0.55 for self-control, α = 0.57 for emotionality, and α = 0.53 for sociability. The POMS scale demonstrated excellent internal consistency (Cronbach’s α = 0.93). Reverse-coded items were recoded prior to analysis to ensure consistent item orientation.
2.4. Machine Learning Workflow
Data Preparation: Before model development, the dataset underwent a systematic preprocessing pipeline designed to improve data quality and maintain consistency across all analytical steps. Missing values, which appeared only in categorical variables and did not exceed 5% of the total data, were addressed using mode-based imputation. To ensure that all variables contributed comparably during training, each feature was standardized with the StandardScaler—scikit-learn 1.8.0 which centers variables at zero mean and rescales them to unit variance. This standardized representation was kept constant throughout both the feature selection (FS) stage and model training to avoid discrepancies in data distribution and to promote stable model learning. To prevent data leakage, all preprocessing steps were fitted exclusively on the training portion of each cross-validation fold and then applied to the corresponding validation fold. No information from the validation data was used during preprocessing or model training.
Feature Selection Strategy: From an initial set of 30 candidate variables, relevant predictors were identified using Sequential Forward Feature Selection (SFFS) combined with a 5-fold stratified cross-validation framework. SFFS incrementally assembles a feature subset by adding, at each iteration, the variable that most improves model performance. The stratified nature of the cross-validation ensured that each fold preserved the original class proportions, an important consideration for datasets with unequal class representation. This FS approach provides several benefits: it focuses the model on the most informative predictors, reduces dimensionality and overfitting risk, and enhances both interpretability and generalization capability. In addition, the FS procedure indirectly mitigates potential multicollinearity issues by excluding redundant predictors and retaining only variables that contribute meaningfully to model performance. To avoid optimistic bias, FS was performed separately within each training fold of the cross-validation procedure and was not applied to the full dataset before partitioning.
Model Training Procedure: To evaluate classification performance from multiple methodological perspectives, we implemented four binary classifiers: Random Forest (RF), Extreme Gradient Boosting (XGBoost), Logistic Regression (LR), and Support Vector Machines (SVM). These algorithms were selected to represent complementary modeling paradigms commonly used in predictive health and behavioral research [27]. Logistic Regression served as a classical statistical baseline model, offering interpretable linear relationships between predictors and outcomes. Random Forest was included as a widely used ensemble learning algorithm that constructs multiple decision trees and aggregates their predictions, allowing the model to capture complex nonlinear relationships and interactions among predictors while maintaining robustness against overfitting. Support Vector Machines were chosen for their ability to model nonlinear decision boundaries and perform effectively in relatively small datasets with potentially complex feature spaces. XGBoost was included as a powerful ensemble learning method capable of capturing nonlinear relationships and higher-order feature interactions while incorporating regularization mechanisms that help mitigate overfitting. Using several algorithms allowed us to assess the stability of the findings and avoid reliance on a single modeling technique. Because different algorithms interact with features in distinct ways, FS was conducted independently for each classifier. Because the primary focus of the study was on machine learning algorithms (SVM and XGBoost), which are generally less sensitive to multicollinearity, explicit multicollinearity diagnostics were not considered critical for the modeling process. In addition, the sequential forward feature selection procedure reduces potential redundancy among predictors by retaining only variables that contribute meaningfully to model performance.
A 5-fold stratified cross-validation scheme was used during training to control overfitting and obtain reliable performance estimates. Stratification ensured that each fold preserved the class distribution of the original dataset, which is particularly important for binary classification tasks with relatively small sample sizes. The choice of five folds represents a commonly used balance between computational efficiency and stable model evaluation. Within each training fold, preprocessing, FS, and hyperparameter tuning were performed exclusively using the training data, and the resulting transformations were then applied to the corresponding validation fold. Hyperparameters for each model were optimized through nested 5-fold stratified cross-validation performed inside the training folds. This multilayered training architecture ensured that model evaluation remained unbiased and that the resulting models were tuned for optimal predictive performance.
Performance Assessment: Model performance was quantified using a diverse set of evaluation metrics. Accuracy provided a global measure of correct classifications. Given the nearly balanced class distribution in the dataset, accuracy represents an appropriate global performance indicator; however, additional metrics such as precision, recall, F1-score, and ROC AUC were also reported to provide a more comprehensive evaluation of model performance. Precision quantified how many of the predicted positive cases were truly positive, while recall (sensitivity) assessed the model’s ability to detect all positive instances. The F1-score combines precision and recall into a single metric that balances both aspects. We also computed the area under the ROC curve (AUC-ROC) to evaluate how well each classifier separated the two classes across different decision thresholds. Additionally, mean normalized confusion matrices were examined to provide insight into error patterns and the distribution of misclassifications.
Model Explainability: To interpret the contribution of individual features to model predictions, we employed SHapley Additive exPlanations (SHAP) [38]. SHAP assigns an additive importance value to each feature for every prediction, grounded in cooperative game-theoretic principles. Using SHAP on the standardized training inputs allowed us to determine which variables were most influential and to clarify whether their effects pushed predictions toward one class or the other. This interpretive layer provided transparency and a deeper understanding of the learned decision logic.
Software and Implementation Details: All model preprocessing, development, and evaluation were carried out in Python 3.10. The Scikit-learn library served as the core toolkit for implementing preprocessing routines and machine learning algorithms, ensuring a reproducible and efficient computational environment.
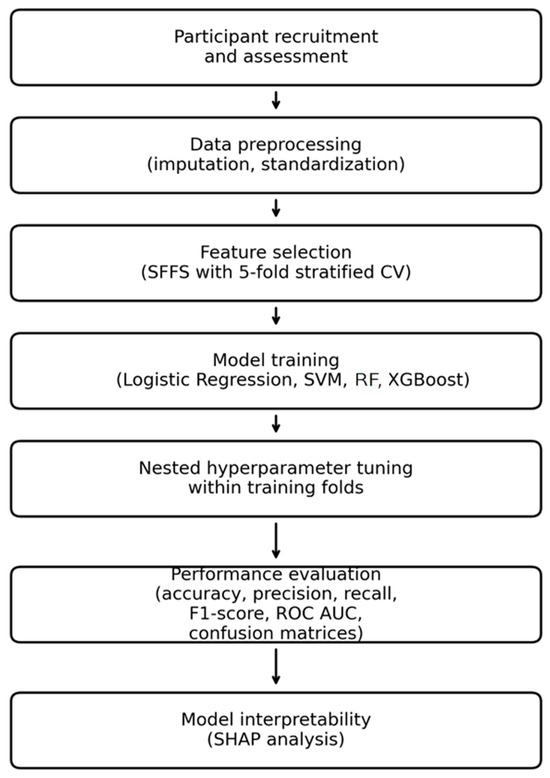
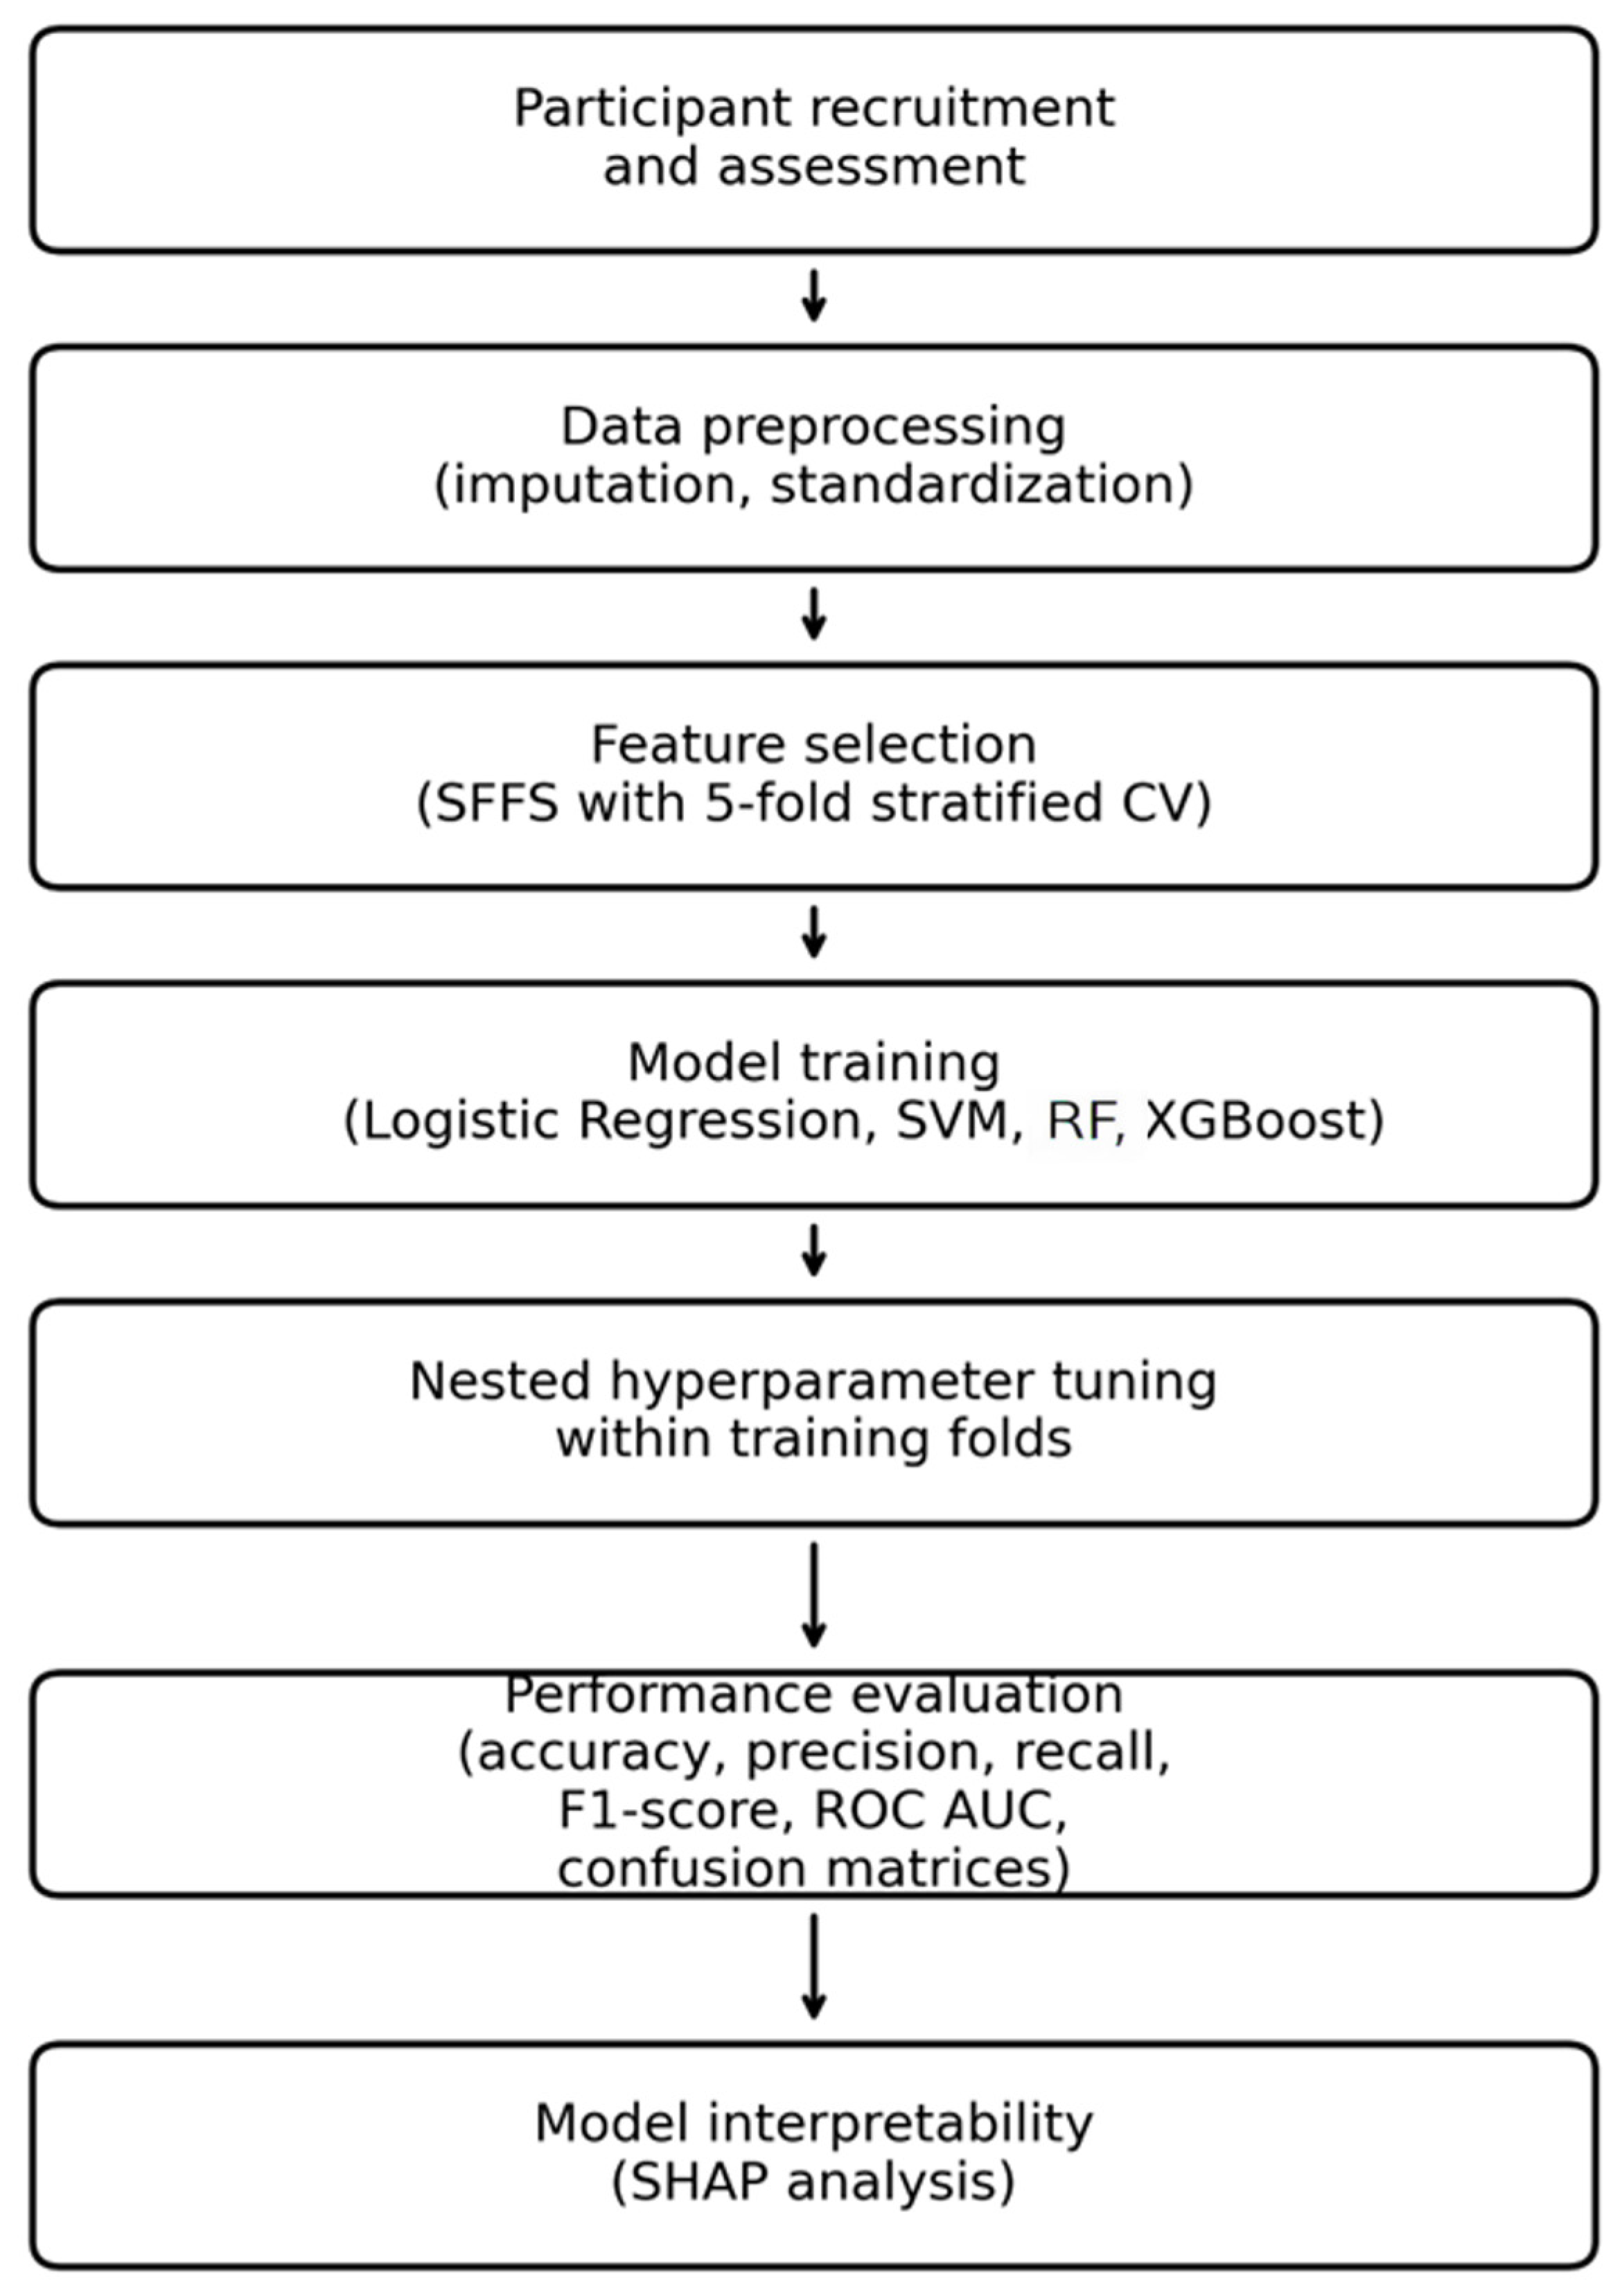
Figure 1 presents an overview of the ML workflow applied in the present study.
Figure 1.
Overview of the ML workflow used in the present study.
3. Results
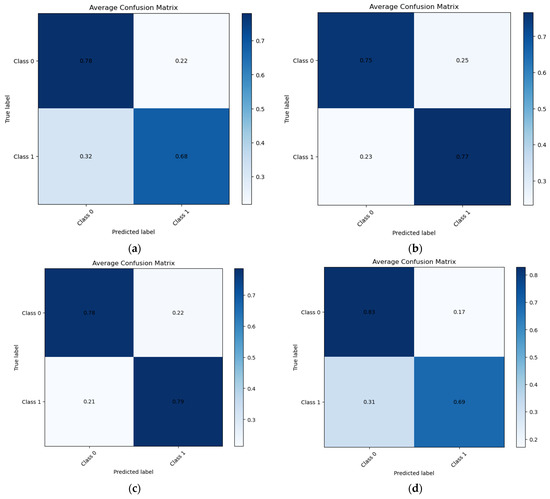
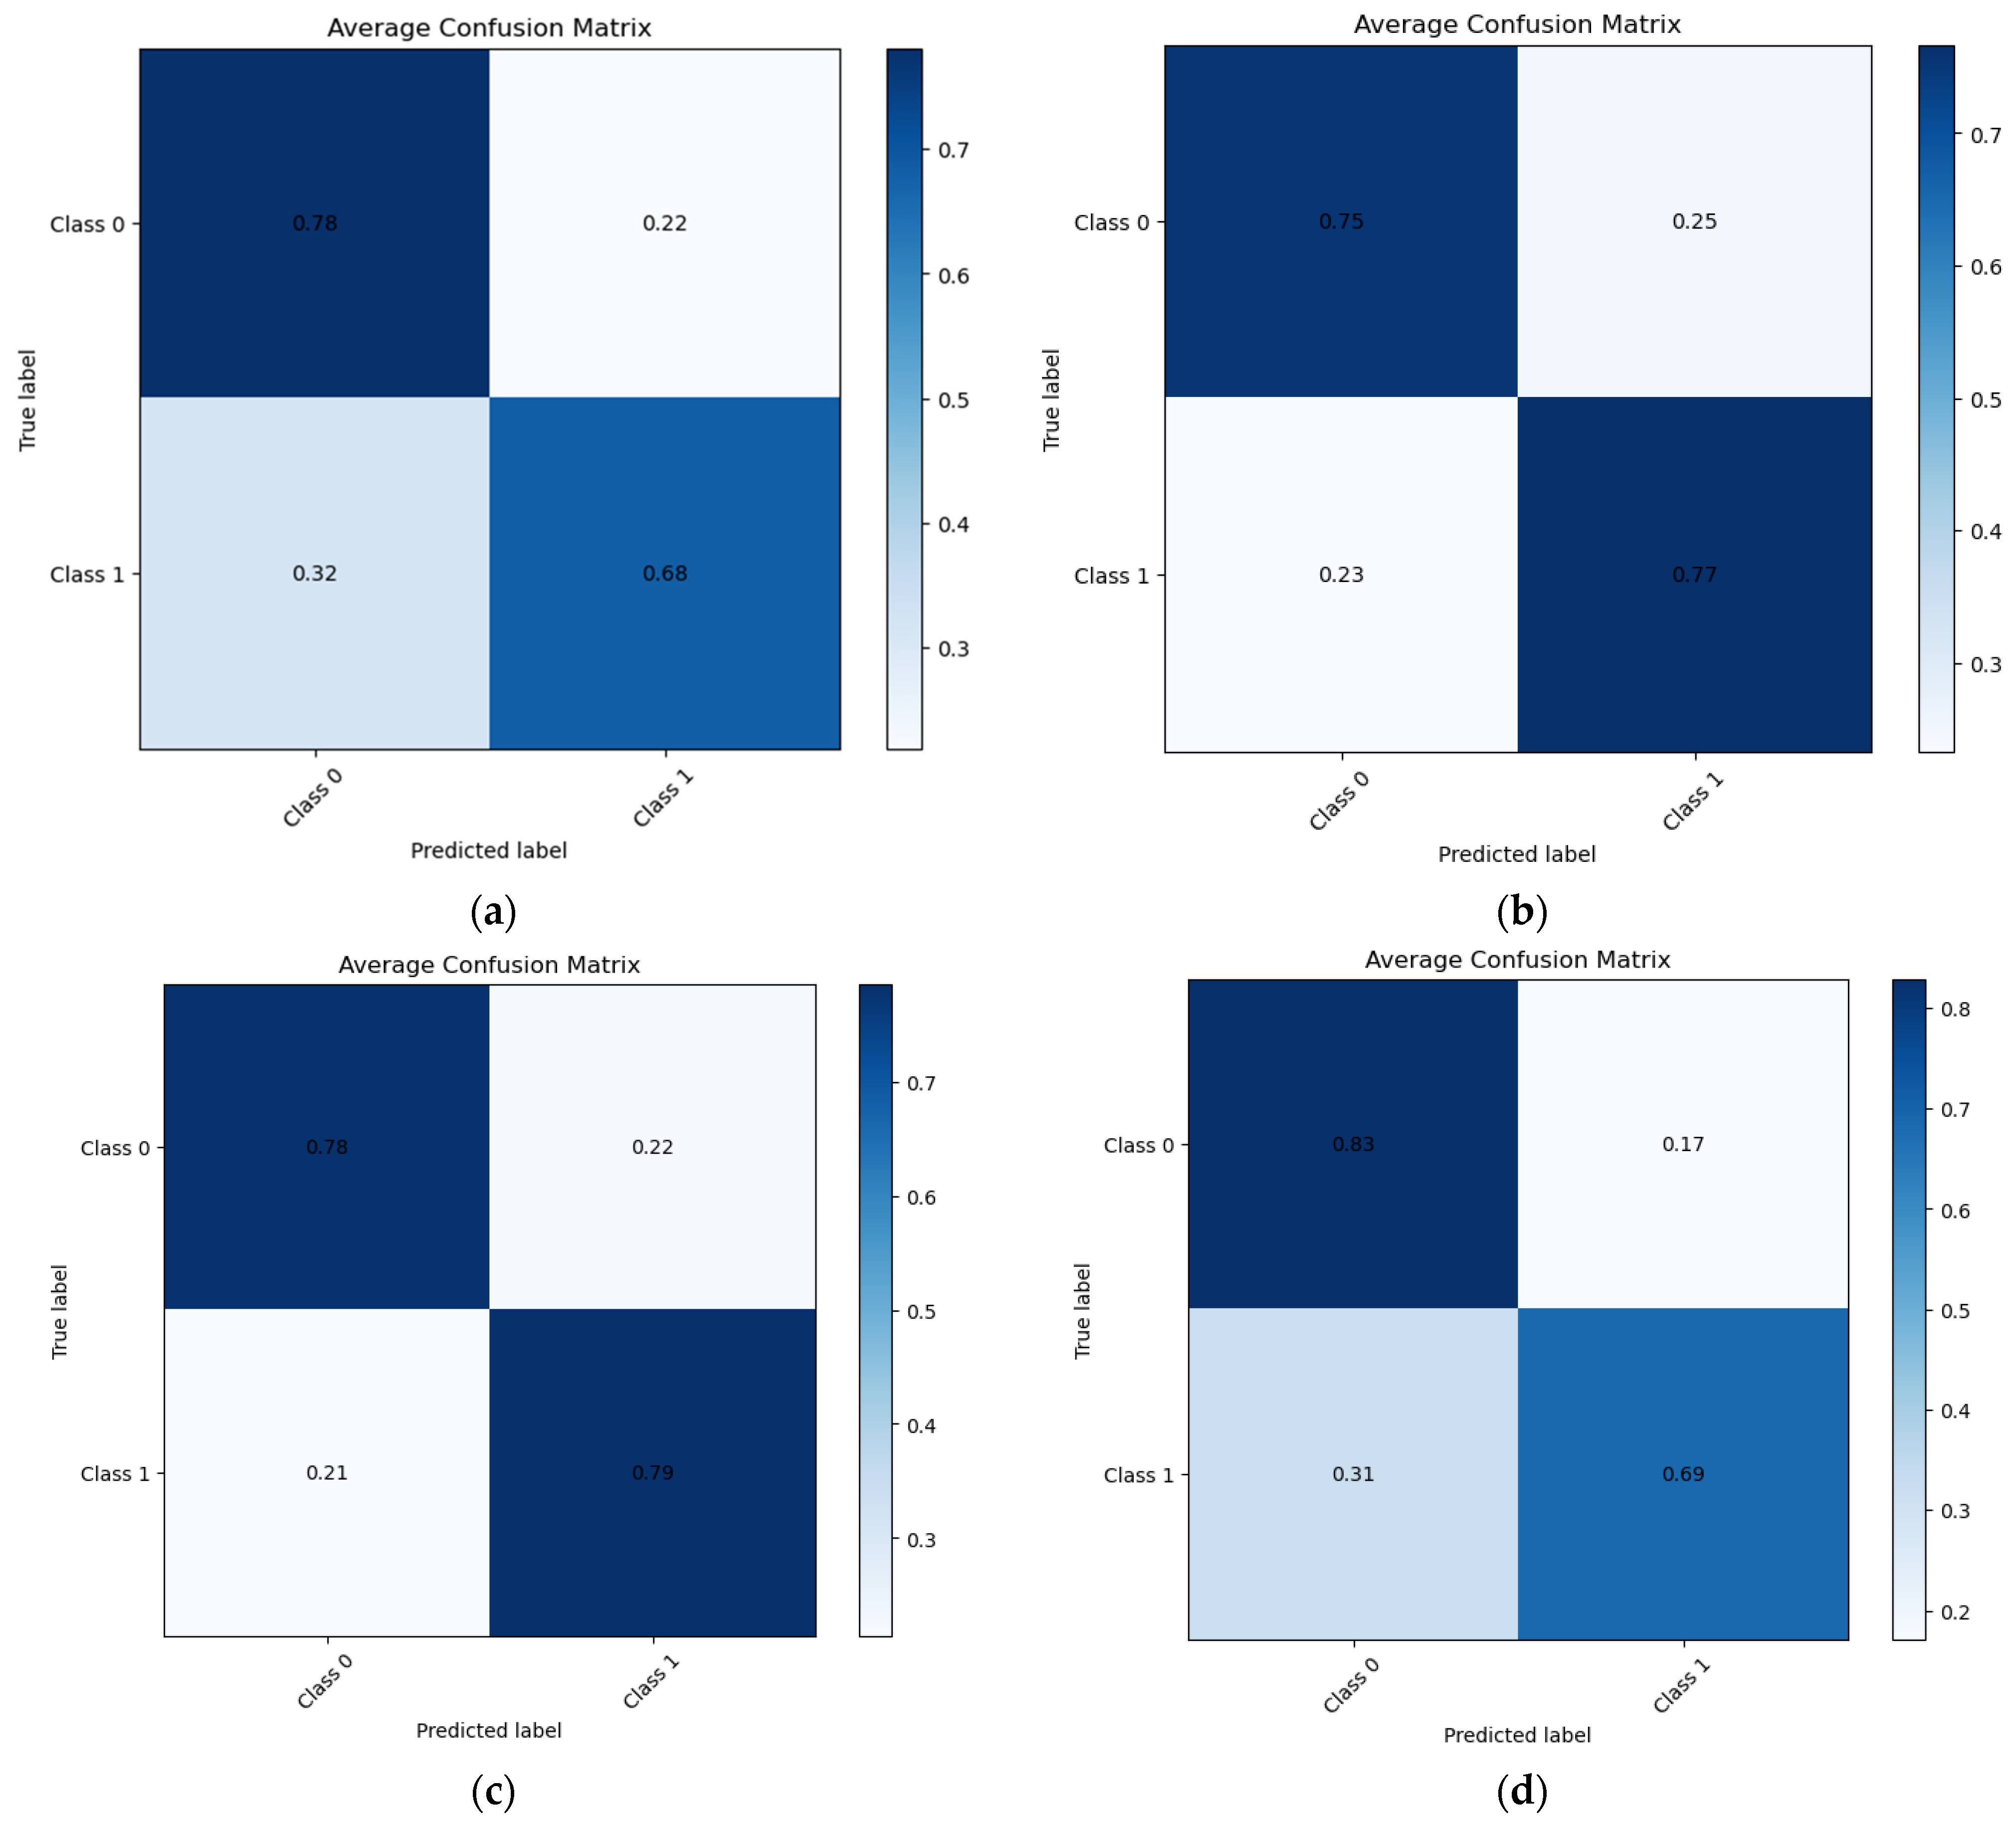
A total of four ML algorithms were trained to predict well-being status five months after baseline. Their performance was evaluated using 5-fold stratified cross-validation. The results consistently demonstrated variation in how each model handled the two outcome classes, as illustrated by the averaged confusion matrices and global performance metrics (Figure 2 and Figure 3).
Figure 2.
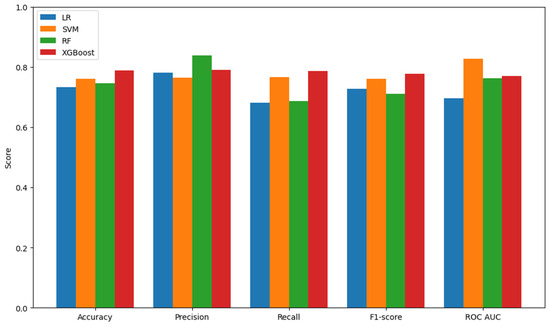
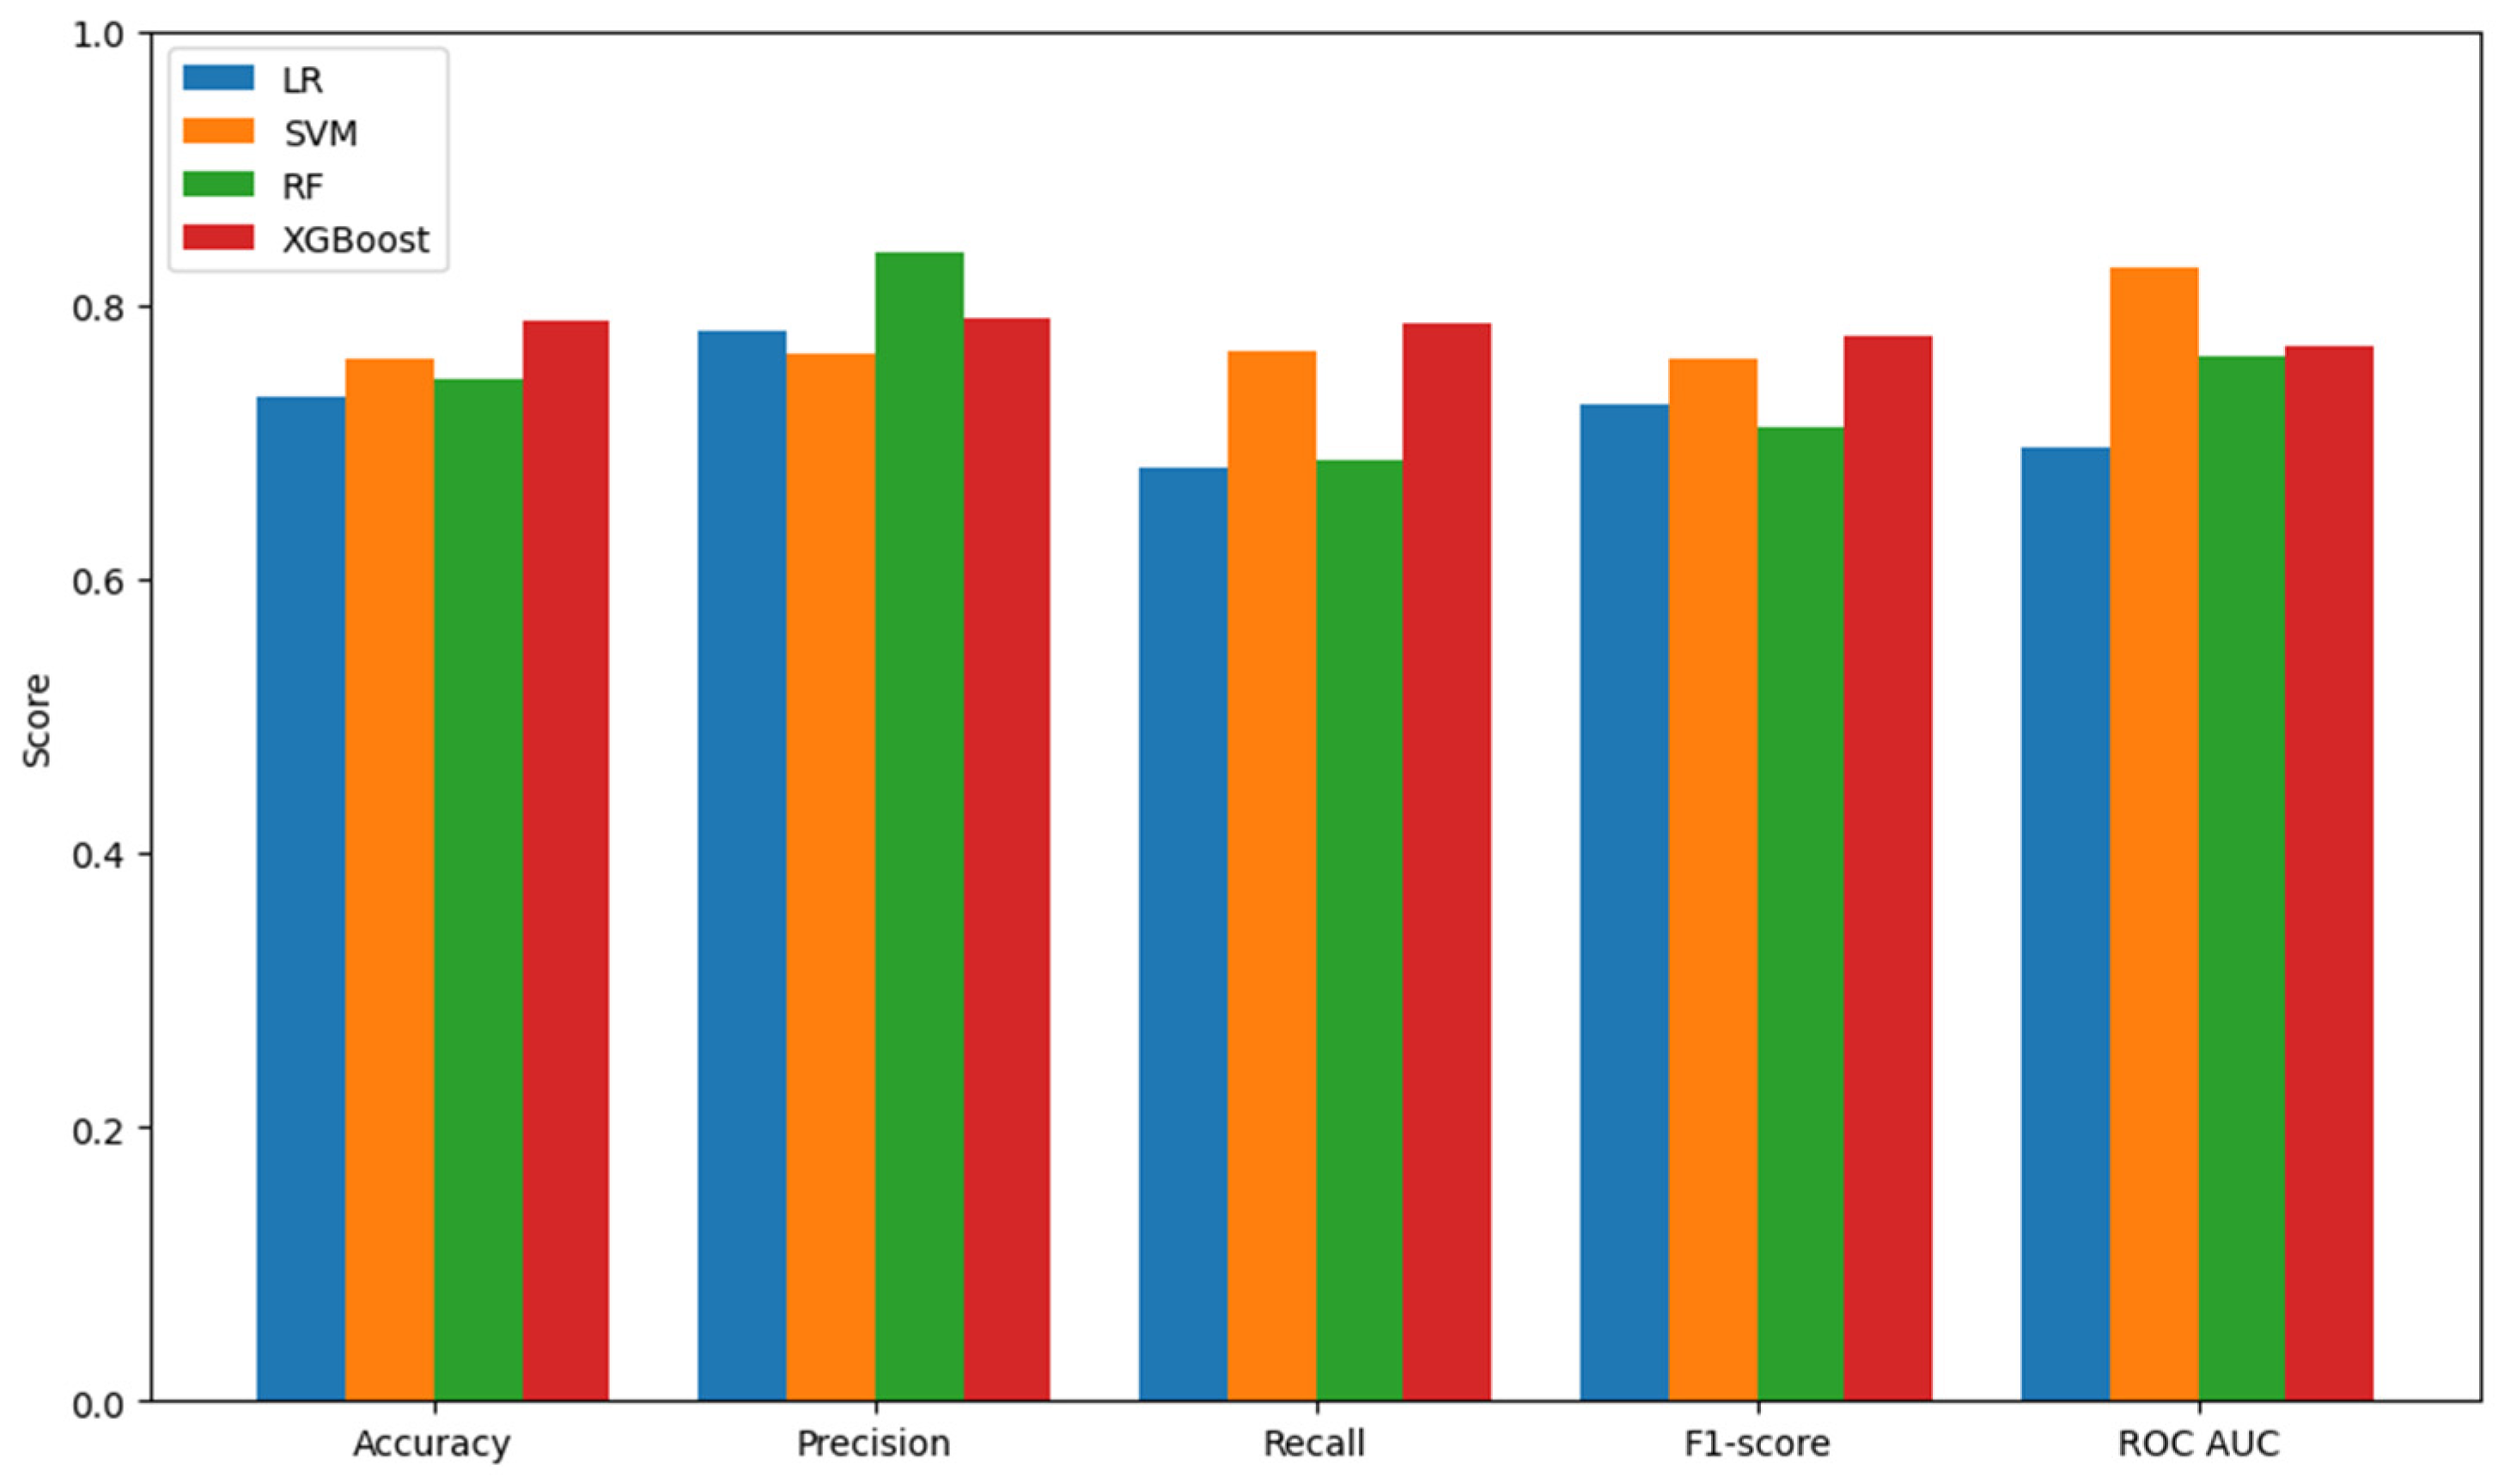
Comparative predictive performance of the evaluated machine learning models (LR, SVM, RF, and XGBoost) across the main evaluation metrics, including accuracy, precision, recall, F1-score, and ROC AUC.
Figure 3.
Normalized Confusion Matrices (a) LR, (b) SVM, (c) XGBoost and (d) RF. Each matrix shows the proportion of correctly and incorrectly classified observations for the two well-being outcome classes, where rows represent the true labels and columns represent the predicted labels. Values are normalized within each class to facilitate comparison of classification patterns across models.
LR produced moderate predictive performance. The model achieved an accuracy of 73.19%, driven largely by strong identification of Class 0 (better well-being). As shown in the confusion matrix, LR correctly assigned 78.1% of Class 0 cases, whereas performance was lower for Class 1, with only 68.1% correctly classified. This imbalance is also reflected in a precision of 0.781, indicating reliable detection of positive predictions, contrasted by a recall of 0.681, demonstrating that nearly one-third of Class 1 participants were missed. The F1-score of 0.727 and ROC AUC of 0.6966 further confirm that LR, while functional, struggled particularly with the minority class. The model’s difficulty in capturing Class 1 patterns suggests that relationships between predictors and the outcome may not be strictly linear. Optimal performance was achieved using C = 10 with the liblinear solver.
The SVM classifier demonstrated a clear improvement over LR, offering more balanced detection across both classes. The model attained an accuracy of 76.04% and maintained nearly symmetrical performance: 75.2% correct identification for Class 0 and 76.7% for Class 1. This indicates that SVM was more capable of capturing the underlying structure of the dataset, leading to fewer biased predictions toward either class. Statistically, the SVM achieved precision (0.765) and recall (0.767) values that were almost identical, reflected in a stable F1-score of 0.760. Importantly, SVM reached the highest ROC AUC among all evaluated models (0.8279), indicating strong discriminative ability across decision thresholds. These results suggest that the nonlinear decision boundary introduced by the RBF kernel (C = 3) was well suited for the complexity of the predictor space.
Random Forest demonstrated stable predictive performance, achieving an average accuracy of 74.62%, comparable to LR but slightly lower than SVM. The confusion matrix shows that the model correctly classified 82.9% of Class 0 cases, while performance for Class 1 was more limited, with 68.6% correctly identified (Figure 3). This pattern suggests that RF was particularly effective in detecting better well-being cases but showed reduced sensitivity in identifying poorer well-being outcomes. The model achieved a precision of 0.838, the highest among the evaluated models, along with a recall of 0.686, resulting in an F1-score of 0.710 and a ROC AUC of 0.763, indicating satisfactory discriminative ability.
XGBoost achieved the highest overall accuracy and F1-score among the evaluated models. However, the differences between algorithms were relatively modest, and model performance should be interpreted cautiously given the small sample size. With an accuracy of 78.90%, XGBoost outperformed both LR and SVM while maintaining highly balanced classification across both outcome groups (Figure 2). The confusion matrix shows that the model correctly classified 78.1% of Class 0 and 78.6% of Class 1—virtually identical detection rates (Figure 3). This symmetry demonstrates strong generalization and minimal bias toward either class. The classifier also achieved a precision of 0.790, a recall of 0.786, and the highest F1-score among all models (0.778), indicating robust predictive capability. Although the ROC AUC (0.769) was lower than that of SVM, XGBoost offered the best overall balance between sensitivity and precision across classes. This superior performance likely stems from its ability to model nonlinear patterns and high-level interactions that may not be captured by traditional linear models. Model tuning produced an optimal configuration with learning_rate = 0.1, max_depth = 4, min_child_weight = 2, and n_estimators = 200.
To facilitate comparison across the evaluated algorithms, Figure 2 presents a visual summary of the main performance metrics for LR, SVM, XGBoost and RF.
The confusion matrices provide additional insight into the distribution of correct and incorrect classifications across the two well-being categories, illustrating how each model balanced sensitivity and specificity.
FS identified 12 influential predictors, primarily drawn from emotionality, self-control, sociability, self-motivation, and well-being domains, highlighting the multi-dimensional nature of emotional intelligence components in forecasting long-term well-being (Table 1).
Table 1.
The 12 most influential predictors of the best-performing ML model.
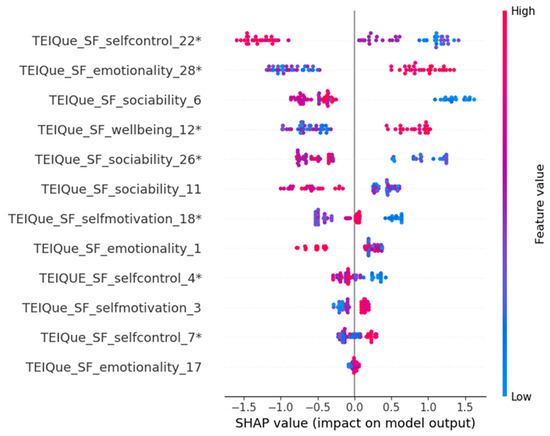
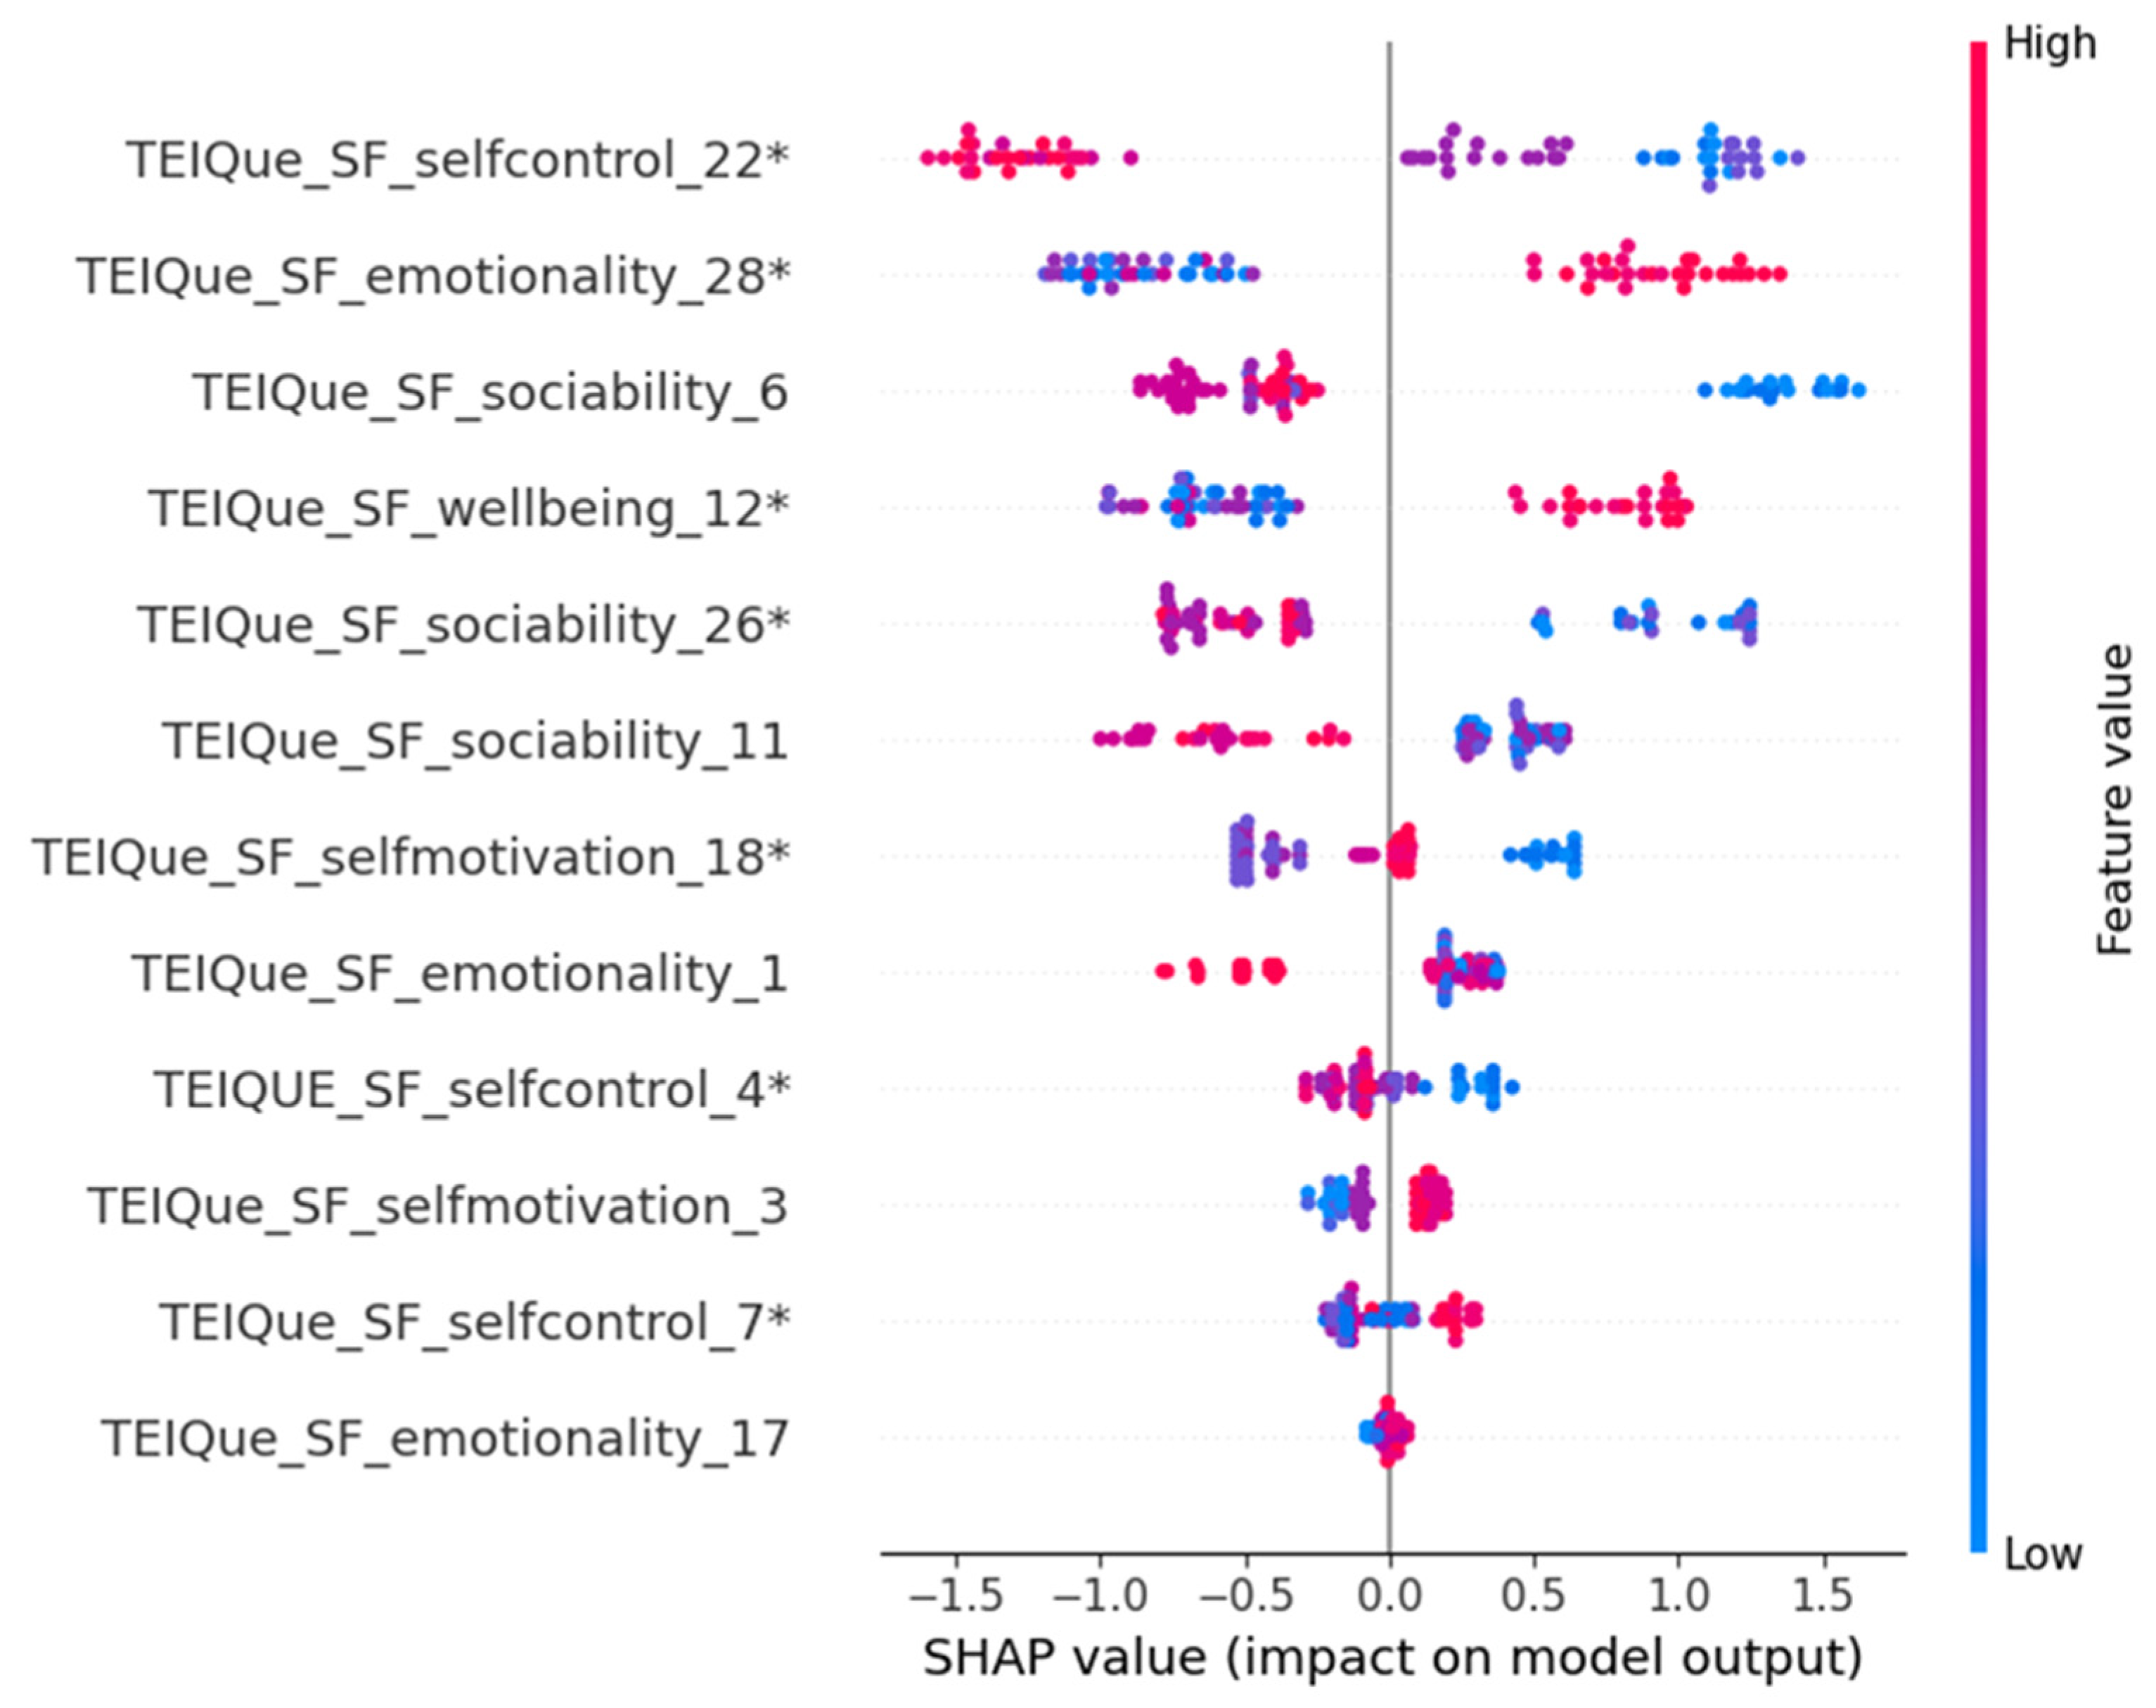
The SHAP bee swarm plot provides a global overview of feature importance and the direction of each feature’s contribution to the model predictions, revealing that TEIQue_SF_selfcontrol_22*, TEIQue_SF_emotionality_28*, and TEIQue_SF_sociability_6 were the most influential predictors of 5-month well-being (Figure 4). These features showed a clear pattern in which higher scores (red points) consistently produced positive SHAP values, indicating a shift toward the better well-being class. Conversely, lower scores (blue points) were associated with negative SHAP values, reflecting a tendency toward poorer well-being. Mid-ranked predictors, such as TEIQue_SF_wellbeing_12*, TEIQue_SF_sociability_26*, and TEIQue_SF_sociability_11, displayed similar but slightly less pronounced effects. Lower-impact features contributed more modestly but still exhibited individualized influences, with both positive and negative contributions depending on the participant. Overall, the SHAP plot highlights that multiple dimensions of emotionality, sociability, self-control, and self-motivation interact in nonlinear ways, jointly shaping the model’s classification of well-being outcomes.
Figure 4.
SHAP bee swarm plot illustrating the distribution and magnitude of feature-level contributions to the model predictions. Each point represents an individual observation, while color indicates the relative value of the feature (low to high). Features are ordered according to their average absolute SHAP value, reflecting their overall importance in the model. The plot provides an interpretable overview of how variations in predictor values influence the predicted probability of well-being outcomes. These patterns should be interpreted as exploratory indications of feature influence within the predictive model.
4. Discussion
The present study examined the feasibility of using ML models to predict well-being status at a 5-month follow-up using emotional intelligence–related indicators collected at baseline. Across the four models evaluated, XGBoost demonstrated the highest classification accuracy and the most balanced performance for both outcome classes, suggesting that nonlinear modeling approaches may be particularly well suited for capturing the complex relationships underlying emotional and behavioral predictors of well-being. The SVM also performed well, especially in terms of ROC AUC, indicating strong discriminative power, whereas LR produced acceptable but comparatively weaker results, particularly in identifying individuals with poorer well-being. This pattern aligns with prior evidence that emotional and psychological constructs often interact in nonlinear or multiplicative ways, favoring algorithms capable of modeling high-order interactions. Consistent with this interpretation, XGBoost also demonstrated relatively stable predictive performance across cross-validation folds, achieving an accuracy of 0.789 ± 0.102 (95% CI [0.663–0.915]) and an F1-score of 0.778 ± 0.132 (95% CI [0.615–0.942]), with a ROC AUC of 0.769 ± 0.074 (95% CI [0.678–0.861]).
The SHAP bee swarm analysis identified statistical associations between specific facets of trait emotional intelligence, social functioning, and predicted well-being classification within the model. The strongest feature contributions were observed for items reflecting behavioral self-regulation (e.g., avoiding commitments one later regrets; TEIQue_SF_selfcontrol_22*), perceived bonding capacity (TEIQue_SF_emotionality_28*), and interpersonal effectiveness (e.g., TEIQue_SF_sociability_6, TEIQue_SF_sociability_11, TEIQue_SF_sociability_26*), alongside the well-being-related item reflecting optimism versus gloom (TEIQue_SF_wellbeing_12*). The prominence of bonding and social-related items is consistent with existing literature linking social connectedness to later-life well-being and health and showing that social isolation/loneliness are reliable risk factors for adverse outcomes [39,40]. Likewise, the importance of emotion-related self-perceptions aligns with work showing that emotional intelligence is positively associated with subjective well-being (including meta-analytic evidence) and may play a meaningful role in emotional functioning across adulthood [41]. Notably, several items in the bee swarm show substantial dispersion and bidirectional contributions across individuals, suggesting heterogeneity (and potentially interactions) rather than a single uniform “more EI is always better” pattern; in older adulthood, this is theoretically plausible given socioemotional selectivity perspectives emphasizing context-dependent prioritization of emotionally meaningful goals and regulation strategies [42]. In that light, the more counterintuitive directions observed for some “interpersonal influence” or “high competence” endorsements (e.g., perceived ability to influence others’ feelings) may be interpreted as reflecting, for some older adults, tendencies that coincide with greater emotional demands or emotion-management labor (e.g., in family roles or caregiving contexts), which has been linked to poorer psychological well-being [43,44]. Taken together, the model’s explanation profile supports a view of later-life well-being as especially sensitive to close relational connectedness and the costs/benefits of emotion regulation in real social roles, while also highlighting meaningful subgroup variability that merits follow-up with interaction- or stratified analyses [39,42].
Importantly, the SHAP bee swarm plot revealed substantial individual variability in how emotional intelligence items contributed to predicted well-being, with several features exerting both positive and negative influences depending on the participant. This pattern underscores the heterogeneity of pathways through which emotional, social, and motivational processes relate to well-being in later life. Rather than a single dominant predictor, well-being appears to emerge from the combined influence of multiple self-regulatory and affective processes, consistent with multidimensional models of psychological well-being [45]. Notably, part of this heterogeneity may reflect measurement-related factors that are particularly salient in older populations. Psychometric research has shown that reverse-scored items can exhibit reduced reliability and atypical response patterns among older adults, partly due to increased cognitive processing demands [46]. In addition, late-life depression, a prevalent and clinically significant condition, is associated with negative cognitive biases and altered self-evaluation, which may influence how older individuals interpret and respond to emotion-related self-report items [47]. Together, these findings suggest that some counterintuitive or bidirectional SHAP effects may reflect the interaction of emotional intelligence with mood-related and evaluative processes in later adulthood, rather than model instability or noise.
It is important to emphasize that SHAP values represent feature contributions within the predictive model and should not be interpreted as evidence of causal or directional relationships between emotional intelligence components and subsequent well-being outcomes.
From a clinical and applied perspective, the interpretability component of the proposed framework is particularly relevant. Unlike “black-box” predictive models, SHAP-based explanations provide feature-level contributions for each individual prediction, allowing practitioners to identify which emotional or social dimensions most strongly influence an individual’s predicted well-being trajectory. Such information may inform hypothesis generation, structured psychosocial discussions, and future research exploring personalized intervention strategies within community elderly care settings. Importantly, the model is not intended to replace clinical judgment but to function as a decision-support tool that enhances transparency and structured risk awareness.
Limitations and Future Directions
Despite the promising results, several considerations warrant attention. Although cross-validation provides an internal estimate of model performance, the reported differences between algorithms should be interpreted cautiously, as they may partly reflect sampling variability inherent in small datasets. First, the modest sample size (N = 67) limits statistical power and generalizability, and replication in larger and more diverse populations is required. In addition, the gender distribution was imbalanced (predominantly women), reflecting typical participation patterns in community elderly centers. Subgroup analyses by gender were not conducted due to the limited number of male participants (n = 16), as such analyses would likely produce statistically unstable and potentially overfitted models. Importantly, although nested cross-validation was employed to reduce overfitting and provide internal performance estimation, the models were not evaluated on an independent external dataset. Therefore, the predictive performance reported here should be interpreted as preliminary and specific to the current sample. External validation in independent cohorts is necessary before considering broader generalization or practical implementation. Furthermore, participants were recruited from two Open Care Centers for the Elderly (KAPI) in a single Greek city, which may reflect specific sociocultural, demographic, and community engagement characteristics. Cultural norms, social structures, and healthcare systems vary across regions, and such contextual factors may influence both emotional intelligence profiles and well-being trajectories. Future studies should therefore examine the replicability of these findings across different geographic and cultural settings. Third, emotional intelligence and well-being measures rely on self-report instruments; therefore, future work could benefit from integrating behavioral or physiological indicators to enhance prediction accuracy. Finally, while SHAP provides valuable interpretability, it does not establish causality, and thus these predictors should be viewed as informative correlates rather than definitive determinants. Consequently, the predictive performance values reported in this study should be interpreted as preliminary estimates derived from a relatively small exploratory dataset rather than definitive indicators of model generalizability.
Another methodological consideration relates to the dichotomization of well-being scores using a median split. Although this approach facilitates the development of classification models and ensures nearly balanced outcome classes in the present dataset, it may reduce variability and obscure more subtle gradations in well-being levels. Consequently, the predictive framework used here should be interpreted as an exploratory risk-classification approach rather than a comprehensive modeling of the full well-being continuum. Future studies with larger datasets could employ regression-based or ordinal prediction models to capture more nuanced variations in well-being outcomes. Such studies could also incorporate calibration analyses (e.g., calibration curves) to further assess probability calibration and the potential real-world applicability of predictive models.
Overall, the findings highlight the potential of explainable ML to advance early identification of well-being outcomes. By combining predictive modeling with transparent interpretability techniques, this study contributes to a growing body of work demonstrating how computational approaches can complement psychological assessment to support personalized and preventive interventions.
5. Conclusions
The results demonstrate the feasibility of using explainable ML models to predict well-being status at 5 months from baseline emotional intelligence indicators within the present sample. XGBoost provided the strongest overall performance, offering accurate and balanced classification across both well-being categories. The integration of SHAP interpretability further clarified the roles of key emotional intelligence components, illustrating how features related to self-control, emotionality, sociability, self-motivation, and well-being collectively influenced predictions. These findings underscore that well-being in the elderly is shaped by multiple interacting emotional and social factors and that machine learning methods, especially those capable of modeling complex interactions, can capture these relationships effectively. Importantly, the explainability framework used in this study enhances the transparency and practical utility of the model, enabling researchers and practitioners to understand why the model makes specific predictions. In summary, explainable ML represents a promising research direction for exploring early identification of individuals at risk of poorer well-being outcomes. However, the present findings should be interpreted as preliminary until replicated and externally validated in larger and independent samples. Future research should validate these models in larger samples, explore additional behavioral predictors, and examine how prediction outputs can be integrated into targeted, personalized support strategies.
Author Contributions
Conceptualization, E.K. and E.B.; methodology, E.K., E.B., M.M. and F.F.; validation, E.K., E.B., M.M. and F.F.; formal analysis, E.K., E.B. and F.F.; investigation, E.K., E.B. and M.M.; writing—original draft preparation, E.K.; writing—review and editing, E.K. and E.B.; supervision, E.K. and E.B. All authors have read and agreed to the published version of the manuscript.
Funding
This research received no external funding.
Institutional Review Board Statement
The study was conducted in accordance with the Declaration of Helsinki and approved by the Institutional Ethics Committee of Democritus University of Thrace, Department of Physical Education and Sport Science (approval number: 6118/29-28/09/2022).
Informed Consent Statement
Informed consent was obtained from all subjects involved in the study.
Data Availability Statement
The data used in this study contain sensitive personal information and cannot be publicly shared due to ethical and privacy restrictions approved by the institutional ethics committee. However, anonymized or aggregated data may be made available from the corresponding author upon reasonable request and subject to ethical approval. All preprocessing procedures, machine learning methods, and model evaluation steps are described in detail in the manuscript to ensure methodological transparency and reproducibility.
Acknowledgments
The authors would like to thank the staff and administrators of the two Open Care Centers for the Elderly for their collaboration, as well as all the older adults who participated in this study.
Conflicts of Interest
The authors declare no conflicts of interest.
References
- Koh, H.K.; Blakey, C.; Ochiai, E. Flourishing After a Pandemic: Healthy People 2030. J. Public Health Manag. Pract. 2021, 27, S215–S217. [Google Scholar] [CrossRef] [Scilit]
- Chida, Y.; Steptoe, A. Positive Psychological Well-Being and Mortality: A Quantitative Review of Prospective Observational Studies. Biopsychosoc. Sci. Med. 2008, 70, 741–756. [Google Scholar] [CrossRef] [Scilit] [PubMed]
- Pressman, S.D.; Jenkins, B.N.; Moskowitz, J.T. Positive Affect and Health: What Do We Know and Where Next Should We Go? Annu. Rev. Psychol. 2019, 70, 627–650. [Google Scholar] [CrossRef] [Scilit] [PubMed]
- Zaninotto, P.; Steptoe, A. Association Between Subjective Well-Being and Living Longer Without Disability or Illness. JAMA Netw. Open 2019, 2, e196870. [Google Scholar] [CrossRef] [Scilit]
- Cross, M.P.; Hofschneider, L.; Grimm, M.; Pressman, S.D. Subjective Well-Being and Physical Health. In Handbook of Well-Being; DEF Publishers: Salt Lake City, UT, USA, 2018. [Google Scholar]
- Kushlev, K.; Drummond, D.M.; Diener, E. Subjective Well-being and Health Behaviors in 2.5 Million Americans. Appl. Psychol. Health Well-Being 2020, 12, 166–187. [Google Scholar] [CrossRef] [Scilit]
- Ngamaba, K.H.; Panagioti, M.; Armitage, C.J. How Strongly Related Are Health Status and Subjective Well-Being? Systematic Review and Meta-Analysis. Eur. J. Public Health 2017, 27, 879–885. [Google Scholar] [CrossRef] [Scilit]
- National Research Council. Subjective Well-Being: Measuring Happiness, Suffering, and Other Dimensions of Experience; Stone, A.A., Mackie, C., Eds.; The National Academies Press: Wahington, DC, USA, 2013. [Google Scholar]
- OECD. OECD Guidelines on Measuring Subjective Well-Being; OECD Publishing: Paris, France, 2013. [Google Scholar]
- VanderWeele, T.J.; Trudel-Fitzgerald, C.; Allin, P.; Farrelly, C.; Fletcher, G.; Frederick, D.E.; Hall, J.; Helliwell, J.F.; Kim, E.S.; Lauinger, W.A. Current Recommendations on the Selection of Measures for Well-Being. Prev. Med. 2020, 133, 106004. [Google Scholar] [CrossRef] [Scilit] [PubMed]
- Feller, S.C.; Castillo, E.G.; Greenberg, J.M.; Abascal, P.; Van Horn, R.; Wells, K.B. Emotional Well-Being and Public Health: Proposal for a Model National Initiative. Public Health Rep. 2018, 133, 136–141. [Google Scholar] [CrossRef] [Scilit]
- Beatty, A.S.; Kaplan, R.M. Ontologies in the Behavioral Sciences: Accelerating Research and the Spread of Knowledge; The National Academies Press: Wahington, DC, USA, 2022. [Google Scholar]
- Goleman, D. Emotional Intelligence: Why It Can Matter More than IQ; Bantam Press: New York, NY, USA, 2005. [Google Scholar]
- Carstensen, L.L.; Pasupathi, M.; Mayr, U.; Nesselroade, J.R. Emotional Experience in Everyday Life across the Adult Life Span. J. Pers. Soc. Psychol. 2000, 79, 644–655. [Google Scholar] [CrossRef]
- Cabello, R.; Sorrel, M.A.; Fernández-Pinto, I.; Extremera, N.; Fernández-Berrocal, P. Age and Gender Differences in Ability Emotional Intelligence in Adults: A Cross-Sectional Study. Dev. Psychol. 2016, 52, 1486. [Google Scholar] [CrossRef] [Scilit]
- Prilleltensky, I. Promoting Well-Being: Time for a Paradigm Shift in Health and Human Services. Scand. J. Public Health 2005, 33, 53–60. [Google Scholar] [CrossRef] [Scilit]
- World Health Organization. Ottawa Charter for Health Promotion: First International Conference on Health Promotion; World Health Organization: Geneva, Switzerland, 1986. Available online: https://www.who.int/publications/i/item/ottawa-charter-for-health-promotion (accessed on 5 March 2026).
- Kickbusch, I. The Contribution of the World Health Organization to a New Public Health and Health Promotion. Am. J. Public Health 2003, 93, 383–388. [Google Scholar] [CrossRef] [Scilit]
- Razaghi, S.; Parsaei, S.; Saemi, E. The Mediating Role of Physical Activity in The Relationship of Emotional Intelligence with Psychological Well-Being in Elderly People. Yektaweb J. 2020, 14, 392–405. [Google Scholar]
- Meredith, S.J.; Cox, N.J.; Ibrahim, K.; Higson, J.; McNiff, J.; Mitchell, S.; Rutherford, M.; Wijayendran, A.; Shenkin, S.D.; Kilgour, A.H.M.; et al. Factors That Influence Older Adults’ Participation in Physical Activity: A Systematic Review of Qualitative Studies. Age Ageing 2023, 52, afad145. [Google Scholar] [CrossRef] [Scilit]
- Zhang, Y.; Zhou, M.; Yin, Z.; Zhuang, W.; Wang, Y. Relationship between Physical Activities and Mental Health in Older People: A Bibliometric Analysis. Front. Psychiatry 2024, 15, 1424745. [Google Scholar] [CrossRef] [Scilit]
- Gross, J.J.; John, O.P. Individual Differences in Two Emotion Regulation Processes: Implications for Affect, Relationships, and Well-Being. J. Pers. Soc. Psychol. 2003, 85, 348. [Google Scholar] [CrossRef] [Scilit]
- Urry, H.L.; Gross, J.J. Emotion Regulation in Older Age. Curr. Dir. Psychol. Sci. 2010, 19, 352–357. [Google Scholar] [CrossRef] [Scilit]
- Oparina, E.; Kaiser, C.; Gentile, N.; Tkatchenko, A.; Clark, A.E.; De Neve, J.-E.; D’Ambrosio, C. Machine Learning in the Prediction of Human Wellbeing. Sci. Rep. 2025, 15, 1632. [Google Scholar] [CrossRef] [Scilit] [PubMed]
- Vera Cruz, G.; Maurice, T.; Moore, P.J.; Rohrbeck, C.A. Using Artificial Intelligence to Identify the Top 50 Independent Predictors of Subjective Well-Being in a Multinational Sample of 37,991 Older European & Israeli Adults. Sci. Rep. 2023, 13, 11352. [Google Scholar] [CrossRef] [Scilit]
- Austin, R.R.; Jantraporn, R.; Michalowski, M.; Marquard, J. Machine Learning Methods to Discover Hidden Patterns in Well-Being and Resilience for Healthy Aging. J. Nurs. Scholarsh. 2025, 57, 72–81. [Google Scholar] [CrossRef] [Scilit] [PubMed]
- Nopour, R. Machine Learning Models in Enhancing Prediction of Health-Related Indices among Older Adults: A Scoping Review. Heliyon 2025, 11, e43510. [Google Scholar] [CrossRef] [Scilit]
- Markus, A.F.; Kors, J.A.; Rijnbeek, P.R. The Role of Explainability in Creating Trustworthy Artificial Intelligence for Health Care: A Comprehensive Survey of the Terminology, Design Choices, and Evaluation Strategies. J. Biomed. Inform. 2021, 113, 103655. [Google Scholar] [CrossRef] [Scilit] [PubMed]
- Tjoa, E.; Guan, C. A Survey on Explainable Artificial Intelligence (XAI): Toward Medical XAI. IEEE Trans. Neural Netw. Learn. Syst. 2021, 32, 4793–4813. [Google Scholar] [CrossRef] [Scilit] [PubMed]
- Sutton, R.T.; Pincock, D.; Baumgart, D.C.; Sadowski, D.C.; Fedorak, R.N.; Kroeker, K.I. An Overview of Clinical Decision Support Systems: Benefits, Risks, and Strategies for Success. NPJ Digit. Med. 2020, 3, 17. [Google Scholar] [CrossRef] [Scilit]
- Preti, L.M.; Ardito, V.; Compagni, A.; Petracca, F.; Cappellaro, G. Implementation of Machine Learning Applications in Health Care Organizations: Systematic Review of Empirical Studies. J. Med. Internet Res. 2024, 26, e55897. [Google Scholar] [CrossRef] [Scilit] [PubMed]
- Fang, Z.; Sim, N. Does Lifelong Learning Matter for the Subjective Wellbeing of the Elderly? A Machine Learning Analysis on Singapore Data. PLoS ONE 2024, 19, e0303478. [Google Scholar] [CrossRef] [Scilit]
- Retzepis, N.-O.; Avloniti, A.; Kokkotis, C.; Protopapa, M.; Stampoulis, T.; Gkachtsou, A.; Pantazis, D.; Balampanos, D.; Smilios, I.; Chatzinikolaou, A. Identifying Key Factors for Predicting the Age at Peak Height Velocity in Preadolescent Team Sports Athletes Using Explainable Machine Learning. Sports 2024, 12, 287. [Google Scholar] [CrossRef] [Scilit]
- Petrides, K.V.; Furnham, A. The Role of Trait Emotional Intelligence in a Gender-specific Model of Organizational Variables 1. J. Appl. Soc. Psychol. 2006, 36, 552–569. [Google Scholar] [CrossRef] [Scilit]
- Petrides, K.V.; Pita, R.; Kokkinaki, F. The Location of Trait Emotional Intelligence in Personality Factor Space. Br. J. Psychol. 2007, 98, 273–289. [Google Scholar] [CrossRef] [Scilit]
- Shacham, S. A Shortened Version of the Profile of Mood States. J. Pers. Assess. 1983, 47, 305–306. [Google Scholar] [CrossRef] [Scilit]
- Zervas, Y.; Ekkekakis, P.; Psychoudaki, M.; Kakkos, V. Adaptation of the Profile of Mood States (POMS) for the Greek Population; Unpublished Manuscript; Department of Physical Education and Sport Science, National and Kapodistrian University of Athens: Athens, Greece, 1993. [Google Scholar]
- Lundberg, S.M.; Lee, S.-I. A Unified Approach to Interpreting Model Predictions. In NIPS’17: Proceedings of the 31st International Conference on Neural Information Processing Systems; Curran Associates Inc.: New York, NY, USA, 2017; pp. 4768–4777. [Google Scholar]
- Donovan, N.J.; Blazer, D. Social Isolation and Loneliness in Older Adults: Review and Commentary of a National Academies Report. Am. J. Geriatr. Psychiatry 2020, 28, 1233–1244. [Google Scholar] [CrossRef] [Scilit]
- Holt-Lunstad, J.; Smith, T.B.; Baker, M.; Harris, T.; Stephenson, D. Loneliness and Social Isolation as Risk Factors for Mortality: A Meta-Analytic Review. Perspect. Psychol. Sci. 2015, 10, 227–237. [Google Scholar] [CrossRef] [Scilit]
- Chen, Y.; Peng, Y.; Fang, P. Emotional Intelligence Mediates the Relationship between Age and Subjective Well-Being. Int. J. Aging Hum. Dev. 2016, 83, 91–107. [Google Scholar] [CrossRef] [Scilit]
- Carstensen, L.L. Socioemotional Selectivity Theory: The Role of Perceived Endings in Human Motivation. Gerontologist 2021, 61, 1188–1196. [Google Scholar] [CrossRef] [Scilit] [PubMed]
- Zhong, S.; Chen, X.; Li, J. Emotional Labor of Caregivers of Elderly Patients with Dementia and Disabilities in a Psychiatric Hospital in China. Med. Sci. Monit. Int. Med. J. Exp. Clin. Res. 2024, 30, e945722. [Google Scholar] [CrossRef] [Scilit] [PubMed]
- Kim, H.-K.; Park, C.-H. Effects of General Characteristics, Emotional Labor, Empathy Ability, and Wisdom on the Psychological Well-Being of Female Caregivers Visiting the Homes of Vulnerable Care Recipients and the Elderly. Behav. Sci. 2023, 13, 360. [Google Scholar] [CrossRef] [Scilit]
- Ryff, C.D.; Singer, B.H. Know Thyself and Become What You Are: A Eudaimonic Approach to Psychological Well-Being. J. Happiness Stud. 2008, 9, 13–39. [Google Scholar] [CrossRef] [Scilit]
- Carlson, M.; Wilcox, R.; Chou, C.-P.; Chang, M.; Yang, F.; Blanchard, J.; Marterella, A.; Kuo, A.; Clark, F. Psychometric Properties of Reverse-Scored Items on the CES-D in a Sample of Ethnically Diverse Older Adults. Psychol. Assess. 2011, 23, 558. [Google Scholar] [CrossRef] [Scilit]
- Alexopoulos, G.S. Depression in the Elderly. Lancet 2005, 365, 1961–1970. [Google Scholar] [CrossRef] [Scilit]

Disclaimer/Publisher’s Note: The statements, opinions and data contained in all publications are solely those of the individual author(s) and contributor(s) and not of MDPI and/or the editor(s). MDPI and/or the editor(s) disclaim responsibility for any injury to people or property resulting from any ideas, methods, instructions or products referred to in the content. |
© 2026 by the authors. Licensee MDPI, Basel, Switzerland. This article is an open access article distributed under the terms and conditions of the Creative Commons Attribution (CC BY) license.