


Abstract
Distracted driving is one of the primary causes of road traffic accidents. Behavior recognition technology based on machine vision has emerged as a research hotspot due to its non-contact and high-efficiency nature. To address the challenges of complex lighting conditions in the driver’s cabin, low detection accuracy for small-scale keypoints, and the difficulty in effectively characterizing behavioral features, this paper proposes a distracted driving behavior recognition method based on an improved YOLOv8n-Pose model and multi-feature fusion. First, the original YOLOv8n-Pose model is optimized. A P2 detection layer is added to enhance the feature extraction capabilities for small-scale human keypoints, and the SE attention module is incorporated to improve the model’s robustness under complex lighting conditions. In addition, the loss function is replaced with focal loss to tackle the class imbalance problem, thus forming the YOLOv8n-PSF-Pose keypoint detection network. Subsequently, based on the coordinates of 12 human keypoints extracted by this network, a multi-dimensional feature vector is constructed, which takes joint angles as the core and integrates the relative distances between keypoints and the number of valid keypoints. Finally, a BP neural network is adopted to classify the constructed feature vectors, enabling the accurate recognition of six typical distracted driving behaviors (normal driving, drinking or eating, making phone calls, using mobile phones, operating vehicle infotainment systems, and turning around to fetch items). The experimental results show that the improved YOLOv8n-PSF-Pose model achieves an mAP50 of 93.8% in keypoint detection, which is 6.7 percentage points higher than the original model; the BP classification model based on multi-feature fusion achieves an F1-score of 97.7% in the behavior recognition task, which is significantly better than traditional classifiers such as SVM and random forest, and the image processing speed on the NVIDIA RTX 3090TI reaches a high throughput of 45 FPS. This proves that the proposed method achieves an excellent balance between accuracy and speed. This study provides an effective solution for the real-time and accurate recognition of distracted driving behaviors.
1. Introduction
In recent years, distracted driving behavior recognition, as a key research direction in the field of intelligent traffic safety, has received extensive attention. According to a World Health Organization (WHO) report, more than 30% of traffic accidents are related to human driver errors, among which distracted driving is one of the main causes [1,2]. Especially in commercial vehicles, drivers are exposed to monotonous driving environments for long periods and are highly prone to distracted behaviors, such as making phone calls, operating on-board equipment, and eating and drinking, which significantly increase accident risks [3,4]. Therefore, the construction of a real-time and robust distracted driving behavior recognition system is of great significance for improving the level of active road traffic safety.
In terms of technical approaches for behavior recognition, computer vision-based methods have become the mainstream of research due to their advantages of non-contact measurement and low deployment costs. Existing methods can be roughly divided into two categories: holistic image-based methods and human pose-based methods. The former usually directly use convolutional neural networks (CNNs) for the end-to-end classification of driver images. For example, the CNN model proposed by P. Li et al. [5,6] has achieved high recognition accuracy on public datasets. However, such methods are sensitive to illumination changes, background interference, and individual differences, with weak generalization abilities, making them difficult to adapt to the complexity of real driving scenarios.
In contrast, human pose-based behavior recognition methods extract the skeletal keypoints of drivers to construct behavior representations with semantic information, showing stronger robustness and interpretability. For instance, Shahverdy, M et al. [7] proposed a driver pose extraction framework based on OpenPose, combined with an SVM classifier to recognize various distracted behaviors. S. R. Kothuri et al. [8] further introduced a temporal modeling mechanism and used LSTM to dynamically model pose sequences, significantly improving the behavior recognition accuracy. The core goals of such methods are to characterize behavioral features through joint motion patterns, reduce the dependence on appearance changes, and thus enhance the adaptability of models in complex environments.
However, in the specific application scenario of the cockpit, pose-based methods still face three major challenges. The first is the limited accuracy of keypoint detection. Vehicle-mounted cameras are usually installed on the center console, with a fixed view and long distance from the driver, resulting in low pixel proportions for small-scale keypoints such as hands and elbows, which are prone to missed detection or positioning deviations [9,10,11]. The second is complex environmental interference. Dramatic changes in lighting conditions inside the cockpit (e.g., entering and exiting tunnels, night driving), coupled with occlusion from the steering wheel, seats, and other objects, significantly increase the difficulty of keypoint detection and behavior feature extraction [12,13,14]. The third is the high ambiguity of behavior representation. Some distracted behaviors are highly similar in posture (e.g., drinking water and operating a mobile phone), and traditional features based on joint coordinates or angles are difficult to distinguish effectively, necessitating the construction of more discriminative behavior representations [15].
To address the above problems, researchers have conducted extensive explorations in both pose estimation and behavior recognition. In pose estimation, HRNet [16,17,18] achieves fine keypoint localization while maintaining high-resolution feature maps through a parallel multi-resolution subnetwork structure, achieving leading performance on public datasets such as COCO. Nevertheless, its large number of parameters and high computational complexity make it difficult to deploy on resource-constrained vehicle-mounted terminals. To this end, the YOLO-Pose series methods [19,20,21] offer a one-stage joint detection and pose estimation framework, which significantly improves the inference speed while ensuring accuracy, providing possibilities for real-time applications.
In behavior recognition, early studies mostly adopted traditional machine learning methods such as support vector machine (SVM) [22,23] and random forest (RF) [24,25], which rely on manually designed features and struggle to capture temporal dynamic information in pose sequences. In recent years, deep learning models, especially LSTM [26,27,28] and its variants, have been widely used in behavior recognition tasks due to their advantages in sequence modeling. For example, Wang et al. [29] proposed a driver behavior recognition model based on double-layer LSTM, which effectively captures long-term dependencies in pose sequences and improves the classification performance. Bidirectional recurrent neural networks significantly enhance the contextual understanding of action sequences by modeling both forward and backward temporal dependencies. The BiLSTM architecture proposed by Schuster and Paliwal [30,31] has shown excellent modeling performance for bidirectional causal actions (e.g., looking back, sideways operations) in driver behavior recognition, and its bidirectional encoding mechanism can fully utilize future pose information to assist current state discrimination. The GRU, proposed by Cho et al. [32], simplifies the gating structure of LSTM by merging the cell state and hidden state using reset and update gates. It reduces the computational complexity by approximately 25% while maintaining similar recognition accuracy [33], making it more suitable for vehicle-mounted edge computing scenarios. BiGRU further combines the efficiency advantages of the bidirectional structure and gated recurrent units, achieving a better balance between accuracy and efficiency in driving posture classification tasks.
In recent years, the Transformer architecture, proposed by Vaswani et al. [34], with its self-attention mechanism, has overcome the temporal dependence limitation of recurrent networks and can directly model long-range dependencies between arbitrary positions in a sequence. In the field of driver behavior recognition, the Transformer has shown potential in processing long-term driving behavior segments (e.g., continuous distracted operations), and its parallel computing characteristic also significantly improves the model training efficiency.
Although existing studies have made remarkable progress, they still have the following shortcomings when applied to real driving scenarios: (1) a contradiction between high model complexity and real-time requirements—high-precision models often incur a large computational overhead, making it difficult to meet the real-time inference requirements of vehicle-mounted embedded systems; (2) insufficient robustness to small-scale keypoints—under long-distance and low-resolution imaging conditions, key areas such as hands are prone to missed or false detection; (3) limited ability for behavior feature representation—relying solely on joint coordinates or angle information makes it challenging to effectively distinguish different distracted behaviors with similar postures.
Therefore, how to improve the model’s detection ability for small-scale keypoints in driving scenarios without significantly increasing the computational burden, as well as constructing highly discriminative behavior feature representations for end-to-end integration, remains a key problem to be solved in current research.
In recent years, architectures based on Vision Transformer (ViT) have opened up a new technical path for human pose estimation. By dividing images into patch sequences and modeling them using a global self-attention mechanism, ViT and its variants dedicated to pose estimation (such as TokenPose and TransPose) can effectively capture the complex long-range dependencies between keypoints. Such methods have demonstrated excellent localization accuracy on standard benchmark datasets (e.g., COCO) and exhibit strong robustness, especially for severely occluded or unconventional body poses. However, their advantages are accompanied by significant efficiency costs: their computational complexity is proportional to the square of the input sequence length, resulting in a large number of model parameters, high memory usage, and significant inference latency. For example, the number of parameters of a typical ViT-based pose model often exceeds 50 M, and it is difficult to achieve real-time frame rates (≥30 FPS) even on high-end GPUs, making it difficult to directly deploy them on on-board embedded platforms with extremely stringent requirements for computing resources, power consumption, and real-time performance.
The main contributions of this paper are as follows:
- (1)
- An improved YOLOv8n-PSF-Pose keypoint detection model is proposed, which enhances the feature extraction ability for small-scale keypoints by adding a P2 detection layer, introduces the SE attention module to improve the model’s robustness under complex illumination, and replaces the loss function with focal loss to handle class imbalance.
- (2)
- A multi-dimensional feature vector fusing joint angles, relative distances between keypoints, and the number of valid keypoints is constructed to represent distracted driving behaviors more comprehensively and with higher discriminability.
- (3)
- A BP neural network is used to classify the constructed feature vectors, effectively learning different behavior patterns, and the superiority of the proposed method over traditional classifiers is verified on a self-built dataset.
The following sections elaborate on data preprocessing, model improvement, and feature construction and present the experimental analysis and result discussion.
2. Data Preprocessing and Construction
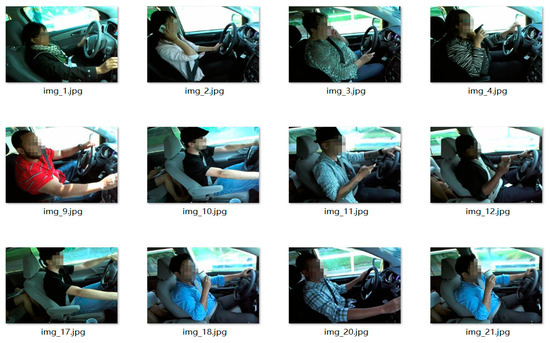
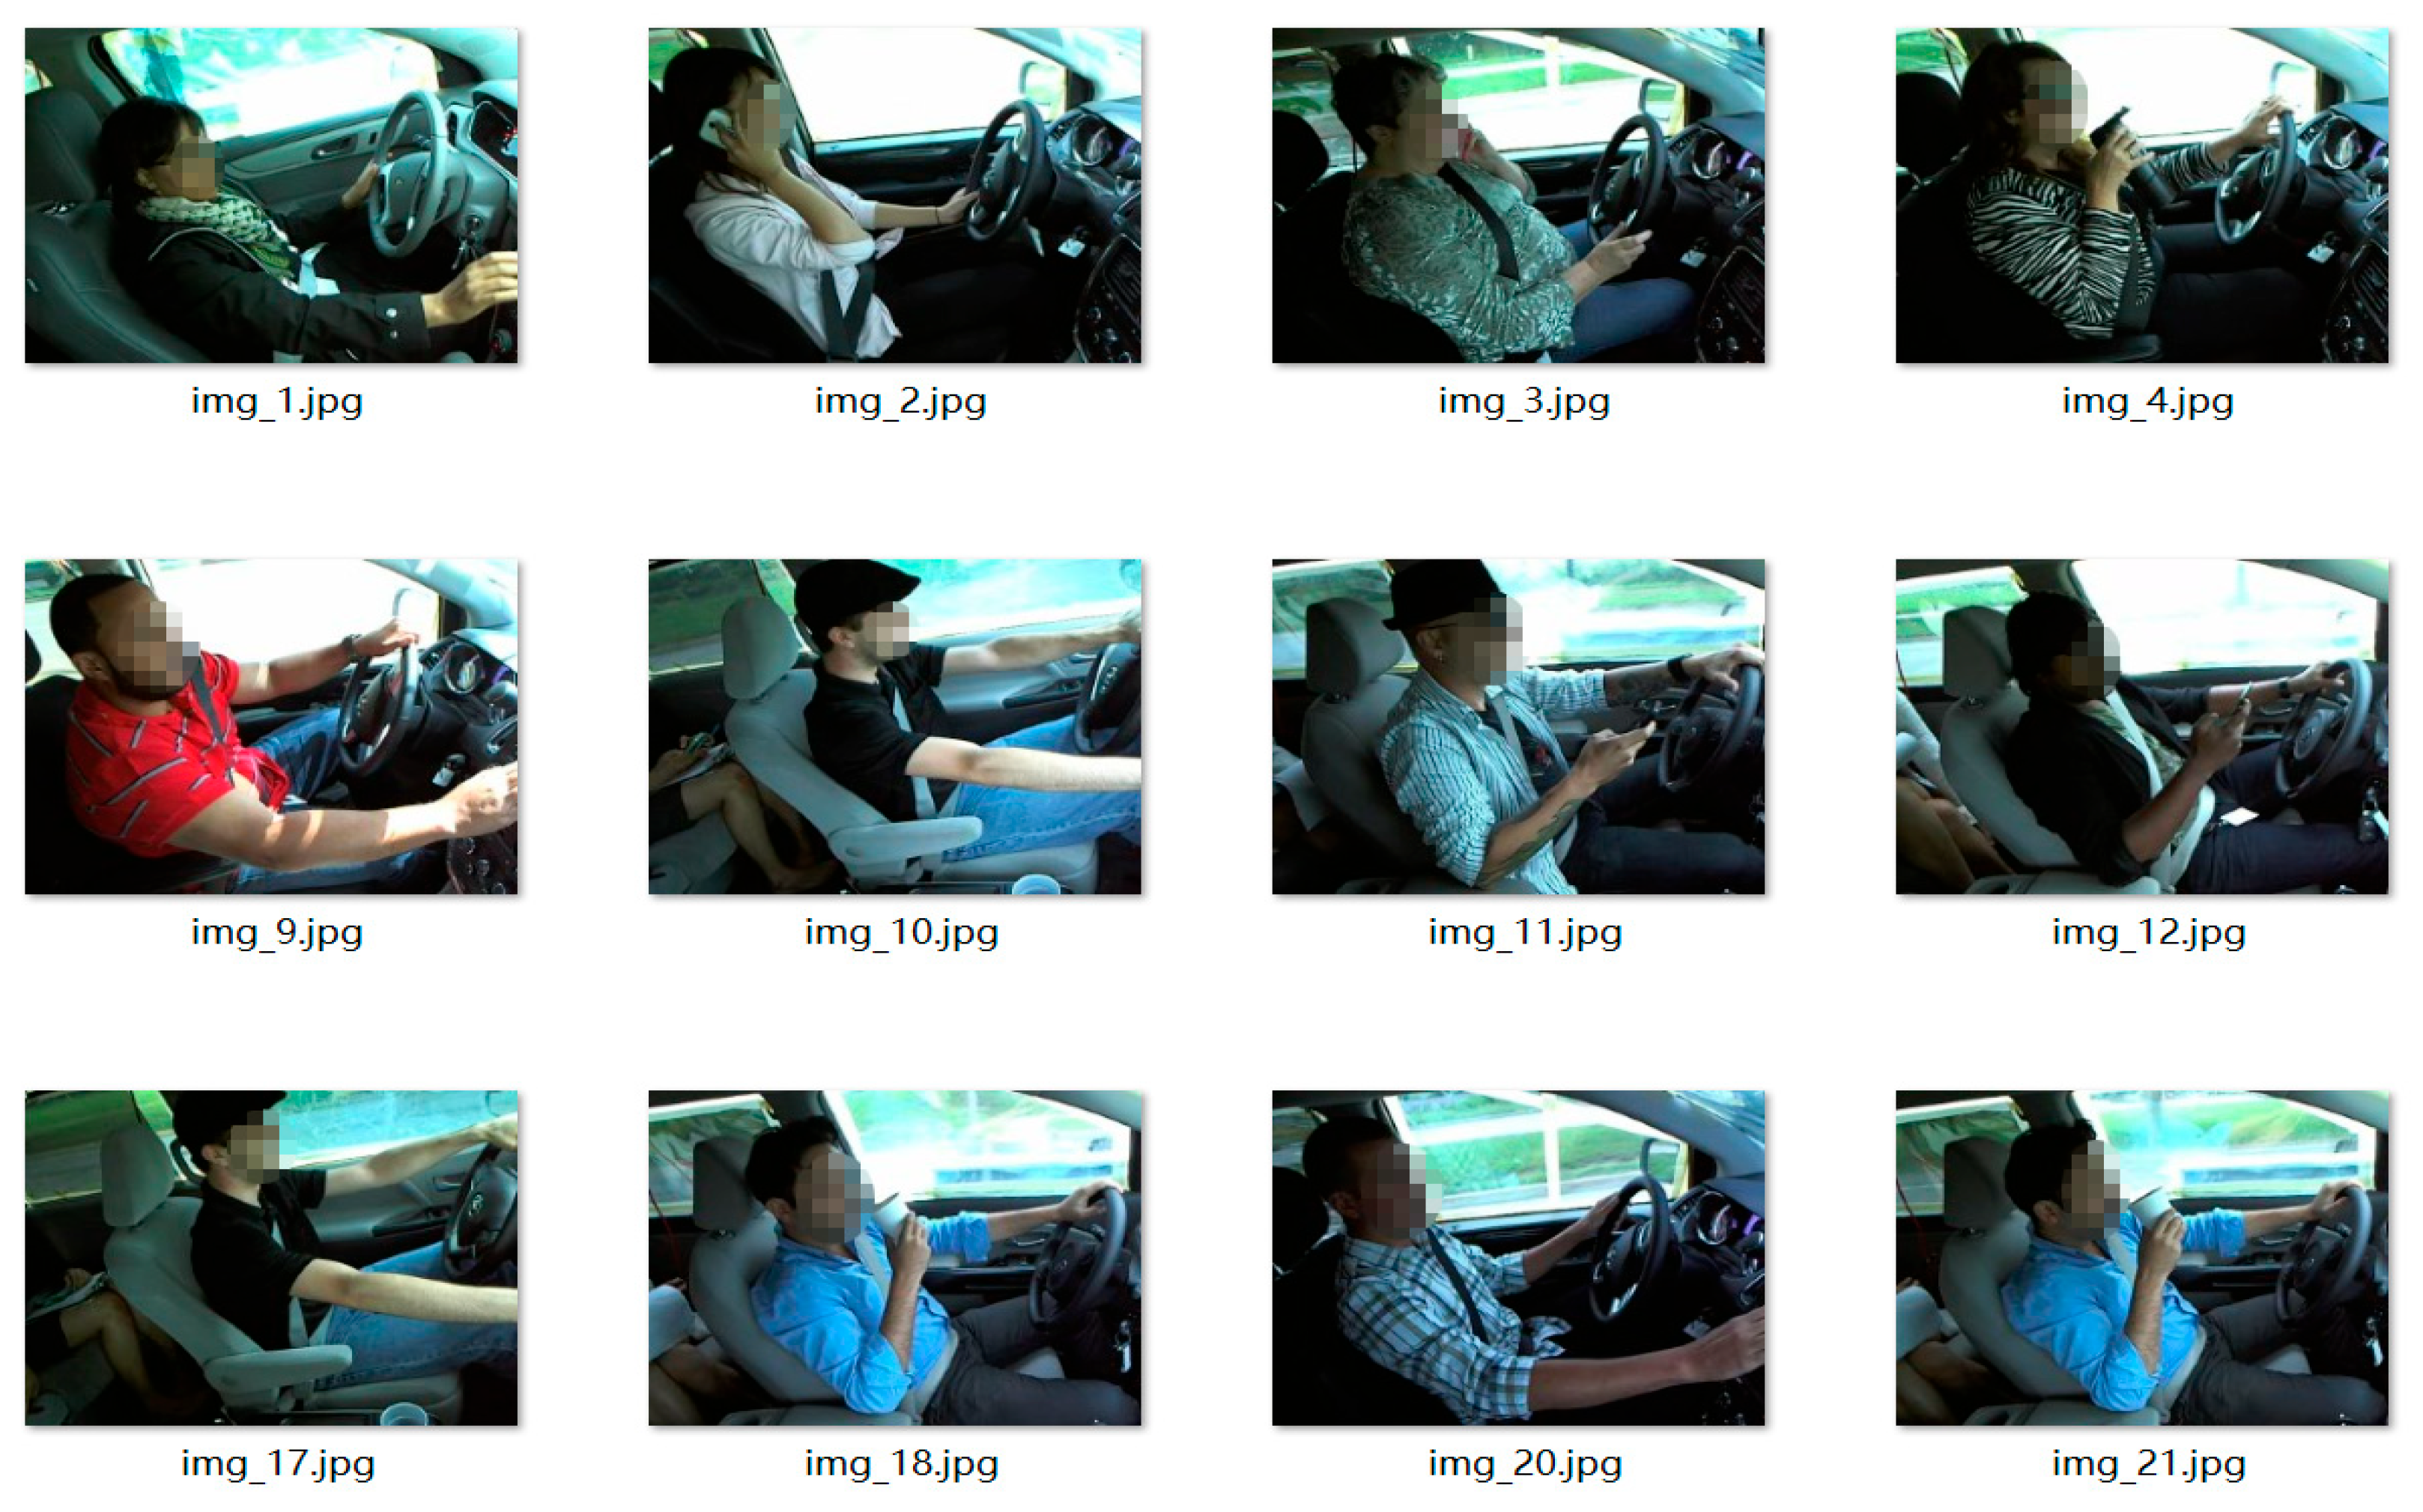
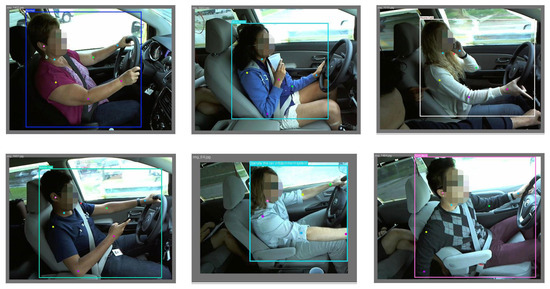
The data used in this paper are derived from the State Farm Distracted Driver Detection dataset, which was obtained from an image classification competition held on Kaggle several years ago. This dataset mainly consists of images and video data collected for several types of driver distraction behaviors during driving, as shown in Figure 1.
Figure 1.
Dataset examples.
2.1. Image Data Augmentation
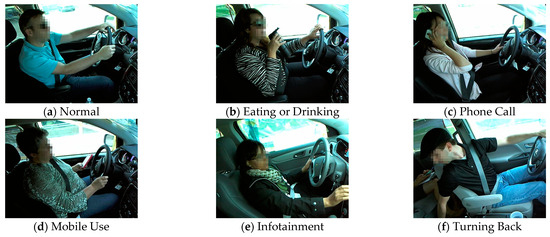
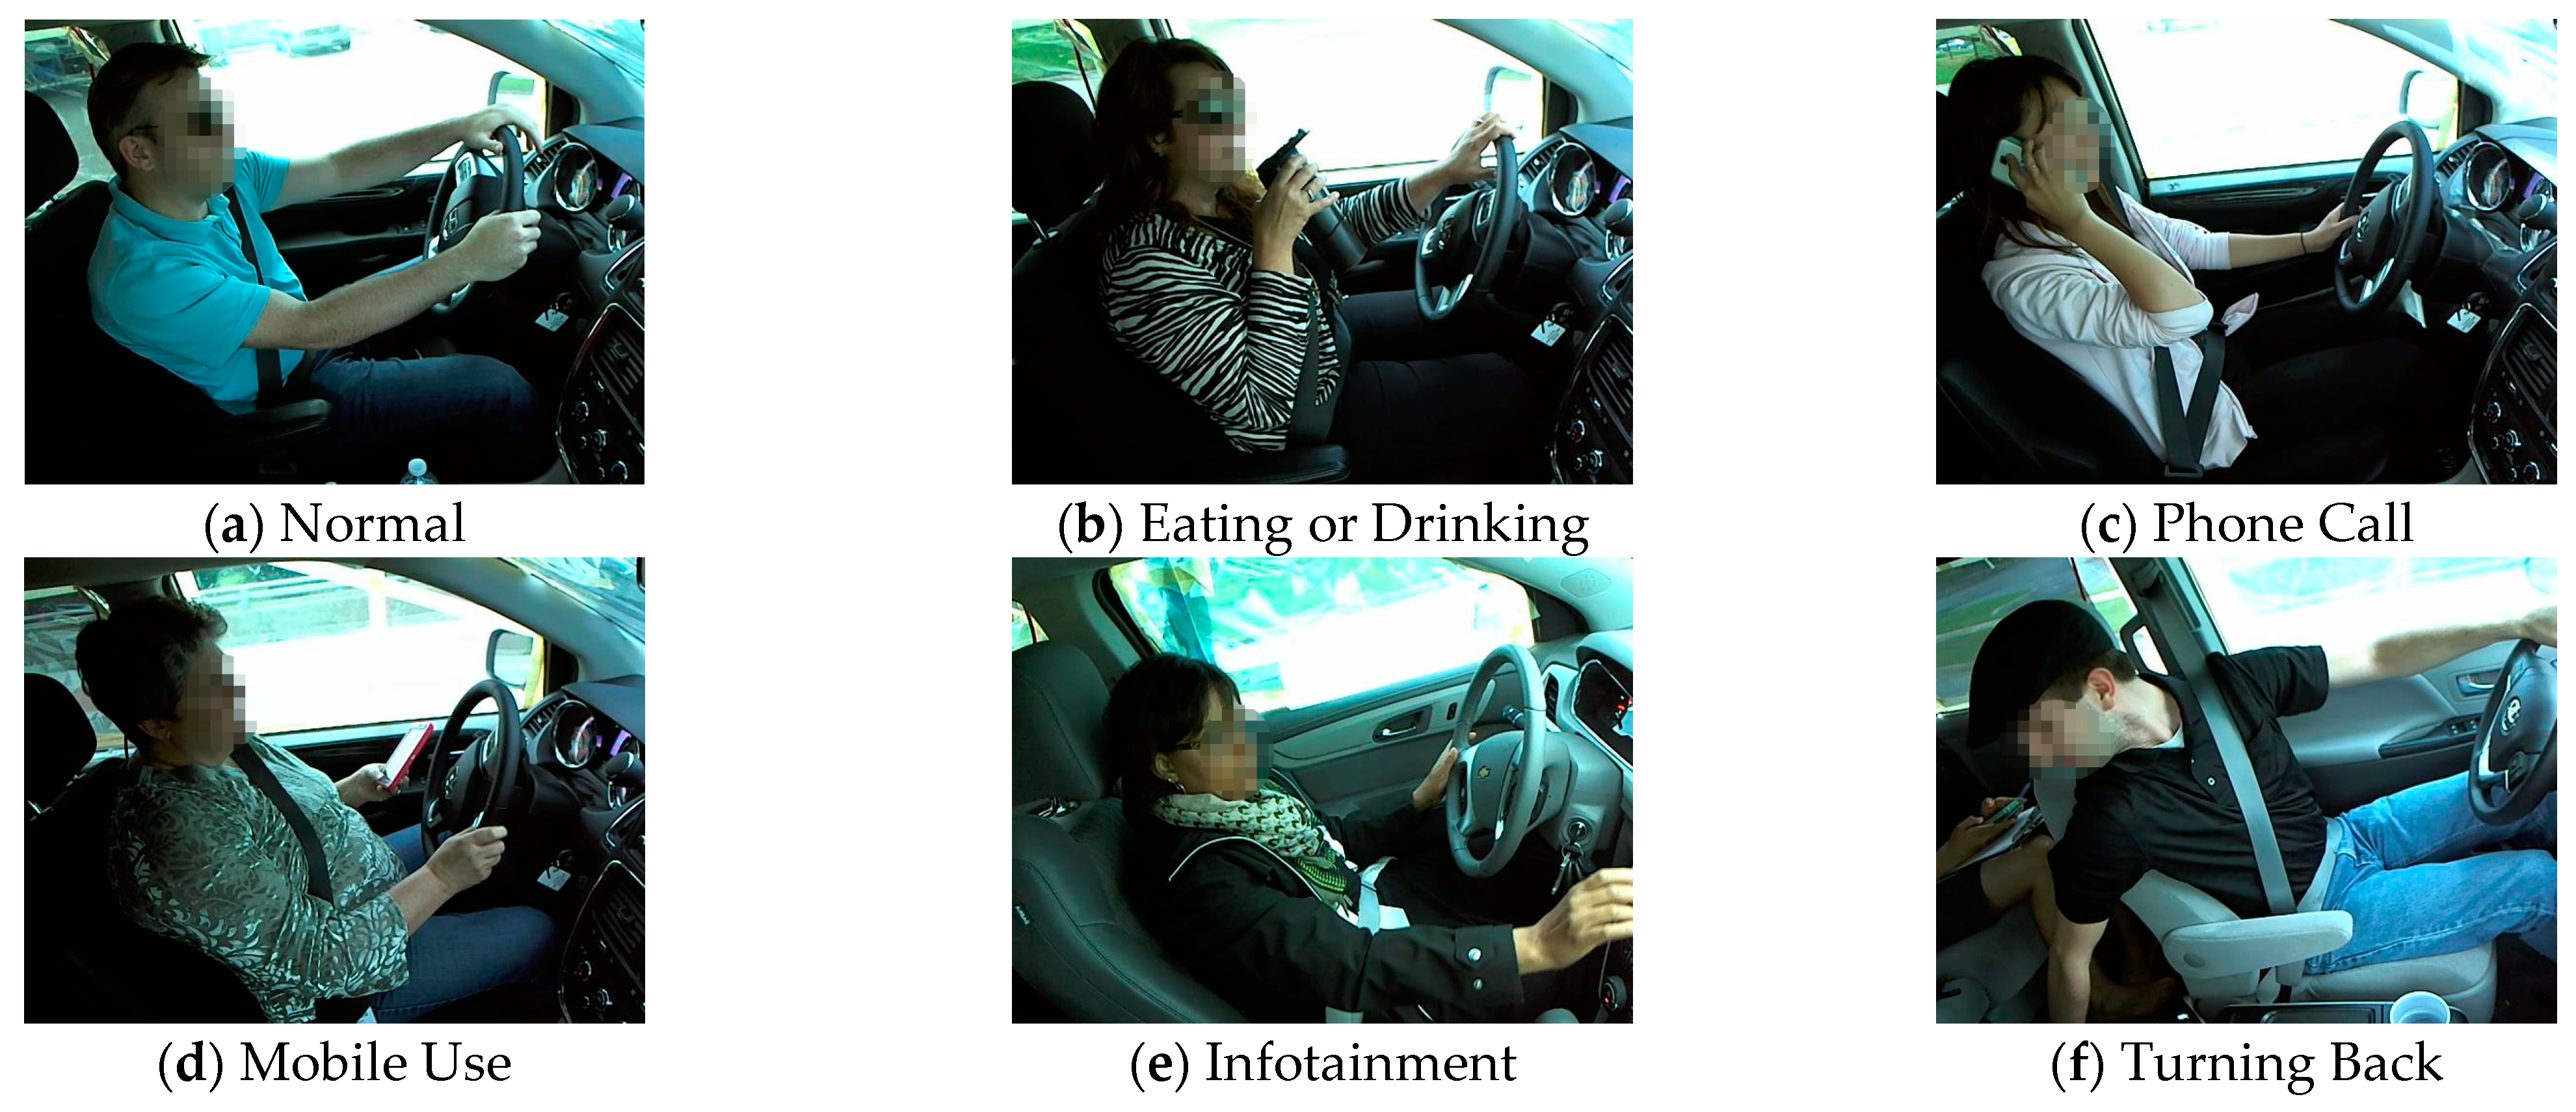
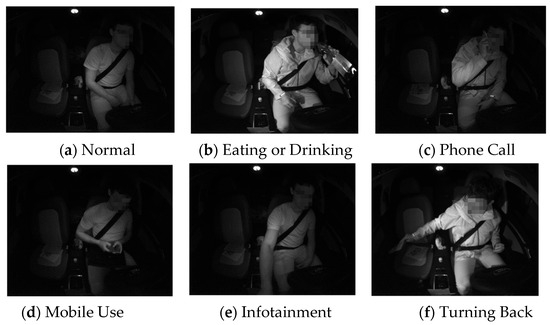
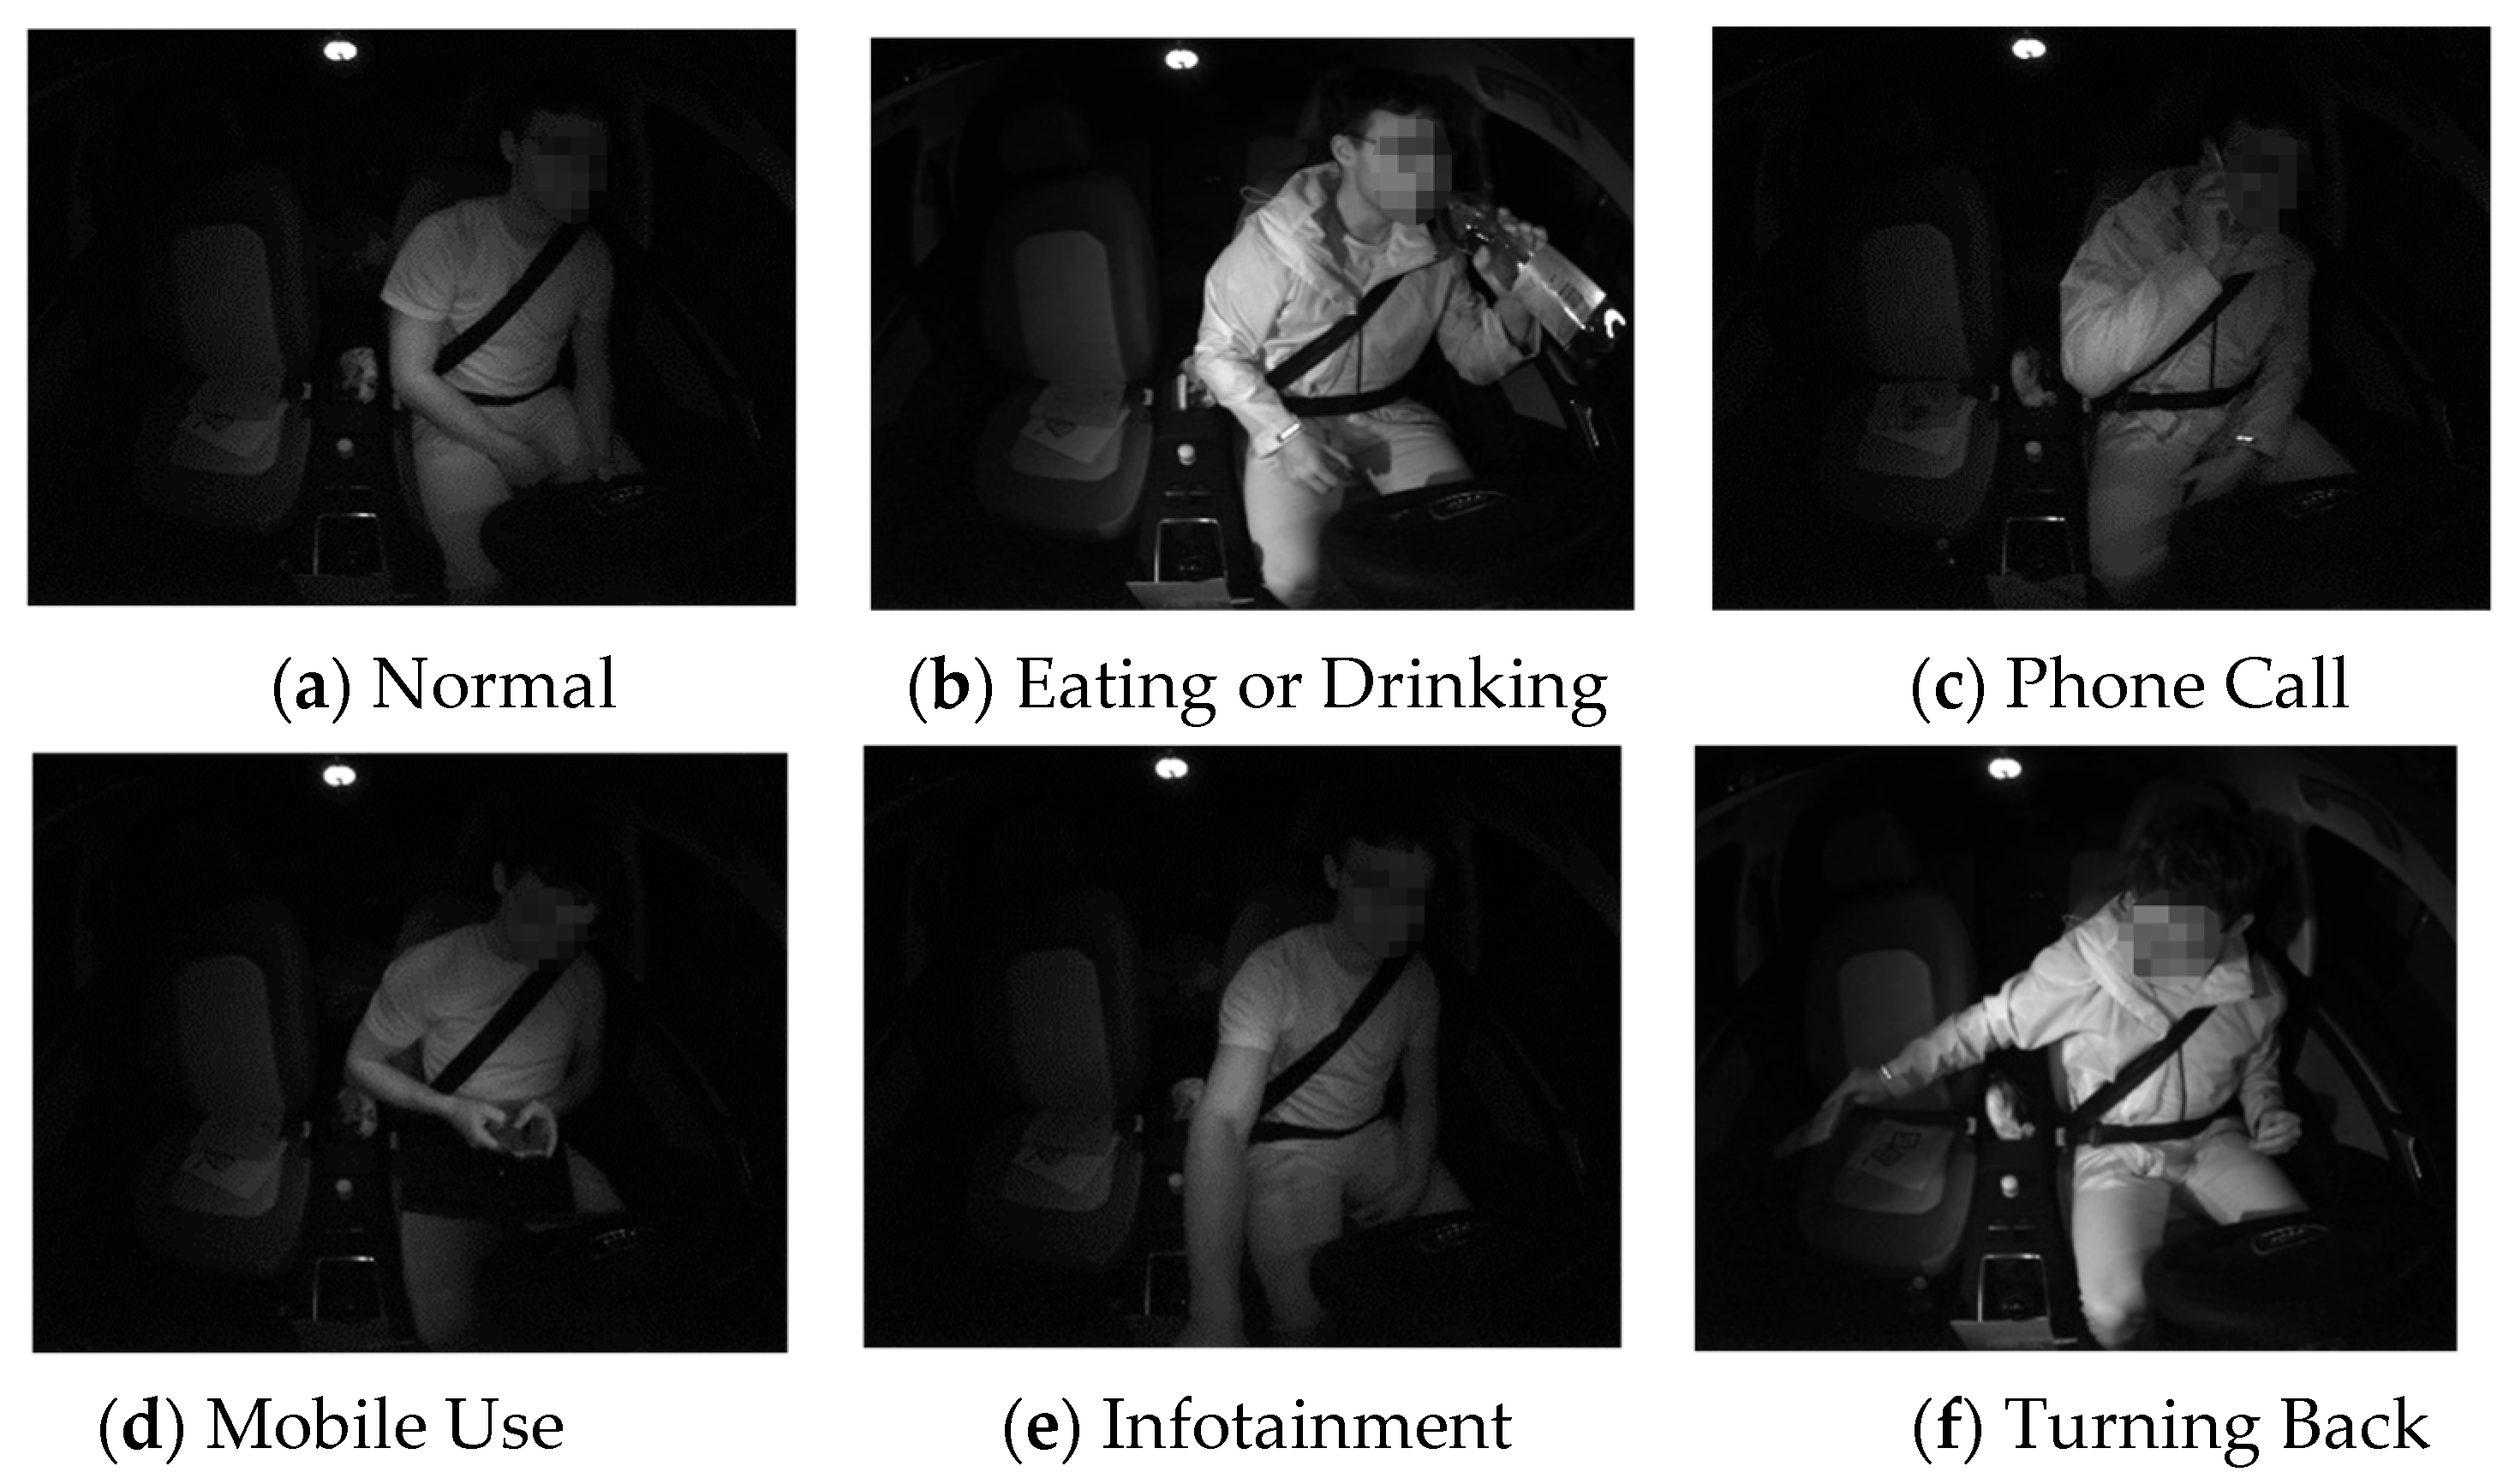
Six types of behavior data are adopted in this experimental dataset, namely normal driving, drinking and eating, making phone calls, using mobile phones, operating vehicle-mounted equipment, and turning around to take objects.
Illustrations of these distracted driving types are shown in Figure 2.
Figure 2.
Illustrations of different distracted behaviors.
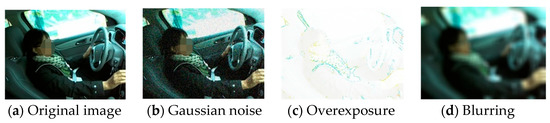
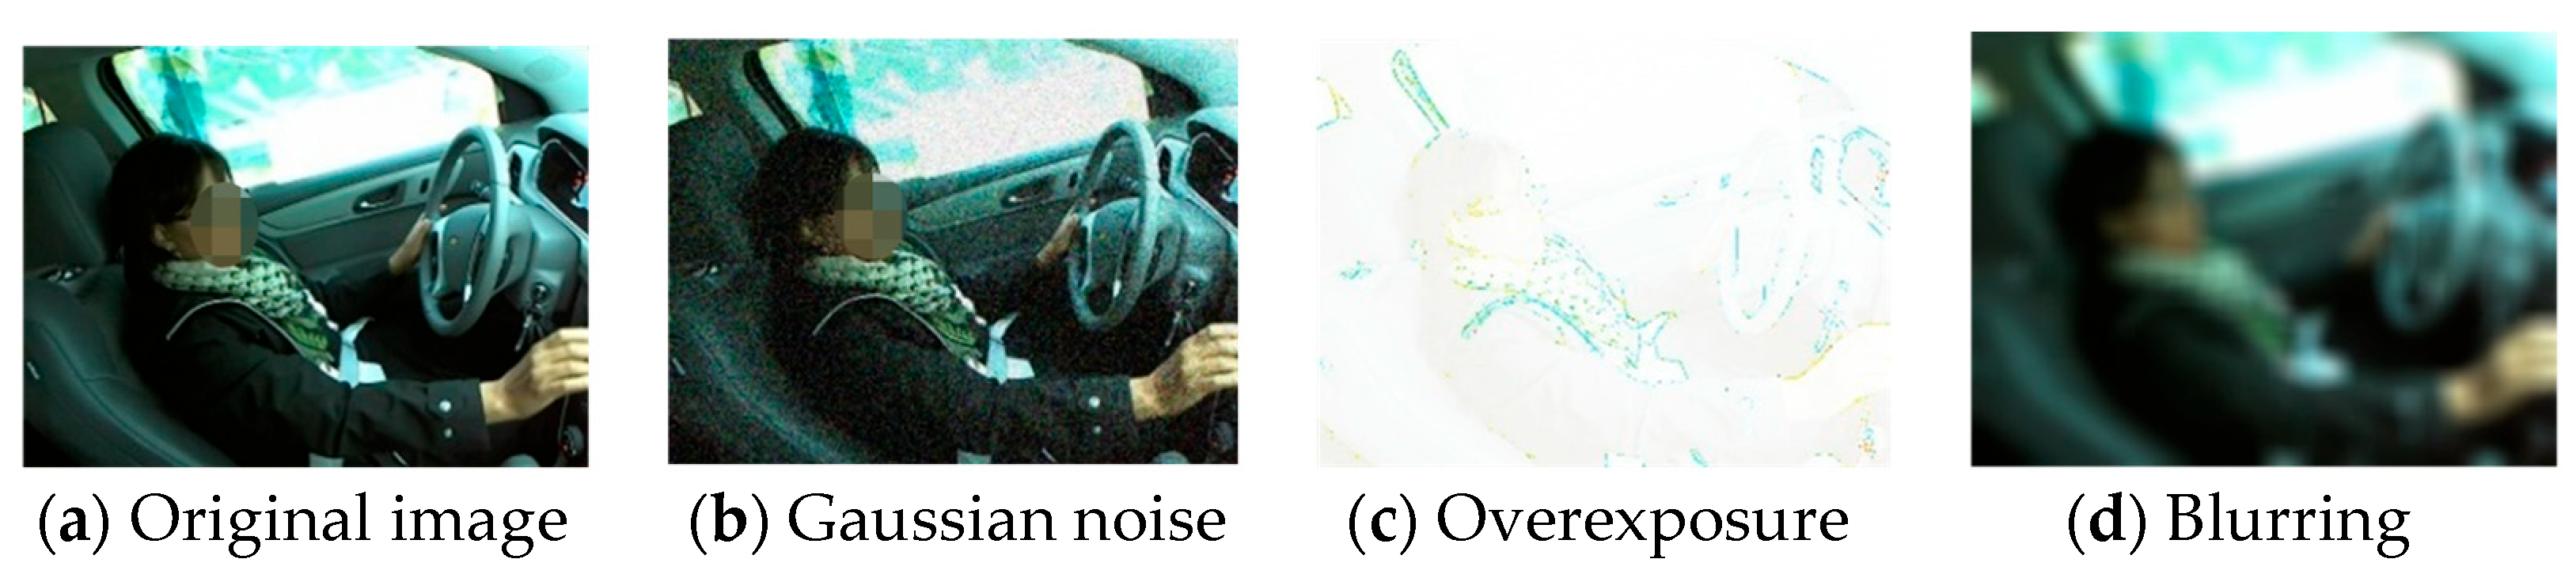
To improve the generalization ability of the model and enrich the dataset, data augmentation techniques including Gaussian noise addition, overexposure, and blurring are applied to the images to increase their diversity.
Examples of image augmentation are shown in Figure 3.
Figure 3.
Examples of image augmentation.
Subsequently, in the preprocessing stage of the algorithm, image filtering, algorithm-based enhancement, and screening for images with high similarity were carried out. Representative images with significant behavioral characteristics, covering different individuals and various illumination conditions, were preferentially retained to ensure the quality and representativeness of the data.
(1) Image filtering optimization
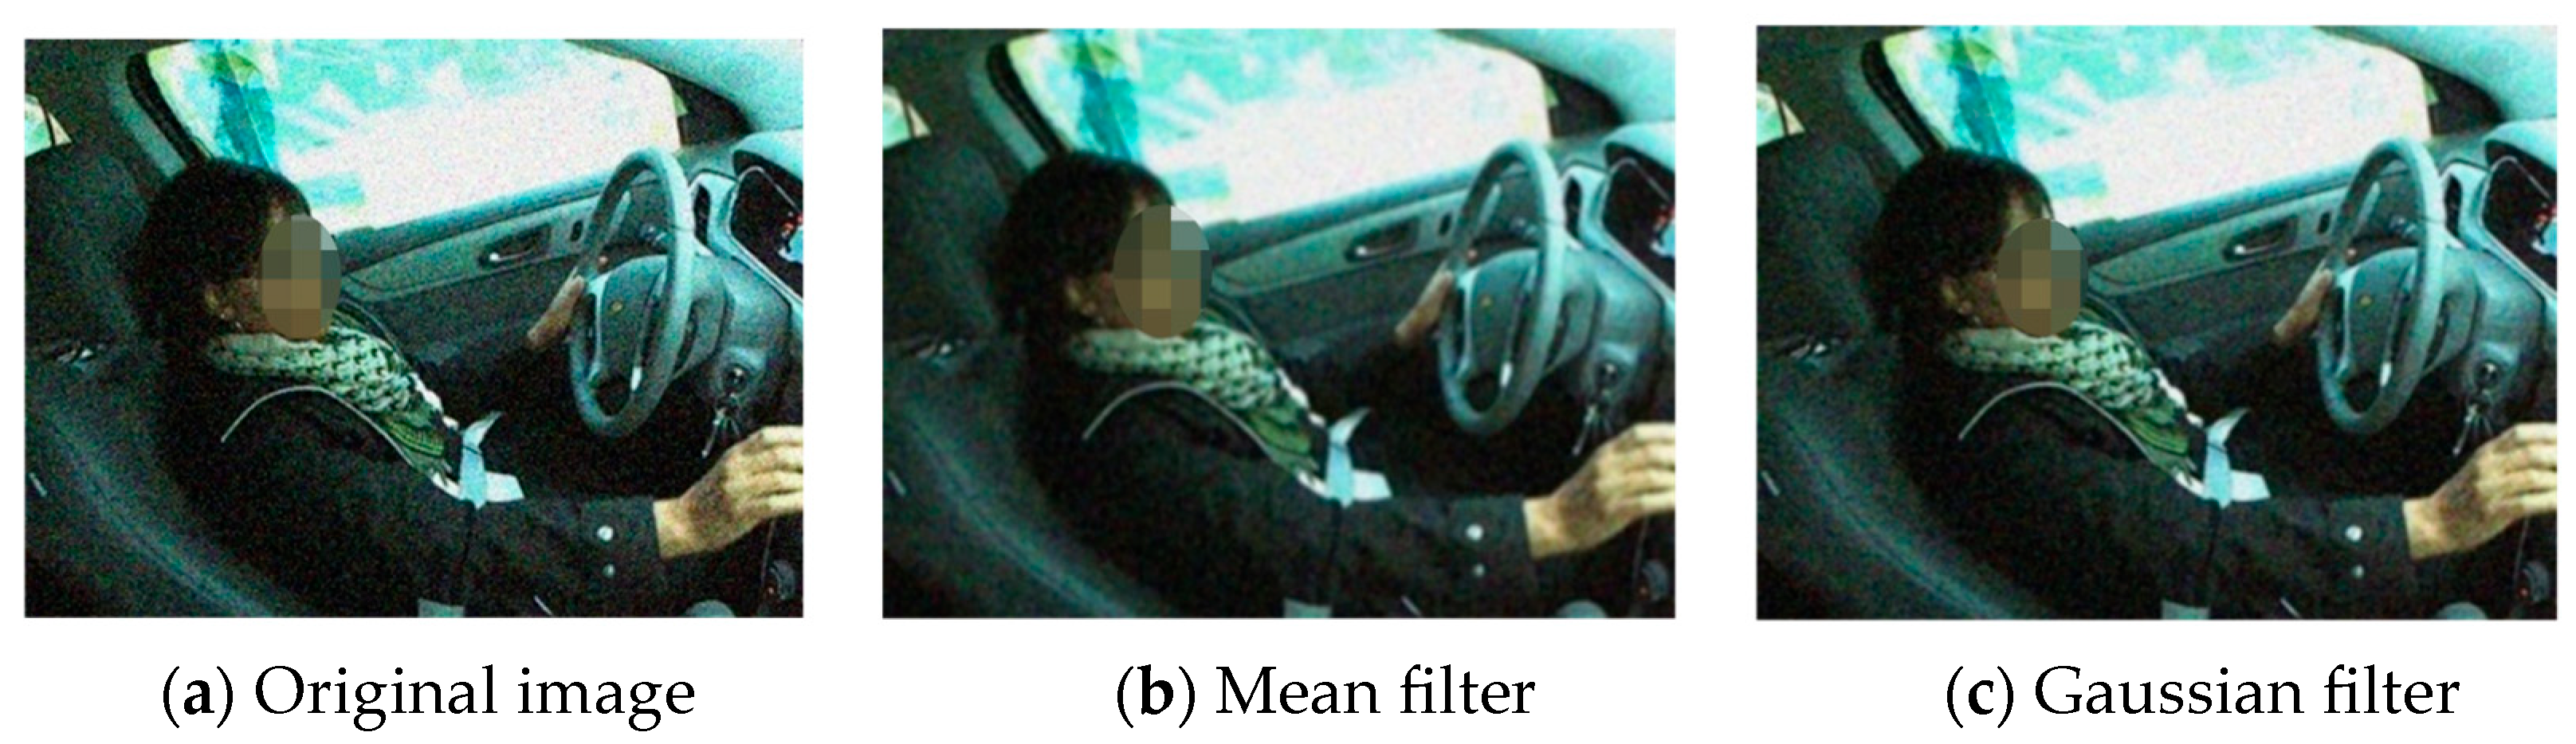
The core purpose of image filtering is to remove random noise (such as Gaussian noise and salt-and-pepper noise) introduced during image acquisition and transmission, improve the image clarity, and prevent subsequent algorithms (e.g., edge detection, segmentation) from being disturbed by noise. It can also preserve and enhance edges without causing edge blurring, making it suitable for high-precision scenarios such as face recognition and medical image analysis.
The denoising effects using the two filtering methods are compared with the original image, as shown in Figure 4.
Figure 4.
Comparison of image filtering and denoising effects.
(2) Optimization with Contrast-Limited Adaptive Histogram Equalization (CLAHE)
CLAHE is not a filter designed for “a specific type of noise” but a contrast enhancement technique. It is mainly used to improve the local image contrast, especially in scenes with uneven illumination, low contrast, or suppressed/overexposed details.
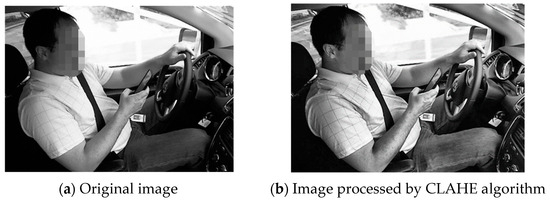
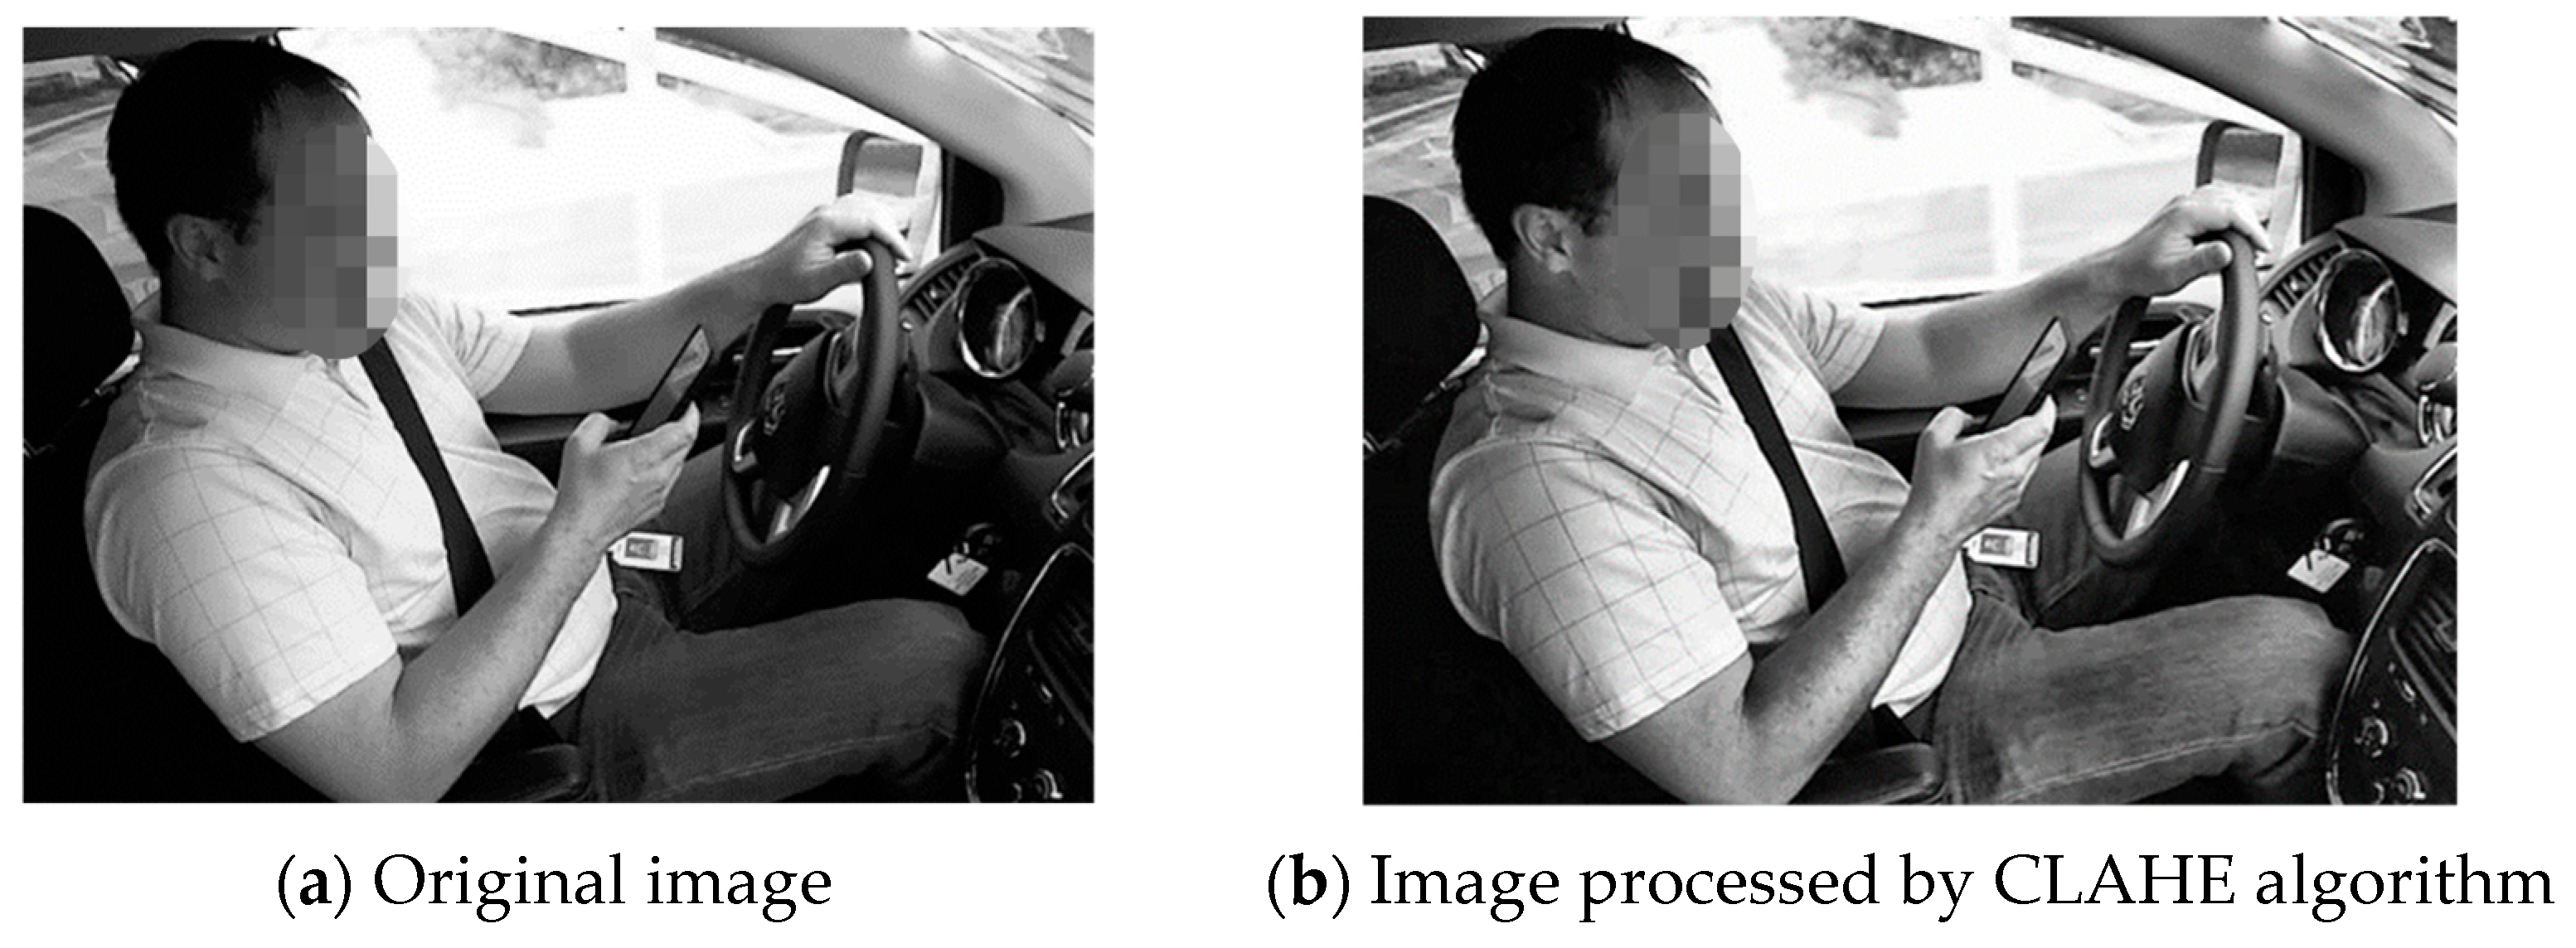
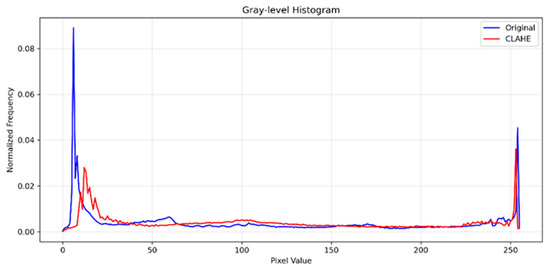
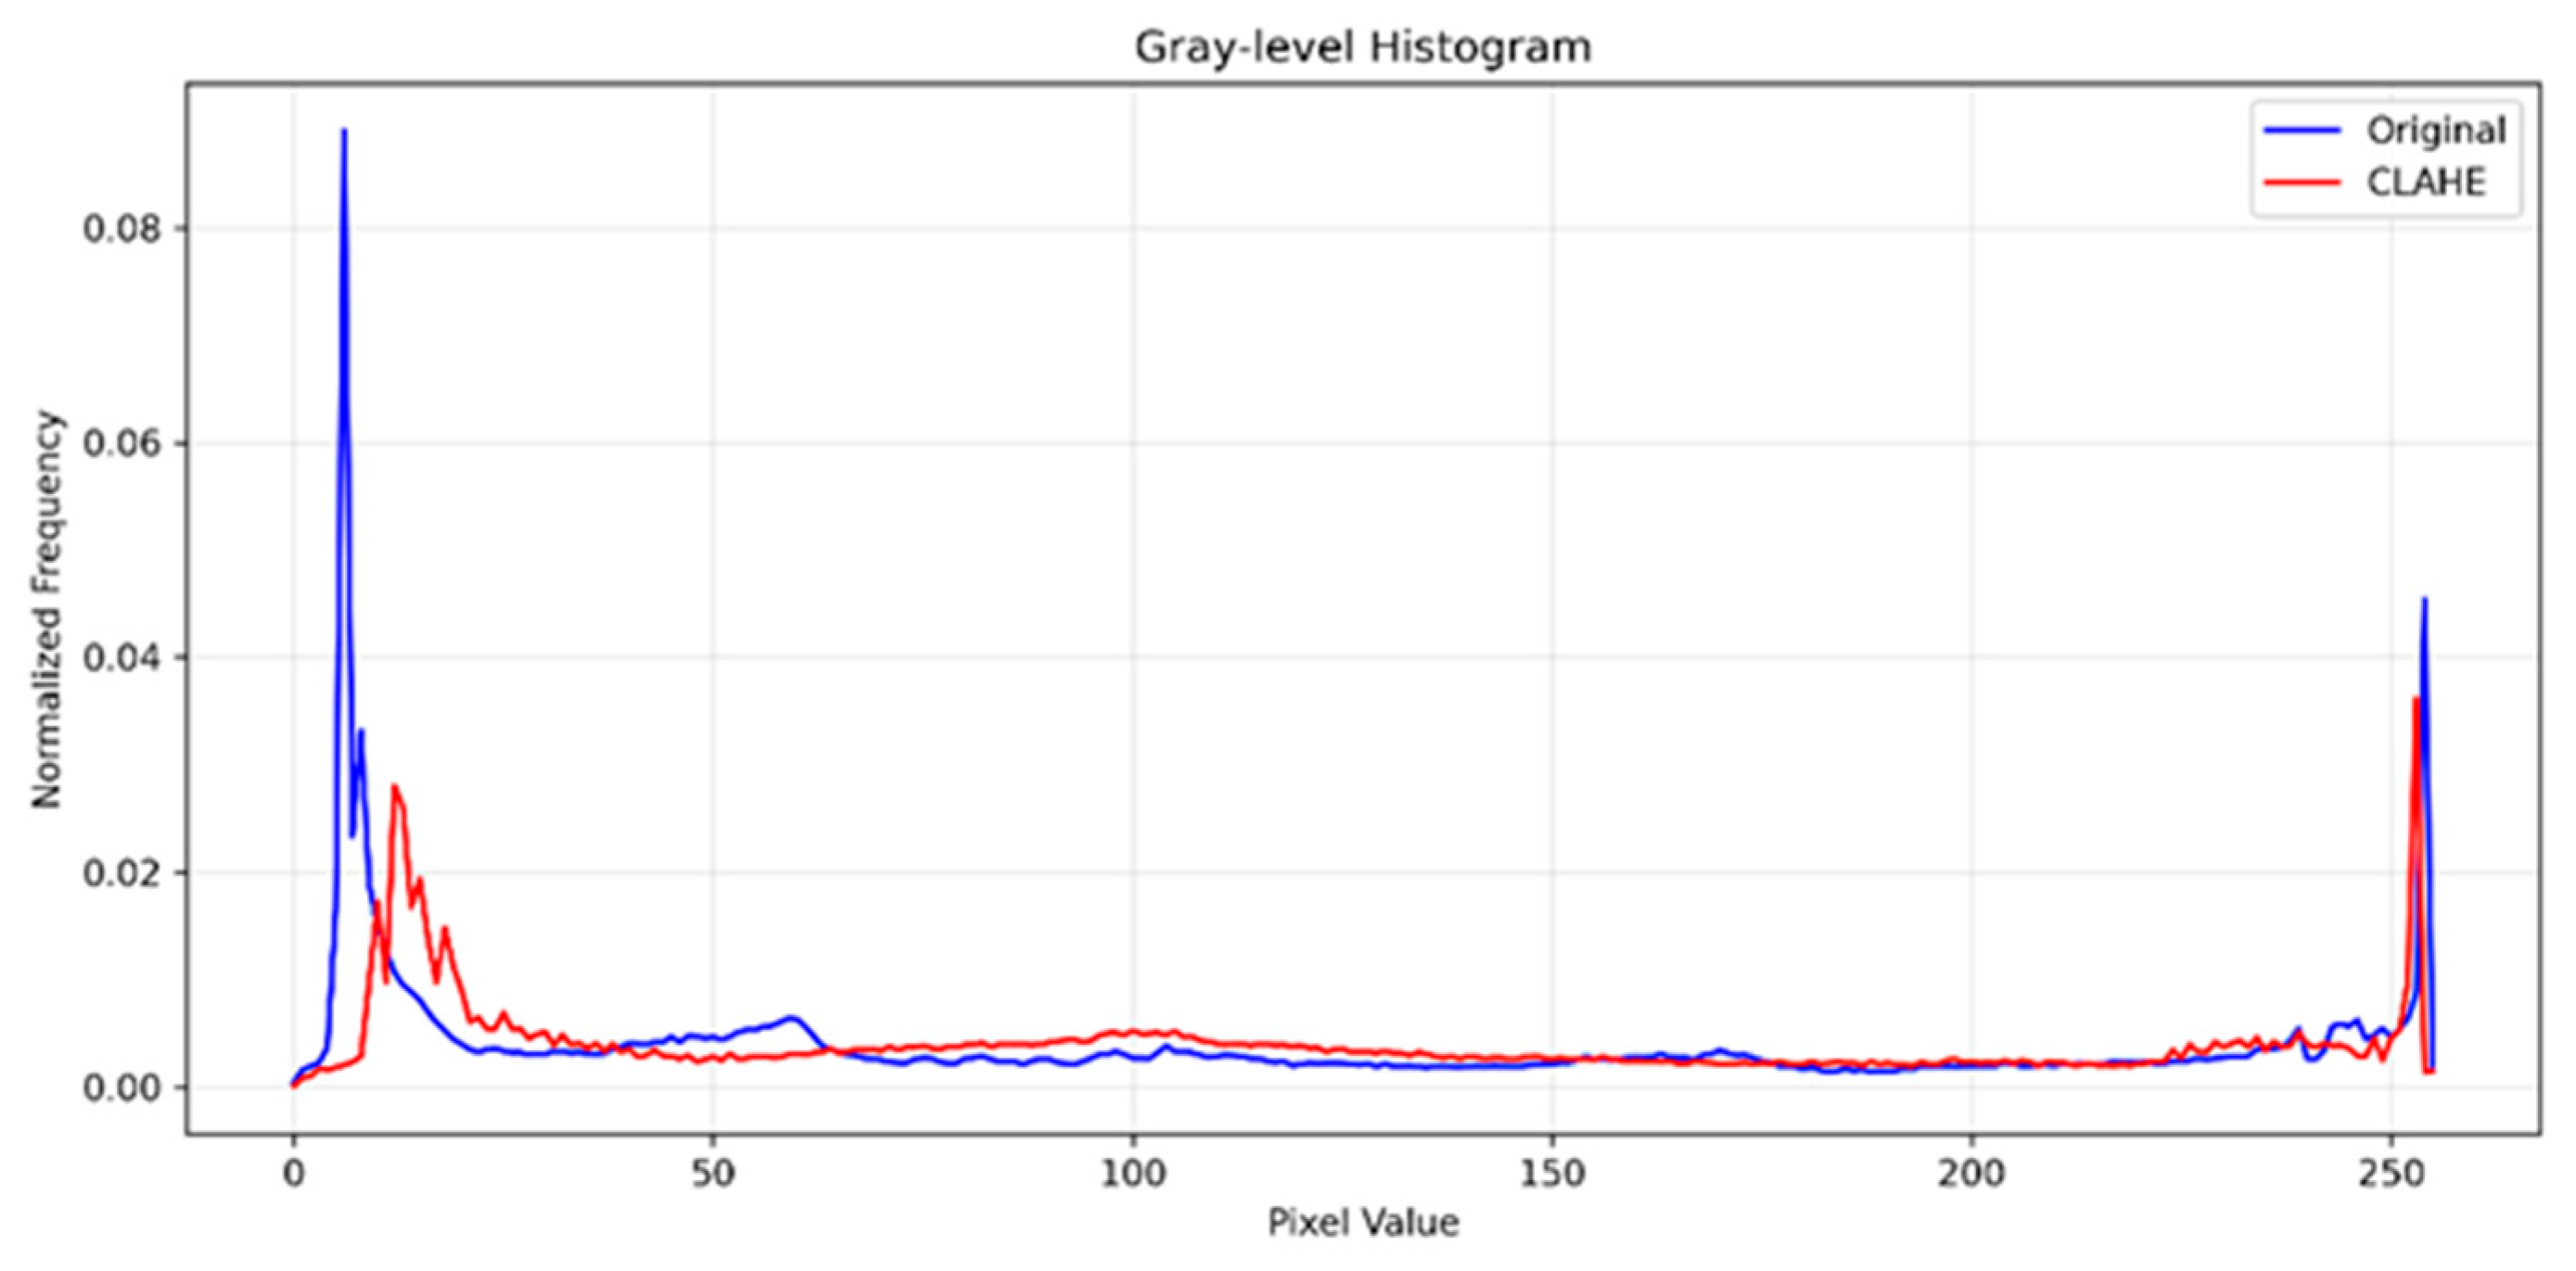
Without introducing obvious noise, this algorithm successfully stretches the grayscale dynamic range of the original image and reveals details in dark regions. A comparison between the image processed by the CLAHE algorithm and the original image is shown in Figure 5. As shown in Figure 6, the histogram changes from a “narrow peak” to a “smooth distribution”, and both the standard deviation and entropy increase synchronously, which quantitatively verifies the contrast enhancement effect. This provides richer texture information for subsequent detection and recognition tasks.
Figure 5.
Preprocessing effect of CLAHE algorithm.
Figure 6.
Grayscale dynamic range histogram curve.
2.2. Dataset Construction
(1) Skeleton Model Construction
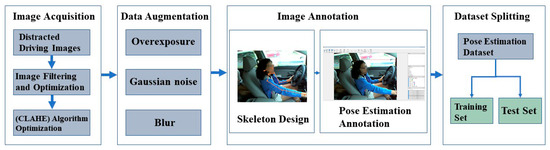
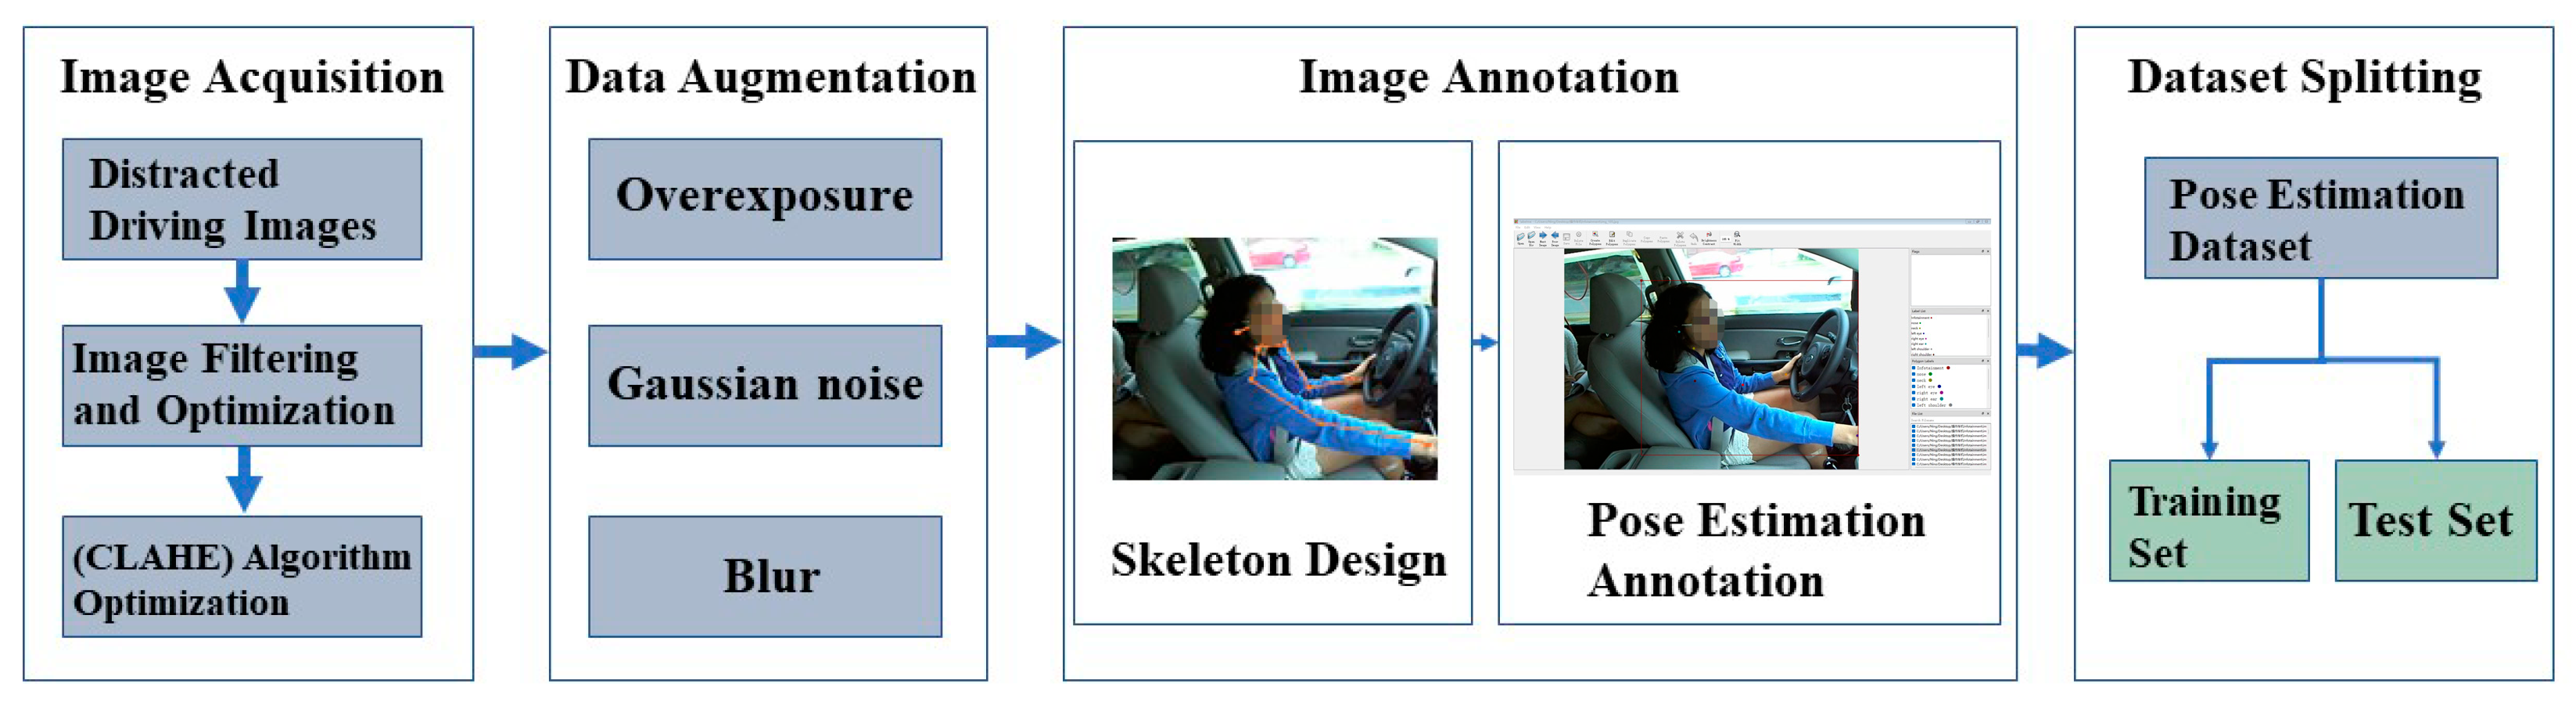
Before conducting human pose analysis, the primary task is to establish the topological structure of skeletal keypoints. Based on human anatomical characteristics and organ distribution rules, a skeleton system containing 12 keypoints and 11 groups of connections is constructed, and the specific configuration is shown in Figure 7.
Figure 7.
Flowchart of dataset construction.
(2) Data Annotation System
The Labelme tool is used for image annotation, and the annotation scheme is shown in Figure 7. The human body region is framed with a minimum enclosing rectangle, and instances such as operating the vehicle machine are marked as “Infotainment”. The keypoint sequence is arranged in anatomical order from facial features (nose, neck, eyes, ears) to upper limb joints (shoulders, elbows, wrists). After format conversion, each sample includes the target class code, bounding box parameters (center coordinates and size), and a keypoint coordinate matrix, and a ternary visibility flag system is adopted: 0—invisible, 1—occluded, 2—fully visible.
The original image dataset contains 6 types of driving behavior samples: 250 cases of normal driving, 165 cases of eating and drinking behavior, 296 cases of calling postures, 285 cases of mobile phone operation, 147 cases of infotainment interaction, and 142 cases of turning around, totaling 1285 images. After data augmentation, it is expanded to 5140 images. The coordinate parameters of the keypoints and the label files remain unchanged; only the image files are expanded. A stratified sampling strategy is used to divide the data into a training set and test set at a ratio of 7:3 to ensure the consistent distribution of various behavior samples in the subsets. The complete data processing flow is shown in Figure 7.
3. Distracted Driving Behavior Recognition Method Based on Machine Vision Algorithms
In human pose estimation, keypoint extraction is a critical technique. In scenarios such as the cockpit, which are characterized by a single person, half body, and strong interference, many action cues are available: raw image pixels, human detection boxes, optical flow, inertial measurement unit (IMU) signals, and even depth maps. However, pixels and optical flow are highly sensitive to illumination and camera vibration; IMU signals require additional hardware; and depth maps are often unavailable in low-cost cockpits. In contrast, 2D semantic keypoints compress the human body into just over a dozen high-semantic, robust, low-bandwidth joint coordinates, which possess irreplaceable natural advantages.
- (1)
- Distracted behaviors such as calling, smoking, drinking, leaning to pick up objects, etc., ultimately depend on the relative geometric relationships among joints, including the hands, head, shoulders, and torso. Once keypoints are obtained, these relationships can be directly represented by geometric features such as vector angles and distance ratios, without requiring large models to “guess” actions.
- (2)
- Extracting 12 keypoints only requires 24 float values. The subsequent distraction decision module (rule-based or lightweight classifier) can run within 1 ms, fully meeting the vehicle-mounted real-time requirement (≥30 fps).
Existing pose analysis frameworks mainly adopt two technical routes: a data-driven aggregation strategy and an object-oriented decomposition strategy. The former follows an inference pattern from local to global, achieving multi-object parsing through full-image keypoint extraction and topological reorganization. It has good adaptability in crowded scenes but suffers from association errors caused by occlusion. The latter adopts a processing pipeline of localization first, refinement second: it extracts individual regions via a detection network and then performs keypoint regression for each candidate box. This staged processing effectively suppresses background interference and provides significant accuracy advantages in scenes with a limited number of individuals.
Considering the spatial characteristics and target distribution of the driving environment, this study adopts the YOLOv8n-Pose framework for 2D pose estimation. This model uses an object-oriented cascaded architecture and improves the accuracy of human pose extraction in the cockpit via the joint optimization of detection and keypoint regression.
YOLOv8n-Pose Model and Improvement Strategies
YOLOv8n-PSF-Pose is an end-to-end pose analysis architecture derived from the YOLOv8 detection framework, with dual functions of object localization and keypoint regression. The system adopts a four-level cascaded design: a data preprocessing unit, a feature encoder, a multi-scale fusion module, and a task-specific decoder.
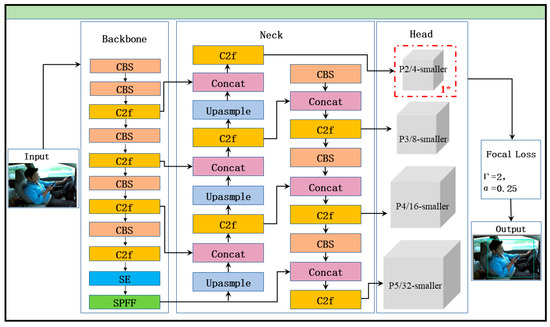
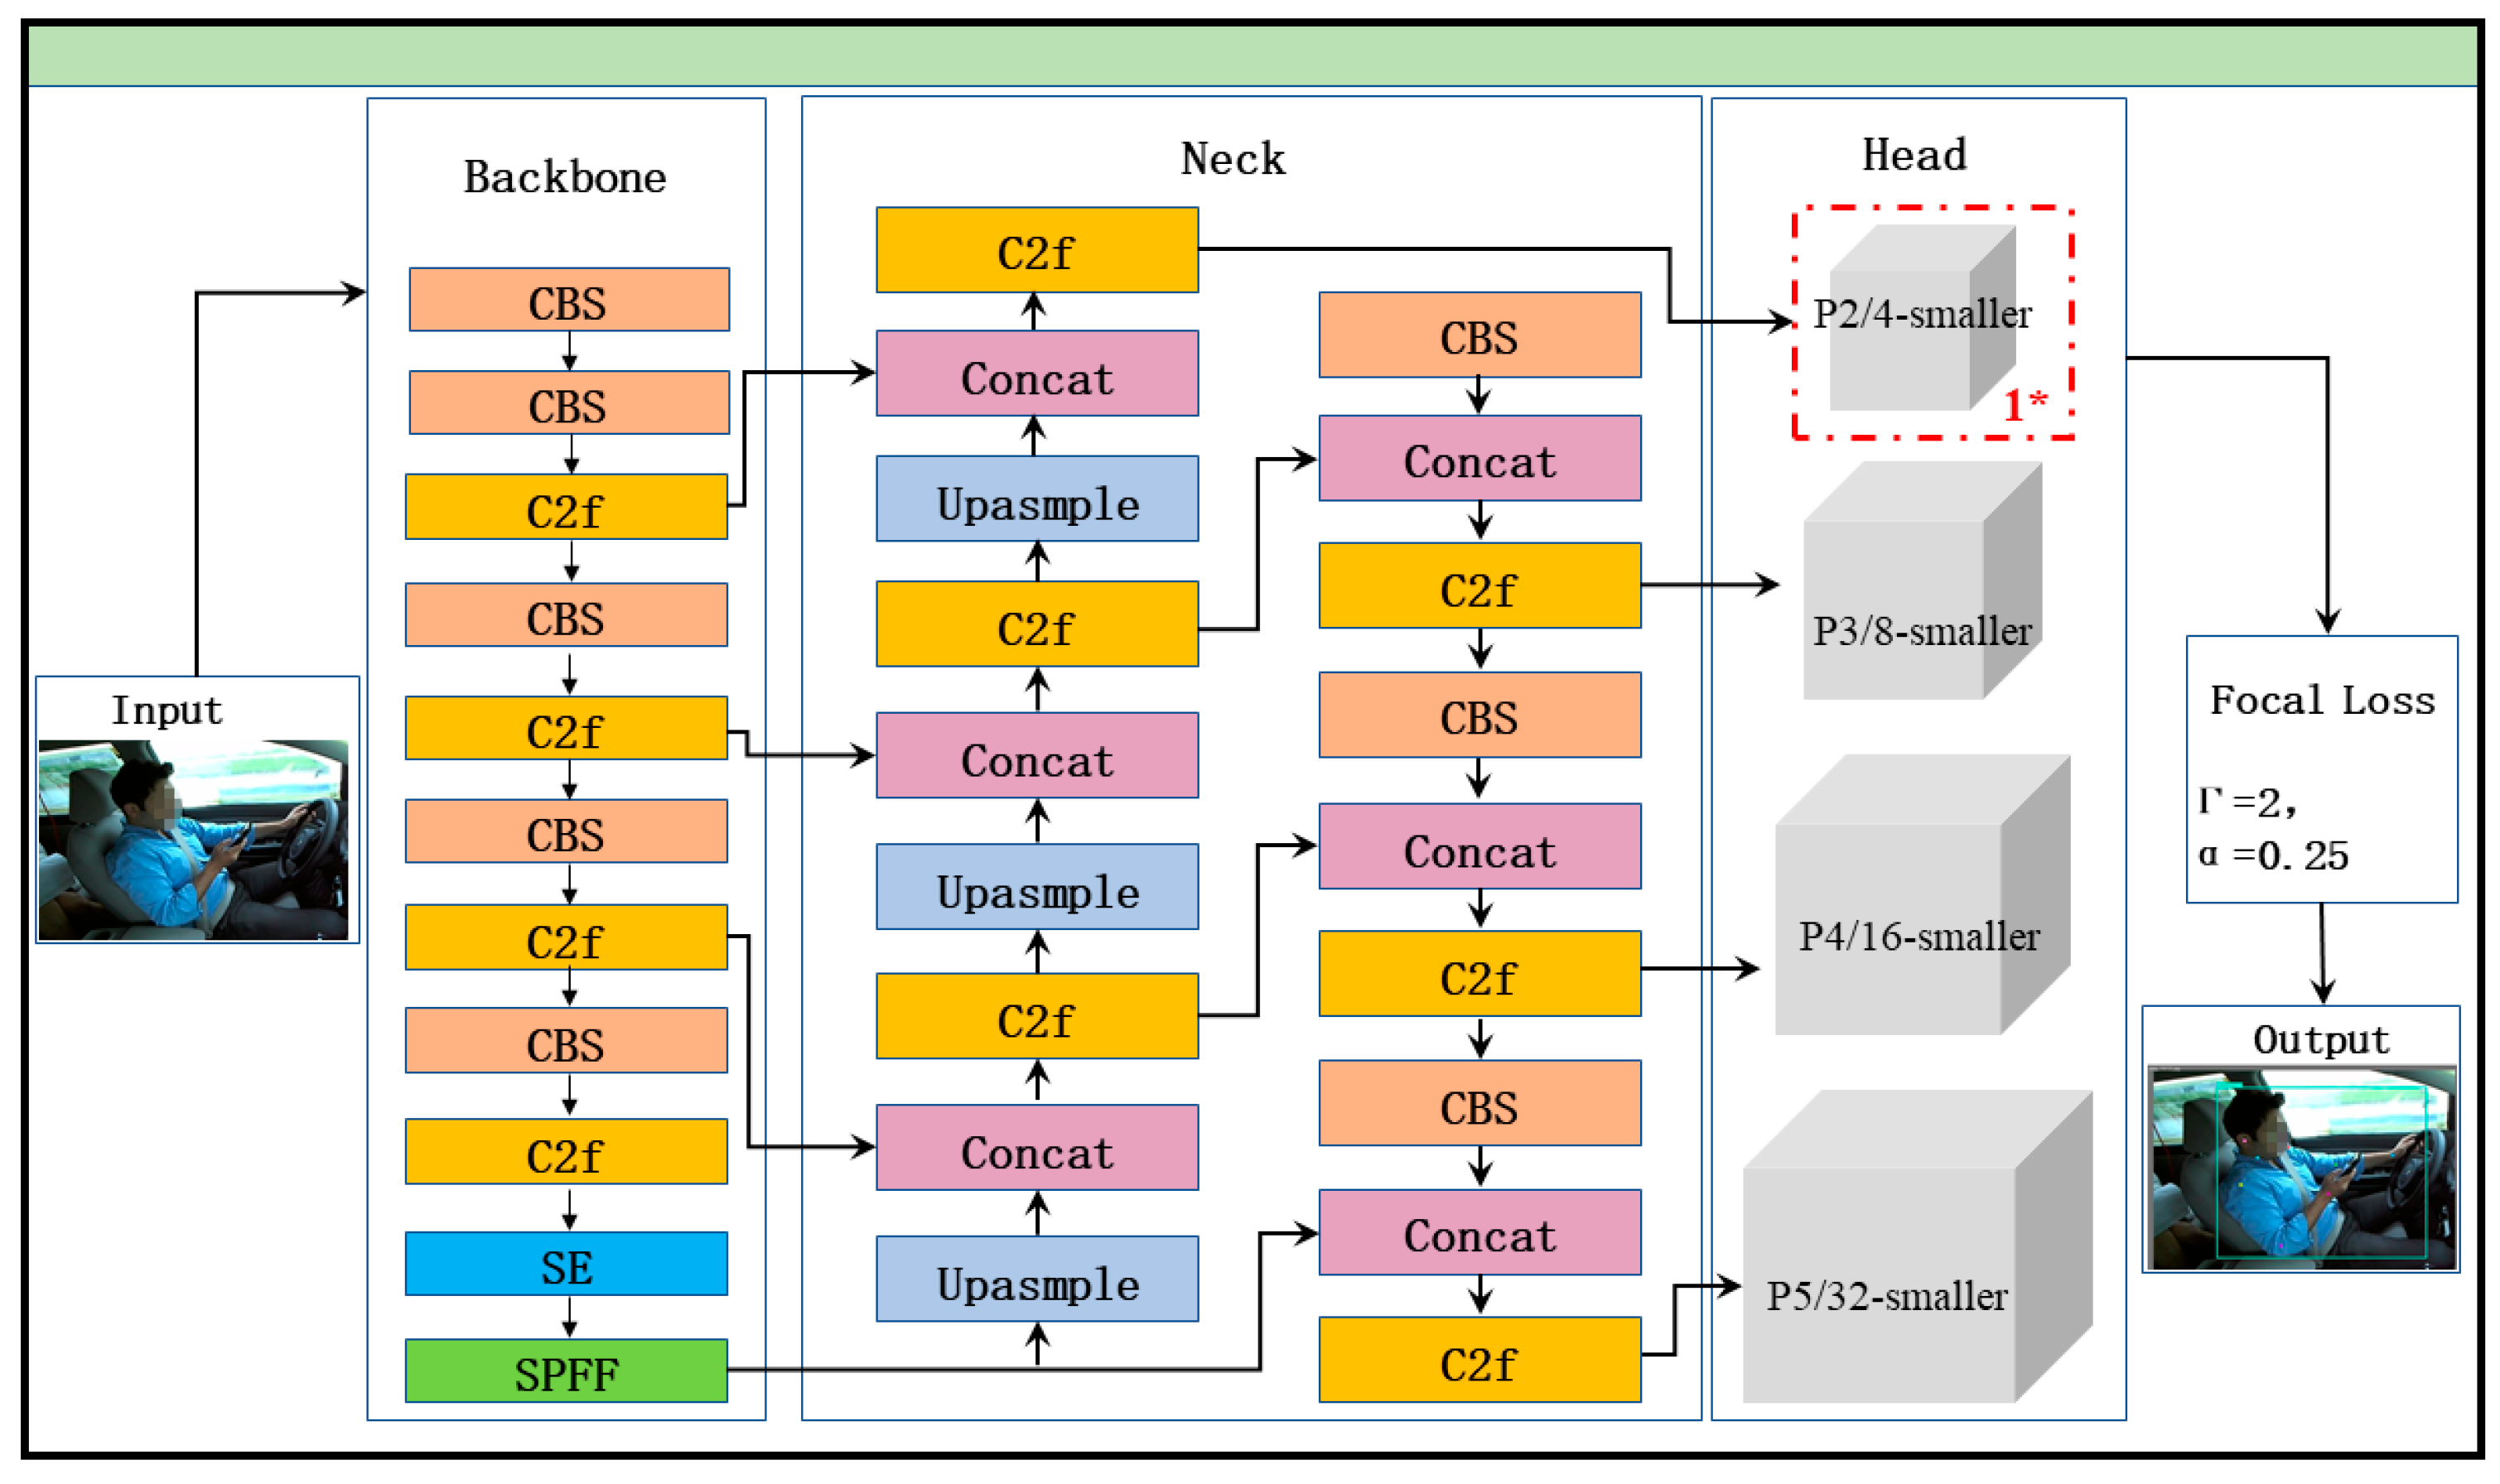
To meet the detection requirements for 12 anatomical landmarks in driving scenarios, two major optimizations are applied to the standard YOLOv8n-Pose. First, a P2 shallow branch is added based on the original P3–P5 detection towers, introducing 160 × 160 high-resolution feature maps to reduce detail loss caused by downsampling. Second, a Squeeze-and-Excitation (SE) channel attention mechanism is embedded in the backbone to achieve adaptive feature recalibration for keypoint regions. Third, the detection head is modified to use the focal loss function, introducing a focusing factor and adjusting the sample weights to allow the model to pay more attention to hard-classified samples, thereby improving the classification performance. The improved architecture is shown in Figure 8.
Figure 8.
Architecture of YOLOv8n-PSF-Pose. Note: 1* denotes the P2 detection layer module. The blue modules represent the SE attention modules. CBS stands for Convolution-BatchNorm-Activation. C2f is the cross-stage feature fusion module. SPFF refers to the spatial pyramid fusion module. Concat denotes the feature fusion method by channel concatenation. Upsample represents the upsampling module.
(1) Added P2 Shallow Feature Enhancement
The standard FPN realizes semantic–detail feature coupling through cross-layer connections, but its P3–P5 detection layers have a limited response to sub-pixel-level key points. This study adds a P2 detection node at the bottom of the feature pyramid. The feature map of this layer has a spatial resolution of 160 × 160 and it can retain more micro-texture information.
Specifically, let the input image size be . In the backbone network (Backbone), we extract the shallow feature map from the second C2f module, which has a spatial size of and a channel number of . This feature map contains rich detailed texture information but has weak encoding of semantic information.
First, we apply a 1 × 1 convolution operation to for channel adjustment and feature refinement, generating the initial feature map of the P2 layer:
where is the set output channel number, which is consistent with the channel numbers of other layers in the FPN to ensure compatibility.
Subsequently, as shown in Figure 8, is fed into a feature fusion path consisting of upsampling (Upsample) and feature concatenation (Concat). We use bilinear interpolation to upsample the spatial resolution of by 2 times, matching its size with that of the P3 feature map (size of ) from the deeper layer:
Next, the upsampled shallow high-resolution feature is concatenated with the P3 feature map from the FPN, which has stronger semantic information, along the channel dimension:
Finally, is passed through a standard C2f module for feature fusion and dimensionality reduction, outputting the final feature used by the P2 detection head. Meanwhile, will continue to participate in the feature propagation of subsequent layers in the FPN.
This shallow enhancement strategy is especially suitable for the precise localization of small keypoints such as wrists and ears, effectively alleviating the spatial quantization errors caused by deep networks.
(2) Introduction of the SE Attention Module
To enhance the network’s feature sensitivity to keypoints, this study incorporates the Squeeze-and-Excitation (SE) channel attention mechanism.
The SE module is selected based on two main considerations: (1) light weight—the SE structure is simple, and the introduced parameters and computational overhead are extremely small, meeting the requirements of real-time systems; (2) effectiveness—changes in cockpit illumination (such as entering and exiting tunnels) mainly affect the channel response distribution of the entire image, rather than the local spatial structure. Preliminary comparative experiments show that, under similar computational complexity, the SE module achieves a better improvement in illumination robustness than more complex spatial-channel hybrid attention mechanisms (e.g., CBAM). Therefore, we adopt the SE module as a balanced choice between efficiency and performance.
As shown in Figure 9, this module adopts a dynamic recalibration strategy to realize the adaptive weighting of feature channels, guiding the model to focus on discriminative regional features while suppressing background interference, thereby improving the ability to discriminate fine-grained features.
Figure 9.
Structure diagram of the SE attention mechanism.
The SE architecture consists of two cooperative processing units: the squeeze unit constructs channel-wise descriptors through global information aggregation, and the excitation unit generates attention distributions based on interdependencies among channels. Specifically, the squeeze operation compresses the convolutional feature U with spatial dimensions W × H × C into a statistical vector Z of size 1 × 1 × C, which encodes the global response intensity of each channel. In the excitation stage, a bottleneck fully connected network models interchannel interactions and produces a C-dimensional attention weight vector S. Channel-wise multiplication between S and the original features achieves adaptive feature recalibration. This recalibration mechanism significantly strengthens the network’s selective expression of task-related features and effectively improves the discriminative performance of the model.
(3) Replacement of Cross-Entropy Loss with Focal Loss
Focal loss is a loss function specifically designed to address the class imbalance problem, and it performs especially well in object detection tasks. Class imbalance is a common issue in many practical applications, such as object detection. For instance, in an image, the background (negative samples) usually accounts for the majority, while objects (positive samples) are scarce. The traditional cross-entropy loss may cause the model to overemphasize negative samples and neglect positive ones, especially hard-to-detect positive samples. Focal loss solves this problem by focusing on hard-to-classify samples. The improvement is illustrated in Figure 8.
The cross-entropy loss in the classification branch of the detection head is replaced with focal loss. By introducing tunable parameters γ = 2 and α = 0.25, the model adaptively reduces the weights of easy-to-classify samples during training and focuses on learning hard samples. This improvement does not involve modifications to the network structure and only replaces the loss function, so it introduces no extra model parameters or computational overhead during inference.
The formula of focal loss is as follows:
where is the predicted probability of the model for the target class, is the balancing factor used to adjust the influence between positive and negative samples, and is the focusing factor used to adjust the weights of easy and hard samples.
The three proposed modifications—the P2 layer, SE attention, and focal loss—are designed to work synergistically to address distinct challenges in driver cabin keypoint detection. The P2 detection layer provides high-resolution spatial features, which are crucial for localizing small-scale keypoints (e.g., wrists, ears). However, introducing finer-grained features also amplifies background noise. The SE attention module addresses this by performing channel-wise feature recalibration, effectively suppressing irrelevant background activations and amplifying features from informative regions. This allows the network to focus its computational resources on the spatially enhanced but noise-prone features from the P2 layer. Concurrently, the focal loss function tackles the inherent class imbalance between easy and hard samples (e.g., occluded vs. clear keypoints). By down-weighting the loss contribution from well-classified keypoints, it forces the model to concentrate learning on the more challenging samples, which often coincide with small or occluded keypoints, which the P2 and SE modules are designed to better detect and represent. Thus, the P2 layer offers the spatial capacity to see fine details, the SE module provides the selectivity to focus on them, and focal loss ensures learning robustness to master them. This tripartite design forms a coherent optimization loop that significantly boosts performance in complex cabin environments.
4. Methods for Constructing Key Features
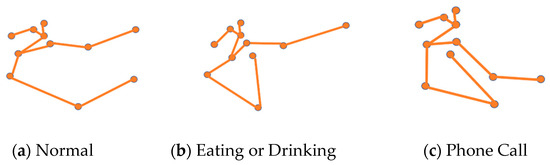
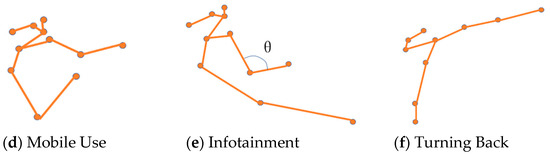
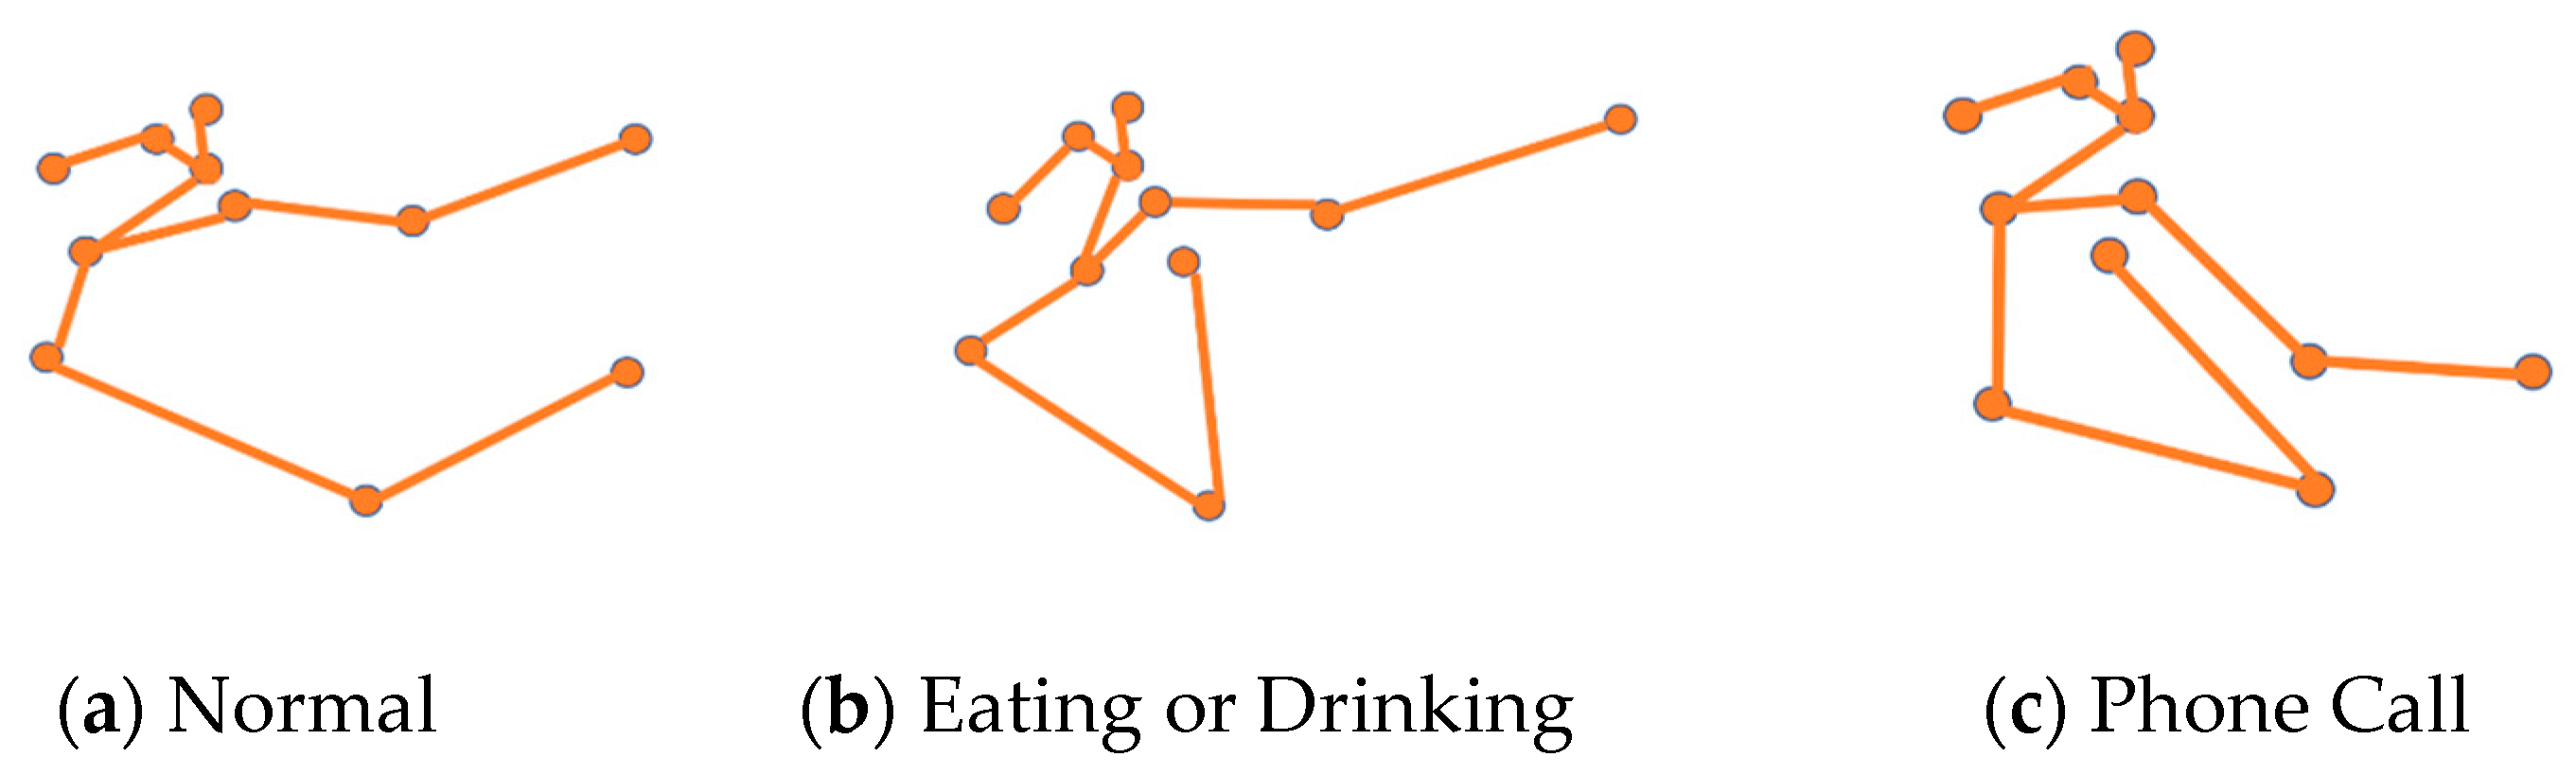
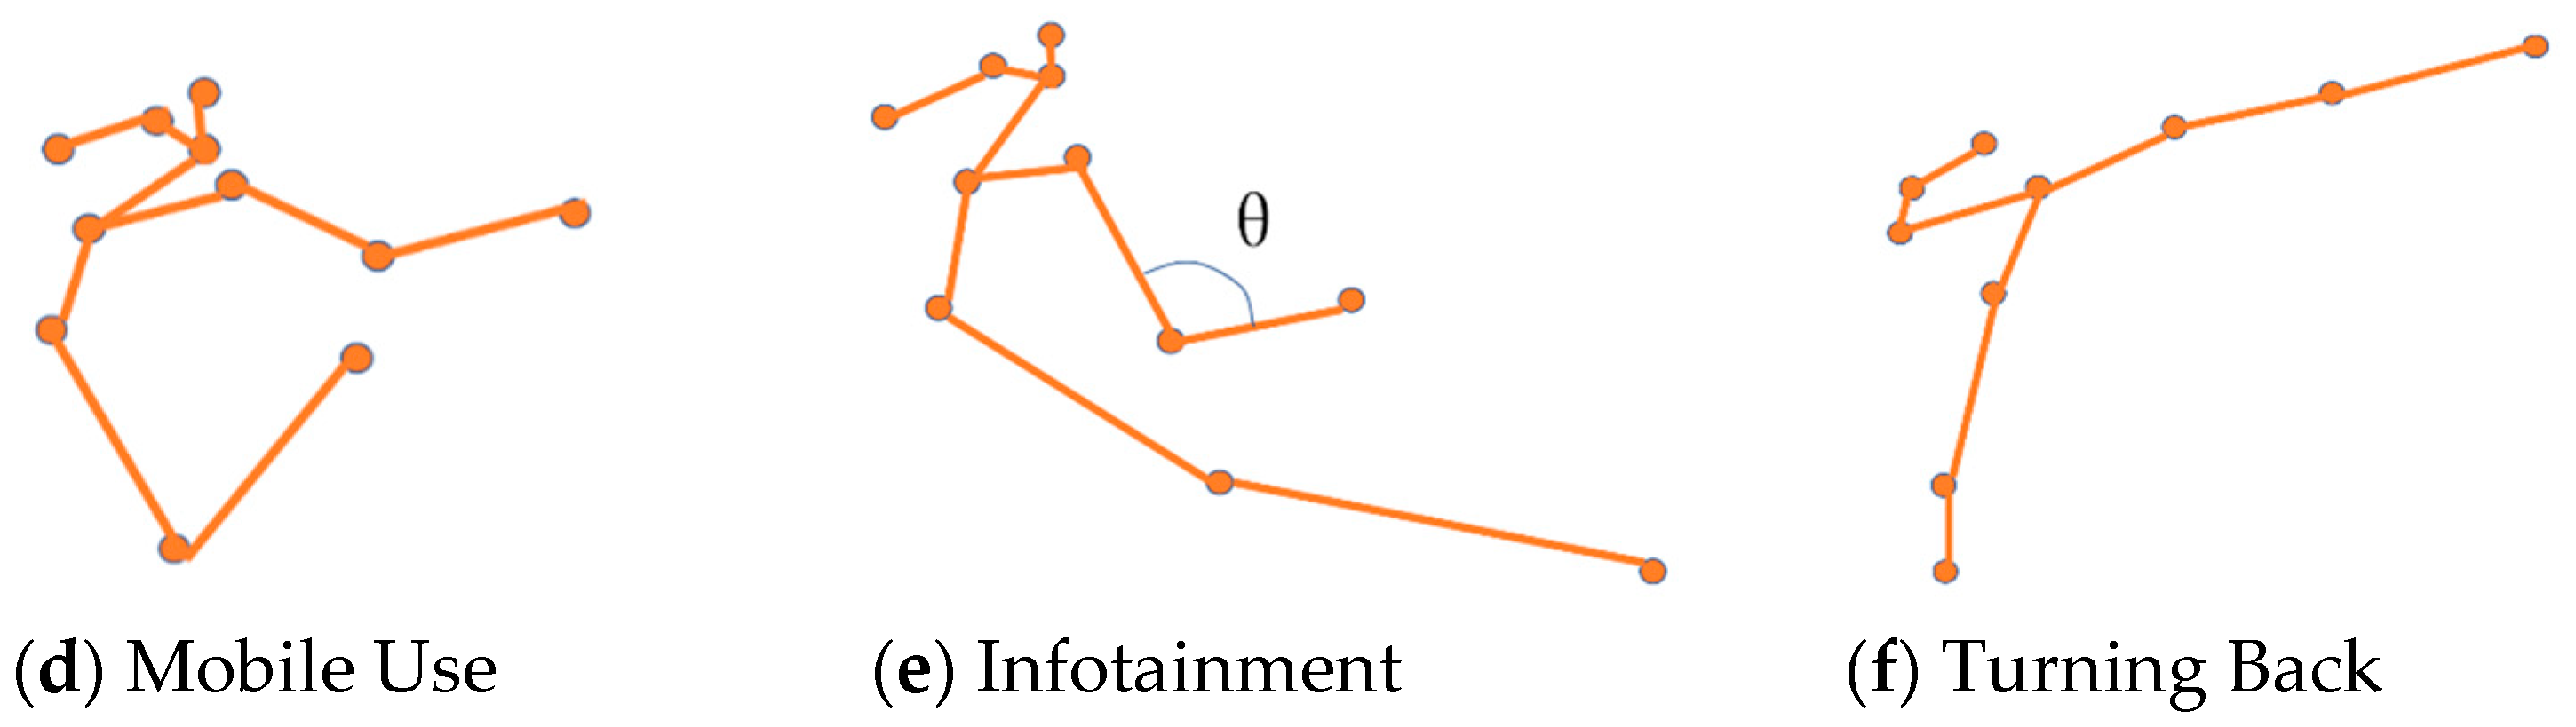
The accuracy of driving behavior recognition highly depends on the spatial representation of action patterns. Experiments show that different distracted states are not only reflected in systematic offsets of limb angles but also exhibit significant differences in the topological relationships of anatomical landmarks and the number of effectively detected keypoints. Based on this observation, this study constructs a multi-dimensional pose description: taking joint angles as the main discriminative dimension, supplemented by relative coordinates between landmarks and visibility statistics as complementary features, and forming a complementary feature space. The spatial pattern differences of various behaviors are shown in Figure 10.
Figure 10.
Schematic diagrams of different poses.
During normal driving, facial keypoints maintain stable angles, and the left and right elbow angles are basically consistent. When drinking or eating, compared with normal driving, the right elbow angle or the left elbow angle becomes smaller, but the angle is smaller than that when drinking; when using a mobile phone, the elbow angle is basically around 90 degrees; when operating the vehicle machine, the right elbow angle is typically 160–180 degrees; when turning around, the distance between the left and right ankles is very large.
The joint angle is a core feature characterizing the dynamic changes in human pose. Based on the keypoint coordinates extracted by the model mentioned above, this study calculates each joint angle through vector-included angle computation, and the specific angle calculation is shown in Equation (5).
Assume that the coordinates of three keypoints are (), (), and (), and the angle formed by these three points is denoted as . To reduce the influence of keypoint detection errors or missing coordinates on angle calculation, the following criterion is set: when two or more of the three keypoints forming an angle have detection confidence lower than 0.5, the angle value is marked as −1, indicating that the angle data are invalid.
To compensate for the limitations of relying solely on joint angles in pose description, this paper introduces the Euclidean distances of the “neck–wrist” and between the left and right wrists as supplementary features. Such distance indicators can reflect the spatial position changes of the hands and show obvious discrimination in distinguishing two types of behavior: “drinking and eating” and “using a mobile phone”.
To address the problem of incomplete keypoint detection caused by occlusion or poor lighting conditions, this paper counts the number of keypoints with visibility marked as 2 (no occlusion) in each frame and performs binarization on all keypoints: successfully detected keypoints are marked as 1, and undetected keypoints are marked as 0. This strategy exhibits strong discriminability in distinguishing “operating vehicle-mounted devices” from “normal driving”.
To evaluate the practical effectiveness of various features in behavior recognition, this paper statistically analyzes the average values of each feature under different behavior states and constructs a multiple regression model. The mean feature values are taken as independent variables and the behavior categories as dependent variables, and the importance of each feature is quantified by regression coefficients. Table 1 shows the mean distribution of joint angles, relative positions, and the number of detected keypoints under different behaviors, as well as their corresponding weight assignments.
Table 1.
Table of average feature values and weight allocation.
Table 1 shows that Angle 1 represents the elbow joint angle, and its positive weight indicates that it plays a positive role in behavior discrimination. Distance 1 represents the distance from the wrist to the neck, and Distance 2 represents the distance between the two wrists. The relative position features and human keypoint existence features have higher weights, which further verifies their key roles in behavior recognition, and they help to improve the discrimination ability and overall performance of the classification model.
5. Behavior Classification Based on BP Neural Network
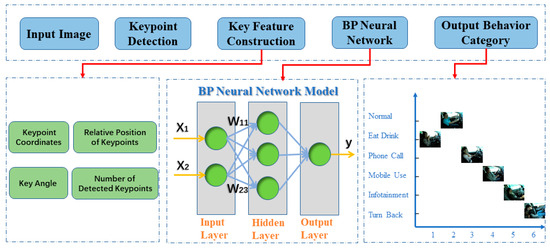
After completing keypoint detection and joint angle calculation, this study comprehensively uses coordinate information, angle data, the relative positional relationships of keypoints, and the detection integrity to determine pose categories. The constructed feature system is optimally designed with a moderate scale: it covers the 2D coordinates of 12 keypoints (24 dimensions), 2 main joint angles (2 dimensions), the relative distances between 2 groups of keypoints (2 dimensions), and the count of successfully detected keypoints (1 dimension), with a total of 29 feature dimensions.
Considering the requirements of a lightweight model and real-time performance, this paper adopts the BP network as the core architecture for behavior recognition, and its processing flow is shown in Figure 11. The system first receives the images collected by the monitoring equipment; then, it performs pose parsing on a single-frame image through the optimized YOLOv8n-PSF-Pose model to obtain the coordinates of 12 key human body nodes, laying a foundation for subsequent feature extraction; subsequently, a multi-dimensional feature vector is constructed based on these coordinates and imported into the BP neural network; the BP network is used to complete the classification task, where the input layer contains 29 neurons corresponding to 29 feature parameters, and the BP neural network learns the features of different behavior patterns for classification. For the hidden layers, two fully connected hidden layers are adopted to balance model capacity and overfitting risks. The first hidden layer contains 64 neurons, using the rectified linear unit (ReLU) as the activation function to introduce non-linearity and alleviate the gradient vanishing problem. The second hidden layer contains 32 neurons, also using the ReLU activation function. For the output layer, the number of neurons is 6, corresponding one-to-one to the six types of distracted driving behaviors to be identified (normal driving, eating, holding a call, operating a mobile phone, operating the in-vehicle entertainment system, and turning around to take objects). This layer uses the Softmax activation function to convert the outputs of neurons into the predicted probability distribution of each category.
Figure 11.
Behavior classification flowchart. Note: X is the input, W is the weight matrix, and Y is the output.
To prevent features with different dimensions from introducing bias into network training, all features are standardized using the Z-score method before being input into the BP network:
where denotes the original data, and and represent the mean and standard deviation of the feature over the training set, respectively.
Training Hyperparameters and Configuration:
The Adam optimizer is adopted as the optimizer, with its parameters set to default values (first-moment estimation decay rate ρ1 = 0.9, second-moment estimation decay rate ρ2 = 0.999). The initial learning rate is set to 1 × 10⁻³. The batch size during training is set to 32. The total number of model training epochs is 200. We also adopt early stopping, which terminates training when the validation set loss no longer decreases for 20 consecutive epochs to prevent overfitting. Cross-entropy loss is used as the loss function for the training objective. For regularization, to improve the generalization ability of the model, we introduce dropout regularization layers after both hidden layers, with the dropout rate set to 0.2. The weights of all fully connected layers are initialized using the Kaiming normal distribution.
6. Experiments and Analysis
6.1. Training Environment and Configuration
In this experiment, all models used are run on the same server, and the server configuration is shown in Table 2. The number of training epochs is set to 300, the batch size of input images is 16, the initial learning rate (lr0) is 0.01, and the momentum factor (momentum) is 0.937. The weight decay is set to 0.0005 to regularize the model. For the focal loss function, we use hyperparameters alpha = 0.25 and gamma = 2.0, which are widely adopted in object detection tasks to effectively balance positive/negative samples as well as easy/hard samples. The input images are uniformly resized to 640 × 640 pixels.
Table 2.
Server configuration and operating environment.
6.2. Keypoint Evaluation Metrics
This study adopts precision (P), recall (R), the mean average precision (mAP50), and the mAP50:95 as the core indicators to evaluate the performance of the keypoint detection model. Precision is used to measure the proportion of true positive samples among the keypoints predicted as positive by the model, reflecting the accuracy of the prediction results. Recall is used to evaluate the proportion of all truly positive keypoints that are successfully predicted by the model, reflecting the model’s ability to cover positive samples.
The mean average precision (mAP) is an important indicator that comprehensively considers precision and recall. The mAP50 specifically refers to the mean average precision calculated when the object keypoint similarity (OKS) threshold is fixed at 0.5. The mAP50:95 is a more comprehensive evaluation criterion where the OKS threshold is increased from 0.5 to 0.95 with a step size of 0.05, calculating the mean average precision at each threshold and then averaging these results. This indicator can be used to more comprehensively evaluate the robustness of the model under different strictness levels.
Object keypoint similarity (OKS) is the core metric proposed by the COCO Keypoint Challenge and is similar to the intersection over union (IoU) in object detection tasks. It is used to quantify the matching degree between the predicted keypoint coordinates and the annotated ground-truth coordinates. The calculation of OKS comprehensively takes into account the Euclidean distance between the predicted points and the real points, as well as the human body scale where the keypoints are located, and its calculation formula clearly defines this similarity relationship. Therefore, the mAP-series indicators based on OKS allows us to effectively evaluate the overall detection performance of the model under different matching tolerances.
The calculation formula for OKS is as follows:
Here, denotes the negative exponential function, which is a function that grows or decays very rapidly. For a negative exponent, it indicates that the output value decreases rapidly as the input value increases. is the Euclidean distance between the predicted position and the ground-truth position of the -th keypoint. This is a distance metric between two data points, which is usually used to measure their similarity. A larger distance indicates lower similarity between the two points. refers to the area of the target object or its bounding box width and height, etc. It is the scale of the target, and the area of the target’s bounding box is generally selected. is the standard error of the -th keypoint, which is usually a predefined constant used to reflect the importance and scale uncertainty of different keypoints. represents the visibility flag, and its numerical meaning is as follows: 0 corresponds to the invisible state, 1 indicates occlusion, and 2 represents a fully visible state. is an indicator function that takes the value 1 when the condition > 0 is satisfied and 0 otherwise.
When the OKS value exceeds the set threshold T, the detection result is regarded as a correct match, based on which the average precision (AP) can be calculated. The final mAP metric is obtained by weighting and integrating the AP values obtained under different thresholds.
To further evaluate the efficiency of the keypoint detection model, this paper also incorporates computational complexity (FLOPs) and the number of parameters into the lightweight evaluation system. FLOPs are obtained by calculating and accumulating the product of parameters and input dimensions layer by layer, reflecting the computational cost of the model. The number of parameters reflects the scale and complexity of the model and serves as an important basis for evaluating model capacity.
6.3. Model Comparison Experiments
In the application of human pose detection, to comprehensively evaluate the overall performance of YOLOv8n-Pose in keypoint detection tasks, this study conducted comparative tests of keypoint detection algorithms including HRNet, OpenPose, YOLOv11s-Pose, and YOLOv8n-Pose on the same dataset under identical experimental conditions. The test results are shown in Table 3.
Table 3.
Test results of different models.
From the perspective of detection accuracy, the mAP50 metric of YOLOv8n-Pose reaches 85.7%, which is 2.4, 1.2, and 0.5 percentage points higher than those of HRNet, OpenPose, and YOLOv11s-Pose, respectively. In terms of model complexity and computational cost, YOLOv8n-Pose exhibits significant lightweight advantages. Its parameter amount is only 3.11 M, which is smaller by 60.5 M, 25.5 M, and 6.31 M compared with HRNet, OpenPose, and YOLOv11s-Pose, respectively. Meanwhile, its floating-point operations (FLOPs) total 9.2 G, which is smaller by 24 G, 37.1 G, and 15.1 G compared with other comparative models.
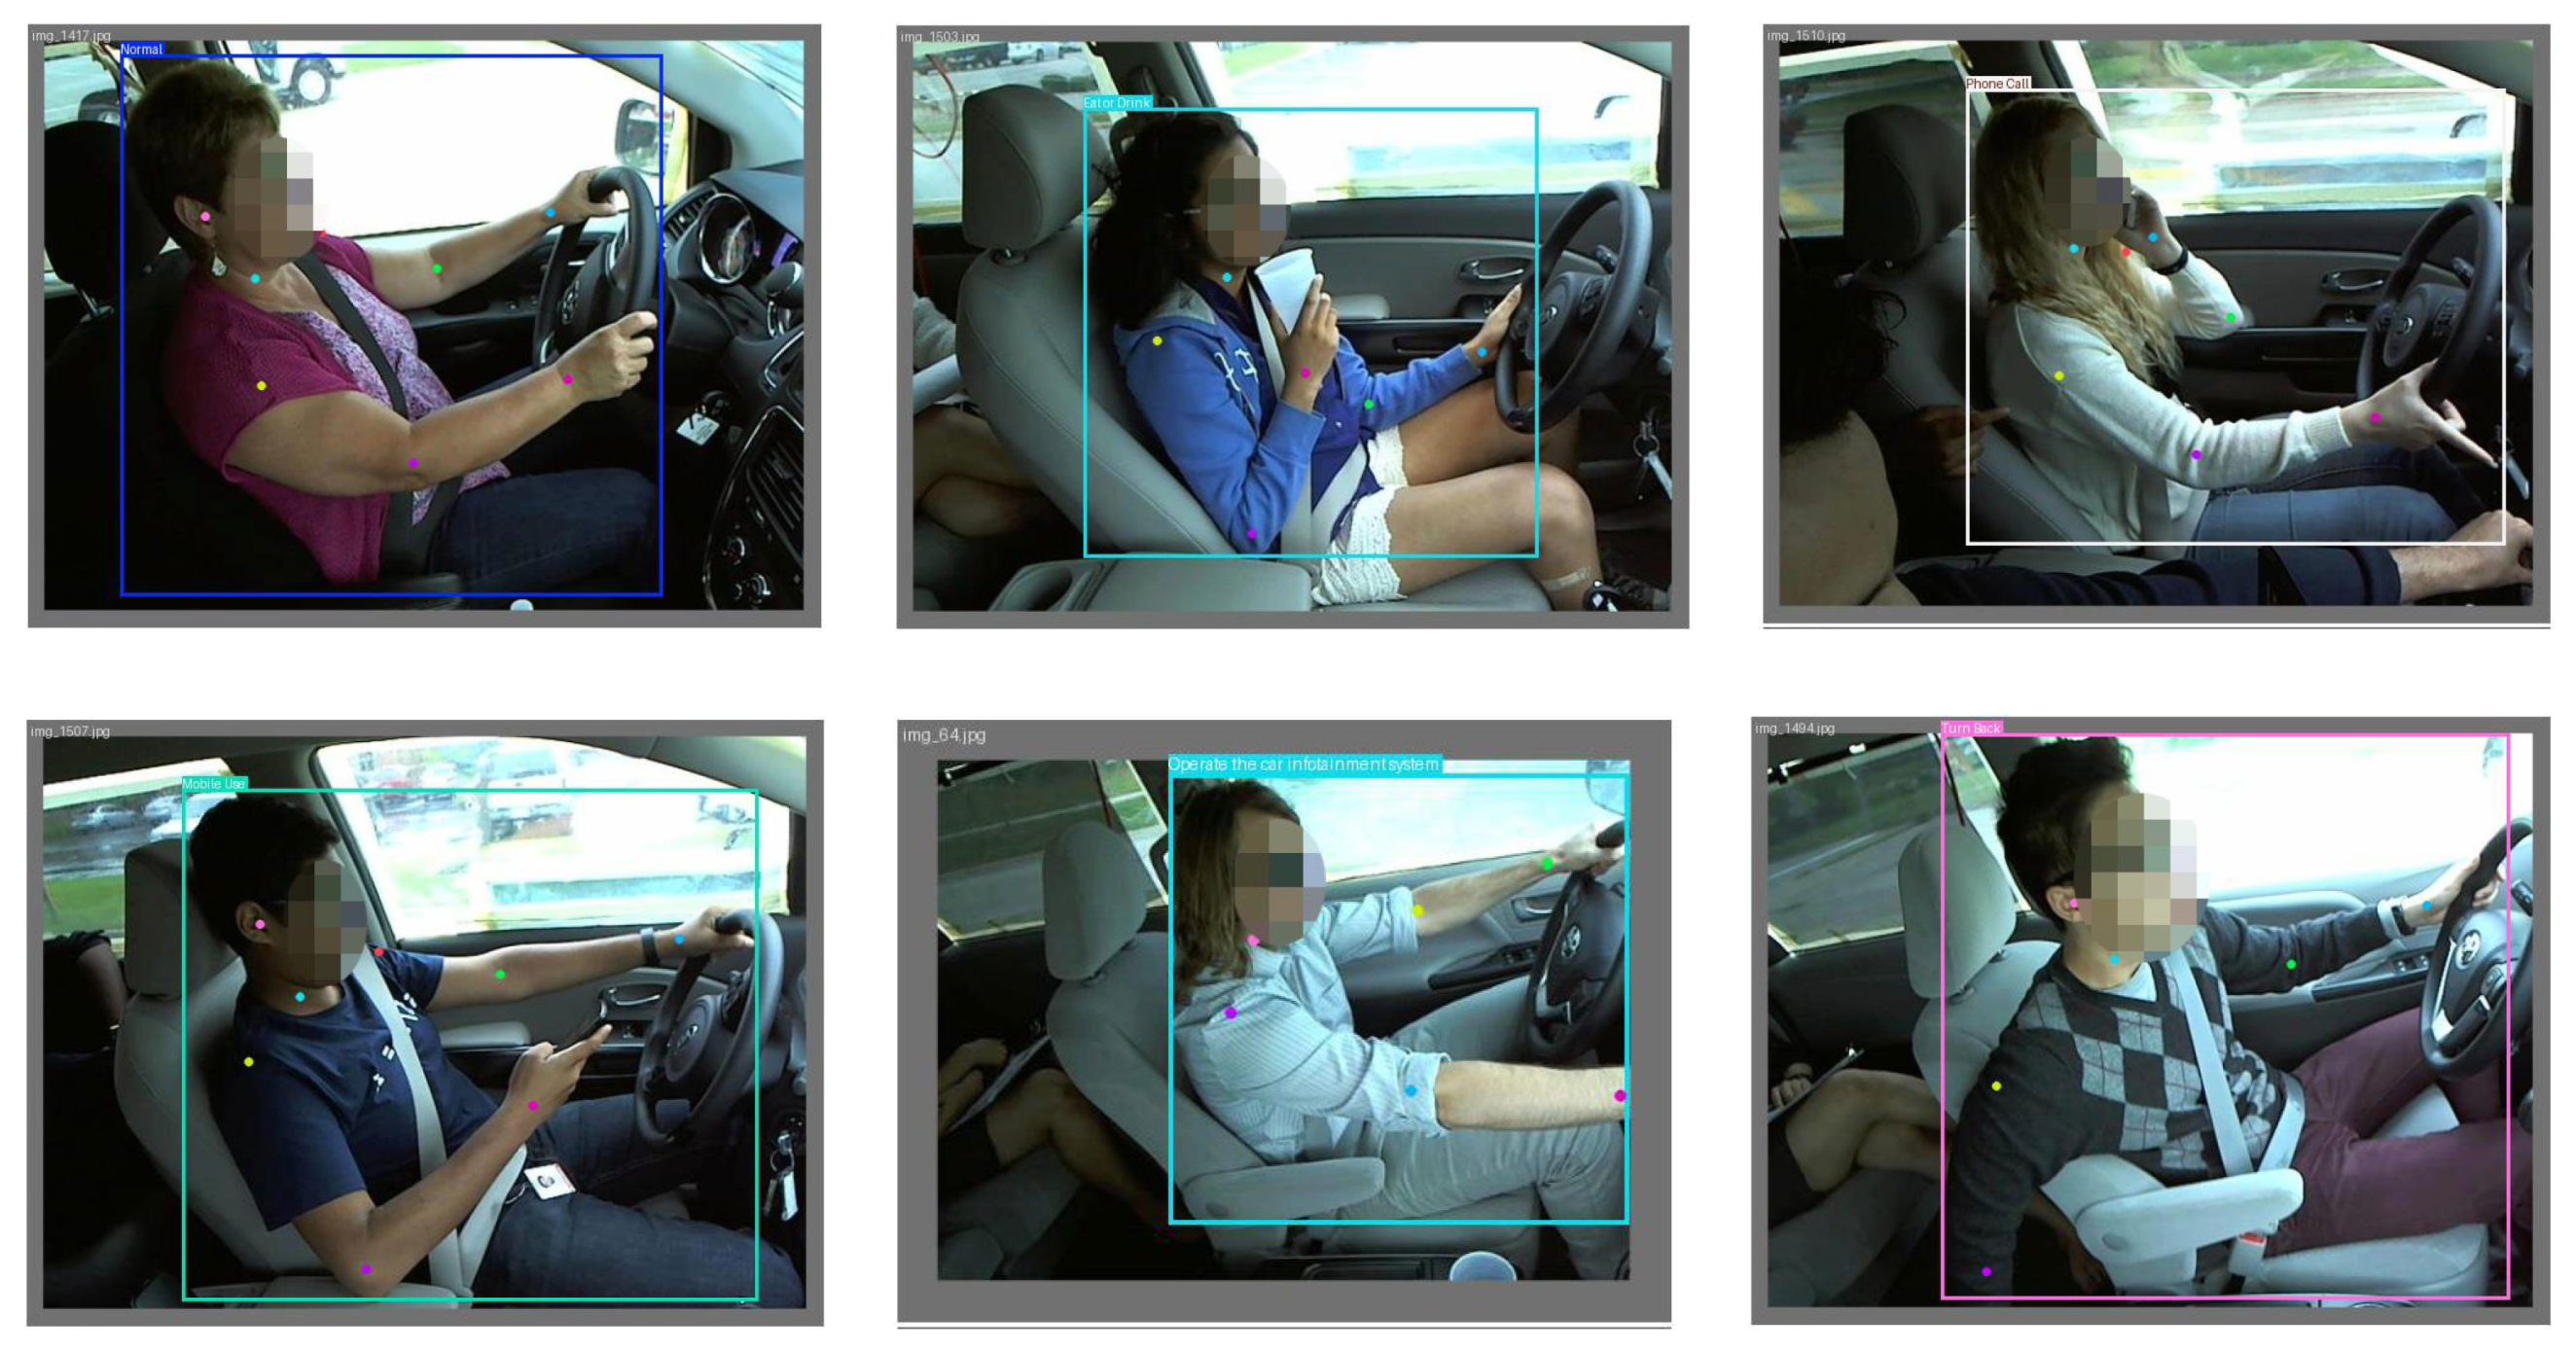
Overall, the experimental data confirm that YOLOv8n-Pose not only achieves higher detection accuracy but also has excellent lightweight characteristics in keypoint detection tasks, achieving a good balance between accuracy and efficiency. The detection effect diagram is shown in Figure 12.
Figure 12.
Recognition result effect diagram.
6.4. Ablation Experiment
To verify the contributions of the P2 detection layer, SE attention module, and focal loss function to the YOLOv8n-Pose model, ablation experiments were conducted on the dataset. Table 4 shows the experimental results obtained by different combination schemes of YOLOv8n-Pose, the P2 detection layer, the SE attention module, and the focal loss function.
Table 4.
Ablation experiment results.
It can be seen from Table 4 that, after introducing the P2 detection layer into YOLOv8n-Pose, its precision (P), recall (R), mAP50, and mAP50:95 are increased by 3.1, 0.4, 1.1, and 3.3 percentage points, respectively, indicating that the P2 detection layer helps to enhance the keypoint feature extraction ability. After further adding the SE attention module, the P, R, mAP50, and mAP50:95 are improved by 3.9, 1.2, 3.8, and 4.1 percentage points, respectively, showing that the attention mechanism significantly promotes feature selection. After adding focal loss individually, the P, R, mAP50, and mAP50:95 are increased by 4.4, 1.5, 4.2, and 4.5 percentage points, respectively. When the improved components are combined in pairs, precision and recall show unstable fluctuations, but the key indicator mAP50 maintains growth. When the P2 detection layer, SE attention module, and focal loss are integrated simultaneously, the final model achieves improvements of 4.8, 2.0, 6.7, and 6.6 percentage points in P, R, mAP50, and mAP50:95, respectively, compared with the original YOLOv8n-Pose, verifying the synergistic gain effects of the combined improvement strategies in enhancing the detection accuracy. Therefore, the improvements are not merely additive but multiplicative, as each component resolves a specific weakness that would otherwise limit the others’ effectiveness.
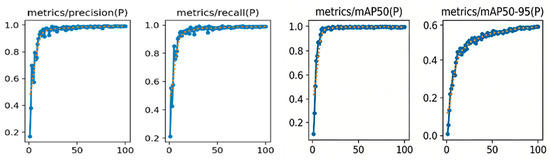
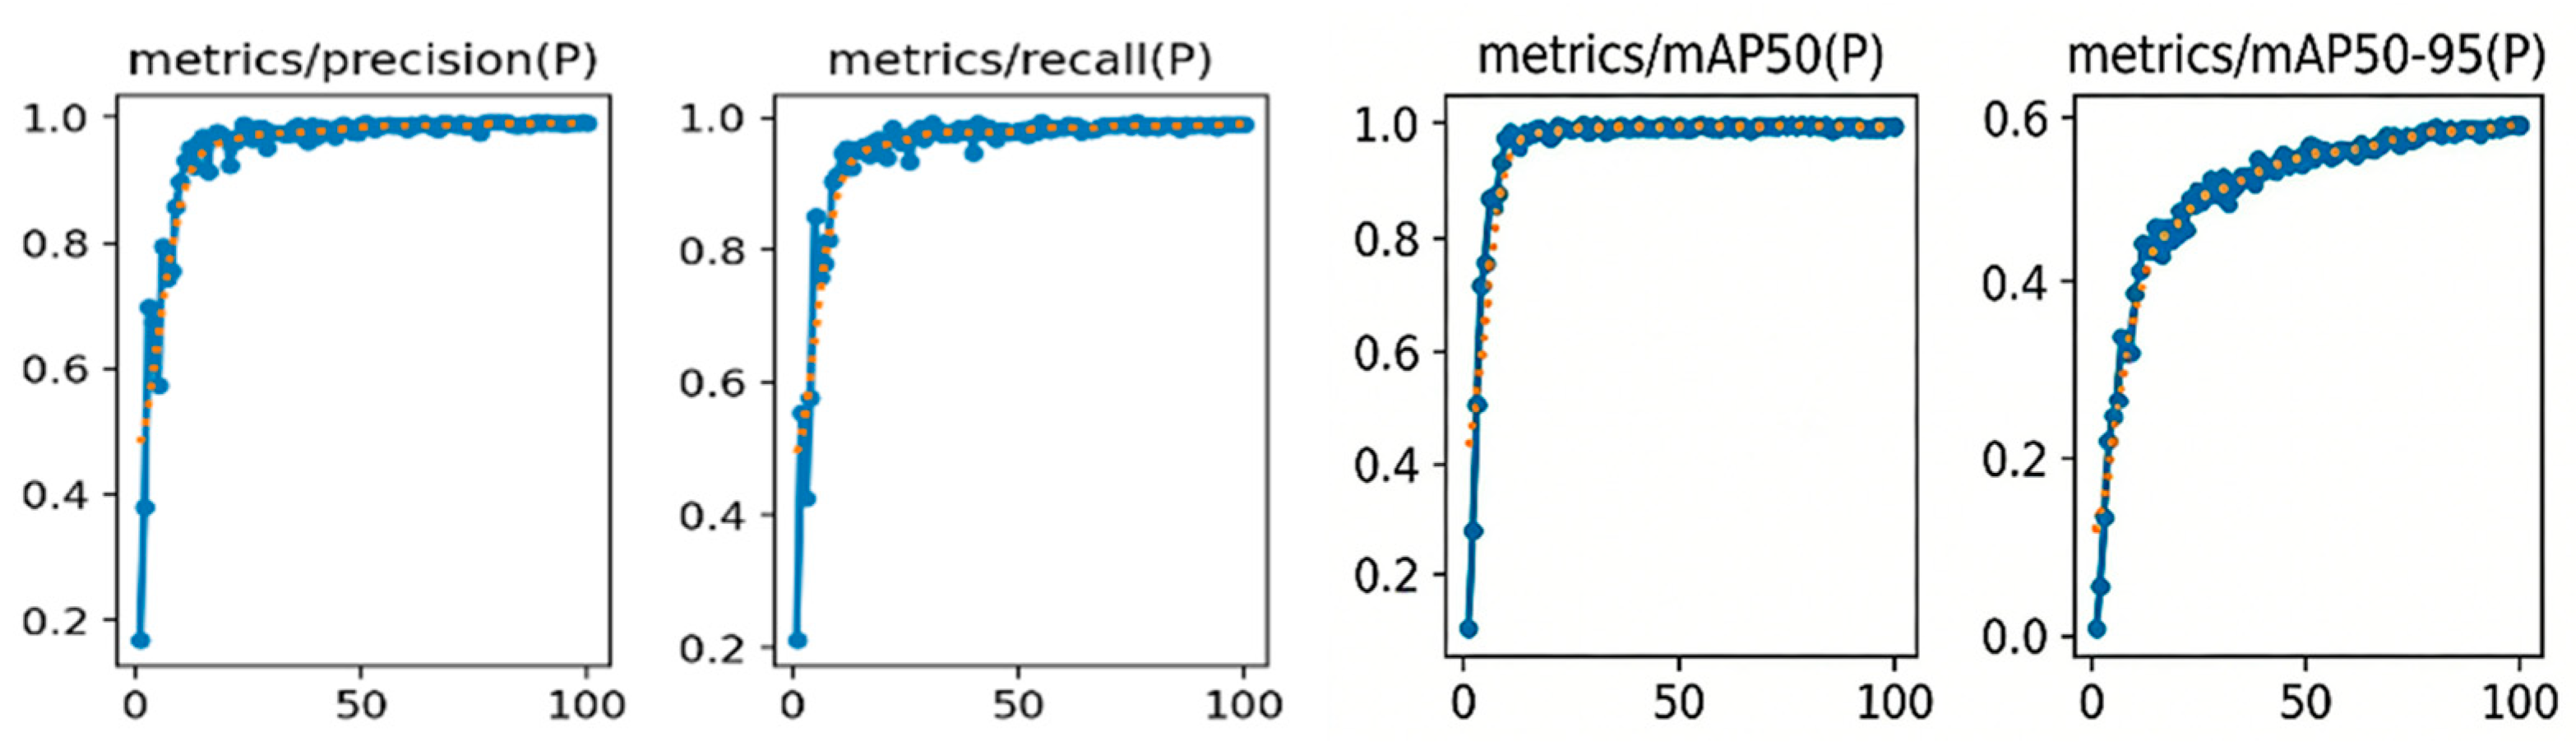
Figure 13 shows the curves of the precision (P), recall (R), mAP50, and mAP50:95 of the improved final model, varying with the training epochs. It can be seen from the curves that the improved model converges rapidly and achieves significant detection performance.
Figure 13.
Growth curves of each parameter with training epochs.
6.5. Generalization Verification Experiment
To verify the generalization ability of the model, validation was carried out on the Drive&Act driver action recognition dataset, which was released by Fraunhofer IOSB and is specifically designed for driver action recognition during vehicle driving. The dataset includes 3D skeletons and frame-level hierarchical annotations of 9.6 million frames captured from six different viewpoints and three modalities (RGB). Illustrations of the distracted driving categories in the dataset are shown in Figure 14.
Figure 14.
Illustrations of different distraction behaviors.
Comparative experiments on four models (HRNet, OpenPose, YOLOv11s-Pose, and YOLOv8n-Pose) were conducted on this dataset, and the experimental results are shown in Table 5. The results show that the mAP of the basic model used in this paper is 4.3, 2.5, and 0.8 percentage points higher than those of HRNet, OpenPose, and YOLOv11s-Pose, respectively, with a relatively smaller number of parameters. Its comprehensive performance is better than that of the other three models and algorithms, which further verifies the cross-architecture applicability and generalization ability of the proposed strategy.
Table 5.
Comparative test results of different models on Drive&Act.
In addition, to verify the generalization ability of the proposed improvement in other algorithms, different versions of YOLO for pose estimation were also used for comparison, and the experimental results are shown in Table 6. The results show that the improved strategy proposed in this paper not only performs excellently in the v8 version but also exhibits good adaptability in the YOLOv10 and YOLOv26 algorithms, further verifying its generalization ability.
Table 6.
Generalization verification experiment on the improved strategy.
According to the above comparative results for the improved strategy, it can be seen that the proposed improved algorithm still achieves satisfactory performance in different scenarios and has a good generalization ability.
6.6. Behavior Recognition Results
In this study, the optimized YOLOv8n-PSF-Pose model was used to analyze poses in distracted driving scenarios and accurately extract two-dimensional position information for human keypoints. Based on the obtained coordinate data, multi-dimensional features such as angle parameters, point distances, and the detection integrity were further derived to systematically characterize the pose differences of various distracted actions. The sample library constructed using this method contains 1285 records covering six typical distracted behaviors, and all features are stored in CSV format.
To verify the applicability of the BP network in this task, its performance was compared with that of classical algorithms including SVM, RF, LSTM, BiLSTM, GRU, BiGRU, and Transformer under the same dataset and feature inputs. The relevant experimental results are summarized in Table 7, which shows the test performance of each model in the distracted driving behavior recognition scenario.
Table 7.
Comparative test results of different models.
According to the experimental results in Table 7, the comprehensive performance of the BP neural network in the six-class driving behavior recognition task is superior to that of the support vector machine (SVM), random forest (RF), LSTM, BiLSTM, GRU, BiGRU, and Transformer models. Specifically, the F1-score of the BP model is 6.5, 5.3, 5.5, 7.6, 17.2, and 1.8 percentage points higher than those of the SVM, RF, BiLSTM, GRU, BiGRU, and Transformer models, respectively, showing its significant advantage in terms of classification accuracy.
Compared with the LSTM model, the F1-score of the BP neural network is 0.1 percentage point lower, but the computation time is 9.3 milliseconds faster. Although LSTM has certain advantages in capturing temporal information when processing sequential data, the classification task in this study is mainly based on keypoint features extracted from single-frame images, which fails to fully exploit the temporal dependencies between consecutive frames. Therefore, the potential of the LSTM model is not effectively exploited, and its computational response speed is far inferior to that of the BP neural network. Meanwhile, LSTM usually incurs higher computational costs in both training and inference, with much higher complexity than the BP network, resulting in stricter requirements for subsequent hardware deployment.
By analyzing the FPS data, it can be found that the BP neural network achieves the best balance between accuracy and speed. Its FPS reaches 45, which is significantly higher than those of all recurrent neural network (RNN) variants (LSTM: 28, BiLSTM: 22, GRU: 35, BiGRU: 30) and the Transformer model (25). Although the GRU and its bidirectional variant (BiGRU) are lighter than LSTM in design, their FPS advantage in this task does not translate into higher classification accuracy (F1-score). In contrast, the BP network, with its simple feedforward structure, achieves the highest classification accuracy (F1-score: 97.7%) and the leading processing speed.
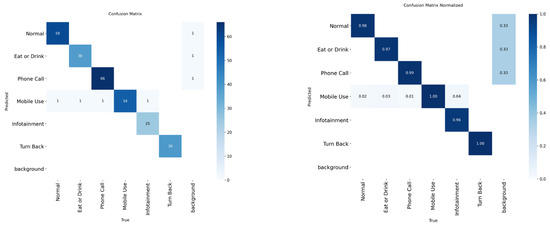
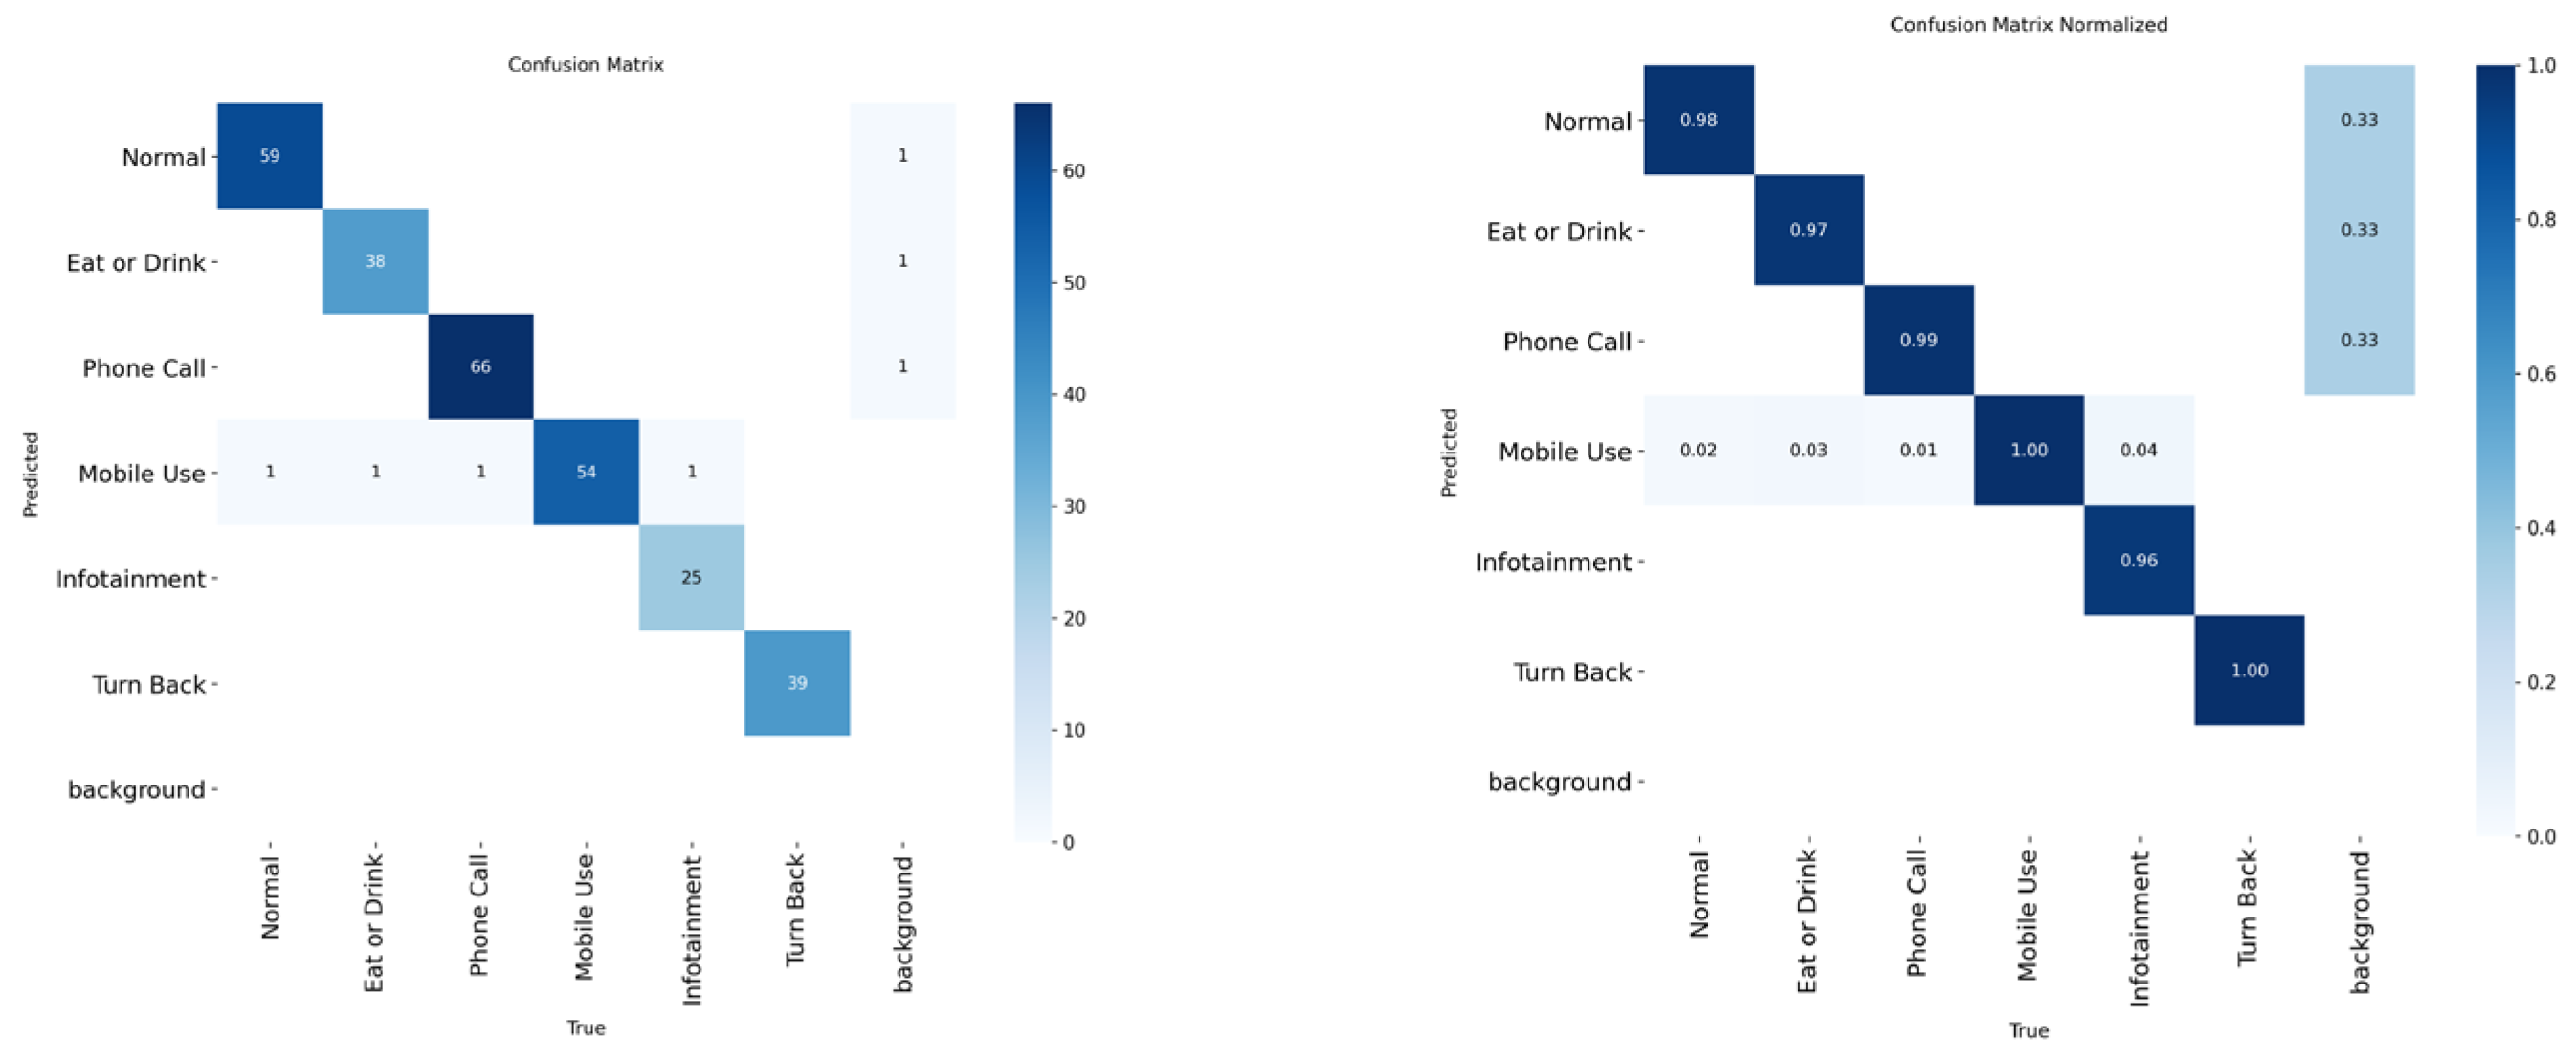
Figure 15 shows the ordinary confusion matrix and normalized confusion matrix of the BP neural network classification model. The values on the diagonal are generally high, with only a small number of misjudgments between Eat or Drink and Phone Call. Overall, the classification accuracy is high and the recognition effect is obvious.
Figure 15.
Confusion matrix diagram.
Therefore, when comprehensively considering the classification accuracy, model computational complexity, and real-time requirements of the system, the BP neural network achieves a better balance between accuracy and efficiency in the driving behavior recognition task in this study. The results show that BP not only performs excellently in time series prediction tasks but also exhibits strong practicability and application potential in behavior classification scenarios based on feature sequences.
7. Conclusions
In this study, aiming at the challenge of real-time distracted driving behavior recognition in complex cockpit environments, a lightweight solution based on the improved YOLOv8n-Pose model and multi-feature fusion is proposed. Through systematic experimental verification and analysis, we draw the following conclusions, which not only validate the effectiveness of the proposed method but also provide clear evidence for its theoretical contribution and practical deployment feasibility.
This work goes beyond the simple application of existing models and proposes a collaborative improvement strategy for resource-constrained real-time systems. We clarify how to systematically solve the core problems in cockpit pose estimation, such as small targets, illumination variations, and keypoint class imbalance, by introducing high-resolution shallow features (P2 layer), channel attention recalibration (SE module), and a loss function for imbalanced data (focal loss). This research deepens the understanding of the effective fusion of spatial details and semantic information in lightweight networks and provides a reproducible architecture improvement paradigm for achieving high-precision real-time pose estimation on embedded platforms.
Experiments show that the multi-dimensional feature vector constructed from accurate keypoints (fusing joint angles, relative distances, and the number of valid points) can provide a more discriminative representation space for behavior recognition in terms of geometric relationships and spatial distribution. This effectively distinguishes behaviors with similar hand movements but different intentions (e.g., drinking water and operating a mobile phone). Furthermore, we verify the inherent advantages of the BP neural network in processing such structured feature sequences: its simple feedforward structure achieves the highest classification accuracy (F1-score: 97.7%) while obtaining a processing speed far exceeding those of complex temporal models (e.g., LSTM, Transformer). This demonstrates that, for tasks with clear specific patterns and complete feature design, a well-designed lightweight feedforward network may offer a better efficiency–accuracy trade-off than complex recurrent or attention-based architectures.
The current work is mainly based on single-frame image analysis. In the future, temporal modeling will be introduced to recognize more continuous distracting actions (such as turning around for a long time). Meanwhile, we will further explore the generalization ability of the model under a wider range of lighting conditions and occupant body types and study the feasibility of full quantization deployment on more edge devices.
In summary, through the organic combination of algorithm improvement, feature engineering, and lightweight classification, this study provides a complete solution with both theoretical innovation and engineering practicality for the real-time and accurate recognition of distracted driving behaviors.
Author Contributions
Z.L. proposed the idea and participated in the preparation of the program. D.G. and M.S. provided part of the code for the process and wrote the manuscript. Z.W., G.C. and Y.S. participated in data collection and dataset construction. All authors have read and agreed to the published version of the manuscript.
Funding
This work was supported in part by the Key Research and Development Program of Xinjiang Uygur Autonomous Region, “Research, Development and Demonstration of Expressway Intelligent Operation Integrated Information Management Platform” (No. 2022B01004), and in part by the Open Project of the National Engineering Research Center for Road Traffic Safety Control Technology (No. 2026DYZX003).
Institutional Review Board Statement
Not applicable.
Informed Consent Statement
Written informed consent has been obtained from the authors to publish this paper.
Data Availability Statement
All codes, data, and materials included in this research are available upon request from the corresponding author.
Acknowledgments
The authors thank their colleagues from Xinjiang University, the Xinjiang Transportation Science Research Institute Co., Ltd., and the Key Laboratory of Transport Industry of Highway Engineering Technology in Arid Desert Areas. The authors would also like to thank the anonymous reviewers of this article for their constructive comments and suggestions.
Conflicts of Interest
Zhenxun Wei and Guoliang Chen were employed by the company Xinjiang Transportation Science Research Institute Co., Ltd. The remaining authors declare that the research was conducted in the absence of any commercial or financial relationships that could be construed as a potential conflict of interest.
References
- World Health Organization. Global Status Report on Road Safety 2023; WHO Press: Geneva, Switzerland, 2023. [Google Scholar]
- Ge, H.; Ouyang, N.; Wu, P. GCT-Net: Driver’s Distracted Driving Recognition Model Via SpatialMulti-layer Graph Convolution and Segmented Temporal TransformerNetwork. Comput. Eng. Appl. 2026, 62, 152. [Google Scholar]
- He, Y.; Lu, M.; Gao, S.; Cao, B.; Li, J. Distracted Behavior Detection of Commercial Vehicle Drivers Based on the MobileViT-CA Model. China J. Highw. Transp. 2024, 37, 194–204. [Google Scholar] [CrossRef]
- Wu, S. Research on Driver State Recognition Based on Facial Expressions and Distracted Behavior. Ph.D. Thesis, Guangdong University of Technology, Guangzhou, China, 2024. [Google Scholar]
- Li, P.; Yang, Y.; Grosu, R.; Wang, G.; Li, R.; Wu, Y.; Huang, Z. Driver Distraction Detection Using Octave-Like Convolutional Neural Network. In IEEE Transactions on Intelligent Transportation Systems; IEEE: Piscataway, NJ, USA, 2022; Volume 23, pp. 8823–8833. [Google Scholar] [CrossRef] [Scilit]
- Shi, L.X.; Zhang, Y.H.; Liu, H.X.; Jin, Y.; Gao, X. Lightweight Driver Distraction Behavior Recognition Method Based on Improved YOLOv8n. Electron. Des. Eng. 2025, 33, 182–187. [Google Scholar]
- Shahverdy, M.; Fathy, M.; Berangi, R.; Sabokrou, M. Driver behavior detection and classification using deep convolutional neural networks. Expert Syst. Appl. 2020, 149, 113240. [Google Scholar] [CrossRef] [Scilit]
- Kothuri, S.R.; Sujay, V.; Juyal, P.; Bhuvaneshwari, R. Hybrid CNN-LSTM Machine Learning Algorithm for Driver Distraction Detection. In 2024 International Conference on Integrated Circuits and Communication Systems (ICICACS); IEEE: Piscataway, NJ, USA, 2024; pp. 1–5. [Google Scholar] [CrossRef] [Scilit]
- Cao, Z.; Hidalgo, G.; Simon, T.; Wei, S.-E.; Sheikh, Y. OpenPose: Realtime multi-person 2D pose estimation using Part Affinity Fields. IEEE Trans. Pattern Anal. Mach. Intell. 2019, 41, 172–186. [Google Scholar] [CrossRef] [Scilit]
- Yoon, J.-h.; Kwon, S.-k. Robust Human Pose Estimation Method for Body-to-Body Occlusion Using RGB-D Fusion Neural Network. Appl. Sci. 2025, 15, 8746. [Google Scholar] [CrossRef] [Scilit]
- Du, K. Research and Application of In-Vehicle Driver State Monitoring Camera System. Ph.D. Thesis, Tianjin University of Science and Technology, Tianjin, China, 2021. [Google Scholar]
- Sun, K.; Xiao, B.; Liu, D.; Wang, J. HRNet: Deep high-resolution representation learning for human pose estimation. In Proceedings of the IEEE/CVF Conference on Computer Vision and Pattern Recognition (CVPR), Denver, CO, USA, 11–15 June 2019; pp. 5693–5703. [Google Scholar]
- Wang, H.Y.; Tian, A.A.; Zhang, D. Fatigue Driving Detection of Train Drivers Based on Multi-Feature Fusion. J. Comput. Appl. Softw. 2026, 1–10, online published. Available online: https://link.cnki.net/urlid/31.1260.tp.20260205.1351.004 (accessed on 2 March 2026).
- Wang, C.; Wei, Y.; Guo, D.; Gong, J. Human behavior recognition under occlusion based on two-stream network combined with BiLSTM. In 2020 Chinese Control and Decision Conference (CCDC); IEEE: Piscataway, NJ, USA, 2020; pp. 3311–3316. [Google Scholar] [CrossRef] [Scilit]
- Redmon, J.; Farhadi, A. YOLOv3: An incremental improvement. arXiv 2018, arXiv:1804.02767. [Google Scholar] [CrossRef] [Scilit]
- Esmail, M.A.; Wang, J.; Wang, Y.; Sun, L.; Zhu, G.; Zhang, G. Resource-aware strategies for real-time multi-person pose estimation. Image Vis. Comput. 2025, 155, 105441. [Google Scholar] [CrossRef] [Scilit]
- Chen, Y.; Shen, J.; Wang, J.; Zhang, D.; Hu, Z. Research on HRNet high-resolution remote sensing image photovoltaic segmentation combined with attention mechanism. J. Hangzhou Norm. Univ. (Nat. Sci. Ed.) 2025, 24, 610–617+663. [Google Scholar] [CrossRef]
- Tian, X.; Song, L.; Guo, H.; Wang, B. Research on breast cancer image classification technology integrating HRNet modules and deformable attention mechanism. Chin. J. Robot. Surg. 2025, 6, 1454–1460. [Google Scholar]
- Cortes, C.; Vapnik, V. Support-vector networks. Mach. Learn. 1995, 20, 273–297. [Google Scholar] [CrossRef] [Scilit]
- Hou, S.Z.; Tao, J.; Yuan, D.H.; Wu, W.J.; Huai, Y.F. Multi-person pose estimation algorithm based on YOLO-pose in occluded scenes. J. Jianghan Univ. (Nat. Sci. Ed.) 2025, 53, 85–96. [Google Scholar]
- Ma, M.; Ma, H.; Song, H. Small-target pedestrian pose estimation algorithm based on YOLO-Pose in urban street scenes. Comput. Eng. 2024, 50, 177–186. [Google Scholar]
- Breiman, L. Random forests. Mach. Learn. 2001, 45, 5–32. [Google Scholar] [CrossRef] [Scilit]
- Liu, J.; Jiang, Y.H.; Guan, Q. Delay-Tolerant Resource Scheduling for Optical Communication Network Routing Based on Random Forest Regression. Laser J. 2026, 47, 124–130. [Google Scholar]
- Hochreiter, S.; Schmidhuber, J. Long short-term memory. Neural Comput. 1997, 9, 1735–1780. [Google Scholar] [CrossRef] [Scilit]
- Xie, Y.J.; Hu, X.F.; Gu, D.M. Identification of Carbon Emission Driving Factors and Multi-Scenario Prediction of Carbon Peak in Jiangxi Province Based on LSTM-XGBoost. Environ. Sci. 2026, 1–16. [Google Scholar] [CrossRef]
- Wu, X.; Yang, H. Research on two-stage optimized temperature prediction algorithm based on LSTM. Inf. Technol. Informatiz. 2025, 8–11. Available online: https://kns.cnki.net/kcms2/article/abstract?v=QLLcG2LOr2oZgErn3dX2ev_iTvDM6QHi5FiKnW884YlKQuO2ZynuBeXXEcOkWJ-C_sHqV7DErgdM97BQWXwBb9j83ieB6c6r-u3KbG-Ei1em58sy30BT-1aTmo693ardxLj2BSmZbsIBajbxxFj9WQzYVH7Xptl_Y4FUE4yvhZnZWHW2o3DqKw==&uniplatform=NZKPT&language=CHS (accessed on 2 March 2026).
- Dong, M.; Zhang, Y. Application of wavelet-LSTM neural network model in settlement monitoring time series prediction. Geomat. Spat. Inf. Technol. 2025, 48, 157–159. [Google Scholar]
- Zhou, M.; Zhao, Y.; Han, X.; Huang, J.; Wang, G. Underwater sound velocity prediction based on Bi-LSTM-MLP. Mach. Electron. 2025, 43, 8–14. [Google Scholar]
- Wang, X.; Xu, R.; Zhang, S.; Zhuang, Y.; Wang, Y. Driver distraction detection based on vehicle dynamics using naturalistic driving data. Transp. Res. Part C Emerg. Technol. 2022, 136, 103561. [Google Scholar] [CrossRef] [Scilit]
- Schuster, M.; Paliwal, K.K. Bidirectional recurrent neural networks. IEEE Trans. Signal Process. 1997, 45, 2673–2681. [Google Scholar] [CrossRef] [Scilit]
- Yang, J.; Wang, Z.X.; Xu, Y.C. Battery State Prediction Model Based on Ampere-Hour Integration and Bidirectional Recurrent Neural Network. Battery Ind. 2026, 1–6. Available online: https://link.cnki.net/urlid/32.1448.TM.20251120.1332.002 (accessed on 2 March 2026).
- Cho, K.; Van Merriënboer, B.; Gulcehre, C.; Bahdanau, D.; Bougares, F.; Schwenk, H.; Bengio, Y. Learning phrase representations using RNN encoder-decoder for statistical machine translation. arXiv 2014, arXiv:1406.1078. [Google Scholar] [CrossRef] [Scilit]
- Chung, J.; Gulcehre, C.; Cho, K.H.; Bengio, Y. Empirical evaluation of gated recurrent neural networks on sequence modeling. In Proceedings of the NIPS 2014 Workshop on Deep Learning, 2014, Montreal, QC, Canada, 12–13 December 2014. [Google Scholar]
- Vaswani, A.; Shazeer, N.; Parmar, N.; Uszkoreit, J.; Jones, L.; Gomez, A.N.; Kaiser, L.; Polosukhin, I. Attention is all you need. In Proceedings of the Advances in Neural Information Processing Systems (NIPS 2017), Long Beach, CA, USA, 4–9 December 2017; pp. 5998–6008. [Google Scholar]



Disclaimer/Publisher’s Note: The statements, opinions and data contained in all publications are solely those of the individual author(s) and contributor(s) and not of MDPI and/or the editor(s). MDPI and/or the editor(s) disclaim responsibility for any injury to people or property resulting from any ideas, methods, instructions or products referred to in the content. |
© 2026 by the authors. Licensee MDPI, Basel, Switzerland. This article is an open access article distributed under the terms and conditions of the Creative Commons Attribution (CC BY) license.