


Abstract
Major Depressive Disorder (MDD) is a significant global health burden that contributes to disability and reduced quality of life. Its impact extends beyond individuals, placing emotional, social, and economic strain on families and healthcare systems worldwide. Despite its prevalence, MDD remains widely misunderstood, with limited mental health literacy and persistent stigma often preventing individuals from seeking help. This research explored the prediction of MDD utilising social media data via Natural Language Processing (NLP), Machine Learning (ML), and explainable Machine Learning (xML) techniques. The research aimed at identifying depressive indicators on X (formerly Twitter) and developing interpretable models for depression risk detection. The study’s methodology followed the Cross-Industry Standard Process for Data Mining (CRISP-DM) framework to ensure a systematic approach to data analysis. Data was collected via X’s API and processed using regex-based noise removal, normalisation, tokenisation, and lemmatisation. Symptoms were mapped to DSM-5-TR criteria at the post-level, with user-level MDD risk assessed based on symptom persistence over a two-week period. Risk levels were classified as No Risk, Monitor, and High Risk to facilitate early intervention. Six ML models were trained and tested, while the Synthetic Minority Over-sampling Technique (SMOTE) was applied to mitigate class imbalance. The dataset was partitioned into training and testing sets using an 80:20 split. ML models were evaluated, and the Extreme Gradient Boosting model outperformed the others. Extreme Gradient Boosting achieved an accuracy of 0.979, F1-score of 0.970, and ROC-AUC of 0.996, surpassing benchmark results reported in prior studies. Explainability techniques, such as LIME and tree-based feature importance, enhance model transparency and clinical interpretability. Depressed mood consistently emerged as the highest-weighted predictor across different models. The findings highlight the value of aligning ML models with validated diagnostic frameworks to improve trustworthiness and reduce false positives. Future research can expand beyond text-based analysis by incorporating multimodal features to broaden diagnostic depth.
1. Introduction
Depression is clinically known as Major Depressive Disorder (MDD) and is a mental health condition that is characterised by a consistently low mood and diminished interest in normally enjoyable activities [1]. The 2021 WHO report shows that high-income countries (HIC) have approximately 60 mental health practitioners per 100,000 people, compared to just 2 per 100,000 people in low-income countries [2]. Barriers such as stigma, financial constraints, and cultural differences delay intervention. These challenges have contributed to projections that MDD will become the leading global disease burden by 2031 [3]. Approximately 332 million individuals are affected by MDD worldwide. Globally, women are about 1.5 times more likely to experience MDD than men [4]. This variation is thought to arise from differences in hormones, childbirth effects, and different psychosocial stressors [5]. The common symptoms of MDD during a period of two weeks include fatigue, low mood, feeling worthless, and psychomotor agitation. In addition, individuals may present with concentration difficulties, cognitive delays, sleep disturbances, and recurrent thoughts of self-harm or suicide [1,6]. Despite MDD having an impact on the healthcare system and the individuals affected by MDD, it remains underfunded [1,7]. Across countries, the median proportion of government health expenditure allocated to mental health is 2.1% [1].
Advances in Artificial Intelligence (AI), such as Machine Learning (ML) and Natural Language Processing (NLP), have improved the early detection of MDD [6]. NLP is a field within AI that focuses on handling human language to extract valuable insights, and can be used to detect MDD in social media posts. NLP techniques such as sentiment analysis and word embeddings like Word2Vec and GloVe are widely used to identify depressive language patterns [8]. These advancements enable ML models such as Decision Trees (DT), Naïve Bayes (NB), Random Forest (RF), K Nearest Neighbours (KNN), and Support Vector Machines (SVM) to more effectively detect depressive content in social media data [9]. These models analyse linguistic features and behavioural patterns to detect signs of MDD [6]. Although these ML models improve detection accuracy, they often act as ‘black-box,’ making their predictions difficult to interpret. To address this, explainable ML (xML) techniques, such as Local Interpretable Model-agnostic Explanations (LIME) and feature importance, are used for interpretation [10]. There are approximately five billion individuals who are actively using social media worldwide, and this makes these platforms a valuable source of data for analysing MDD symptoms [11]. X (formerly Twitter) stands out as a platform where users frequently express their emotions through short posts. Hashtags and trending topics facilitate the identification of prevalent emotional patterns. Individuals who are undergoing depressive episodes may show distinct posting behaviour and habits [10]. Researchers can leverage these patterns to predict MDD risk from social media posts.
Contribution of the Study
MDD represents a significant worldwide health challenge that frequently goes underdiagnosed due to stigma, cultural and social influences, economic limitations, and language barriers [12]. In other instances, the precise identification of MDD is further complicated by the limited availability of mental health services, such as psychiatrists [10]. Standard clinical diagnostic tools such as the Patient Health Questionnaire-9 (PHQ-9) [13], Beck Depression Inventory-II (BDI-II) [14], Centres for Epidemiologic Studies Depression Scale-Revised (CESD-R) [15], and Diagnostic and Statistical Manual of Mental Disorders (DSM-5-TR) Fifth Edition [1,15] largely rely on self-reported symptoms. This dependence on self-reported symptoms brings about a degree of subjectivity and potential inaccuracies, which may be caused by memory distortions and cultural beliefs [16]. Over and above the tools, the most widely used method to diagnose MDD is through a mental status examination, which must be conducted by a health practitioner or clinician [5]. These assessments can be time-consuming and costly. Laboratory-based methods provide an objective perspective by offering biological insights into MDD’s underlying mechanisms. However, their high cost and individual variability reduce their practicality and clinical relevance, especially in LIC [17]. Common blood tests include haemoglobin (Hb) to detect anaemia, which can contribute to MDD symptoms, and thyroid levels to assess hypothyroidism. Biomarkers such as cortisol are also studied for their association with MDD [18]. Inflammatory markers [19], Brain-Derived Neurotrophic Factor (BDNF) [20], and C-Reactive Protein (CRP) markers [19] are influenced by external factors such as stress, lifestyle, and medication, which compromise their reliability [20].
Studies have recognised ML models as promising approaches for early detection of MDD and could serve as complementary assets in mental health services [9,21]. ML models provide the benefit of analysing large-scale data from social media. This enables the quicker and more efficient identification of depressive indicators beyond what individuals might recall and share. This contrasts with clinical interviews and self-assessment forms, which can be lengthy and prone to personal bias. Although ML techniques mitigate certain shortcomings of conventional approaches, many existing studies still rely on binary classification based on overt statements such as “I feel depressed”. This often misses other behavioural cues that are crucial for accurate diagnosis [21]. ML models can show how accurately MDD is predicted, but they do not explain the reasoning behind their decisions. Incorporating xML models enhances transparency [10]. The use of both NLP, ML, and xML offers potential to bridge this gap by enabling interpretable and inclusive models capable of capturing indirect or implicit expressions of MDD [10]. Future research should develop interpretable ML and NLP models that detect both overt and subtle MDD signs from diverse social media data. Efforts should focus on improving model sensitivity and transparency, going beyond current clinical and predictive methods. Therefore, this study aims to detect MDD indicators from social media data using NLP, ML, and xML techniques, which are aligned with clinical standards to support early identification and awareness of MDD symptoms. To achieve this, this study seeks to accomplish the following objectives:
- To analyse depressive signs on X social media platform through NLP methods.
- To develop and implement NLP, ML, and xML techniques to detect MDD using X data.
- To evaluate the performance of ML models in detecting MDD using social media data.
2. Literature Review
MDD has been defined by numerous organisations and research studies, establishing a framework for comprehension, evaluation, and intervention. Building upon these definitions, previous research has investigated techniques for identifying MDD, ranging from clinical evaluations to AI-based methods. The WHO defined MDD as a widespread illness that negatively affects how individuals feel and behave [4]. In line with the DSM-5-TR, a formal diagnosis of MDD requires the presence of at least five symptoms occurring during the same two-week period. Amongst these symptoms, one should be depressed mood or anhedonia [1]. The DSM-5 framework was released in May 2013, followed by the publication of the DSM-5-TR (Text Revision) in March 2022 [15]. The DSM-5 was adopted in 2015 by the College of Psychiatrists under the Colleges of Medicine of South Africa (CMSA). The CMSA mandated its use in psychiatric examinations and clinical assessments to promote standardisation and improve diagnostic accuracy [22].
MDD affects over 332 million people globally [4], and cases increased by almost 50% between 1992 and 2022 [22]. The WHO further reports that 5.7% of adults worldwide live with MDD, with prevalence higher among women (6.9%) than men (4.6%) and highest in older adults aged 70+ (5.9%) [4]. A study spanning 18 countries found that MDD episodes had an average lifetime occurrence of 14.6% and a twelve-month occurrence of 5.5% in HIC [23]. A study conducted across 29 countries with a focus on 528,293 children and adolescents between 1989 and 2022 found that 21.3% experienced mild to severe symptoms of MDD [24]. The Moderate to severe MDD symptoms were experienced by 18.9% of the population. About 3.7% of adolescents were found to be affected by MDD [24]. Patients from HIC are more likely to receive free care when compared to those in LIC. A significant proportion of patients in LIC bear the full cost of care [23]. Between 2019 and 2021, the global prevalence rate increased by approximately 11%. The disability-adjusted life year rate climbed from 600.52 per 100,000 people in 1990 to 681.14 per 100,000 in 2021 [25]. Recurrences following an initial depressive episode are a major concern, with estimates suggesting that as many as 75–90% of individuals may experience repeated episodes over their lifetime [26]. Up to 75% of people with mental health problems globally receive no help, rising to 76–85% in low-income countries [14]. A study by [6] indicated that MDD is the cause of approximately 800,000 suicides each year.
2.1. Symptoms and Clinical Indicators
MDD comprises a variety of symptoms that are spread across emotional, cognitive, physical, and behavioural domains. Different authorities emphasise these features to varying degrees. While the DSM-5-TR provides standardised diagnostic criteria, other organisations, such as the WHO, describe MDD in slightly broader terms, which account for clinical diversity and global applicability. When comparing MDD symptoms across DSM-5-TR and WHO in [2] criteria, overlapping domains emerge, accompanied by nuanced distinctions. Both frameworks recognise mood disturbances, with DSM-5-TR describing a depressed mood nearly every day, while WHO emphasises persistent sadness. Appetite changes, suicidal ideation, sleep disruptions, loss of interest, feelings of guilt, and fatigue are captured in both. Psychomotor disturbances are included in DSM-5-TR but not mentioned by WHO. Physical or somatic symptoms are acknowledged in both the DSM-5-TR, which treats them as peripheral, whereas the WHO includes them more centrally [1,4].
2.2. Diagnostic and Screening Criteria
Depression cannot be identified merely from an individual’s expression of unpleasant emotions on a single post. Clinical and research frameworks emphasise that a formal diagnosis requires a structured assessment according to established criteria. The DSM-5-TR and ICD-11 require at least two weeks of symptoms, with the DSM-5-TR specifying that five out of nine criteria must be met, including a core symptom. The ICD-11 requires one core symptom, plus two additional symptoms. Screening instruments like PHQ-9, (PHQ-2), BDI-II, the Hamilton Depression Rating Scale (HAM-D), and CESD-R vary in item count and scoring thresholds, but all reflect symptom severity over one to two weeks. The PHQ-9 is widely used due to its brevity and alignment with DSM-5-TR criteria [27]. The BDI assesses cognitive, emotional, and somatic domains and is effective for longitudinal monitoring, but its complexity and self-report format pose challenges [28]. The CESD-R offers scalable symptom assessment [29], yet its cross-cultural validity has been questioned [19]. The DSM-5-TR remains the diagnostic gold standard, though concerns persist regarding cultural limitations [1].
Laboratory methods for assessing MDD focus on biological markers that reflect symptom presence. Inflammatory markers such as Interleukin-6 (IL-6) and C-reactive protein (CRP) are commonly measured, as elevated levels indicate systemic inflammation that disrupts brain function and neurotransmission [19]. Cortisol testing, which is indicative of HPA axis dysregulation, is frequently used but is limited by external factors such as stress and medication [18]. Brain-derived neurotrophic factor (BDNF), which supports neuroplasticity, offers therapeutic insight but is similarly affected by behavioural factors. CRP, developed for treatment-resistant cases, helps guide personalised care but is confounded by comorbid conditions [30]. While these biomarkers deepen understanding of MDD’s molecular basis, their diagnostic reliability is constrained by individual factors. Accessibility in LIC underscores the need for scalable detection methods.
2.3. Depression Detection in the Digital Age
Social media has become a vital platform for individuals to express their opinions and reflect on their emotional well-being. Research based on psycho-linguistic theory shows that everyday language reflects inner thoughts and emotions [31]. The 2025 Statista research found that on average, users spend 141 min daily on social media [32]. With approximately five billion active social media users globally, platforms like X serve as valuable sources of data [11]. People with MDD tend to use more first-person pronouns and negative affective terms, reflecting heightened self-focus, rumination, and low mood [33]. Linguistic and behavioural cues on social media can signal mental distress, but a formal diagnosis of MDD requires meeting the full criteria outlined in validated tools.
For social media-based detection to be clinically relevant, indicators must encompass the full spectrum of MDD symptoms, while addressing key ethical concerns, including user privacy and potential data misinterpretation. Social media users may not be aware that their data is being analysed or used for research purposes. This highlights the necessity of implementing stringent data protection measures [34]. Algorithmic bias is also a concern, as ML models trained on small or unrepresentative datasets may misclassify individuals or disproportionately affect certain groups. These risks highlight the importance of models serving as supportive tools rather than standalone diagnostic systems, with clinical validation remaining crucial [34].
2.4. Application of AI in Predicting Depression Using Social Media Data
AI refers to computer systems designed to simulate human intelligence in tasks like learning, reasoning, and decision-making. Among its key branches, ML, NLP, and explainable AI are particularly relevant to depression prediction through social media platforms.
2.4.1. Natural Language Processing
NLP is a branch of AI that enables computers to interpret and interact using human language. It plays a role in identifying signs of MDD through social media use. NLP involves transforming unstructured language into structured formats that machines can analyse. Features such as word choice, sentiment, and distinct posting habits provide valuable signals for MDD prediction. NLP analyses social media posts by examining how people use language, revealing potential signs of MDD [10]. Early methods, such as the bag-of-words approach and Term Frequency-Inverse Document Frequency (TF-IDF), focus on counting word occurrences and their relative importance in posts. Techniques such as Word2Vec and GloVe generate word embeddings that represent words as vectors based on their surrounding context. Data preprocessing steps, including tokenisation and stemming, prepare text for NLP techniques like sentiment analysis, which enable the detection of subtle linguistic and behavioural indicators of MDD for large-scale monitoring [35].
2.4.2. Explainable Machine Learning (xML)
ML is a branch of AI that enables automated depression detection by recognising patterns in data. Traditional ML models commonly include RF, LR, KNN, DT, NB, and SVM [9,35]. These models analyse linguistic features, user interactions, and behavioural patterns to detect signs of MDD, each with its own strengths and weaknesses [6]. The LR model is simple, interpretable, and effective for binary tasks; however, its linear assumptions limit its performance on complex data [36]. DTs are easy to visualise and trace but tend to overfit noisy social media posts [37]. The RF model overcomes DT limitations by aggregating many trees to boost accuracy and stability, though at the expense of interpretability and higher computation [36]. The SVM model handles high-dimensional text features well and captures nonlinear patterns using kernels, but requires careful tuning and does not scale efficiently [38]. KNN is intuitive and similarity-based, but it becomes slow at prediction, and it is sensitive to noise [39]. The NB model is efficient in text classification and performs well on smaller datasets by assuming word independence. However, this assumption limits its ability to capture word dependencies in natural language [40]. The Extreme Gradient Boosting (XGBoost) model offers strong predictive power by iteratively correcting errors and handling diverse features; however, it requires extensive tuning and risks overfitting without proper regularisation [37]. Explainable ML makes models more transparent by revealing how decisions are reached. In MDD detection on social media, xML tackles the “black box” problem, which is often linked with ML models. The xML provides insights into both model behaviour and the underlying indicators of depression. Techniques such as LIME models are widely used to highlight the relative importance of words in classification tasks [38,39]. This level of interpretability is valuable in mental health research, where trust, accountability, and ethical use of AI are essential.
Notably, different studies have applied ML techniques to predict MDD in social media, combining NLP, ML, and xML approaches. Table 1 summarises contributions and gaps. Across the reviewed studies, the common social media platforms that were used are Reddit and X [39,40,41]. Preprocessing typically included tokenisation, stemming, TF-IDF vectorisation, and normalisation [35,42]. Frequently applied models included NB, SVM, RF, XGBoost, and LR, supported by explainability techniques such as LIME and feature importance [38,41]. Evaluation commonly relied on accuracy, precision, recall, F1-score, and the area under the Receiver Operating Characteristic Curve (ROC AUC).
While these studies showed adequate results and achieved accuracies of over 84%, there are still concerns around predicting depression without having an alignment to a validated clinical diagnostic tool. Three persistent gaps were found. Firstly, several studies relied on labels derived from superficial cues such as self-reported diagnoses or keyword-based annotations [35,42,43]. Secondly, numerous models employ binary classification frameworks that do not include the spectrum and severity of depression symptoms. This constrains clinical significance, interpretability, and the potential for early identification [39,40,44]. Thirdly, poor data quality and inadequate preprocessing pipelines introduce noise and bias, which ultimately undermine model performance and the generalisability of the implemented models [45]. These issues raise ethical concerns, inflate prevalence, reduce early intervention opportunities, and compromise model performance and explainability. This research intends to address these gaps by predicting depression at the user level using DSM-5-TR-aligned symptoms. The research adopts a multi-class classification framework and applies careful preprocessing and dataset balancing techniques.
Table 1.
Comparison of related literature.
3. Materials and Methods
Drawing from prior literature, the study’s materials and methods were developed to close gaps in current MDD detection approaches. The study follows the CRISP-DM framework, which directs the practical execution of data collection, analysis, and ML methodologies. This study utilises secondary data, which is acquired from publicly available posts on X. Figure 1 presents the Research Conceptual Framework, illustrating the key research phases from business understanding to deployment.
Figure 1.
Research conceptual framework.
3.1. The CRISP-DM Framework
This study adopted the CRISP-DM, which is a recognised methodology in data science and ML projects [46]. The CRISP-DM offers a systematic, iterative framework that guides the research process from problem definition to model deployment. The framework consists of six phases, as illustrated in Figure 1. These are applied in this study to ensure methodological rigour, reproducibility, and clinical relevance.
3.1.1. Business Understanding
The study goals were translated into a machine learning problem, framing the research objectives from both public health and computational perspectives. As detailed in Section 2, MDD affects over 322 million people worldwide and remains underdiagnosed due to limited access to care and stigma. This study formulated an ML classification task to predict MDD risk categories based on linguistic features extracted from X posts. The classification was grounded in DSM-5-TR criteria to ensure risk categories reflect clinically validated symptoms. Despite existing studies [38,41,42], significant gaps remain in social media-based MDD detection, including reliance on superficial labels, limited binary classification, and poor data quality, which reduce clinical relevance. This research addresses these gaps by predicting MDD at the user level using DSM-5-TR-aligned symptoms, adopting a multi-class classification framework, and applying careful preprocessing and dataset balancing.
3.1.2. Data Understanding
This phase involved collecting and exploring the data from X to assess its structure, quality, and relevance [47].
- (i)
- Data Source Description
The primary data source for this study was Platform X (formerly Twitter). It consists of publicly available posts published by individual users. The platform’s short-text format encourages spontaneous and concise self-expression, making it particularly suitable for capturing emotional states, cognitive patterns, and behavioural changes over time. Platform X was selected as the data source in this study because of its accessibility and richness of user-generated textual content. It also features a public-facing Application Programming Interface (API) that enables researchers to collect user-generated content in an ethical and systematic manner. It has also been used in the past MDD detection studies, which achieved reasonable outputs [43,45].
- (ii)
- Data Collected
An X developer account was created to allow programmatic access to users’ posts. API tokens and keys were used to collect posts along with selected metadata. A clear inclusion criterion-maintained quality and consistency: only original, public posts written in English were included, while reposts were excluded, as they often repeat someone else’s message rather than expressing the user’s own thoughts or emotions, which could dilute the signal of personal mental state. For each user, only the latest 16 posts spanning at least two weeks were included, ensuring posts reflect behaviour over time rather than a short period. Only limited metadata was retrieved for each post, including timestamp, user handle, and post text.
- (iii)
- Dataset Construction
Two datasets were constructed from this process. The first contained posts in which each user exhibited at least two depressive symptoms, following the guideline that symptoms must persist for a minimum of two weeks to meet diagnostic criteria [1]. Depressive symptoms were identified using a DSM-5-TR keyword dictionary, where each symptom category (e.g., depressed mood, loss of interest, sleep disturbance) was represented by clinically relevant keywords. Posts containing terms matching the dictionary were flagged, enabling systematic identification of users exhibiting multiple symptoms.
The inclusion criteria align with DSM-5-TR, which was chosen for its global recognition [44,48]. Its international relevance is underscored by alignment with the International Classification of Diseases [49]. It has also been formally adopted in South Africa and is recognised by the CMSA as detailed in Section 2. The second dataset included non-depressive content, with one neutral post per user. Dataset collection was automated through Python 3.12.3 scripts that sent API requests, handled rate limits, and stored results in structured CSV files, aligning with CRISP-DM recommendations for systematic data handling to ensure reproducibility. To protect user privacy, all handles were replaced with anonymised codes (e.g., A001, A002), allowing grouping at the user level without exposing identities. The collected data was securely stored with two-factor authentication enabled. No personally identifiable information was retained.
- (iv)
- Data Description
An EDA was performed to examine dataset characteristics and identify irregularities [50]. The EDA included word clouds and descriptive statistics. Descriptive statistics provide insights into the dataset’s structure, variability, and characteristics before modelling. Box plots and summary measures help visualise distributions, detect outliers, and guide preprocessing and modelling decisions [50,51]. The dataset of users showing depressive signs included 330 users, with each user contributing between 2 and 16 posts. On average, users posted about five to six posts in two weeks. The median number of posts was four, and the interquartile range (3–7 posts) showed that most users shared a moderate number of posts. Table 2 below shows the descriptive statistics on X posts.
Table 2.
Descriptive statistics on X posts.
There were 1729 posts with depressive signs in total. These posts had an average length of 153 characters, which ranged from very short posts of 20 characters to much longer ones of up to 979 characters. The median post length was 106 characters, indicating mostly moderate-length posts with some longer outliers. Sentiment analysis using Valence Aware Dictionary and Sentiment Reasoner (VADER) showed an overall negative tendency. The mean sentiment score was −0.22 (SD = 0.54), with a range of −0.99 to 0.98. The median was −0.36, and the interquartile range (−0.68 to 0.19) indicated that most posts leaned toward negativity. The non-depressive dataset included 351 users, each contributing one post. Figure 2 illustrates that most posts were relatively short, with an average length of 107 characters and a median of 85 characters. The shortest post was 19 characters, and the longest was 344, with a right-skewed distribution showing a few highly active users. Sentiment analysis indicated a generally positive trend, with most posts falling between neutral and moderately positive, although a few were strongly negative. In Figure 2 and Figure 3, the circles indicate outlier posts.
Figure 2.
Descriptive statistics on the dataset without depressive symptoms.
Figure 3.
Descriptive statistics on the dataset with depressive symptoms.
Figure 3 shows outliers in post length. These were retained as they reflect genuine user behaviour. Some users were naturally more expressive and wrote longer posts, which was important for maintaining realism in the analysis. Sentiment analysis indicated a generally negative trend, with an average score of −0.35. Most posts fell between neutral and moderately negative sentiment, with a few strongly positive posts.
- (v)
- Extract Word Cloud
Word clouds were generated to visualise the distribution of words in posts with and without depressive indicators. These visualisations serve as a methodological tool to identify patterns in language use, detect irregularities, and inform feature selection for subsequent modelling [10]. Figure 4 illustrates the word cloud for posts with depressive indicators.
Figure 4.
Word Cloud of The Dataset with Depressive Symptoms.
Frequently occurring words such as sad, depression, and cry indicate terms with emotional significance, guiding preprocessing, feature engineering, and context-aware analysis. Figure 5 shows the word cloud for posts without depressive indicators.
Figure 5.
Word cloud of the dataset without depressive symptoms.
3.1.3. Data Preparation
The data preparation phase focuses on transforming posts into structured features suitable for ML [46]. Preprocessing was automated using Python libraries, including Regex, spaCy, and NLTK. This ensured that preprocessing could be applied uniformly to all posts, minimising human error and supporting reproducibility [45].
- (i)
- Lowercasing
All posts were converted to lowercase. This was performed to avoid treating the same word as distinct due to case sensitivity [52]. After this processing step, “Depression” and “depression” would be considered the same word. Lowercasing reduces the dimensionality of the text data from X and improves the accuracy of downstream processing, such as tokenisation [52]. This process was implemented using the “.lower()” function, which is Python’s built-in string operation, and was applied to each post.
- (ii)
- Noise Removal
All user mentions were removed to prevent linking posts to the original users. This was achieved through regular expressions (Regex). All the URLs in the posts, hashtags, punctuation, and non-alphanumeric characters were also removed using the Regex filtering to strip irrelevant elements. Extra spaces were stripped to ensure standardised formatting across different posts. This was also handled through Regex substitutions. The NLTK resources, such as stopword lists, were applied to remove non-informative words.
- (iii)
- Tokenisation
Tokenisation is the process of segmenting posts into smaller units or words, which can then be interpreted by ML models. This preprocessing step was essential to implement, as the subsequent modelling processes required structured input instead of unstructured language [53]. This study made use of “spaCy’s nlp()” pipeline to perform tokenisation, which produced a Doc object (a container for linguistic annotations) from which individual tokens could be extracted [9]. Tokens were then used to generate numerical representations, which enabled features to be extracted. These features included sentiment scoring and symptom identification. This conversion from unstructured text to a structured, token-level format enabled efficient handling of data from X during the prediction of MDD risk [52].
- (iv)
- Lemmatisation
In NLP, lemmatisation is a method for preparing text for analysis by transforming words into their base form, known as a lemma [54]. Lemmatisation looks at the meaning and part of speech of a word to make sure that the change results in a valid word [52]. In this study, lemmatisation was applied using the “spaCys nlp()” pipeline, which processes text into Doc objects. Every token in these objects has a “.lemma” attribute that provides its base form. This approach ensured that words like “Depressed” and “Depressing” were all reduced to “Depress”, which facilitates more accurate text analysis.
- (v)
- Sentiment Analysis
Posts from users are assigned a sentiment score, which captures the overall emotional tone expressed. These scores were computed using the “SentimentIntensityAnalyzer().polarity_scores()” function from Natural Language Toolkit’s VADER implementation [55]. The VADER SentimentIntensityAnalyzer is a lexicon- and rule-based tool designed for social media language, used for sentiment analysis [55]. This function produced four metrics: positive, neutral, negative, and a compound score. The compound score, ranging from −1 (most negative) to +1 (most positive), was used as the primary sentiment feature. In cases where users have multiple posts, the compound scores were averaged to obtain a single representative sentiment value per user. This feature was included alongside DSM-5 symptom indicators as input to the different ML models. This was performed with the intent to provide additional information on the emotional content of users’ social media posts.
- (vi)
- Feature Encoding for Machine Learning
Feature encoding refers to the process of transforming qualitative data into numerical values, making the data usable by ML models [56,57]. In the current study, once posts from X were sanitised and aligned with DSM-5-TR depressive symptoms, they were subsequently encoded using binary encoding. Each DSM-5-TR symptom was represented as an independent feature (column). Each column has values of 0 or 1, indicating the absence or presence of the symptom in the text, respectively [57]. This representation ensured that the semantic presence of depressive cues can be presented in a structured form, which is suitable for ML models [58]. Binary feature encoding is widely used in NLP-based depression detection because it provides a simple and interpretable way to link linguistic markers to clinical categories. This reduces noise and overfitting risks compared to higher-dimensional encodings when targeting clinical constructs [59].
- (vii)
- Feature Aggregation and User-Level Representation
Feature aggregation involves summarising information from multiple text instances (X posts) to generate higher-level features at the user level, which better capture behavioural and linguistic patterns over time [60,61]. In this study, post-level outputs were aggregated at the user level to create features suitable for ML models. The average presence of DSM-5-TR symptoms and the mean sentiment score across all posts were calculated for each user. This step helped capture broader patterns of depressive expression over time, rather than focusing solely on individual posts [60]. These aggregated features were then used to classify users into risk categories, which reflected the frequency of MDD symptoms and the overall emotional tone of their posts.
- (viii)
- Depression Risk Labelling
The DSM-5-TR specifies that a diagnosis of MDD requires a minimum of five symptoms, where at least one symptom is a core symptom [1]. This study labels MDD risk to flag depressive symptoms rather than providing a clinical diagnosis. This is performed since a formal diagnosis of MDD requires much more than symptom observation alone. The diagnosis must be conducted by a qualified mental health professional and must also include a comprehensive assessment of medical, family, social, physical, neurological, and substance-use history [1,5]. Based on insights from the data understanding section and insights from [62,63], where there is an imbalance between symptom expression, this study set the threshold for labelling a user as “High Risk” when four symptoms persist, provided that one of them is a core symptom. This adjustment makes it possible to identify the potential risk of depression earlier, before the full diagnostic criteria are met. This approach was relevant in the context of X, where users may express only partial symptom profiles rather than the complete set outlined in clinical manuals [63].
The specific criteria and classifications for MDD risk used in this study were summarised in Table 3, which indicates how the number of symptoms and the presence of a core symptom determine whether a user falls into the “No Risk”, “Monitor”, or “High Risk” categories. No risk classification meant that there were no DSM-5-TR symptoms in the text or that there was only one non-persistent symptom. High risk indicated the presence of a minimum of four DSM-5-TR symptoms endured for at least two weeks [64,65]. The “High Risk” classification implied a nearly clinically significant probability of MDD (typically defined as five or more symptoms, including at least one core symptom). Monitor reflects mild to moderate risk. The Monitor classification is characterised by the presence of one to three DSM-5-TR symptoms, including possible core symptoms, that do not meet the threshold for High Risk but may signal emerging depressive patterns requiring observation [64,65].
Table 3.
Depression risk classifications.
- (ix)
- Features and Target
The modelling process is carried out using user-level features that are aggregated from individual posts. These features included the presence of DSM-5-TR MDD criteria and the mean sentiment score for each user’s posts. The dataset captured clinical indicators and emotional tone, providing a multidimensional view of how MDD may be expressed on social media. The target variable for prediction was the assigned risk classification, which fell into one of three categories: “No Risk”, “Monitor”, or “High Risk”.
- (x)
- Data Splitting
This study used an 80:20 data split. The split was chosen due to its popularity in ML to have enough data (80%) for models to learn patterns and enough data (20%) for testing. This ratio is commonly used because it helps find the right balance between underfitting and overfitting [55,66]. When the ML model is too simplistic to understand the posts from users, it is said to be underfitting. Overfitting occurs when the ML model is overly suited to the training data and does not perform well on new posts/text that it has never seen before [67].
- (xi)
- Class Balancing
An imbalance in class distribution was identified during the data understanding and early data preparation stages, with users classified as High Risk being underrepresented relative to other categories. To address this imbalance, the Synthetic Minority Oversampling Technique (SMOTE) was applied [68]. SMOTE generates synthetic samples for the minority class by interpolating between existing instances and their nearest neighbours, thereby increasing sample diversity without simply duplicating observations.
It was acknowledged that the direct application of SMOTE to raw textual representations or high-dimensional, sparse feature spaces could generate unrealistic synthetic samples and elevate the risk of overfitting. In this study, SMOTE was not utilised on unprocessed text features. Instead, oversampling was performed after feature transformation, where textual posts were encoded into a low-dimensional, clinically grounded feature space based on DSM-5-TR depressive symptoms. Each feature represented the binary presence or absence of a specific symptom, resulting in a compact and dense representation. This design substantially reduces the risk of generating unrealistic synthetic samples and mitigates overfitting commonly associated with SMOTE in high-dimensional text data. Oversampling was further restricted to the training set only, preventing information leakage into validation and test datasets.
In addition to data-level balancing, the study incorporated algorithm-level imbalance handling. Several classifiers, including Random Forest (RF), Decision Tree (DT), and Support Vector Machine (SVM), were configured with class weighting (class_weight = ‘balanced’), which assigns higher penalties to misclassification of minority-class instances during training. This combined data-level and algorithm-level strategy enabled the models to learn more balanced decision boundaries while reducing bias toward majority classes and limiting reliance on synthetic samples alone.
- (xii)
- Model Reproducibility
A random seed of 72 was applied to ensure reproducibility across all stages of the pipeline. This value was derived from the researcher’s student number. Using a seed guaranteed that all processes involving randomness produced consistent and repeatable results.
- (xiii)
- Cross-Validation
Stratified K-Fold cross-validation was utilised to determine the ideal number of folds for model assessment. This was accomplished using k values from 1 to 10. For each value of k, the dataset was partitioned into k equal folds, with one fold allocated as the validation set and the remaining folds employed for training [69,70].
The process was iteratively repeated until each fold had been utilised once for validation. Stratification guaranteed that the ratio of each risk category was maintained in every fold, which is crucial for imbalanced datasets [69]. Performance metrics from each fold were aggregated to yield a reliable assessment of generalisation capacity. Hyperparameter optimisation was performed within the cross-validation framework to prevent data leakage. The higher values of (8–10) elevated computational costs without significant stability improvements. The lower values of (1–3) resulted in increased variability in performance estimates. The assessment indicated that 5 offered the optimal compromise between computational efficiency and dependable performance estimation, and was consequently chosen for all subsequent analyses.
3.1.4. Modelling
The Modelling phase adopted CRISP-DM methodology, which involves selecting, training, and evaluating ML models on the structured dataset as prepared during earlier stages [46].
- (i)
- Model Selection
This study selected different ML models based on their algorithmic characteristics, suitability for multi-class classification, and proven effectiveness in prior studies that focused on MDD prediction [38,45]. Six ML models (RF, DT, SVM, K-Nearest Neighbours, NB, and XGBoost) were chosen to predict the risk of MDD on X. The decision to implement six models was informed by the findings in Section 2, which showed that most prior studies typically implemented between two and five models [38,45]. This study extends the range to provide broader coverage and a more comprehensive comparative analysis than most benchmark studies have offered.
- a.
- Decision Tree
The DT is a non-parametric supervised ML model that can perform both classification and regression tasks. It represented decisions and their potential consequences as a tree-like structure, with each internal node representing a test on a feature. Each branch of the DT corresponds to an outcome of the test, and each leaf node denotes a decision outcome [71]. The DT model was chosen as it offers clear, rule-based decision paths that are easy to interpret. This is crucial for clinical and stakeholder-facing tasks where explainability matters. Non-parametric models, such as DT, recursively partition the feature space to reduce the impurity in the resultant nodes [72]. The most common impurity measure is the Gini Index, which is shown in Equation (1) below:
where is the proportion of the class in node and is the total number of classes. The DT model was initialised with a random_state of 72 for reproducibility and class_weight ‘balanced’ to mitigate class imbalance. The DT model was configured with Max Depth = 7, Min Samples Split = 5, and Min Samples Leaf = 2. These values were chosen to prevent overfitting while still capturing important patterns [69]. Max Depth limits how deep the tree can grow. Min Samples Split and Min Samples Leaf ensure that splits and leaf nodes are based on enough data for reliable predictions.
- b.
- Random Forest
The RF model is an ensemble of DTs. Each tree was trained on a bootstrap sample of the data, taking into account a random subset of features at each [72]. This model was chosen for its ability to reduce overfitting, which is achieved by aggregating predictions from multiple DTs trained on bootstrapped subsets. This model has built-in feature importance, making it suitable for a study where clinical explainability is crucial. The final class label is assigned based on majority voting, and it is represented by Equation (2) below:
where is the total number of trees and is the prediction from the -th tree. The RF model was configured with 180 trees (n_estimators = 180) to ensure sufficient ensemble diversity, and random_state = 72 was set for reproducibility. The model also used Max Depth = 7, Min Samples Split = 10, and Min Samples Leaf = 2 to balance complexity and generalisation. These settings assist in preventing overfitting while still capturing meaningful patterns in the data. The class_weight = ‘balanced’ parameter was applied to address the imbalance in the risk categories. This ensured that the minority classes contributed proportionally during training. This approach is consistent with earlier research that demonstrated the effectiveness of class-weighted RFs in managing unbalanced classification challenges.
- c.
- Support Vector Machine
The model identifies the hyperplane that best separates classes by maximising the margin between them [38]. This model was selected for use in this study as it is known to handle both linear and non-linearly separable problems. It achieved this by mapping data into a high-dimensional feature space. It also decreased empirical risk and minimised predicted risk within a set confidence range [73]. For a linearly separable dataset, the optimisation problem can be expressed by Equation (3) below:
where is the weight vector, is the bias term, are the input features, and are the class labels. The model was configured with probability = True to enable probability estimates, which are essential for ROC AUC calculations.
The SVM model in this study was configured with C = 1, kernel = rbf, and probability = True to enable ROC AUC computation. The C value of 1 was chosen to balance margin width and classification accuracy, which reduces overfitting while maintaining good predictive performance. The RBF kernel was selected to capture potential non-linear relationships in the data, which provides greater flexibility than a linear kernel [74]. Class weighting is critical here to detect underrepresented categories, such as High Risk, reliably. Class imbalance was addressed using class_weight = ‘balanced’, which adjusted the penalty for misclassifying underrepresented classes. This correction is critical in mental health prediction tasks, where rare but clinically significant categories such as High Risk must be detected reliably.
- d.
- K-Nearest Neighbours
The KNN model is a distance-based classifier that assigns a label based on the most common class among the k closest points in the feature space [38]. This model was selected for use as it is simple to implement and can capture local structure in the data. The classification was performed using Euclidean distance, which was calculated using the following Equation (4):
where m is the number of features; The feature index, which ranges from 1 to m; is the data point index, which refers to a specific sample in the dataset; and is the j-th feature of the i-th data point .
The KNN classifier was configured with k = 5 neighbours, using the default parameters (metric = ‘minkowski’ and weights = ‘uniform’). The choice of k = 5 provides a balance between sensitivity to local patterns and generalisation. It helps prevent overfitting while capturing meaningful structures in the data. No explicit class balancing was applied, meaning each neighbour contributed equally to the prediction regardless of class frequency. This allows the model to make predictions based purely on the proximity of points.
- e.
- Naïve Bayes
The NB model is a probabilistic method that makes use of Bayes’ theorem to determine the likelihood of a class given input features [75]. The model assumed conditional independence between features, which allows the joint probability to be factorised and expressed by Equation (5) below:
where y is the class label, x = () represents the feature vector, and m is the number of features. This assumption simplifies computation and enables efficient learning, particularly in high-dimensional text classification tasks. The NB classifier was configured with default parameters, including var_smoothing = 1 × 10⁻⁹. This adds a small value to the variance to maintain numerical stability and prevent division by zero during probability calculations. Using the default settings provides a simple and effective baseline without the need for additional tuning. No further class weighting or balancing was applied. While NB is computationally efficient and interpretable, its feature independence and normality assumption may limit its performance in complex, imbalanced datasets.
- f.
- Extreme Gradient Boosting
The XGBoost model is a sequential ensemble method that builds additive models to improve prediction accuracy. It optimises a differentiable loss function at each iteration. It was chosen due to its built-in regularisation and feature importance metrics, which improved the generalisation and interpretability, while maintaining computational efficiency [76]. The objective function combines both the training loss and a regularisation term to control model complexity, as shown by Equation (6) below:
where is the loss function, which measures the difference between predicted and true labels. The is the regularisation term penalising the complexity of the -th decision tree, and is the prediction at iteration .
In this study, the XGBoost model was configured with Max Depth = 4, Learning Rate = 0.05, Subsample = 0.8, Colsample Bytree = 0.8, along with use_label_encoder = False, eval_metric = ‘mlogloss’, and random_state = 72 to ensure reproducibility. These hyperparameters were found to be optimal for the dataset, providing a balance between model complexity, learning stability, and generalisation [77]. A maximum depth of 4 mitigates overfitting while effectively identifying significant patterns. A learning rate of 0.05 facilitates gradual and stable learning. The Colsample Bytree values of 0.8 introduce randomness that enhances generalisation. Unlike other models, XGBoost inherently adjusts for class imbalance during training, making it particularly effective at detecting underrepresented categories such as High Risk, while maintaining high precision across all classes.
3.1.5. Model Evaluation
The performance of the different ML models was evaluated using accuracy, F1-score, recall, precision, and ROC AUC [45,78]
- (i)
- Model accuracy
Accuracy refers to how often a model’s predictions match the actual outcomes across the entire dataset [41,78], and it is defined by Equation (7) below:
where True Positives (TP) represent depressed individuals who were correctly identified as depressed, True Negatives (TN) represent those non-depressed individuals who were correctly identified as not depressed, False Positives (FP) represent those non-depressed individuals who were incorrectly labelled as depressed, and False Negatives (FN) represent those depressed individuals who were incorrectly labelled as not depressed.
- (ii)
- F1-Score
The F1-score was selected as it combines precision and recall into a single measure. The model achieves this by calculating their harmonic mean [41,78]. This metric is best used when classes are imbalanced, and it is defined using Equation (8) below:
Recall and precision are computed using Equations (9) and (10), respectively. Recall measures the percentage of actual depressed individuals that the model successfully identifies [41,78]. Describes how many of the cases the model labelled as “depressed” were depressed. Having high precision means fewer false alarms.
- (iii)
- Micro and Macro F1 Performance
These metrics were selected as they provide a more comprehensive evaluation of model performance in multi-class classification, particularly when there is heterogeneity in class distributions. The macro F1-score computes the F1-score for each class independently and then averages them, assigning equal weight to all classes. This metric is especially valuable for datasets with imbalanced classes, as it accurately reflects performance on underrepresented categories [79]. The macro F1-score is shown in Equation (11) below:
where is the number of classes. are true positives, false positives, and false negatives for the class respectively.
The micro F1-score, on the other hand, consolidates the total true positives, false positives, and false negatives across all classes prior to computing the F1-score. This method provides a comprehensive assessment of model performance, predominantly affected by classes with a greater sample size [79]. The micro F1-score is shown in Equation (12) below:
where is the total true positives across all classes, is the total false positives across all classes, and is the total false negatives across all classes.
- (iv)
- Receiver Operating Characteristics curves
The Receiver Operating Characteristic (ROC) curve is a two-dimensional graph representing the model’s TP rate on the y-axis and the FP rate on the x-axis [78]. ROC curves are generated for each class using a One-vs-Rest approach, which visually represents how well each classifier distinguishes between the different categories [80]. This combination of metrics offered a view of predictive effectiveness with a focus on the minority classes that were often harder to predict accurately. When this step was performed, it was also necessary to check for overfitting. The training and testing results are then compared by examining metrics of each model. This ensured that models were not simply memorising patterns in the training data but could also generalise effectively when exposed to an unseen dataset.
3.1.6. Model Deployment
The deployment of the model ensured that the implemented models were used to inform decisions and drive interventions. In this study, Microsoft Power BI was used as a user-interface tool to visualise depression risk classification. Power BI is a business intelligence tool that enables users to integrate data from multiple sources, including CSV, Excel, JSON (both local files and web-based APIs), and databases, and create interactive dashboards and reports. Its drag-and-drop interface and real-time analytics capabilities enable quick exploration of data and the generation of timely insights, which is particularly useful for monitoring dynamic information, such as social media posts [81]. It is available on both mobile and desktop. Python was linked to Power BI through native scripting integration, enabling Python code to run directly within Power BI. This connection enabled the loading of trained depression classifiers, pre-processing of data using Pandas, and the generation of predictions [82].
3.2. Ethical Considerations
Ethical integrity was central to this research, given its reliance on using human posts in social media. Ethical safeguards were implemented to ensure compliance with data protection standards and platform policies. An X Developer account was applied for and granted in accordance with X’s data use policies. This enables lawful and ethical access to publicly available X posts. Ethical approval was obtained from the University of Johannesburg’s CBE Research Ethics Committee before the commencement of the study, with Protocol Reference #: 2025SCiiS031. All data were anonymised and processed solely for research purposes. The data were handled in accordance with the platform’s terms of service and applicable data protection regulations. No personally identifiable information was retained. Data were securely stored with two-factor authentication enabled and governed by restricted access protocols. Only the researcher can access the dataset. These measures were implemented to uphold user dignity, minimise harm, and ensure the ethical integrity of the research process.
4. Results
The six ML models were compared to evaluate their ability to learn patterns from the data and generalise to new, unseen data. Table 4 shows the performance of models on the training data. Table 5 shows the performance of models on the unseen testing data. The overall performance of the implemented models showed that ensemble and boosting methods, specifically RF and XGBoost, consistently outperformed other models, as shown in Table 4 and Table 5. The RF and XGBoost achieved near-perfect training performance (RF: accuracy = 0.993, F1-score = 0.993; XGBoost: accuracy = 0.998, F1-score = 0.998) as shown in Table 4. DT and KNN also performed strongly on training data (DT: accuracy = 0.985, F1-score = 0.985; KNN: accuracy = 0.953, F1-score = 0.952). The SVM achieved moderate training performance (accuracy = 0.945, F1-score = 0.945), and NB had the lowest training performance (accuracy = 0.818, F1-score = 0.814).
Table 4.
Model performance on training data.
Table 5.
Model Performance on Testing Data.
While near-perfect training performance can sometimes indicate overfitting or data leakage, several safeguards were applied in this study to minimise these risks. SMOTE oversampling was applied only on the training data, and feature encoding transformed raw text into a low-dimensional, clinically grounded space based on DSM-5-TR symptoms. Train–test splitting was performed at the user level to ensure that no posts from the same user appeared in both sets, and no feature was perfectly correlated with the target label. Additionally, 5-fold stratified cross-validation was applied on the training data. This was performed to ensure that models were consistently evaluated on multiple subsets, thus reducing the likelihood of overfitting [70]. Therefore, the observed high training accuracy, particularly for tree-based models such as RF and XGBoost, reflects their strong representational capacity on structured, separable features rather than data leakage.
On the testing data, XGBoost retained the highest performance (accuracy = 0.979, F1-score = 0.970), followed by RF (accuracy = 0.966, F1-score = 0.936). DT and KNN showed larger reductions in performance (DT: accuracy = 0.884, F1-score = 0.850; KNN: accuracy = 0.877, F1-score = 0.790), which reflect comparatively lower generalisation ability. SVM also exhibited moderate drops (accuracy = 0.904, F1-score = 0.831), suggesting these models may be less well-suited to capture nuanced patterns of depressive language in user-generated text. NB maintained similar accuracy on testing (accuracy = 0.884), but its F1-score decreased (F1 = 0.774), which indicates limited ability to capture complex depressive patterns compared to the ensemble and boosting methods. These results indicate that XGBoost is the most effective model for multi-class classification of depressive language on Platform X, achieving the highest training performance and best retention on the test set. RF performs well but shows slightly larger reductions from training to testing, indicating somewhat lower generalisation compared to XGBoost.
4.1. ROC Curves Analysis
Figure 6 presents the ROC curves of the six models, with ROC AUC values providing detailed insights into their discriminatory ability across the three risk categories. The dashed line represents the no-discrimination baseline (AUC = 0.5), where the true positive rate equals the false positive rate. Both RF and XGB consistently achieved the highest ROC AUC scores across all risk classes, with values of 0.992–1.000. This demonstrates excellent separability between classes and indicates strong generalisation performance. The DT exhibited the lowest ROC AUC for Monitor (0.944), as well as relatively lower scores for No Risk (0.946) and High Risk (0.982). These results suggest a limited ability to distinguish users at intermediate risk levels. The SVM achieved a high ROC AUC for High Risk (0.993), but slightly lower values for Monitor (0.968) and No Risk (0.938). This reflects a moderate efficacy in detecting transitional risk levels. Both KNN and NB showed satisfactory performance overall, with ROC AUCs predominantly above 0.910. The KNN model struggled somewhat with Monitor (0.921). The NB was highly effective in identifying High Risk (0.997) but less precise for Monitor (0.922).
Figure 6.
ROC curves of models.
4.2. Confusion Matrix Analysis
Figure 7 shows the confusion matrix of the six models. The darker shades indicate higher frequencies of predictions, while lighter shades represent lower values. The confusion matrix of the RF model showed the strongest performance, correctly classifying 84 No-Risk, 47 Monitor, and 10 High-Risk users. Misclassifications were minimal, including only one No Risk misclassified as Monitor, one Monitor misclassified as No Risk, and one High Risk misclassified as Monitor.
Figure 7.
Confusion Matrix of the six models.
The XGBoost model also performed exceptionally well. It accurately identified 85 No-Risk, 48 Monitor, and 10 High-Risk users. Only minor misclassifications occurred, with two Monitor users misclassified as No Risk and one High-Risk user misclassified as Monitor. The SVM model correctly classified 81 No-Risk, 43 Monitor, and 8 High-Risk users. Misclassifications included three No-Risk cases classified as Monitor, four Monitor cases classified as High-Risk, and three High-Risk cases classified as Monitor, reflecting moderate difficulty in distinguishing transitional risk categories.
The DT model correctly classified 75 No-Risk, 45 Monitor, and 9 High-Risk cases. Errors included 10 No-Risk users misclassified as Monitor, 2 Monitor users misclassified as No-Risk, and 3 Monitor users misclassified as High-Risk. The KNN model showed weaker class separation, correctly identifying 78 No-Risk, 41 Monitor, and 9 High-Risk users. Misclassifications included two No-Risk users classified as Monitor, five No-Risk users classified as High-Risk, seven Monitor users classified as High-Risk, and two Monitor users classified as No-Risk. The NB model had the lowest performance, with 78 No-Risk, 44 Monitor, and 7 High-Risk users correctly classified. Misclassifications included one No-Risk user classified as Monitor, six No-Risk users classified as High-Risk, five Monitor users classified as High-Risk, and one High-Risk user classified as Monitor.
The majority of misclassifications transpired between the Monitor and High-Risk categories, rather than involving No-Risk users. From a clinical standpoint, this differentiation is significant. Incorrectly classifying or categorising a Monitor user as High-Risk may result in overly cautious interventions, which is preferable to neglecting a High-Risk case. Conversely, misclassifying a High-Risk user as Monitor could delay necessary support, underscoring the importance of refining detection in this boundary region. These errors likely reflect three inherent challenges: overlapping language between Monitor and High-Risk posts, the limited context available in short social media messages, and the subtlety of high-risk depressive cues that are not always explicitly expressed. The misclassifications between No Risk and Monitor were less frequent, which suggests that the models reliably distinguished non-depressive content.
Table 6 below presents a class-specific misclassification analysis derived from the confusion matrices of all evaluated models. The table summarises the frequency and direction of classification errors across the three risk categories. This enables a granular assessment of model behaviour beyond aggregate performance metrics. Attention is given to critical errors, including FPs where No Risk users are incorrectly classified as High Risk, and FNs where High Risk users are misclassified as No Risk, as these errors carry significant practical implications for mental health risk screening.
Table 6.
Class-specific misclassification analysis (confusion matrix errors).
4.3. Micro and Macro F1 Performance
The performance of the six ML models was evaluated using micro and macro F1 scores. The macro F1 score reflects the model’s ability to predict each class equally, including underrepresented classes. The micro F1 score accounts for overall prediction performance weighted by class frequency. Figure 8 illustrates the comparison of macro versus micro F1 scores for each model.
Figure 8.
Macro vs. Micro F1 score per model.
XGBoost attained the highest macro F1 score of 0.970, which demonstrates a strong performance across all classes. The RF model followed with a score of 0.936, which exhibits consistent efficacy in both prevalent and infrequent classes. The other models, DT (0.850), SVM (0.831), KNN (0.790), and NB (0.774), exhibited greater difficulty with minority classes, underscoring their constrained capacity to manage class heterogeneity.
The micro F1, which aggregates overall predictive performance across all samples, further confirms the superiority of XGBoost (0.979) and RF (0.966). SVM (0.904), DT (0.884), NB (0.884), and KNN (0.877) demonstrated lower overall accuracy, which slightly favours majority classes. The differences between macro and micro F1 underscore the effect of class imbalance, as seen with NB, which shows a higher micro (0.884) than macro F1 (0.774). This suggests an adequate performance on frequent classes but weaker predictions for rarer categories. XGBoost and RF clearly lead the performance, which makes them the most reliable models for multi-class prediction, balancing accuracy across both common and rare classes.
4.4. Explainability
Model explainability was evaluated through global and local interpretability methods to ensure transparency and understanding of the predictive mechanisms. Feature importance was assessed to determine the most significant features throughout the dataset, and it offered a comprehensive view of model performance. LIME was utilised for individual posts and users, and it facilitated explanations of model predictions at both the post and user levels.
4.4.1. Global Explainability at Model Level
Figure 9 shows the feature importance of each variable used. Feature importance identified which DSM-5-TR symptoms contributed most to depression risk. Depressed Mood was the most influential predictor across models. Importance weights were RF (0.351), DT (0.450), SVM (0.350), KNN (0.332), and NB (0.350) (Figure 9). This highlights its core role in the DSM-5-TR criteria and its strong presence in social media language, consistent with the APA criteria in [1]. XGBoost and RF also prioritised secondary features, such as Feelings of Worthlessness or Guilt and Psychomotor Agitation or Retardation, reflecting their ability to capture complex interactions. KNN, SVM, and NB were less sensitive to subtler features, such as sleep disturbance and Appetite or Weight Change. Sleep Disturbance, Psychomotor Agitation or Retardation, and Sentiment contributed least, suggesting that direct symptom-related language was more informative than general sentiment.
Figure 9.
Feature Importance.
4.4.2. Explainability at Post and User Level
LIME provided case-level insights into how specific words and phrases influenced predictions. To avoid duplicating the same posts and the keywords identified, this study showed the clinical relevance and impact of LIME based on the output of the best-performing model. Figure 10 presents the LIME explainability results for the XGboost model applied to three selected users. The figure demonstrated how the model arrived at its predictions by identifying the textual features in users’ posts that most influenced the classification into MDD risk categories. The LIMEs demonstrated that the model was effective and interpretable, which fulfils key principles of explainable ML. Transparency is achieved through the highlighting of specific words, and the model identifies the words driving predictions, along with corresponding impact scores. Traceability was ensured by linking each prediction back to the user’s original text, which allowed for every risk classification to be audited. The approach is scalable, as explanations can be applied at multiple levels, including posts, users, or populations, which enables both granular and aggregated analyses. The output from LIME showed that reproducibility is evident in the consistent identification of similar features and DSM-5-TR symptoms for comparable textual inputs. When interpreted alongside metrics such as accuracy, F1-score, and ROC AUC, these results showed that the model is reliable, and it identified MDD risk while providing clinically meaningful insights suitable for MDD screening.
Figure 10.
LIME Results.
4.5. Depression Risk Prediction System
Figure 11 shows the solution developed in Microsoft Power BI version 2.149.1429.0. The Power BI dashboard’s functionality reflects the deployment phase of CRISP-DM, which demonstrated the translation of the predictive model into a practical, user-friendly solution that supports early detection, awareness, and monitoring of depressive symptoms in a clinically aligned manner. The dashboard provides an intuitive interface that enables users to interact with the predictive system without requiring technical expertise. Users can access the dashboard using a smartphone, laptop, or tablet. Users specify their X handle, which enables the system to access their X posts. There are several ways for users to reach the dashboard. Power BI Desktop is a good choice for users in remote areas who do not have internet access or just need it sometimes. This is because the program can be installed and operated on laptops or tablets. The Power BI Service is a web-based service that allows users with reliable internet access to view the dashboard. It allows users to see real-time updates and interactively explore the dashboard. The Power BI Mobile App, which works on both iOS and Android devices, also enables users to interact with it on smartphones and tablets.
Figure 11.
Depression risk prediction system.
Once the solution is opened and a date range corresponding to social media activity is selected, the system automatically extracts relevant posts from the specified period. These posts were processed using the XGBoost model, the best-performing ML model identified during the modelling phase. The model analyses linguistic indicators and maps them to DSM-5-TR symptom criteria at the post level. After aggregating symptom counts, the system classified the user into one of the three risk categories. These categories were visually represented using a colour-coded scheme where Green showed No Risk, Amber showed Monitor, and Red for High Risk. This was performed to provide immediate visual feedback for easy interpretation. To enhance transparency and user confidence, the dashboard also displays the model’s predictive accuracy and highlights key linguistic indicators contributing to the classification. Users can navigate through summaries over time, track changes in their risk status based on new social media activity, and explore detailed insights into symptom patterns.
5. Discussion
A comparison was conducted between the best-performing models in this study and those reported in relevant literature. The aim was to assess both methodological alignment and clinical relevance. For clarity, the literature was divided into three categories. Category A includes studies clinically aligned with DSM-5 or DSM-5-TR criteria, regardless of whether they used both social media data, NLP, or explainable ML, but they used traditional ML. Category B includes studies that are not clinically aligned but employ a methodology similar to this research. Category C includes studies that employed non-traditional ML models. Table 7 presents the comparison across these two categories. The RF and XGBoost models developed in this study outperformed most comparable models in the literature, particularly those that incorporated DSM-5 or DSM-5-TR criteria. Compared to this study’s RF model, which achieved an accuracy of 0.966, Hong et al. [48] and Krishna et al. [83] reported lower accuracies of 0.770 and 0.880 when using the same type of model on depression-related text. This difference suggested that the improvements made in this study, including alignment with the CRISP-DM framework, extensive data preprocessing, examining depression from a user’s perspective rather than just one post, and multiclassification of risk, assisted the model in understanding the underlying patterns. The study by Safa et al. [60] applied a gradient boosting model, achieving an accuracy of 0.910 and an F1-score of 0.80, which were lower than the results obtained in this research.
Table 7.
Comparison with prior studies.
The models developed in this research also showed stronger performance when compared to those studies that employed a similar methodology but were not clinically aligned with DSM-5 criteria. Adarsh et al. [38], who applied an RF model to social media text, achieved an accuracy of 0.87 and an F1-score of 0.920, less than the RF and XGBoost models implemented in this study. Tadesse et al. [36] presented marginally inferior data, achieving an accuracy of 0.850 and an F1-score of 0.850. The results obtained by AlSagri et al. [41] show an accuracy of 0.84 and a notably lower F1-score of 0.660. The findings of this study showed that the models aligned with DSM-5 TR criteria are more likely to produce outputs that map directly to clinical diagnostic standards, which makes them interpretable and actionable for psychiatrists and other mental health practitioners.
The XGBoost model developed in this study was compared with the advanced deep learning approach proposed by Thakur et al. [84], which presented an interpretable BiLSTM-attention framework for post-level depression detection on Reddit. The model achieved an accuracy of 0.9747, precision of 0.9746, recall of 0.9747, and an F1-score of 0.9746. In comparison, the proposed XGBoost model achieved higher accuracy (0.979) and precision (0.986) than the BiLSTM model, while its recall (0.956) and F1-score (0.949) were lower. This indicates that XGBoost is more precise and accurate overall, whereas the BiLSTM model is more effective at capturing depressive posts. These comparable results suggest that clinically grounded traditional models can rival deep learning approaches, while deep learning may achieve stronger performance when clinically informed and applied at the user level rather than the post level.
The study by Chen et al. [85] proposed a hybrid deep learning model combining a pretrained Sentence-BERT (SBERT) with a convolutional neural network (CNN) to detect depression from Reddit posts. The study achieved an accuracy of 0.86, a precision of 0.85, a recall of 0.87, and an F1-score of 0.86. In comparison, the proposed XGBoost model substantially outperformed this method, achieving higher values across all evaluation metrics. This indicates that the XGBoost model generalises more effectively and is less affected by class imbalance. In contrast, Chen et al. [85] reported that their approach suffered from overfitting and limited performance, partly due to the imbalanced dataset and the use of the lightweight but less expressive all-MiniLM-L6-v2 SBERT model.
The study by Kerasiotis et al. [86] proposed a transformer-based neural network architecture for depression detection in social media posts, leveraging DistilBERT. The model achieved weighted precision, recall, and F1-scores of 0.843, 0.842 and 0.842%, respectively. However, several limitations were noted in this study. The study did not perform hyperparameter tuning. The authors highlighted challenges in deployment, including computational costs, latency issues, fairness across demographics, and continuous retraining needs. In comparison, the proposed XGBoost model substantially outperformed this method, achieving higher values across all evaluation metrics.
The study by Khafaga et al. [87] proposed a novel deep learning Multi-Aspect Depression Detection with Hierarchical Attention Network (MDHAN) enhanced with Adaptive Particle Swarm and Grey Wolf Optimisation (MDH-PWO) for predicting depression from Twitter posts. The MDHAN uses a hierarchical attention network to focus on important textual features, while the optimisation techniques enhance feature representation. The model achieved an accuracy of 0.999 accuracy, precision of 0.935, recall of 0.919 and F1-score of 0.909. In comparison, the XGBoost model developed in this study achieves slightly lower accuracy (0.979) but higher precision (0.986), comparable recall (0.910), and higher F1-score (0.949), which indicates a stronger overall correctness. MDH-PWO comes with higher computational complexity due to hierarchical attention layers and hybrid optimisation, whereas XGBoost demonstrates strong overall performance with faster training and easier deployment.
It was noted that analysing user-level data rather than isolated posts was advantageous in this study, as the models could capture temporal and contextual nuances. Using the CRISP-DM methodology and rigorous preprocessing resulted in model generalisability and reproducibility. Unlike the prediction of a binary depression output, the models in this study that support multiclass prediction are valuable for personalised care planning and could be used by mental health practitioners to prioritise interventions based on severity. The output of this study can also be used to empower individuals with limited depression literacy to recognise DSM-5-TR depressive symptoms and interpret their associated risk levels in the context of daily life.
5.1. Implications of the Study on Policy and Practice
This study made a theoretical contribution by combining computational methods with clinical diagnostic standards. It employs a user-level, multi-symptom approach that goes beyond traditional single-post or binary categorisation methods. This study also found that XGBoost and RF were suitable models for MDD risk prediction. The study found that using sentiments from posts alone is insufficient to predict MDD risk. Sentiment could be used as a supplement to provide clinical standards. The application of explainable ML enhanced understanding of how linguistic features contributed to MDD detection, bridging the gap between computational predictions and clinical interpretation.
This research addressed limitations in retrospective symptom reporting during clinical interviews for MDD, which often span at least two weeks and are prone to memory bias. A supportive solution was created to extract social media sentences containing keywords corresponding to DSM-5-TR depressive symptoms. Combined with clinical interviews, this reduces the risk of missing key indicators. The solution assists individuals with limited MDD literacy to identify symptoms and assess their risk. With an accuracy of 0.97, it serves as a dependable reference for pursuing professional assessment. The risk classification framework categorises users into No-Risk, Monitor, and High-Risk. Although it is not a clinical diagnosis, it provides a structured, symptom-based assessment that is aligned with the DSM-5-TR criteria. This promotes awareness and swift decision-making while conforming to diagnostic limits. The solution fosters trust by using explainable ML techniques that make reasoning clear and understandable. It also enhances MDD literacy for individuals who may be unfamiliar with the disorder, hold misconceptions about it, or face barriers to care.
5.2. Limitations of the Study and Future Work
Several limitations were noted in this research. The dataset used was limited to English-language posts from X, which limits its generalisability to other languages and cultural contexts. The analysis was based solely on textual data and excluded multimodal signals such as images, audio, and behavioural patterns.
Future research may extend beyond textual analysis by integrating diverse data types, including images, audio recordings, and videos. These supplementary sources may yield more profound and detailed insights into users’ emotional states and behaviours. This could potentially enhance the accuracy and promptness of early MDD detection. Incorporating non-English datasets is a crucial avenue. It enables models to comprehend linguistic and cultural variances in the expression of depressive symptoms. Integrating multimodal data with varied, multilingual datasets may enhance future models. This approach could render them more comprehensive and inclusive in identifying MDD across diverse populations and contexts. Future studies could explore deep learning approaches to further enhance predictive performance. They could also explicitly model temporal dynamics in user behaviour and posting patterns, which were not fully addressed in this study. Such approaches may help models capture subtle longitudinal patterns and improve early detection of depressive symptoms at the user level.
6. Conclusions
The study aimed to identify MDD indicators on X and develop interpretable models for detecting MDD risk. Findings showed that social media data can be a valuable source, with depressive markers effectively processed and modelled using NLP, ML, and explainable ML techniques. Aligning DSM-5-TR criteria with machine learning enabled accurate Depression risk classification and supported early intervention. Among all models, RF and XGBoost delivered the strongest performance, with accuracies of 0.966 and 0.979 and F1-scores of 0.936 and 0.970, demonstrating their reliability for predicting MDD risk on social media. LIME and feature importance analysis added interpretability at both the individual post and population levels. In comparison to earlier studies that employed similar techniques, the models in this research achieved consistently higher performance. The proposed approach can supplement early detection of MDD risk, enhance clinical decision support, and promote earlier referrals.
Author Contributions
Conceptualisation, R.M., E.M., T.M. and N.N.; methodology, R.M.; software, R.M.; validation, E.M., T.M. and N.N.; formal analysis, R.M.; investigation, R.M.; resources, R.M.; data curation, R.M.; writing—original draft preparation, R.M.; writing—review and editing, E.M., T.M. and N.N.; visualisation, R.M.; supervision, E.M., T.M. and N.N.; project administration, R.M.; funding acquisition, R.M., E.M., T.M. and N.N. All authors have read and agreed to the published version of the manuscript.
Funding
This research received no external funding.
Institutional Review Board Statement
The study was conducted in accordance with the Declaration of Helsinki and approved by the University of Johannesburg’s College of Business and Economics (CBE) Research Ethics Committee (ethical clearance code: 2025SCiiS031).
Informed Consent Statement
Not applicable. The study used publicly available Twitter (X) posts that were accessed in accordance with the platform’s terms of service. No direct contact was made with users, no intervention was performed, and no identifiable private information was collected. All data were anonymised prior to analysis.
Data Availability Statement
The data used in this study were collected from publicly accessible posts on X (formerly Twitter) at https://x.com. In accordance with X’s data use and redistribution policies, the raw post content cannot be openly shared. No new data were created or generated beyond what is publicly available on the platform. Researchers may reproduce the dataset by accessing X through a Developer account and applying the procedures detailed in Section 3.
Acknowledgments
The authors would like to express their sincere gratitude to the University of Johannesburg for their support throughout this research.
Conflicts of Interest
The authors declare no conflicts of interest.
Abbreviations
The following abbreviations are used in this manuscript:
| AI | Artificial Intelligence |
| APA | American Psychiatric Association |
| API | Application Programming Interface Bidirectional Long Short-Term Memory |
| BiLSTM | Bidirectional Long Short-Term Memory |
| CNN | Convolutional Neural Network |
| DistilBERT | Distilled Bidirectional Encoder Representations from Transformers |
| DSM-5 | Diagnostic and Statistical Manual of Mental Disorders, Fifth Edition |
| DSM-5-TR | Diagnostic and Statistical Manual of Mental Disorders, Fifth Edition, Text Revision |
| DT | Decision Tree |
| EDA | Exploratory Data Analysis |
| GBD | Global Burden of Disease |
| ICD-11 | International Classification of Diseases, Eleventh Revision |
| KNN | K-Nearest Neighbors |
| LIC | Low-Income Countries |
| LIME | Local Interpretable Model-agnostic Explanations |
| MDD | Major Depressive Disorder |
| MDHAN | Multi-Aspect Depression Detection with Hierarchical Attention Network |
| MDH-PWO | MDHAN enhanced with Adaptive Particle Swarm and Grey Wolf Optimisation |
| ML | Machine Learning |
| NLP | Natural Language Processing |
| NLTK | Natural Language Toolkit |
| HIC | High-Income Countries |
| PHQ-2 | Patient Health Questionnaire-2 |
| PHQ-9 | Patient Health Questionnaire-9 |
| RF | Random Forest |
| REGEX | Regular Expression |
| ROC AUC | Receiver Operating Characteristic—Area Under the Curve |
| SBERT | Sentence-BERT |
| SHAP | SHapley Additive exPlanations |
| SMOTE | Synthetic Minority Oversampling Technique |
| SVM | Support Vector Machine |
| TF-IDF | Term Frequency–Inverse Document Frequency |
| VADER | Valence Aware Dictionary and Sentiment Reasoner |
| WHO | World Health Organisation |
| XGBoost | Extreme Gradient Boosting |
| xML | Explainable Machine Learning |
References
- American Psychiatric Association. Diagnostic and Statistical Manual of Mental Disorders, 5th Edition: Text Revision (DSM-5-TR); American Psychiatric Association Publishing: Washington, DC, USA, 2022. [Google Scholar] [CrossRef] [Scilit]
- World Health Organization (WHO). Barriers to Mental Health Care in Africa. WHO Regional Office for Africa. 2022. Available online: https://www.afro.who.int/news/barriers-mental-health-care-africa (accessed on 4 August 2025).
- Cui, L.; Li, S.; Wang, S.; Wu, X.; Liu, Y.; Yu, W.; Wang, Y.; Tang, Y.; Xia, M.; Li, B. Major depressive disorder: Hypothesis, mechanism, prevention and treatment. Signal Transduct. Target. Ther. 2024, 9, 30. [Google Scholar] [CrossRef] [Scilit]
- World Health Organization (WHO). Depressive Disorder (Depression): Key Facts and Symptoms; WHO: Geneva, Switzerland, 2025; Available online: https://www.who.int/news-room/fact-sheets/detail/depression (accessed on 4 August 2025).
- Bains, N.; Abdijadid, S. Major Depressive Disorder. In StatPearls; StatPearls Publishing: Treasure Island, FL, USA, 2025. [Google Scholar]
- Aleem, S.; Huda, N.U.; Amin, R.; Khalid, S.; Alshamrani, S.S.; Alshehri, A. Machine Learning Algorithms for Depression: Diagnosis, Insights, and Research Directions. Electronics 2022, 11, 1111. [Google Scholar] [CrossRef] [Scilit]
- Proudman, D.; Greenberg, P.; Nellesen, D. The Growing Burden of Major Depressive Disorders (MDD): Implications for Researchers and Policy Makers. PharmacoEconomics 2021, 39, 619–625. [Google Scholar] [CrossRef] [Scilit]
- Malgaroli, M.; Hull, T.D.; Zech, J.M.; Althoff, T. Natural language processing for mental health interventions: A systematic review and research framework. Transl. Psychiatry 2023, 13, 309. [Google Scholar] [CrossRef] [Scilit]
- Salas-Zárate, R.; Alor-Hernández, G.; Salas-Zárate, M.D.P.; Paredes-Valverde, M.A.; Bustos-López, M.; Sánchez-Cervantes, J.L. Detecting Depression Signs on Social Media: A Systematic Literature Review. Healthcare 2022, 10, 291. [Google Scholar] [CrossRef] [Scilit]
- Zogan, H.; Razzak, I.; Wang, X.; Jameel, S.; Xu, G. Explainable depression detection with multi-aspect features using a hybrid deep learning model on social media. World Wide Web 2022, 25, 281–304. [Google Scholar] [CrossRef] [Scilit]
- Godard, R.; Holtzman, S. Are active and passive social media use related to mental health, wellbeing, and social support outcomes? A meta-analysis of 141 studies. J. Comput.-Mediat. Commun. 2023, 29, zmad055. [Google Scholar] [CrossRef] [Scilit]
- Goodmann, D.R.; Daouk, S.; Sullivan, M.; Cabrera, J.; Liu, N.H.; Barakat, S.; Muñoz, R.F.; Leykin, Y. Factor analysis of depression symptoms across five broad cultural groups. J. Affect. Disord. 2021, 282, 227–235. [Google Scholar] [CrossRef] [Scilit]
- Kroenke, K.; Spitzer, R.L.; Williams, J.B.W. The PHQ-9: Validity of a brief depression severity measure. J. Gen. Intern. Med. 2001, 16, 606–613. [Google Scholar] [CrossRef] [Scilit]
- Upton, J. Beck Depression Inventory (BDI). In Encyclopedia of Behavioral Medicine; Gellman, M.D., Turner, J.R., Eds.; Springer: New York, NY, USA, 2013; Available online: https://link.springer.com/rwe/10.1007/978-1-4419-1005-9_441 (accessed on 9 August 2025).
- Regier, D.A.; Kuhl, E.A.; Kupfer, D.J. The DSM-5: Classification and criteria changes. World Psychiatry 2013, 12, 92–98. [Google Scholar] [CrossRef] [Scilit]
- Deng, Q.; Liu, S.; Yang, Y.; Chen, Y. Mind matters: A comparative study of self-reported severity of depression and cognitive symptoms in China and the USA. BMC Public Health 2025, 25, 1088. [Google Scholar] [CrossRef] [Scilit]
- Hacimusalar, Y.; Eşel, E. Suggested Biomarkers for Major Depressive Disorder. Noro Psikiyatr. Ars. 2018, 55, 280–290. [Google Scholar] [CrossRef] [Scilit]
- Holsboer, F. The Corticosteroid Receptor Hypothesis of Depression. Neuropsychopharmacology 2000, 23, 477–501. [Google Scholar] [CrossRef] [Scilit]
- Pitharouli, M.C.; Hagenaars, S.P.; Glanville, K.P.; Coleman, J.R.I.; Hotopf, M.; Lewis, C.M.; Pariante, C.M. Elevated C-Reactive Protein in Patients With Depression, Independent of Genetic, Health, and Psychosocial Factors: Results From the UK Biobank. Am. J. Psychiatry 2021, 178, 522–529. [Google Scholar] [CrossRef] [Scilit]
- Castrén, E.; Monteggia, L.M. Brain-Derived Neurotrophic Factor Signaling in Depression and Antidepressant Action. Biol. Psychiatry 2021, 90, 128–136. [Google Scholar] [CrossRef] [Scilit]
- Shen, Y.; Yang, H.; Lin, L. Automatic Depression Detection: An Emotional Audio-Textual Corpus and a GRU/BiLSTM-based Model. In Proceedings of the CASSP 2022 IEEE International Conference on Acoustics, Speech and Signal Processing (ICASSP), Singapore, 22–27 May 2022. [Google Scholar] [CrossRef] [Scilit]
- Colleges of Medicine of South Africa (CMSA). Diploma in Mental Health of the College of Psychiatrists of South Africa: DMH(SA). Available online: https://cmsa.co.za/diploma-in-mental-health-of-the-college-of-psychiatrists-of-south-africa-dmhsa (accessed on 24 October 2025).
- Kar, N. Challenges in Managing Depression in Clinical Practice: Result of a Global Survey. Pharmacoepidemiology 2025, 4, 5. [Google Scholar] [CrossRef] [Scilit]
- Lu, B.; Lin, L.; Su, X. Global burden of depression or depressive symptoms in children and adolescents: A systematic review and meta-analysis. J. Affect. Disord. 2024, 354, 553–562. [Google Scholar] [CrossRef] [Scilit]
- Chen, X.; Li, F.; Zuo, H.; Zhu, F. Trends in Prevalent Cases and Disability-Adjusted Life-Years of Depressive Disorders Worldwide: Findings from the Global Burden of Disease Study From 1990 to 2021. Depress. Anxiety 2025, 2025, 5553491. [Google Scholar] [CrossRef] [Scilit]
- Monroe, S.M.; Harkness, K.L. Major Depression and Its Recurrences: Life Course Matters. Annu. Rev. Clin. Psychol. 2022, 18, 329–357. [Google Scholar] [CrossRef] [Scilit]
- Levis, B.; Benedetti, A.; Thombs, B.D. Accuracy of Patient Health Questionnaire-9 (PHQ-9) for screening to detect major depression: Individual participant data meta-analysis. BMJ 2019, 365, l1476. [Google Scholar] [CrossRef] [Scilit]
- Roseman, M.; Kloda, L.A.; Saadat, N.; Riehm, K.E.; Ickowicz, A.; Baltzer, F.; Katz, L.Y.; Patten, S.B.; Rousseau, C.; Thombs, B.D. Accuracy of Depression Screening Tools to Detect Major Depression in Children and Adolescents: A Systematic Review. Can. J. Psychiatry Rev. Can. Psychiatr. 2016, 61, 746–757. [Google Scholar] [CrossRef] [Scilit] [PubMed]
- Radloff, L.S. The CES-D Scale: A Self-Report Depression Scale for Research in the General Population. Appl. Psychol. Meas. 1977, 1, 385–401. [Google Scholar] [CrossRef] [Scilit]
- Ali, S.; Zehra, A.; Khalid, M.U.; Hassan, M.; Shah, S.I.A. Role of C-reactive protein in disease progression, diagnosis and management. Discoveries 2023, 11, e179. [Google Scholar] [CrossRef] [Scilit] [PubMed Central]
- O’Dea, B.; Boonstra, T.W.; Larsen, M.E.; Nguyen, T.; Venkatesh, S.; Christensen, H. The relationship between linguistic expression in blog content and symptoms of depression, anxiety, and suicidal thoughts: A longitudinal study. PLoS ONE 2021, 16, e0251787. [Google Scholar] [CrossRef] [Scilit] [PubMed]
- Statista. Average Daily Time Spent on Social Media Worldwide 2012–2025. 2025. Available online: https://www.statista.com/statistics/433871/daily-social-media-usage-worldwide/ (accessed on 29 November 2025).
- Hards, E.; Orchard, F.; Reynolds, S. ‘I am tired, sad and kind’: Self-evaluation and symptoms of depression in adolescents. Child Adolesc. Psychiatry Ment. Health 2023, 17, 126. [Google Scholar] [CrossRef] [Scilit]
- Naslund, J.A.; Bondre, A.; Torous, J.; Aschbrenner, K.A. Social Media and Mental Health: Benefits, Risks, and Opportunities for Research and Practice. J. Technol. Behav. Sci. 2020, 5, 245–257. [Google Scholar] [CrossRef] [Scilit]
- Liu, D.; Feng, X.L.; Ahmed, F.; Shahid, M.; Guo, J. Detecting and Measuring Depression on Social Media Using a Machine Learning Approach: Systematic Review. JMIR Ment. Health 2022, 9, e27244. [Google Scholar] [CrossRef] [Scilit]
- Tadesse, M.M.; Lin, H.; Xu, B.; Yang, L. Detection of Depression-Related Posts in Reddit Social Media Forum. IEEE Access 2019, 7, 44883–44893. [Google Scholar] [CrossRef] [Scilit]
- Tong, L.; Liu, Z.; Jiang, Z.; Zhou, F.; Chen, L.; Lyu, J.; Zhang, X.; Zhang, Q.; Sadka, A.; Wang, Y.; et al. Cost-Sensitive Boosting Pruning Trees for Depression Detection on Twitter. IEEE Trans. Affect. Comput. 2023, 14, 1898–1911. [Google Scholar] [CrossRef] [Scilit]
- Adarsh, V.; Arun Kumar, P.; Lavanya, V.; Gangadharan, G.R. Fair and Explainable Depression Detection in Social Media. Inf. Process. Manag. 2023, 60, 103168. [Google Scholar] [CrossRef] [Scilit]
- Burdisso, S.G.; Errecalde, M.; Montes-y-Gómez, M. A text classification framework for simple and effective early depression detection over social media streams. Expert Syst. Appl. 2019, 133, 182–197. [Google Scholar] [CrossRef] [Scilit]
- Bokolo, B.G.; Liu, Q. Advanced Comparative Analysis of Machine Learning and Transformer Models for Depression and Suicide Detection in Social Media Texts. Electronics 2024, 13, 3980. [Google Scholar] [CrossRef] [Scilit]
- AlSagri, H.; Ykhlef, M. Quantifying Feature Importance for Detecting Depression using Random Forest. Int. J. Adv. Comput. Sci. Appl. 2020, 11, 5. [Google Scholar] [CrossRef] [Scilit]
- Chen, J.Q.; Qi, K.; Zhang, A.; Shalaginov, M.; Zeng, T.H. COVID-19 Impact on Mental Health Analysis based on Reddit Comments. In Proceedings of the 2022 IEEE International Conference on Bioinformatics and Biomedicine (BIBM), Las Vegas, NV, USA, 6–8 December 2022; IEEE: New York, NY, USA, 2022; pp. 2253–2258. [Google Scholar] [CrossRef] [Scilit]
- Pradnyana, G.A.; Anggraeni, W.; Yuniarno, E.M.; Purnomo, M.H. An explainable ensemble model for revealing the level of depression in social media by considering personality traits and sentiment polarity pattern. Online Soc. Netw. Media 2025, 46, 100307. [Google Scholar] [CrossRef] [Scilit]
- Prama, T.T.; Islam, M.S.; Anwar, M.M.; Jahan, I. AI-Enabled Deep Depression Detection and Evaluation Informed by DSM-5-TR. IEEE Trans. Comput. Soc. Syst. 2024, 11, 6453–6465. [Google Scholar] [CrossRef] [Scilit]
- Ding, Z.; Wang, Z.; Zhang, Y.; Cao, Y.; Liu, Y.; Shen, X.; Tian, Y.; Dai, J. Trade-offs between machine learning and deep learning for mental illness detection on social media. Sci. Rep. 2025, 15, 14497. [Google Scholar] [CrossRef] [Scilit]
- Shimaoka, A.M.; Ferreira, R.C.; Goldman, A. The evolution of CRISP-DM for Data Science: Methods, Processes and Frameworks. SBC Rev. Comput. Sci. 2024, 4, 28–43. [Google Scholar] [CrossRef] [Scilit]
- Ayele, W.Y. Adapting CRISP-DM for Idea Mining: A Data Mining Process for Generating Ideas Using a Textual Dataset. Int. J. Adv. Comput. Sci. Appl. 2020, 11, 20–32. [Google Scholar] [CrossRef] [Scilit]
- Hong, J.; Kim, J.; Kim, S.; Oh, J.; Lee, D.; Lee, S.; Uh, J.; Yoon, J.; Choi, Y. Depressive Symptoms Feature-Based Machine Learning Approach to Predicting Depression Using Smartphone. Healthcare 2022, 10, 1189. [Google Scholar] [CrossRef] [Scilit]
- Gomez, R.; Chen, W.; Houghton, S. Differences between DSM-5-TR and ICD-11 revisions of attention deficit/hyperactivity disorder: A commentary on implications and opportunities. World J. Psychiatry 2023, 13, 138–143. [Google Scholar] [CrossRef] [Scilit]
- Muraina, I.O.; Adesanya, O.M.; Agoi, M.A.; Onen, S. The Necessity of Exploratory Data Analysis How are preprocessing activities beneficial to Data Analysts and Professional Researchers in Academia. Int. J. Sci. Res. Comput. Sci. Eng. 2023, 11, 22–28. [Google Scholar] [CrossRef] [Scilit]
- Cooksey, R.W. Descriptive Statistics for Summarising Data. In Illustrating Statistical Procedures: Finding Meaning in Quantitative Data; Springer: Singapore, 2020; pp. 61–139. [Google Scholar] [CrossRef] [Scilit]
- Kanahuati-Ceballos, M.; Valdivia, L.J. Detection of depressive comments on social media using RNN, LSTM, and random forest: Comparison and optimisation. Soc. Netw. Anal. Min. 2024, 14, 44. [Google Scholar] [CrossRef] [Scilit]
- Nusrat, M.O.; Shahzad, W.; Jamal, S.A. Multi Class Depression Detection Through Tweets using Artificial Intelligence. arXiv 2024. [Google Scholar] [CrossRef] [Scilit]
- Kabir, F.; Hossain, M.A.; Rahman, A.F.M.M.; Mishu, S.Z. Depression Detection From Social Media Textual Data Using Natural Language Processing and Machine Learning Techniques. In Proceedings of the 2023 26th International Conference on Computer and Information Technology (ICCIT), Cox’s Bazar, Bangladesh, 13–15 December 2023; IEEE: New York, NY, USA, 2023; pp. 1–6. [Google Scholar] [CrossRef] [Scilit]
- Kim, Y.; Römer-Barron, U. Detection and Analysis of Depression-Related Language in an Online Community: Machine Learning, Topic Modeling, and Corpus-Linguistic Approaches. Corpus-Based Stud. Humanit. 2025, 3, 283–312. [Google Scholar] [CrossRef] [Scilit]
- Soofi, Y.J.; Gu, Y.; Liu, J. An adaptive Physics-based feature engineering approach for Machine Learning-assisted alloy discovery. Comput. Mater. Sci. 2023, 226, 112248. [Google Scholar] [CrossRef] [Scilit]
- Ta, V.; Carrico, L.; Bousquet, A. Binary Classification: An Introductory Machine Learning Tutorial for Social Scientists. J. Methods Meas. Soc. Sci. 2021, 12, 56–94. [Google Scholar] [CrossRef] [Scilit]
- Drougkas, G.; Bakker, E.M.; Spruit, M. Multimodal machine learning for language and speech markers identification in mental health. BMC Med. Inform. Decis. Mak. 2024, 24, 354. [Google Scholar] [CrossRef] [Scilit]
- Lorenzoni, G.; Tavares, C.; Nascimento, N.; Alencar, P.; Cowan, D. Assessing ML classification algorithms and NLP techniques for depression detection: An experimental case study. PLoS ONE 2025, 20, e0322299. [Google Scholar] [CrossRef] [Scilit]
- Safa, R.; Bayat, P.; Moghtader, L. Automatic detection of depression symptoms in twitter using multimodal analysis. J. Supercomput. 2022, 78, 4709–4744. [Google Scholar] [CrossRef] [Scilit]
- Wongkoblap, A.; Vadillo, M.A.; Curcin, V. Modeling Depression Symptoms from Social Network Data through Multiple Instance Learning. AMIA Summits Transl. Sci. Proc. 2019, 2019, 44–53. [Google Scholar]
- Handy, A.; Mangal, R.; Stead, T.S.; Coffee, R.L.; Ganti, L. Prevalence and Impact of Diagnosed and Undiagnosed Depression in the United States. Cureus 2022, 14, e28011. [Google Scholar] [CrossRef] [Scilit]
- Mowery, D.; Smith, H.; Cheney, T.; Stoddard, G.; Coppersmith, G.; Bryan, C.; Conway, M. Understanding Depressive Symptoms and Psychosocial Stressors on Twitter: A Corpus-Based Study. J. Med. Internet Res. 2017, 19, e48. [Google Scholar] [CrossRef] [Scilit]
- Priyadarshana, Y.H.P.P.; Liang, Z.; Piumarta, I. HelaDepDet: A Novel Multi-class Classification Model for Detecting the Severity of Human Depression. In Collaboration Technologies and Social Computing, Lecture Notes in Computer Science; Takada, H., Marutschke, D.M., Alvarez, C., Inoue, T., Hayashi, Y., Hernandez-Leo, D., Eds.; Springer Nature: Cham, Switzerland, 2023; pp. 3–18. [Google Scholar] [CrossRef] [Scilit]
- Milintsevich, K.; Sirts, K.; Dias, G. Towards automatic text-based estimation of depression through symptom prediction. Brain Inf. 2023, 10, 4. [Google Scholar] [CrossRef] [Scilit]
- Joseph, V.R. Optimal Ratio for Data Splitting. Stat. Anal. Data Min. ASA Data Sci. J. 2022, 15, 531–538. [Google Scholar] [CrossRef] [Scilit]
- Halabaku, E.; Bytyçi, E. Overfitting in Machine Learning: A Comparative Analysis of Decision Trees and Random Forests. Intell. Autom. Soft Comput. 2024, 39, 987–1006. [Google Scholar] [CrossRef] [Scilit]
- Byeon, H. Predicting the Depression of the South Korean Elderly using SMOTE and an Imbalanced Binary Dataset. Int. J. Adv. Comput. Sci. Appl. 2021, 12, 74–79. [Google Scholar] [CrossRef] [Scilit]
- Wilimitis, D.; Walsh, C.G. Practical considerations and applied examples of cross-validation for model development and evaluation in health care: Tutorial. JMIR AI 2023, 2, e49023. [Google Scholar] [CrossRef] [Scilit]
- Setyawan, A.E.; Sudiarto, B. Optimization of heat rate and greenhouse gas emission reduction at coal-fired power plants in Indonesia through machine learning modeling. Int. J. Electr. Comput. Biomed. Eng. 2024, 2, 454–476. [Google Scholar] [CrossRef] [Scilit]
- Colledani, D.; Anselmi, P.; Robusto, E. Machine learning-decision tree classifiers in psychiatric assessment: An application to the diagnosis of major depressive disorder. Psychiatry Res. 2023, 322, 115127. [Google Scholar] [CrossRef] [Scilit]
- Uma Pavan Kumar, K.; Gandhi, O.; Venkata Reddy, M.; Srinivasu, S.V.N. Usage of KNN, Decision Tree and Random Forest Algorithms in Machine Learning and Performance Analysis with a Comparative Measure. In Machine Intelligence and Soft Computing, Advances in Intelligent Systems and Computing; Bhattacharyya, D., Thirupathi Rao, N., Eds.; Springer: Singapore, 2021; pp. 473–479. [Google Scholar] [CrossRef] [Scilit]
- Saha, D.K.; Hossain, T.; Safran, M.; Alfarhood, S.; Mridha, M.F.; Che, D. Ensemble of hybrid model based technique for early detecting of depression based on SVM and neural networks. Sci. Rep. 2024, 14, 25470. [Google Scholar] [CrossRef] [Scilit]
- Wshah, S.; Skalka, C.; Price, M. Predicting posttraumatic stress disorder risk: A machine learning approach. JMIR Ment. Health 2019, 6, e13946. [Google Scholar] [CrossRef] [Scilit] [PubMed]
- Samanvitha, S.; Bindiya, A.R.; Sudhanva, S.; Mahanand, B.S. Naïve Bayes Classifier for depression detection using text data. In Proceedings of the 2021 5th International Conference on Electrical, Electronics, Communication, Computer Technologies and Optimisation Techniques (ICEECCOT), Mysuru, India, 10–11 December 2021; IEEE: New York, NY, USA, 2021; pp. 418–421. [Google Scholar] [CrossRef] [Scilit]
- Wiens, M.; Verone-Boyle, A.; Henscheid, N.; Podichetty, J.T.; Burton, J. A Tutorial and Use Case Example of the EXTREME Gradient Boosting (XGBOOST) Artificial Intelligence Algorithm for Drug Development Applications. Clin. Transl. Sci. 2025, 18, e70172. [Google Scholar] [CrossRef] [Scilit]
- Roy, K.; Easin, M.; Reno, S.; Sarker, A.M.; Shamsi, R. Leveraging a stacking ensemble model for accurate depression prediction and diagnosis across all ages. Eng. Rep. 2025, 7, e70416. [Google Scholar] [CrossRef] [Scilit]
- Tharwat, A. Classification assessment methods. Appl. Comput. Inf. 2021, 17, 168–192. [Google Scholar] [CrossRef] [Scilit]
- Hinojosa Lee, M.C.; Braet, J.; Springael, J. Performance metrics for multilabel emotion classification: Comparing micro, macro, and weighted F1-scores. Appl. Sci. 2024, 14, 9863. [Google Scholar] [CrossRef] [Scilit]
- Hughes, C.M.L.; Zhang, Y.; Pourhossein, A.; Jurasova, T. A comparative analysis of binary and multi-class classification machine learning algorithms to detect current frailty status using the English longitudinal study of ageing (ELSA). Front. Aging 2025, 6, 1501168. [Google Scholar] [CrossRef] [Scilit]
- Virani, J.; Daredi, N.; Bhanushali, A.; Shukla, M.; Shah, P. Mental Healthcare Analysis using Power BI & Machine Learning. In Proceedings of the 2023 4th International Conference on Signal Processing and Communication (ICSPC), Coimbatore, India, 23–24 March 2023; pp. 73–76. [Google Scholar] [CrossRef] [Scilit]
- Vashisht, V.; Jakhmola, N.; Manjarwar, P.; Nikhil, N. An Effective Approach for Integrating Microsoft Power BI Application with Python for Predictive Analytics. In Micro-Electronics and Telecommunication Engineering, Proceedings of 4th ICMETE 2020, Ghaziabad, India, 26–27 September 2020; Springer: Berlin/Heidelberg, Germany, 2020; pp. 469–477. [Google Scholar] [CrossRef] [Scilit]
- Krishna, R.; Teja, R.; Neelima, N.; Peddi, N. Advanced machine learning models for Depression level categorisation using DSM 5 and personality traits. Procedia Comput. Sci. 2024, 235, 2783–2792. [Google Scholar] [CrossRef] [Scilit]
- Thakur, R.S.; Singh, J.P. Explainable depression detection on Reddit: A BiLSTM-attention framework with SHAP and LIME interpretability. Int. J. Res. Appl. Sci. Eng. Technol. IJRASET 2025, 13, 527–537. [Google Scholar] [CrossRef] [Scilit]
- Chen, Z.; Yang, R.; Fu, S.; Zong, N.; Liu, H.; Huang, M. Detecting Reddit users with depression using a hybrid neural network SBERT-CNN. arXiv 2024, arXiv:2302.02759. [Google Scholar] [CrossRef] [Scilit]
- Kerasiotis, M.; Ilias, L.; Askounis, D. Depression detection in social media posts using transformer-based models and auxiliary features. Soc. Netw. Anal. Min. 2024, 14, 196. [Google Scholar] [CrossRef] [Scilit]
- Khafaga, D.S.; Auvdaiappan, M.; Deepa, K.; Abouhawwash, M.; Karim, F.K. Deep learning for depression detection using Twitter data. Intell. Autom. Soft Comput. 2023, 36, 1301–1313. [Google Scholar] [CrossRef] [Scilit]
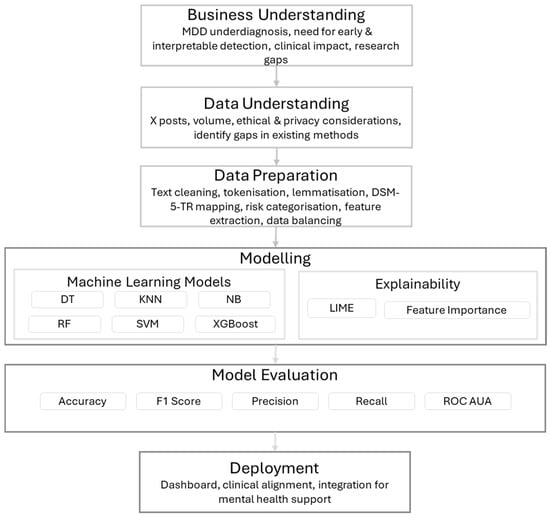
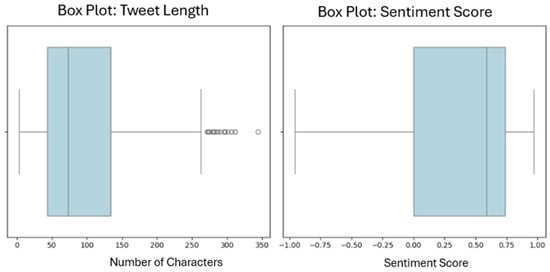
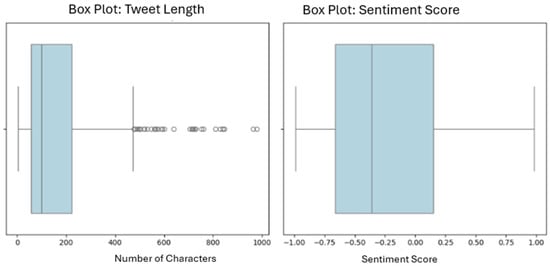
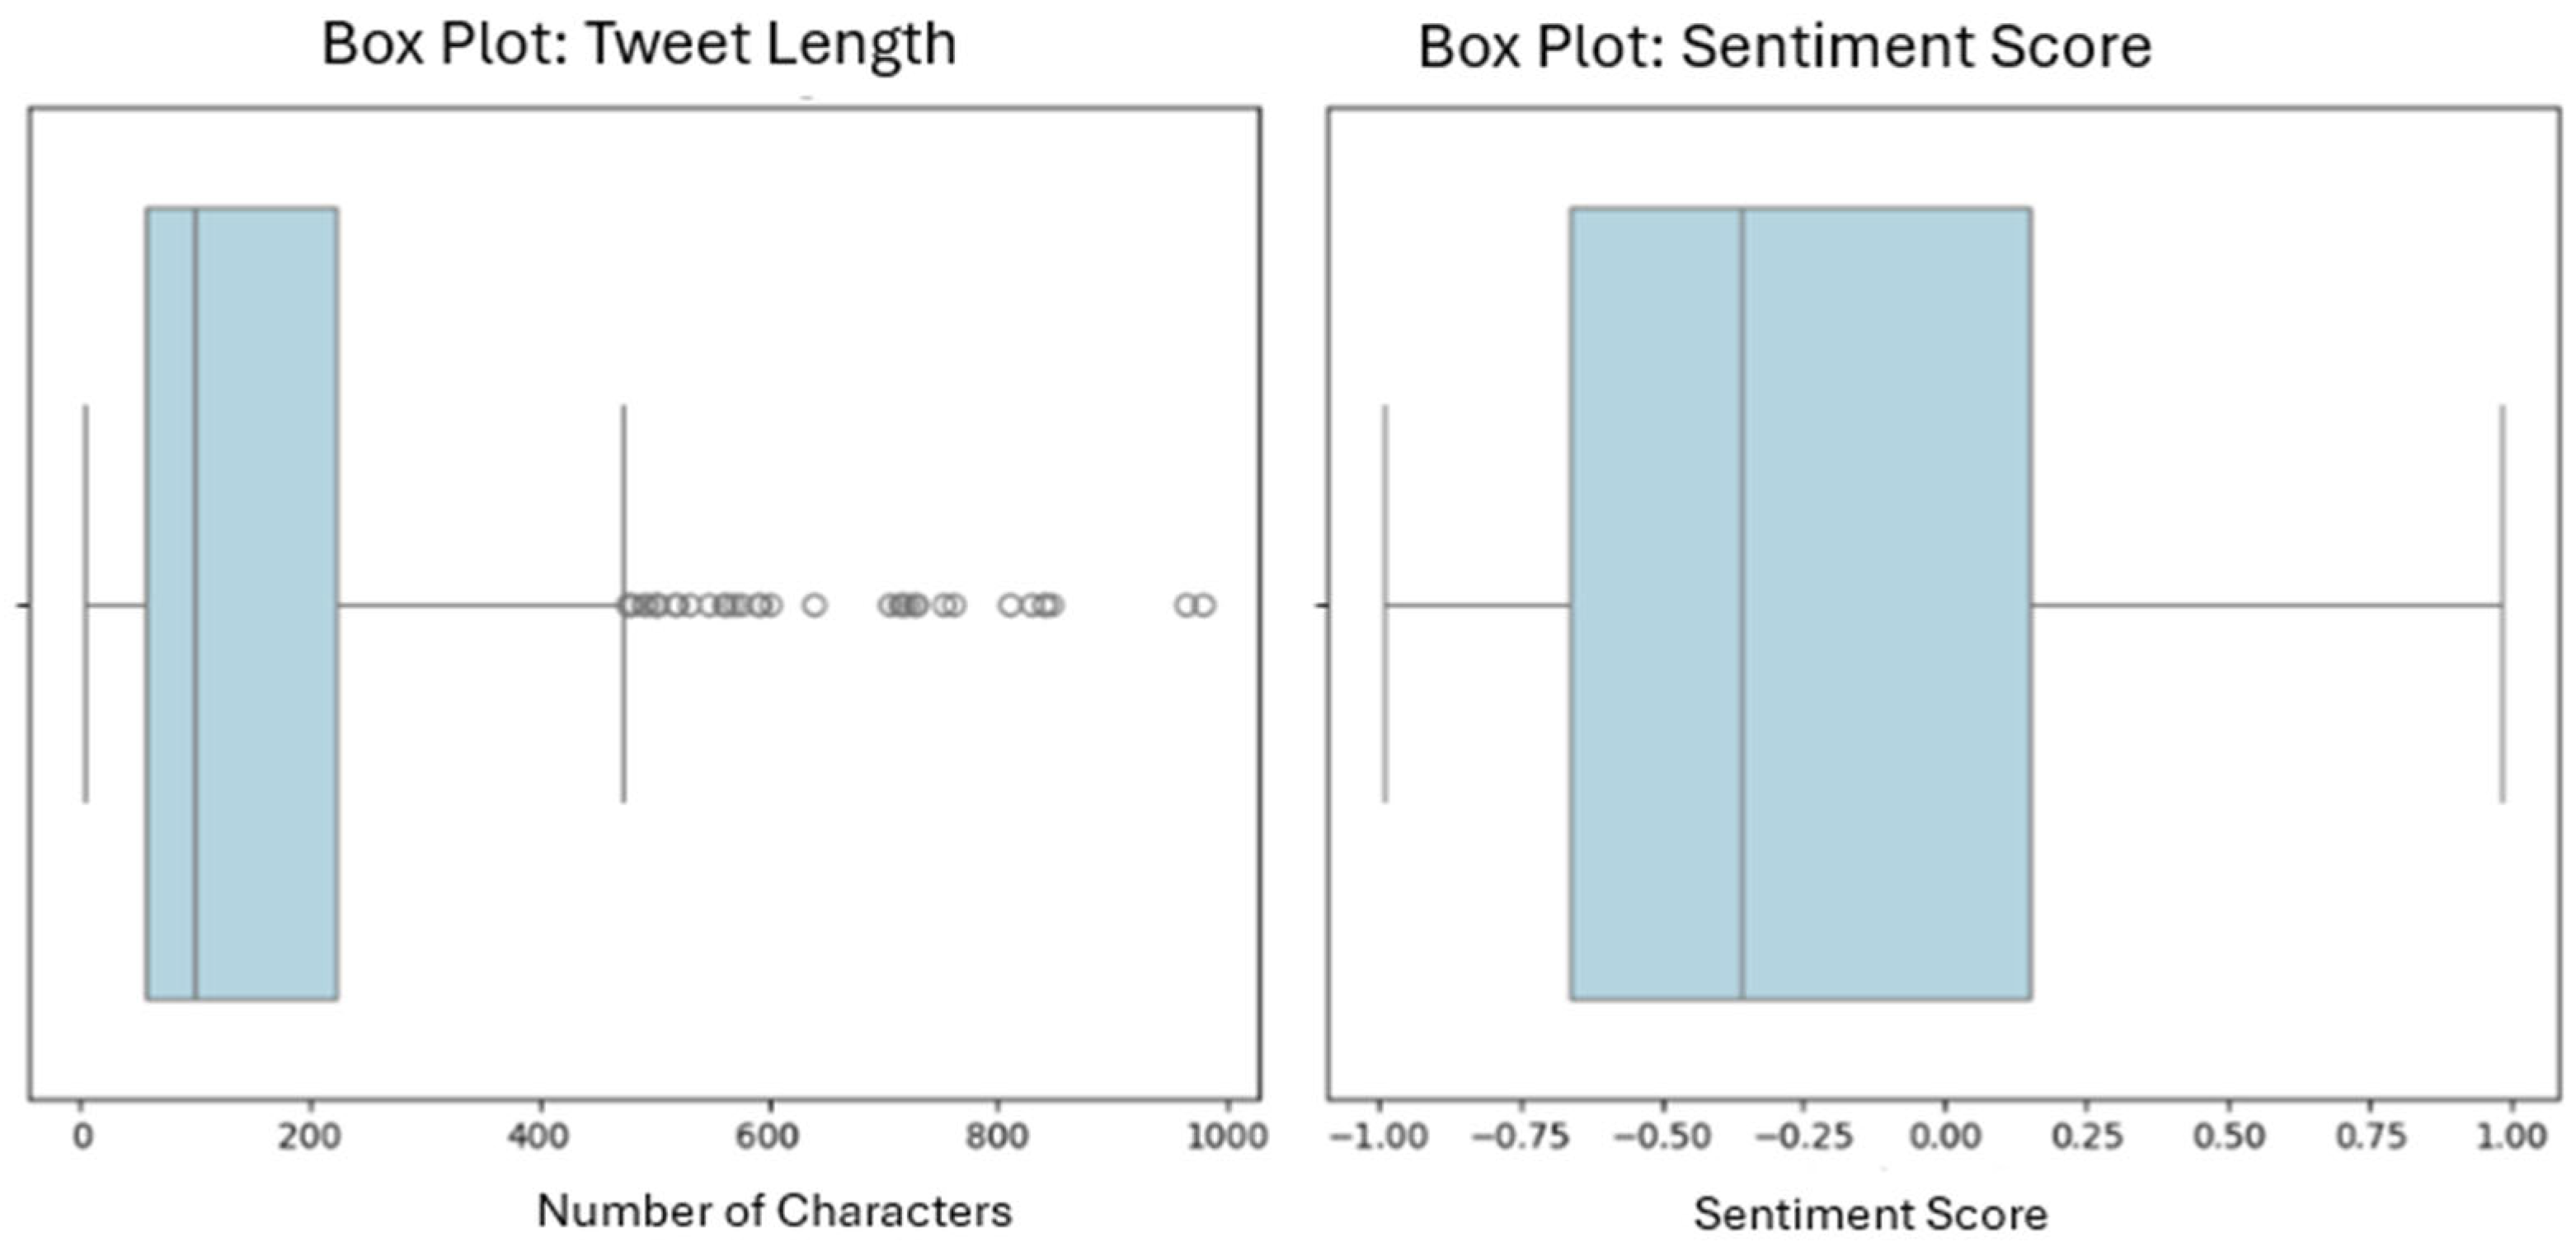
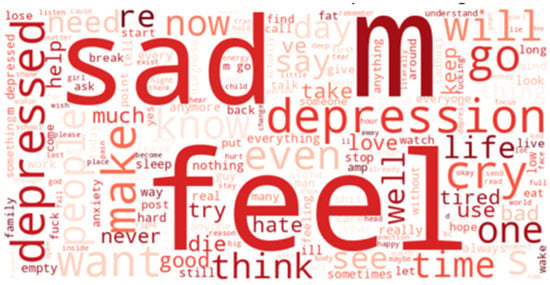
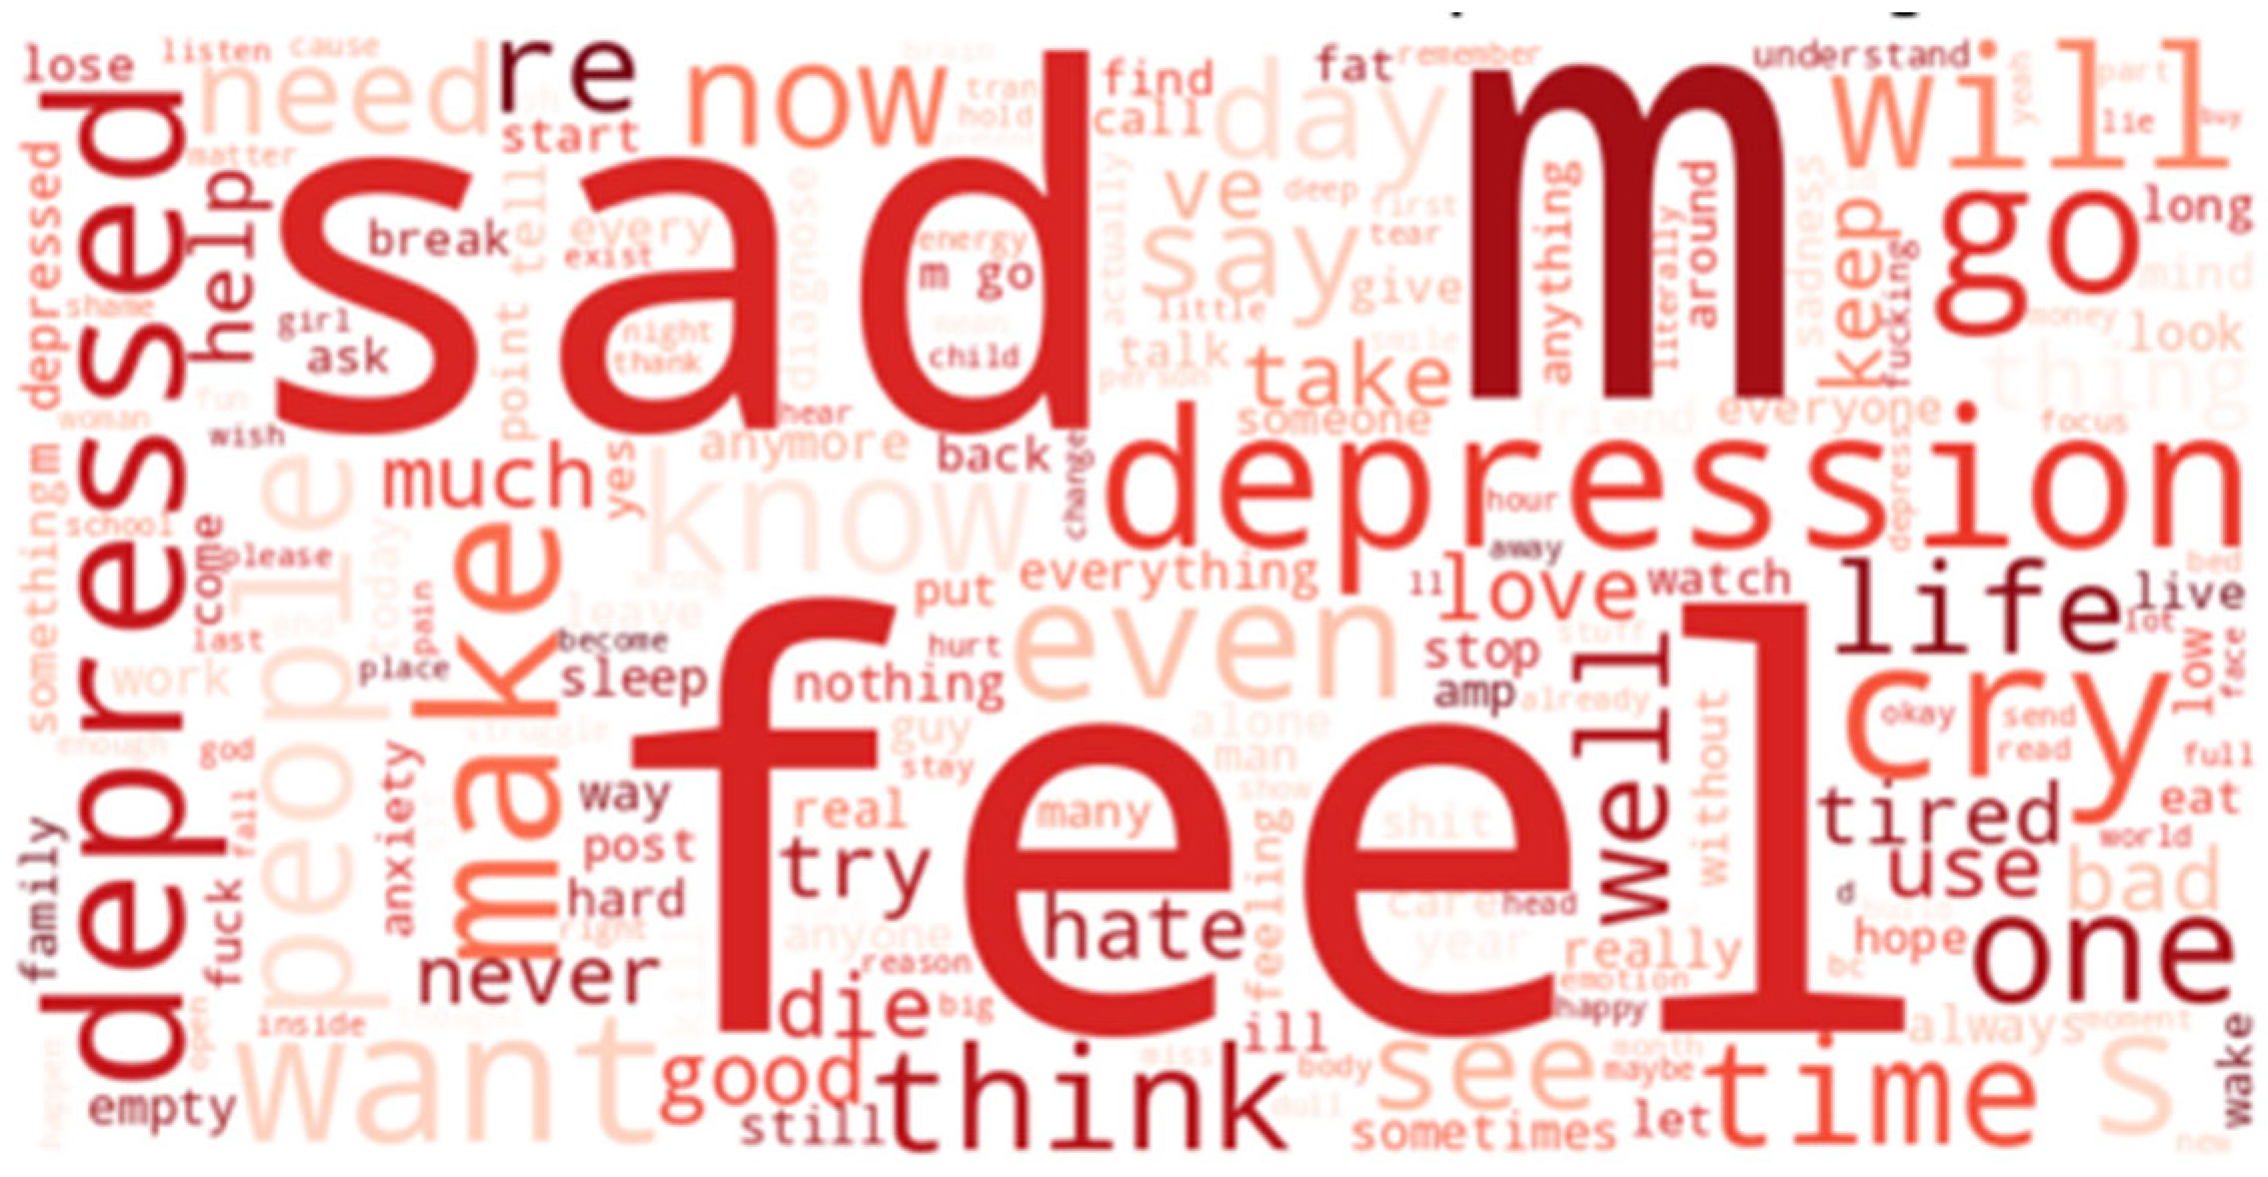

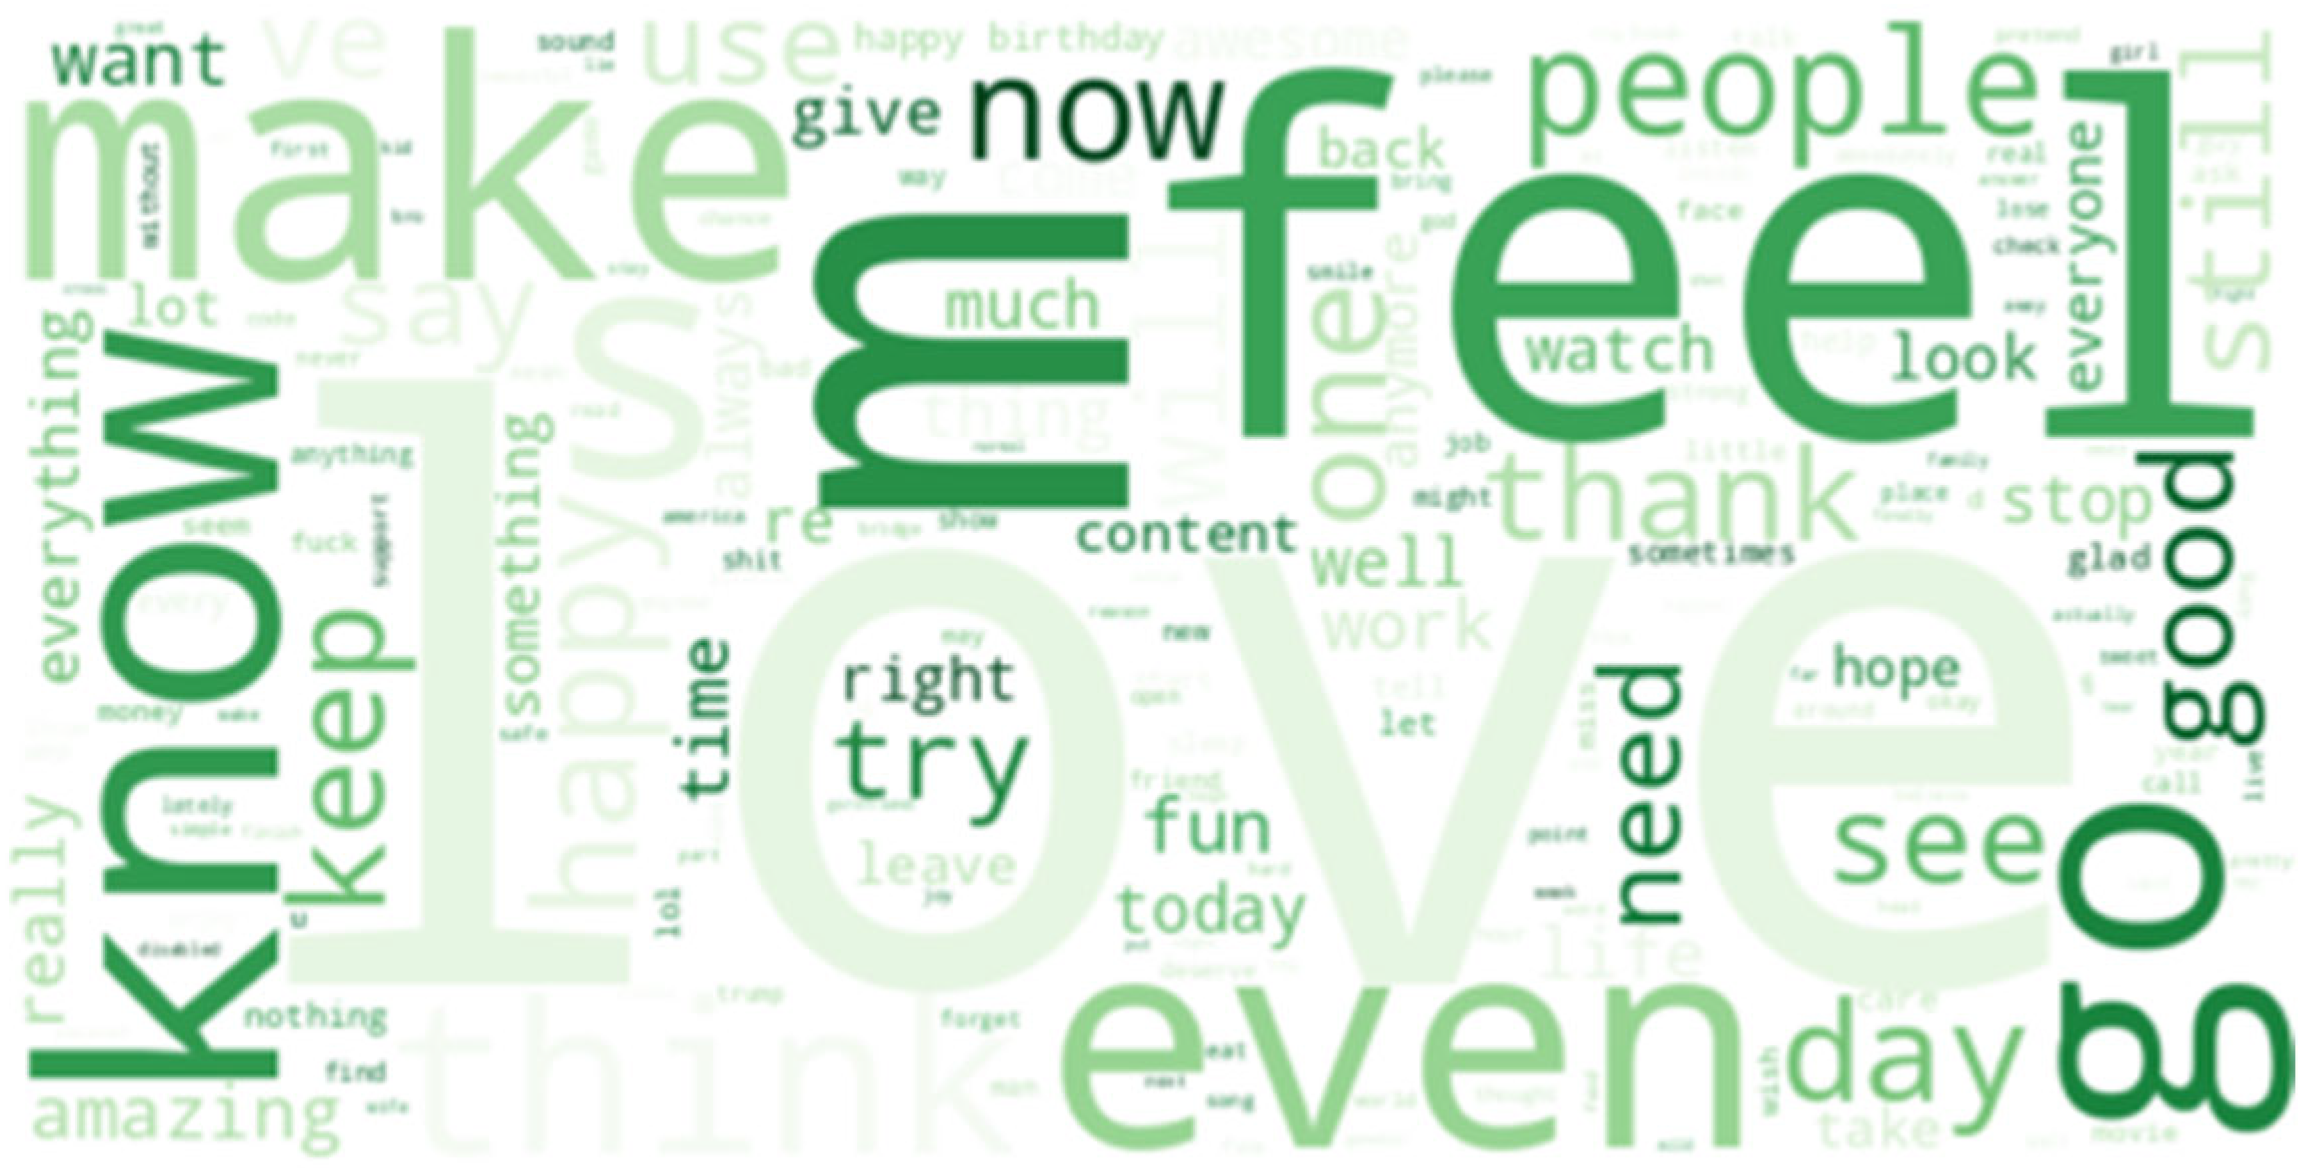
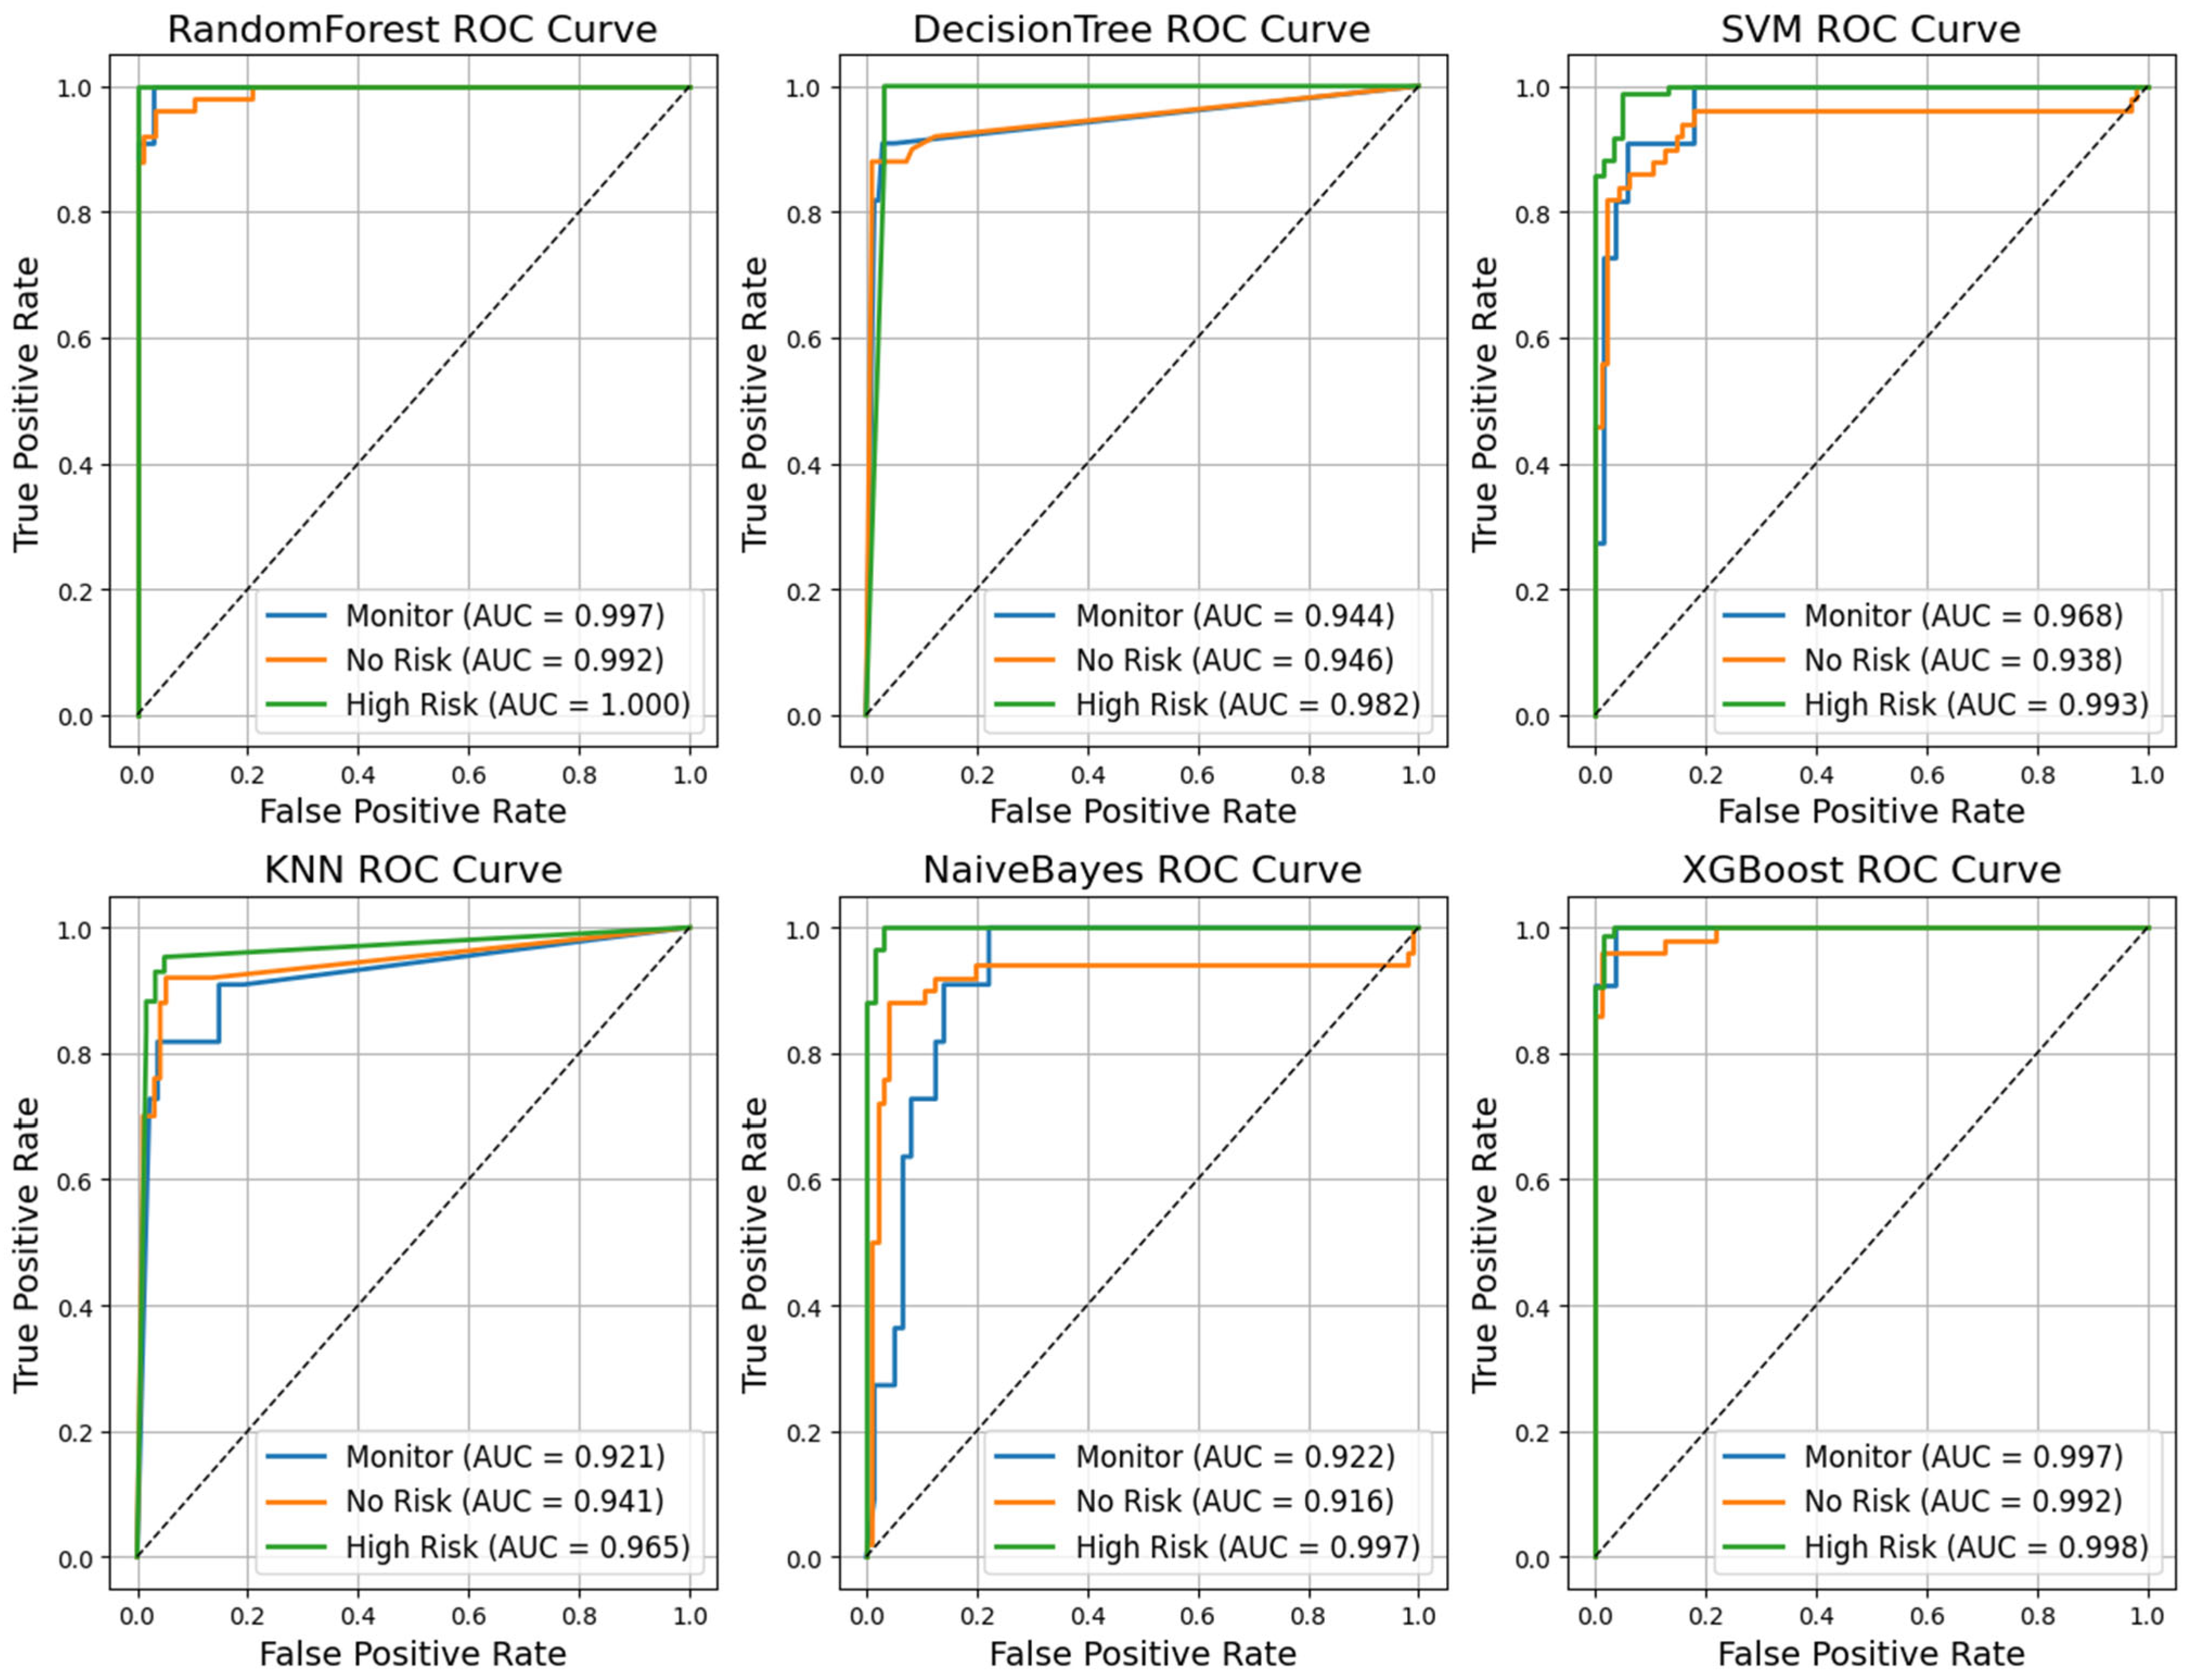
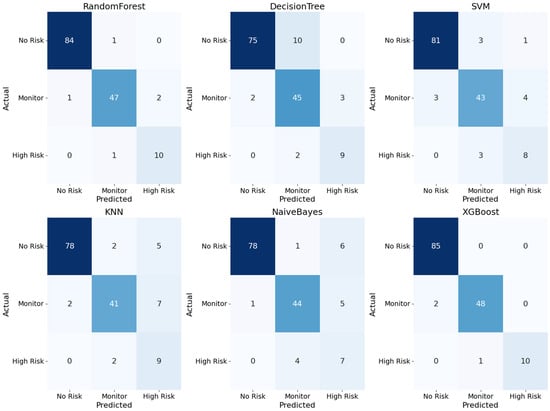
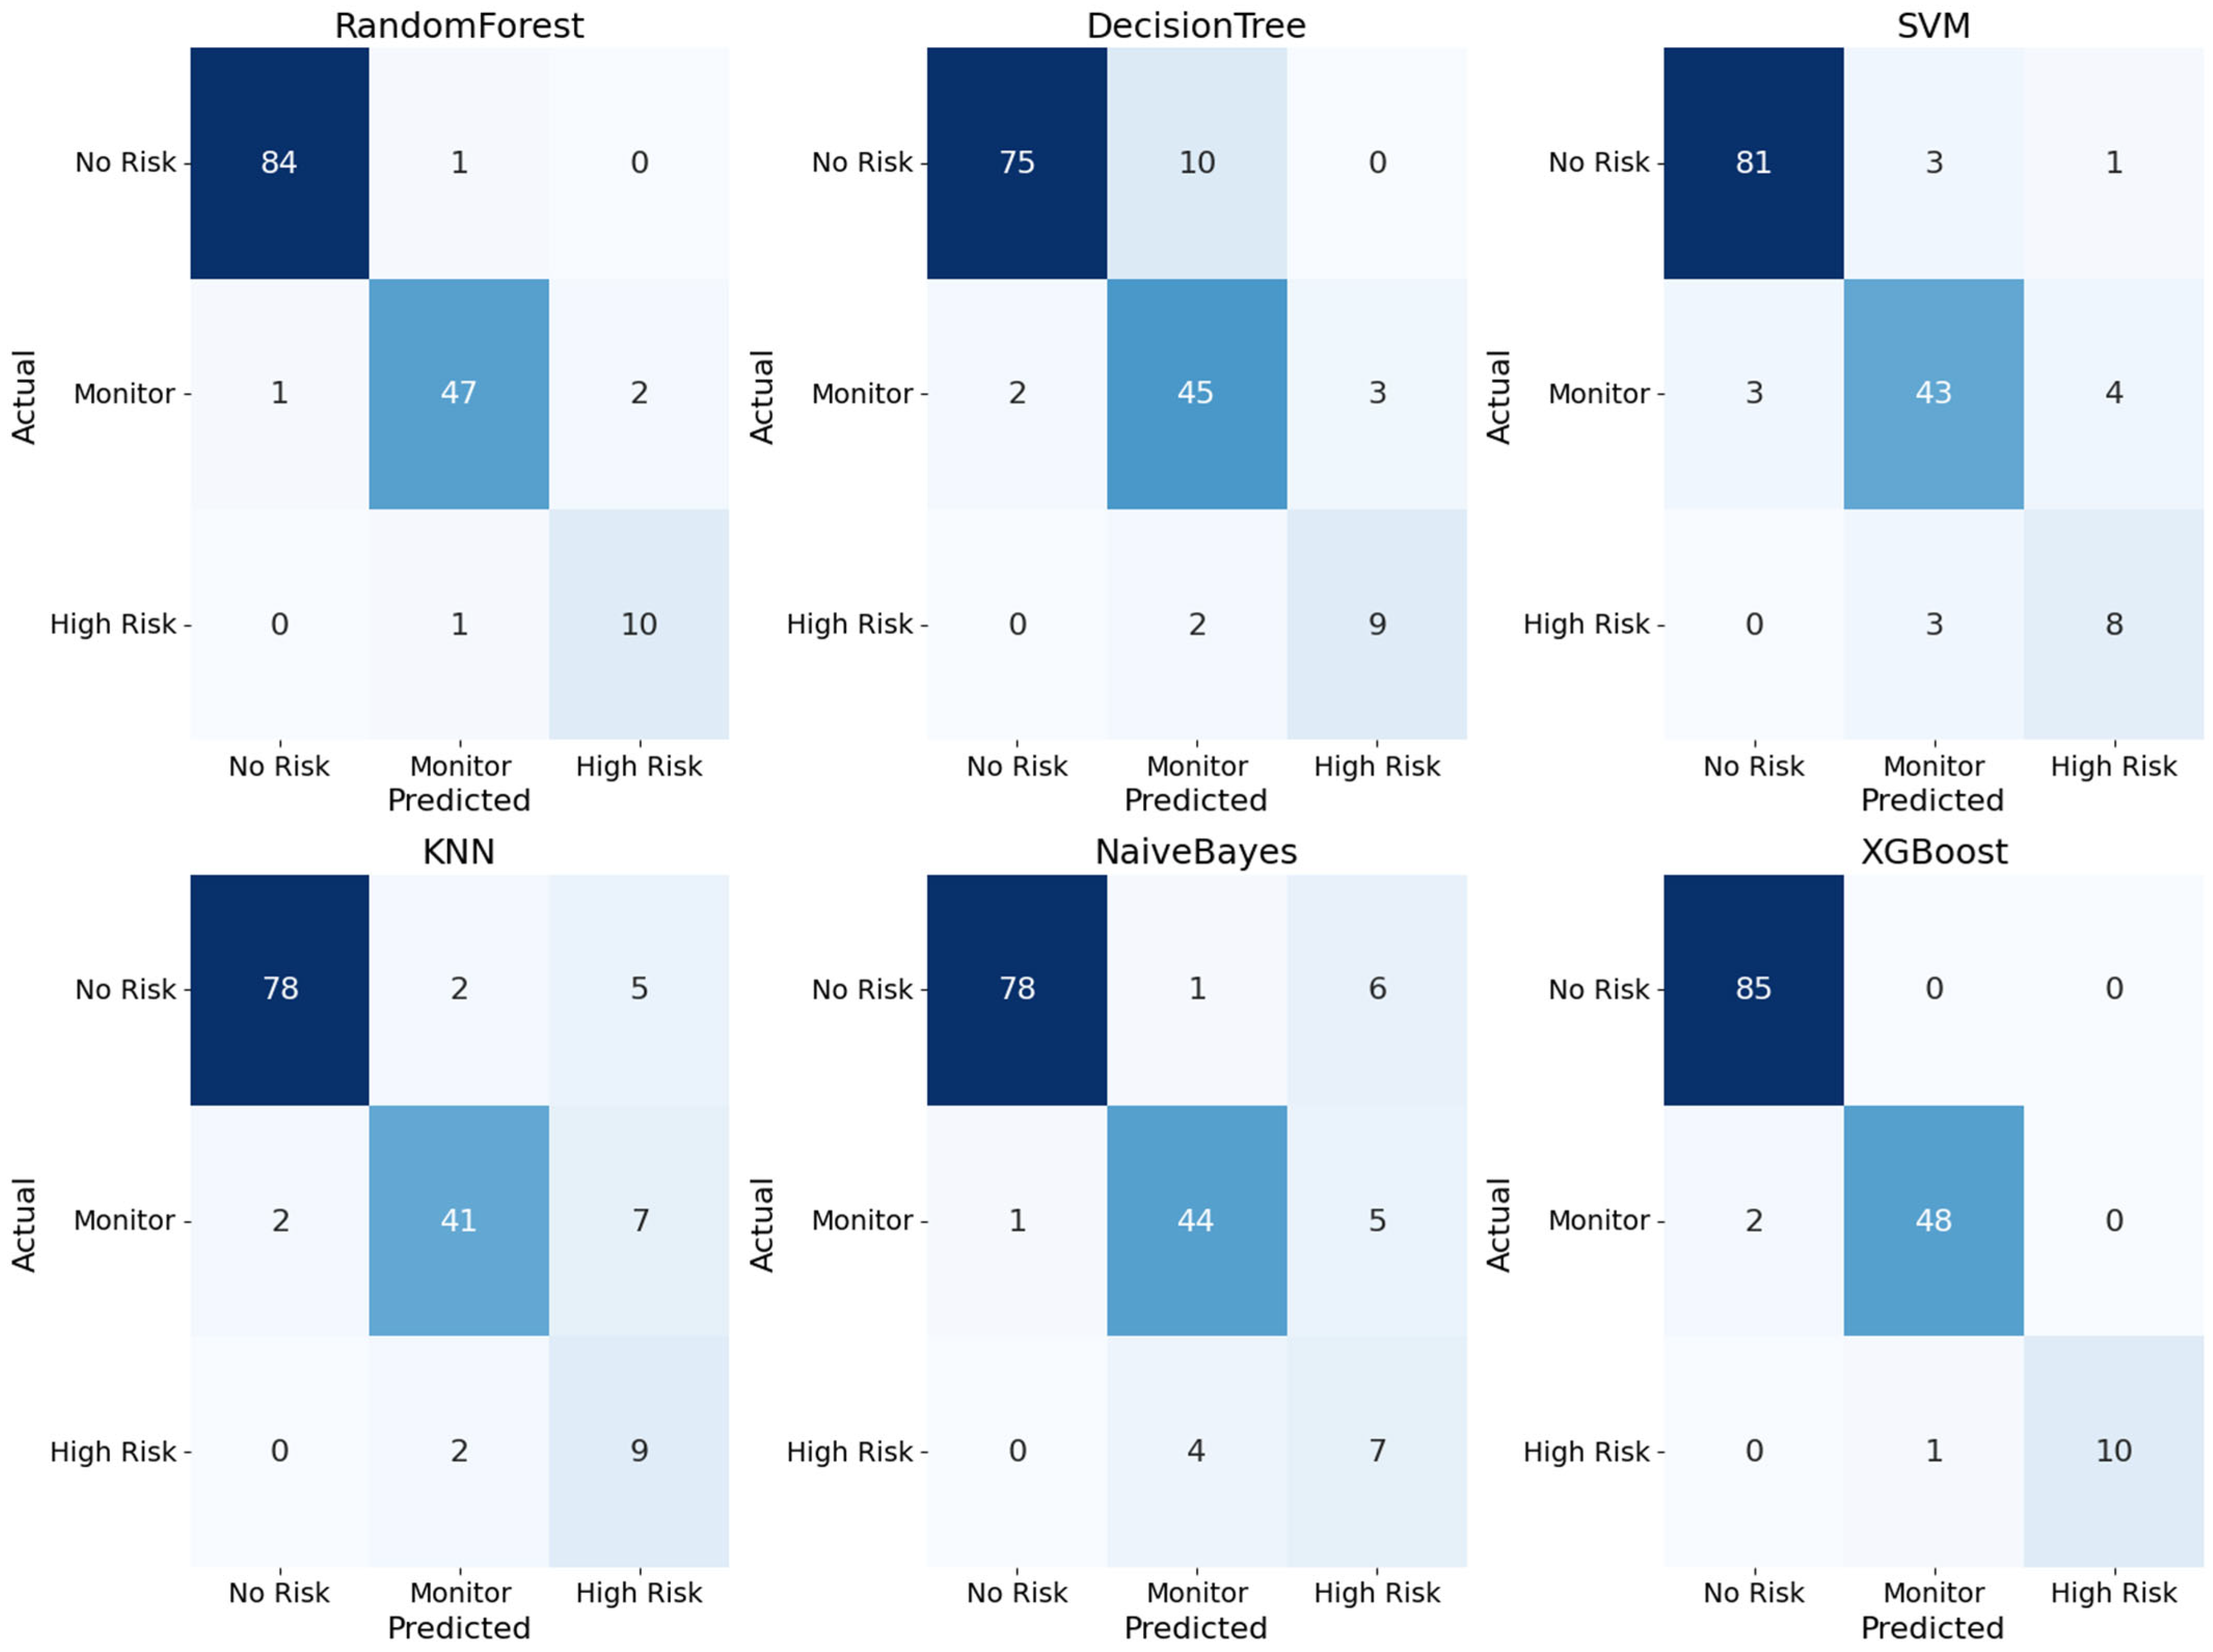
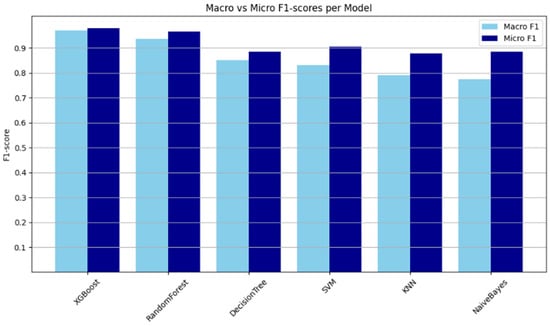
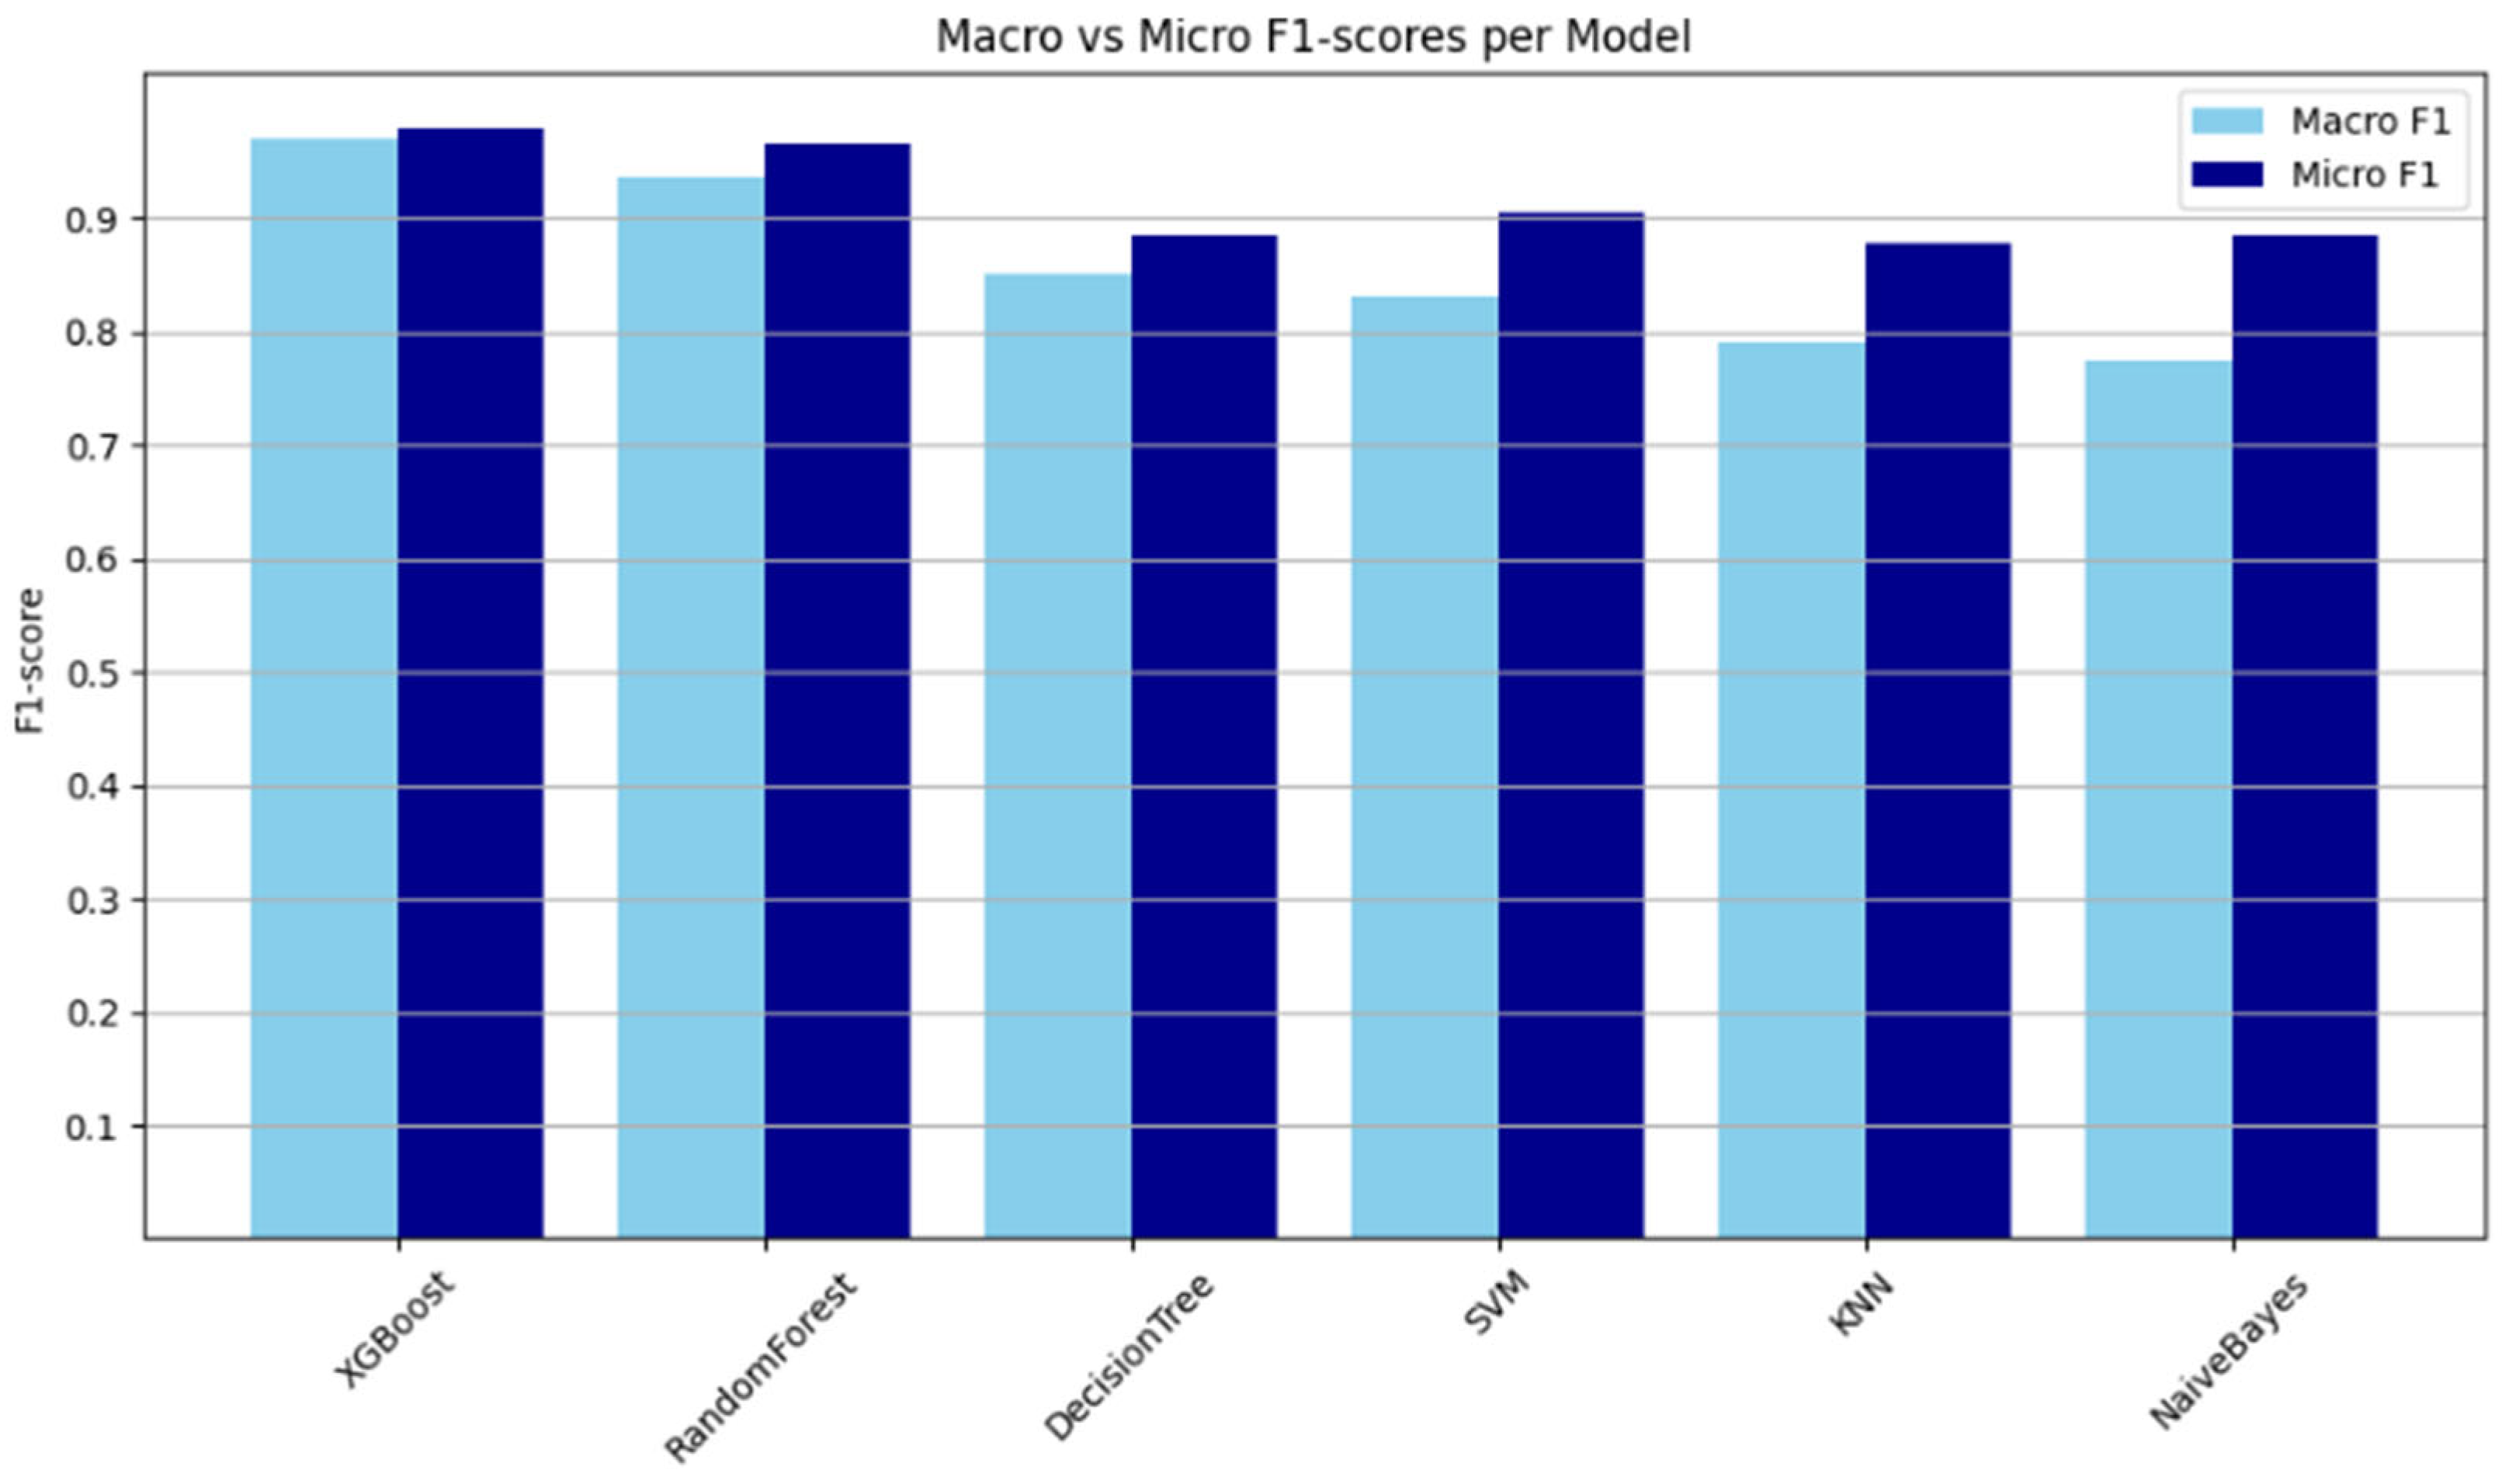
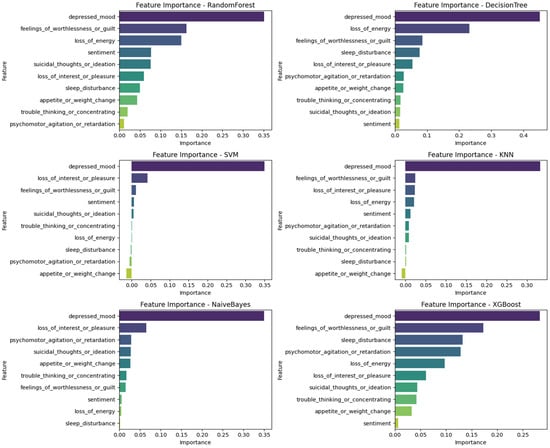
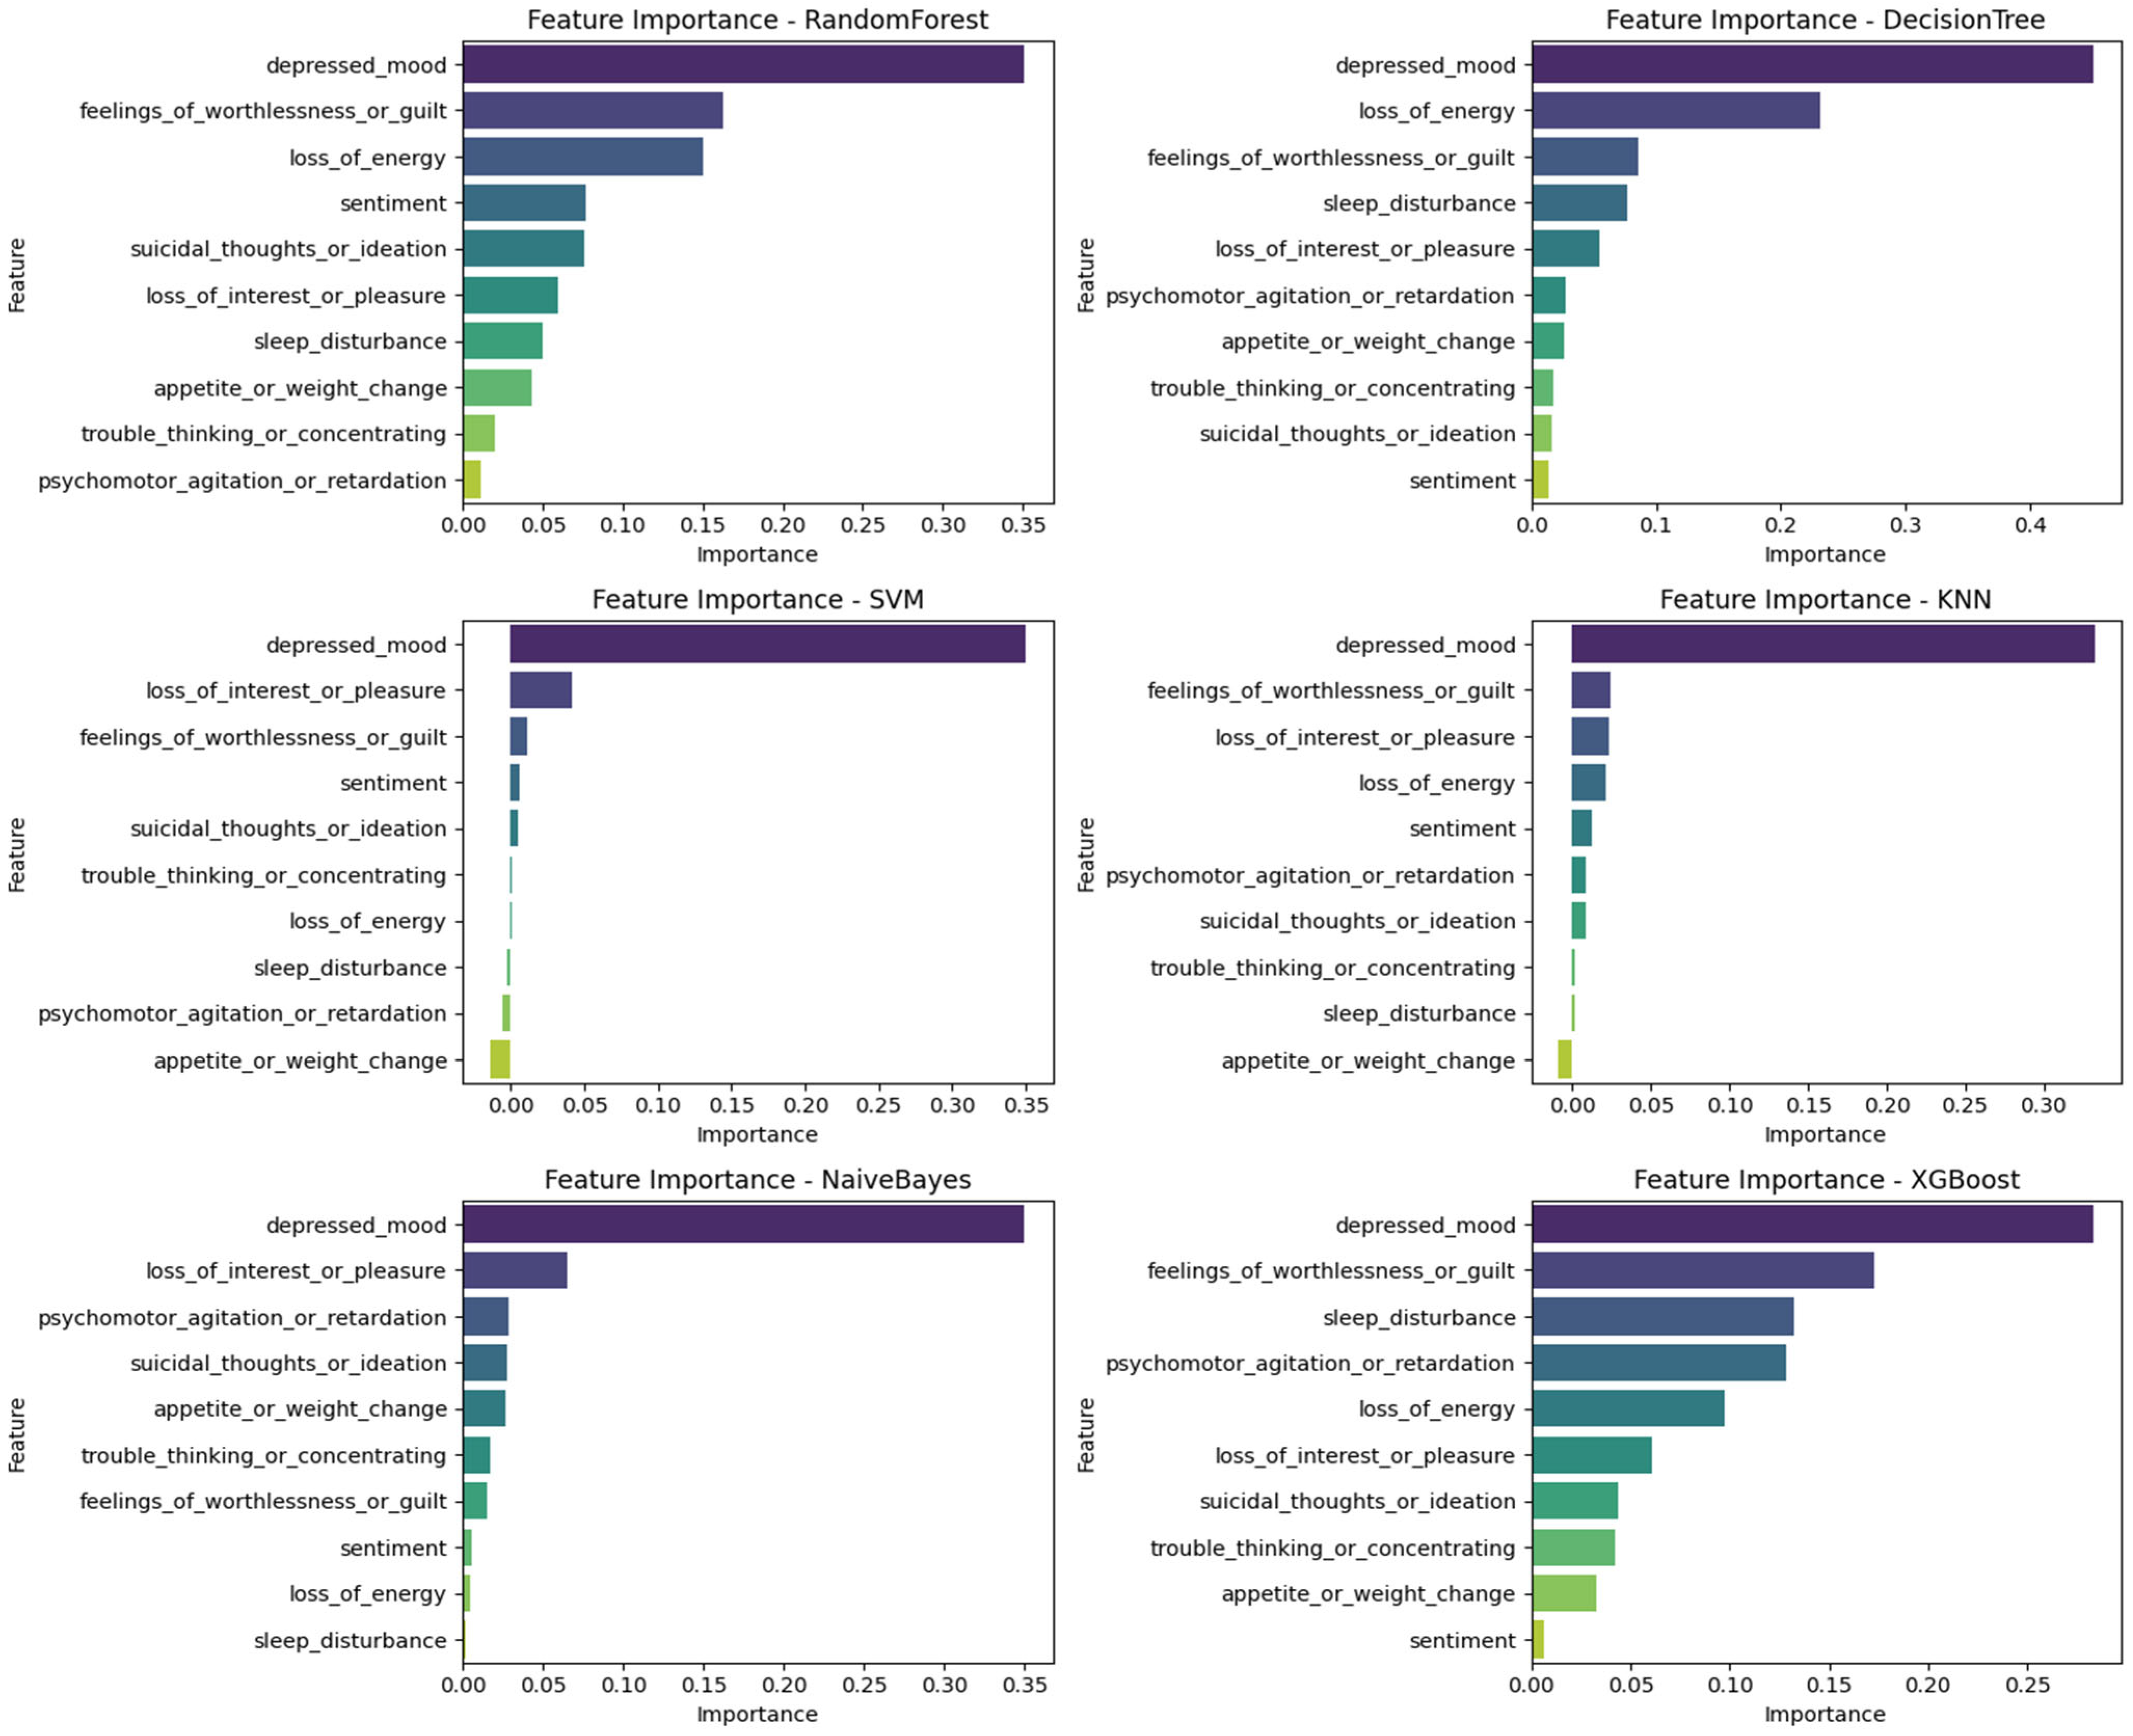
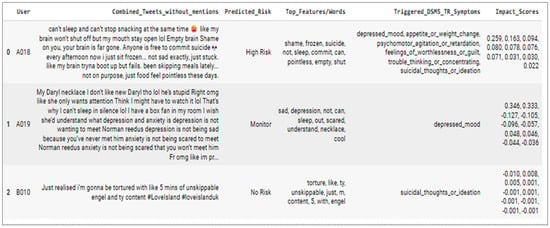
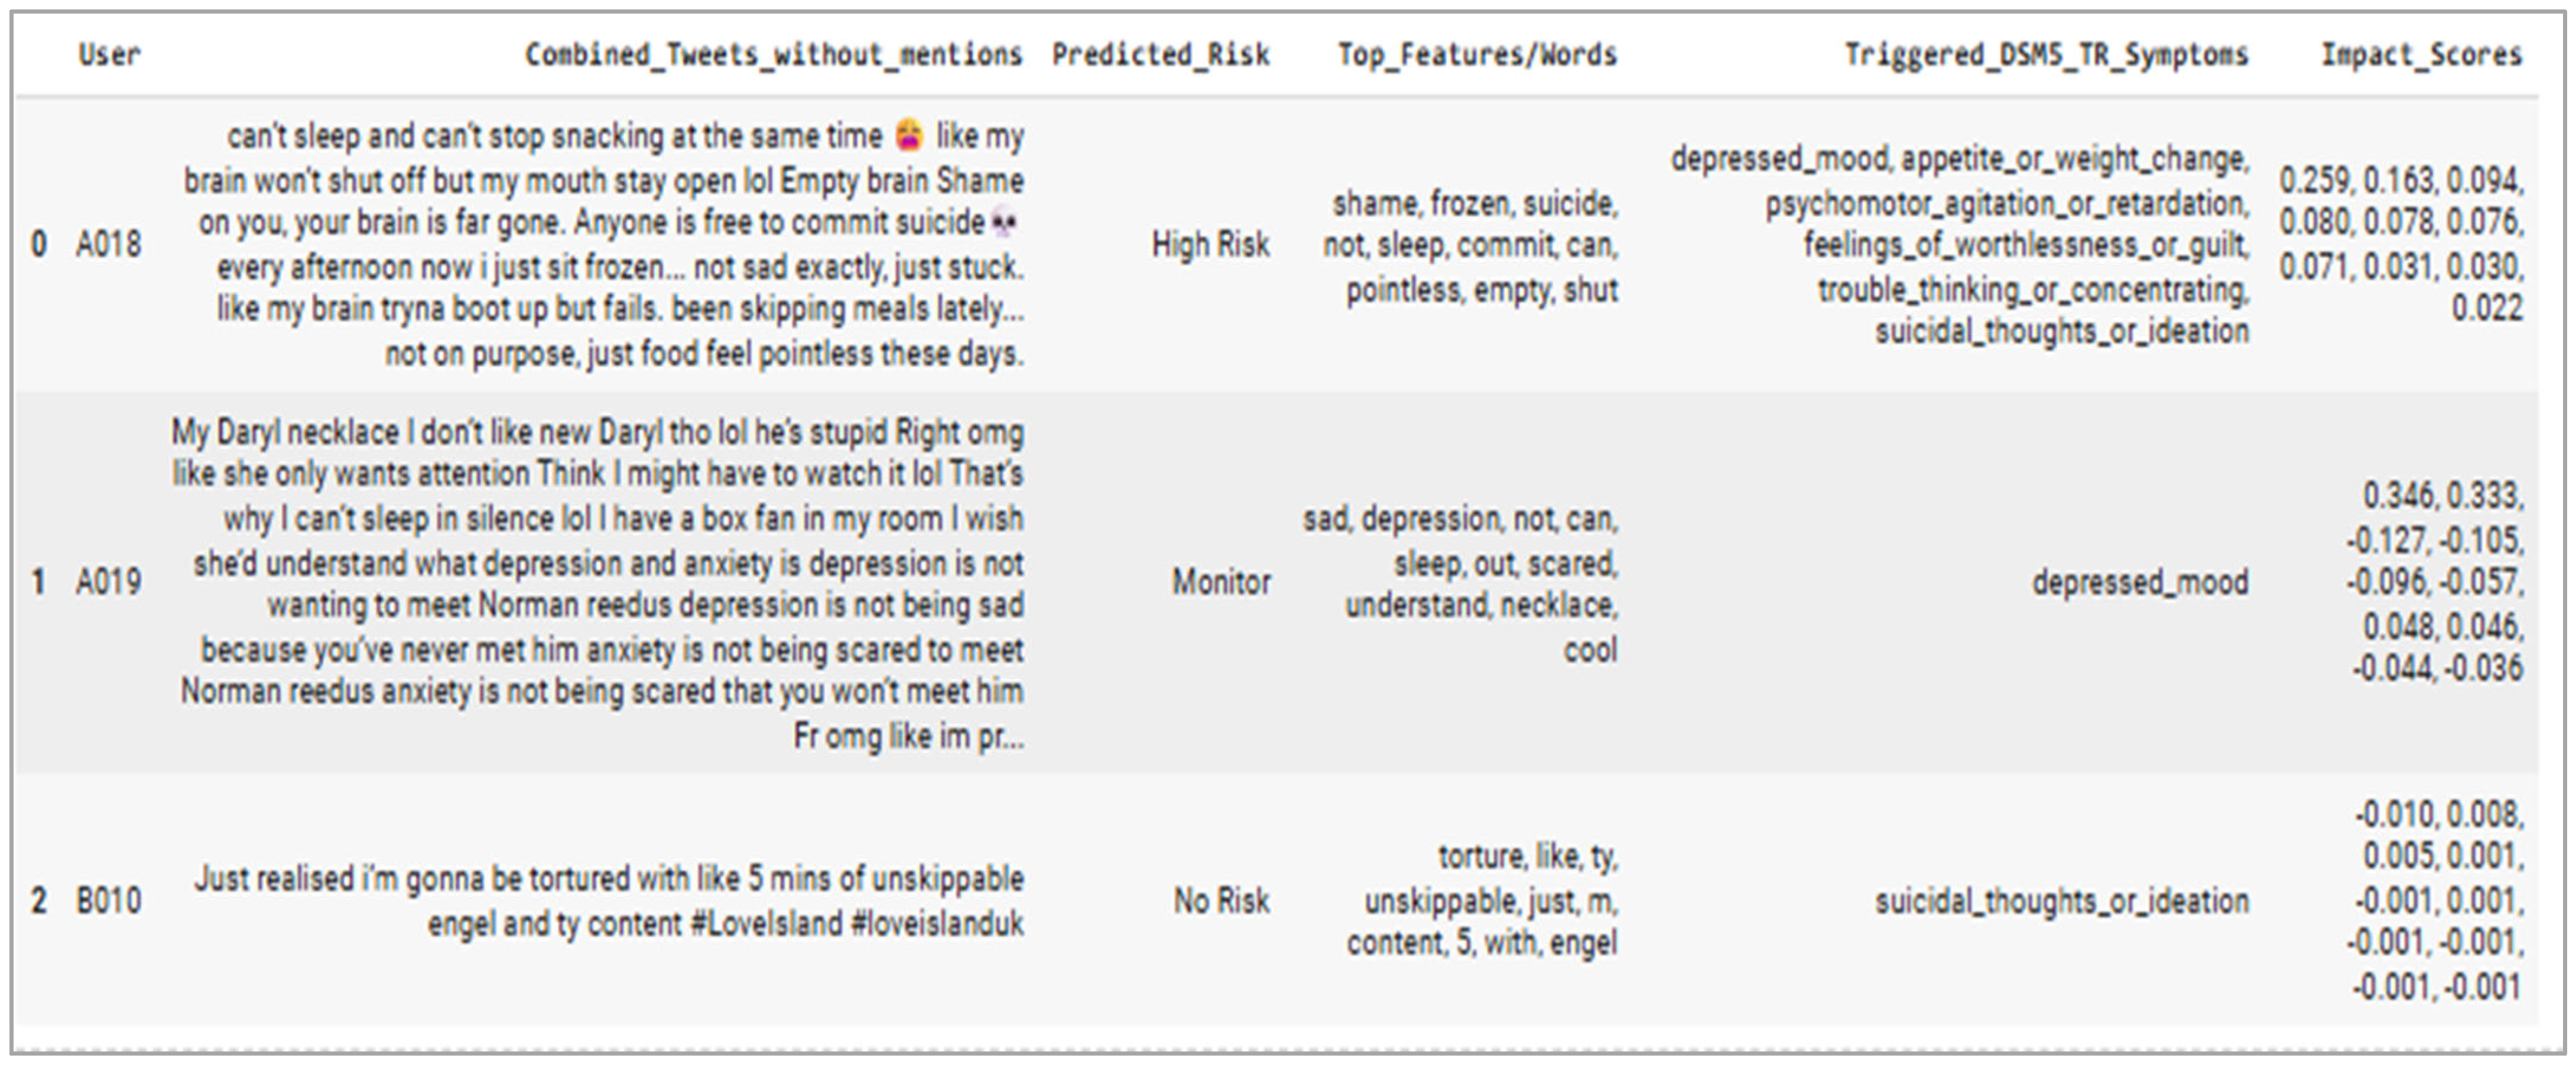
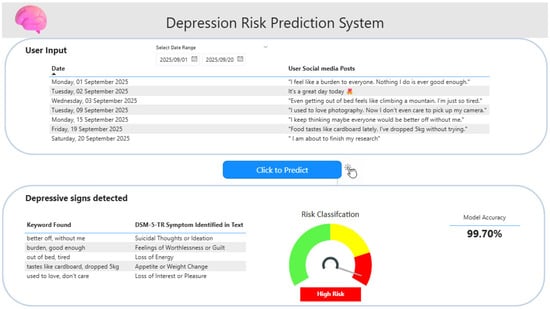
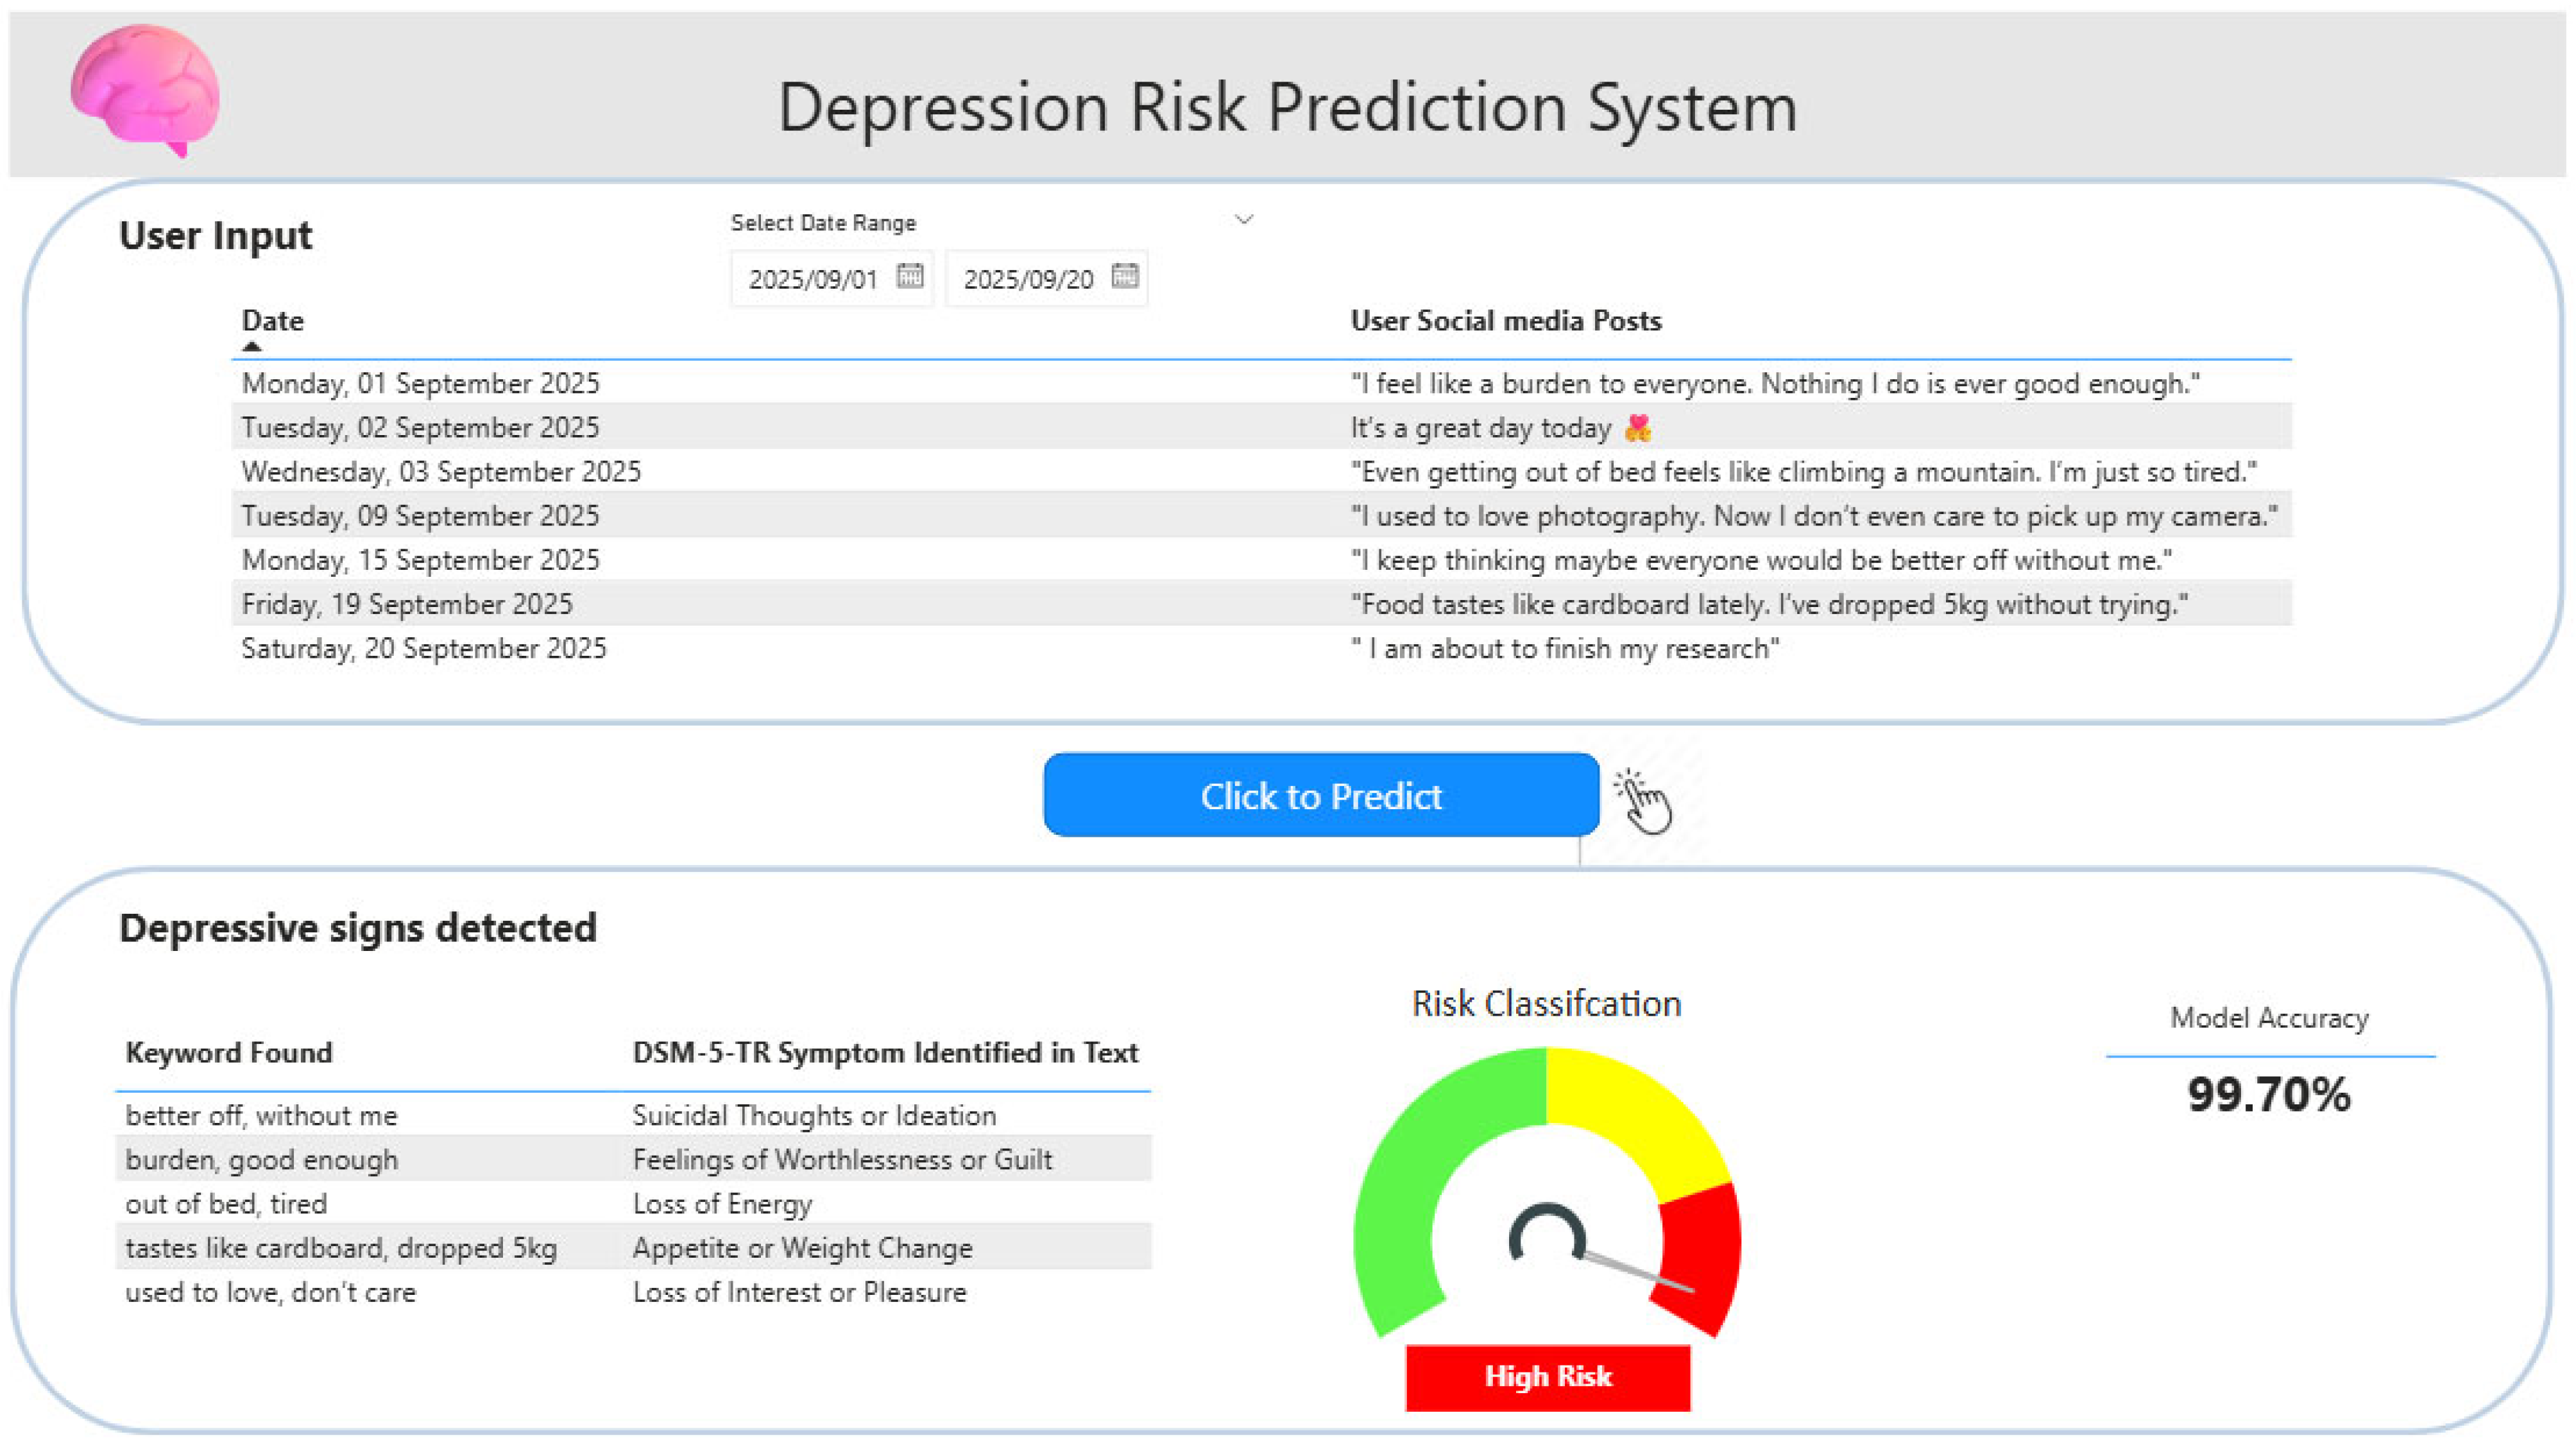

Disclaimer/Publisher’s Note: The statements, opinions and data contained in all publications are solely those of the individual author(s) and contributor(s) and not of MDPI and/or the editor(s). MDPI and/or the editor(s) disclaim responsibility for any injury to people or property resulting from any ideas, methods, instructions or products referred to in the content. |
© 2026 by the authors. Licensee MDPI, Basel, Switzerland. This article is an open access article distributed under the terms and conditions of the Creative Commons Attribution (CC BY) license.