


Abstract
Accurate estimation of soil hydraulic parameters under drip irrigation is essential for improving water flow simulations and optimizing irrigation management; however, field measurements in aeolian sandy soils are often expensive and time-consuming. This study focused on typical aeolian sandy soils in the Kubuqi Desert. Field drip irrigation experiments were conducted to obtain temporal variations in soil water content and wetting front advancement, which were used to inversely estimate and calibrate hydraulic parameters for different soil layers. Soil pore space characteristics were quantified using nitrogen adsorption, and their relationships with hydraulic parameters were analyzed through correlation and redundancy analyses. On this basis, the combined effects of particle-size distribution and pore space structure on parameter prediction were evaluated, and soil water movement under drip irrigation was simulated and validated using HYDRUS-2D/3D. The results indicated pronounced spatial variability in soil hydraulic parameters. Residual water content, saturated hydraulic conductivity, and pore-size distribution index were significantly correlated with specific surface area, total pore volume, mean pore diameter, micropore volume fraction, and pore fractal dimension. Compared with approaches based solely on particle-size distribution, incorporating pore space structure effectively reduced the prediction errors of both hydraulic parameters and wetting front migration, thereby improving simulation accuracy. These findings demonstrate that integrating particle-size distribution and pore space characteristics provides a feasible approach for the rapid estimation of hydraulic parameters and the analysis of water movement in aeolian sandy soils under drip irrigation.
1. Introduction
The soil–water system plays a fundamental role in achieving the United Nations Sustainable Development Goals, particularly in attaining land degradation neutrality by 2030. In agricultural and forestry water use, irrigation accounts for the largest share of total water consumption; therefore, improving irrigation efficiency is a key strategy for alleviating regional water stress. Drip irrigation, as an efficient water-saving technique, can substantially enhance water use efficiency in crops and trees and has been widely applied in agricultural production and ecological restoration [1,2,3,4,5]. Accordingly, quantitatively characterizing soil water movement under drip irrigation is critical for optimizing irrigation parameters and scheduling, thereby enhancing both economic performance and water use efficiency [6,7].
Numerical models based on the theory of saturated–unsaturated soil water flow have become essential tools for analyzing soil water movement under drip irrigation [8]. The reliability of model simulations is highly dependent on the accurate characterization of soil hydraulic parameters, which are controlled by soil texture, structure, and pore system characteristics [6,9,10]. Therefore, the reliable estimation of soil hydraulic parameters is critical for improving the accuracy of soil water movement simulations and facilitating effective irrigation management.
Soil hydraulic properties are commonly characterized by the soil water retention curve and the hydraulic conductivity function, with their parameters governing soil water status and movement under both saturated and unsaturated conditions [11]. Due to pronounced spatial variability in soil particle size, arrangement, and pore structure, hydraulic parameters vary significantly among soil layers and across regions, posing challenges for their accurate determination [12,13,14]. Although direct measurements can provide reliable parameter estimates, they are often time-consuming and costly, and laboratory-derived parameters may not accurately represent field conditions [15,16].
By contrast, indirect estimation approaches based on basic soil physical properties have been widely adopted due to their operational simplicity and relatively low cost. Among these approaches, pedotransfer functions (PTFs) have become an important tool for estimating soil hydraulic parameters [17,18,19]. However, previous studies have shown that conventional indicators, such as soil particle size distribution and bulk density, are insufficient to fully capture variations in soil pore systems (e.g., specific surface area, pore size distribution, and connectivity), thereby limiting the accuracy of hydraulic parameter predictions [20,21].
In recent years, soil pore space characteristics have been increasingly recognized as important indicators of soil structure and water retention capacity [22]. The loose structure and complex pore distribution of aeolian sandy soils render soil water movement highly sensitive to pore space characteristics. Indirect methods, such as nitrogen adsorption, enable the quantitative characterization of pore size distribution, specific surface area, and pore volume fractions, thereby enhancing the understanding of how soil structure influences hydraulic properties [23]. However, most existing studies focus on qualitative analyses of pore structure characteristics, whereas systematic applications integrating pore space parameters into hydraulic parameter estimation and soil water movement simulation under drip irrigation in aeolian sandy soils remain limited.
The methodological innovation of this study lies in three aspects. First, this study systematically integrates nitrogen-adsorption-derived microscale pore structure parameters (SSA, TPV, APD, PMV, Dp1, and Dp2) into a multilayer perceptron (MLP)-based pedotransfer function (PTF) specifically calibrated for aeolian sandy soils under drip irrigation—an approach not previously reported for this soil type. Second, the proposed model extends conventional PTF inputs beyond soil texture and bulk density by incorporating six quantitative pore structure descriptors that capture pore connectivity, micropore fraction, and pore geometry not represented by traditional PTFs (e.g., Rosetta). Third, aeolian sandy soils are characterized by loose structure, high sand content, and highly variable pore systems sensitive to wind erosion and vegetation disturbance, making explicit pore structure quantification particularly valuable for improving hydraulic parameter prediction accuracy. Three specific hypotheses were tested: (H1) pore space structural parameters are significantly correlated with soil hydraulic parameters; (H2) incorporating pore structure information into PTFs improves hydraulic parameter prediction accuracy compared to texture-only models; and (H3) pore-structure-informed parameter sets improve HYDRUS-2D/3D simulation of wetting front dynamics.
Accordingly, this study focuses on typical aeolian sandy soils in the Kubuqi Sandy Land to address the limited application of pore space characteristics in hydraulic parameter estimation under drip irrigation. Soil hydraulic parameters were calibrated based on field drip irrigation experiments, and the relationships between pore space characteristics and hydraulic parameters were analyzed. In addition, the feasibility of incorporating pore structure information into hydraulic parameter estimation and soil water movement simulation was evaluated. This study aims to provide a basis for the rapid estimation of soil hydraulic parameters and the analysis of soil water movement under drip irrigation in aeolian sandy soils, thereby supporting water-saving irrigation management and ecological restoration in sandy land regions.
2. Overview of the Study Area
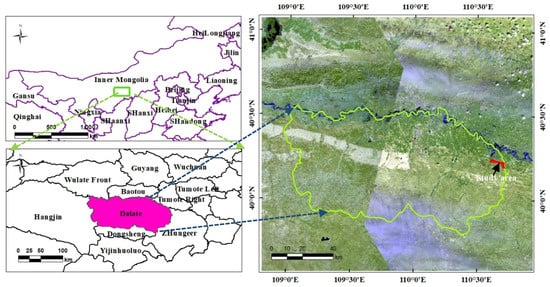
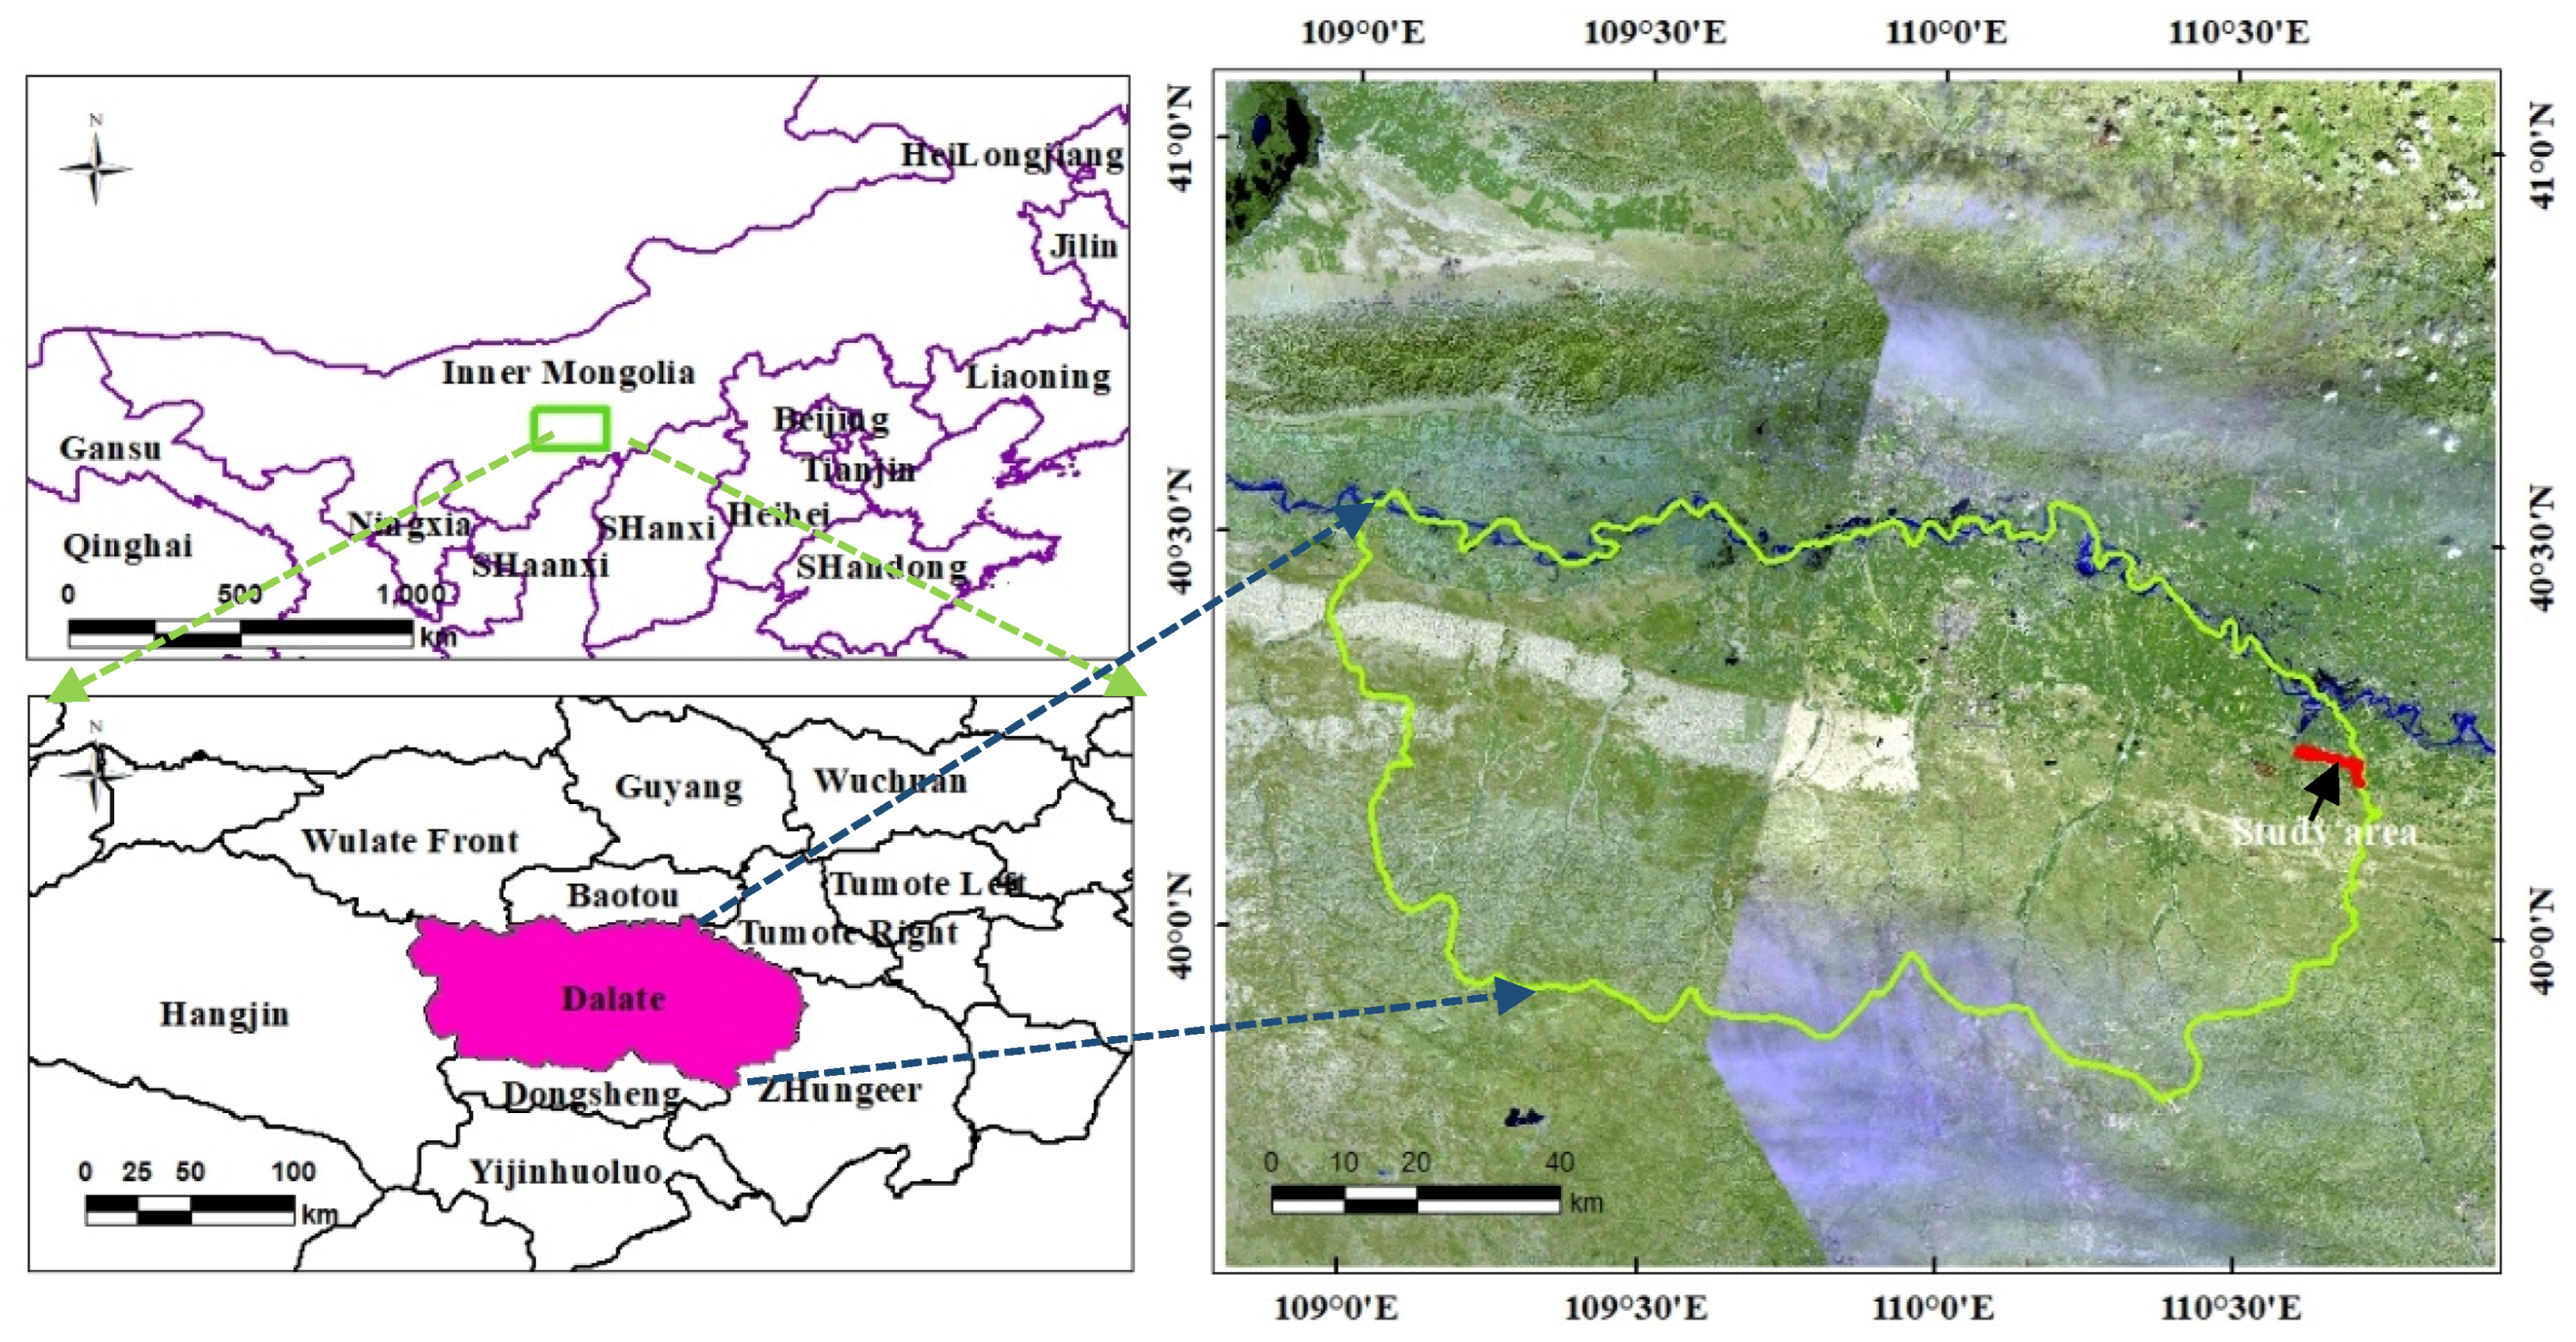
The study was conducted at the Caositan Forest Protection Station (110°39′14″ E, 40°14′24″ N) of the Gouxinzhao branch of the Ordos Afforestation General Plant, Dalat Banner, Ordos City, Inner Mongolia Autonomous Region, at an average altitude of 1012 m (Figure 1). The region has a temperate continental monsoon climate, with an average annual temperature of 6.1 °C, annual precipitation of 297.3 mm, annual evaporation of 2161 mm, and mean relative humidity of 52%. Most precipitation occurs from July to September, averaging 211.4 mm and accounting for 71.1% of the annual total.
Figure 1.
Study area.
The soils in the study area are classified as grassland aeolian sands according to the Chinese soil classification system. Aeolian sandy soils are characterized by high sand content, coarse texture, a loose and dispersed structure, and low water and nutrient retention capacity. They develop from an aeolian sand matrix, with formation driven by the combined effects of wind erosion, sand deposition, leaching, biological soil fixation, and nutrient accumulation. Soil formation in aeolian sandy soils is generally weak and frequently disrupted by wind erosion and sand deposition. Water infiltrating into deeper soil layers experiences high losses and low utilization efficiency, making the soil highly susceptible to both water and wind erosion [24]. The main tree species in the artificial forests of the study area are willow, Populus, and red pine. Herbaceous vegetation beneath the trees is dominated by annual species, whereas natural grasslands are dominated by perennials.
3. Research Methods
3.1. Experimental Design
Based on soil utilization, the study area was divided into seven experimental plots, each containing three test plots. One test plot was randomly selected from each experimental plot and labeled I–VII. Each test plot measured approximately 40 m × 36 m, and the trees were well-established and evenly distributed. Drip irrigation was installed in July 2021, with drippers delivering 3.0 L/h and spaced 1.0 m apart. The drippers were arranged on the soil surface in two lateral lines along each tree row, with irrigation pipes positioned 30 cm from both sides of the trees.
In August 2021, prior to measuring wetting front movement in test plots I–V, three standard trees were randomly selected per plot. A data acquisition recorder (JL-01, Qingyi, Jilin, China) was installed at 5, 20, 60, and 120 cm from the dripper adjacent to each sample tree to record soil volumetric water content (θ) at 15 min intervals, with a total of 12 datasets collected. FDR soil water sensors (FDS-100, Qingyi, Jilin, China) were installed at 20, 30, 40, 60, 80, and 100 cm depths for each recorder, enabling θ measurements down to 1 m, with a total of 72 sensors deployed. Forty-eight hours after irrigation ended, the sensors were repositioned in the next plot. During measurements, all surface areas surrounding the water content sensors were covered with plastic film to minimize the effects of rainfall and evaporation.
During the growing season, tree growth begins to decline when soil water availability falls below 70% [6,25]. In the study area, soil θ should be at least 78.9% of field water capacity. Therefore, irrigation was initiated when θ at 20 cm below the dripper reached 81% of field capacity, corresponding to a soil water potential of approximately −20 kPa. To minimize variability, the θ of the same soil layer across different test plots was maintained within 0.05 cm3·cm−2 at the start of irrigation. Following [22], the irrigation duration was set to 6 h, and field water capacity was determined indoors for different plots using the ring-knife method.
3.2. Soil Sample Collection and Determination
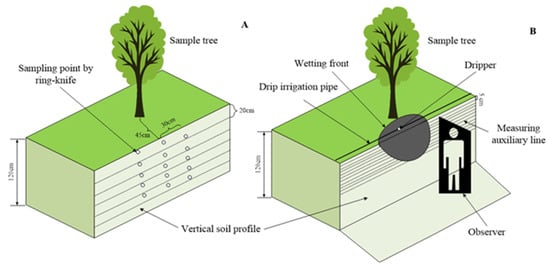
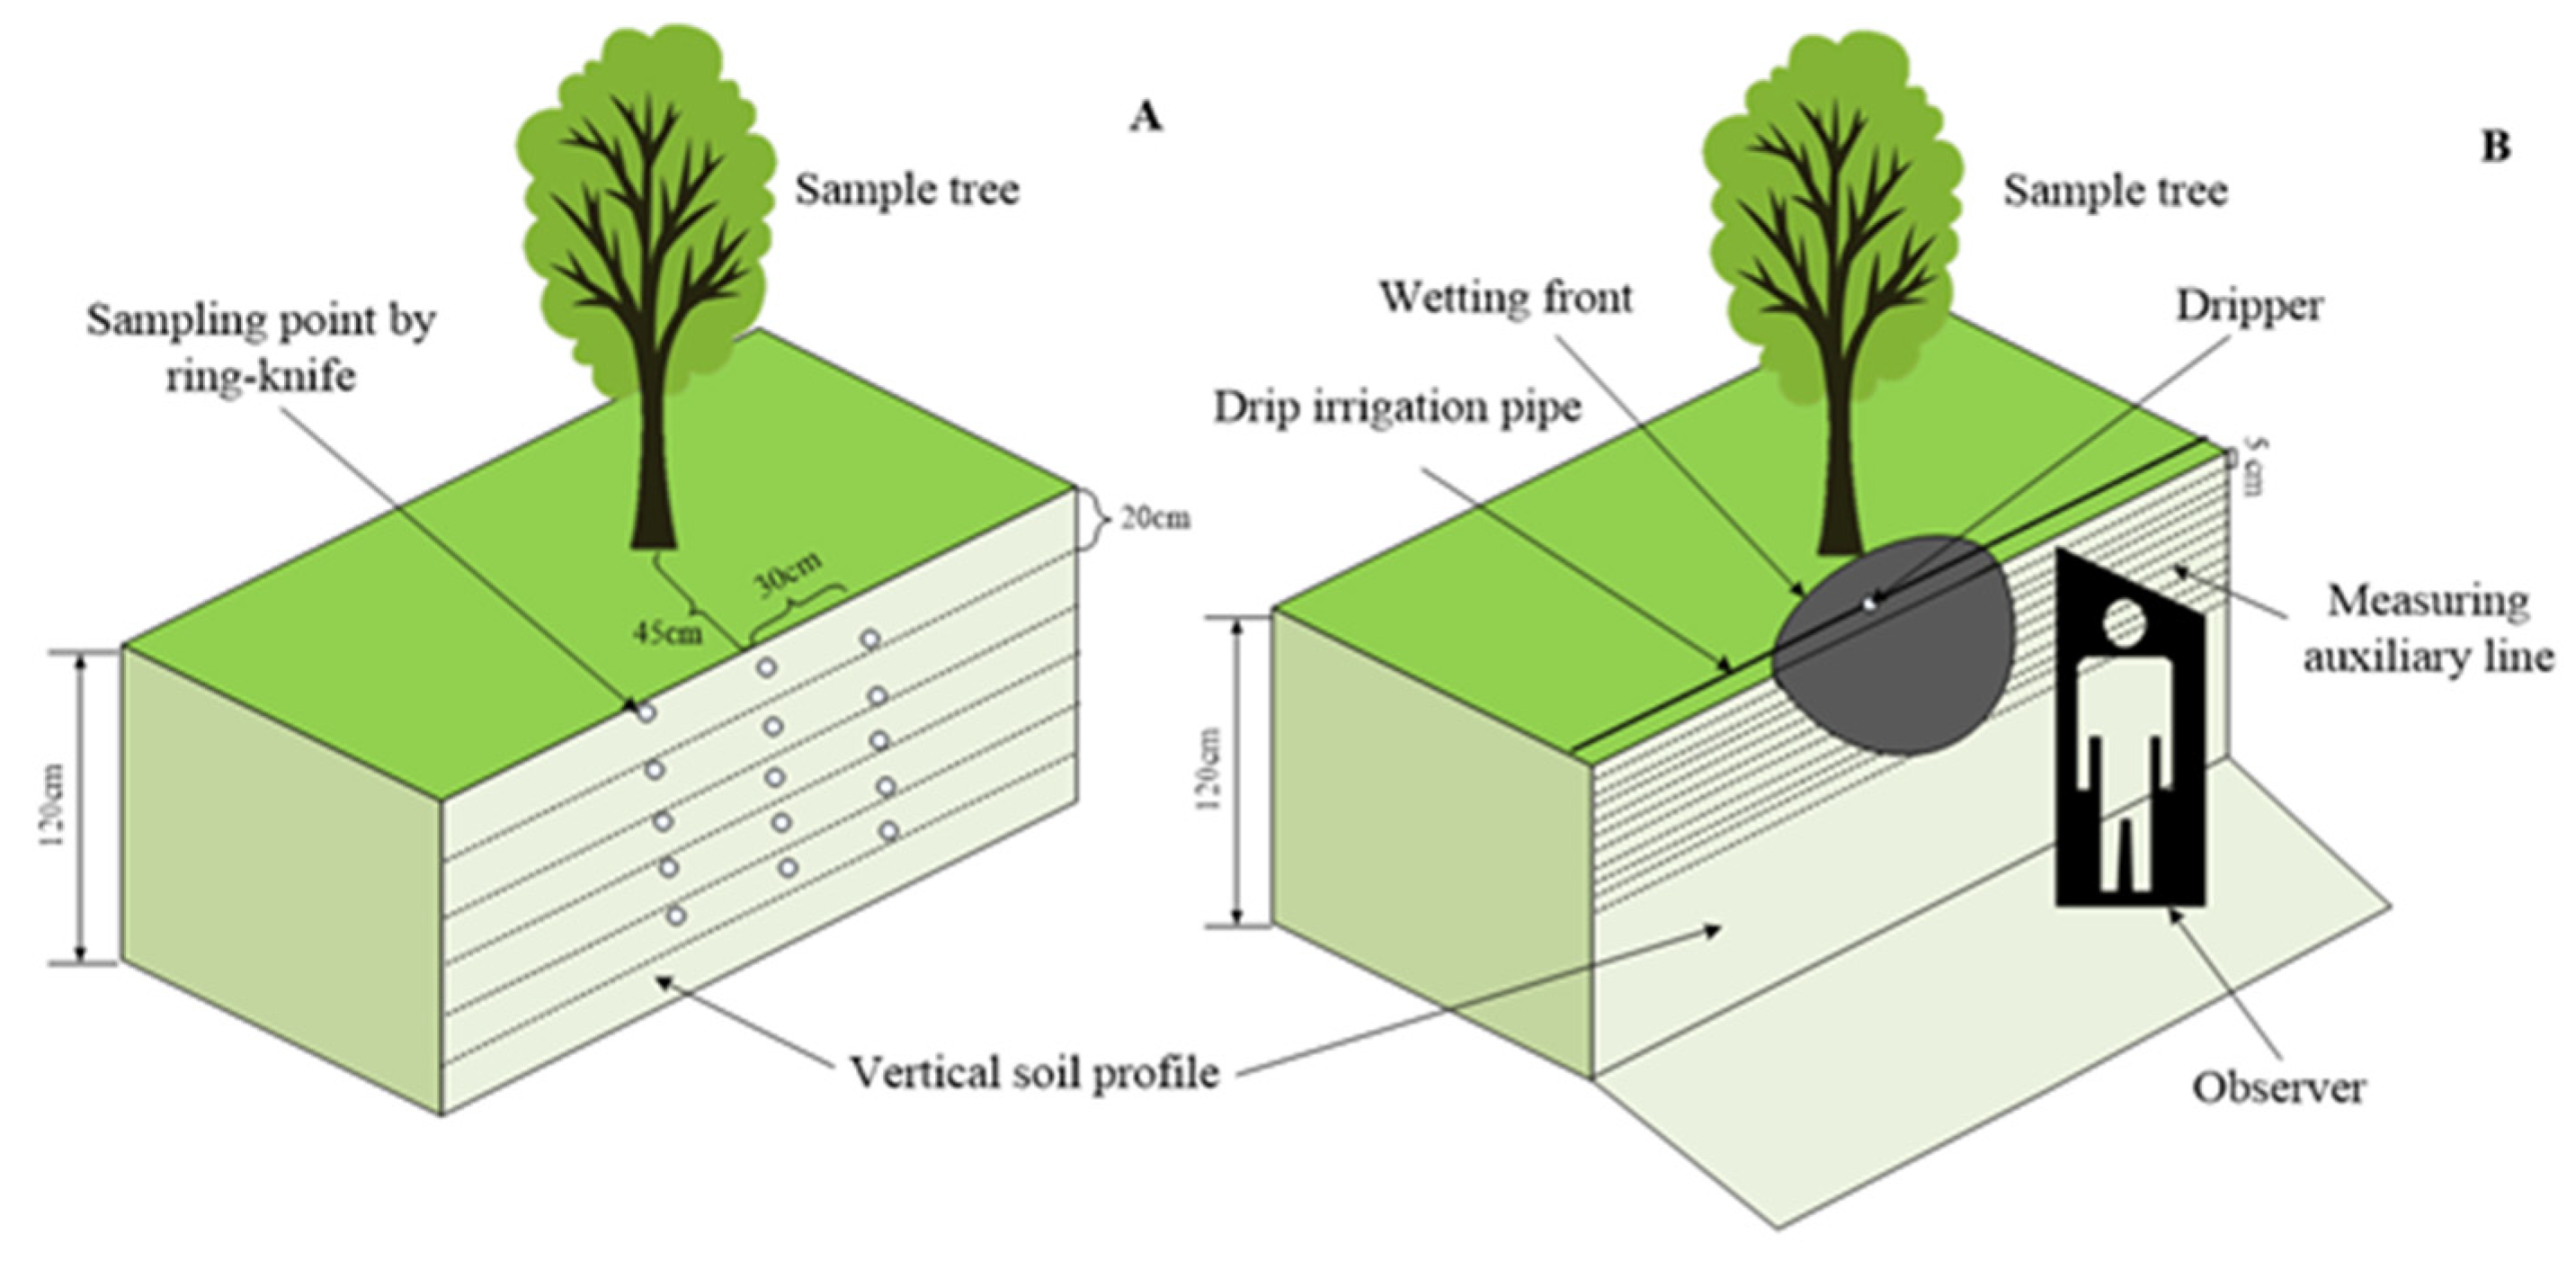
Soil samples were collected in early August 2021 from seven experimental sites, including six plantations and one natural meadow. In the plantations, soil sampling sections were established between adjacent forest belts, with a uniform distance of 45 cm from the forest belt (15 cm from the dripper). In each experimental plot, three standard trees (total of 12 trees) were randomly selected, and three soil profiles per tree were used for layered sampling. For the natural meadow, three soil profiles per plot were randomly selected, with profile distances of 10–20 m. Considering the groundwater level and soil water movement, soil samples were collected to a depth of 100 cm at 20 cm intervals (0–20, 20–40, 40–60, 60–80, and 80–100 cm). Three samples were randomly taken from each layer using a ring knife with a volume of 100 cm3 (Figure 2A).
Figure 2.
Schematic diagram of soil sample collection and wetting front movement measurement. (A). Schematic diagram of soil profile sampling. (B). Schematic diagram of wetting front migration measurement.
Soil particle size distribution (PSD) was determined at the Soil Physics Laboratory of Inner Mongolia Agricultural University. Following the pretreatment method ofsoil particle composition was measured using a laser particle size analyzer (RODOS/M, Sympatec, Clausthal-Zellerfeld, Germany) based on laser diffraction. The proportion of each particle size class was then calculated according to the USDA soil texture classification method.
Soil bulk density was determined using the ring-knife method. Laboratory analyses of the collected samples were performed to measure bulk density and field water capacity. A total of 105 soil samples were collected, calculated as 7 test plots × 5 depths × 3 replicates. The specific surface area tester (Gemini VII 2390, Micromeritics, Norcross, GA, USA) was used to measure the pore spatial structure parameters based on the nitrogen adsorption method. The nitrogen adsorption test was conducted after mixing three different sections of soil samples in various soil layers. The soil sample pretreatment method was based on that of.
3.3. Measurement Items and Methods
(1) Wetting front horizontal movement distance
In August 2021, three drippers were randomly selected in each test plot (21 drippers in total). The horizontal movement of the wetting front during and after drip irrigation was measured using a tape. Measurements were taken every 10–20 min during irrigation, once per hour immediately after irrigation stopped, and once every 12 h for up to 41 h post-irrigation (Figure 2B). During measurements, the soil surface near each profile was covered with plastic film to minimize the effects of evaporation.
(2) Wetting front vertical movement distance
Observation pits were excavated near each dripper, measuring 2.0 m in length, 1.5 m in width, and 1.2 m in depth, with the long side positioned 10 cm from the dripper. The vertical movement of the wetting front during and after drip irrigation was measured using a tape and auxiliary lines at 5 cm intervals from the soil surface (Figure 2B). Measurements were taken every 20 min during irrigation and within the first 4 h after irrigation stopped, once per hour from 4 to 41 h post-irrigation.
(3) Pore spatial structure parameters
Soil nanopore characteristics were determined using a specific surface analyzer (SSA) based on nitrogen adsorption. The adsorption isotherms were obtained, and the soil specific surface area (SSA) was calculated using the Brunauer–Emmett–Teller (BET) multilayer adsorption theory (Equation (1)). Average pore diameter (APD), total pore volume (TPV), and pore size distribution were derived from the adsorption data using the Barrett–Joyner–Halenda (BJH) method in combination with the Kelvin equation. The underlying principles have been described by [22].
In Equation (1), p is the adsorption pressure (kPa), p is the saturated vapor pressure of the adsorbent (kPa), Q is the volume of nitrogen adsorbed by the sample (cm3·g−1), Qm is the monolayer saturated adsorption volume (cm3·g−1), and c is the BET constant.
(4) Pore fractal dimension
Based on the isothermal adsorption data, the ln [ln(p0/p)] value was taken as the independent variable, and lnV was the dependent variable for linear fitting. Then, the slope was the K value, and the pore fractal dimension of the soil under the FHH model Count Dp was calculated. Despite slight differences in the shape of the nitrogen adsorption curve in this study, the overall shape is a reversed “S”. According to the IUPAC classification method, when the curve is close to the type II isothermal adsorption line, the relative adsorption pressure can be divided into 0 < p/p0 < 0.5, 0.5 < p/p0 < 1.0. The soil pore fractal dimension of each pressure section is expressed as Dp1 and Dp2. Dp1 reflects the irregularity of the pore surface, also known as the surface fractal dimension; Dp2 reflects the complexity of the internal structure of the pore, also known as the structural fractal dimension.
3.4. Numerical Simulation and Parameter Calibration
(1) Model construction
The HYDRUS-2D/3D software (Version 4), developed by the U.S. Salinity Laboratory, was used to simulate soil water movement under drip irrigation in each test plot. Due to the relatively large dripper spacing, wetting fronts from adjacent drippers did not merge immediately after irrigation began, resulting in a roughly circular wetting zone centered at each dripper. Accordingly, soil water movement was approximated as two-dimensional flow from a point source. Assuming the soil to be a homogeneous and isotropic rigid porous medium and neglecting the effects of gas phase and temperature, soil water movement was described using the two-dimensional Richards equation [26].
Simulation area, initial and boundary conditions
The simulation domain was defined as a rectangular area with a lateral width of 300 cm and a vertical depth of 100 cm.
The initial condition was defined using the volumetric water content profile measured prior to irrigation, assuming a linear distribution of water content within each soil layer based on the measured values.
A variable flow boundary was applied at the dripper, with different flow rates during and after irrigation. A saturated zone with a radius W (measured as 1.5 cm in this study) was assumed around the dripper, and the change in radius over time was neglected. The flow density at the boundary was then calculated as described by [26]:
In the equation, σ(t) is the flow density (cm·h−1) at the variable flow boundary in the saturated zone around the dripper, Q(t) is the dripper flow rate (L·h−1), and Leis is the dripper spacing (cm). As the groundwater level at the experimental site is relatively deep (~20 m), the lower boundary of the simulation domain was set as a free drainage boundary, while all other boundaries were set as no-flow boundaries.
(2) Calibration of hydraulic parameters and model validation
It should be noted that the soil hydraulic parameters reported in this study were not directly measured in the field or laboratory, but were estimated through inverse modelling using HYDRUS-2D/3D, with Rosetta 3-derived values serving as initial parameter estimates. Firstly, based on soil particle size distribution and bulk density, Rosetta 3 software [12] was used to predict hydraulic parameters—including residual water content (θr), saturated water content (θs), air-entry parameter (α), pore shape coefficient (n), saturated hydraulic conductivity (Ks), and others—of 75 soil samples (71.43% of the total) from five test plots with different particle size ratios in each soil layer, using artificial neural network prediction.
Subsequently, using measured θ before, during, and within 48 h after irrigation, the hydraulic characteristic parameters of each soil layer in each test plot were obtained through the inverse solution function in HYDRUS-2D/3D. During the inverse solution, (θr) was fixed to ensure more accurate results. The Levenberg–Marquardt algorithm was employed for parameter optimization within HYDRUS-2D/3D. The objective function minimized the sum of squared differences (SSQ) between simulated and observed volumetric soil water content. Convergence was considered achieved when the relative SSQ reduction between successive iterations fell below 1 × 10⁻⁶ or the maximum number of iterations (100) was reached. θr was fixed at the Rosetta 3-predicted value to improve inversion stability, while θs, α, n, and Ks were simultaneously optimized within the search intervals stated above. Finally, the hydraulic parameters were calibrated using wetting front movement data. After calibration, R2, RMSE, and RE were evaluated to ensure that the adjusted parameters met the simulation accuracy requirements. Neural network modeling of hydraulic parameters was then conducted based on the calibrated values. The remaining 30 soil samples (28.57% of the total) from two test plots were used to validate the HYDRUS-2D/3D simulation results against experimental observations.
3.5. Model and Data Analysis
(1) Model analysis and evaluation
The adjusted coefficients of R2, RMSE and RE were used to evaluate the results to analyze the accuracy of the hydraulic parameter model. The higher the adjusted R2 value, the lower the RMSE and the better the prediction performance and accuracy of the built model. When RE ≤ 10%, the model is premium; when 10% < RE ≤ 20%, the model is moderate; the model is poor when RE > 20% [11], as described below.
where n is the sample size; is the actual measurement value; is the predicted value; is the mean actual measurement and k is the number of independent variables.
(2) Data analysis
The experiment was designed with seven test plots randomly assigned, and one-way analysis of variance (ANOVA) was used to compare mean values among the plots (Table 1). Plot (experimental plots I–VII) was entered as the grouping factor in the one-way ANOVA model, with three replicate soil profiles serving as the unit of replication. Prior to ANOVA, the assumptions of normality and homogeneity of variance were assessed using the Shapiro–Wilk test and Levene’s test, respectively. For all statistical tests, significance was defined when p < 0.05. The multilayer perceptron (MLP) neural network was implemented using IBM SPSS Statistics (version 25). The input variables of the traditional model included soil particle size distribution (sand, silt, and clay contents) and bulk density, while the improved model additionally incorporated pore structure parameters derived from nitrogen adsorption, including specific surface area (SSA), total pore volume (TPV), average pore diameter (APD), micropore volume fraction (PMV), and pore fractal dimensions (Dp1 and Dp2). The output variables were soil hydraulic parameters, namely saturated water content (θs), air-entry parameter (α), pore shape coefficient (n), and saturated hydraulic conductivity (Ks). The MLP architecture consisted of an input layer, one hidden layer, and an output layer. The number of neurons in the hidden layer was automatically optimized by SPSS based on model performance during training. The hyperbolic tangent (tanh) activation function was used in the hidden layer to capture nonlinear relationships, while a linear (identity) activation function was applied in the output layer. Model training was conducted using the scaled conjugate gradient (SCG) algorithm, which provides efficient optimization for nonlinear problems without requiring manual tuning of the learning rate. The dataset was randomly divided into training (60%), validation (20%), and testing (20%) subsets. The validation set was used to monitor model generalization performance and prevent overfitting. To further improve model robustness, early stopping was applied: training was terminated when the error on the validation set no longer decreased. All input variables were automatically normalized by the software prior to training to ensure numerical stability and improve convergence efficiency. Model performance was evaluated using the adjusted coefficient of determination (R2), root mean square error (RMSE), and relative error (RE). The same network configuration and training strategy were applied to both the traditional model and the pore-structure-informed model to ensure a fair comparison. The obtained parameter set was evaluated based on RMSE and RE. All statistical analyses were performed using SPSS version 25 (IBM® SPSS® Statistics, New York, NY, USA). Other data were processed and visualized using Microsoft Excel 2016 and Origin 2019.
Table 1.
Calibration results of hydraulic parameters in the test plots I–V.
4. Results
4.1. Soil Particle Size Distribution and Bulk Density
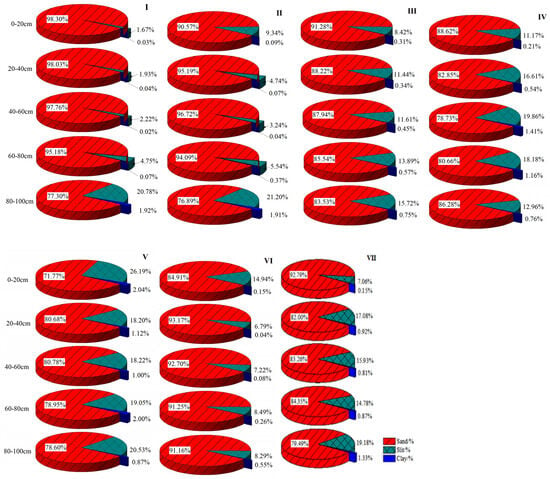
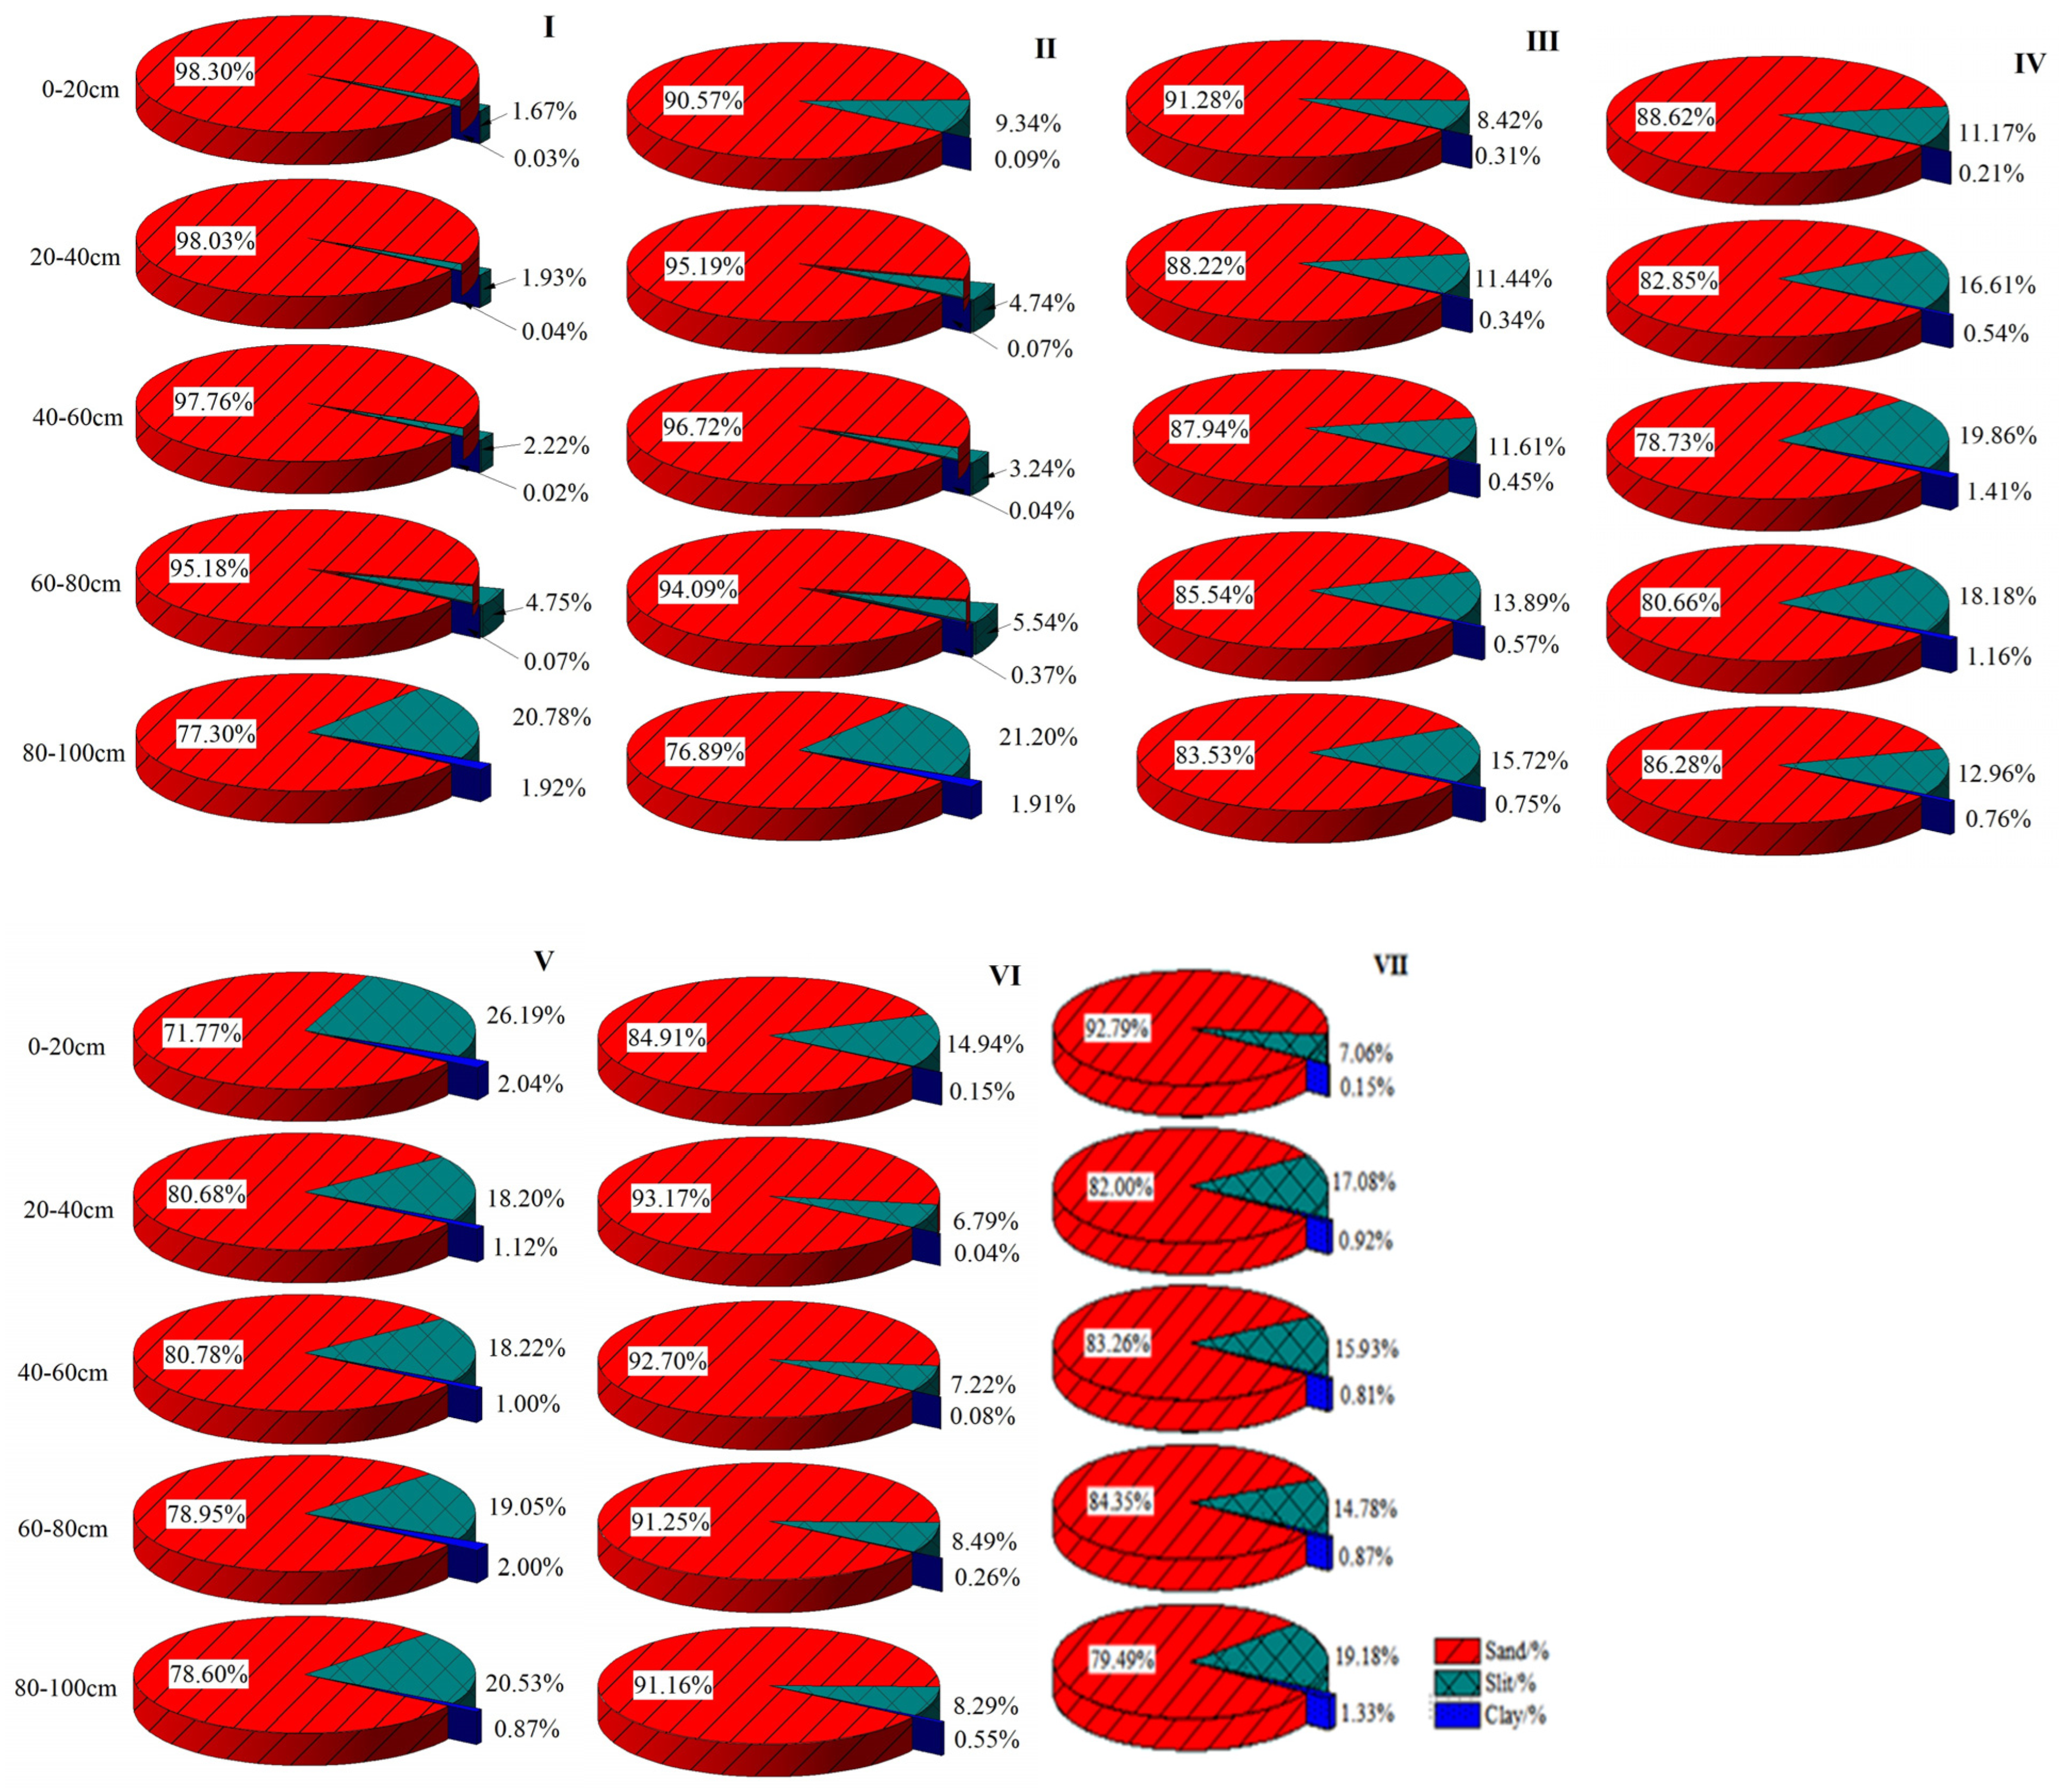
According to the USDA soil texture classification, the soils in the test plots comprised sandy soil, sandy loam, loamy sand, sandy clay loam, and other sandy soils, with clay content below 2.50% in all samples (Figure 3). Sand content exceeded 70%, ranging from 71.77% to 98.30%. Significant differences in sand, silt, and clay contents were observed among some test plots (p < 0.05). The average sand content across all soil layers decreased sequentially in plots I–V, while plots VI and VII fell within this range.
Figure 3.
Soil particle size distribution in each test plot. Note: I–VII represent test plots I–VII.
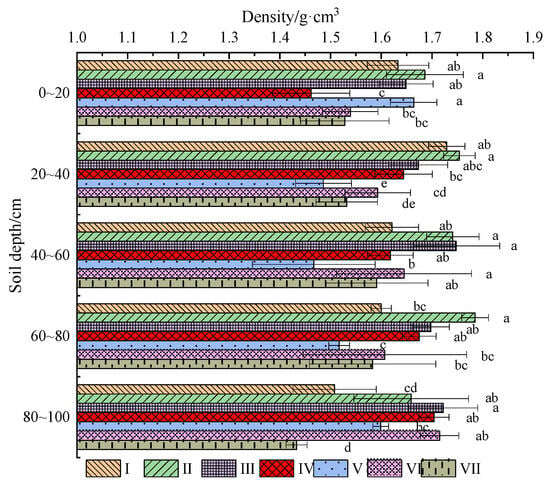
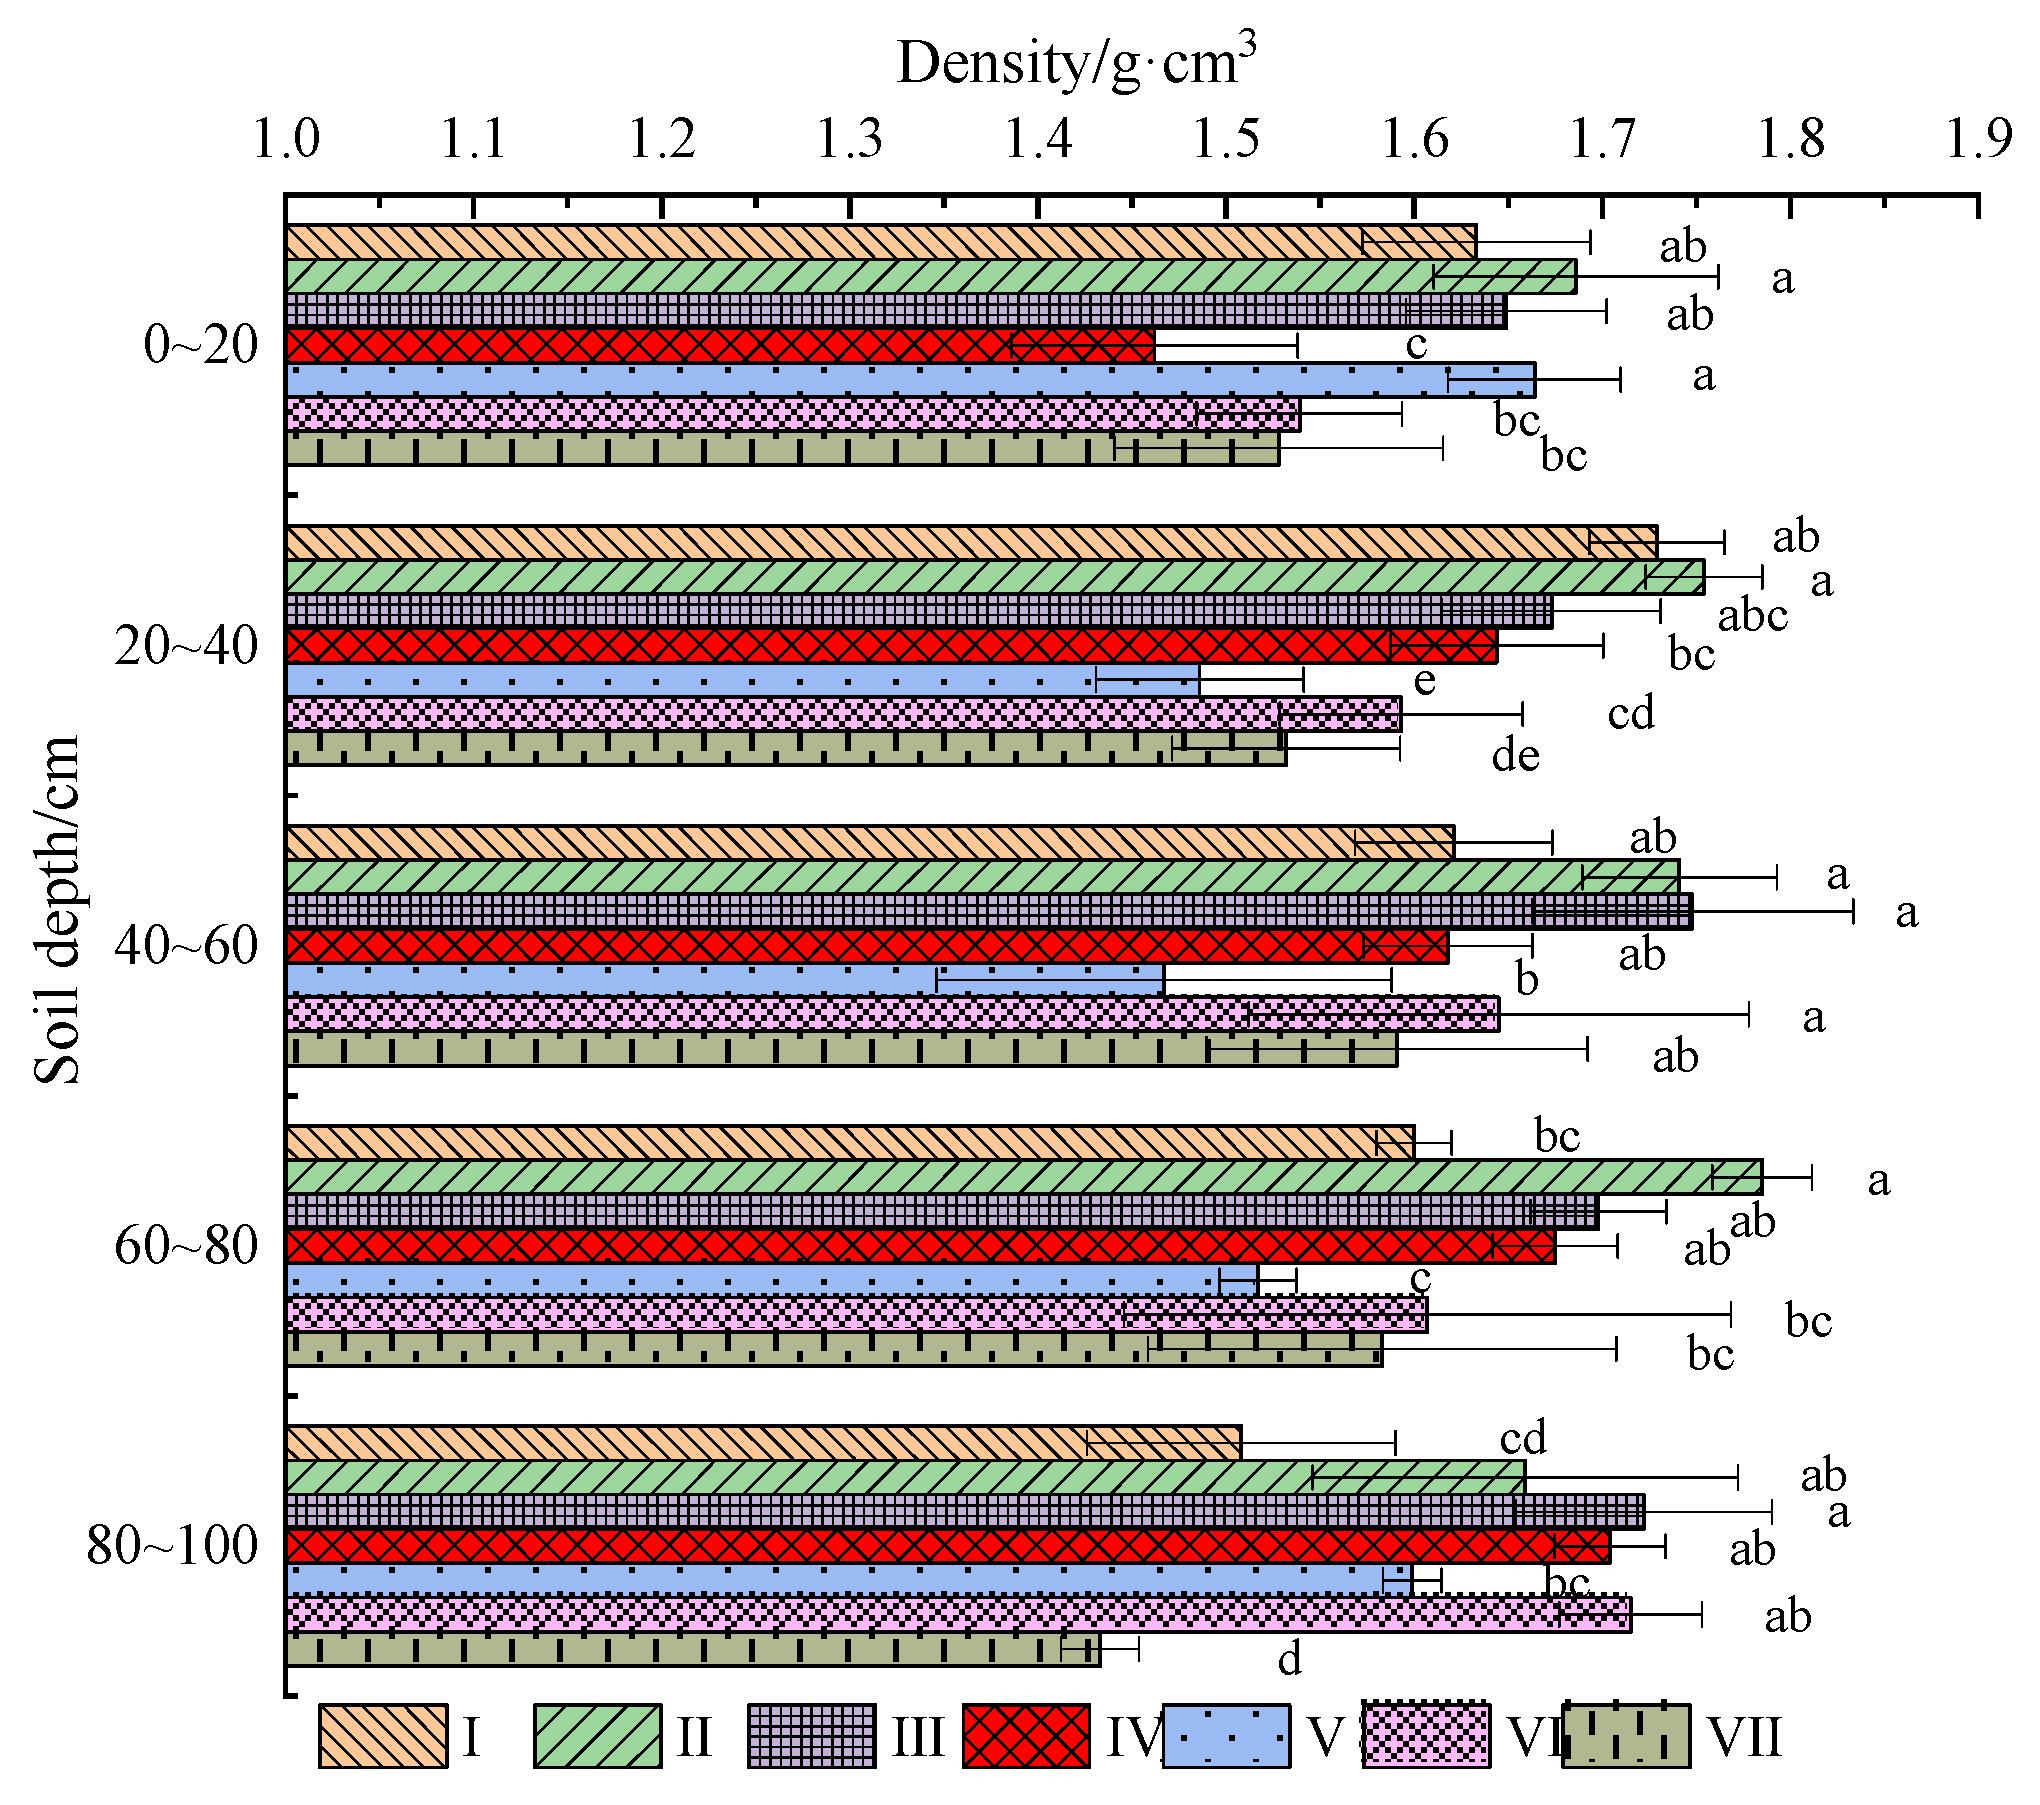
As shown in Figure 4, soil bulk density in the test layers ranged from 1.433 to 1.785 g·cm−3, with significant differences observed among some plots within the same soil layer (p < 0.05), particularly in the 20–40 cm and 80–100 cm layers. The average bulk density across all layers decreased sequentially in plots I–V, corresponding to decreasing sand content, while plots VI and VII fell within this range.
Figure 4.
Soil bulk density of each test plot. Note: The different lowercase letters to the right of the error bars denote a significant difference among different test plots in a certain soil layer (p < 0.05).
4.2. Calibration of Soil Hydraulic Parameters Under Drip Irrigation
4.2.1. Soil Wetting Front Movement Under Drip Irrigation
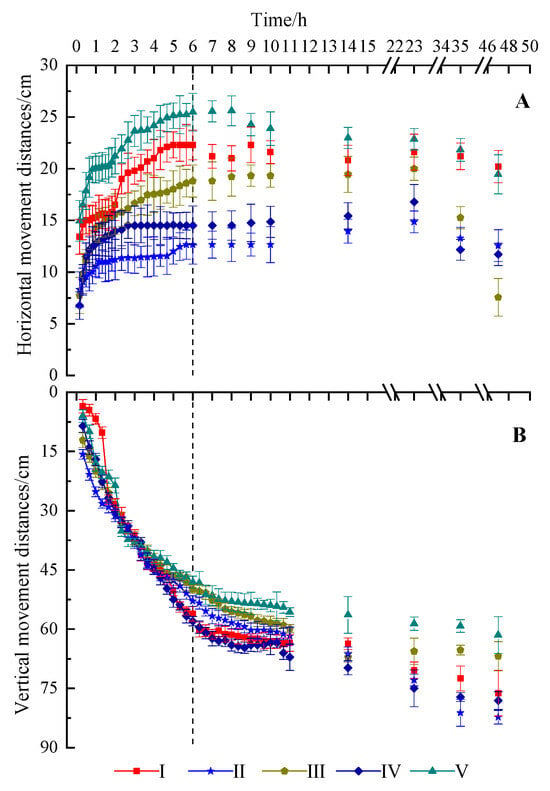
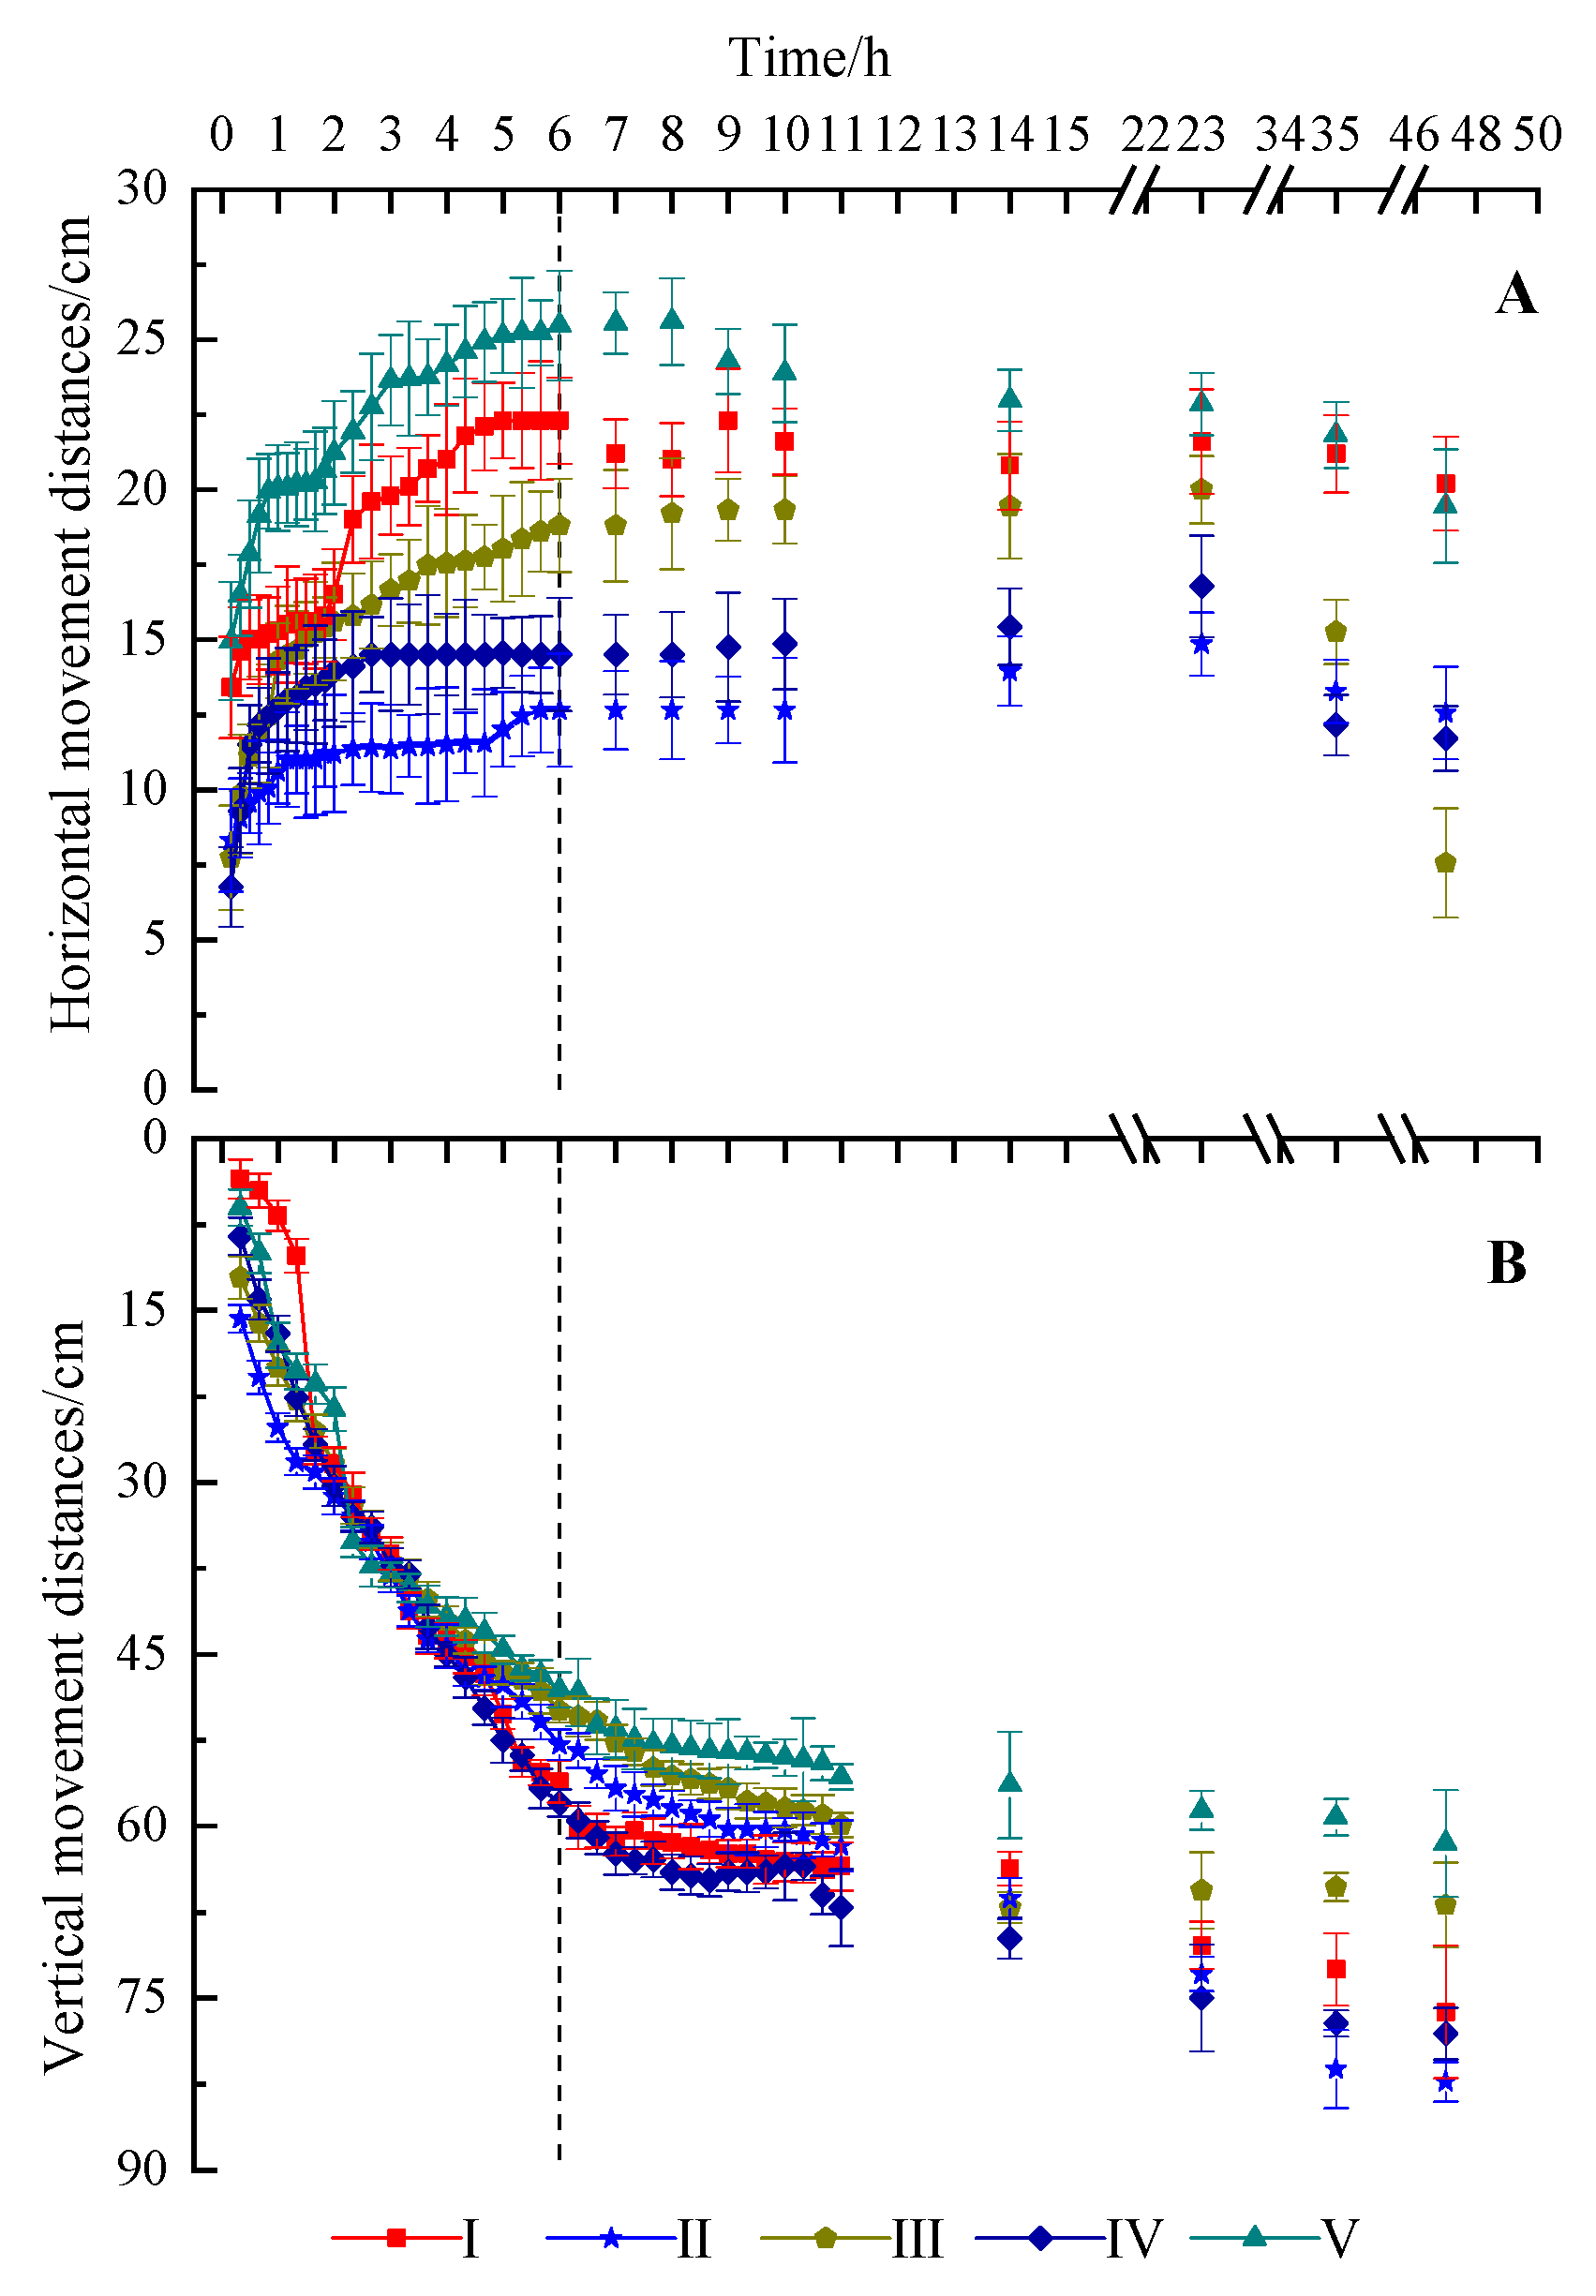
Based on the distribution of soil particle size in the main sample plots, sand accounted for a large proportion and strongly influenced soil texture. To represent the main soil textures in the study area, wetting front movement data from plots I–V were selected according to the average sand content. The results are presented in Figure 5. Sand content in each soil layer ranged from 71.77% to 98.30%. After irrigation commenced, both horizontal and vertical wetting front movements increased rapidly, although the growth rate gradually slowed. At the end of irrigation, horizontal movement distances ranged from 12.7 to 25.5 cm, with significant differences among plots (p < 0.05), while vertical movement distances ranged from 48.1 to 58.0 cm, showing no significant differences (p > 0.05).
Figure 5.
Changes in wetting front movement distance with drip irrigation time in the test plots I–V. Note: The dotted line is the time of stopping irrigation. (A) Horizontal wetting front movement distance; (B) Vertical wetting front movement distance.
4.2.2. Calibration of Soil Hydraulic Parameters
Based on experimental data and simulation conditions, soil hydraulic parameters were inversely estimated using HYDRUS-2D/3D. The residual water content (θr) was fixed according to Rosetta 3 predictions. Search intervals for θs, α, n, and Ks were set to 0.2–0.6 cm3·cm−3, 0.01–0.1 cm−1, 1.0–5.0, and 0.01–0.5 cm·min−1, respectively. The calibration results (Table 1) show that, across soil layers, θr ranged from 0.0303 to 0.0493 cm3·cm−3, θs from 0.220 to 0.356 cm3·cm−3, α from 0.0184 to 0.0638 cm−1, n from 1.67 to 3.96, and Ks from 0.048 to 0.435 cm·min−1. Significant differences in θr, α, n, and Ks were observed among most test plots within the 0–100 cm soil layer (p < 0.05), whereas θs showed significant differences only between plot I and other plots in the 20–80 cm layers (p < 0.05).
4.3. Soil Pore Spatial Structure Parameters
4.3.1. Soil Microscale Pore Structure Parameters
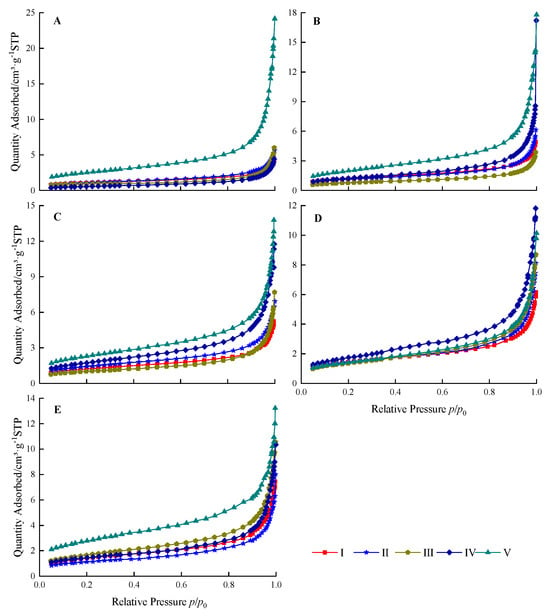
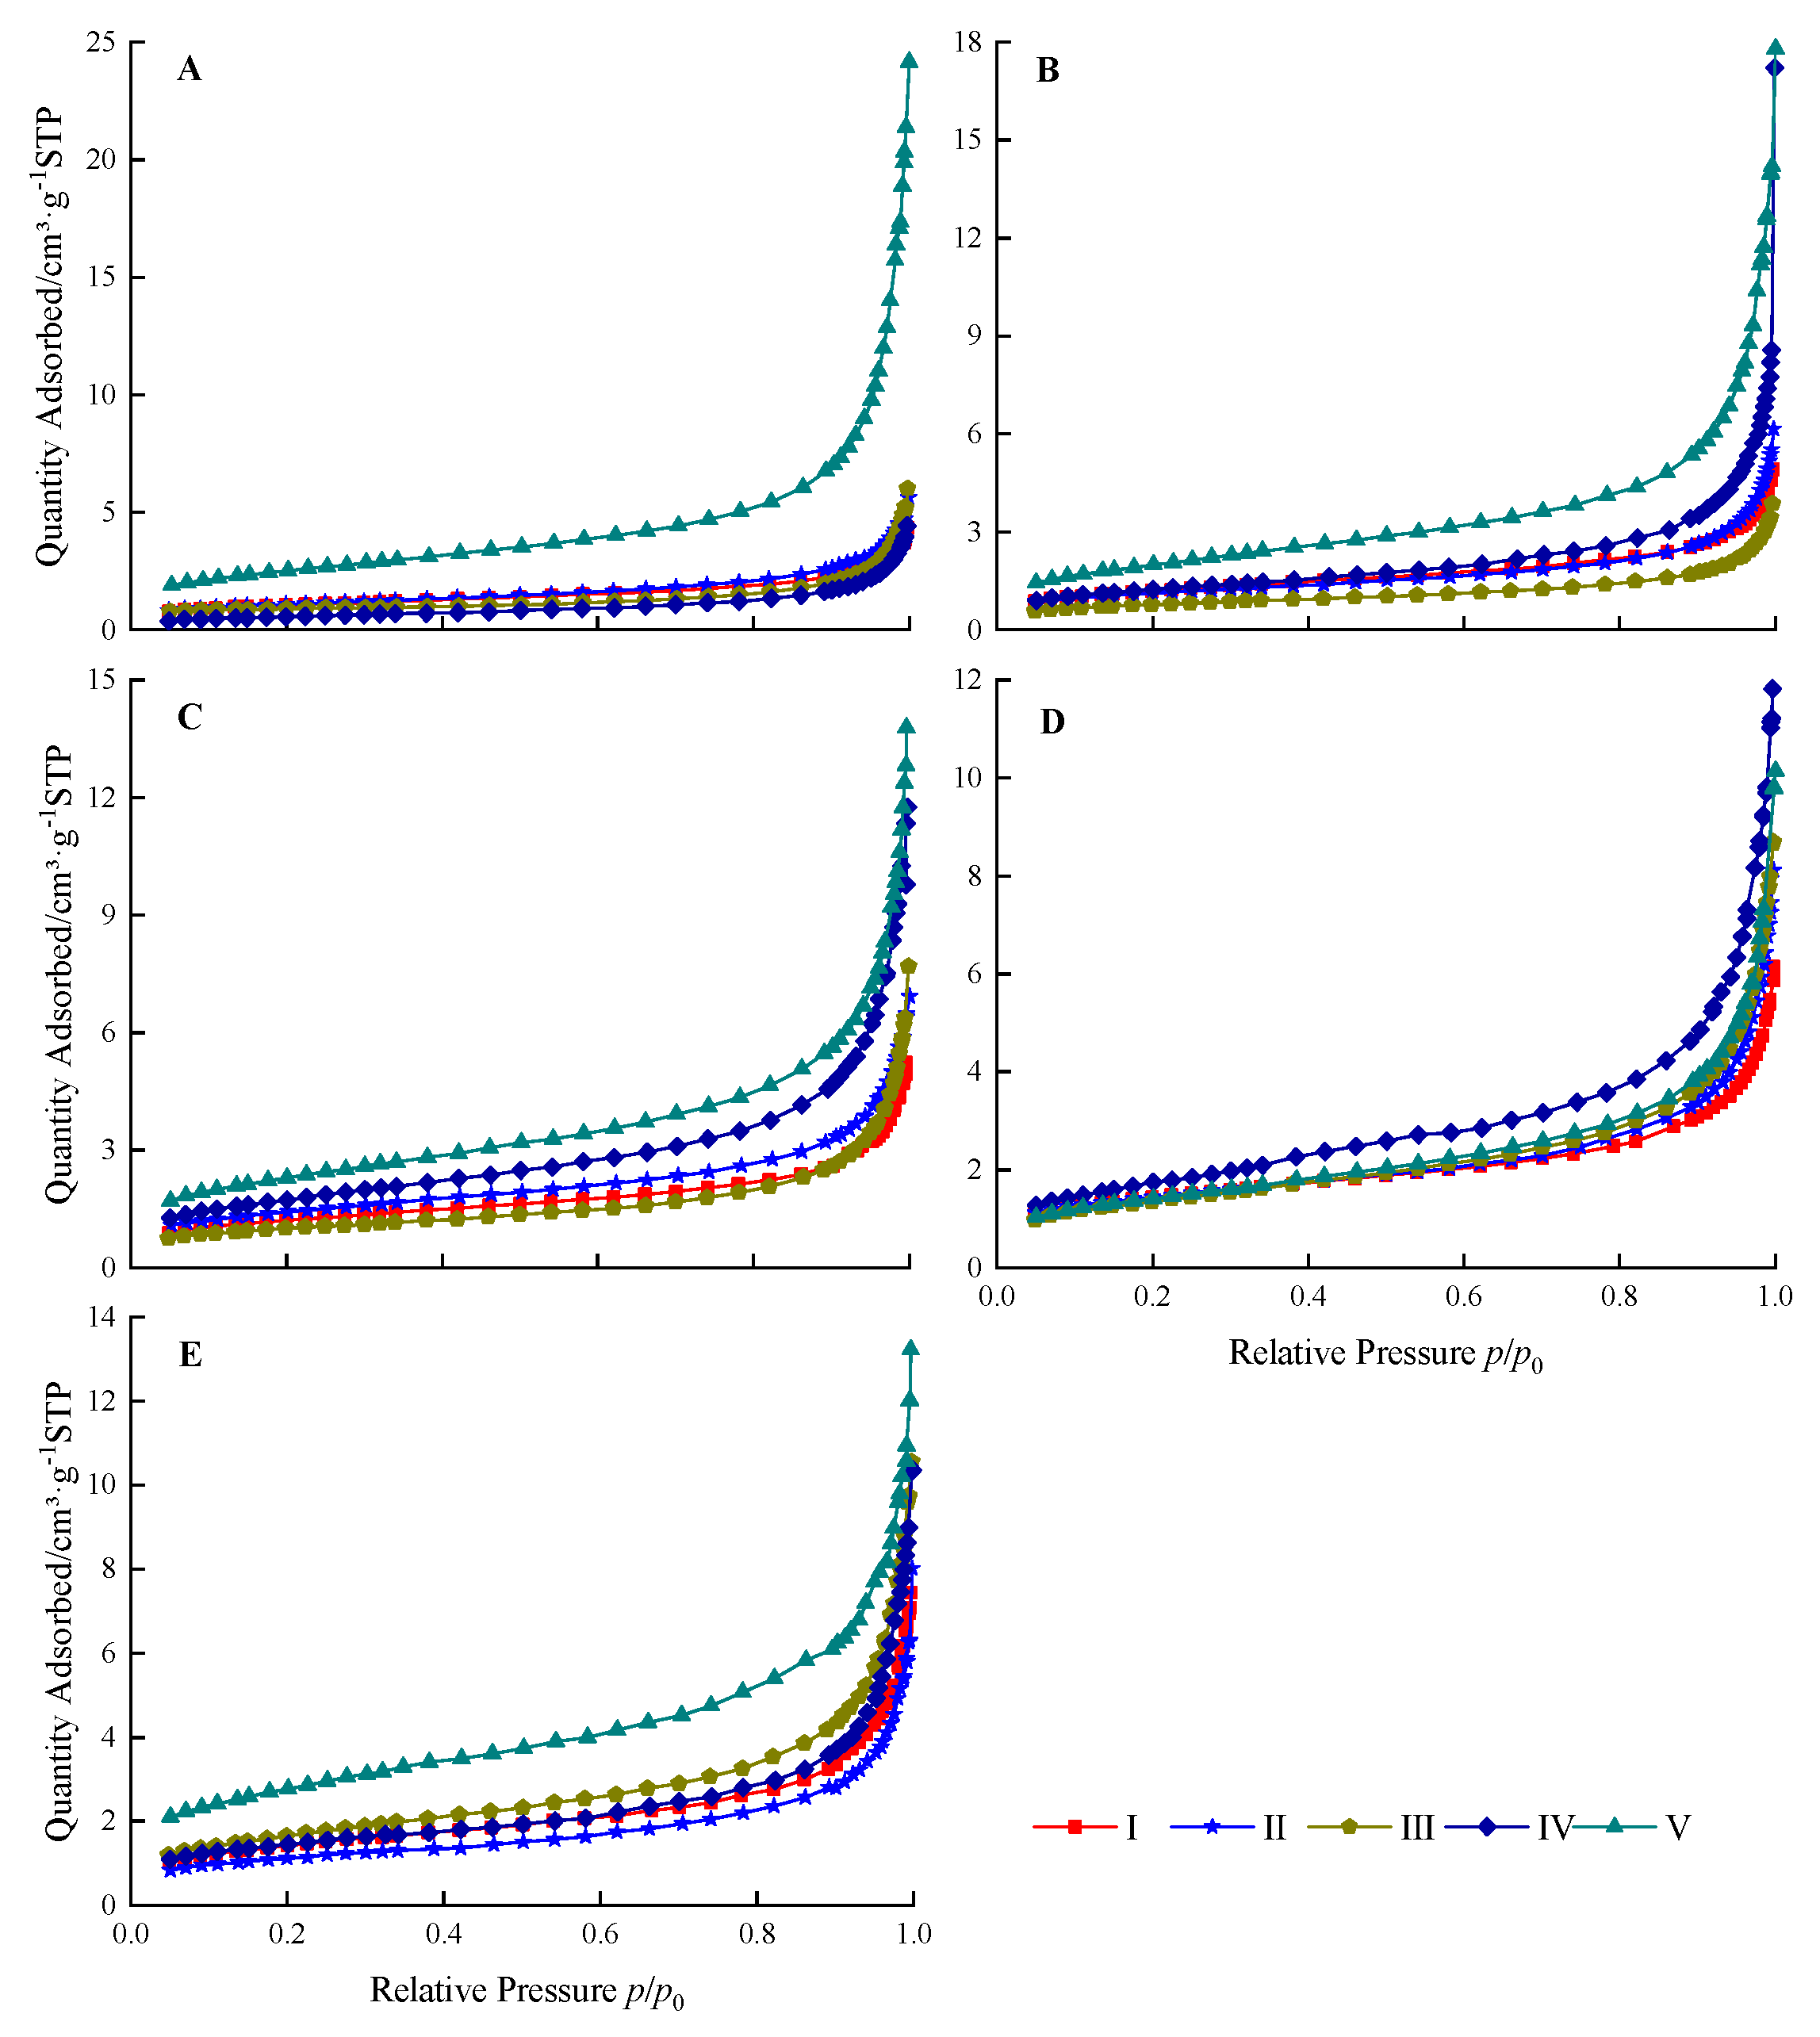
The nitrogen adsorption isotherms of soil samples from test plots I–V are presented in Figure 6. Under standard conditions, the final nitrogen adsorption in the soil pores of each sample ranged from 3.87 to 24.16 cm3·g−1, with notable differences observed among samples within the same soil layer across the test plots.
Figure 6.
Isothermal adsorption curves of soil layers of the test plots I–V: (A) 0–20 cm, (B) 20–40 cm, (C) 40–60 cm, (D) 60–80 cm and (E) 80–100 cm.
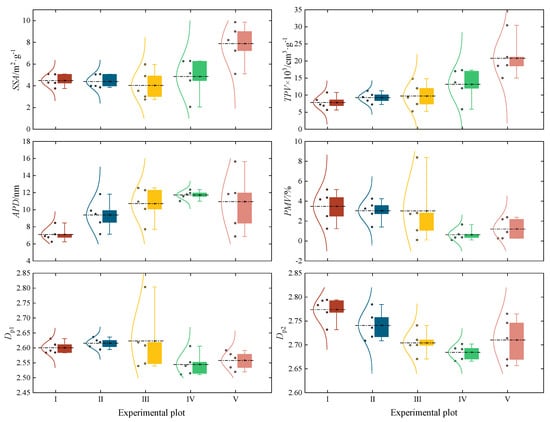
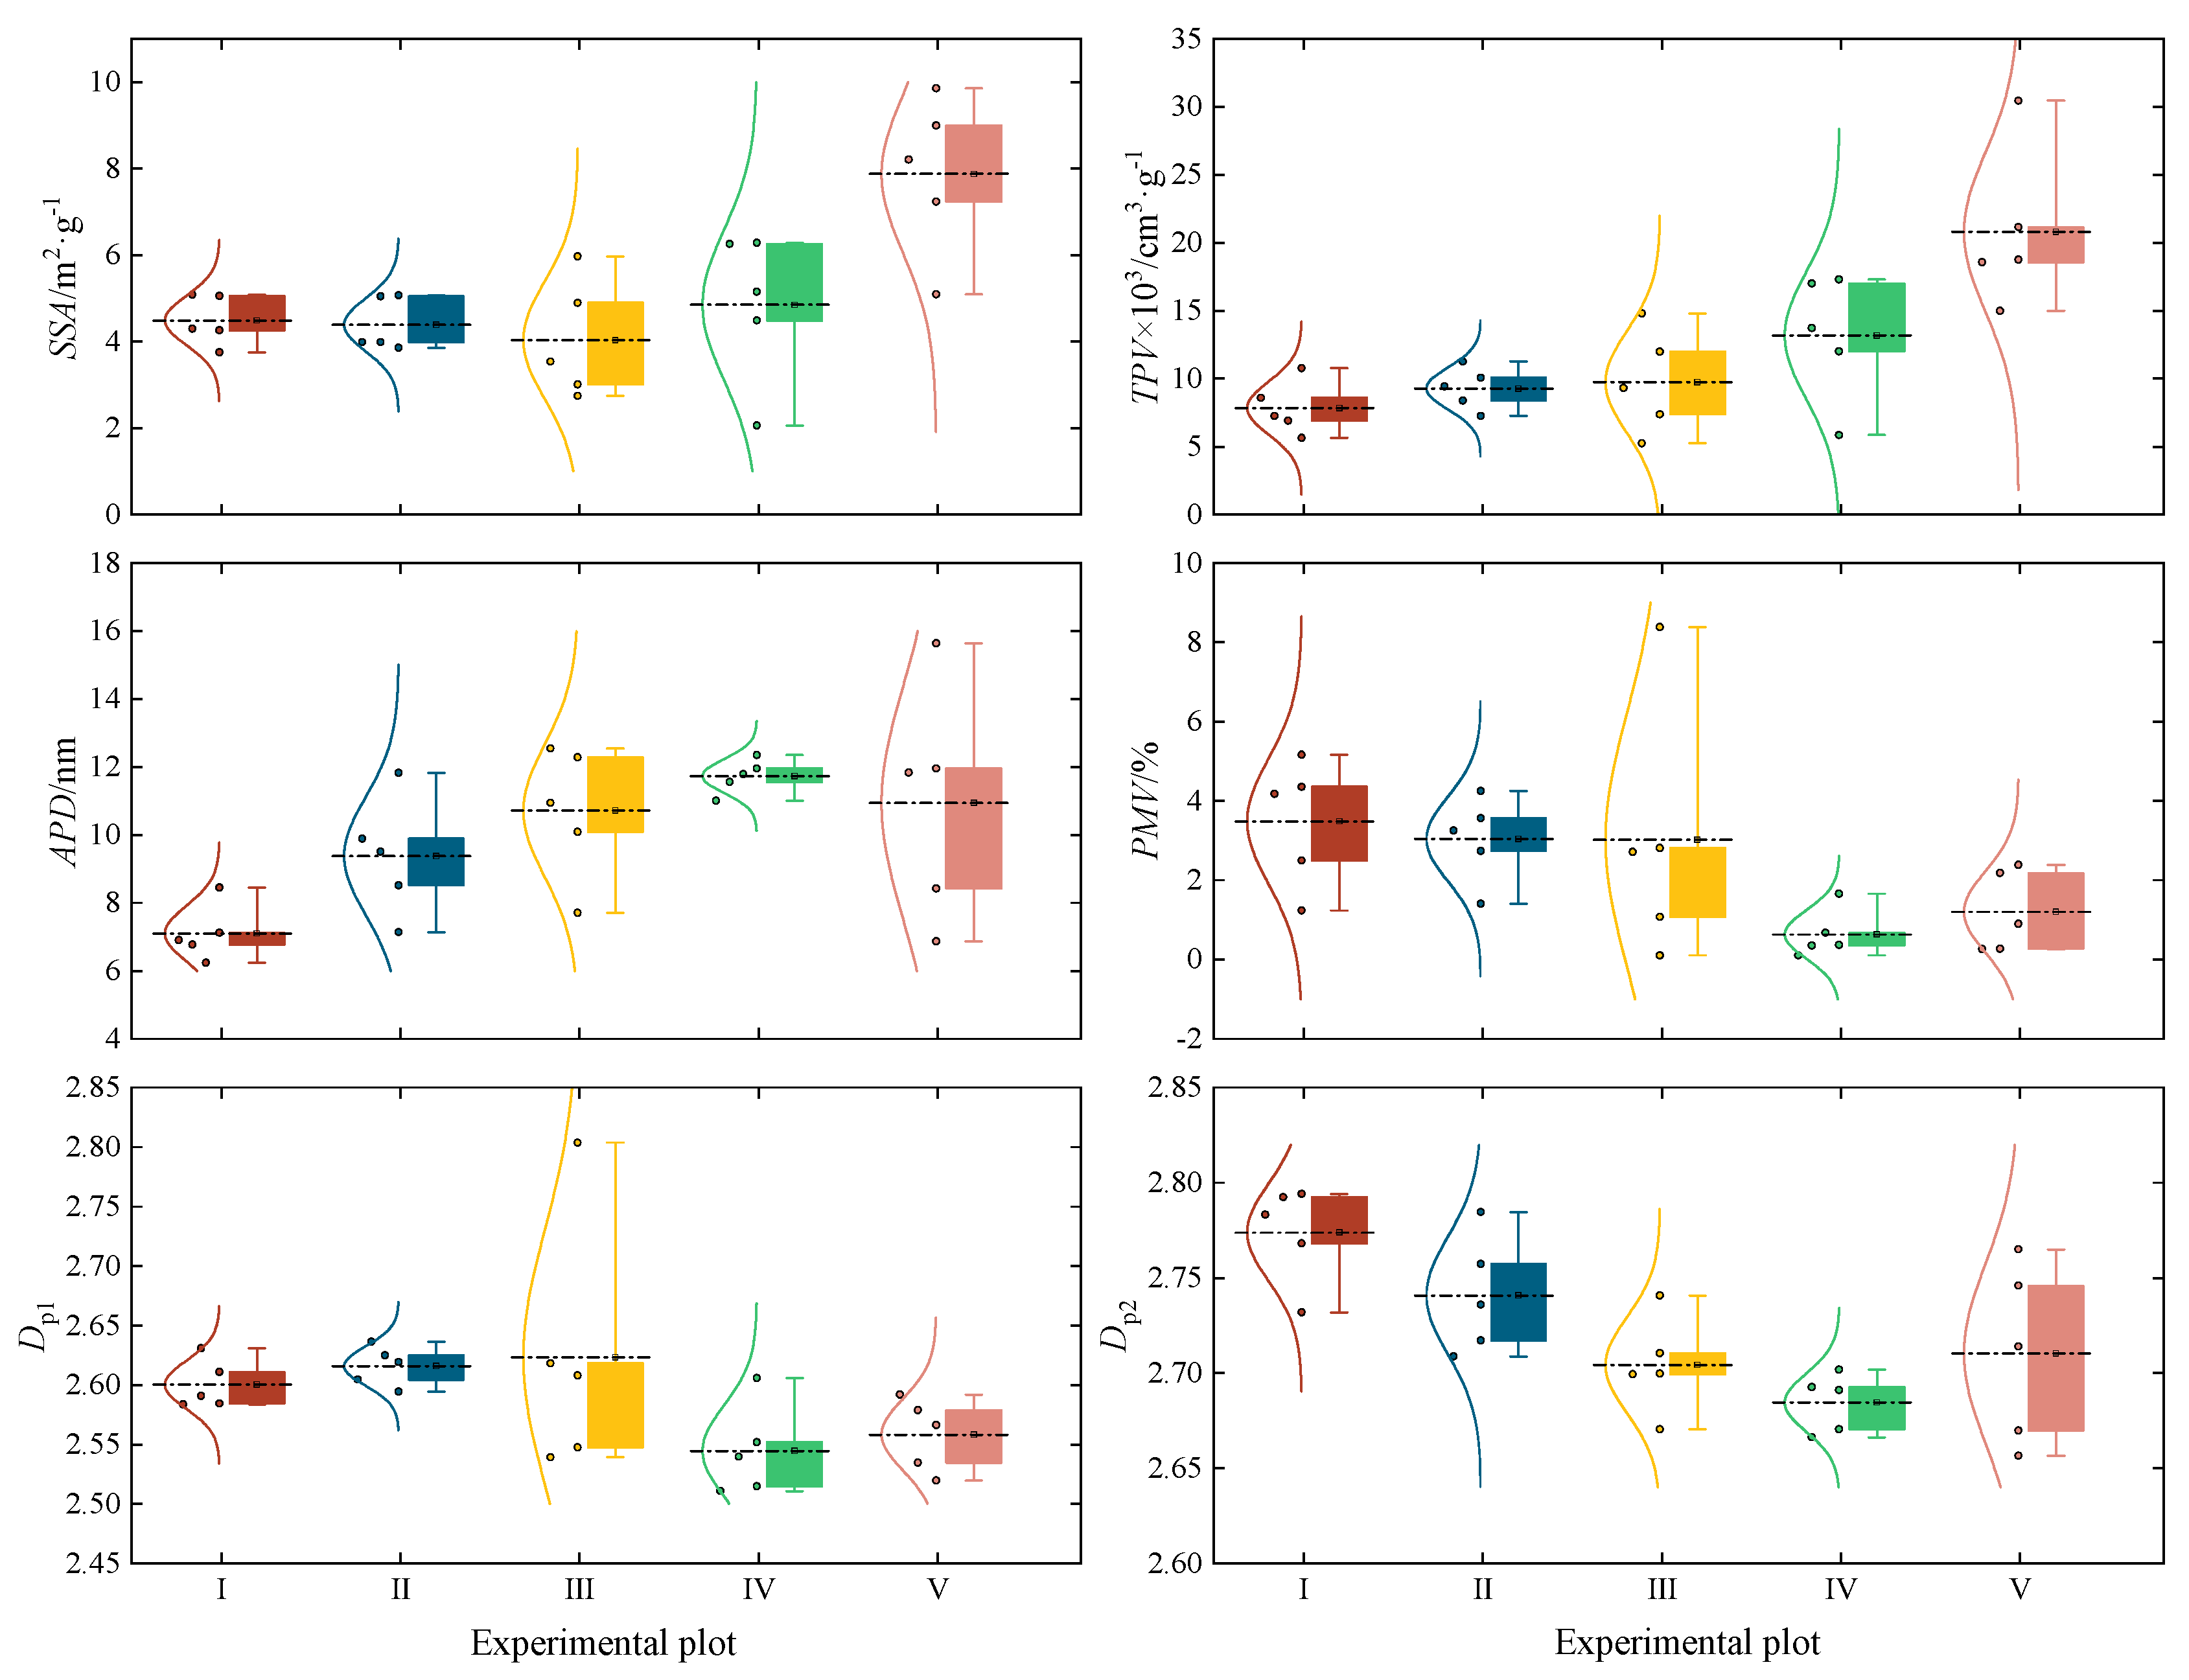
The calculated soil pore structure parameters for test plots I–V are presented in Figure 7. In most soil layers, test plot V exhibited significantly higher BET specific surface area (SSA), BJH total pore volume (TPV), average pore diameter (APD), and structural fractal dimension (Dp2) compared to the other plots. Differences in SSA, TPV, APD, and micropore volume fraction (PMV) among the plots were more pronounced than those in the surface fractal dimension (Dp1) and Dp2. Additionally, SSA, TPV, and APD increased with soil depth, whereas Dp2 decreased.
Figure 7.
Spatial structure parameters of pore spatial structure in different soil layers of the test plots I–V: BET specific surface area (SSA), BJH total pore volume (TPV), average pore diameter (APD) and percentage of micropore volume (PMV). Different colors represent different test plots. The whiskers and horizontal lines within the boxes indicate the maximum, upper quartile, median, lower quartile, and minimum values, respectively.
4.3.2. Relationship Between Soil Particle Size Parameters, Hydraulic Parameters, and Microscale Pore Structure Parameters
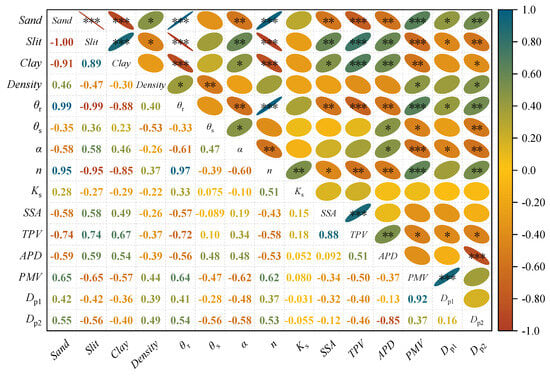
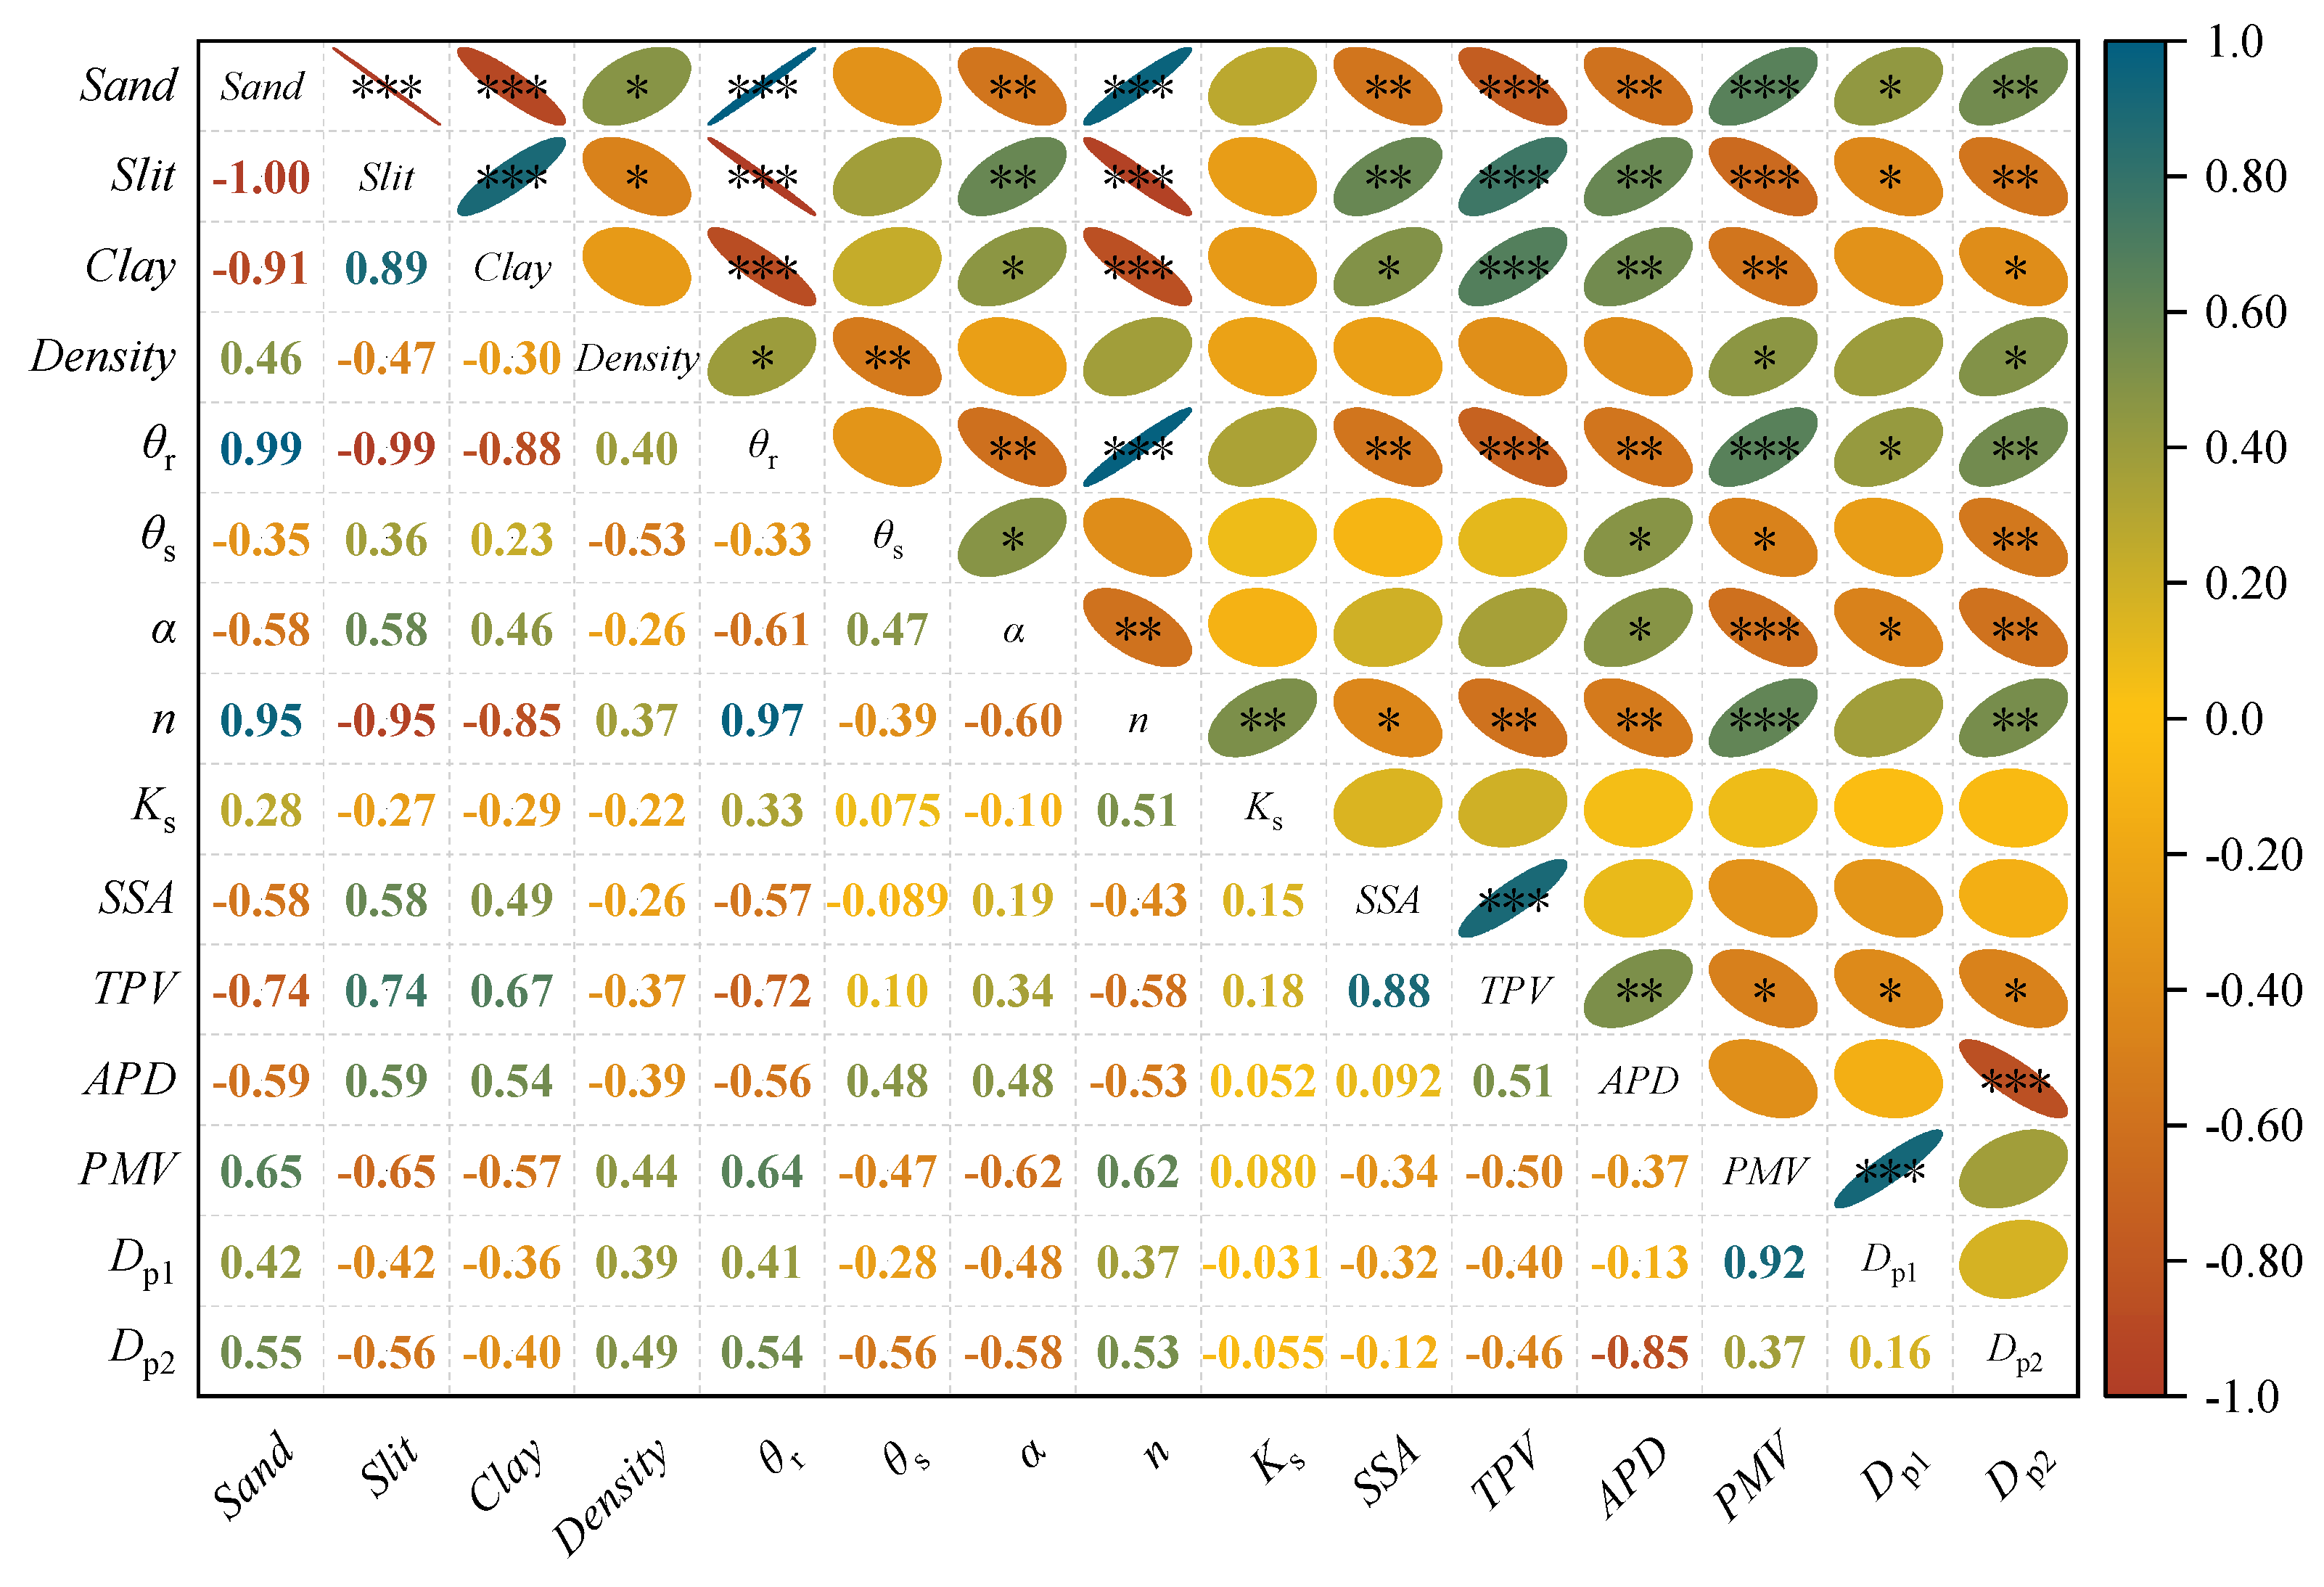
Soil Sand, Silt, and Clay content were mostly significantly correlated with θr, α, n, and all microscale pore parameters (p < 0.05, p < 0.01 or p < 0.001). Bulk Density significantly correlated (p < 0.05 or p < 0.01) with θr, θs, PMV and Dp2. θr significantly correlated (p < 0.05, p < 0.01 or p < 0.001) with all microscale pore structure parameters. θs, α and n significantly correlated (p < 0.05, p < 0.01 or p < 0.001) with APD, PMV, and Dp2. α significantly correlated with the surface fractal dimension (Dp1) (p < 0.05), while n significantly correlated with SSA and TPV (p < 0.05 or p < 0.01). All correlations were moderate to strong (Figure 8).
Figure 8.
Correlation analysis between SHPs and microscale pore structure parameters. Blue indicates positive correlation, red indicates negative correlation. * denotes significant correlation at the 0.05 level (p < 0.05), ** indicates significant correlation at the 0.01 level, and *** denotes significant correlation at the 0.001 level. The eccentricity of the ellipse and color indicate the strength of the correlation.
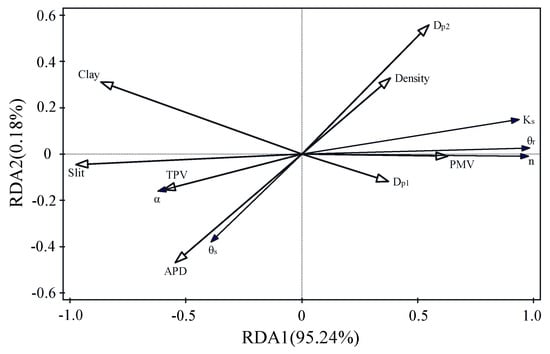
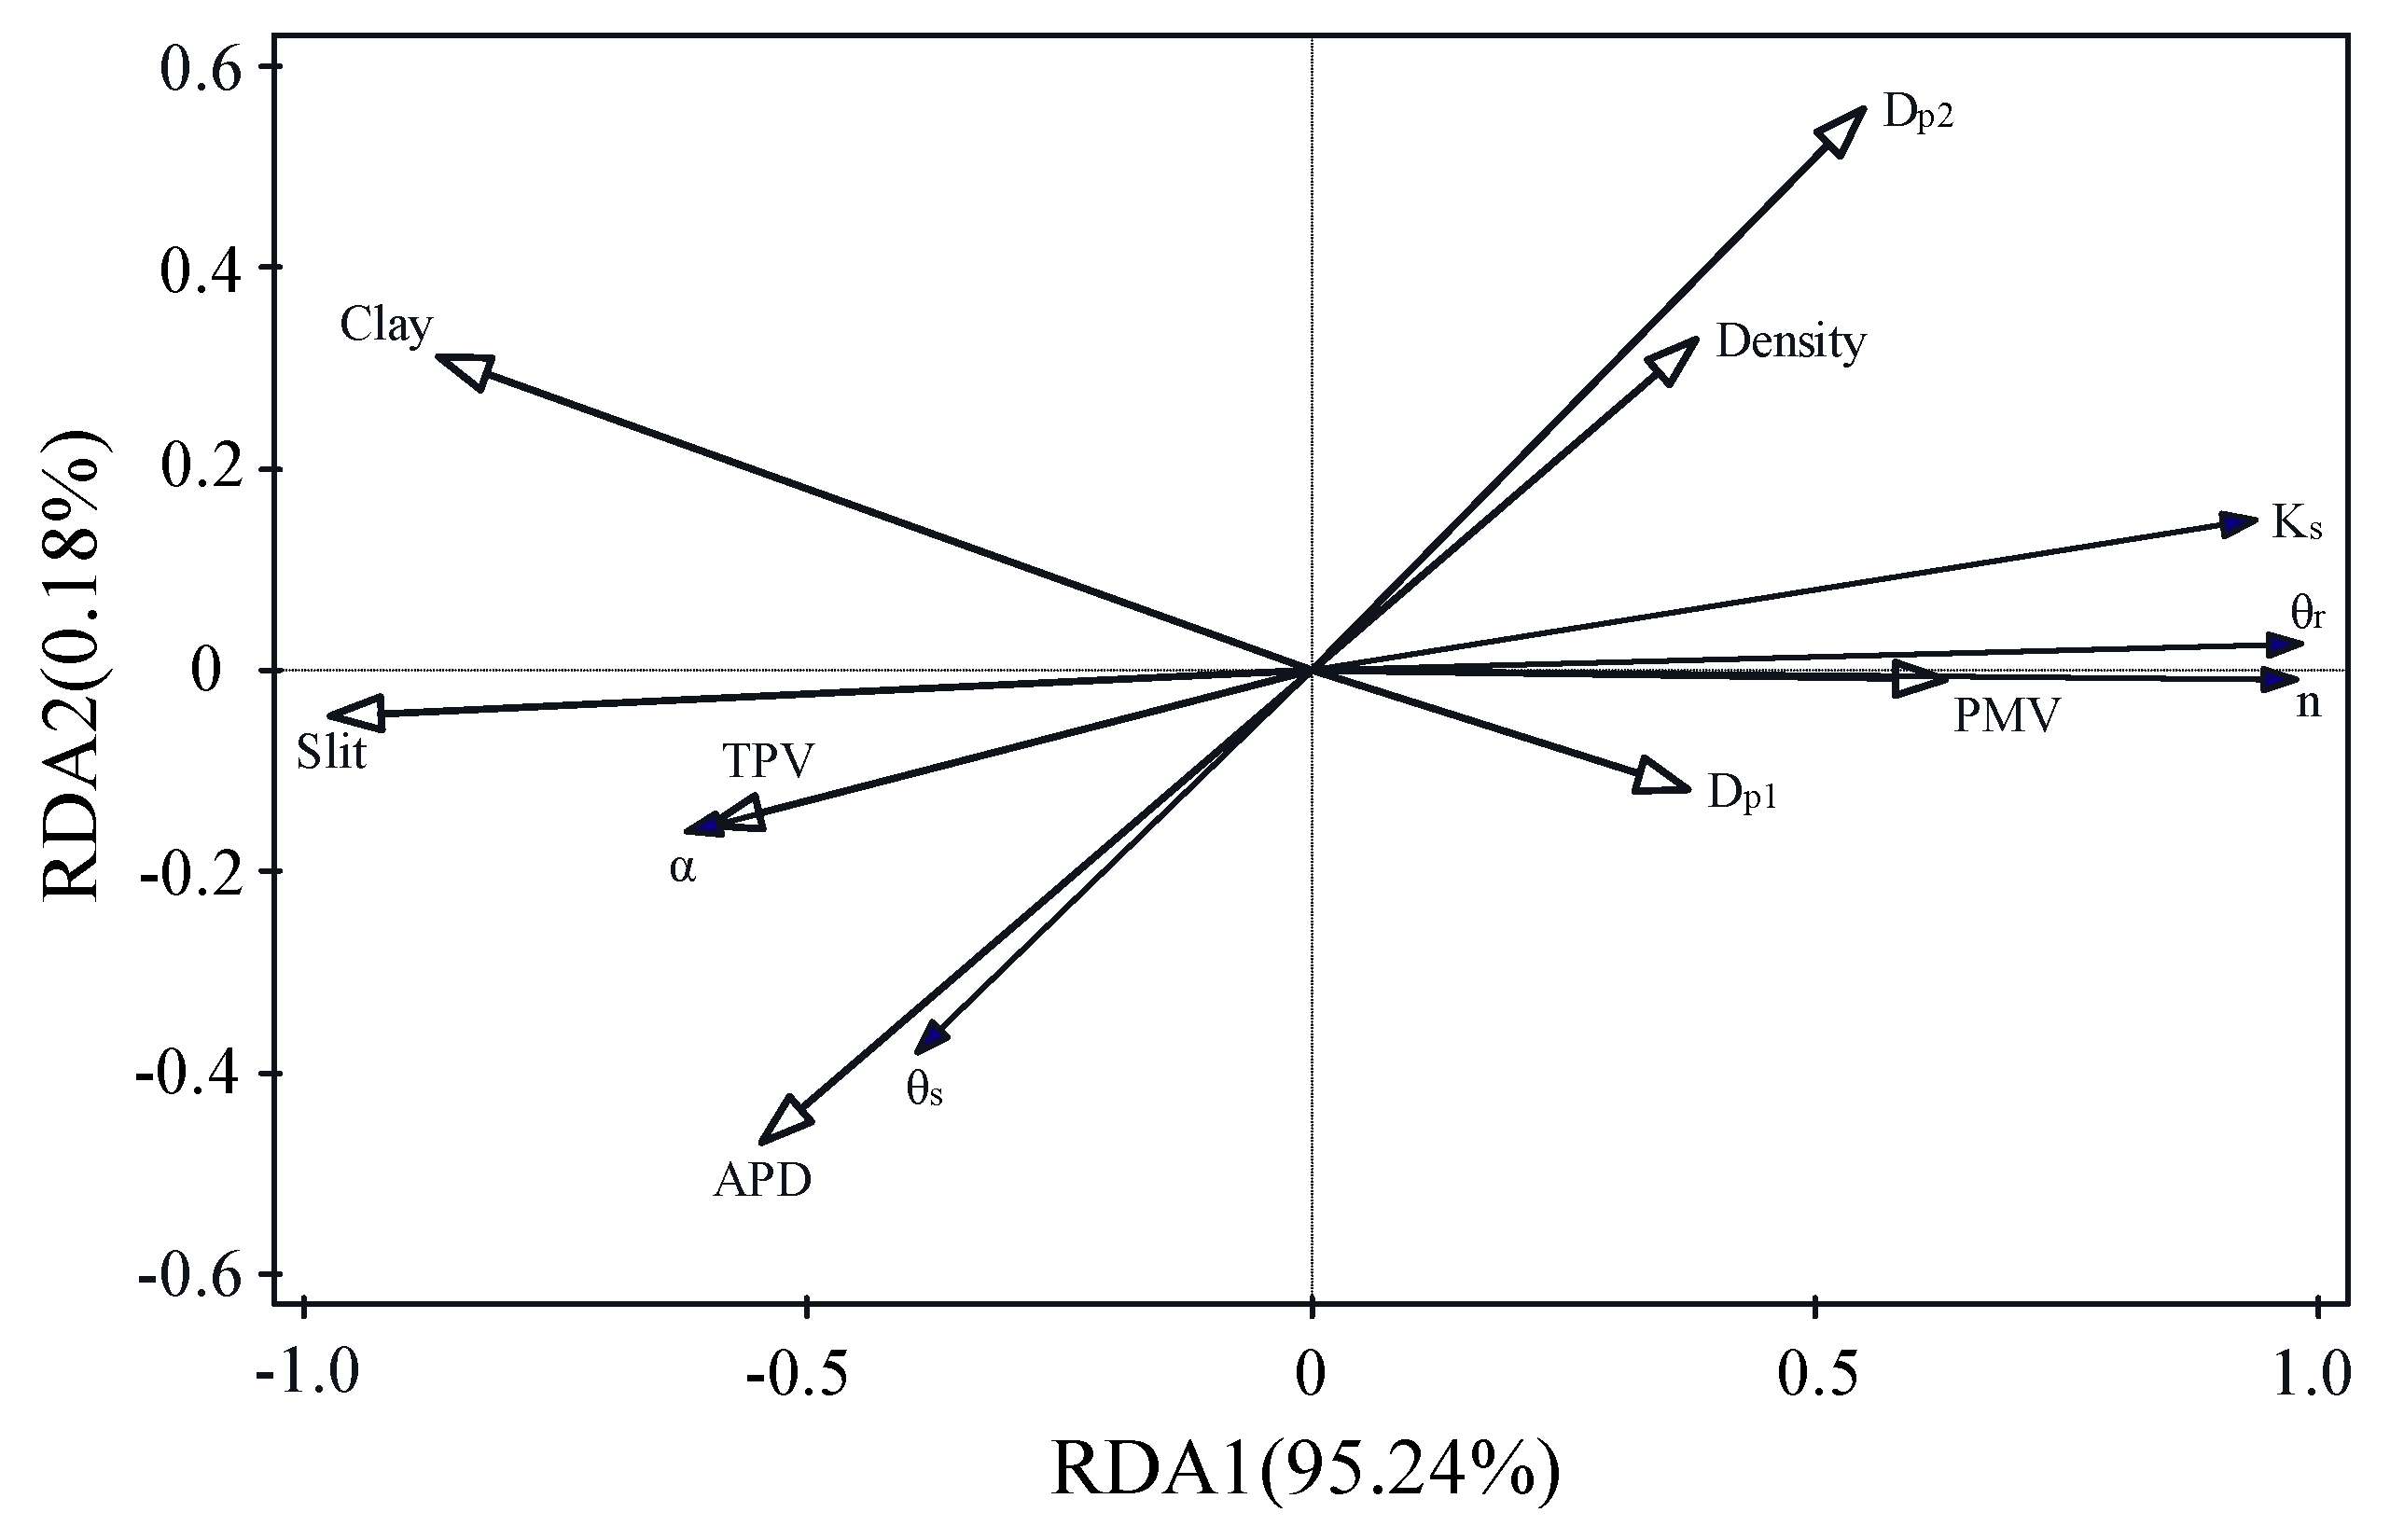
Soil particle distribution and microscale pore structure parameters collectively explained 95.42% of the variation in soil hydraulic parameters (SHPs). The first canonical variable accounted for 95.24% of the variance, while the second accounted for 0.18%. Among the individual variables, silt content, total pore volume (TPV), and bulk density explained 90.4%, 3.5%, and 0.7% of the variance in the hydraulic parameters, respectively. Among these, silt content had the greatest influence on θr, TPV had the greatest influence on α and Ks, PMV had the greatest influence on n, and Dp2 had the greatest influence on θs (Figure 9).
Figure 9.
Redundancy analysis (RDA) of SHPs with particle size parameters and microscale pore structure parameters.
4.4. Modeling and Estimation of Hydraulic Parameters
4.4.1. Hydraulic Parameter Modeling and Error Analysis
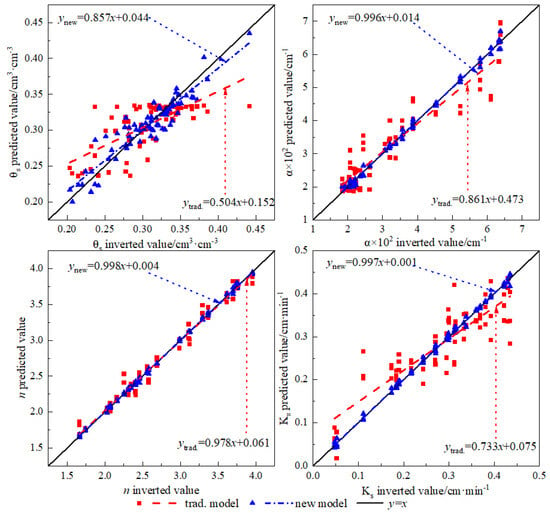
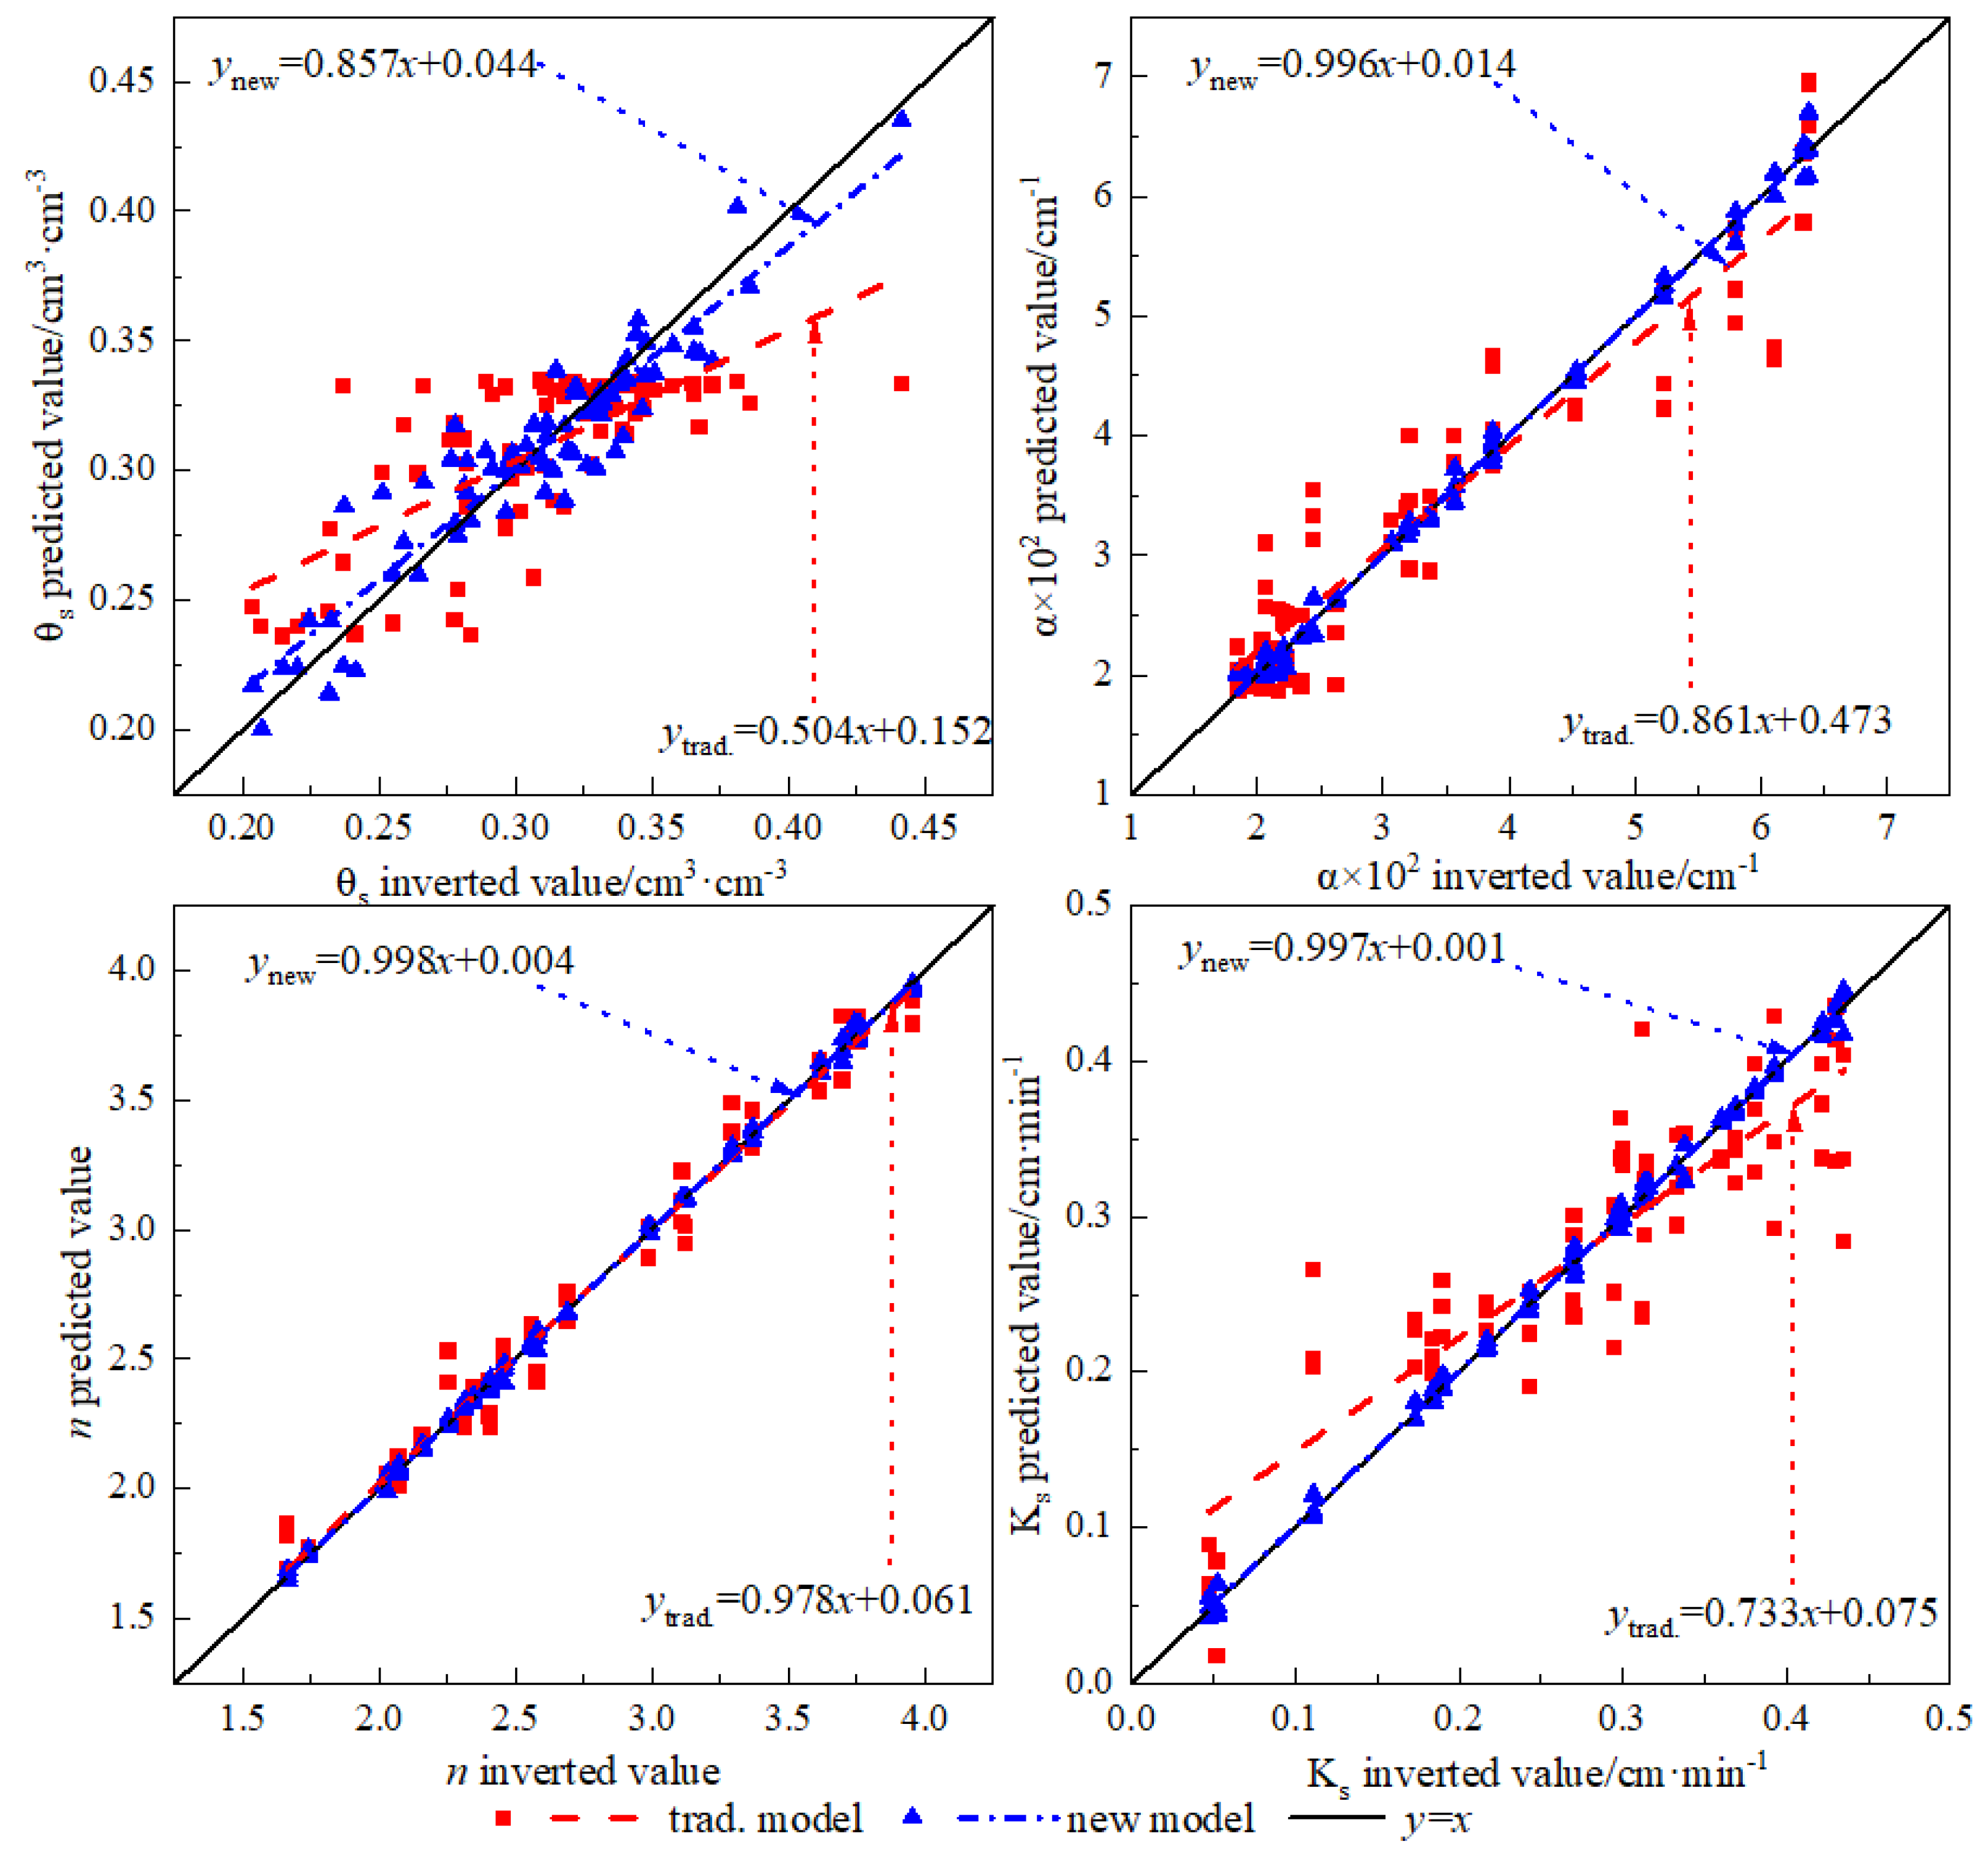
Using the neural network method, θs, α, n, and Ks were treated as dependent variables. The traditional model (trad.) predicted hydraulic properties based on sand, silt, clay contents, and bulk density, whereas the new model incorporated additional pore structure parameters, including SSA, TPV, APD, PMV, Dp1, and Dp2, as independent variables. Comparisons between the predicted hydraulic parameters from both models and measured values are shown in Figure 10. The regression slopes of the new model were closer to 1 for all hydraulic parameters compared to the trad. model. Model evaluation results (Table 2) indicated higher adjusted R2 values for the new model than for the trad. model, both exceeding 0.85. RMSE and relative error (RE) values also reflected improved performance; for θs, α, and Ks, REs in the new model were reduced to below 20%, indicating more reliable predictions than the traditional model.
Figure 10.
Comparison between the predicted and measured values of the hydraulic parameter model in the modeling group. Note: The “trad. model” denotes the traditional model, the same applies hereinafter.
Table 2.
Statistical analysis of prediction results of hydraulic parameters in the modeling group.
4.4.2. Model Validation and Applicability Analysis
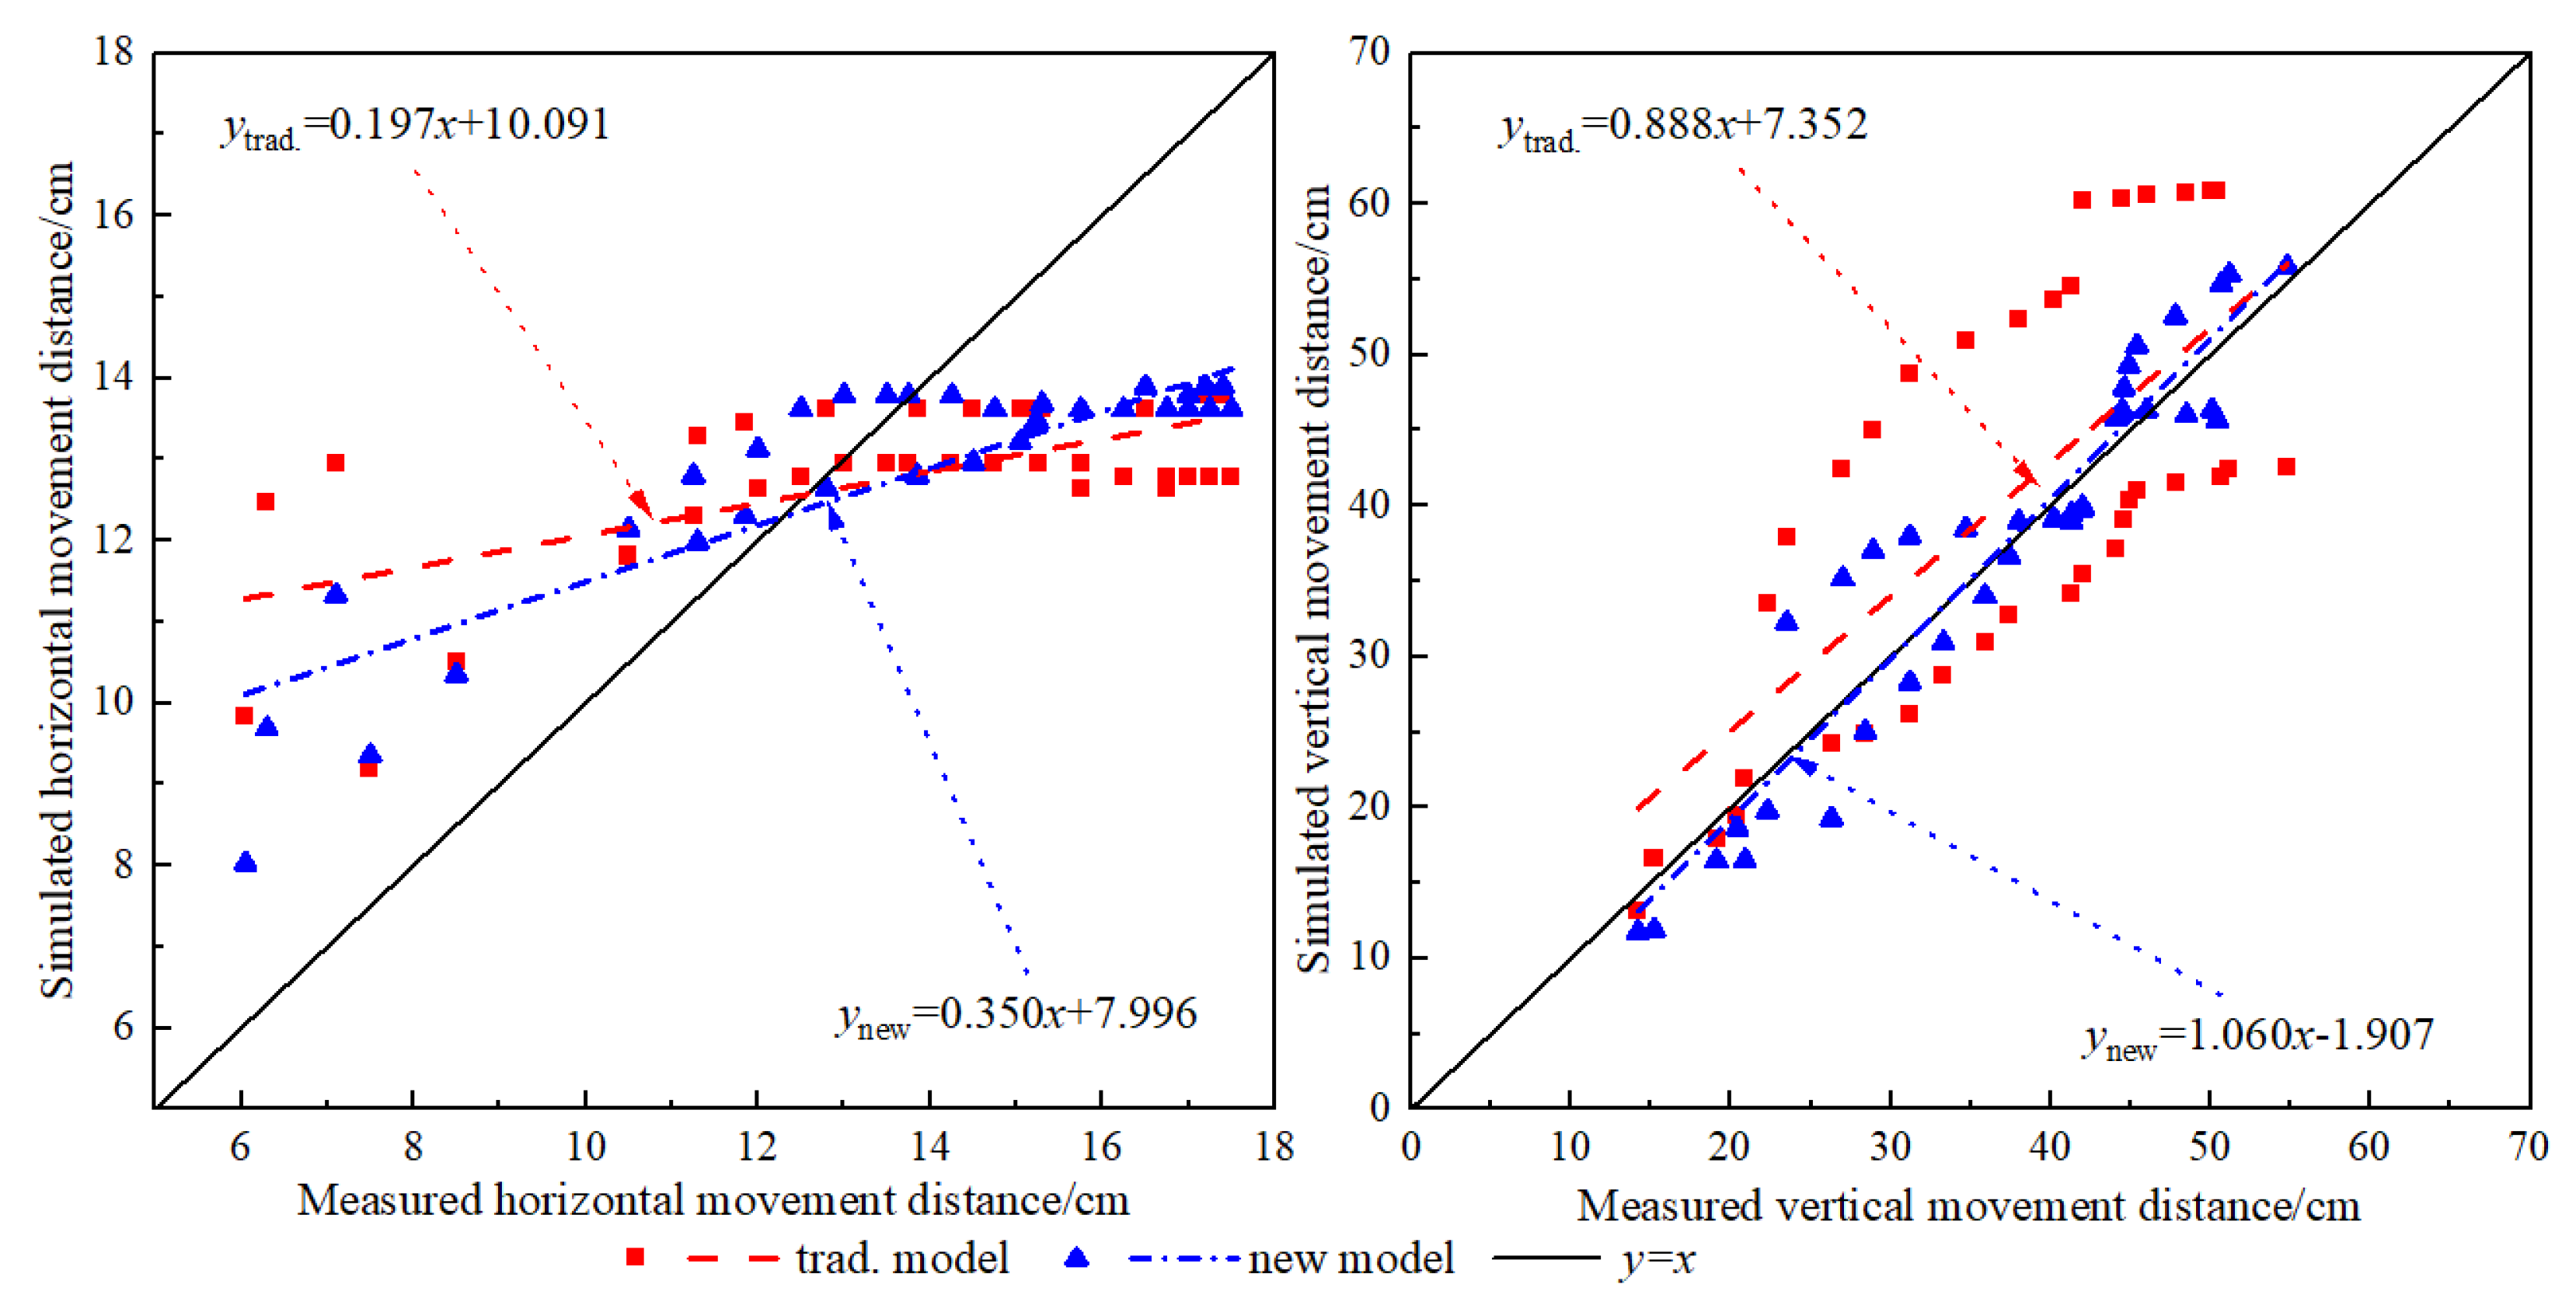
Based on hydraulic parameters predicted by the non-pore and pore models, soil water movement in test plots VI and VII was numerically simulated using HYDRUS-2D/3D. Simulated wetting distances were compared with measured values, as shown in Figure 11. The regression slopes of the pore model were closer to 1 than those of the non-pore model, indicating higher simulation accuracy. Specifically, the slope of the horizontal movement increased from 0.197 to 0.350, and that of the vertical movement increased from 0.888 to 1.060, demonstrating improved performance. Table 3 presents the statistical analysis used to verify the simulation results. The adjusted R2 calculated by the pore model exceeded that of the non-pore model. Especially, for the vertical movement distance pore model, the adjusted R2 surpassed 0.85. The RMSE of the pore model was significantly smaller than that of the non-pore model. Compared with the non-pore model, the REs of the water horizontal and vertical movement distances declined to less than 20%, and the reliability improved significantly. Overall, the close agreement between simulated and measured soil wetting distances indicates the improved applicability of the model.
Figure 11.
Comparison between the simulated and measured values of the wetting front movement distance model in the verification group.
Table 3.
Statistical analysis to verify the numerical simulation results of water movement.
5. Discussions
Soil hydraulic parameters are key variables describing soil water status and movement under both saturated and unsaturated conditions, and are jointly influenced by soil texture, structure, and pore system characteristics [27]. Aeolian sandy soils, strongly affected by pedogenic processes and external disturbances, are typically characterized by high sand content, loose structure, and complex pore systems, rendering their hydraulic parameters particularly sensitive under drip irrigation. Therefore, reliable determination of soil hydraulic parameters is essential for accurate simulation of soil water movement based on soil water retention curves and the Richards equation.
The results indicate pronounced vertical textural differentiation in aeolian sandy soils of the Kubuqi Sandy Land. With increasing soil depth, sand content and bulk density generally decreased, whereas silt and clay contents gradually increased. This pattern is closely associated with the study area’s location at the desert margin and the long-term effects of wind erosion, which favor the formation of coarse-textured, loosely structured sandy layers in the surface soil [4]. Furthermore, the predominance of forest land and the growth and distribution of shrub roots have modified the looseness of deeper soil layers, thereby influencing particle composition and pore structure. This behavior contrasts with that in cohesive soils, where root activity promotes aggregate formation and reduces bulk density [14], highlighting the distinctive structural evolution and hydraulic behavior of aeolian sandy soils.
Under multilayered and heterogeneous aeolian sandy soil conditions, soils with different particle size distributions exhibited markedly different water movement behaviors during drip irrigation. Even at identical initial water contents, substantial differences were observed in wetting front advancement and wetted body geometry among the experimental plots, consistent with previous findings [21]. These results suggest that soil particle composition not only governs pore size distribution, but also affects pore connectivity and water flow pathways, thereby exerting a strong influence on soil hydraulic parameters.
Further analysis indicated that pore space structural parameters obtained via nitrogen adsorption provide a complementary microscopic characterization of the pore system in aeolian sandy soils. Specific surface area (SSA), total pore volume (TPV), average pore diameter (APD), micropore volume fraction (PMV), and pore fractal dimensions were significantly correlated with saturated water content (θs), air-entry parameter (α), pore shape coefficient (n), and saturated hydraulic conductivity (Ks). As noted by [28], the geometric configuration of pore pathways constitutes the microscopic basis of macroscopic hydraulic behavior. The results of this study provide experimental evidence supporting the role of pore space structure in explaining variations in soil hydraulic parameters in aeolian sandy soils.
In estimating soil hydraulic parameters and simulating water movement under drip irrigation, jointly considering soil particle size distribution and pore space structural characteristics reduces uncertainty in parameter estimation and improves agreement between simulated and field-observed results. Compared with approaches based solely on particle size distribution, incorporating pore structure information provides a more comprehensive representation of the hydraulic behavior of aeolian sandy soils as heterogeneous porous media, thereby enhancing the reliability of drip irrigation water movement simulations.
It should be noted that the validation dataset used in this study was relatively limited, as hydraulic parameter estimation and model validation were primarily conducted using data from two independent test plots within the same study area. Although these plots exhibited distinct particle-size distributions and pore structure characteristics, they still represent aeolian sandy soils under similar climatic and environmental conditions. Therefore, the generalizability of the proposed pore-structure-informed pedotransfer function (PTF) to other regions, soil types, or management conditions remains to be further verified. In particular, soils with different parent materials, aggregation levels, or organic matter contents may exhibit different pore network configurations, which could influence the transferability of the relationships established in this study. Additionally, factors such as vegetation type, root water uptake dynamics, and temporal variability in soil structure were not explicitly incorporated into the current model framework, although they may affect hydraulic behavior.
Future research should focus on expanding the validation dataset to include multi-regional field experiments, different soil types, and broader environmental conditions. Incorporating cross-site validation and long-term monitoring data would help to further assess the robustness and predictive capability of the proposed model, thereby improving its applicability in diverse hydrological and irrigation management contexts.
6. Conclusions
This study investigated the characteristics and estimation of soil hydraulic parameters in typical aeolian sandy soils of the Kubuqi Sandy Land by combining field drip irrigation experiments with analyses of soil pore space structure. The main conclusions are summarized as follows:
(1) Hydraulic parameters of different soil layers were calibrated through inverse modeling based on the dynamic variations in soil volumetric water content and wetting front movement. The residual water content (θr) ranged from 0.0303 to 0.0493 cm3·cm−3, the saturated water content (θs) from 0.220 to 0.356 cm3·cm−3, the air-entry parameter (α) from 0.0184 to 0.0638 cm−1, the pore shape coefficient (n) from 1.67 to 3.96, and the saturated hydraulic conductivity (Ks) from 0.048 to 0.435 cm·min−1. Distinct differences in hydraulic parameters were observed among soil layers.
(2) Correlation and redundancy analyses revealed that residual water content (θr), pore shape coefficient (n), and saturated hydraulic conductivity (Ks) were strongly negatively correlated with specific surface area (SSA), total pore volume (TPV), and average pore diameter (APD), while exhibiting highly significant positive correlations with micropore volume fraction (PMV) and pore structure fractal dimension (Dp). In contrast, saturated water content (θs) and the air-entry parameter (α) showed opposite trends. These findings indicate that pore space structural characteristics can effectively capture variations in the hydraulic behavior of aeolian sandy soils.
(3) In estimating soil hydraulic parameters and simulating water movement under drip irrigation, integrating soil particle size distribution with pore space structural information markedly reduced prediction errors and improved simulation accuracy, demonstrating superior applicability compared with approaches based solely on particle size distribution.
Overall, under drip irrigation in aeolian sandy soils, integrating soil particle size distribution with pore space structural characteristics provides a practical approach for rapid estimation of hydraulic parameters and analysis of soil water movement. These findings offer valuable guidance for improving drip irrigation simulations, optimizing irrigation management, and supporting ecological restoration in sandy land regions. However, further validation across different regions and soil types is required to fully establish the general applicability of the proposed approach.
Author Contributions
W.Q.: Writing—original draft, Visualization, Investigation, Data curation, Conceptualization. K.S.: Writing—review & editing, Investigation, Conceptualization. L.W.: Writing—review & editing, Funding acquisition, Formal analysis, Data curation. All authors have read and agreed to the published version of the manuscript.
Funding
This work was supported by the National Natural Science Funds, P.R. China (No. 32571847, 32460288), Guiding Funds of Central Government for Supporting the Development of the Local Science and Technology (2024ZY0128), CSPON Project, China (No. 2023ZRBSHZ064), Natural Science Foundation of Inner Mongolia Autonomous Region (Project No. 2024QN03026).
Institutional Review Board Statement
Not applicable.
Informed Consent Statement
Not applicable.
Data Availability Statement
The raw data supporting the conclusions of this article will be made available by the authors on request.
Conflicts of Interest
The authors declare no conflicting financial interests.
References
- Nie, Z.; Chen, Y.; Zhang, J.; Shi, J.; Li, C.; Gao, W.; Sui, P. Effects of drip irrigation patterns on wheat yield and water use efficiency. Acta Agron. Sin. 2013, 39, 1687–1692. (In Chinese) [Google Scholar] [CrossRef] [Scilit]
- Bhunia, S.R.; Verma, I.M.; Sahu, M.P.; Sharma, N.C.; Balai, K. Effect of drip irrigation and bioregulators on yield, economics and water use of fenugreek (Trigonella foenum-graecum). J. Spices Aromat. Crops 2015, 24, 102–105. [Google Scholar]
- Li, J.; Li, Y.; Wang, J.; Wang, Z.; Zhao, W. Microirrigation in China: History, current situation and prospects. J. Hydraul. Eng. 2016, 47, 372–381. (In Chinese) [Google Scholar]
- Guo, Z.; Li, J.; Zhang, Y.; Wang, H.; Li, W. Soft rock promotes improvement of aeolian sandy soil in the Mu Us Sandy Land, China. Sci. Rep. 2023, 13, 11813. [Google Scholar] [CrossRef] [Scilit] [PubMed]
- Budhathoki, S.; Lamba, J.; Srivastava, P.; Malhotra, K.; Way, T.R.; Katuwal, S. Using X-ray computed tomography to quantify variability in soil macropore characteristics in pastures. Soil Tillage Res. 2022, 215, 105194. [Google Scholar] [CrossRef] [Scilit]
- Xi, B.; Bloomberg, M.; Watt, M.S.; Wang, Y.; Jia, L. Modeling growth response to soil water availability simulated by HYDRUS for a mature triploid Populus tomentosa plantation located on the North China Plain. Agric. Water Manag. 2016, 176, 243–254. [Google Scholar] [CrossRef] [Scilit]
- Yang, W.; Zhao, J.; Zhao, Y.; Wang, Q. Factors affecting evapotranspiration analyzed based on a structural equation model. J. Tsinghua Univ. 2022, 62, 581–588. [Google Scholar]
- Selim, T.; Bouksila, F.; Berndtsson, R.; Persson, M. Soil water and salinity distribution under different drip irrigation treatments. Soil Sci. Soc. Am. J. 2013, 77, 1144–1156. [Google Scholar] [CrossRef] [Scilit]
- Lai, J.B.; Ren, L. Estimation of effective hydraulic parameters in heterogeneous soils at field scale. Geoderma 2016, 264, 28–41. [Google Scholar] [CrossRef] [Scilit]
- Zhang, L.-T.; Shuai, F.; Chen, L.-B.; Huang, Y.-H.; Lin, J.-S.; Zhang, Y.; Ge, H.-L. Effect of gravel content on the detachment of colluvial deposits in Benggang. J. Mt. Sci. 2022, 19, 3088–3104. [Google Scholar] [CrossRef] [Scilit]
- Liu, K.; Huang, G.; Jiang, Z. Gaussian process-based ensemble Kalman filter for parameter estimation of unsaturated flow. J. Hydrol. 2020, 589, 125144. [Google Scholar] [CrossRef] [Scilit]
- Zhang, Y.G.; Schaap, M.G. Weighted recalibration of the Rosetta model (Rosetta3). J. Hydrol. 2017, 547, 39–53. [Google Scholar] [CrossRef] [Scilit]
- Mao, W.; Zhu, Y.; Ye, M. A quasi-3D model for simulating coupled unsaturated–saturated flow and solute transport. J. Hydrol. 2021, 602, 126749. [Google Scholar] [CrossRef] [Scilit]
- Ju, X.; Gao, L.; She, D.; Jia, Y.; Pang, Z.; Wang, Y. Impacts of soil pore structure on infiltration characteristics at the profile scale in the red soil region. Soil Tillage Res. 2024, 236, 105843. [Google Scholar] [CrossRef] [Scilit]
- Basile, A.; Ciollaro, G.; Coppola, A. Hysteresis in soil water characteristics as a key to interpreting comparisons of laboratory and field measured hydraulic properties. Water Resour. Res. 2003, 39, 1355. [Google Scholar] [CrossRef] [Scilit]
- Le Bourgeois, O.; Bouvier, C.; Brunet, P.; Ayral, P.A. Inverse modeling of soil water content to estimate hydraulic properties of a shallow soil and associated weathered bedrock. J. Hydrol. 2016, 541, 116–126. [Google Scholar] [CrossRef] [Scilit]
- Pachepsky, Y.A.; Rawls, W.J.; Lin, H.S. Hydropedology and pedotransfer functions. Geoderma 2006, 131, 308–316. [Google Scholar] [CrossRef] [Scilit]
- Li, Y.; Chen, D.; White, R.E.; Zhu, A.; Zhang, J. Estimating soil hydraulic properties using pedotransfer functions. Geoderma 2007, 138, 261–271. [Google Scholar] [CrossRef] [Scilit]
- Lv, D.; Zhang, S.; He, B.; Zhang, Z. Characteristics of soil macropore and water infiltration under different land use in hilly red soil region of northern Guangdong. Chin. J. Soil Sci. 2023, 54, 1290–1298. [Google Scholar]
- Siyal, A.A.; Skaggs, T.H. Measured and simulated wetting patterns under subsurface irrigation. Agric. Water Manag. 2009, 96, 893–904. [Google Scholar] [CrossRef] [Scilit]
- Naglic, B.; Kechavarzi, C.; Coulon, F. Influence of soil texture, drip emitter discharge and initial soil moisture on wetting patterns. Irrig. Sci. 2014, 32, 421–436. [Google Scholar] [CrossRef] [Scilit]
- Sun, K.; Wang, H.; Pei, Z.; Wang, H.; Sun, X.; Li, Y.; Sun, G.; Alatengsuhe; Yang, J.; Su, X. Particle-size fractal dimensions and pore structure characteristics of soils of typical vegetation communities in the Kubuqi Desert. Front. Environ. Sci. 2023, 10, 1044224. [Google Scholar] [CrossRef] [Scilit]
- Almquist, V.; Brueck, C.; Clarke, S.; Wanzek, T.; Dragila, M.I. Bioavailable water in coarse soils: A fractal approach. Geoderma 2018, 323, 146–155. [Google Scholar] [CrossRef] [Scilit]
- Wang, Y.F.; Liu, Y.; Wang, K.; Ding, X.; Xu, K.; Jia, L.; Xi, B. Effects of water-nitrogen coupling treatment on growth of Populus tomentosa pulp forest and the soil moisture-nutrient characteristics. Sci. Silvae Sin. 2025, 61, 85–97. [Google Scholar]
- Liu, H.; Li, Z.; Li, L.; Xu, Q.; Bai, Z.; Wang, T. Effects of deep vertical rotary tillage depth on the improvement of soil physicochemical properties and cotton yield in the current year and the following year in severe saline land in Southern Xinjiang of China. Trans. Chin. Soc. Agric. Eng. 2024, 40, 45–57. [Google Scholar]
- Li, D.; Xi, B.; Tang, L.; Feng, C.; He, Y.; Zhang, Y.; Liu, L.; Liu, J.; Jia, L. Patterns of soil water movement in drip-irrigated young Populus tomentosa plantations on sandy loam soil and their simulation. Sci. Silvae Sin. 2018, 54, 157–168. (In Chinese) [Google Scholar]
- He, X.; He, X.; Dang, H.; Wang, L.; Zhou, Z.; Lv, W. Simulation and analysis of soil water retention curves within and between hedgerows in northern China farm systems. Acta Prataculturae Sin. 2016, 25, 42–51. (In Chinese) [Google Scholar]
- Novák, V.; Kňava, K.; Šimůnek, J. Influence of stones on saturated hydraulic conductivity determined numerically. J. Hydrol. 2011, 406, 177–181. [Google Scholar]

Disclaimer/Publisher’s Note: The statements, opinions and data contained in all publications are solely those of the individual author(s) and contributor(s) and not of MDPI and/or the editor(s). MDPI and/or the editor(s) disclaim responsibility for any injury to people or property resulting from any ideas, methods, instructions or products referred to in the content. |
© 2026 by the authors. Licensee MDPI, Basel, Switzerland. This article is an open access article distributed under the terms and conditions of the Creative Commons Attribution (CC BY) license.