


Featured Application
By modelling multi-bolted connections treated as a system, it is possible to distinguish, among other things, a subsystem of the contact layer between the joined elements. The results presented in this article can be used to describe a model of this layer.
Abstract
The stiffness of connections between machine elements depends on the geometry of the product and the condition of the material from which the joined elements are made. This stiffness is also influenced by the state of the surface geometrical texture and the technological parameters during the assembly process. This study examined whether, under normal load, there is a significant change in the geometrical state of the surfaces joined by a multi-bolted connection. It was shown that by properly performing the preloading process for such a connection, loss of the elastic properties of the jointed surfaces can be avoided. The 3D images of the surfaces of the joined elements obtained as a result of the measurements can be used to model multi-bolted connections in a systemic approach.
1. Introduction
Multi-bolted connections remain one of the most important connections used in mechanical structures [1,2,3]. They play a very valuable role in ensuring the required static and dynamic properties of modern machines and technological devices. Adapting the designs of machines and devices with multi-bolted connections to the requirements of economic efficiency and durability poses a real challenge for designers. These two mutually exclusive criteria must be combined in a compromise solution that will ensure long-term load transfer and trouble-free operation of the designed machines or devices [4]. Such a procedure is rational and is used for newly manufactured machines and devices. The situation should be different for the servicing and repair of machines and devices that are in operation. To reduce the risk of losing connection stiffness, designers usually recommend replacing not only the fasteners but also elements whose surfaces are in contact with each other. This practice, in addition to generating high costs for replacement elements, places a significant burden on the environment. Apart from increased demand for raw materials and energy, it generates an additional carbon footprint for the machines and devices for which the replacement elements are manufactured [5]. Instead, it would be better to define the conditions under which this is not always necessary. The absence of additional processes during the servicing of machines and devices would not necessitate any extra electricity consumption. Furthermore, the fact that there would be no need to produce additional replacement components would mean there would be no unnecessary carbon footprint placing a burden on the environment.
When performing engineering calculations for multi-bolted connections, dedicated standards are most often used [6,7,8]. These standards can be utilised, among other things, to determine the strength and preload of bolts or their maximum tightening torque. With this type of connection design, the occurrence of non-linear changes in stiffness at the point of contact between two interacting surfaces is also ignored, and perfect stiffness of the contact connections is assumed [9,10,11]. In such cases, in addition to dimensions and their tolerances [12], geometrical requirements are often specified for joined surfaces, the most common of which are flatness and roughness. At the same time, the design documentation for two interacting surfaces specifies strict requirements for maximum surface roughness (Rz) or the arithmetic mean deviation of the profile roughness from the mean line (Ra) [13,14]. On the one hand, this is a very safe approach, which ensures compliance with the requirements resulting from the maximum permissible pressures of cooperating surfaces. On the other hand, it is difficult to maintain the economics of a technological process for a surface characterized by very low unevenness values.
In the case of more advanced calculations focused on specific aspects or phenomena occurring in these connections, it is necessary to consider the effects observed in the modelling process during experiments [15]. One such phenomenon is the uneven adherence of the joined surfaces to each other [16]. Even precisely machined surfaces always only meet each other on a limited part of that surface [17,18,19,20,21].
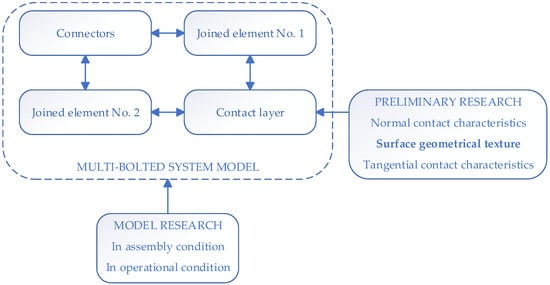
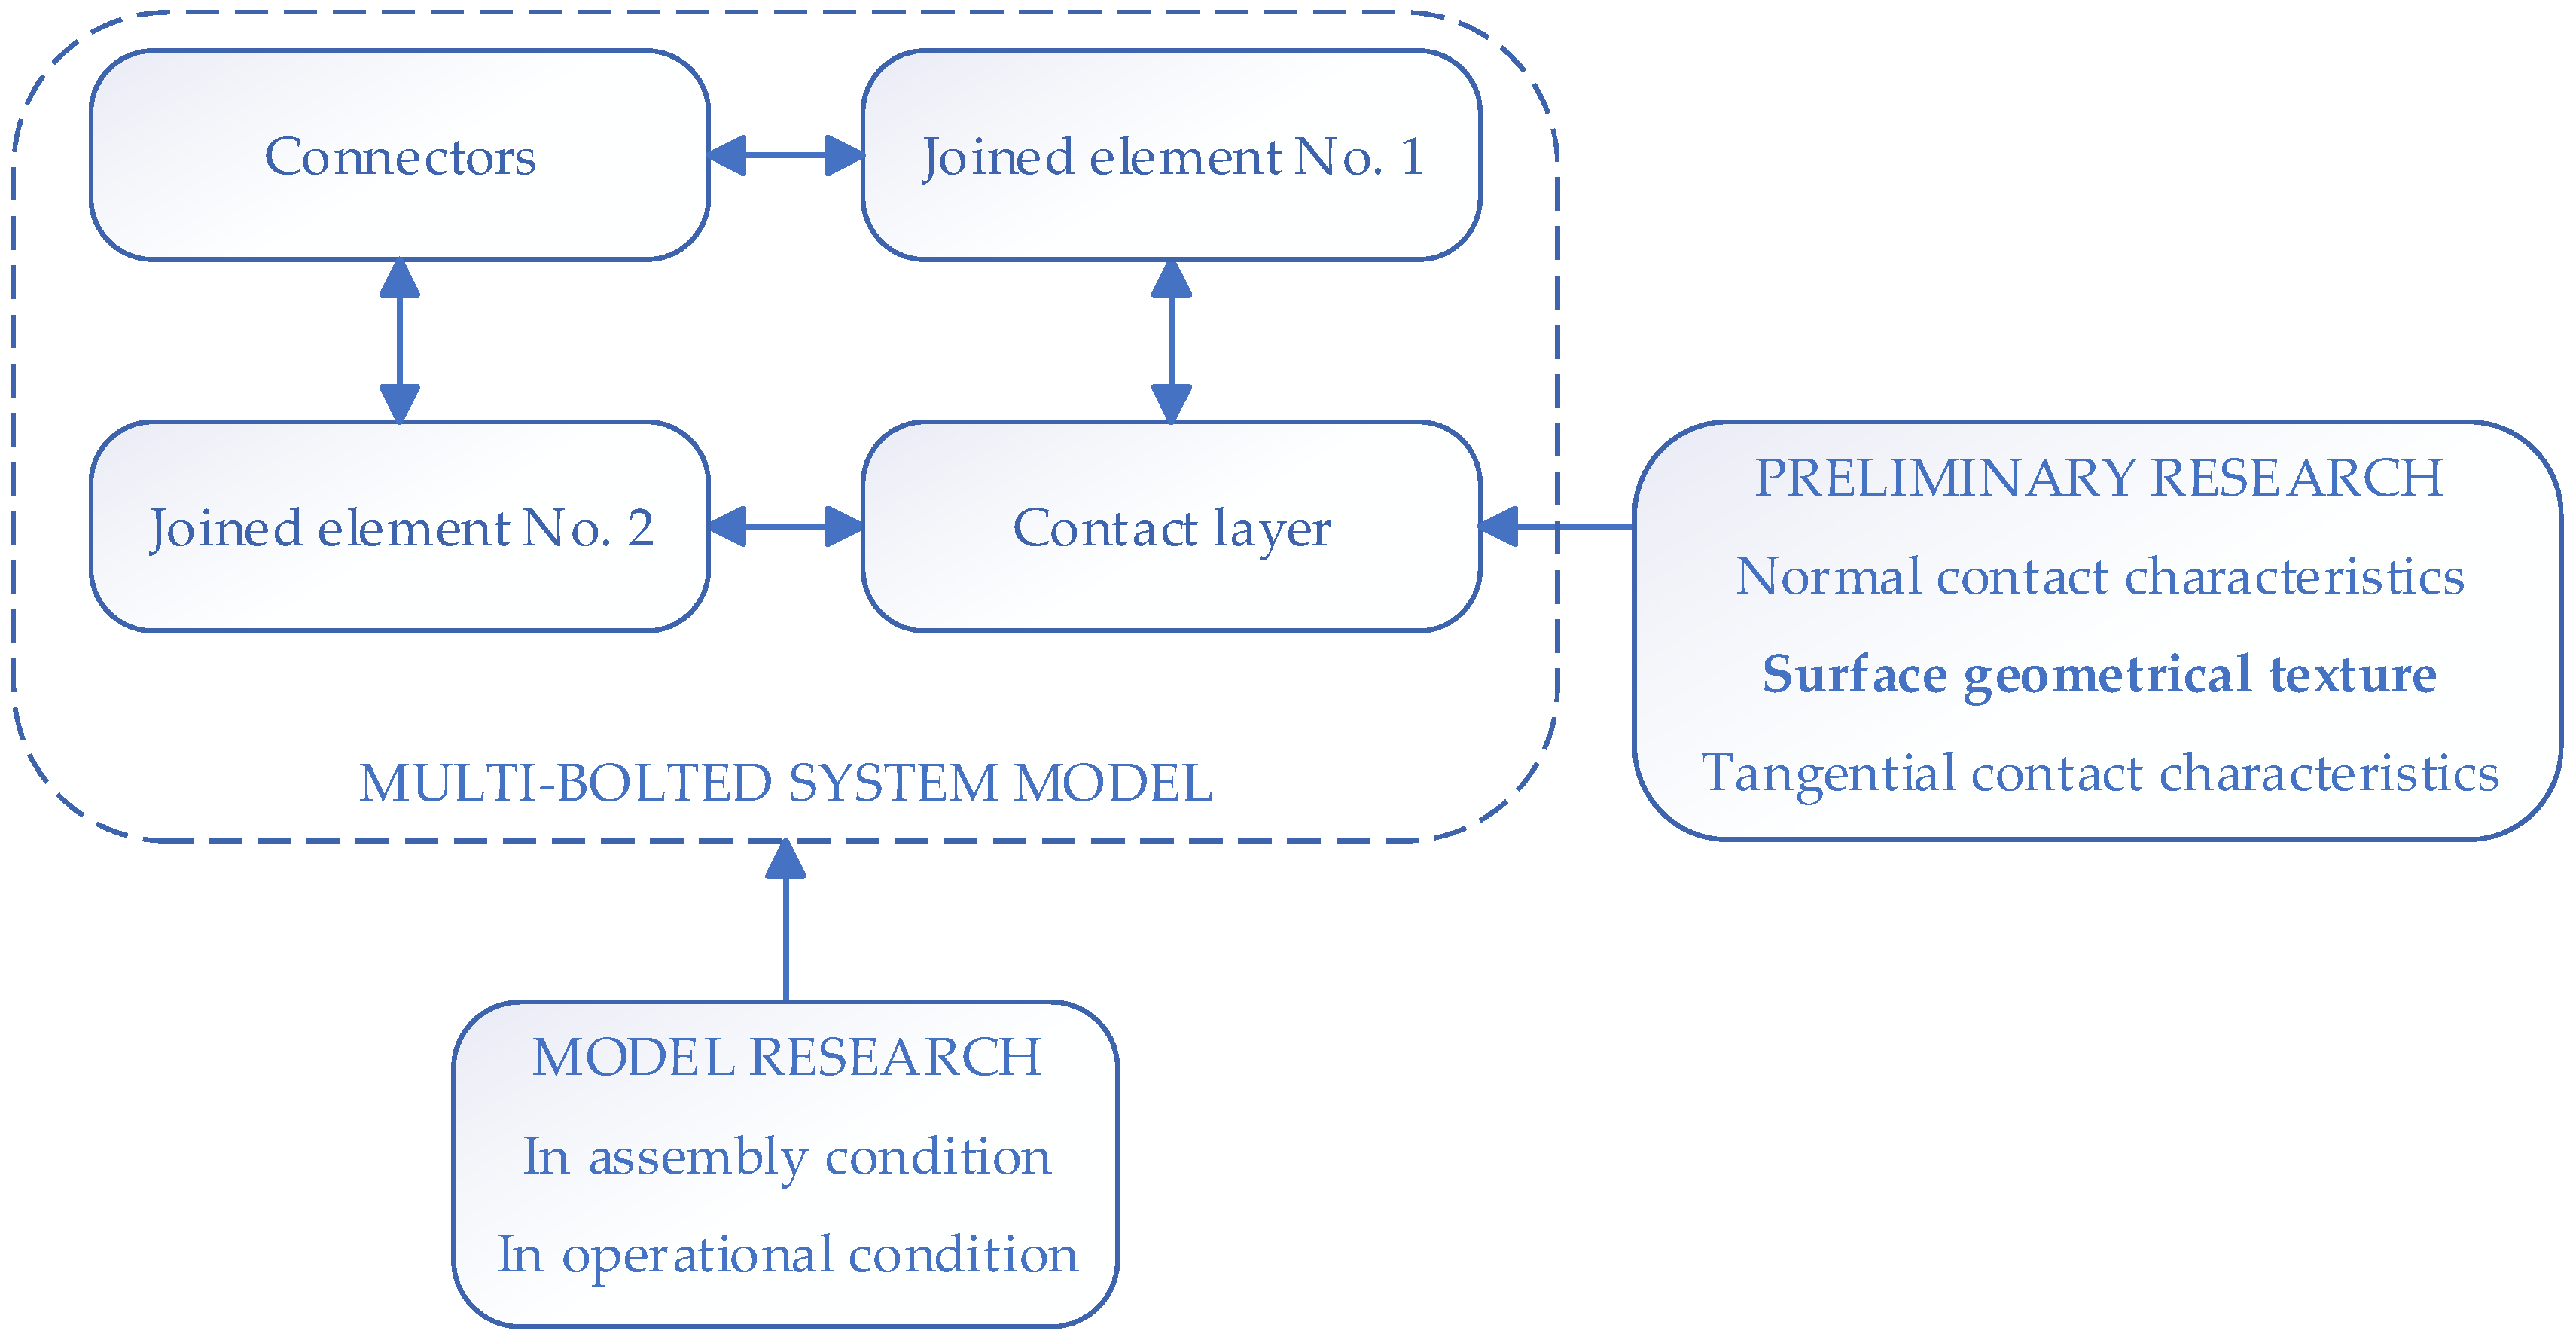
When modelling a multi-bolted connection as a system [22], it is possible to identify specific subsystems within it that can be modelled separately. An example of such a system is shown in Figure 1.
Figure 1.
Multi-bolted connection treated as a system.
The system presented in Figure 1 can be divided into the following subsystems: connectors, a pair of joined elements, and the contact layer between them. When modelling individual subsystems, it is possible to take into account phenomena occurring in real connections, observed during experimental tests. For example, the contact layer can be described by mechanical characteristics in the normal and tangential directions [22,23]. It is also possible to take into consideration the surface geometrical texture (SGT) [24,25] of the joined elements. The validation of the multi-bolted system model can take place both at the stage of bolt preloading and during system operation.
Fractal description [26] is most commonly used to model irregularities on the surface of joined elements. The modelling of composite single-bolted connections, including the rough contact layer between the joined elements, was discussed in a paper by Zhou et al. [27]. They determined the mechanical parameters of contact using fractal contact theory. A model of bolted connection stiffness considering the effects of surface irregularities in contact between rough surfaces using a revised fractal contact model is presented in [28]. Theoretical model studies on the tangential stiffness and friction hysteresis of bolted connections subjected to transverse vibrations were presented by Li et al. [29]. They proposed a multiscale modelling method based on fractal contact theory and a discretised Iwan model [30,31] to characterise the friction behaviour in bolted connections. Previously, rough surfaces between jointed elements were also replaced with a spring system [32]. Methods of this type are still used today [33], although they should be considered as simplified.
Another approach to modelling the contact between elements in a multi-bolted connection is to introduce an equivalent virtual layer (EVL) of material into the model instead of the contact surface [34]. An example approach to determining material constants for such a layer is shown in [35]. Wang et al. [36] applied an EVL model in calculations for an example multi-bolted flange connection but removed the bolts from the modelled system. The application of an EVL model for predicting the natural vibration frequency of composite bolted connections is discussed by Yang et al. [37]. This type of contact model was also used to assess the impact of contact between rough surfaces on the dynamic reactions of composite bolted connections [38]. A model of an EVL divided into radial segments is shown in [39]. In turn, a comparison of the twin-bolted connection model with a contact layer in the form of an EVL and in the form of a spring assembly was made by Chang et al. [40].
Very few researchers have used experimentally measured surface profiles to model the contact layer between elements joined in a multi-bolted connection. An example is the work of Zhang et al. [41], who measured the profiles of joined surfaces using a three-coordinate measuring machine for modal analysis of selected symmetrical four-bolted connections. Meanwhile, the idea of measuring surface profiles in order to model them, for example using the finite element method (FEM), is well known [42,43]. One of the simple analyses of contact on a rough surface determined experimentally using the FEM is presented in [44]. A similar simplified analysis with regard to surfaces obtained after hybrid milling and ceramic ball burnishing is shown in [45]. Walter et al. [46] described a 2D finite element simulation of the effect of surface roughness on the nanoindentation of thin layers using spherical indentations. Theoretical analysis and finite element analysis of static friction between surfaces with different roughnesses measured experimentally were performed by Wang et al. [47]. Zhang et al. [48] conducted more advanced experimental and finite element analyses of contact behaviour between non-transparent rough surfaces produced by different methods. Under experimental conditions, they measured the actual contact area of contact pairs made of aluminium and polycarbonate. Then, they developed finite element models to simulate the contact behaviour of the same pairs. The simulation results were consistent with the experimental observations when the material properties of the rough surfaces were consistent. The above examples concern the modelling of experimentally measured surfaces. However, sometimes computer-generated random surfaces are modelled [49,50,51].
Given the limited use of SGT measurements of elements joined by multiple bolts in their modelling to date, this topic was addressed in our paper. For the selected multi-bolted connection used in systemic modelling [22], the geometrical conditions of the joined surfaces were examined and evaluated before and after they were loaded with normal forces. Based on these activities, two aims set in the work were achieved. The first was to obtain 3D images of individual surfaces that can be implemented in the systemic modelling of a multi-bolted connection using the FEM, either directly or by applying the above-mentioned idea of an EVL. The second aim was to investigate the effect of normal load on changes in the geometrical texture of the bolted joint surface.
2. Materials and Methods
2.1. Tested Contact Joint
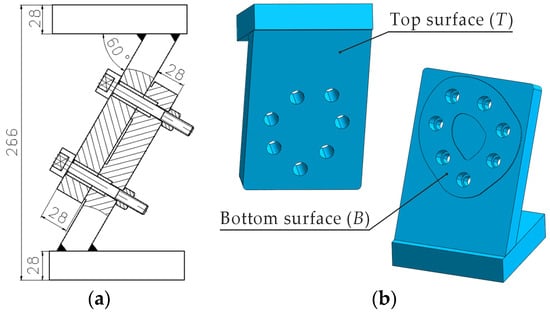
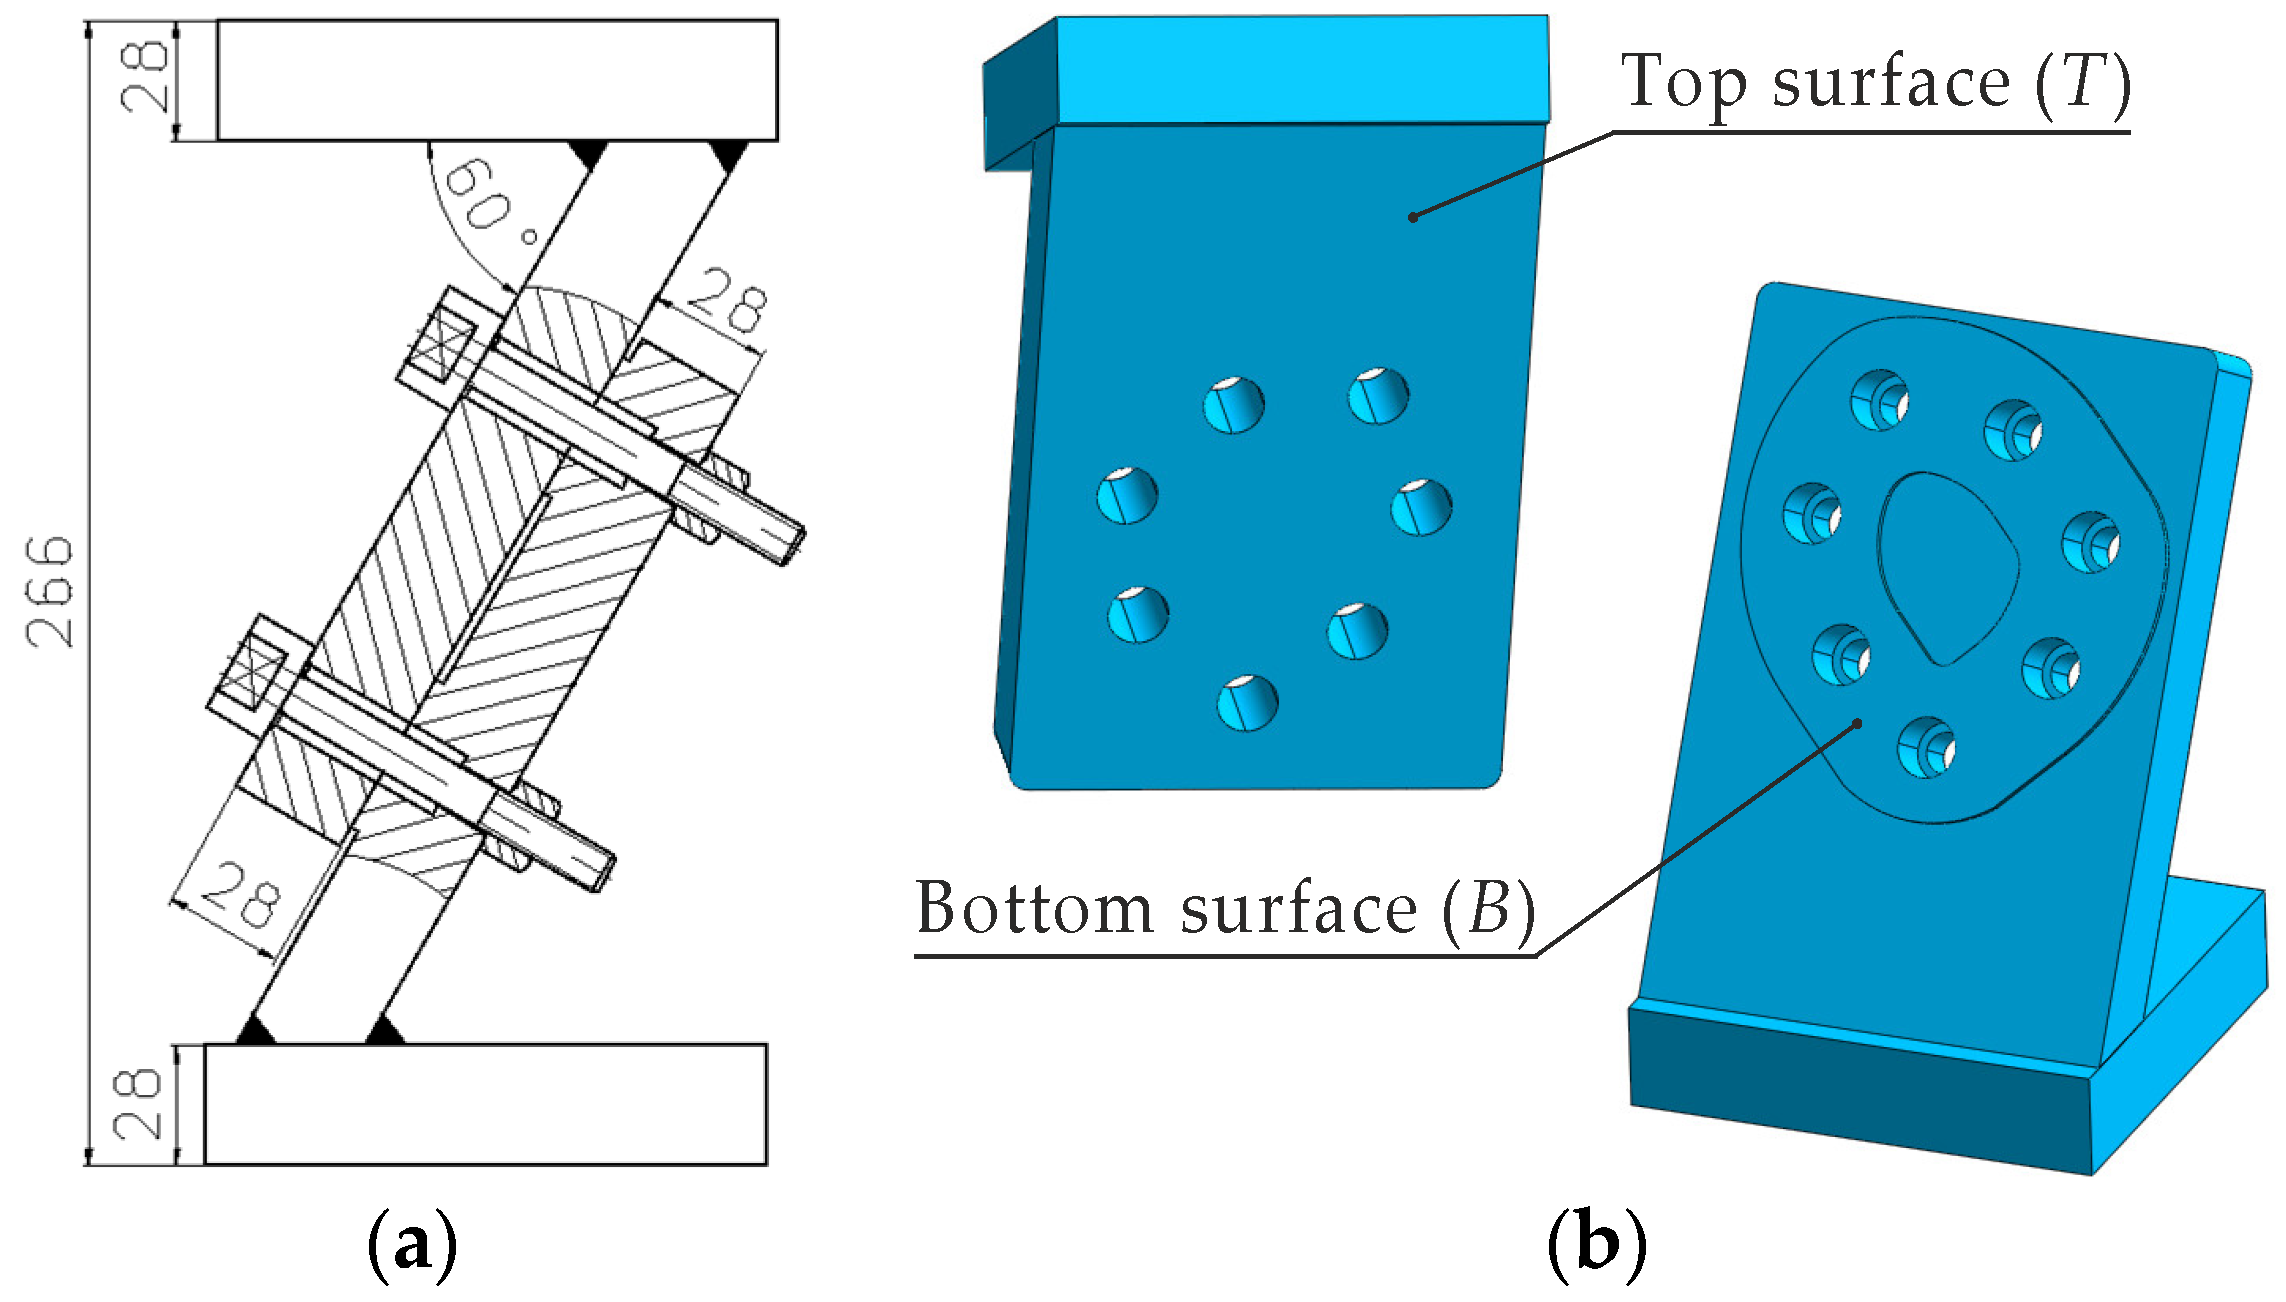
The contact joint under test was taken from the multi-bolted connection shown in Figure 2a. It consists of two surfaces marked in Figure 2b as the top surface (T) and bottom surface (B) of individual elements joined in the multi-bolted connection. All elements in the connection were made of non-alloy steel 1.0577 [52], which has a yield strength of 345 MPa and a modulus of elasticity of 210 GPa. The asymmetrical surface B was adopted to meet the assumption of an arbitrary shape of the contact surface. This also allows for the conclusion that the multi-bolted connection system model, to which the results of the research described in this paper can be applied, is of a universal nature [22]. The shape of surface B fitted within a circle with a diameter of 175 mm, and its dimension was 89.2 cm2.
Figure 2.
Analysed contact joint: (a) scheme; (b) view of joined element models.
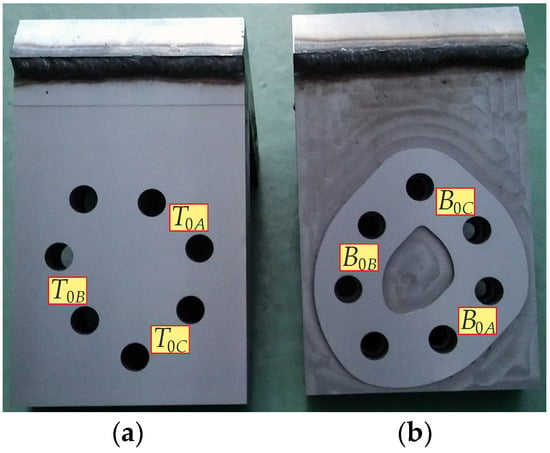
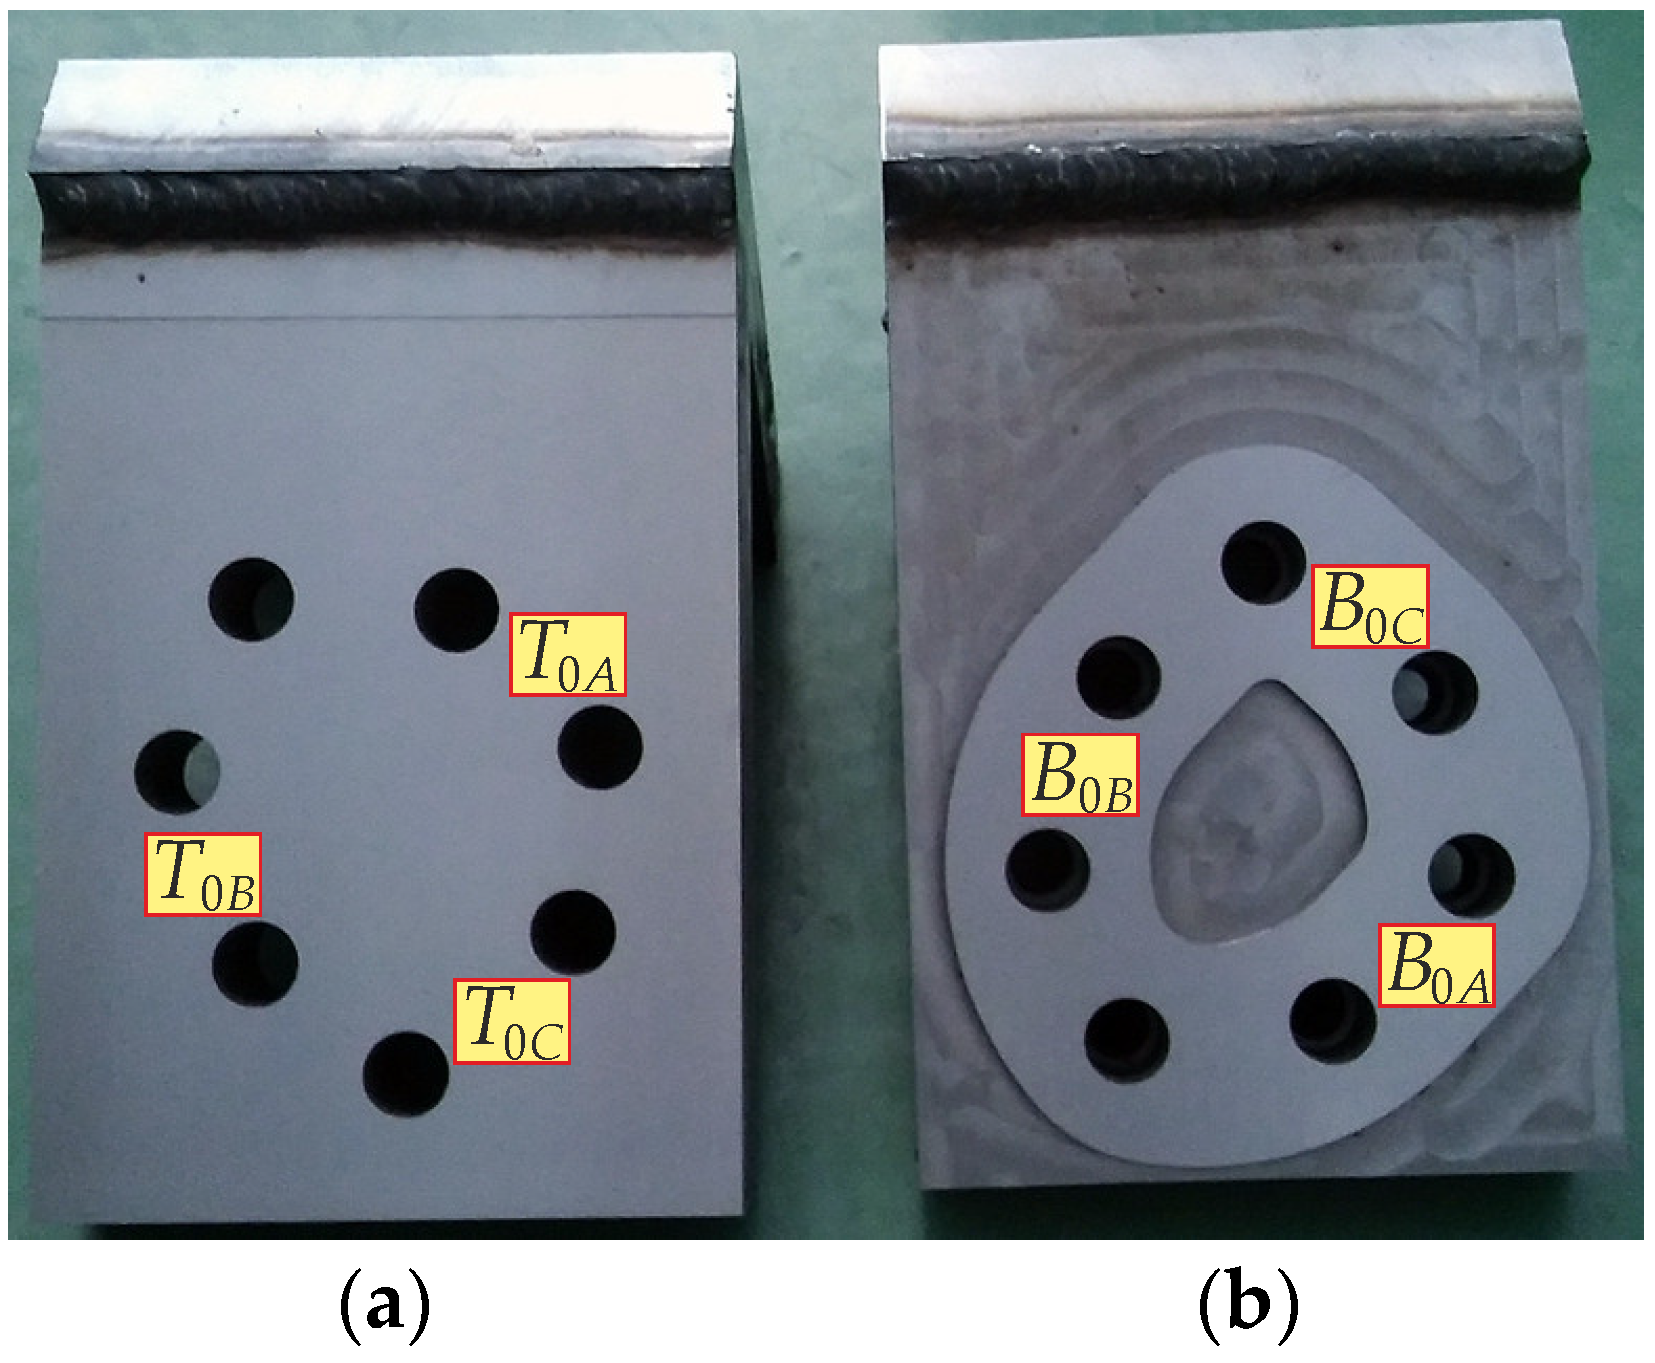
Before testing, surfaces T and B underwent a typical grinding process on a Malcus MP9 surface grinder (Malcus Holmquist AB, Halmstad, Sweden) equipped with a magnetic table. A large-pore grinding wheel with electro-corundum grit and a ceramic bond, manufactured by FTŚ Elephant (Grodzisk Mazowiecki, Poland) [53], was used for the machining. The machining was carried out at a rotational speed of 30 m/s (i.e., at a grinding wheel speed of 1900 rpm) and with a cross feed of 0.04 mm. This procedure was used to reduce the non-linearity of the normal contact characteristics and facilitate subsequent modelling of the contact layer using the FEM [15]. A photo of the surfaces forming the contact joint under investigation is shown in Figure 3.
Figure 3.
Actual elements forming the contact joint before loading: (a) surface T; (b) surface B (subscript 0 denotes the surface before loading, while subscripts A, B and C denote successive SGT measurement areas).
Surfaces T and B were analysed immediately after preparation (after grinding) and after being subjected to normal forces. The load consisted of preloading the joint using seven bolts in three passes and according to different tensioning sequences. The full preload of each bolt was 22 kN and was determined on the basis of EN 1993-1-8 [54]. Details of the preloading process and its results were published in [55,56].
2.2. Procedure for Determining SGT
SGT measurements were performed using the AltiSurf A520 multisensory surface topography testing machine [24] from Altimet (Altimet, Thonon-les-Bains, France), equipped with a chromatic confocal sensor CL2 with a working range of up to 400 µm and a vertical resolution of 22 nm. The measurements were performed on fields measuring 3.0 × 2.0 mm. The scanning resolution was experimentally set at 0.47 µm along the X-axis and 1.97 µm along the Y-axis, resulting in 6303 points on 1520 lines. The measurement of approximately 9.6 million points for each surface took an average of 2 h.
Three measurements were taken from selected areas of the unloaded surfaces T and B (designated T0X and B0X, respectively) and three measurements were taken from the same areas of surfaces T and B after loading in accordance with Section 2.1 (designated T1X and B1X, respectively). Subsequent measurements were marked with the subscript X, which could take the values A, B and C (see Figure 3). The surfaces to be joined were ground using the same process parameters. It was therefore assumed that they could be considered identical across the entire contact area. For the SGT characteristic tests, sections between the bolt holes were selected, at intervals of every 2–3 holes. Given the specified dimensions of the multi-bolted connection and the closely spaced bolts in the flange, it was considered that the distribution of surface pressures between the joined surfaces was uniform and that the sections of the contact area selected for testing were representative of the entire contact surface.
The analysis of the collected data and the development of SGT (in accordance with ISO 25178-2 [57,58]) were carried out using MCubeMAP 8.1 software, based on MOUNTAINS technology (Mitutoyo, Kanagawa, Japan). Each time, for the registered point cloud of the measured surface, an SGT analysis methodology was used, which included setting a threshold value to remove incorrectly collected surface points (the removed points were set as unmeasured values). Then, the surface was levelled (using the least squares method [59] to approximate the average plane). For the developed point clouds, the values of selected height and volume SGT indicators were determined [60,61,62]—see Table 1.
Table 1.
Set of indicators used to characterise changes occurring on the studied surfaces and the accompanying measurement uncertainty value.
All measurements were carried out in accordance with good metrological practice. Three scans were performed on each area of the tested surfaces. Next, the values of selected SGT indicators were determined. The calculated standard deviation of these indicators, increased by the expansion factor k = 2.0 (covering a 95% range of variability around the mean value [63]), was used to calculate the measurement uncertainty using the following product:
3. Results and Discussion
3.1. Assessment of the Variability of the Obtained SGT Indicators
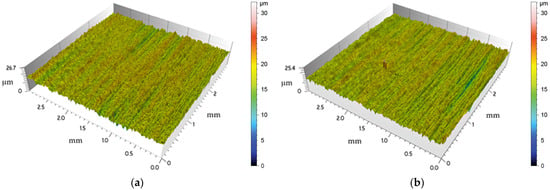
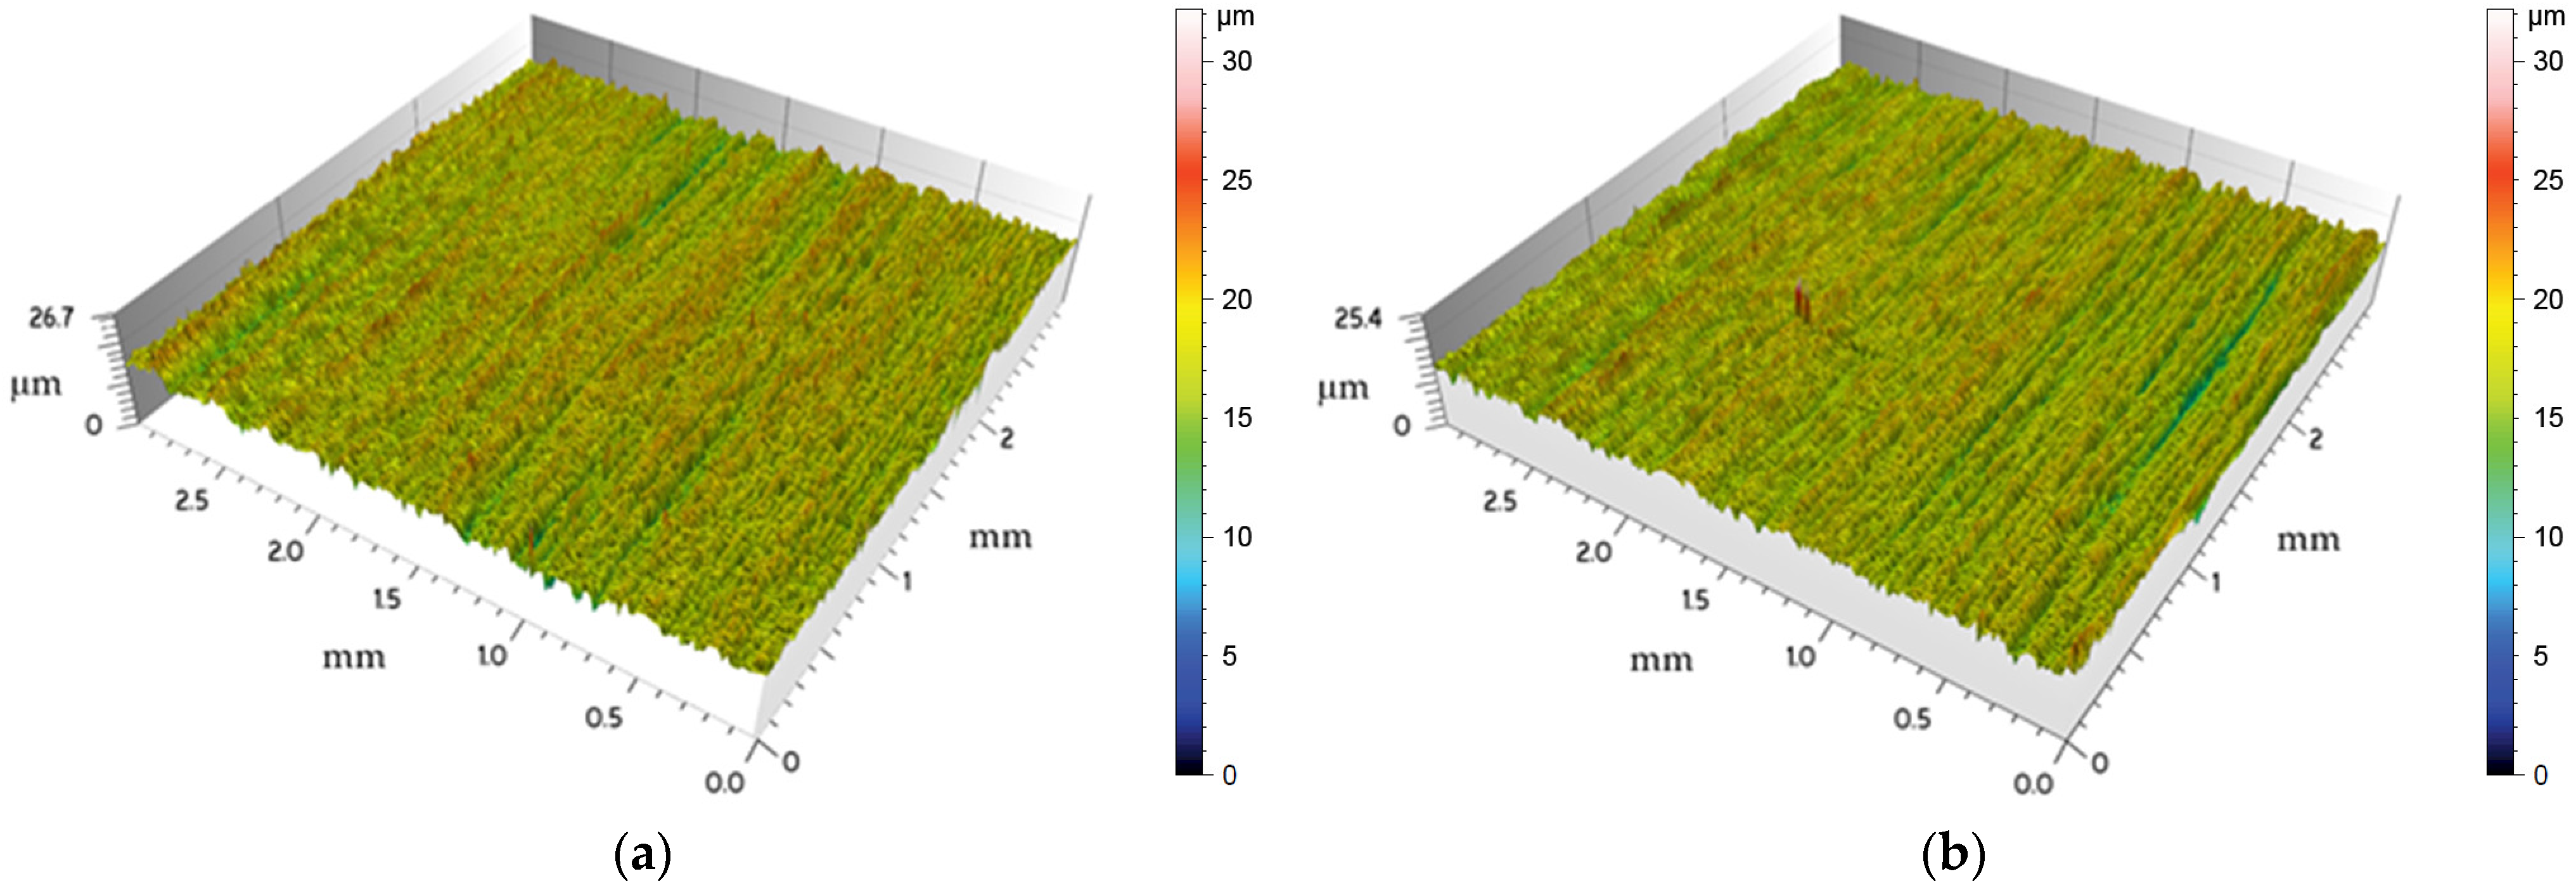
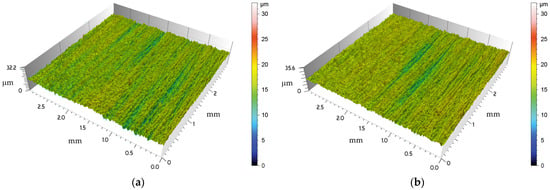
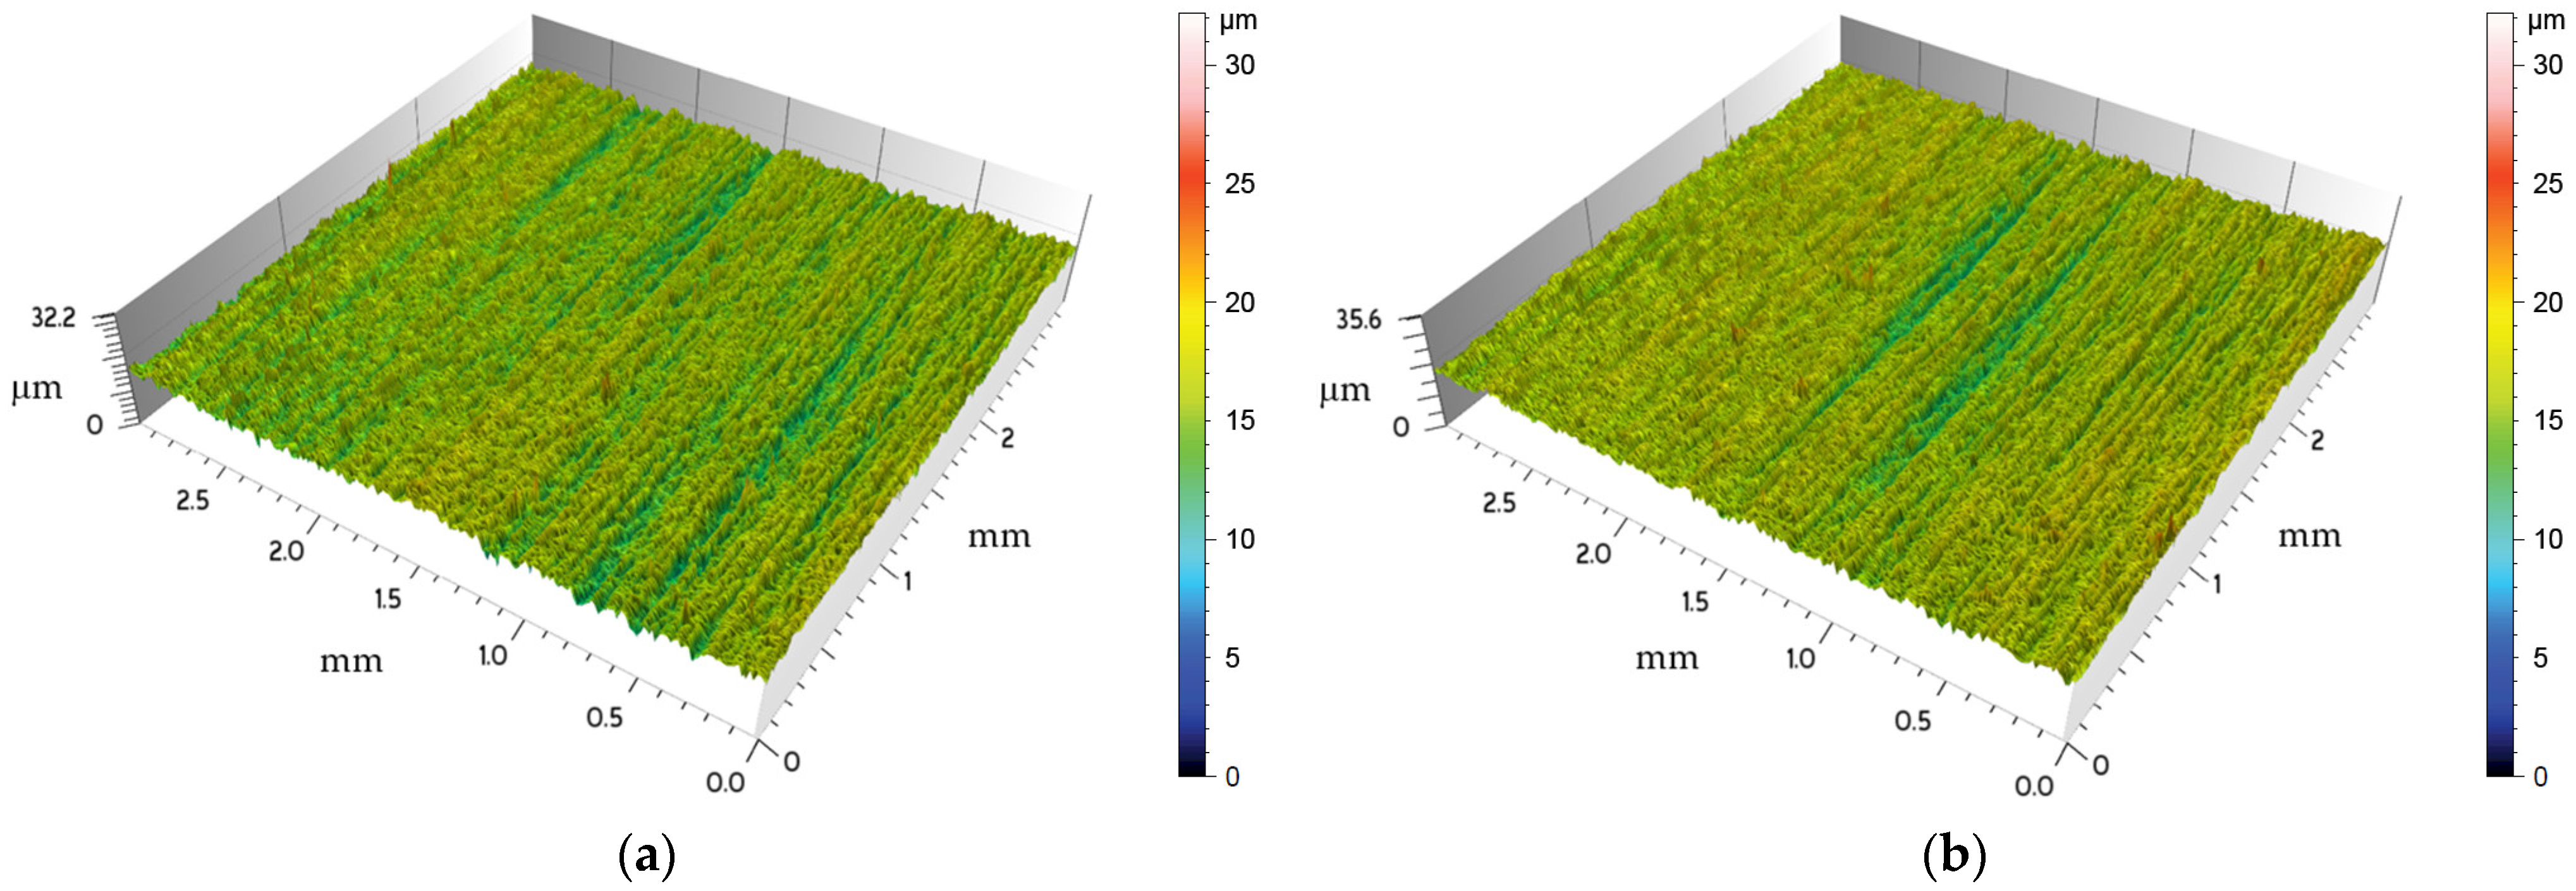
Examples of selected areas of the tested surfaces before and after loading are shown in Figure 4 and Figure 5. The collection of 3D images of surfaces T and B can be used to model a multi-bolted connection using the FEM, either directly or using an EVL. The first aim of the work has therefore been achieved.
Figure 4.
Examples of selected areas of the tested surfaces: (a) T0B; (b) T1B.
Figure 5.
Examples of selected areas of the tested surfaces: (a) B0B; (b) B1B.
The statistical characteristics of the analysed SGT indicators recorded for unloaded and loaded surfaces T and B are presented in Table 2.
Table 2.
Characteristics of the analysed SGT indicators recorded for surfaces T and B before and after loading.
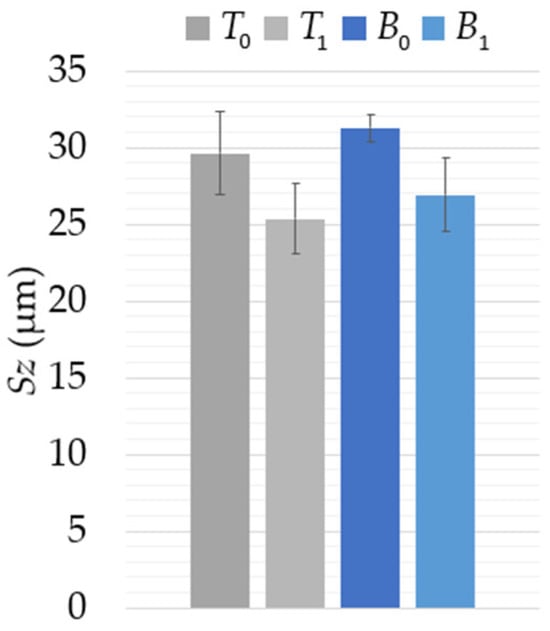
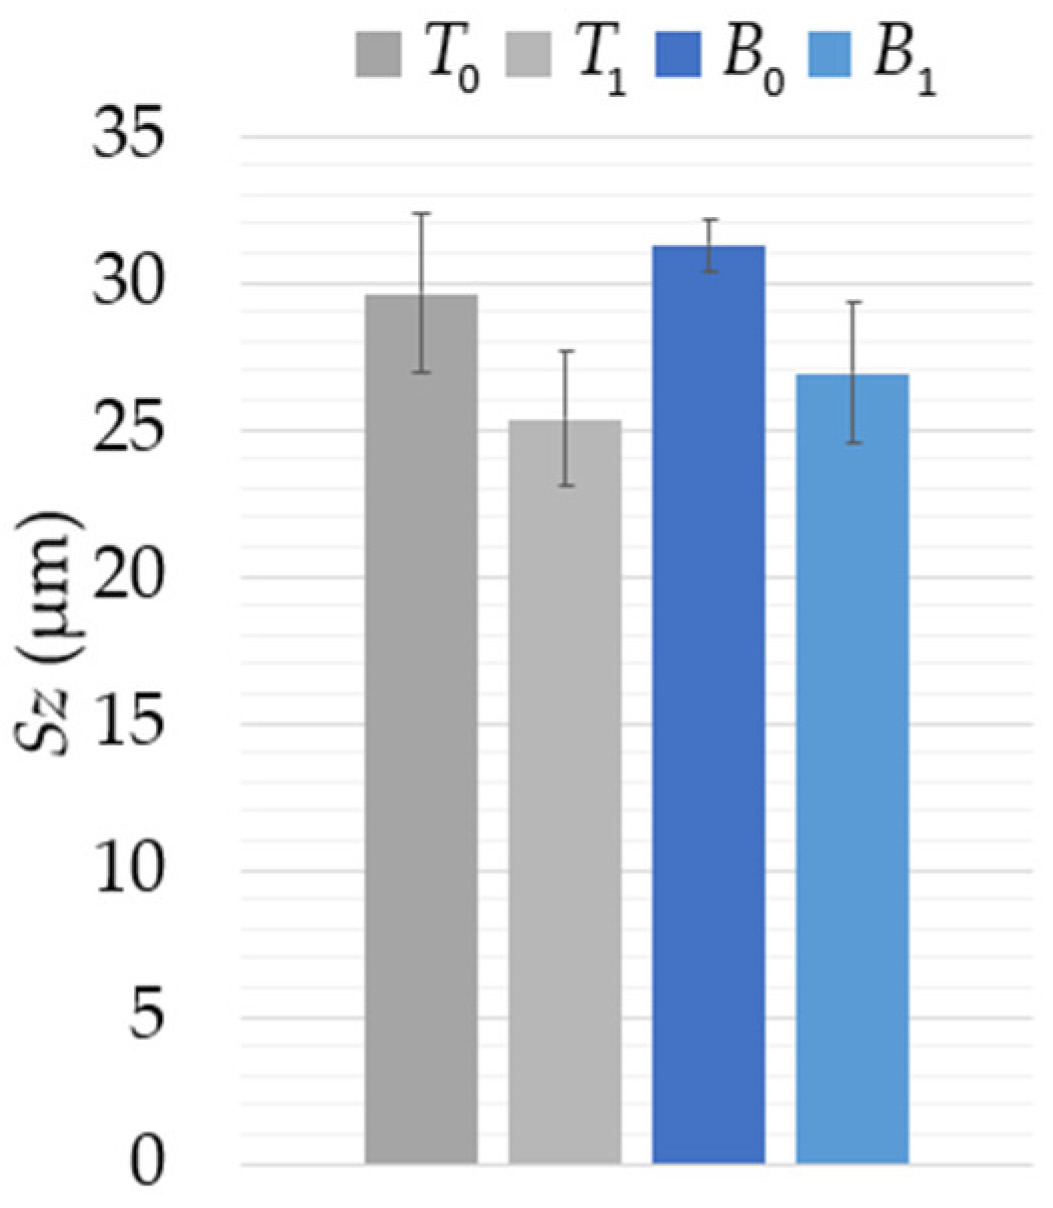
The changes in the mean values of the indicator describing the maximum irregularities of the tested surfaces—Sz—are shown in Figure 6.
Figure 6.
Mean values of the indicator describing the maximum irregularities of the tested surfaces—Sz. (Error bars indicate the standard deviation for the indicator value.)
Both surfaces under consideration (T and B) were prepared for testing in a very similar manner. The value of the Sz indicator describing the maximum height of irregularities for these surfaces fluctuates around 30 μm (with the irregularities on surface B being slightly greater)—see Figure 6. After applying a normal load to both tested surfaces, the maximum surface irregularities decreased by approximately 15%. This was caused by permanent plastic deformation of the individual highest-surface peaks (for comparison, see [64]).
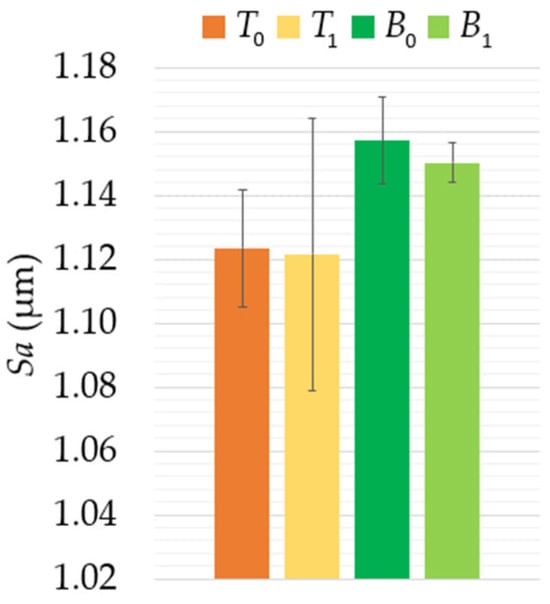
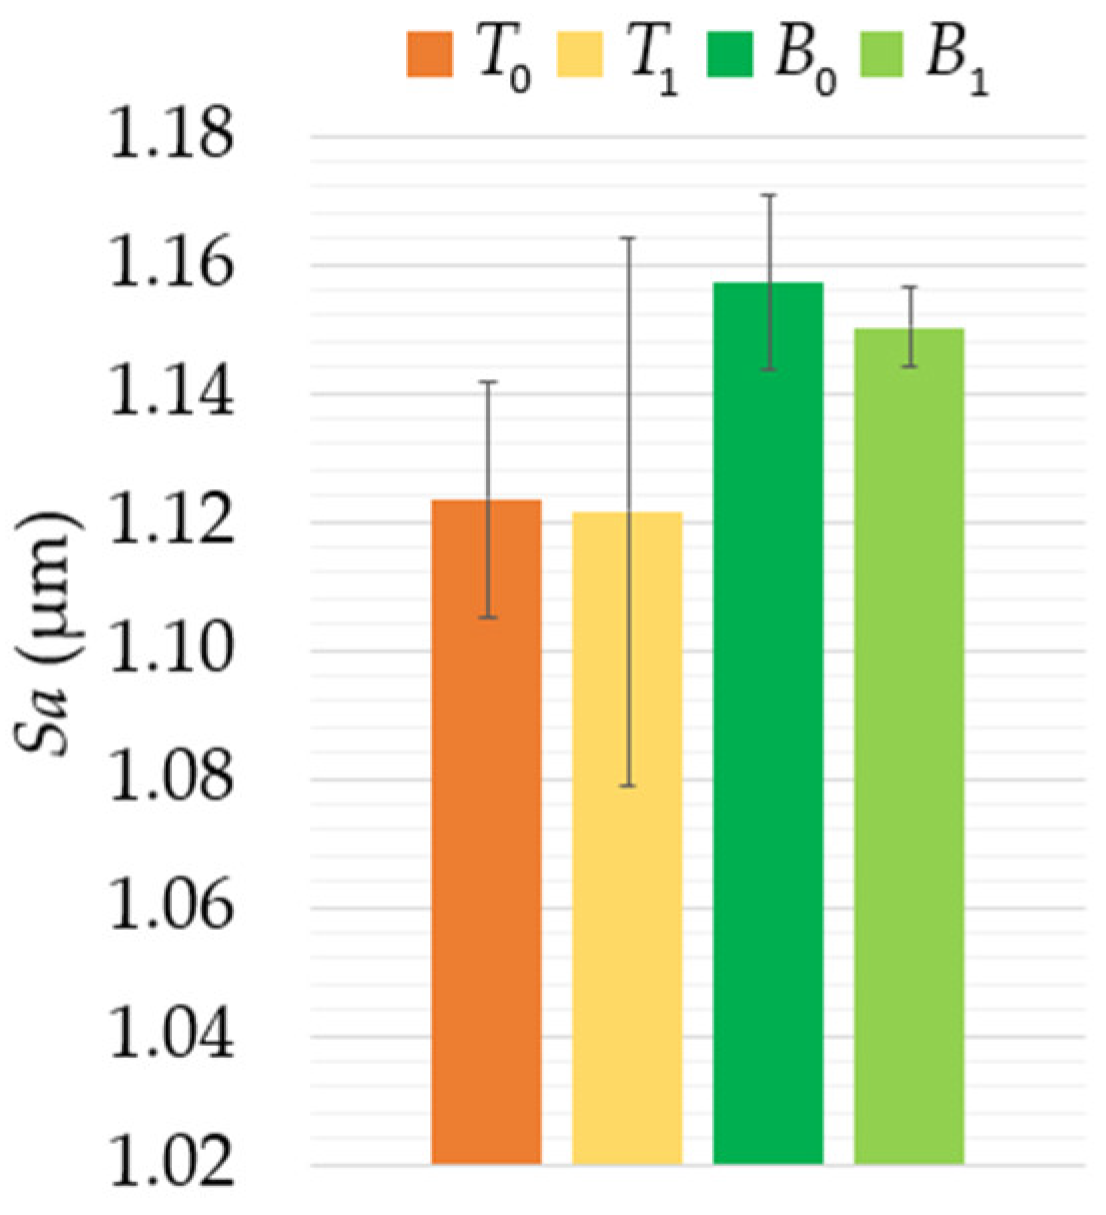
The changes in the mean values of the indicator describing the arithmetic mean of the irregularities of the tested surfaces—Sa—are shown in Figure 7.
Figure 7.
Mean values of the indicator describing the arithmetic mean of the irregularities of the tested surfaces—Sa. (Error bars indicate the standard deviation for the indicator value.)
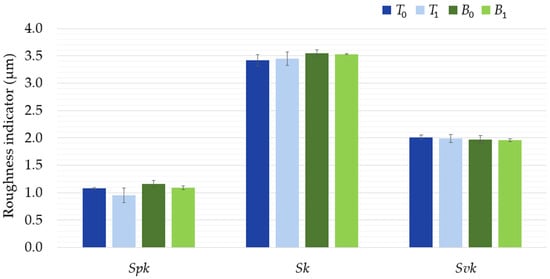
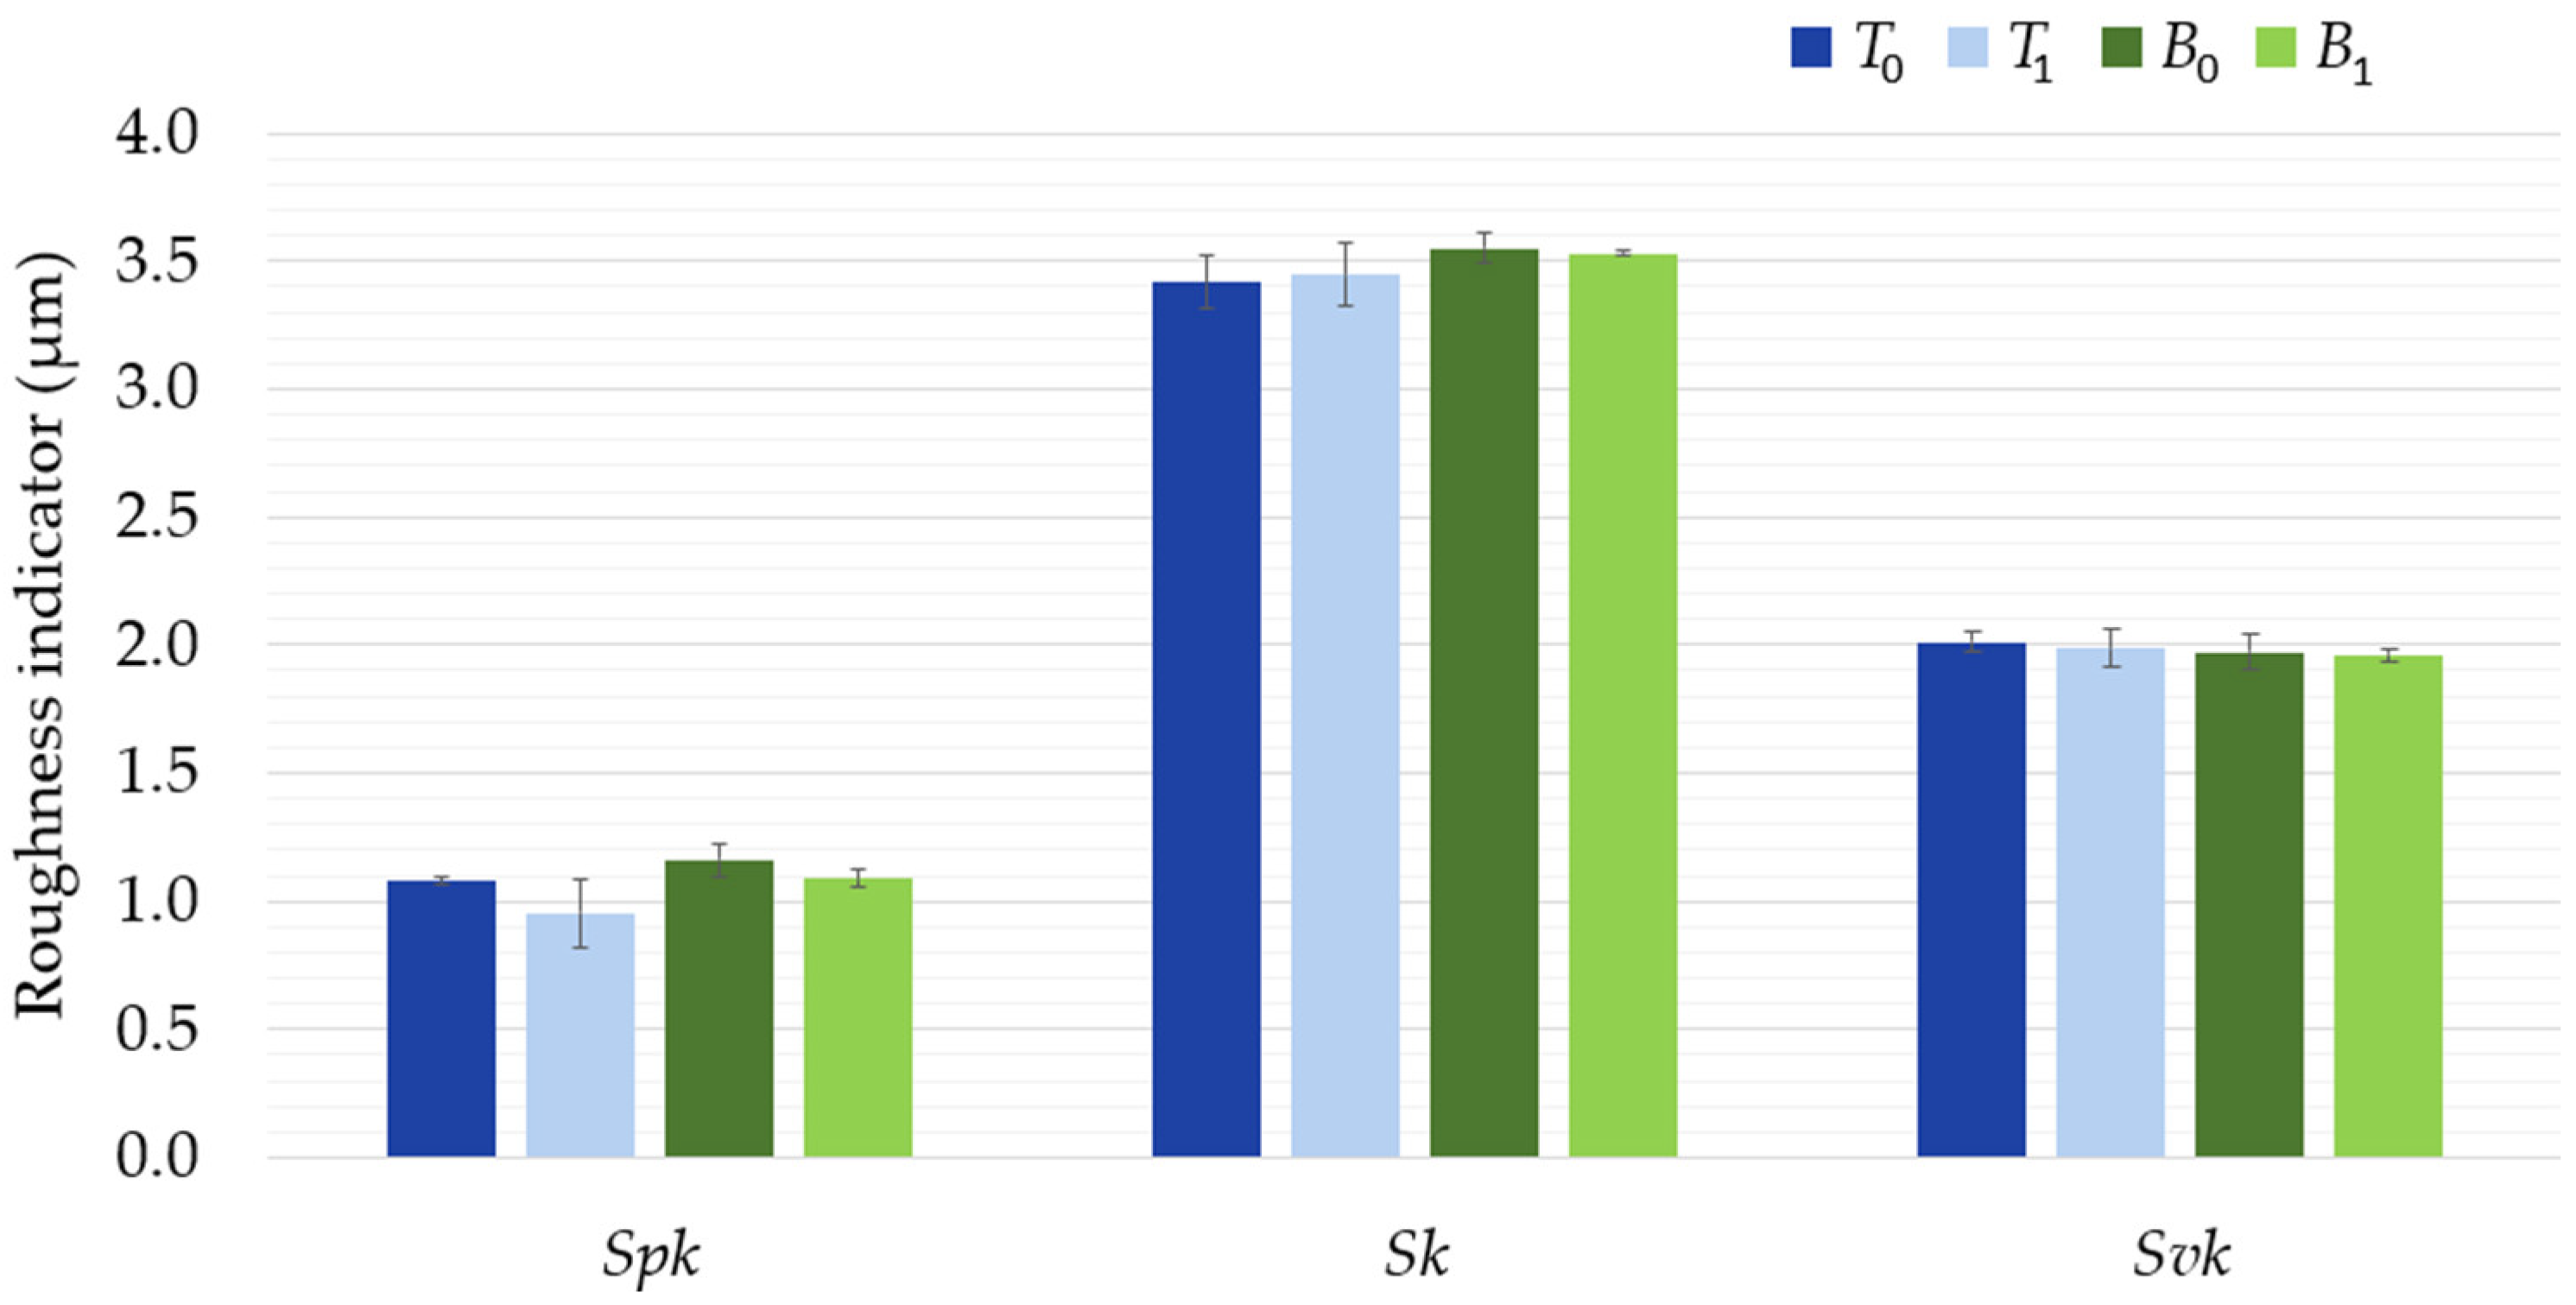
The changes in the arithmetic mean height of the irregularities of the tested surfaces (reflected in the Sa indicator) are practically imperceptible—see Figure 7. After applying a normal load to both surfaces, the Sa indicator decreased by less than 1% of its original value. The change in the values of indicators determined on the basis of the Abbott–Firestone curve [65], such as the core roughness depth (Sk) and the reduced valley depth (Svk), is similar in this respect (Figure 8). The only indicator in this group of SGT indicators that undergoes greater changes is the reduced peak height of the material (represented by the Spk indicator). After loading the tested surfaces, a reduction of nearly 12% in this indicator was recorded in relation to the original value for surface T and a reduction of almost 7% in relation to surface B.
Figure 8.
Mean values of indicators for the tested surfaces determined based on the Abbott–Firestone curve—Spk, Sk and Svk. (Error bars indicate the standard deviation for the indicator value.)
The values of the Sz indicator, similarly to the Spk indicator, are determined in relation to locally occurring ‘extreme heights’ of surface irregularities. These frequently observed local extremes on the surface are the result of technological errors made during its preparation. They are also caused by the structure of the material, and their presence is sometimes adversely affected by the environment and contamination encountered during SGT testing. No additional filtering was used when determining the values of the SGT indicators selected for analysis in this study. Therefore, the values of the Sz and Spk indicators were more sensitive to changes taking place on the surfaces, the main source of which was the application of normal load to them before the second part of the tests. Naturally, the high variability observed in these indicators may reduce the sensitivity of statistical tests that compare the significance of changes in mean values against the range (when the range is large, the mean values must differ by a very large margin).
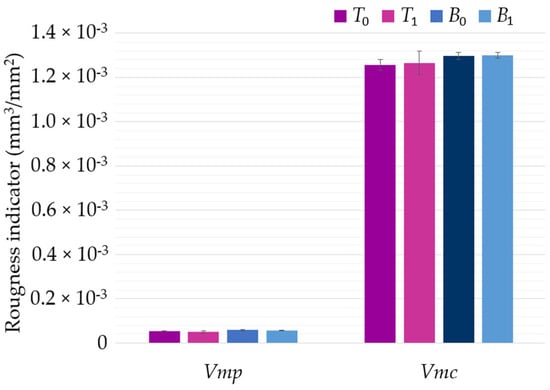
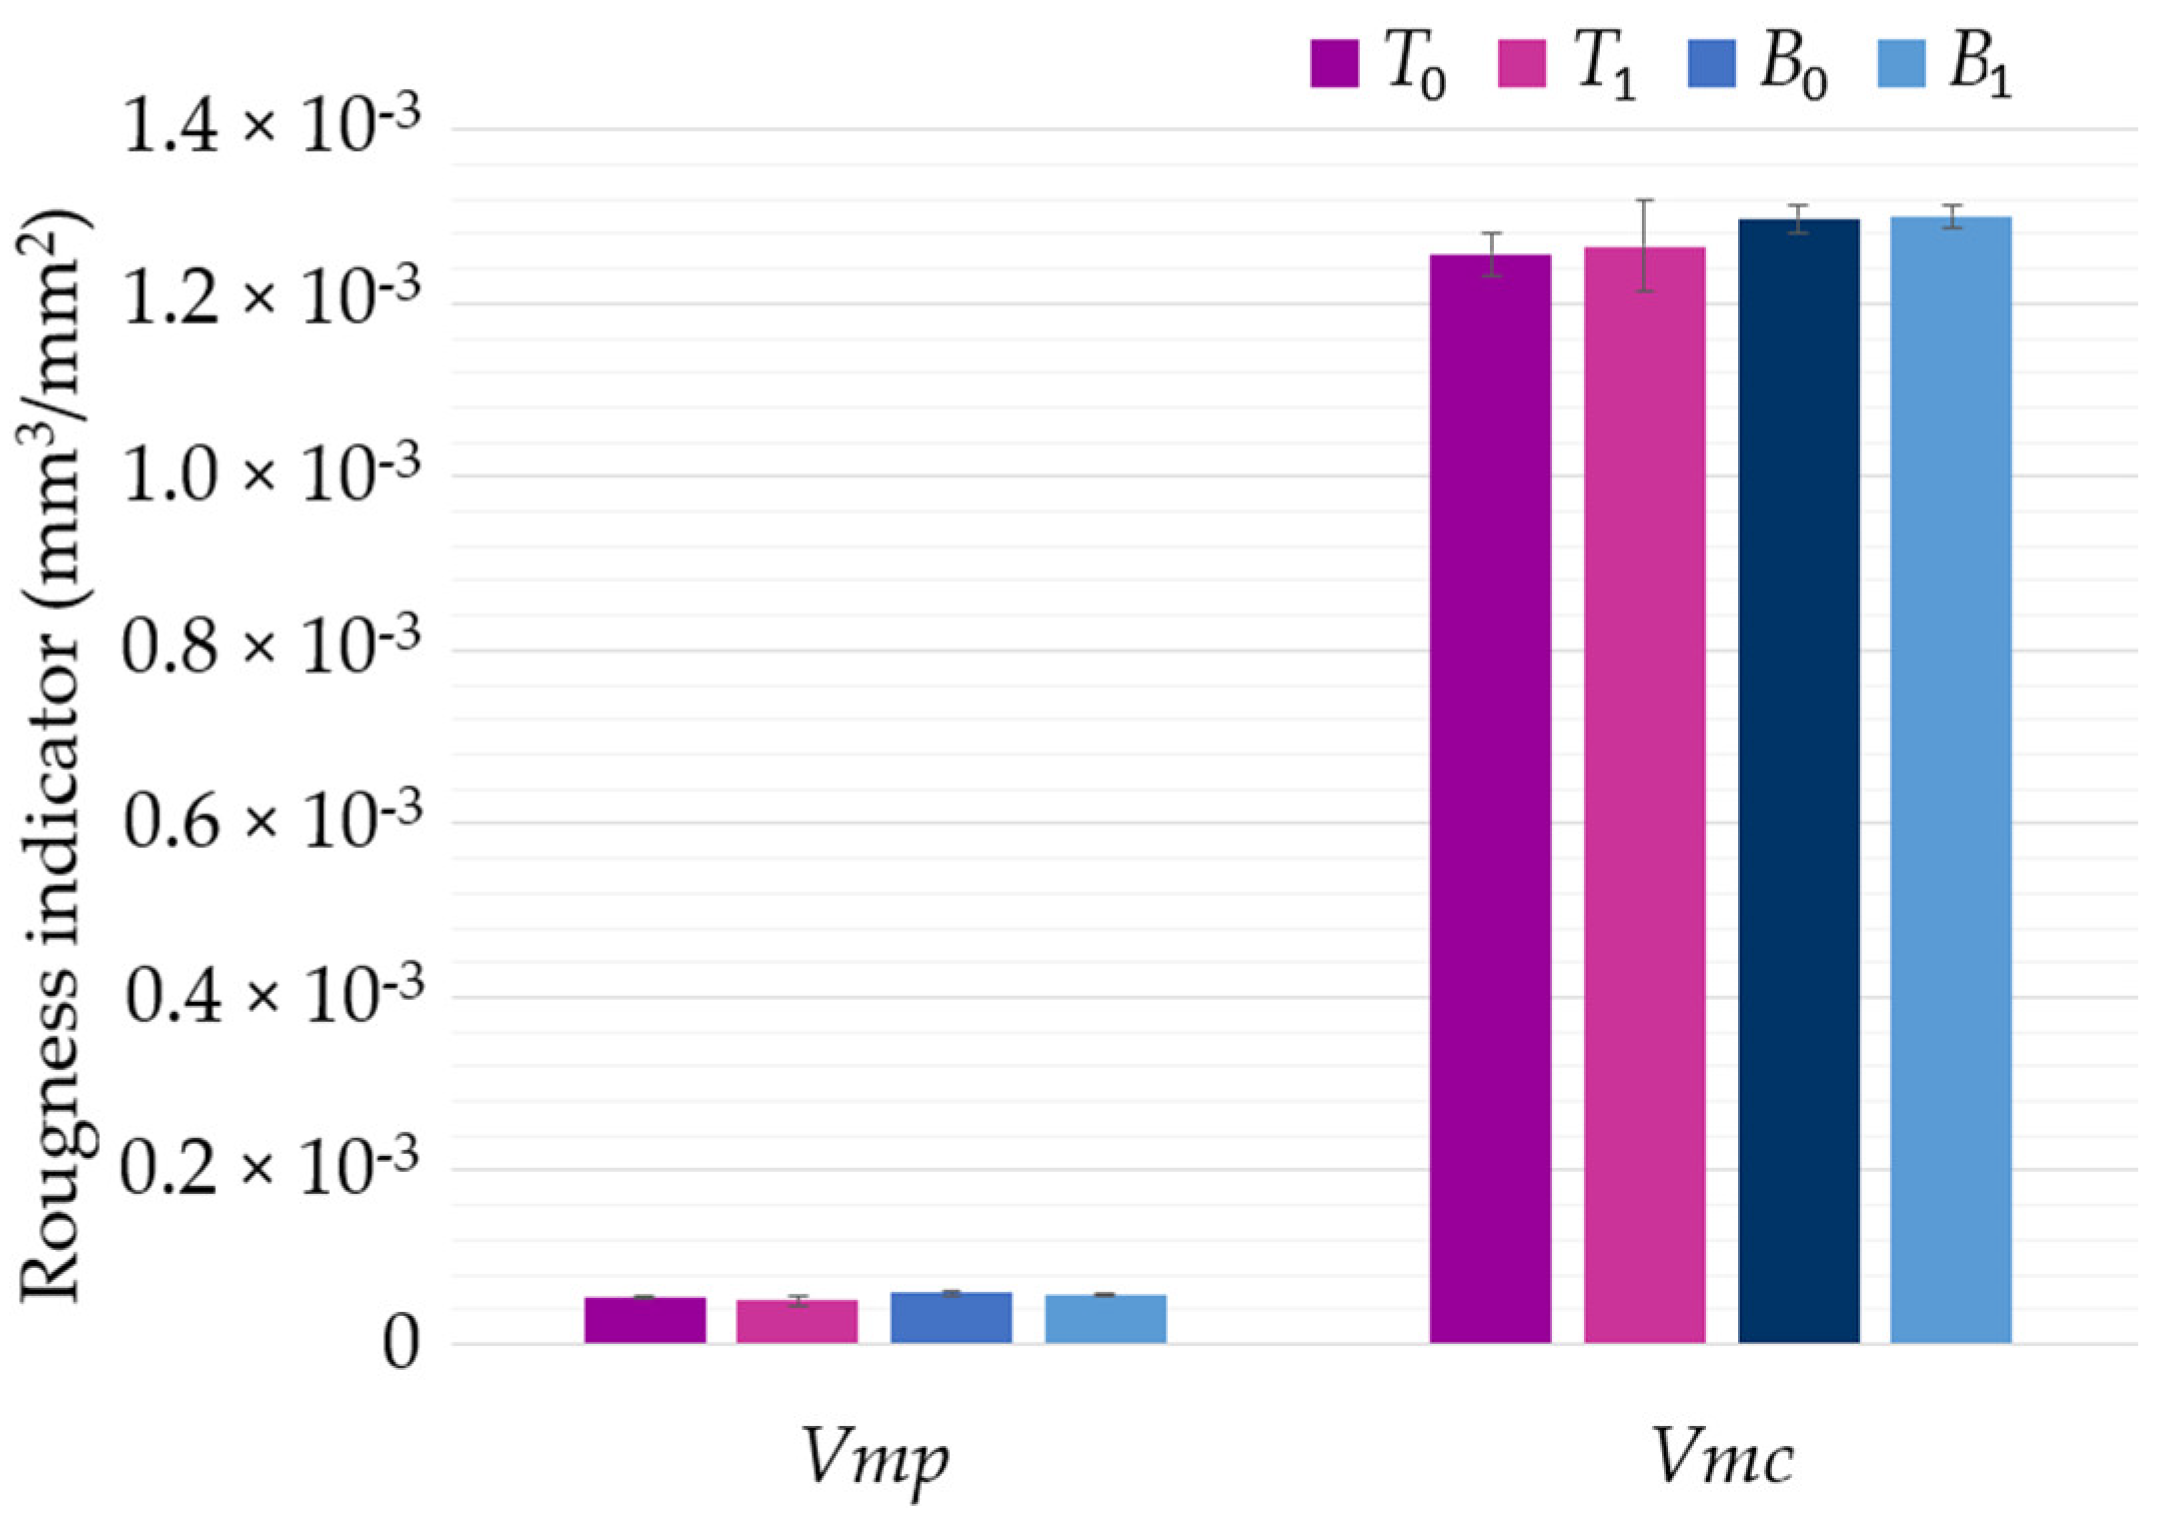
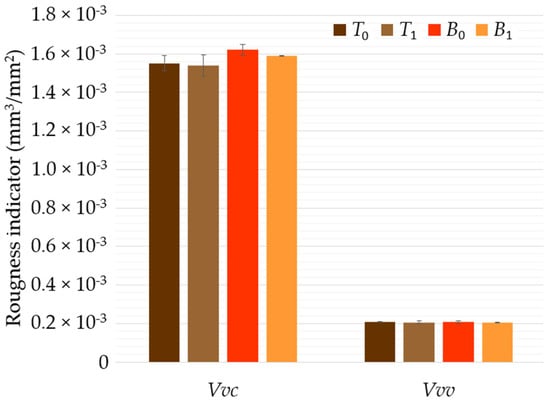
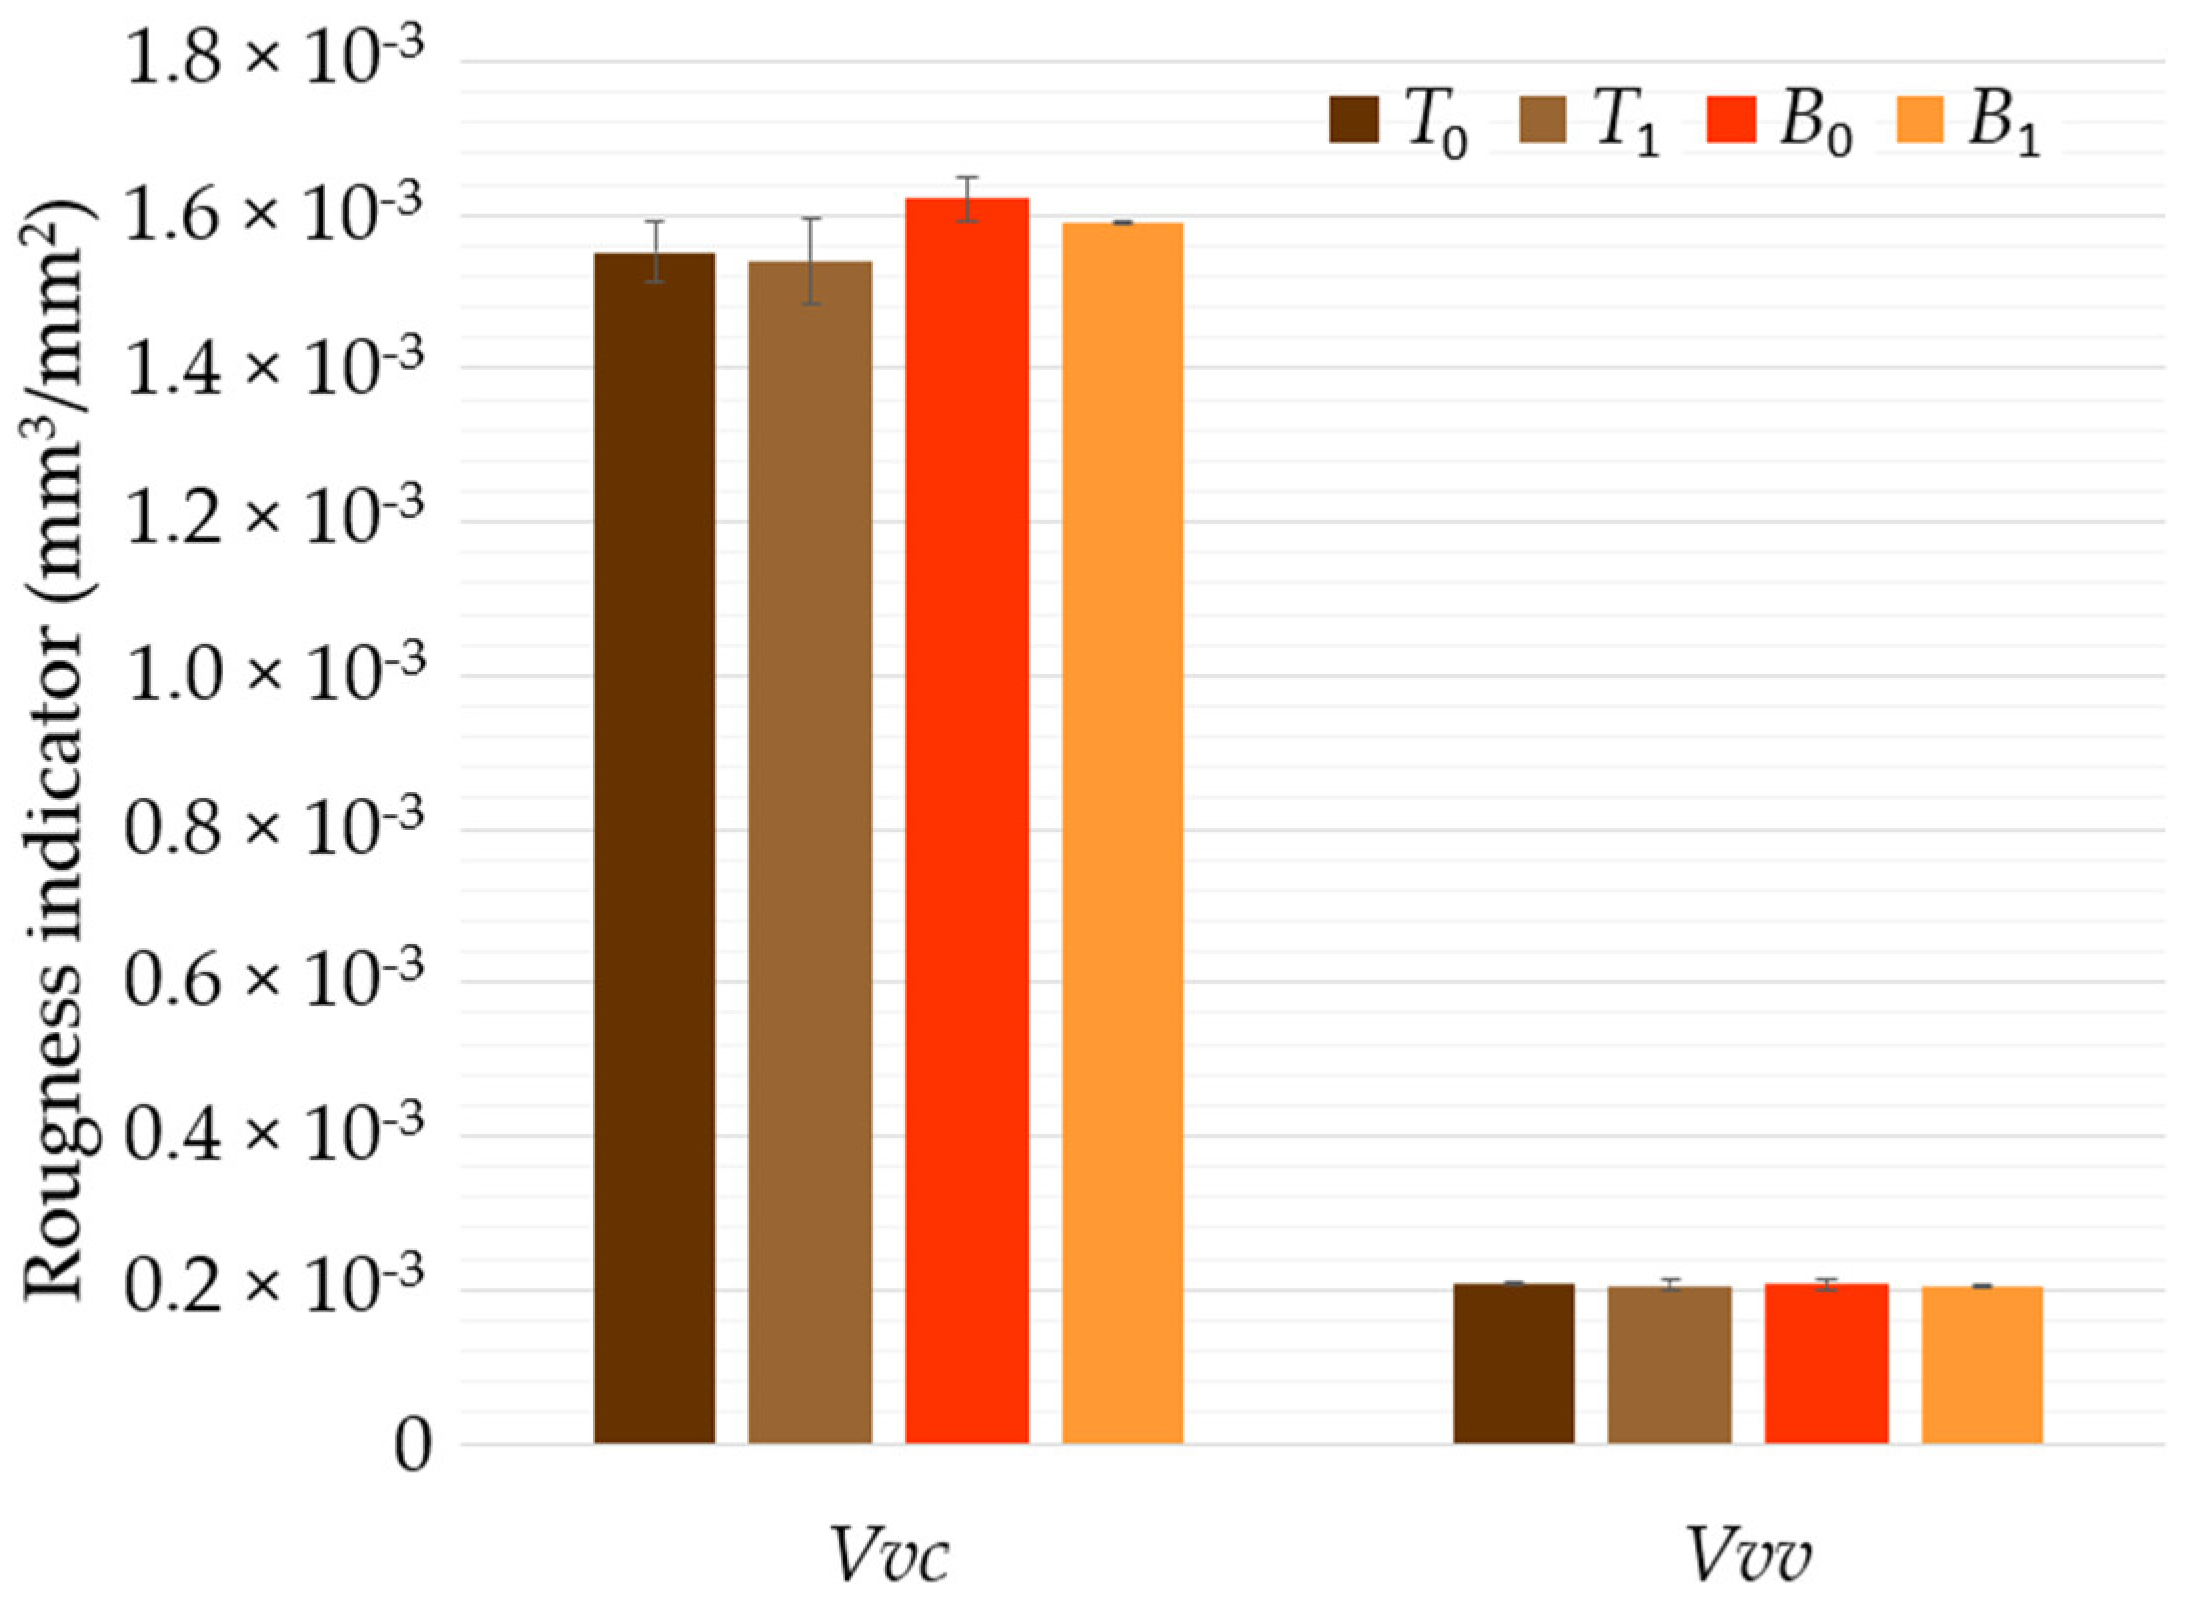
The changes in the mean values of volumetric indicators for the tested surfaces—Vmp, Vmc, Vvc and Vvc—are presented in Figure 9 and Figure 10.
Figure 9.
Mean values of Vmp and Vmc indicators for the tested surfaces. (Error bars indicate the standard deviation for the indicator value.)
Figure 10.
Mean values of Vvc and Vvv indicators for the tested surfaces. (Error bars indicate the standard deviation for the indicator value.)
The slight effect of the permanent plastic interaction between the joined T and B surfaces is visible when analysing changes in the values of the functional indicators (Vmp and Vmc)—see Figure 9. As a result of applying load to the surfaces being joined, there was a reduction in the volume of material at the surface peaks (as shown by the Vmp indicator) of slightly over 9% for surface T and just under 6% for surface B. The plastically deformed peaks permanently increased the volume occupied by the surface irregularity core (as illustrated by the Vmc indicator) for both surface T and surface B under load. The volume of the surface irregularity core increased by approximately 1%.
The volume of voids in the core (represented by the Vvc indicator) and the volume of voids in the valleys of the material (represented by the Vvv indicator) under the influence of normal forces on both surfaces decreased by a maximum of 1.8% (Figure 10).
3.2. Assessment of the Variation in the Characteristics of the Tested Surfaces
In order to compare the variation in surface characteristics under applied load, variation indicators were determined for individual SGT indicators according to the following relationship:
where denotes the value of a given SGT indicator for the surface before loading and denotes the value of a given SGT indicator for the surface after normal loading.
The designated indicator values are summarised in Table 3. It is generally accepted that for a variation indicator value of less than 0.2, the influence of the technological factor under investigation is barely noticeable and the physical change in the investigated object under its influence is insignificant [66,67]. In no case was the aforementioned threshold value for the indicator exceeded. It should therefore be concluded that applying normal forces to the tested surfaces did not cause any significant physical change to the tested contact joint.
Table 3.
Statistical characteristics of the analysed SGT indicators.
In the analysis of the experimental results, the next step was to check whether the two sets of results had the same variability (variance). First, the Fisher–Snedecor test [68] was performed, followed by Student’s t-test [69]. This order stems from the fact that Student’s t-test requires a certain assumption regarding variances, and the Fisher-Snedecor distribution is used precisely to verify this. This is crucial, as the classical Student’s t-test assumes that the variances are equal (so-called homogeneity of variances). Student’s t-test was used to verify whether the mean values differed in a statistically significant manner. This made it possible to provide a clear answer regarding the effect of the method of applying the load to the tested surfaces and to assess the observed changes in SGT.
The homogeneity of variance was checked using the Fisher–Snedecor test with the measure. In this case, the experimental data was divided into only two groups, related to the unloaded state and the loaded state, without separating them into surfaces T and B. The aim of this analysis was to verify the absence of significant differences in the variance of SGT indicators’ values before and after loading the surfaces with normal forces using the quotient
where is the variance of a given SGT indicator for the surface before loading and is the variance of a given SGT indicator for the surface after normal loading.
Based on the results of the homogeneity of variance test, the pooled variance [70,71] was determined in accordance with the relationship
where is the size of the sample for the surface measurements before loading and is the size of the sample for the surface measurements after normal loading.
To clearly assess and classify the source of the observed differences in the mean values for the analysed SGT indicators (before and after applying normal load to the tested surfaces), a comparison of the significance of the differences in the obtained mean values ( and ) was performed using a homoscedastic Student’s t-test. For this purpose, the measure was calculated as follows:
Using the proposed procedure, it is possible to clearly assess whether the observed differences in mean values ( and ) and variability ( and ) are caused by a technological factor or are rather a matter of chance.
The Fisher–Snedecor test and Student’s t-test were performed at a significance level of 0.05. The test results are summarised in Table 3. Critical test values were also determined for the cases under consideration, which amounted to 3.18 for the Fisher–Snedecor test (at 9 degrees of freedom) and 2.78 for Student’s t-test (at 16 degrees of freedom).
When comparing the determined test statistic values with the critical values of both tests, it should be noted that relatively large (up to 15%) changes in the maximum surface irregularity values (represented by the Sz indicator) are not statistically significant. The same applies to changes in material volume at irregularity peaks (indicated by the Vmp indicator) which, under the influence of normal forces applied to the tested surfaces, changed by over 9% in relation to the volume of material peaks on unloaded surfaces.
The minimal variability observed among the other indicators proposed for SGT analysis suggests that the nature of the originally prepared T and B surfaces has not changed significantly. Their original function in a multi-bolted connection can be repeated after disassembly without the need for additional post-processing (grinding).
Observing changes in the Vmc indicator, it can be seen that an increase in the volume of the material in the surface core occurs at the expense of slight permanent plastic deformation of the material peaks, which should be considered a beneficial phenomenon. An increase in the surface material core volume (as indicated by the Vmc indicator) could potentially improve the stiffness of the contact joint. This topic may be the subject of further research. Reassembling a multi-bolted connection from elements with higher load-bearing surfaces (i.e., characterised by a more favourable Abbott–Firestone curve) should reduce local extremes associated with increased maximum surface pressures.
4. Conclusions
In the engineering, shipbuilding and automotive industries, there are many elements that are joined using multi-bolted connections. Maintenance instructions should include guidelines on the initial verification of the surface roughness of the contact joints. If compliance is confirmed, previously assembled elements should be reused. As demonstrated in this study, the contact mechanics of correctly preloaded multi-bolted connections remain unchanged. The originally specified properties, such as tightness, load-bearing capacity and the ability to ensure high coefficient of friction values, are subsequently met for elements that can be reused. The SGT condition can be assessed quickly and easily, which reduces service time and scope whilst avoiding surface treatment of previously joined elements. Furthermore, SGT measurements and condition assessments are significantly cheaper than the preventative replacement of all elements.
The aims of the work have been achieved. Firstly, a set of 3D images of surfaces joined by multi-bolted connections was obtained, which can be used to model the multi-bolted system—either directly or through the application of the EVL concept. Secondly, the effect of normal load on bolted surfaces on the change in their SGT was investigated and described.
Summarising all the results obtained, the following practical conclusions can also be drawn:
- Surfaces properly designed by the constructor and prepared by the technologist enable multiple connections between elements without the need for repair (i.e., restoring them to their original SGT condition). This applies to steel elements that have been ground and subjected to standardised preload. It should be noted that softer materials, rougher surfaces or higher loads may cause significant changes in the SGT indicators.
- Reconnecting elements of machines and devices that originally worked together may potentially improve contact stiffness due to favourable changes in the material structure at the core of surface irregularities.
- During servicing and in machine construction technology, it is possible to reduce costs associated with the need to manufacture replacement elements or re-process the surfaces of previously used elements.
- The research described in this paper could be supplemented by establishing the relationship between normal load, surface geometrical texture and the stiffness of joint surfaces and by identifying the correlation between the load and surface geometrical texture.
Author Contributions
Conceptualisation, R.G.; methodology, R.G. and D.G.; software, D.G.; validation, R.G. and D.G.; formal analysis, R.G. and D.G.; investigation, D.G.; resources, R.G. and D.G.; data curation, D.G.; writing—original draft preparation, R.G. and D.G.; writing—review and editing, R.G. and D.G.; visualisation, R.G. and D.G.; supervision, R.G.; project administration, R.G.; funding acquisition, R.G. All authors have read and agreed to the published version of the manuscript.
Funding
This research received no external funding.
Institutional Review Board Statement
Not applicable.
Informed Consent Statement
Not applicable.
Data Availability Statement
The data presented in this study are available on request from the corresponding author.
Conflicts of Interest
The authors declare no conflicts of interest.
Abbreviations
The following abbreviations are used in this paper:
| EVL | Equivalent virtual layer |
| FEM | Finite element method |
| SGT | Surface geometrical texture |
References
- Tai, J.L.; Sultan, M.T.H.; Łukaszewicz, A.; Siemiątkowski, Z.; Skorulski, G.; Shahar, F.S. Preventing catastrophic failures: A review of applying acoustic emission testing in multi-bolted flanges. Metals 2025, 15, 438. [Google Scholar] [CrossRef] [Scilit]
- Nowakowski, M.; Kosiuczenko, K. Evaluation of TAERO UGV structural collision resistance using FEM analysis. Bull. Pol. Acad. Sci. Tech. Sci. 2025, 73, e153431. [Google Scholar] [CrossRef] [Scilit]
- Zmarzły, P.; Wrzochal, M.; Rębosz-Kurdek, A. Investigation of the effect of contact seal geometry on frictional moment in ball bearings. Materials 2025, 18, 5068. [Google Scholar] [CrossRef] [Scilit] [PubMed]
- Dostatni, E.; Diakun, J.; Grajewski, D.; Wichniarek, R.; Karwasz, A. Multi-agent system to support decision-making process in design for recycling. Soft Comput. 2016, 20, 4347–4361. [Google Scholar] [CrossRef] [Scilit]
- Panagiotopoulou, V.C.; Stavropoulos, P.; Chryssolouris, G. A critical review on the environmental impact of manufacturing: A holistic perspective. Int. J. Adv. Manuf. Technol. 2022, 118, 603–625. [Google Scholar] [CrossRef] [Scilit]
- Held, T.; Peth, J.; Friedrich, C. Preload stability of modern bolted joints. Athens J. Technol. Eng. 2022, 9, 187–212. [Google Scholar] [CrossRef] [Scilit]
- Bouzid, A.-H.; Bouzid, S. A Comparative Study Between ASME B16.5 and EN1092-1 Weld Neck Flanges. In Proceedings of the ASME 2024 Pressure Vessels & Piping Conference, Bellevue, WA, USA, 28 July–2 August 2024. [Google Scholar]
- Grzejda, R.; Diakun, J. Assessment of mechanical and recycling properties of selected types of bolted and riveted connections in product design. Appl. Sci. 2026, 16, 592. [Google Scholar] [CrossRef] [Scilit]
- Griza, S.; da Silva, M.E.G.; dos Santos, S.V.; Strohaecker, T.R. Experimental evaluation of cyclic stresses on axially loaded bolted joints. Proc. Inst. Mech. Eng. Part C J. Mech. Eng. Sci. 2016, 230, 2611–2622. [Google Scholar] [CrossRef] [Scilit]
- Schwarz, M.; Glienke, R.; Wegener, F.; Blunk, C.; Henkel, K.-M. Calculation of lockbolt joints in mechanical engineering. Mater. Sci. Eng. Technol. 2020, 51, 267–283. [Google Scholar] [CrossRef] [Scilit]
- Heston, A.W. VDI joint design procedures. In Handbook of Bolts and Bolted Joints, 2nd ed.; Nassar, S.A., Bickford, J.H., Eds.; CRC Press: Boca Raton, FL, USA, 2025; pp. 209–231. [Google Scholar]
- Terelak-Tymczyna, A.; Bachtiak-Radka, E.; Grzesiak, D.; Jardzioch, A. Comparison of the classic and hybrid production methods with the use of SLM taking into account the aspects of sustainable production development. Adv. Sci. Technol. Res. J. 2023, 17, 94–107. [Google Scholar] [CrossRef] [Scilit]
- Grzesik, W. Prediction of the functional performance of machined components based on surface topography: State of the art. J. Mater. Eng. Perform. 2016, 25, 4460–4468. [Google Scholar] [CrossRef] [Scilit]
- Żak, K.; Grzesik, W. Metrological aspects of surface topographies produced by different machining operations regarding their potential functionality. Metrol. Meas. Syst. 2017, 24, 325–335. [Google Scholar] [CrossRef] [Scilit]
- Grzejda, R.; Kwiatkowski, K. Modelling of multi-bolted systems at the pretension stage—Part 1: Mechanical characteristics of the contact between the joined elements. Arch. Metall. Mater. 2024, 69, 717–721. [Google Scholar] [CrossRef] [Scilit]
- Zhao, Y.; Xu, J.; Cai, L.; Shi, W.; Liu, Z. Stiffness and damping model of bolted joint based on the modified three-dimensional fractal topography. Proc. Inst. Mech. Eng. Part C J. Mech. Eng. Sci. 2017, 231, 279–293. [Google Scholar] [CrossRef] [Scilit]
- Braunovic, M. Effect of Connection Design on the Contact Resistance of High Power Overlapping Bolted Joints. In Proceedings of the Forth-Seventh IEEE Holm Conference on Electrical Contacts, Montreal, QC, Canada, 12 September 2001; pp. 220–229. [Google Scholar]
- Kostek, R. Analysis of the primary and superharmonic contact resonances—Part 1. J. Theor. Appl. Mech. 2013, 51, 475–486. [Google Scholar]
- Poulios, K.; Klit, P. Implementation and applications of a finite-element model for the contact between rough surfaces. Wear 2013, 303, 1–8. [Google Scholar] [CrossRef] [Scilit]
- Kucharski, S.; Starzynski, G. Study of contact of rough surfaces: Modeling and experiment. Wear 2014, 311, 167–179. [Google Scholar] [CrossRef] [Scilit]
- Taylor, R.I. Rough surface contact modelling—A review. Lubricants 2022, 10, 98. [Google Scholar] [CrossRef] [Scilit]
- Grzejda, R. Modeling the normal contact characteristics between components joined in multi-bolted systems. WSEAS Trans. Appl. Theor. Mech. 2024, 19, 73–81. [Google Scholar] [CrossRef] [Scilit]
- Leus, M.; Gutowski, P.; Bachtiak-Radka, E. The effect of contact compliance of sliding pair on friction force reduction at longitudinal tangential vibrations. Tribol. Int. 2023, 187, 108701. [Google Scholar] [CrossRef] [Scilit]
- Ochal, A.; Grochała, D.; Grzejda, R.; Kochmańska, A.E. Investigations on changes in the surface geometrical texture caused by the use of corrosion product removers. Coatings 2025, 15, 539. [Google Scholar] [CrossRef] [Scilit]
- Zgrzeblak, S.; Grochała, D.; Grzejda, R. On the possibility of improving surface geometrical texture during high-performance machining of aluminium without the use of coolant. Coatings 2025, 15, 971. [Google Scholar] [CrossRef] [Scilit]
- Jaszak, P.; Grzejda, R. Symmetric and asymmetric semi-metallic gasket cores and their effect on the tightness level of the bolted flange joint. Materials 2025, 18, 2624. [Google Scholar] [CrossRef] [Scilit] [PubMed]
- Zhou, Y.; Xiao, Y.; He, Y.; Zhang, Z. A detailed finite element analysis of composite bolted joint dynamics with multiscale modeling of contacts between rough surfaces. Compos. Struct. 2020, 236, 111874. [Google Scholar] [CrossRef] [Scilit]
- Zhou, H.; Long, X.; Meng, G.; Liu, X. A stiffness model for bolted joints considering asperity interactions of rough surface contact. J. Tribol. 2022, 144, 011501. [Google Scholar] [CrossRef] [Scilit]
- Li, D.; Botto, D.; Li, R.; Xu, C.; Zhang, W. Experimental and theoretical studies on friction contact of bolted joint interfaces. Int. J. Mech. Sci. 2022, 236, 107773. [Google Scholar] [CrossRef] [Scilit]
- Li, Y.; Hao, Z. A six-parameter Iwan model and its application. Mech. Syst. Signal Process. 2016, 68–69, 354–365. [Google Scholar] [CrossRef] [Scilit]
- Biswas, S.; Chatterjee, A. A two-state hysteresis model for bolted joints, with minor loops from partial unloading. Int. J. Mech. Sci. 2018, 140, 506–520. [Google Scholar] [CrossRef] [Scilit]
- Marshall, M.B.; Lewis, R.; Dwyer-Joyce, R.S. Characterisation of contact pressure distribution in bolted joints. Strain 2006, 42, 31–43. [Google Scholar] [CrossRef] [Scilit]
- Chen, W.; Liu, Z.; Zhao, Y.; Yan, X.; Li, M.; Li, Y. Tangential stiffness modeling and multi-stage analysis of single-lap double-bolted joints based on spring coupling element method. Structures 2025, 79, 109610. [Google Scholar] [CrossRef] [Scilit]
- Li, Z.; Zhang, Y.; Li, C.; Xu, M.; Dai, W.; Liu, Z. Modeling and nonlinear dynamic analysis of bolt joints considering fractal surfaces. Nonlinear Dyn. 2022, 108, 1071–1099. [Google Scholar] [CrossRef] [Scilit]
- Hui, Y.; Huang, Y.; Li, P.; Li, Y.; Bai, L. Virtual material parameter acquisition based on the basic characteristics of the bolt joint interfaces. Tribol. Int. 2016, 95, 109–117. [Google Scholar] [CrossRef] [Scilit]
- Wang, Z.; Fei, C.-W.; Wang, J.-J. Equivalent simulation of mechanical characteristics for parametric modeling of bolted joint structures. Adv. Mech. Eng. 2017, 9, 1–12. [Google Scholar] [CrossRef] [Scilit]
- Yang, Y.; Cheng, H.; Liang, B.; Zhao, D.; Hu, J.; Zhang, K. A novel virtual material layer model for predicting natural frequencies of composite bolted joints. Chin. J. Aeronaut. 2021, 34, 101–111. [Google Scholar] [CrossRef] [Scilit]
- Zhang, Z.; Xiao, Y.; Xie, Y.; Su, Z. Effects of contact between rough surfaces on the dynamic responses of bolted composite joints: Multiscale modeling and numerical simulation. Compos. Struct. 2019, 211, 13–23. [Google Scholar] [CrossRef] [Scilit]
- Xu, L.; Zhang, W.; Zhu, Y.; Huang, Z.; Li, X.; Zhu, J. Dynamic modeling of bolted joints for radially segmented annular virtual material considering thickness. J. Mech. Sci. Technol. 2024, 38, 5341–5354. [Google Scholar] [CrossRef] [Scilit]
- Chang, Y.; Ding, J.; Fan, H. Interfacial micromechanics study on contact modeling for bolted joints. Acta Mech. 2023, 234, 3377–3396. [Google Scholar] [CrossRef] [Scilit]
- Zhang, K.; Li, G.; Gong, J.; Wan, F. Modal analysis of bolted structure based on equivalent material of joint interface. Materials 2019, 12, 3004. [Google Scholar] [CrossRef] [Scilit]
- Thompson, M.K.; Thompson, J.M. Considerations for the incorporation of measured surfaces in finite element models. Scanning 2010, 32, 183–198. [Google Scholar] [CrossRef] [Scilit]
- Bryant, M. Running-In and Residual Stress: Finite Element Contact Analysis of as Measured Rough Surfaces and Comparison with Experiment. Ph.D. Thesis, Cardiff University, Cardiff, Wales, 2013. [Google Scholar]
- Yastrebov, V.A.; Durand, J.; Proudhon, H.; Cailletaud, G. Rough surface contact analysis by means of the Finite Element Method and of a new reduced model. Comptes Rendus Mec. 2011, 339, 473–490. [Google Scholar] [CrossRef] [Scilit]
- Grochała, D.; Berczyński, S.; Grządziel, Z. Analysis of surface geometry changes after hybrid milling and burnishing by ceramic ball. Materials 2019, 12, 1179. [Google Scholar] [CrossRef] [Scilit]
- Walter, C.; Antretter, T.; Daniel, R.; Mitterer, C. Finite element simulation of the effect of surface roughness on nanoindentation of thin films with spherical indenters. Surf. Coat. Technol. 2007, 202, 1103–1107. [Google Scholar] [CrossRef] [Scilit]
- Wang, X.; Xu, Y.; Jackson, R.L. Theoretical and finite element analysis of static friction between multi-scale rough surfaces. Tribol. Lett. 2018, 66, 146. [Google Scholar] [CrossRef] [Scilit]
- Zhang, F.; Liu, J.; Ding, X.; Wang, R. Experimental and finite element analyses of contact behaviors between non-transparent rough surfaces. J. Mech. Phys. Solids 2019, 126, 87–100. [Google Scholar] [CrossRef] [Scilit]
- Sellgren, U.; Björklund, S.; Andersson, S. A finite element-based model of normal contact between rough surfaces. Wear 2003, 254, 1180–1188. [Google Scholar] [CrossRef] [Scilit]
- Pei, L.; Hyun, S.; Molinari, J.F.; Robbins, M.O. Finite element modeling of elasto-plastic contact between rough surfaces. J. Mech. Phys. Solids 2005, 53, 2385–2409. [Google Scholar] [CrossRef] [Scilit]
- Ripoll, M.R.; Podgornik, B.; Vižintin, J. Finite element analysis of textured surfaces under reciprocating sliding. Wear 2011, 271, 952–959. [Google Scholar] [CrossRef] [Scilit]
- PN-EN 10025-2; Hot Rolled Products of Structural Steels, Part 2: Technical Delivery Conditions for Non-Alloy Structural Steels. Polish Committee for Standardization: Warsaw, Poland, 2019.
- Sanding Disc Factory. Available online: https://www.ftselephant.pl/eng-catalogue/ (accessed on 19 March 2026).
- PN-EN 1993-1-8; Eurocode 3, Design of Steel Structures, Part 1–8: Joints. Polish Committee for Standardization: Warsaw, Poland, 2006.
- Grzejda, R.; Parus, A. Experimental studies of the process of tightening an asymmetric multi-bolted connection. IEEE Access 2021, 9, 47372–47379. [Google Scholar] [CrossRef] [Scilit]
- Grzejda, R.; Parus, A. Health assessment of a multi-bolted connection due to removing selected bolts. FME Trans. 2021, 49, 634–642. [Google Scholar] [CrossRef] [Scilit]
- Ţălu, Ş.; Achour, A.; Solaymani, S.; Nikpasand, K.; Dalouji, V.; Sari, A.; Rezaee, S.; Nezafat, N.B. Micromorphology analysis of TiO2 thin films by atomic force microscopy images: The influence of postannealing. Microsc. Res. Tech. 2020, 83, 457–463. [Google Scholar] [CrossRef] [Scilit]
- PN-EN ISO 25178-2; Geometrical Product Specifications (GPS), Surface Texture: Areal, Part 2: Terms, Definitions and Surface Texture Parameters. Polish Committee for Standardization: Warsaw, Poland, 2022.
- Czapaj, R.; Kamiński, J.; Benalcazar, P. Evaluation of the application of a forecasting model using the classic least squares method in forecasting daily 15-minute peak power demand in the national power system. Acta Energ. 2019, 11, 45–51. [Google Scholar]
- Hoła, J.; Sadowski, Ł.; Reiner, J.; Stach, S. Usefulness of 3D surface roughness parameters for nondestructive evaluation of pull-off adhesion of concrete layers. Constr. Build. Mater. 2015, 84, 111–120. [Google Scholar] [CrossRef] [Scilit]
- Podulka, P.; Macek, W.; Zima, B.; Lesiuk, G.; Branco, R.; Królczyk, G. Roughness evaluation of turned composite surfaces by analysis of the shape of autocorrelation function. Measurement 2023, 222, 113640. [Google Scholar] [CrossRef] [Scilit]
- Podulka, P.; Macek, W.; Branco, R.; Kubit, A. Laser-textured cross-hatched surface topography analysis with evaluation of high-frequency measurement noise. Measurement 2024, 235, 114988. [Google Scholar] [CrossRef] [Scilit]
- Grudzień, J.; Grochała, D.; Grzejda, R.; Kochmański, P. Testing the effectiveness of hybrid milling and surface burnishing in improving the wear resistance of machine parts made of structural steel. Lubricants 2024, 12, 458. [Google Scholar] [CrossRef] [Scilit]
- Zhang, T.-Y.; Xu, W.-H.; Zhao, M.-H. The role of plastic deformation of rough surfaces in the size-dependent hardness. Acta Mater. 2004, 52, 57–68. [Google Scholar] [CrossRef] [Scilit]
- Kubátová, D.; Melichar, M. Roughness Evaluation Using Abbott-Firestone Curve Parameters. In Proceedings of the 30th International DAAAM Symposium ‘Intelligent Manufacturing & Automation’, Zadar, Croatia, 23–26 October 2019. [Google Scholar]
- Walpole, R.E.; Myers, R.H. Probability and Statistics for Engineers and Scientists, 5th ed.; Prentice Hall: Hoboken, NJ, USA, 1993. [Google Scholar]
- Leach, R. Characterisation of Areal Surface Texture, 1st ed.; Springer: Heidelberg, Germany, 2013. [Google Scholar]
- Kudełko, J.; Bodlak, M. Evaluation significance of differences between the geotechnical parameters of the lithological rocks roof layers, above mining excavation. Min. Sci. 2020, 27, 183–197. [Google Scholar]
- Bórawski, P.; Bełdycka-Bórawska, A.; Szymańska, E.J.; Jankowski, K.J.; Dunn, J.W. Environmental and economic factors shaping efficiency of rapeseed farms in Poland. Pol. J. Environ. Stud. 2019, 28, 43–51. [Google Scholar]
- Yin, T.S.; Othman, A.R. When does the pooled variance t-test fail? Afr. J. Math. Comput. Sci. Res. 2009, 2, 56–62. [Google Scholar]
- Abebe, T.H. The derivation and choice of appropriate test statistic (Z, t, F and Chi-square test) in research methodology. Math. Lett. 2019, 5, 33–40. [Google Scholar] [CrossRef] [Scilit]

Disclaimer/Publisher’s Note: The statements, opinions and data contained in all publications are solely those of the individual author(s) and contributor(s) and not of MDPI and/or the editor(s). MDPI and/or the editor(s) disclaim responsibility for any injury to people or property resulting from any ideas, methods, instructions or products referred to in the content. |
© 2026 by the authors. Licensee MDPI, Basel, Switzerland. This article is an open access article distributed under the terms and conditions of the Creative Commons Attribution (CC BY) license.