


Abstract
With the increasing penetration of renewable energy in power systems, the effective utilization of pumped storage power plant (PSP) clusters for peak shaving has become an important issue in system operation. In this study, an intraday scheduling model for PSP clusters is formulated to minimize the variance of the system net load, while accounting for operational constraints, including power balance, unit operation, and reservoir energy evolution. The resulting model is a mixed-integer nonlinear programming (MINLP) problem, which is solved using the Non-dominated Sorting Genetic Algorithm II (NSGA-II). Case studies are conducted on an improved IEEE 39-bus system under both conventional scenarios and extreme renewable energy conditions. The results show that, under a unified peak-shaving objective, PSP clusters exhibit a stable structure of role differentiation even in conventional operating conditions. As the system peak-shaving pressure increases, this differentiation is progressively reinforced along existing functional roles, shifting from renewable energy absorption to peak-period generation support. It tends to converge under high operational stress due to the coupling between load and renewable variability. Further analysis indicates that when capacity differences among PSPs are eliminated, the differentiation structure is significantly weakened, suggesting that physical capability differences constitute an important foundation for the formation of role differentiation.
1. Introduction
The stochasticity, volatility, and intermittency of wind and solar power generation have significantly increased the demand for flexible regulating resources in modern power systems [1,2,3,4,5]. Pumped storage power plants (PSPs), as the most technologically mature and economically viable large-scale energy storage technology, play a critical role as regulators, stabilizers, and balancers of system operation [6,7]. By operating in a bidirectional mode of peak shaving and valley filling—generating electricity during peak-load periods and absorbing energy through pumping during low-demand or renewable-surplus periods—PSPs effectively reduce system operating costs and enhance overall operational efficiency [8,9]. Driven by these advantages, the deployment of pumped storage capacity has accelerated rapidly in recent years, and power systems with large-scale PSP integration are emerging as a new structural characteristic following the widespread penetration of renewable energy [10,11]. Under this evolving system paradigm, a key operational question arises: how to effectively exploit multiple pumped storage power plants in a coordinated manner to support system-level peak shaving.
In the field of pumped storage power plant (PSP) cluster dispatch, existing studies can be broadly categorized according to their optimization objectives.
From an economic perspective, Castorino et al. [12] and Chen et al. [13] investigated the joint optimization of power outputs and reservoir levels of multiple PSPs within a system cost minimization framework, thereby enabling coordinated cluster operation. Liu et al. [14] further developed a multi-energy day-ahead scheduling model incorporating cascaded PSPs and HVDC transmission, aiming to simultaneously minimize system operating cost and renewable curtailment.
In addition, Wang and Yu [15] formulated PSP cluster dispatch as a network flow problem with virtual arcs, where thermal generation cost is minimized to coordinate multiple PSPs in regional grids. Peng et al. [16] proposed a water-level-based balance control strategy to coordinate multiple PSPs under extreme operating conditions while minimizing total generation-side cost.
From the perspective of peak-shaving demand, Liao et al. [17] determined PSP power allocation by minimizing the variance of residual load, while Zhao et al. [18] adopted the minimization of residual load peak-valley differences to characterize coordinated peak shaving under renewable uncertainty. Cheng et al. [19] further addressed load allocation among multiple PSPs by minimizing regional residual load variance. Feng et al. [20] applied a similar objective to manage energy accommodation of virtual variable-speed PSP units under persistent renewable deviations.
Moreover, Song et al. [21] developed a two-layer coordination model between regional and provincial grids, enabling cross-regional peak shaving and power allocation under uncertainty using PSPs and other flexible resources. Chen et al. [22] further proposed a multi-regional flexibility supply-demand matching and dispatch framework for multiple PSPs under regional allocation constraints.
Although substantial progress has been made in improving the dispatch performance of pumped storage power plants (PSPs) and enhancing renewable energy accommodation, existing studies remain largely centered on specific dispatch tasks, such as economic optimization, residual load reduction, and multi-objective coordination. In these frameworks, renewable variability and system peak-shaving pressure are typically incorporated either as exogenous constraints or as ex-post evaluation metrics, while PSP clusters are generally treated as collections of functionally equivalent regulating resources. Consequently, it remains challenging to explicitly characterize their coordinated operational behavior and to reveal the underlying driving mechanisms under a unified scheduling objective.
Meanwhile, most existing studies focus on conventional operating conditions, with limited attention given to high-stress peak-shaving scenarios arising from the coupled variability of load and renewable generation. As a result, several key questions remain insufficiently addressed: whether multiple PSPs exhibit differentiated operational characteristics under a unified scheduling objective and operational constraints; whether such differences can further evolve into stable structures of role differentiation; and how these structures evolve with changing system peak-shaving pressure, as well as the conditions under which their applicability may diminish.
Based on the above considerations, this study does not primarily aim to improve dispatch solution performance. Instead, the intraday scheduling model of PSP clusters is employed as an analytical tool to investigate the structural characteristics and evolutionary patterns of coordinated operation under a unified peak-shaving objective. Specifically, from the perspective of system peak-shaving pressure as the dominant driving factor, an intraday scheduling model for PSP clusters is formulated with the objective of minimizing the variance of system net load [23,24]. Through comparative multi-scenario case studies under different load levels and extreme renewable conditions, the formation, reinforcement, and evolution of functional differentiation within the PSP cluster are systematically characterized.
To avoid the influence of differences in solution methods on the identification of operational behavior, a well-established and mature optimization algorithm is adopted as the solution tool. Under a unified modeling and solution framework, a set of structural indicators, including energy shares and temporal distribution characteristics during generation and pumping phases, is employed to analyze the structural features, formation mechanisms, and applicability range of coordinated operation within the PSP cluster.
The remainder of this paper is organized as follows. First, the characteristics of system peak-shaving demand under high renewable penetration are analyzed, and the corresponding scheduling model is formulated. Next, multiple operating scenarios are constructed based on an improved IEEE 39-bus system, and comparative case studies are conducted to identify the formation, evolution, and stability of functional differentiation under varying system operating pressures. On this basis, the formation mechanism and convergence boundary of the observed structure are interpreted from the interaction between plant-level physical heterogeneity and the unified peak-shaving objective, and further validated through a capacity-equalization comparative analysis. Finally, conclusions are drawn, and directions for future research are discussed.
2. Peak-Shaving-Oriented Intraday Dispatch Modeling of Pumped Storage Power Plant Clusters
In power systems with high penetration of wind and photovoltaic generation, the combined stochasticity and variability of renewable outputs lead to significant fluctuations in system load, resulting in increasing peak-shaving pressure [25]. Under operating conditions characterized by multiple generation sources and pronounced dual-peak load profiles, insufficient energy storage capacity not only reduces renewable energy utilization but may also compromise grid security and operational flexibility [26]. With the rapid expansion of pumped storage capacity, it is increasingly necessary to deploy pumped storage power plant (PSP) clusters in renewable-rich regions, load centers, and key support areas, enabling energy absorption during low-demand or renewable-surplus periods and energy release during peak-demand or renewable-deficit periods, thereby providing essential peak-shaving capability for the system [27].
In addition, PSPs can provide ancillary services such as frequency regulation and reserve in practical operation. However, under a unified peak-shaving-oriented scheduling framework, their operational behavior is primarily driven by peak-shaving demand.
Within this operational context, system peak-shaving pressure gradually becomes the dominant factor shaping dispatch behavior. To analyze the response characteristics of multiple PSPs under a unified peak-shaving objective, and to provide an observable basis for subsequent investigation of cluster-level operational behavior, an intraday dispatch model for PSP clusters is formulated with system peak-shaving demand as the core driver.
2.1. Optimization Objective of Pumped Storage Power Plant Clusters
Under high renewable penetration, system peak-shaving pressure is primarily manifested through the temporal variability of net load. To characterize the response of multiple pumped storage power plants (PSPs) to system peak-shaving demand within a unified dispatch framework, the variance of system net load is adopted as the optimization objective.
The system net load is defined as the residual load obtained by subtracting renewable generation (e.g., wind and photovoltaic output) and the pumping and generating power of PSPs from the original system load. The variance of net load provides a comprehensive measure of load fluctuation intensity over the entire scheduling horizon and is therefore a representative indicator of system peak-shaving pressure.
Compared with metrics that reflect local or short-term dynamic characteristics, such as maximum ramping requirements or reserve shortages, net load variance captures the overall level of system regulation demand over the full dispatch period. It is therefore more suitable as a global measure of system peak-shaving pressure under a unified scheduling objective.
By employing net load variance as the unified objective, differences in the responses of individual PSPs to system peak-shaving demand are effectively amplified, thereby providing an observable basis for analyzing the coordinated operational behavior of the PSP cluster.
Accordingly, the intraday optimal dispatch model of pumped storage power plant clusters is formulated with the objective of minimizing the variance of system net load:
where denotes the variance of the system net load over the scheduling horizon; is the total number of dispatch periods; represents the original system load at time (MW); denotes the accommodated wind power at time (MW); denotes the accommodated photovoltaic power at time (MW); is the system net load at time (MW); is the number of pumped storage power plants in the cluster; denotes the generating power of pumped storage plant at time (MW); denotes the pumping power of pumped storage plant at time (MW); is the generation status indicator of pumped storage plant at time , where indicates generating mode and otherwise; is the pumping status indicator of pumped storage plant at time , where indicates pumping mode and otherwise; denotes the average net load over the scheduling horizon.
Within this modeling framework, the pumped storage power plant cluster directly shapes the system net load profile through time-varying pumping and generating actions, such that its dispatch decisions have a pronounced impact on the resulting net load variance. Because individual plants differ in installed capacity, operating conditions, and grid location, their contributions to net load variance regulation under a unified peak-shaving objective may vary substantially.
This formulation therefore provides a fundamental basis for analyzing how the operational behavior of pumped storage power plant clusters emerges and differentiates under system peak-shaving pressure.
2.2. Constraints of the Pumped Storage Power Plant Cluster Dispatch Model
To ensure that the dispatch results of pumped storage power plant clusters have clear physical meaning, and that the subsequent analysis of cluster-level operating behavior is conducted within a realistic and feasible operating space, the proposed optimization model must satisfy a set of constraints, including system power balance, unit operating characteristics, and pumped storage energy evolution. These constraints jointly define the feasible operating boundaries of the PSP cluster under system peak-shaving pressure, thereby providing a sound basis for analyzing the differentiated responses of individual plants under a unified dispatch objective.
- (1)
- System power balance constraint
This constraint ensures that the system supply–demand balance is satisfied at every dispatch period, forming the fundamental condition under which pumped storage power plant clusters participate in system peak shaving.
- (2)
- Operating constraints of conventional units (thermal and hydropower units)
- (3)
- Renewable energy output constraints
These constraints characterize the stochastic and uncontrollable nature of renewable generation, ensuring that the dispatch behavior of pumped storage power plant clusters reflects the actual operating environment under renewable energy integration.
- (4)
- Reservoir water level constraints of pumped storage plants
Reservoir capacity plays a crucial role in enabling pumped storage plants to absorb renewable energy and perform peak shaving. However, since reservoir volume is difficult to measure directly, water level is introduced as a state variable to formulate the operating constraints of pumped storage plants. For each pumped storage plant and at each time period, the water level must satisfy:
where and denote the minimum and maximum allowable water levels of the pumped storage plant , respectively.
This constraint ensures that pumping and generating decisions over the entire scheduling horizon comply with the principle of energy conservation, thereby guaranteeing the physical interpretability of the cluster’s operating behavior.
To highlight the coordinated dispatch behavior of PSP clusters under a unified peak-shaving objective, the energy conversion process is modeled using a constant efficiency factor. This assumption primarily affects the absolute magnitude of energy conversion, but does not alter the relative contribution of different PSPs under the unified objective.
- (5)
- Operating mode transition constraints of pumped storage units
For each pumped storage plant and at each time period, the operating mode must satisfy the following transition constraints:
These constraints ensure the feasibility of switching between operating states, preventing dispatch solutions that violate the actual physical operating characteristics of pumped storage units.
- (6)
- Generation power constraints
- (7)
- Pumping power constraints
In this study, fixed-speed pumped storage units are modeled using discrete pumping power levels. For variable-speed units, pumping power can be represented as a continuous variable. This difference mainly affects regulation granularity and has a limited impact on the coordinated operation structure of PSP clusters under a unified peak-shaving objective.
3. Model Solution Method
The objective function based on net load variance contains the generation and pumping power decisions of pumped storage plants at each time period, which makes the objective function explicitly nonlinear. Moreover, the model includes both continuous decision variables (such as generating power) and discrete decision variables (such as operating mode selection of pumped storage units). As a result, the dispatch model exhibits the coexistence of nonlinearity and mixed continuous–discrete variables, and can be classified as a typical mixed-integer nonlinear programming (MINLP) problem, which is computationally challenging to solve directly [28].
To ensure that stable and reproducible feasible dispatch solutions can be obtained under different operating scenarios—thereby providing a reliable computational basis for subsequent analysis of PSP cluster behavior—the Non-dominated Sorting Genetic Algorithm II (NSGA-II) is adopted to solve the proposed model. This algorithm imposes relatively low requirements on the continuity and convexity of the objective function and is well suited to problems involving mixed continuous–discrete decision variables under complex constraints [29,30,31,32].
It should be noted that the scheduling model developed in this study is primarily employed as an analytical tool for behavioral investigation, rather than for pursuing optimal algorithmic performance. Under a unified peak-shaving objective and consistent solution settings, the model provides a comparable analytical framework for identifying the coordinated response patterns of PSP clusters, thereby enabling the exploration of the endogenous formation mechanism of coordinated operation structures.
Accordingly, a well-established and mature optimization algorithm is adopted to reduce the influence of solution-method differences on result interpretation, and the analysis is focused on the structural characteristics of PSP cluster behavior and their evolution under different operating scenarios.
In the single-objective setting considered in this study, NSGA-II ranks individuals based on the objective function value, where the non-dominated sorting mechanism degenerates into a hierarchical ranking according to solution quality, while the crowding distance is used to maintain population diversity in the search space. This ensures the stability of the search process in solving the non-convex mixed-integer problem. Therefore, in this study, NSGA-II is primarily used to provide a robust search capability rather than to perform multi-objective trade-off optimization.
Based on the above, the implementation procedure of the algorithm within the proposed scheduling model is further described as follows.
- (1)
- Encoding and Mapping of Decision Variables
At the algorithm implementation level, the operating states and the generation and pumping power trajectories of PSP units over the scheduling horizon are encoded into chromosome individuals. Continuous genes are used to represent generation and pumping power decision variables, while discrete genes are used to represent unit operating states.
Accordingly, each chromosome can be expressed as:
The decision variables correspond directly to unit-level variables in the proposed model, while plant-level power and energy state variables are obtained through aggregation and recursive relationships based on unit-level decisions.
By embedding state exclusivity rules and power bound mappings into the encoding process, each unit is restricted to operate in only one mode—generation, pumping, or shutdown—at any given time step, thereby ensuring that all generated scheduling solutions are physically meaningful.
- (2)
- Constraint-Handling Mechanism
To ensure that candidate scheduling solutions satisfy system operational constraints, including power balance, energy evolution, and unit operating limits, a feasibility evaluation and constraint-violation penalty mechanism is introduced during the fitness evaluation stage.
The fitness function is defined as:
where denotes the objective function value corresponding to net load variance minimization, is a positive penalty coefficient that balances the objective value and constraint violations, and represents the total constraint violation degree, which is formulated as:
where denotes the inequality constraint, denotes the equality constraint, and and represent the numbers of inequality and equality constraints, respectively.
For infeasible individuals, the fitness value is penalized according to the degree of constraint violation, guiding the population progressively toward the feasible region. This mechanism ensures that the final scheduling solutions not only achieve favorable objective values but also satisfy engineering operational constraints.
- (3)
- Solution Selection and Subsequent Analysis
After the termination of the evolutionary process, representative scheduling solutions are selected from the feasible solution set. Specifically, solutions with stable objective values and satisfying cycle-consistency constraints are chosen as the basis for subsequent analysis of PSP cluster operational behavior and structural characteristics.
4. Case Study
4.1. Case Study Setup
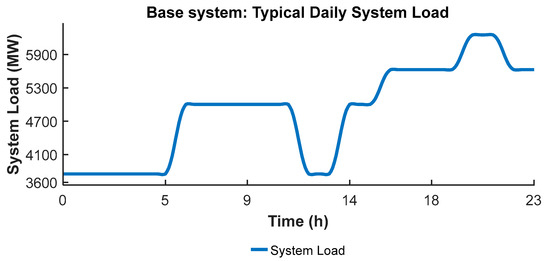
To establish a reproducible experimental environment for analyzing the dispatch behavior of pumped storage power plant (PSP) clusters, this study adopts an improved IEEE 39-bus system based on measured renewable generation data from a representative region. A single typical 24-h load profile is used for all simulations, which exhibits a characteristic pattern of two daytime valleys and two demand peaks.
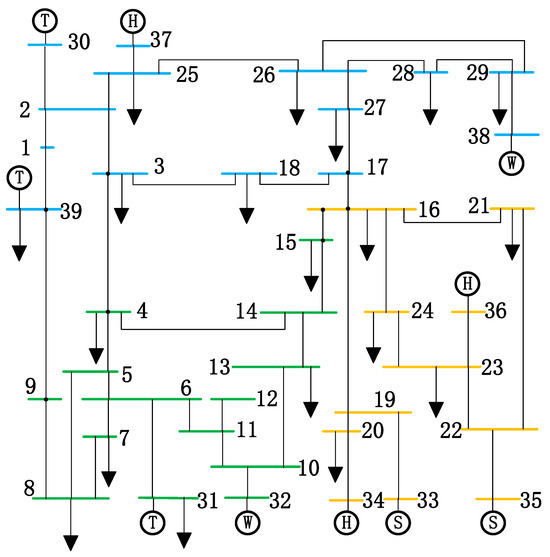
In terms of generation configuration, the generators in the original IEEE 39-bus system are reconfigured to include thermal, hydropower, wind, and photovoltaic (PV) units. These units are connected to designated buses, as illustrated in Figure 1, and additional bus interfaces are reserved for the integration of multiple pumped storage plants, enabling the analysis of cluster-level behavior under different operating scenarios.
Figure 1.
Improved IEEE 39-bus system. T, W, H, and S denote thermal, wind, hydropower, and solar units, respectively.
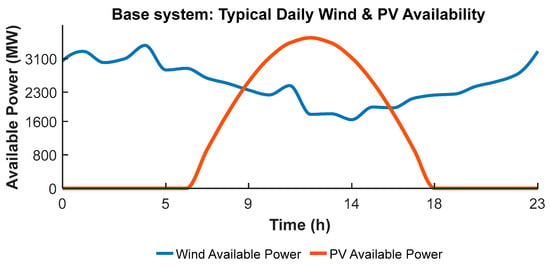
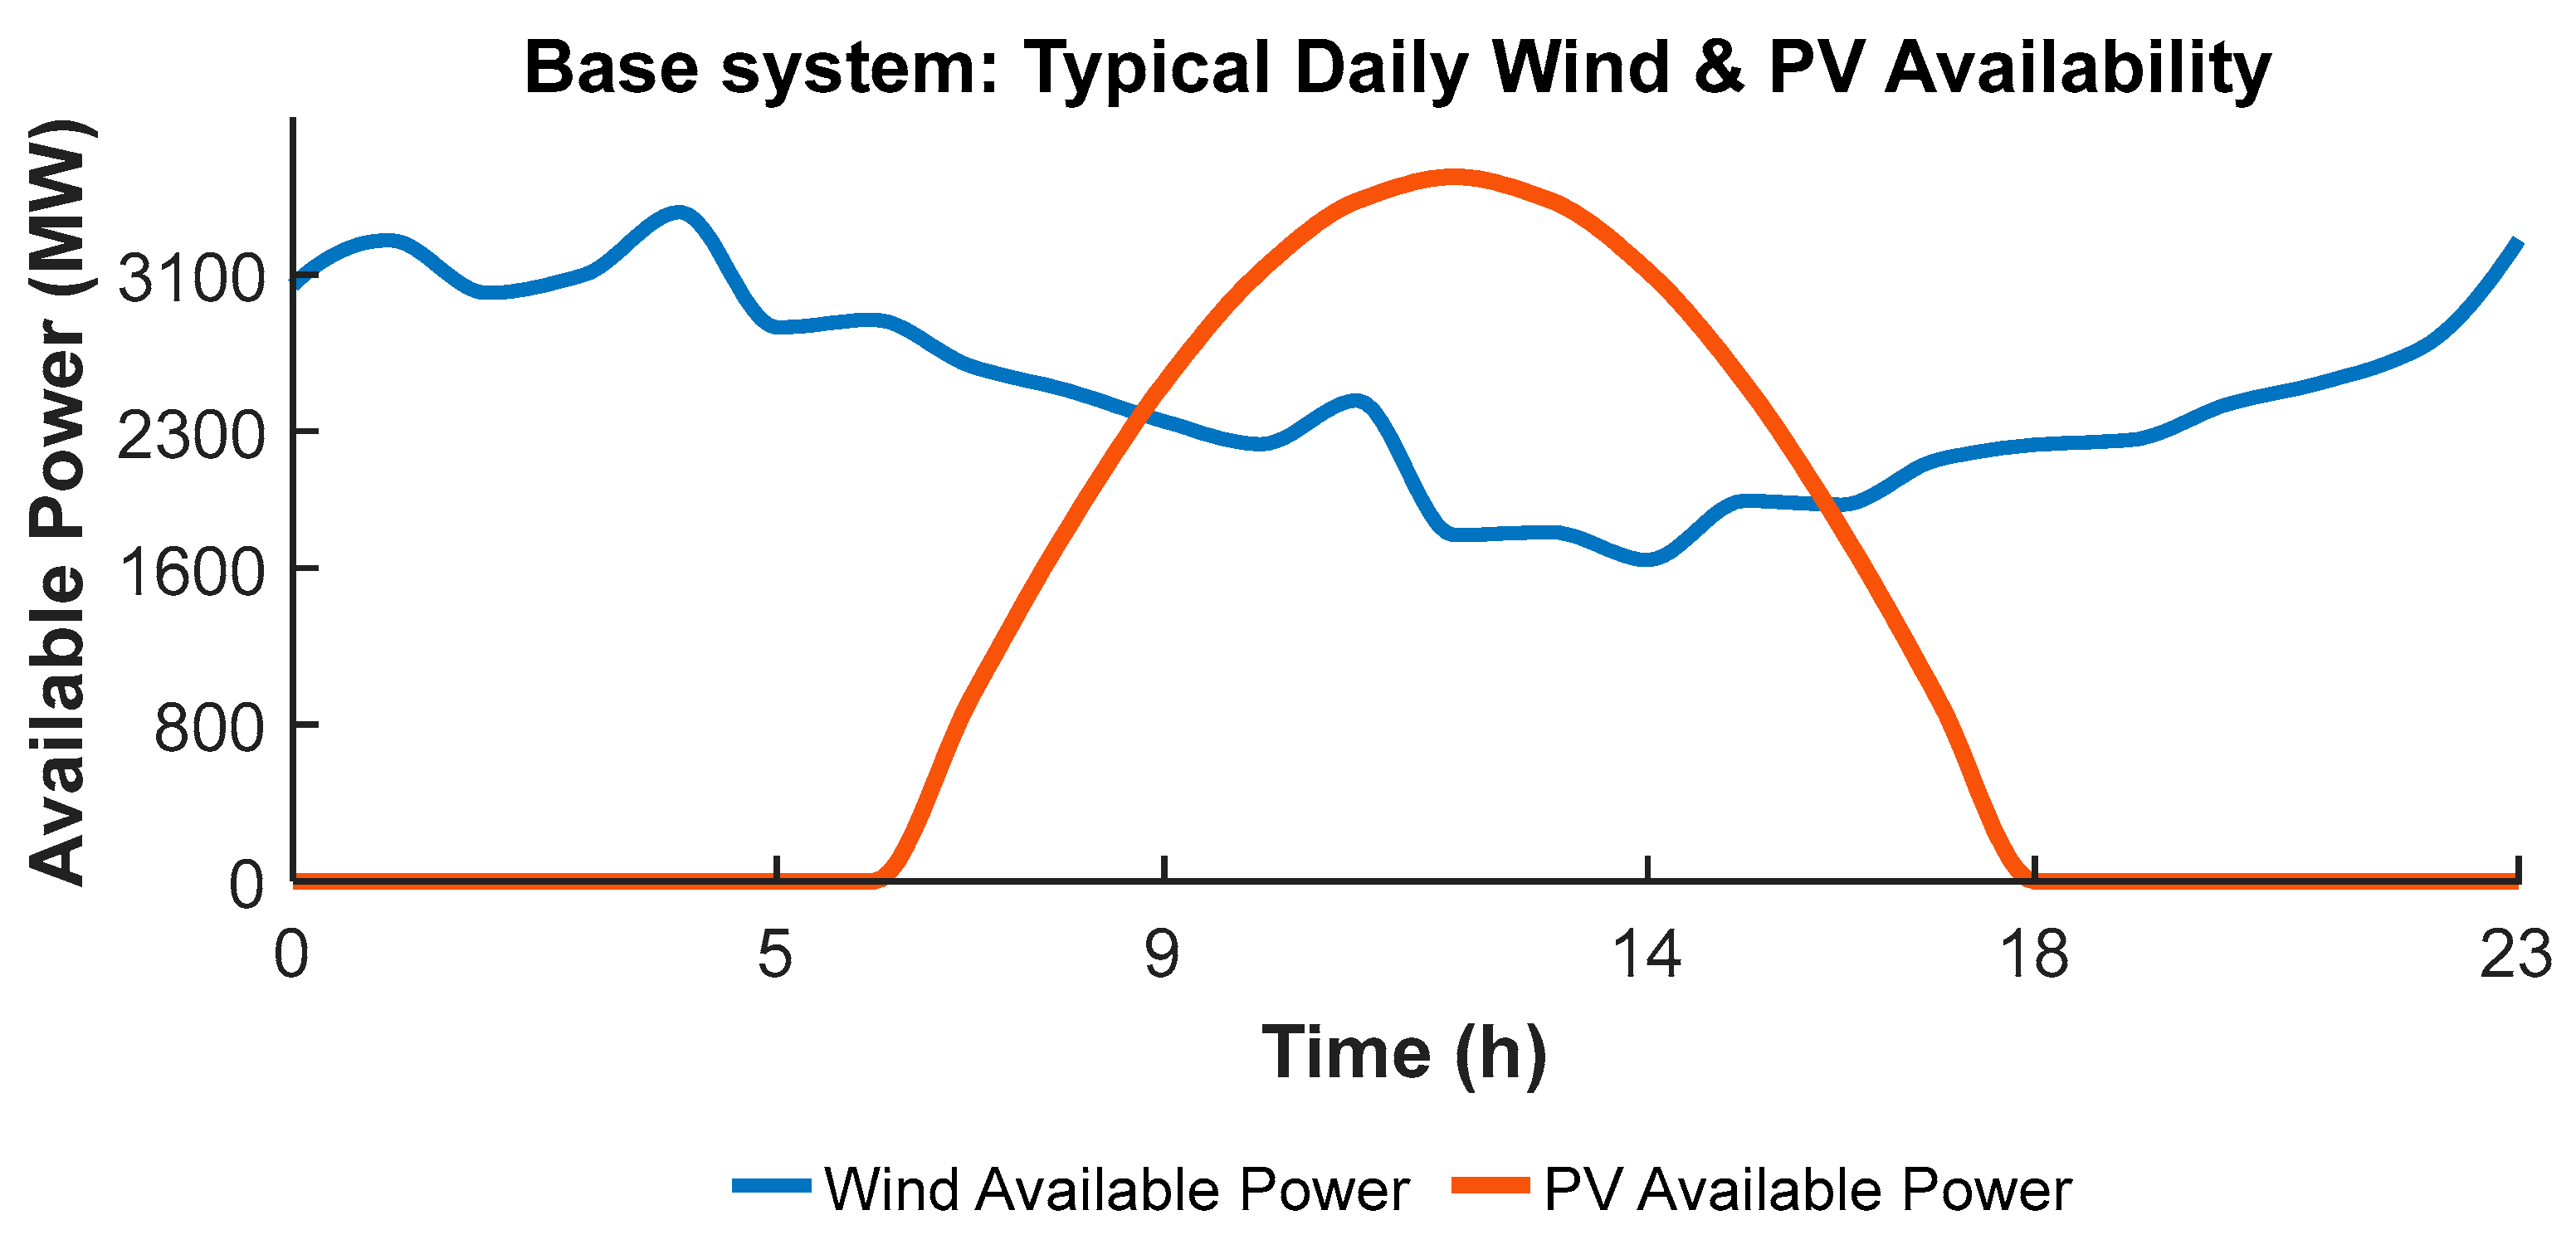
Wind and photovoltaic (PV) units are modeled as zero marginal cost generators, whose outputs are represented by time-varying upper bounds of available power. The wind and PV availability profiles are derived from typical measured data of renewable energy units in a regional power system and are appropriately scaled for use in the case study. The wind power output exhibits relatively smooth variations, while the PV output presents a pronounced midday peak.
To ensure comparability across different operating scenarios, the same wind and PV availability time series are adopted as exogenous inputs for all simulations. System operating pressure is varied only through adjustments in load levels and renewable scaling coefficients.
Figure 2 and Figure 3 present the typical daily system load profile and the corresponding wind and PV availability profiles used in the case study. These profiles serve as unified input conditions for all dispatch scenarios and represent a typical peak-shaving environment under high renewable penetration.
Figure 2.
Typical daily load profile.
Figure 3.
Typical wind and PV availability profiles.
At each dispatch interval, an AC optimal power flow (AC-OPF) model is employed to determine the actual output of each generating unit, subject to network topology, line flow limits, and voltage constraints. When available renewable generation cannot be fully accommodated due to network or operational constraints, renewable curtailment is quantified as the difference between available and dispatched power.
A 24-h scheduling horizon is adopted to represent intraday system operation. To mitigate the influence of a single typical day on the results, multiple representative operating scenarios are constructed by combining different load levels and renewable generation conditions, enabling a comparative analysis of system operating pressure under various scenarios.
Detailed system parameters, generator constraints, and other model settings are provided in Appendix A.
4.2. Analysis Under Normal Operating Conditions
To characterize the dispatch behavior of pumped storage power plant (PSP) clusters under conditions where renewable-induced system pressure is not pronounced, and to identify the potential formation of internal operational structures under a unified peak-shaving objective, representative conventional operating scenarios are selected for analysis.
In these scenarios, the system network topology, unit parameters, and operational constraints are kept unchanged to ensure comparability. By comparing dispatch results under different load levels, the analysis focuses on the variation in cluster-level operational behavior and the corresponding patterns of internal functional differentiation under the unified peak-shaving objective.
Based on system load levels and renewable generation conditions, multiple operating scenarios are constructed, among which three typical normal scenarios are selected: low load (C1), medium load (C2), and high load (C3). The detailed scenario construction procedure is provided in Appendix B. In all three cases, renewable generation remains within its normal fluctuation range, and these scenarios can therefore be regarded as representative operating states of the power system under non-stressed conditions. The load levels and renewable characteristics of these scenarios are summarized in Table 1.
Table 1.
Normal operating scenarios.
Under these three normal operating scenarios, the intraday schedules of the pumped storage power plant cluster are obtained using the unified peak-shaving-oriented dispatch model. The participation of each pumped storage plant in both generation and pumping stages is then statistically analyzed. By comparing temporal operating patterns and system-level performance indicators across different scenarios, the functional differentiation exhibited by the PSP cluster under normal operating conditions can be clearly identified.
It should be noted that the pumped storage plants in the case study differ in installed capacity and connection nodes, reflecting the typical heterogeneity of PSP clusters in real power systems. The focus of this study is not on the absolute operating capability of individual plants, but rather on how these physical differences are systematically mapped, under a unified peak-shaving objective, into a stable structure of functional differentiation that persists across operating scenarios.
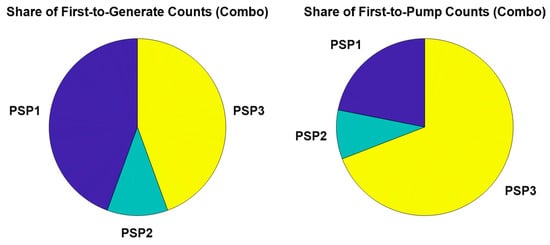
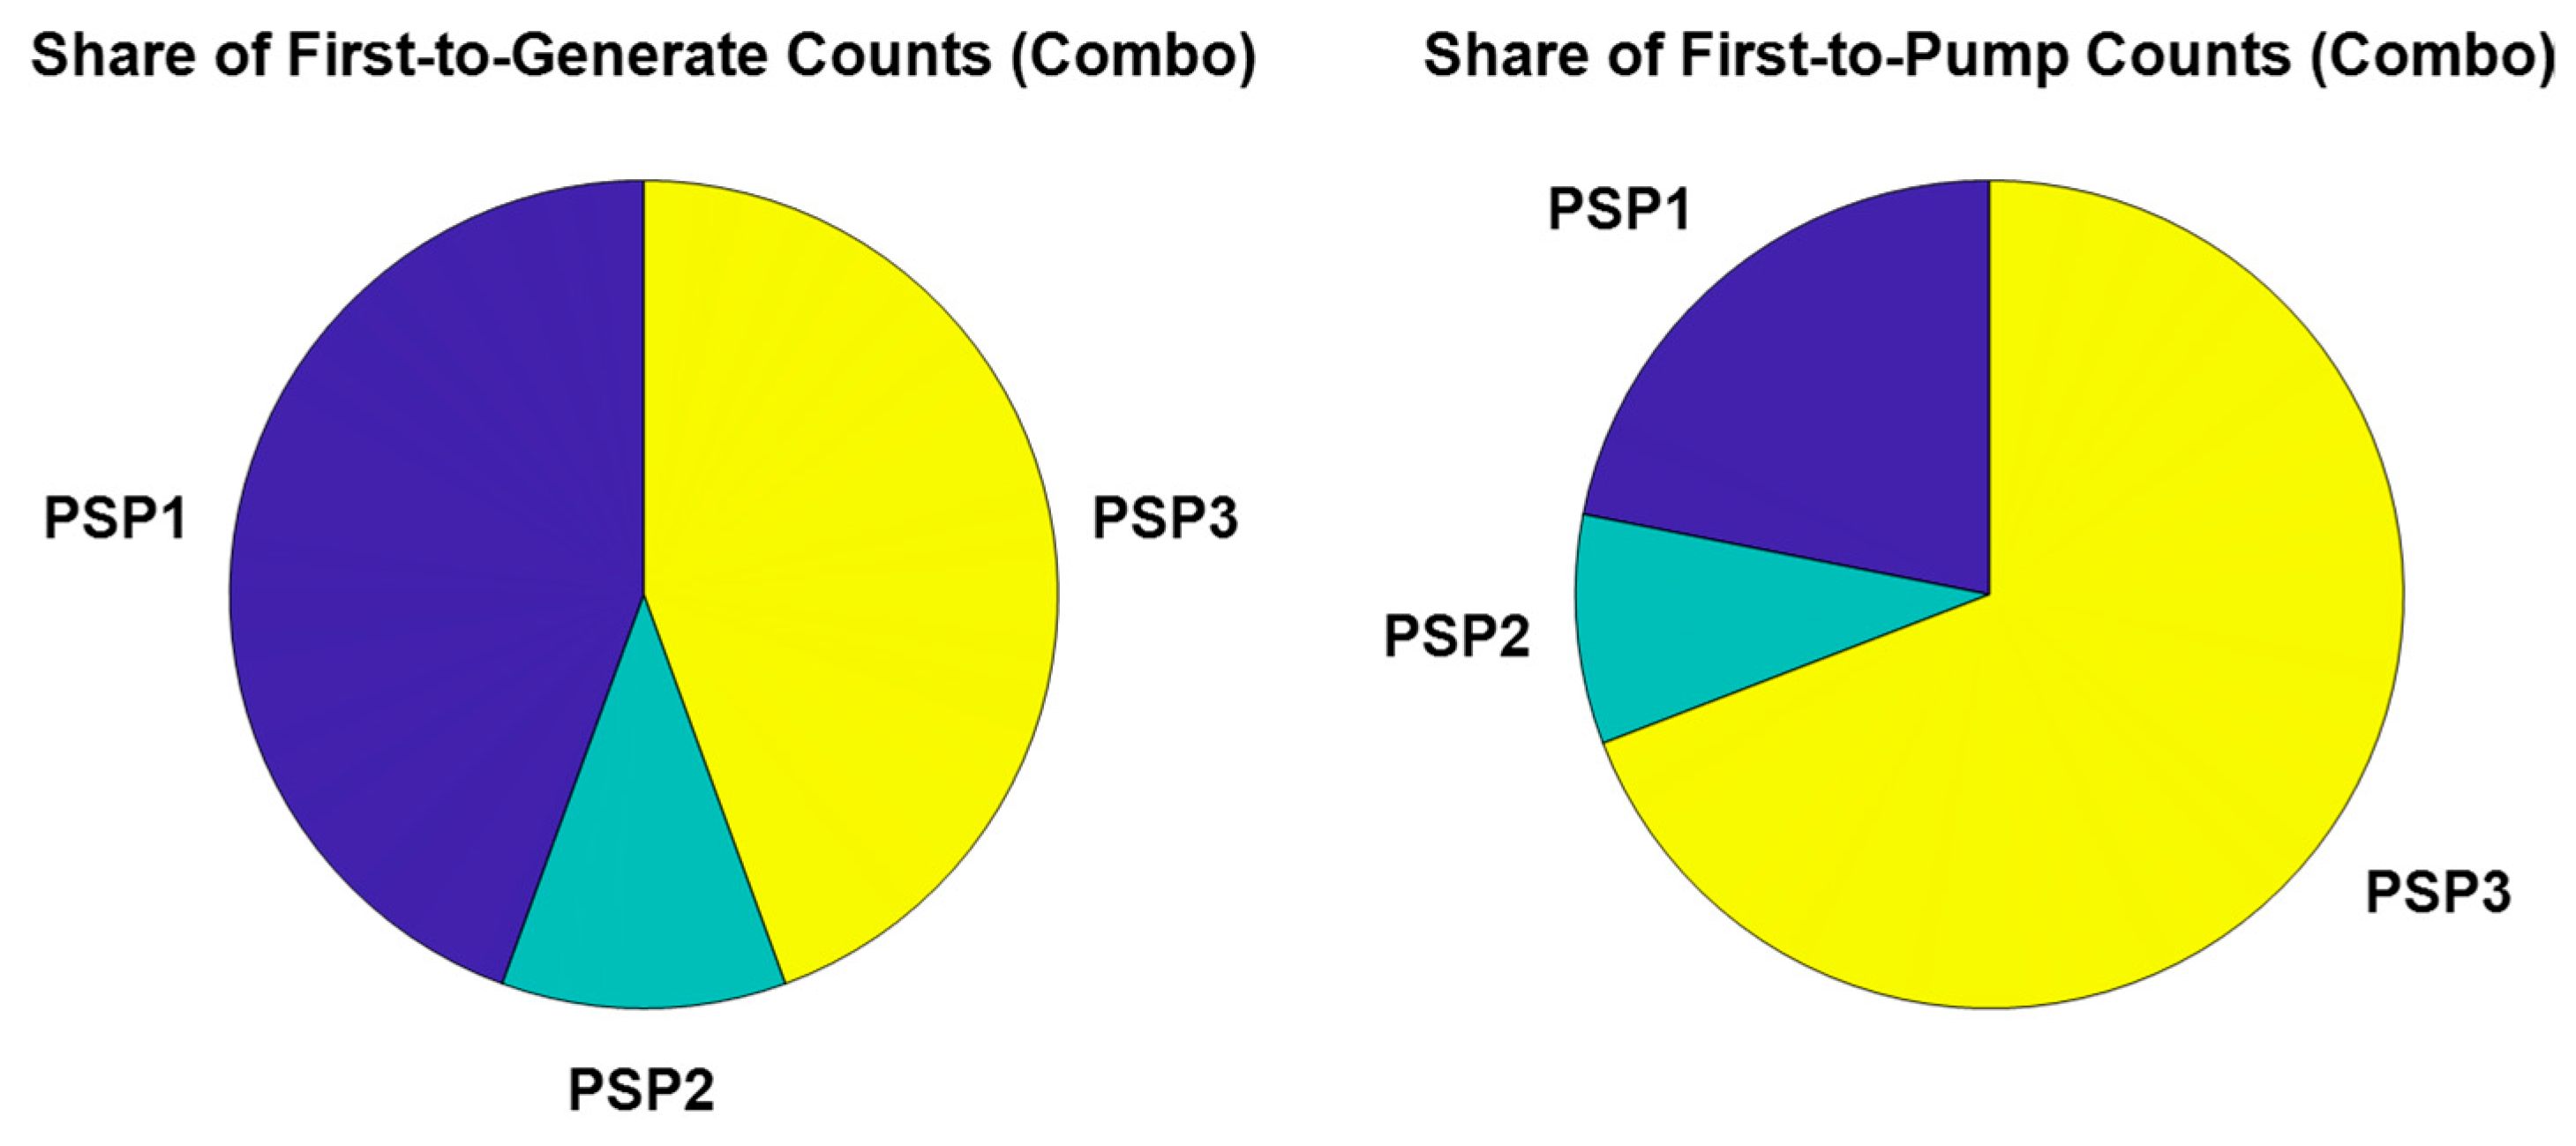
As summarized in Table 2 and Table 3 and illustrated in Figure 4, the pumped storage plants exhibit distinct operating patterns and energy-sharing profiles across the three normal operating scenarios, indicating the emergence of functional differentiation within the cluster.
Table 2.
System-level performance under normal operating scenarios.
Table 3.
Energy shares of PSP functional roles under normal conditions.
Figure 4.
Proportion of operating events of pumped storage plants.
Under the low-load scenario C1, the overall system demand is low and renewable generation is relatively abundant, making renewable energy accommodation the dominant operating constraint. The dispatch results indicate that the PSP cluster operates predominantly in pumping mode during valley periods, with limited participation in generation. Plants with larger reservoir capacities or those located closer to major renewable injection points participate more frequently in pumping, while the remaining units mainly serve auxiliary or standby roles, forming a functional structure dominated by renewable energy absorption.
Under the medium-load scenario C2, the system operates at an intermediate load level, and the PSP cluster maintains high participation in both generation and pumping stages. Some plants assume the primary role of generation support during peak demand periods, whereas others continuously pump during low-demand intervals to replenish energy for subsequent peak shaving. This leads to a clear functional separation between peak-period generation support and off-peak energy replenishment.
Under the high-load scenario C3, as system demand further increases and peak-shaving requirements become more pronounced, the operating focus of the PSP cluster shifts distinctly toward peak-period generation. Plants with larger installed capacities or those located near load centers dominate peak-period operation, while pumping during valley periods is relatively constrained to maintain overall system power balance.
By synthesizing the dispatch results across the three normal operating scenarios, it can be observed that as system load increases from low to high, the pumped storage power plant cluster does not behave as a set of equivalent peak-shaving units. Instead, under the unified peak-shaving objective, a stable structure of functional differentiation emerges endogenously. This structure preserves a consistent relative ordering across different load levels. It evolves continuously with changing system conditions: renewable energy absorption dominates under low-load conditions, generation support and energy replenishment become relatively separated under medium-load conditions, and peak-period generation support is progressively strengthened under high-load conditions.
The energy share results in Table 3 further confirm that the roles of individual pumped storage plants within the cluster are not assigned arbitrarily by the dispatch strategy, but rather arise naturally from structural differences induced by changes in system load under the same optimization model and constraint set. These findings indicate that, even under normal operating conditions with moderate renewable variability and limited system stress, a clear and stable pattern of role differentiation can already be identified in the dispatch outcomes of the pumped storage power plant cluster.
4.3. Analysis Under Extreme Operating Conditions
In practical power system operation, system load levels and renewable generation conditions may enter extreme states within short time intervals, thereby substantially amplifying system peak-shaving pressure. To further characterize the dispatch behavior of pumped storage power plant (PSP) clusters under high operational stress, two representative extreme operating scenarios are constructed based on the normal-condition analysis to examine how cluster-level operating patterns evolve under extreme conditions.
While keeping the network topology, unit parameters, and operating constraints unchanged, two extreme scenarios are defined: a low-load scenario with highly abundant wind and photovoltaic generation (E1), and a high-load scenario with insufficient renewable output (E2). Scenario E1 represents a system state dominated by renewable energy accommodation pressure, whereas scenario E2 reflects a system state dominated by peak-shaving demand [33,34]. For consistent comparison with normal operating conditions, Table 4 summarizes the system-level performance and PSP operating statistics under these extreme scenarios.
Table 4.
System-level performance under extreme operating scenarios.
To further characterize the role differentiation of the PSP cluster from the perspective of energy allocation under extreme operating conditions, and to analyze the evolution of the identified operational structure, Table 5 presents the shares of generation and pumping energy of each pumped storage plant under both conventional and extreme scenarios.
Table 5.
Energy allocation of PSP functional roles under normal and extreme scenarios.
By comparing extreme scenarios (E1, E2) with conventional scenarios (C1–C3), the evolution of the functional differentiation structure of the PSP cluster can be quantitatively examined as system operating pressure increases.
Under the extremely low-load scenario E1 with highly abundant renewable generation, the pressure for renewable energy accommodation is further intensified. The dispatch results indicate that pumping operations of the PSP cluster are substantially reinforced: more plants participate in pumping and the pumping periods become more concentrated, while the share of generation decreases accordingly. As shown by the energy share results in Table 5, the relative role ordering of individual plants remains consistent with that observed under normal conditions. However, the differences in pumping contributions become more pronounced, indicating that the existing functional differentiation structure is explicitly amplified under conditions of renewable surplus.
Under the extremely high-load scenario E2, characterized by insufficient renewable generation and elevated demand, system peak-shaving requirements become highly concentrated, and the operating focus of the PSP cluster converges further toward peak-period generation. Compared with the normal high-load case, the relative ordering of generation energy shares across plants remains essentially unchanged, and the magnitude of their variations is limited, suggesting that the cluster’s functional differentiation structure enters a stable convergent state under high peak-shaving pressure.
By jointly examining system-level performance indicators and energy allocation results, it can be concluded that extreme operating conditions do not alter the fundamental differentiation pattern formed under normal conditions. Instead, the cluster behavior evolves along the existing differentiation directions, exhibiting further reinforcement and convergence: pumping-based renewable absorption is strengthened under renewable surplus, while generation-based peak support is concentrated under intense peak-shaving demand.
Further comparison between conventional and extreme operating scenarios indicates that, under the unified peak-shaving objective and operational constraints, the role differentiation structure of the pumped storage power plant (PSP) cluster exhibits strong stability.
As system operating pressure continues to increase, both the energy shares and the relative ordering among individual plants gradually converge, rather than continuing to diverge. Specifically, the differences in generation and pumping energy shares among plants no longer expand with increasing system pressure, but instead enter a stable range.
This suggests that the marginal space for further structural evolution is inherently limited, providing a basis for identifying the boundary of coordinated dispatch behavior within the PSP cluster.
4.4. Formation Mechanism and Validation of Role Differentiation in PSP Clusters Under a Unified Peak-Shaving Objective
Through the comparative analysis of conventional and extreme operating scenarios, it can be observed that the formation of functional differentiation within the PSP cluster is not a result of random dispatch outcomes, but rather an endogenous consequence of the interaction between physical heterogeneity among plants and the unified peak-shaving objective.
From the perspective of resource endowment, individual plants differ in installed capacity, power limits, sustainable generation/pumping duration, and grid connection locations. These differences inherently lead to heterogeneous regulation capabilities across plants over different periods within the scheduling horizon. In particular, plants with larger capacities typically possess higher single-period regulation amplitude and greater cumulative energy transfer capability, making them more likely to undertake dominant regulation roles during periods when the system net load deviates significantly from its mean. In contrast, plants with relatively smaller capacities or different locational responses tend to provide supplementary regulation during specific periods or in auxiliary roles. Therefore, physical heterogeneity among plants constitutes the fundamental basis for the formation of role differentiation within the cluster.
On this basis, the unified peak-shaving objective further translates such physical heterogeneity into differentiated dispatch behaviors. By adopting the minimization of net load variance as the optimization objective, the model inherently prioritizes time periods with larger load fluctuations. Consequently, plants that can provide greater marginal contributions to reducing system variability are preferentially dispatched. In this way, inherent differences in physical capabilities are transformed into differentiated task allocations, which are manifested as relatively stable patterns in peak-period generation support, valley-period pumping absorption, and intraday energy shifting. Therefore, the unified peak-shaving objective does not merely reflect plant heterogeneity passively, but actively amplifies and maps it into a stable behavioral structure through the optimization process.
In addition, the analysis of extreme scenarios indicates that the observed role differentiation is not subject to unlimited reinforcement, but instead exhibits a distinct range of applicability and an evolution boundary.
When the system operating pressure is relatively low, the overall regulation demand of the PSP cluster remains limited, and the degree of differentiated contribution among plants is weak, resulting in an indistinct differentiation structure. As renewable variability and load peak–valley differences increase, the unified peak-shaving objective increasingly accentuates the selection of marginal regulation capabilities, leading to a gradual emergence and strengthening of functional differentiation within the cluster.
However, as system operating pressure further approaches the aggregate regulation capacity limit of the PSP cluster, the available flexibility of individual plants becomes progressively constrained. Consequently, the expansion of the differentiation structure transitions toward convergence: the differences in generation and pumping energy shares among plants no longer continue to increase, but instead enter a stable range.
These results demonstrate that the differentiated coordination of PSP clusters is not a scenario-specific artifact, but an evolutionary outcome characterized by identifiable formation conditions, a progressive strengthening process, and a bounded range of applicability.
To further validate the formation mechanism of the identified role differentiation structure, a capacity-homogenized scenario is constructed for supplementary analysis. Under the condition that the system topology, operating scenarios, and the unified peak-shaving objective remain unchanged, the rated capacities of the three pumped storage power plants are set to an identical level, and the dispatch problem is resolved.
Specifically, the rated capacities of the three PSPs are uniformly set to 600 MW, thereby eliminating the original capacity gradient (±800/±600/±400 MW), while all other parameters and operational constraints are kept unchanged. The dispatch simulations are then re-conducted for the three conventional operating scenarios. Table 6 presents the statistical results of PSP cluster dispatch under the capacity-homogenized condition.
Table 6.
Energy Share Distribution Reflecting Role Differentiation of PSP Clusters under Capacity-Homogenized Conditions.
The results show that, after eliminating capacity differences, the shares of generation and pumping energy among the PSPs become comparable, and no stable hierarchical differentiation structure is observed within the cluster. This confirms that the identified role differentiation structure is not an artifact of algorithmic bias or specific parameter settings, but a structural outcome arising from the optimization-driven mapping of physical capability differences under the unified peak-shaving objective.
5. Conclusions
This study addresses the increasing peak-shaving demand of power systems with high penetration of renewable energy by establishing a pumped storage power plant (PSP) cluster dispatch framework driven by system peak-shaving pressure. Based on an improved IEEE 39-bus system, multi-scenario case studies are conducted to systematically characterize the coordinated operating behavior of PSP clusters under a unified peak-shaving objective.
The results demonstrate that, under high renewable penetration, multiple pumped storage plants do not behave as functionally equivalent regulating units in unified dispatch. Instead, a stable structure of role differentiation emerges endogenously in response to system peak-shaving demand. Even under normal operating conditions, this structure exhibits clear characteristics, and as system operating pressure varies, the cluster’s operating mode evolves continuously from renewable absorption dominance, to balanced pumping–generation operation, and finally to reinforced peak-period generation support.
Further analysis indicates that under extreme operating conditions—either with highly abundant renewable generation or highly concentrated peak-shaving demand—the identified role differentiation structure is not weakened, but instead becomes further reinforced at the level of energy allocation and gradually converges toward a stable configuration. As system operating pressure continues to increase, both the relative ordering and the magnitude of energy contributions among individual plants tend to stabilize within a limited range, indicating the existence of a clear evolutionary boundary in the coordinated dispatch behavior of PSP clusters. A comparative analysis further reveals that when capacity differences among plants are eliminated, the energy allocation within the cluster becomes more balanced, and the previously observed hierarchical differentiation structure is significantly weakened. This confirms that capacity heterogeneity plays a fundamental role in the formation of the observed role differentiation structure.
These findings indicate that a peak-shaving-pressure-driven dispatch modeling framework can explicitly reveal the operating behavior of PSP clusters under unified optimization conditions, providing a new analytical perspective for understanding the coordination mechanisms of pumped storage plants and their role in power systems with high renewable penetration.
Future research may extend this framework by incorporating higher levels of renewable penetration, multi-period uncertainty, and market price mechanisms, thereby broadening the scope of PSP cluster behavior analysis and supporting planning and operational decision-making in emerging power systems.
Author Contributions
W.L.: Supervision, Writing—Review and Editing, Resources, Funding acquisition, Project administration; Y.J.: Conceptualization, Methodology, Software, Validation, Formal analysis, Investigation, Data Curation, Visualization, Writing—Original Draft; Z.W.: Writing—Review and Editing, Investigation; M.H.: Writing—Review and Editing, Investigation; L.Z.: Writing—Review and Editing, Investigation. All authors have read and agreed to the published version of the manuscript.
Funding
This research received no external funding.
Data Availability Statement
The original contributions presented in this study are included in the article. Further inquiries can be directed to the corresponding author.
Acknowledgments
During the manuscript Writing stage, an artificial intelligence–assisted tool was used for language polishing to improve clarity and readability. The tool was not involved in the research design, experiments, or result analysis, and all scholarly content of this paper was completed by the authors, who take full responsibility for it.
Conflicts of Interest
The authors declare no conflicts of interest.
Appendix A. System Configuration of the Improved IEEE 39-Bus Test System
The improved IEEE 39-bus system exhibits distinct temporal patterns of system load and renewable generation over a typical day. During the nighttime valley (0–5 h), system demand is low, photovoltaic (PV) generation is zero, and wind power remains relatively stable, with the system mainly supplied by conventional generation. In the morning period (6–11 h), load gradually increases while PV output rises rapidly, leading to a significant increase in the share of renewable energy. Around midday (12–13 h), load temporarily declines while PV generation approaches its peak, resulting in a pronounced temporal mismatch between demand and renewable supply. In the afternoon (14–15 h), load increases again as PV output decreases and wind power remains at a moderate-to-high level, aligning supply and demand. During the evening and night peak (16–21 h), system demand reaches its maximum, PV output quickly drops to zero, and the need for regulation from conventional sources becomes pronounced. In the late-night period (22–23 h), demand decreases, and wind power fluctuations partially alleviate the system’s regulation burden.
Table A1 summarizes the bus locations, output limits, and linear marginal cost parameters of all generation units in the improved IEEE 39-bus system. These parameters are automatically generated by the simulation code and are used for the 24-h simulation and optimization. For conventional units (thermal and hydropower), minimum output constraints are uniformly applied to reflect stable operating requirements. Wind and PV units have zero minimum output, indicating that their available power is limited only by the time-varying availability profiles. Pumped storage units are modeled as bidirectional units, and three PSPs are differentially configured in the main script to support the analysis of dispatch responses under capacity heterogeneity. Generation costs follow the MATPOWER linear cost model: zero marginal cost for wind and PV, 10 for hydropower, and 20 for thermal units, reflecting the operating preference of renewable priority and conventional backup regulation.
Table A1.
Generator data of the IEEE 39-bus system.
Appendix B. Configuration of Pumped Storage Power Plants and Scenario Construction
To better reflect realistic operating conditions, three pumped storage power plants (PSPs) are integrated into the improved IEEE 39-bus system. All PSPs are assumed to have identical round-trip efficiency, with both pumping and generating efficiencies set to 0.90. The energy storage capacity of each plant is defined as 6 h of its rated power. To avoid bias in dispatch results caused by initial energy conditions, the initial state of charge (SOC) of all PSPs is uniformly set to 50% of their rated energy capacity, which serves as a neutral initial condition. The three PSPs differ in their rated capacities and connection buses. Specifically, PSP1 is connected to bus 6 with both generating and pumping capacities of 800 MW; PSP2 is connected to bus 18 with capacities of 600 MW; and PSP3 is connected to bus 19 with capacities of 400 MW.
System load levels are categorized into three representative states based on typical daily demand patterns and seasonal variations. The low-load level corresponds to holidays or periods of low economic activity, characterized by reduced demand and a smaller peak–valley difference. The typical load level represents the average demand on regular working days. The high-load level simulates extreme peak periods, such as summer cooling or winter heating, with prolonged evening peaks and rapid load ramping.
To reflect seasonal variations in solar irradiance, a scaling factor is applied to the photovoltaic output profile. Values of represent cloudy or winter conditions with low irradiance, whereas corresponds to clear or summer conditions with high irradiance. Similarly, wind power output is adjusted using a scaling factor to capture seasonal and diurnal variations in wind speed: represents low-wind or calm periods, and represents high-wind or seasonally windy conditions.
By combining these three dimensions—load level, photovoltaic scaling, and wind scaling—twelve representative operating scenarios are constructed, spanning the full operating envelope from renewable surplus periods to peak-shaving-dominated conditions. All scenarios share identical network topology and transmission capacities, ensuring that observed differences arise solely from variations in load and renewable availability. This design allows the adaptive dispatch behavior of the pumped storage power plant cluster to be analyzed in a controlled and systematic manner under diverse supply–demand environments.
Table A2.
Definition of all operating scenarios.
Table A3.
Simulation results of the 12 scenarios.
References
- Ashraf, A.; Sagheer, M. Renewable energy capacity and technological innovations: A review of global trends and future directions. Environ. Prog. Sustain. Energy 2025, 44, e70071. [Google Scholar] [CrossRef] [Scilit]
- Gharibvand, H.; Gharehpetian, G.B.; Anvari-Moghaddam, A. A survey on microgrid flexibility resources, evaluation metrics and energy storage effects. Renew. Sustain. Energy Rev. 2024, 201, 114632. [Google Scholar] [CrossRef] [Scilit]
- Rahman, M.M.; Dadon, S.H.; He, M.; Giesselmann, M.; Hasan, M.M. An Overview of Power System Flexibility: High Renewable Energy Penetration Scenarios. Energies 2024, 17, 6393. [Google Scholar] [CrossRef] [Scilit]
- Laimon, M. Renewable energy curtailment: A problem or an opportunity? Results Eng. 2025, 26, 104925. [Google Scholar] [CrossRef] [Scilit]
- De Carne, G.; Maroufi, S.M.; Beiranvand, H.; De Angelis, V.; D’Arco, S.; Gevorgian, V.; Waczowicz, S.; Mather, B.; Liserre, M.; Hagenmeyer, V. The role of energy storage systems for a secure energy supply: A comprehensive review of system needs and technology solutions. Electr. Power Syst. Res. 2024, 236, 110963. [Google Scholar] [CrossRef] [Scilit]
- Othman, M.E.F.; Sidek, L.M.; Basri, H.; El-Shafie, A.; Chua, L.H.; Ahmed, A.N. Review on climate change impacts on hydropower potentials: Mitigation and adaptation strategies. Energy Rep. 2025, 14, 5558–5571. [Google Scholar] [CrossRef] [Scilit]
- Tariq, G.; Ding, G.; Hussain, M.A. Pathways to Carbon Neutrality: The Impact of Hydropower, Nuclear Energy, Economic Complexity, Financial Development, and Eco-Innovation. Environ. Qual. Manag. 2025, 34, e70038. [Google Scholar]
- Guo, L.; Xu, C.; Zhang, F.; Deng, F.; Ai, X.; Xue, F. Variable speed pumped storage units in China: Current status and development. Energy Rep. 2025, 13, 2815–2828. [Google Scholar] [CrossRef] [Scilit]
- Zhao, K.; Wang, J.; Qiu, L. Approval and progress analysis of pumped storage power stations in Central China during the 14th five-year plan period. J. Energy Storage 2024, 102, 114104. [Google Scholar] [CrossRef] [Scilit]
- Wu, Z.; Feng, Y.; Li, X.; Yuan, B. Flexibility definition and improvement of pumped hydro storage: A techno-economic analysis. J. Energy Storage 2024, 93, 112078. [Google Scholar] [CrossRef] [Scilit]
- Vasconcelos, M.H.; Castro, M.V.; Nicolet, C.; Moreira, C.L. Flexibility extension in hydropower for the provision of frequency control services within the European energy transition. Int. J. Electr. Power Energy Syst. 2024, 156, 109689. [Google Scholar] [CrossRef] [Scilit]
- Castorino, G.A.M.; Dahlquist, E.; Kyprianidis, K.; Losi, E.; Manservigi, L.; Pinelli, M.; Renuke, A.; Spina, P.R.; Venturini, M. Optimization of sizing and operation of pumped hydro storage plants under current and future economic scenarios. J. Energy Storage 2025, 119, 116130. [Google Scholar] [CrossRef] [Scilit]
- Chen, C.; Huang, S.; Yin, Y.; Tang, Z.; Shuai, Q. Enhancing Pumped Hydro Storage Regulation Through Adaptive Initial Reservoir Capacity in Multistage Stochastic Coordinated Planning. Energies 2025, 18, 2707. [Google Scholar] [CrossRef] [Scilit]
- Liu, M.; Kong, X.; Lian, J.; Wang, J.; Yang, B. Distributionally robust coordinated day-ahead scheduling of Cascade pumped hydro energy storage system and DC transmission. Appl. Energy 2025, 384, 125449. [Google Scholar] [CrossRef] [Scilit]
- Wang, H.Z.; Yu, E.K. Short-term optimal dispatching of pumped storage power station groups. Power Syst. Technol. 1996, 20, 1–5. [Google Scholar]
- Peng, Y.M.; Liu, D.X.; Wang, X.L.; Zhou, J.Z.; Li, C.S.; Zhang, Y.C. Research on optimal dispatching of pumped storage power stations under extreme meteorological scenarios considering reservoir operation constraints. J. Hydraul. Eng. 2023, 54, 1298–1308. [Google Scholar]
- Liao, S.; Wu, X.; Liu, B.; Cheng, C.; Li, S. Short-term peak shaving model for a wind-solar-pumped hydropower storage system fully using storage flexibility by dynamic fuzzy clustering algorithm. Sustain. Energy Technol. Assess. 2026, 85, 104778. [Google Scholar] [CrossRef] [Scilit]
- Zhao, G.; Yu, C.; Huang, H.; Yu, Y.; Zou, L.; Mo, L. Optimization Scheduling of Hydro–Wind–Solar Multi-Energy Complementary Systems Based on an Improved Enterprise Development Algorithm. Sustainability 2025, 17, 2691. [Google Scholar] [CrossRef] [Scilit]
- Cheng, X.; Shen, J.J.; Cheng, C.T.; Wu, X.Y.; Li, G. A short-term multi-power grid heuristic peak-shaving method for pumped storage power station groups under the large power grid platform. Autom. Electr. Power Syst. 2014, 38, 53–60. [Google Scholar]
- Feng, Q.; Wu, X.Y.; Cheng, C.T.; Shen, J.J.; Li, G. Peak-shaving optimization method for pumped storage power station groups considering cumulative error of wind-solar output prediction. Proc. CSEE 2025, 45, 1–13. [Google Scholar]
- Song, B.; Qin, K.; Wen, M.; Zhu, M.; Zou, K.; He, G. Coordinated multi-level scheduling method considering uncertainty of renewable energy and load. Front. Energy Res. 2025, 13, 1612065. [Google Scholar] [CrossRef] [Scilit]
- Chen, X.; Wu, P.; He, H.; Song, B.; Qin, K.; Teng, X.; Yang, F.; Li, D. Optimal flexibility dispatching of multi-pumped hydro storage stations considering the uncertainty of renewable energy. Symmetry 2024, 16, 1404. [Google Scholar] [CrossRef] [Scilit]
- Wang, M.; Xu, X.; Fan, S.; Yan, Z.; Yang, B.; Guan, X. Multi-Period Electrical Array Reconfiguration for Multi-PV Systems Considering Net Power Fluctuation Mitigation. J. Mod. Power Syst. Clean Energy 2025, 13, 2040–2050. [Google Scholar]
- Meng, Y.; Fan, S.; Shen, Y.; Xiao, J.; He, G.; Li, Z. Transmission and distribution network-constrained large-scale demand response based on locational customer directrix load for accommodating renewable energy. Appl. Energy 2023, 350, 121681. [Google Scholar] [CrossRef] [Scilit]
- Ahmad, A.B.; Ooi, C.A.; Ali, O.; Charin, C.; Maharum, S.M.M.; Swadi, M.; Salem, M. Renewable integration and energy storage management and conversion in grid systems: A comprehensive review. Energy Rep. 2025, 13, 2583–2602. [Google Scholar] [CrossRef] [Scilit]
- Enasel, E.; Dumitrascu, G. Storage solutions for renewable energy: A review. Energy Nexus 2025, 17, 100391. [Google Scholar] [CrossRef] [Scilit]
- Bhattarai, B.; Bhattarai, B.S.; Chamlagain, B.S.; Upreti, S.; Maskey, R.K. Pumped Storage Hydropower Systems: A Comprehensive Review of Innovations, Resilience, and Climate Adaptation. IOP Conf. Ser. Earth Environ. Sci. 2025, 1533, 012007. [Google Scholar] [CrossRef] [Scilit]
- Tipán-Salazar, L.; Naval, N.; Yusta, J.M. An optimal dispatch model of renewable generation and pumped hydro energy storage for green hydrogen production. Renew. Energy 2025, 246, 122939. [Google Scholar] [CrossRef] [Scilit]
- Lin, X.; Meng, W.; Yu, M.; Yang, Z.; Luo, Q.; Rao, Z.; Peng, J.; Chen, Y. Multi-Objective Optimization of Offshore Wind Farm Configuration for Energy Storage Based on NSGA-II. Energies 2025, 18, 3061. [Google Scholar] [CrossRef] [Scilit]
- He, R.; Hao, J.; Zhou, H.; Chen, F. Multi-Objective Collaborative Optimization of Distribution Networks with Energy Storage and Electric Vehicles Using an Improved NSGA-II Algorithm. Energies 2025, 18, 5232. [Google Scholar]
- Abido, M.A. Multiobjective evolutionary algorithms for electric power dispatch problem. IEEE Trans. Evol. Comput. 2006, 10, 315–329. [Google Scholar] [CrossRef] [Scilit]
- Deb, K.; Pratap, A.; Agarwal, S.; Meyarivan, T.A.M.T. A fast and elitist multiobjective genetic algorithm: NSGA-II. IEEE Trans. Evol. Comput. 2002, 6, 182–197. [Google Scholar] [CrossRef] [Scilit]
- Dalal, D.; Bilal, M.; Shah, H.; Sifat, A.I.; Pal, A.; Augustin, P. Cross-correlated scenario generation for renewable-rich power systems using implicit generative models. Energies 2023, 16, 1636. [Google Scholar] [CrossRef] [Scilit]
- Terrén-Serrano, G.; Ludkovski, M. Extreme day-ahead renewables scenario selection in power grid operations. Appl. Energy 2025, 391, 125747. [Google Scholar] [CrossRef] [Scilit]

Disclaimer/Publisher’s Note: The statements, opinions and data contained in all publications are solely those of the individual author(s) and contributor(s) and not of MDPI and/or the editor(s). MDPI and/or the editor(s) disclaim responsibility for any injury to people or property resulting from any ideas, methods, instructions or products referred to in the content. |
© 2026 by the authors. Licensee MDPI, Basel, Switzerland. This article is an open access article distributed under the terms and conditions of the Creative Commons Attribution (CC BY) license.