


Abstract
This study investigates the thermo-hydro-mechanical (THM) coupling impacts on seepage and heat transfer characteristics to enhance the efficient utilization of hot dry rock resources in the Guanzhong Basin. A computational model of thermo-hydro-mechanical three-field coupling for an enhanced geothermal system is developed based on the geological context and rock thermophysical properties of the Huazhou-Huayin target area in the Guanzhong Basin. The effects of differential pressure during injection and production, injection temperature, and well configuration on the reservoir stress field, permeability variations, temperature distribution, and heat recovery efficiency of the system are carefully simulated and analyzed. Simulations indicate that increasing the injection–production pressure differential from ±1 MPa to ±7 MPa dramatically enhances heat recovery, yielding a fivefold increase in the extraction rate and an 11.54-fold rise in cumulative heat production. Conversely, this aggressive approach severely impacts long-term sustainability, accelerating thermal breakthrough and drastically cutting the operational lifespan by 93.30%. Lowering the injection temperature from 60 °C to 20 °C yields a 24.14% enhancement in heat output over the same duration, together with a 24.14% increase in the geothermal extraction rate. Increasing the number of injection–production wells from one to two broadens the heat extraction range and improves system heat production by 35.82%, concurrently diminishing lifespan by 39.50%. This work possesses theoretical importance for the progression of hot dry rock initiatives similar to those in the Guanzhong Basin and other geological settings.
1. Introduction
Geothermal energy, as a clean, dependable, and abundant renewable resource, plays a crucial strategic role in the restructuring of the global energy landscape and the pursuit of carbon neutrality. Hot dry rock resources are widely distributed in deep, high-temperature rock formations, exhibiting substantial thermal energy potential. Effective development mostly relies on Enhanced Geothermal Systems (EGSs), which employ artificial fracturing operations to establish effective heat exchange conduits [1]. During this procedure, cold water is delivered into the subsurface via injection wells under high pressure to enlarge the fissures. Production wells are tasked with extracting fluid to transfer substantial heat energy to the surface for human utilization. EGSs create a fracture network in a low-permeability rock mass using artificial fracturing technology to establish a fluid circulation pathway between injection and production wells, thus facilitating effective thermal energy extraction [2]. The development process of EGSs entails a complicated thermo-hydro-mechanical multi-field coupling, encompassing the interactions among the temperature field, seepage field, and stress field. Thus, enhancing development strategies continues to be a principal concern and a central focus of contemporary study. Using Utah FORGE data, Janiga et al. developed a fully coupled EGS model integrating DFN and SRV, validating advanced numerical simulations in the EGS and providing a key reference for multi-field coupling engineering applications [3]. Numerical modeling has proven effective in clarifying the intricate thermo-hydro-mechanical (THM) coupling processes involved in the development of Enhanced Geothermal Systems (EGSs), especially in low-permeability reservoirs.
At present, many researchers are examining multi-field coupling challenges in Enhanced Geothermal Systems. Liu et al. highlighted that the spacing of injection–production wells significantly affects thermal breakthrough and underscored the importance of optimal well spacing in injection–production parameters and well pattern optimization [4]. Liu et al. proposed a parameter evaluation method employing a surrogate model and multi-response optimization, meticulously examining the impacts of injection–production flow, well spacing, and injection temperature on productivity [5]. Zeng et al. created a comprehensive thermo-hydro-mechanical model to clarify the impact of fracture variables on thermal breakthrough [6]. Du et al. developed a fully coupled THM model, illustrating that fracture permeability and spacing significantly affect the heat extraction efficiency of the geothermal system [7]. Ma et al. concentrated on the well pattern configuration and fracture parameters, proposing an optimal well layout scheme [8,9]. Cai et al. compared various fracture connectivity and injection–production schemes based on the five-point horizontal well model, proposing that the configuration using four injection wells and one production well is more efficient [10]. Janiga et al. applied the discrete fracture network method to evaluate the sensitivity of a horizontal dual-well EGS, quantifying the effects of flow rate, fracture properties, and well spacing on thermal decline and demonstrating that optimized fracture networks and well layouts can reduce operational flow while controlling thermal breakthrough [11]. Using numerical reservoir simulations, Nassereddine and Zerpa compared different well configurations and EGS development modes in deep hot dry rock, showing that an EGS achieves higher heat extraction efficiency under high-temperature, deep conditions, with well architecture and fracture characteristics being critical to system feasibility [12].
Chen et al. examined the heat extraction efficiency of a geothermal system employing supercritical CO2 as the working fluid, highlighting its advantages of higher fluidity and improved thermal efficiency in relation to fracture modeling and working fluid selection [13,14]. Okoroafor and Horne examined the effects of temperature-dependent viscosity in simulations of Enhanced Geothermal Systems (EGSs), demonstrating that these models are essential for precise thermal predictions in heterogeneous or channelized fractures with significant injection well–reservoir temperature disparities, while constant viscosity is applicable in scenarios with uniform fracture distribution or minimal temperature variations [15]. Huang et al. introduced a heterogeneous fracture-generating technique predicated on relative pressure distribution and analyzed the impacts of various injection–production well configurations and injection methodologies [16]. Xiong et al. formulated a thermal water coupling model utilizing a discrete fracture network, which proficiently mimicked the prolonged heat recovery process [17]. Guo et al. developed a fully coupled THM model for abandoned reservoirs and examined the synergistic impacts of various well configurations and working fluids on geothermal extraction [18].
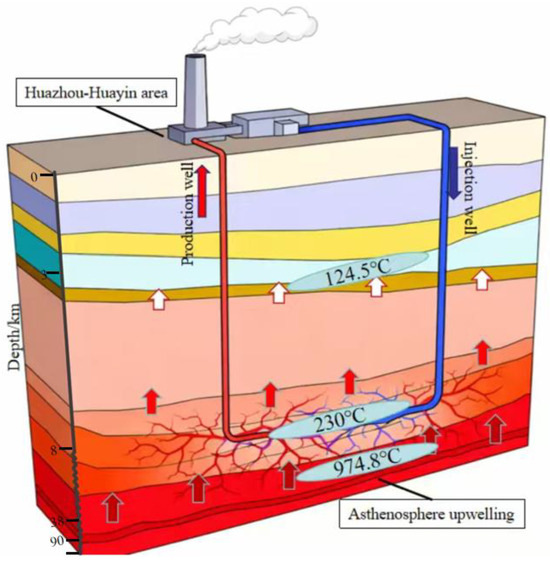
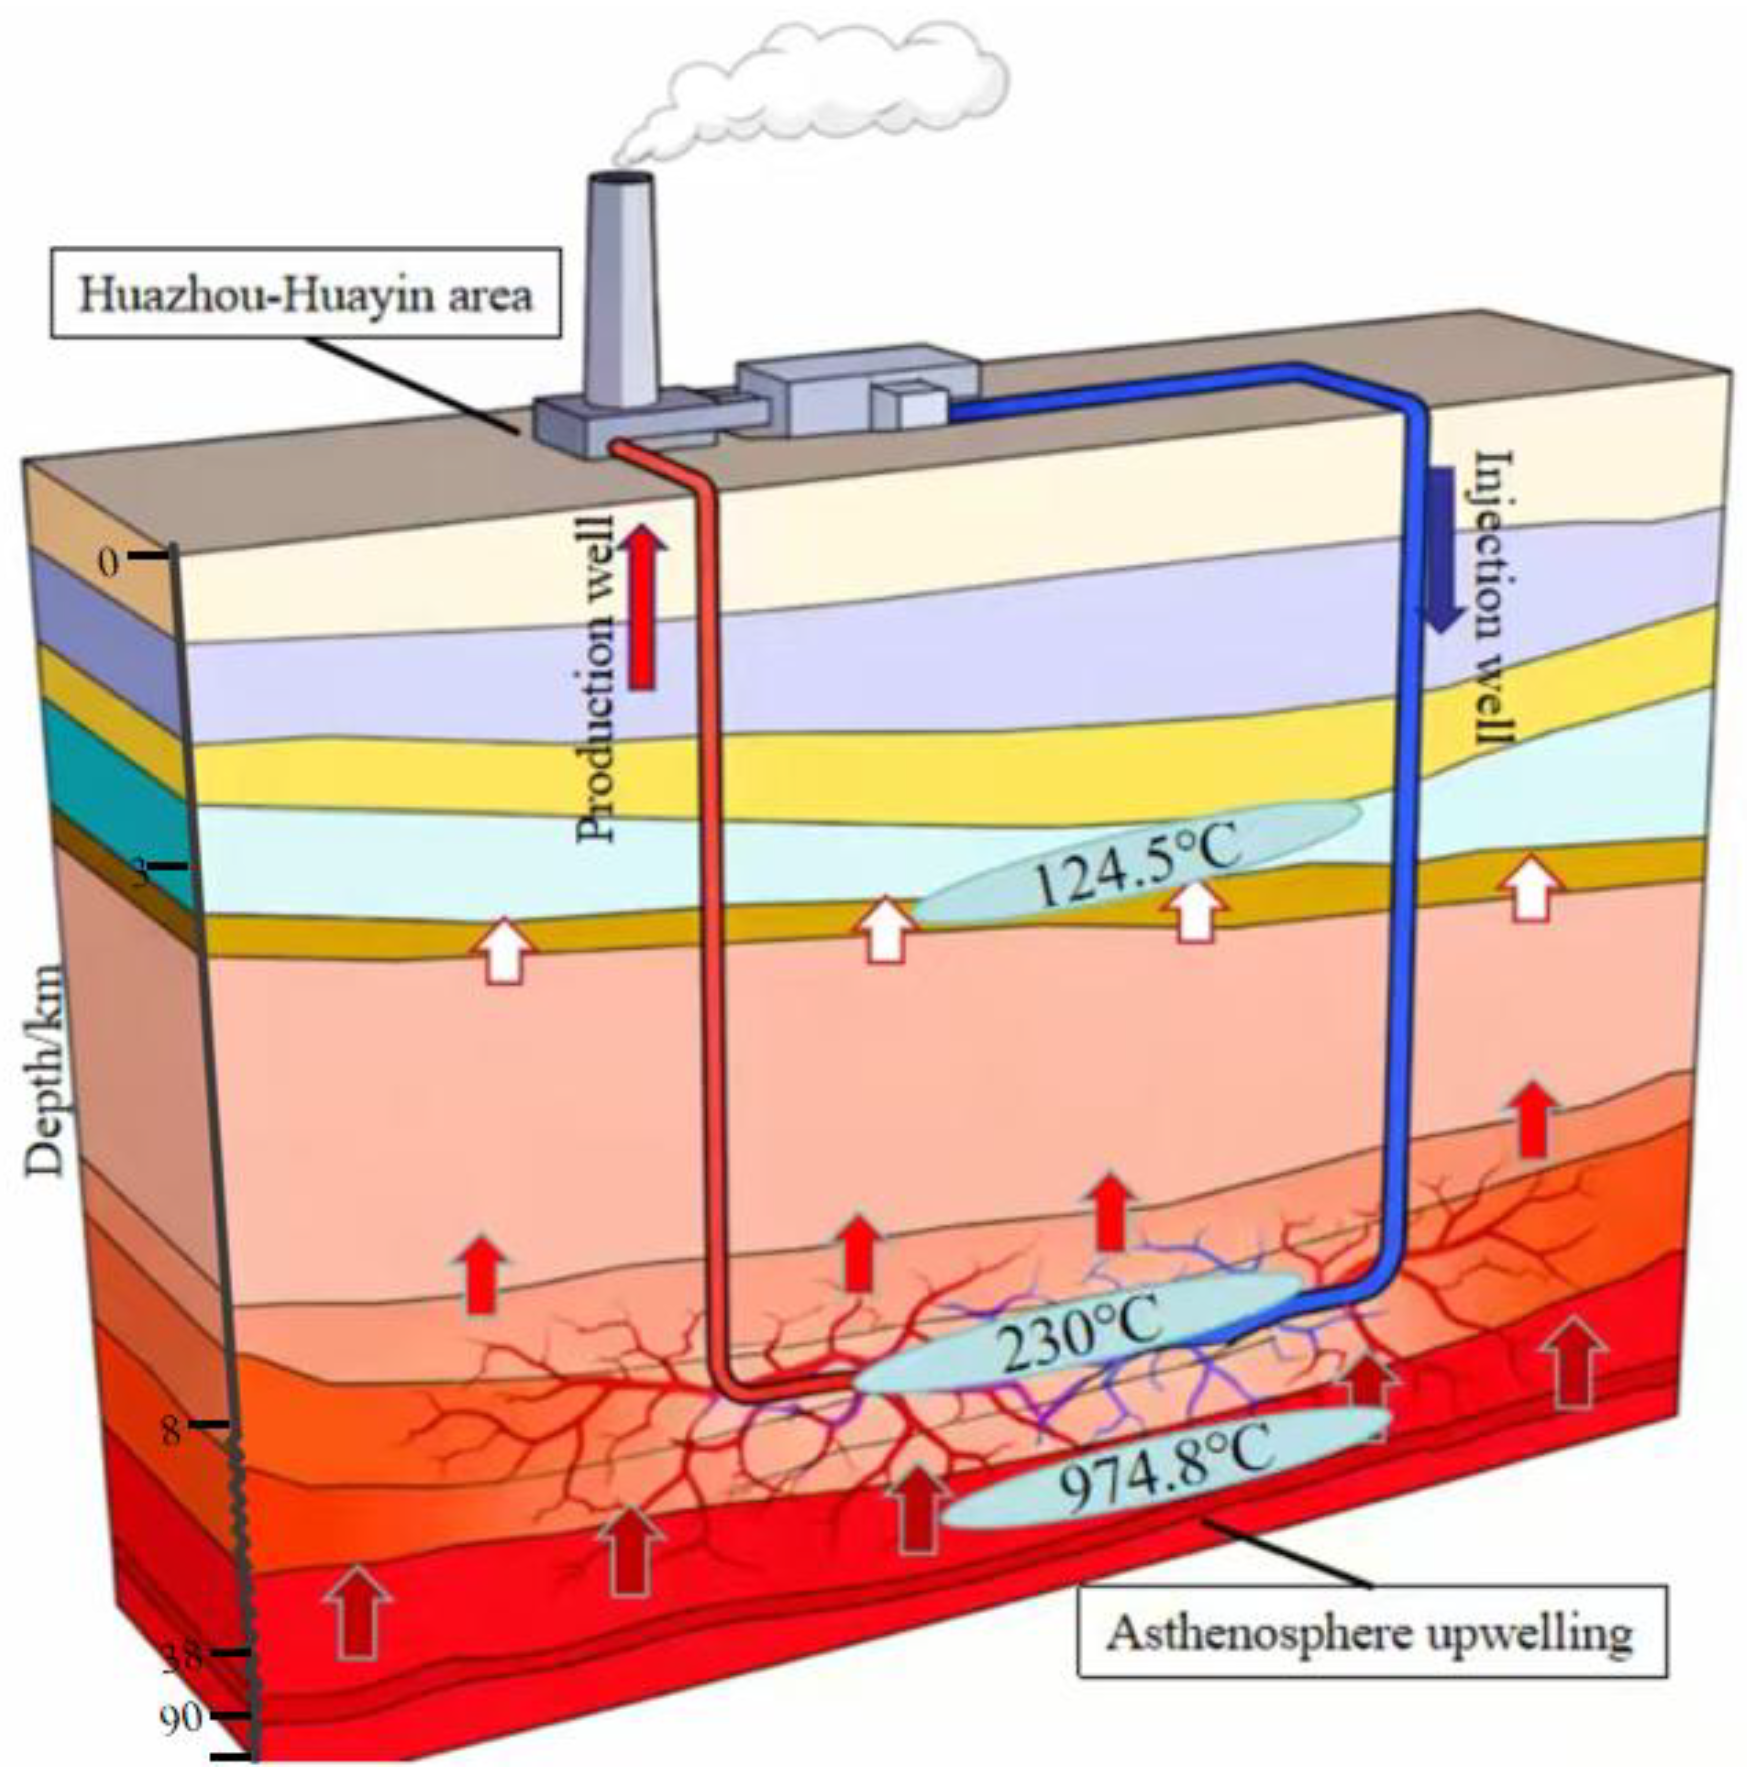
While discrete fracture network (DFN) models accurately depict fluid flow in complex fractures, they often simplify the rock matrix deformation. Conversely, stimulated reservoir volume (SRV) approaches provide macroscopic estimates but lack detailed heat transfer mechanics. Furthermore, many existing fully coupled THM models rely on generalized parameters rather than site-specific geological data [19,20,21,22,23,24]. The scientific gap addressed in this study is the integration of a fully coupled THM model with specific geological and thermophysical parameters from the Guanzhong Basin, overcoming the limitations of idealized models to provide engineering-grade optimization for this specific region. The established hot dry rock geothermal system depicted in Figure 1 utilizes COMSOL Multiphysics (version 6.2) numerical simulation software to quantitatively elucidate the influence mechanisms of various development parameters on the seepage and heat transfer characteristics, as well as the long-term heat recovery performance of the system, through the design of multiple comparative schemes. The objective is to establish a theoretical foundation and optimization framework for the scientific and efficient development of hot dry rock resources in this region.
Figure 1.
Schematic diagram of hot dry rock geothermal system in Huazhou-Huayin area.
2. Geological Background and Thermal Reservoir Model
2.1. Regional Geological Background
The hot dry rock resources in the Huazhou-Huayin region of Shaanxi Province are characteristic of a typical sedimentary basin type. The heat source mechanism is primarily evident in the tectonic context of lithospheric thinning and Moho uplift. The upwelling of mantle heat flow serves as the primary heat source, augmented by the radioactive heat generation of crustal rocks [25,26,27,28,29]. In the context of elevated thermal backgrounds and distinct geological formations, the pronounced disparity in thermal conductivity between shallow strata—specifically, the Archean Taihua Group granite exhibiting high thermal conductivity and the Cenozoic sedimentary rock layer characterized by low thermal conductivity—contributes to the re-aggregation of heat flow in the uplifted basement region, thereby establishing a conducive thermal aggregation model [30,31,32]. The analysis of geothermal characteristics reveals that the total reserves of hot dry rock resources within 8 km are 46.1 EJ, with recoverable resources estimated at 0.92 EJ based on a 2% recovery rate, equivalent to 52.53 million tons of standard coal. The regional mean geothermal gradient is 33.0 ± 2.0 °C/km, and the average terrestrial heat flux is 80.3 ± 4.9 mW/m2. In most locations, the ratio of crustal to mantle heat flow is below 1, signifying the dominance of the mantle heat source. The burial depth of the 150 °C isothermal surface ranges from 3.5 to 6.3 km, while the temperature at an 8 km depth is between 182.7 and 260.6 °C, averaging 238.8 ± 12.5 °C [33,34,35].
2.2. Thermo-Hydro-Mechanical Coupling Mathematical Model
2.2.1. Model Assumptions
To examine the thermo-hydro-mechanical coupling process in geothermal extraction, it is imperative to establish the pertinent partial differential control equations. This study expands on previous achievements and, by employing theories of geotechnical mechanics, seepage mechanics, and heat transfer, introduces a series of prudent assumptions to moderately simplify the governing equations [36,37,38,39]. Due to the small strain characteristics and slow evolution process under conventional operations, the skeleton deformation is assumed to be linearly elastic. Consequently, a quasi-static analysis is employed to make the microscopic heterogeneous reservoir macroscopically equivalent to a continuous porous medium; the viscous force of low-speed flow in pores is dominant, and the seepage process obeys Darcy’s law. Ignoring the fluid inertia term and multiphase effect, it is assumed to be single-phase saturated seepage. The temperature difference is limited and the medium is opaque. The thermophysical parameters (density, viscosity, etc.) of the fluid are approximately constant. The energy transfer only considers heat conduction and ignores heat radiation. The solid–liquid two-phase process in the pore scale satisfies the local heat balance.
2.2.2. Mathematical Model
- Control equation of stress field;
According to the assumption, the strain–displacement equation can be expressed as follows:
where is the strain tensor component and is the displacement component. By ignoring the inertial force, the equilibrium equation can be articulated as:
where is the stress tensor component and is the volume force component.
Assuming that the volumetric expansion or contraction due to temperature variation results solely in linear strain and that the thermal deformation is isotropic, the total strain field of the rock mass can be articulated as the aggregate of the thermal strain induced by temperature change and the strain resulting from stress.
where denotes the stress invariant, signifies the bulk modulus of the rock mass, represents the bulk modulus of the rock matrix, indicates the shear modulus, is the Poisson’s ratio, refers to the Biot coefficient, is the thermal expansion coefficient, denotes the fluid pressure, represents the temperature, and is the Kronecker delta, where i = j yields 1 and i ≠ j yields 0. The governing equations for the thermo-mechanical coupling deformation of the high-temperature rock mass are derived from the simultaneous Equations (1)–(3).
where indicates the impact of fluid seepage on rock mass deformation, while shows the effect of temperature variation on rock mass deformation.
- 2.
- Control equation of temperature field;
According to the basic law of thermodynamics, the temperature field control equation of a rock mass skeleton can be obtained:
where is the density of the rock mass skeleton, is the constant pressure specific heat capacity of the rock mass skeleton, is the bulk thermal expansion coefficient, is the thermal conductivity of the rock mass skeleton, and is the heat source strength of the rock mass skeleton. Because the porosity is , so , the above equation can be simplified as:
The temperature field control equation of the fluid is:
where is the fluid density, is the constant pressure specific heat capacity of the fluid, is the thermal conductivity of the fluid, and is the heat source strength of the fluid. Assuming that the solid and fluid achieve thermal equilibrium, the governing equations for the fluid temperature field within the thermal reservoir can be determined by integrating the previously described two equations.
The initial term on the left side of the equation represents the rate of change of the system’s internal energy; the subsequent term denotes the rate of change of thermal strain energy; the third term signifies the convection term; the fourth term indicates the heat conduction term; and the right side of the equation corresponds to the heat source term, .
- 3.
- Control equation of seepage field;
The mass balance equation of the fluid is as follows:
In the formula, represents the liquid density, denotes the Darcy velocity vector, and signifies the source and sink term of the fluid. Next, denotes the fluid mass per unit volume of rock mass, and its expression is . Finally, signifies porosity, correlated with the volume strain of the rock mass. Assuming the gravitational influence is negligible, Darcy’s law may be articulated as:
where pertains to fluid dynamic viscosity, while relates to permeability. By integrating Equations (9) and (10), the governing equation of the seepage field is represented as Equation (11), wherein denotes the coupling term:
2.3. Parameter Setting and Numerical Simulation Method
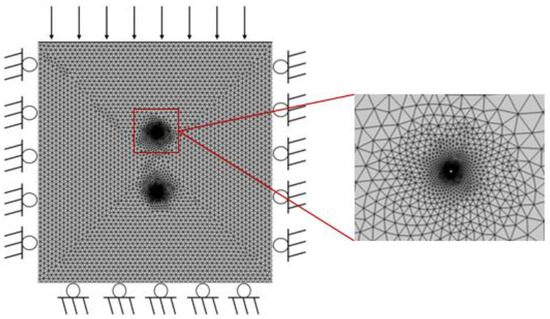
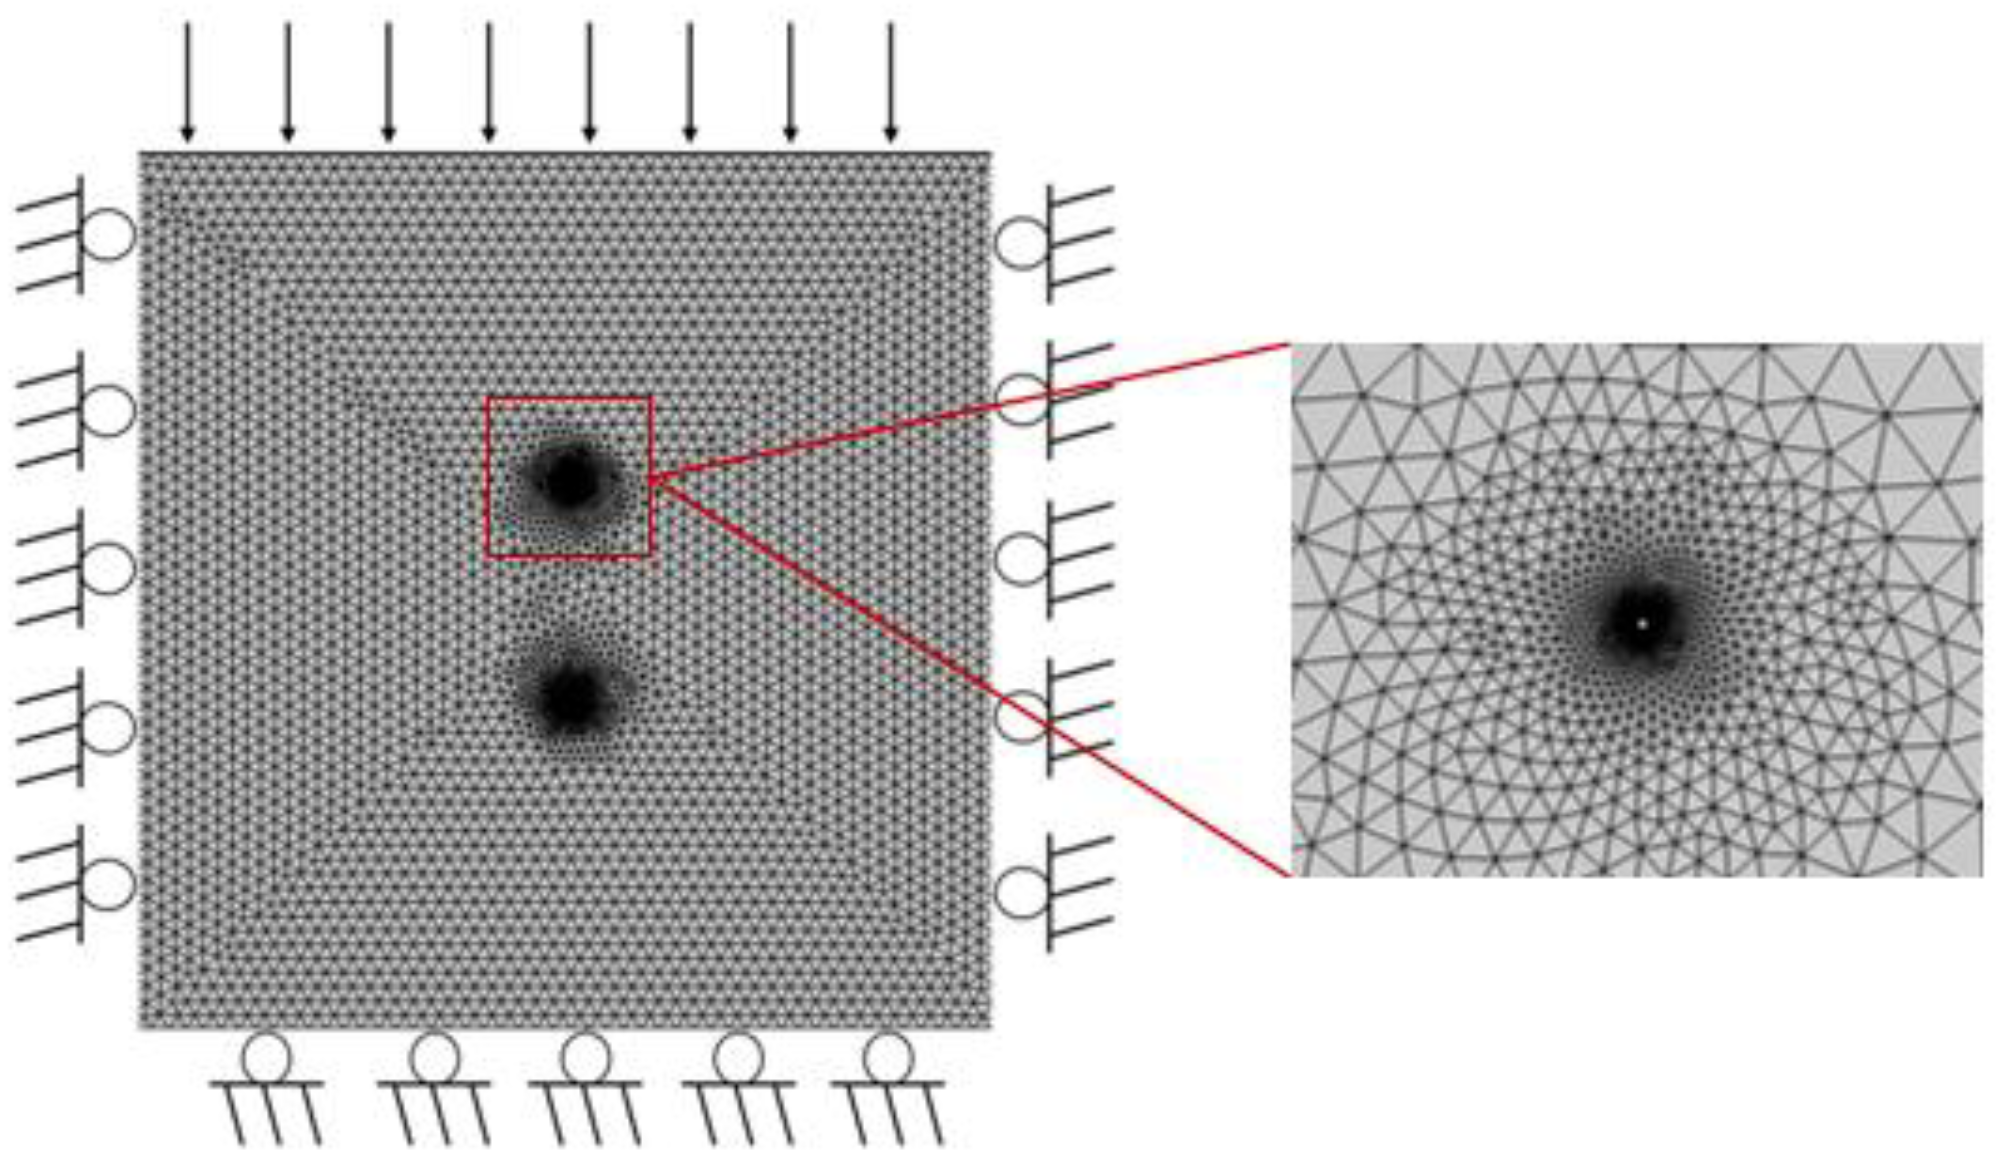
A two-dimensional plane model of 80 m × 80 m has been constructed utilizing the COMSOL Multiphysics platform; the spatial distribution of the generated mesh, including a local magnified view of the highly refined region, is illustrated in Figure 2. The radii of the injection well and the production well are each 0.1 m, located at coordinates (40, 30) at the bottom and (40, 50) at the top of the model, respectively. The model’s boundary conditions are defined as follows: the seepage field is classified as a non-flow boundary, the temperature field is regarded as an adiabatic boundary, an overburden pressure of 80 MPa is imposed at the top of the stress field, while the remaining three sides and the wellbore are constrained to fixed displacement. The specified hot dry rock exploration target area is located 8 km beneath the surface in the Huazhou-Huayin region, south of Weinan City, Shaanxi Province. The starting state parameters of the thermal reservoir are a temperature of 230 °C and a pressure of 24 MPa. The pertinent geological parameters surrounding the well in the numerical model pertain to the physical characteristics of the Gushi depression, specifically the thermophysical parameters of the formation in the Shaanxi region, as documented in the appendix of the “Technical regulation for medium deep geothermal buried pipe heating system” (DBJ61/T166-2020 [40]). The model’s primary calculation parameters are shown in Table 1, and the simulation scheme is depicted in Table 2.
Figure 2.
Geometric model.
Table 1.
Numerical simulation parameters.
Table 2.
Simulation development scheme.
The numerical simulation in this study was conducted using the commercial multiphysics simulation platform COMSOL Multiphysics (version 6.2). The computation was executed on a laptop equipped with an Intel(R) Core (TM) i7-11800H CPU and 2.48 GB of RAM, with a total computational time of approximately 140 s. The computational domain was discretized using an unstructured free triangular mesh, comprising a total of 11,140 elements. Relative to the 80 m domain scale, the minimum and maximum element sizes were 0.006 m and 1.6 m, respectively, yielding a mesh sensitivity ranging from 0.0075% to 2%. Mesh quality evaluations demonstrated a minimum element quality of 0.5622 and an average quality of 0.8964, ensuring sufficient computational accuracy. During the transient simulation, the solver dynamically adjusted the size of the time step based on a predefined tolerance. To verify time-step independence, a sensitivity test was performed by halving the maximum time step in the software. The resulting temperature and pressure curves at the production well almost perfectly overlapped with the original outputs with negligible errors, confirming that the current numerical settings provide a highly stable solution.
2.4. Evaluation Indicators
Recent studies demonstrate that high-efficiency geothermal systems typically display sustained operating stability, increased output temperatures, and enhanced heat extraction efficiency [41]. This study selected several characteristics, such as geothermal system running length, heat breakthrough time, heat extraction rate, and cumulative extracted heat, to comprehensively evaluate the heat extraction capacity of the geothermal system model. The operational cycle of the geothermal extraction system is sometimes characterized as the economic lifespan of the geothermal well in geothermal development. Research undertaken by both domestic and international scholars reveals that when the temperature of the mining fluid declines to 70–80% of the original reservoir temperature, the system’s economic benefits will diminish below the development investment. It is advisable to cease mining operations or seal the well at this juncture [42]. This study identifies 161 °C as the temperature decline threshold; specifically, production will halt when the outlet temperature of the well reaches 70% of the reservoir’s initial temperature of 230 °C. The thermal breakthrough time of a geothermal system refers to the period necessary for the thermal fluid, after stable production, to decrease by 1 °C. The heat extraction rate is dictated by the temperature differential between the heat of the extracted fluid and the injected fluid. The procedure for computation is as follows:
In Equation (12), is the temperature of the produced fluid and is the temperature of the injected fluid.
3. Calculation Results and Discussion
3.1. Effect of Injection–Production Pressure Difference on Thermal Reservoir
The extraction of geothermal resources modifies the pressure parameters of injection and production wells, hence altering the stress field distribution inside the geothermal reservoir, which directly affects the system’s operational efficiency. In practical engineering, engineers frequently modify the pressure of injection and production wells in accordance with production dynamics. This section will analyze the effects of fluctuations in the differential pressure gradient between injection and production wells, as well as reservoir pressure, on geothermal extraction. The precise parameter configurations are given in Scheme 1 of Table 2. In this simulation, the injection temperature is set at 20 °C, with water functioning as the working medium for heat extraction. For the sake of clarity, these three scenarios are designated as a pressure difference of 1 MPa, a pressure difference of 4 MPa, and a pressure difference of 7 MPa, respectively.
3.1.1. Variation of Stress Field
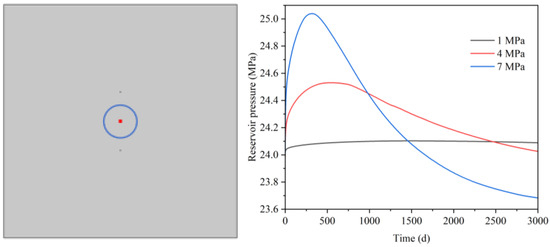
Figure 3 illustrates the pressure–time curve at the geometric center point (40, 40) of the model, situated exactly at the midway of the injection–production well, for varying injection–production pressure differentials. Geothermal energy within the thermal reservoir primarily resides in the high-temperature rock mass located between the injection and production wells; hence, the data from the monitoring point possess a degree of representativeness. Figure 3 illustrates that the reservoir pressure undergoes a clear two-phase progression: a fast initial increase succeeded by a steady decrease. Throughout the injection phase, pressure progressively accumulates prior to entering a decay phase. A comparison of the curves under varying pressure differentials indicates that, with a high injection–production pressure differential of 7 MPa, the attenuation range of reservoir pressure reaches a maximum of 1.34 MPa. Conversely, the effect of a low injection–production pressure differential of 1 MPa on reservoir pressure remains relatively stable at approximately 0.1 MPa.
Figure 3.
The change law of reservoir pressure at the midpoint (40, 40) of injection–production wells under different pressure differences.
3.1.2. Permeability Change
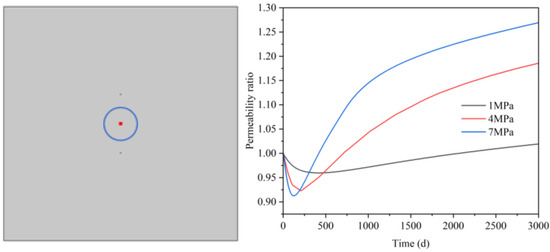
Figure 4 illustrates the permeability ratio versus time curves at the geometric center point (40, 40) of the reservoir under varying injection–production pressure settings. The figure demonstrates that the permeability trend initially lowers and then increases: during the initial phase, permeability experiences a modest decline. Upon entering the second stage, it exhibits a persistent upward trajectory. The results in the figure indicate that at 3000 days, the permeability ratio for pressure differentials of 1 MPa and 7 MPa increased from 1.02 to 1.27, representing an approximate rise of 24.51%.
Figure 4.
The change law of permeability at the midpoint (40, 40) of injection–production wells under different pressure differences.
Two principal factors influence the modification of reservoir permeability during geothermal extraction. Firstly, the continuous permeation of the low-temperature working and induces elastic deforma fluid induces the hot reservoir of the reservoir rock skeleton, subsequently leading to a reduction in volume. This stress generates modifications in the pore structure, evidenced by increased pore connectivity and greater effective porosity. Secondly, the elevated pressure differential sustained within the system enhances the migration efficiency of the working medium. Expanding the contact range with the reservoir rock mass enhances permeability under identical temporal conditions. The combined effect of these two processes leads to a continuous enhancement of the permeability of thermal reservoirs. At the conclusion of the second stage, as shown in Figure 4, the variation of permeability under distinct pressure circumstances is not uniform. Figure 4 illustrates that the alteration in reservoir permeability significantly varies during the course of changes in system pressure differentials. Upon the application of a pressure differential of 7 MPa, the permeability ratio curve first reaches a steady phase. The permeability ratio with a pressure differential of 4 MPa progressively reaches a steady phase. Nevertheless, at a low pressure differential of 1 MPa, the permeability ratio has not exhibited significant convergence. The magnitude of the pressure differential both influences the extent of the transient permeability and significantly affects the duration needed to stabilize the permeability. The duration required for permeability to reach a stable state decreases as the pressure differential increases; however, the stable permeability remains at an increased level.
3.1.3. Temperature Field Changes
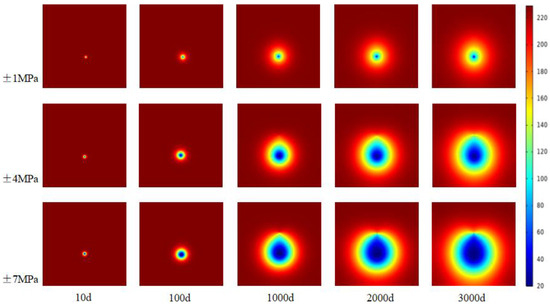
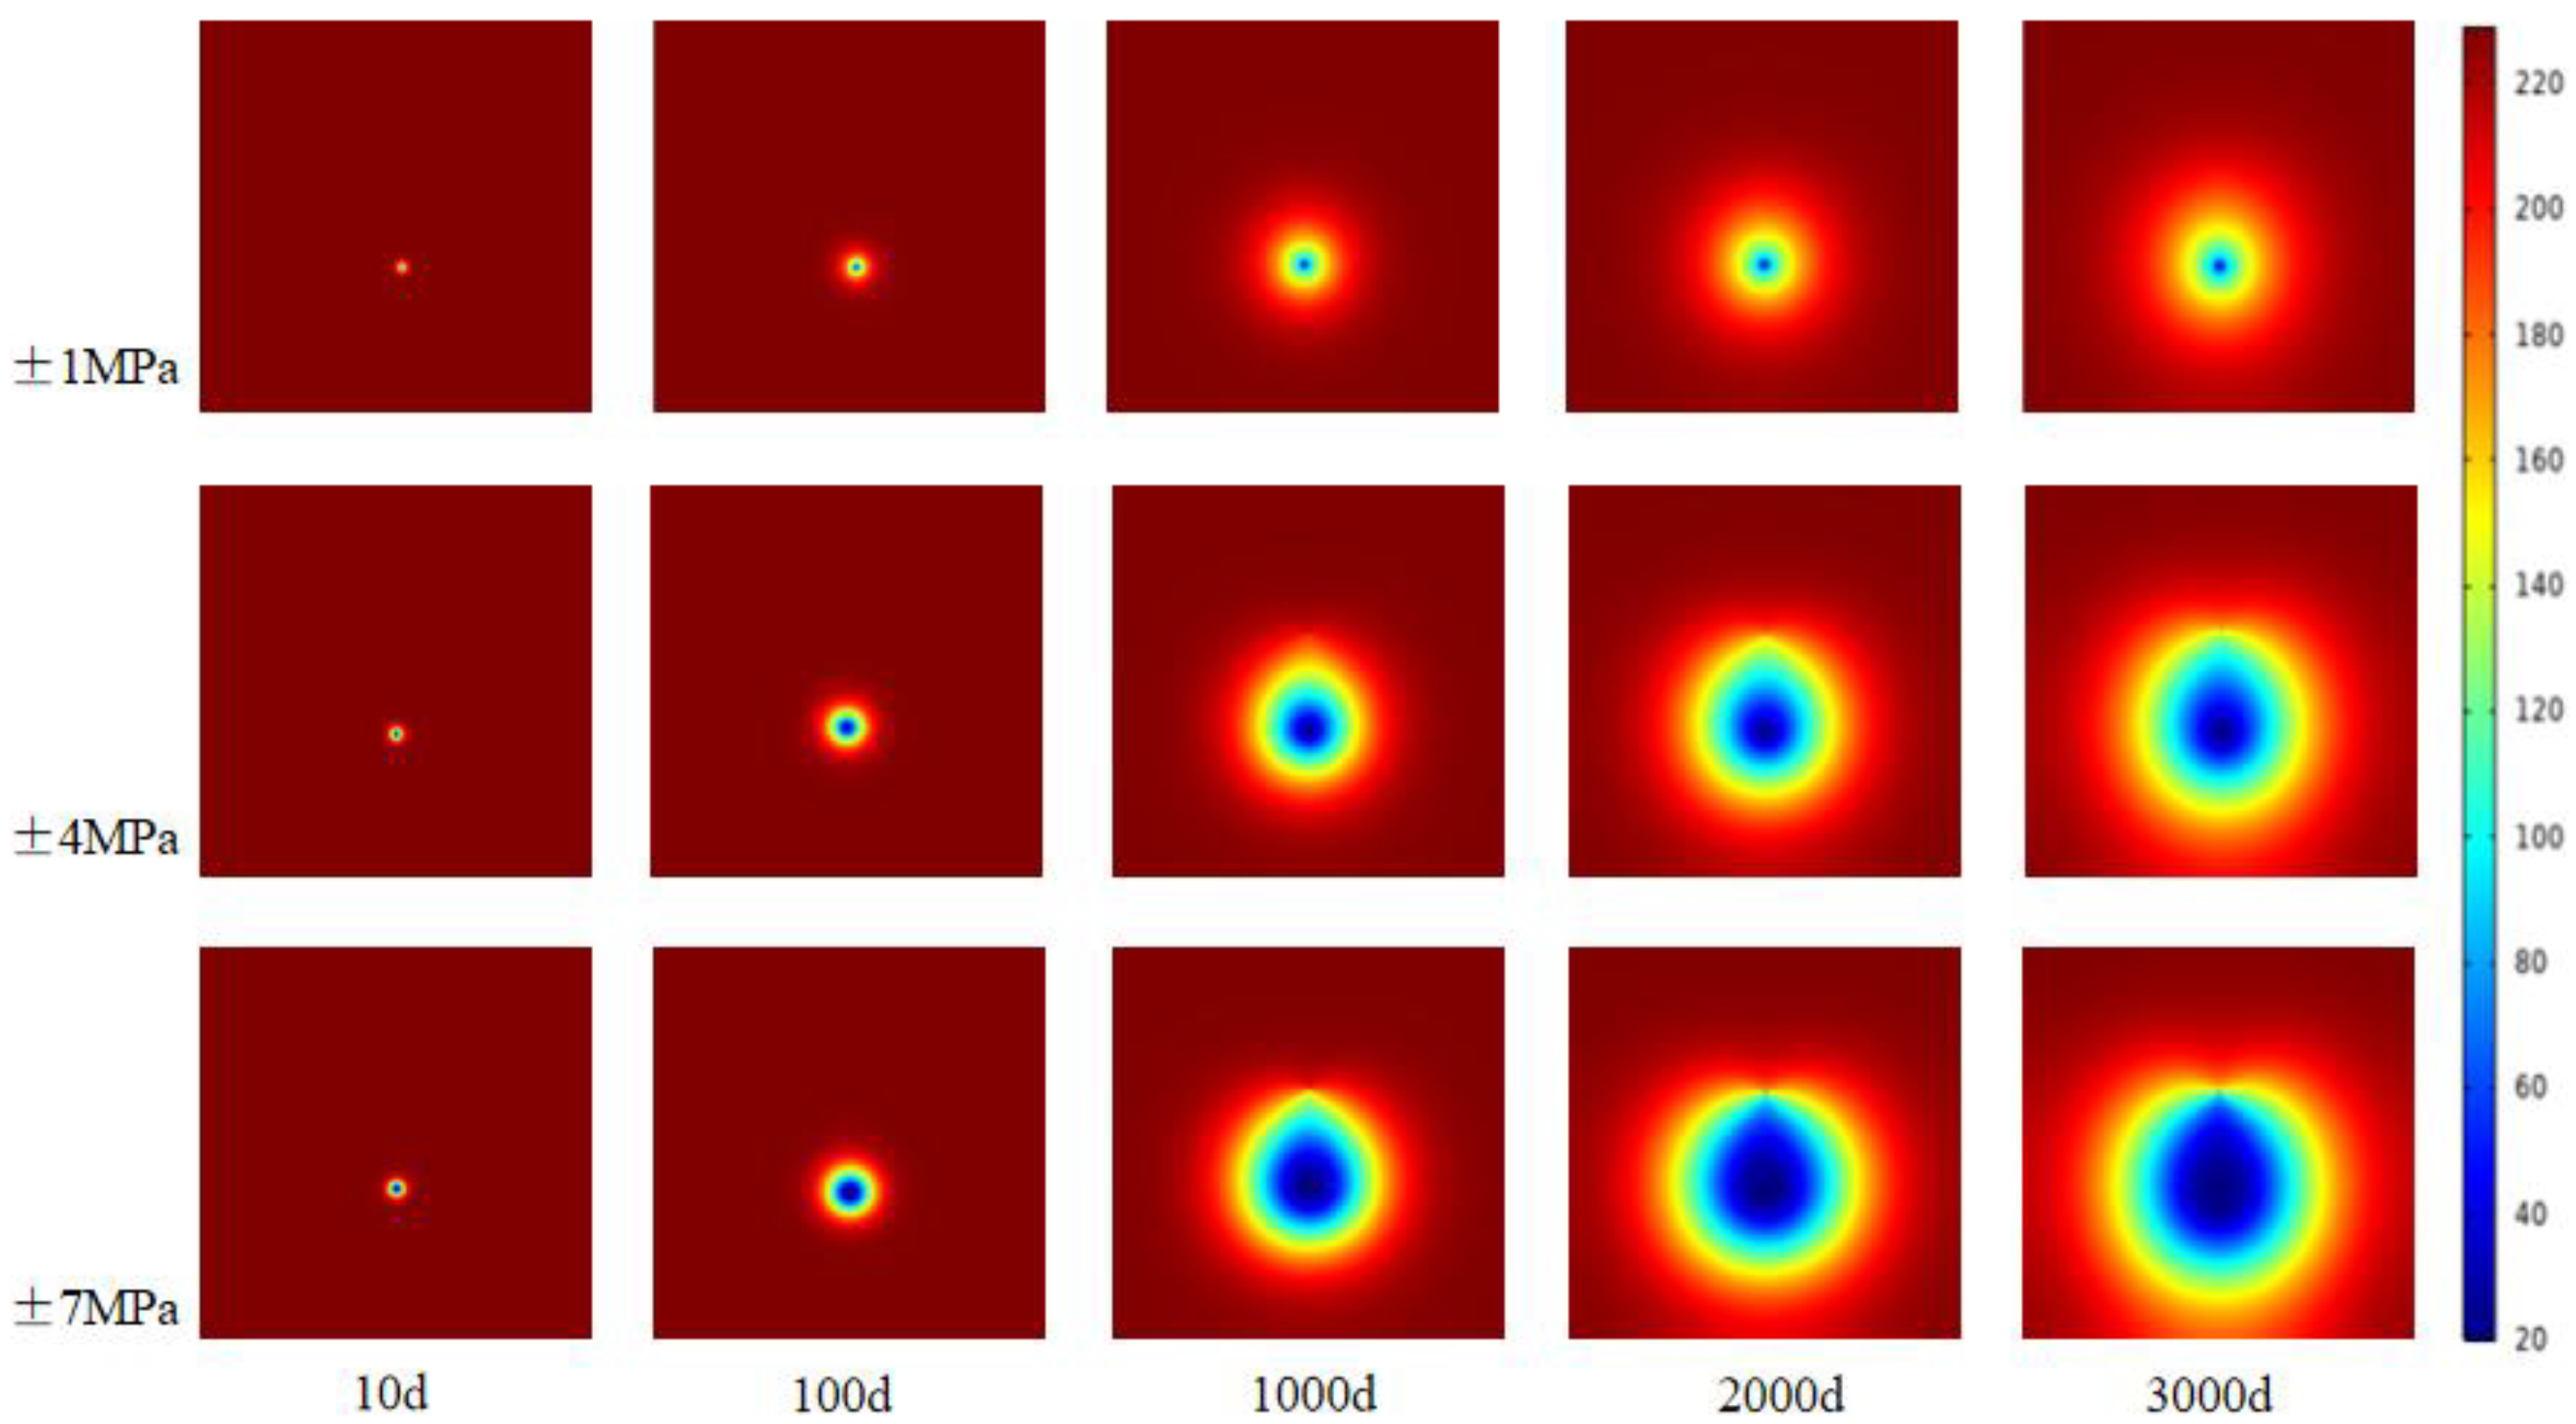
Variations in the alteration of the reservoir temperature field under distinct injection–production pressure settings are illustrated in Figure 5. As the pressure differential between the injection well and the production well is incrementally elevated from 1 MPa to 7 MPa, the thermal impact range of the reservoir progressively expands. In this diagram, red denotes the high-temperature region, while blue signifies the low-temperature region. It is noted that an increase in the pressure differential correlates with a greater temperature variation over the same time interval.
Figure 5.
Temperature distribution nephogram of thermal reservoir under different injection–production pressure settings.
A “finger-like breakthrough” seepage phenomenon transpires between the injection well and the production well, signifying that the low-temperature “thermal interference front” will advance rapidly along a specified path. This phenomenon arises due to the fluid’s adherence to the “high seepage line” principle within the dual-well arrangement. Upon entering the reservoir through the injection well, the heat-producing fluid will preferentially follow the path of least resistance, thereby creating the primary channel, which leads to a significant temperature gradient anomaly between the production well and the injection well. Figure 5 depicts notable fluctuations in the temperature distribution of the thermal reservoir under varying pressure differential conditions. When the pressure differential within the system is consistently maintained at 1 MPa, the isotherm in the reservoir is concentrically arranged around the injection well as the focal point. The 200 °C isotherm expands 10 m to the periphery in approximately 1000 days. Upon increasing the pressure differential to 7 MPa, the isotherm exhibits a distinct “finger-like” morphology. The time required for the expansion of the 200 °C isotherm boundary is decreased to approximately 100 days, suggesting that the extent of the low-temperature zone within the thermal reservoir is predominantly affected by the pressure differential between the injection and production wells. Effective regulation of the pressure differential between the wells can mitigate the temperature decline towards the “thermal interference front” induced by the “finger-like” phenomenon.
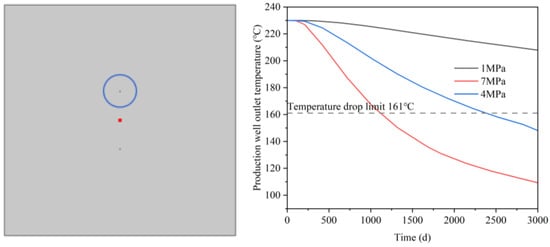
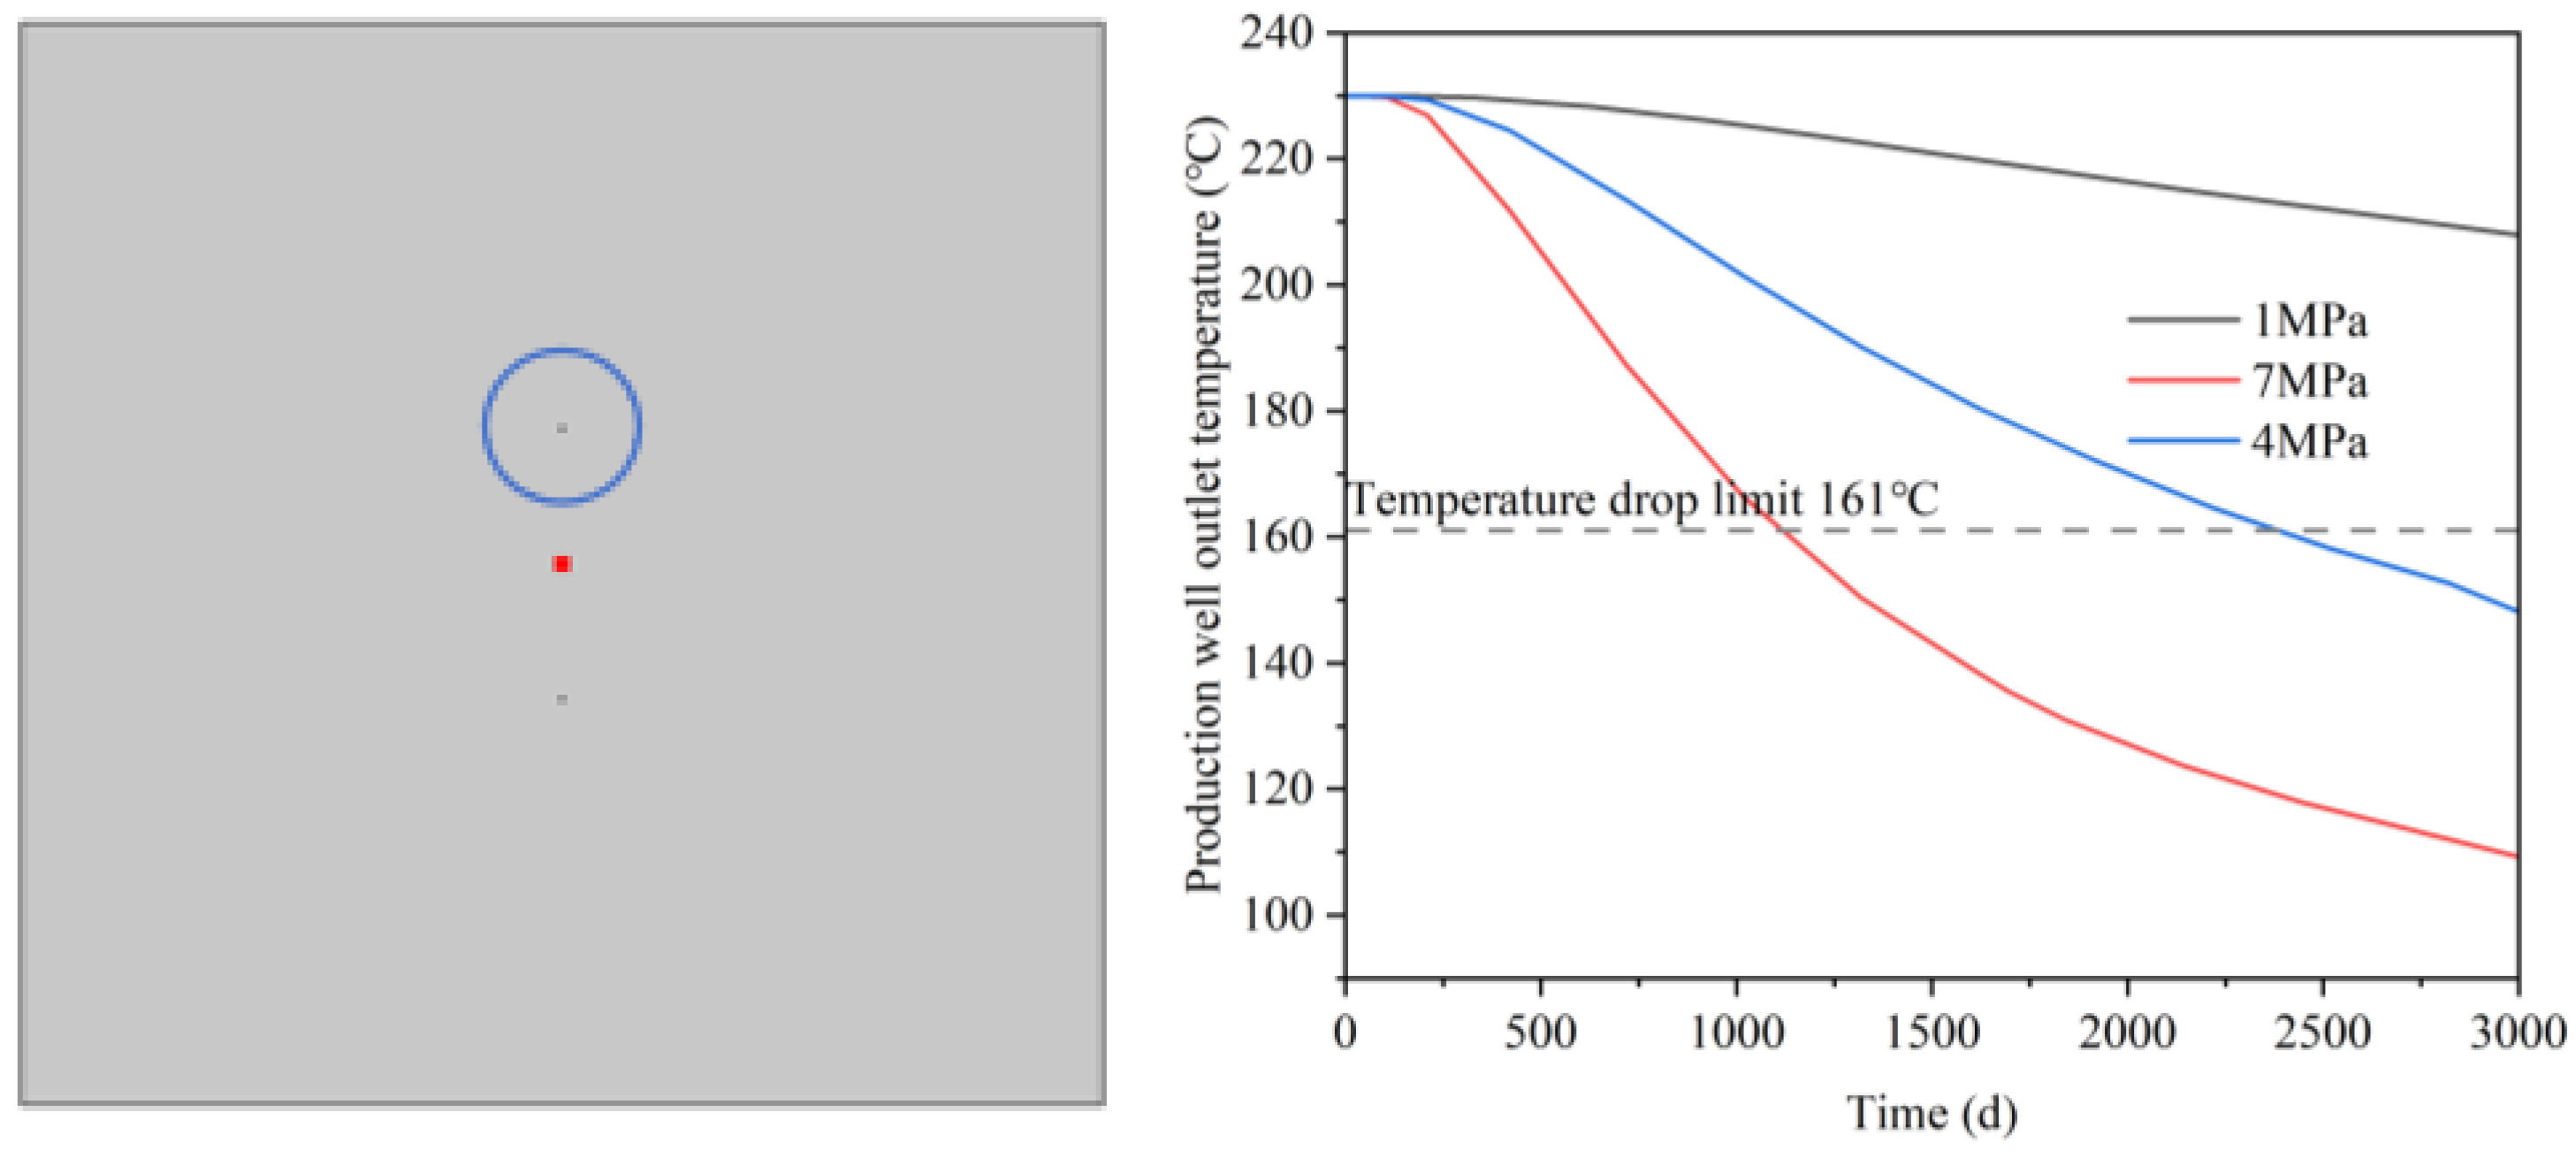
The temperature–time curve of the production well outlet, as illustrated in Figure 6, indicates that the temperature fluctuations during geothermal extraction are classified into two periods. In the initial phase of exploitation, the wellhead temperature is maintained at the original thermal reservoir level, signifying a stable period of geothermal energy extraction. As geothermal extraction progresses, the occurrence of thermal breakthrough increasingly manifests, resulting in a constant decline in output temperature. When the pressure differential between injection and production is maintained at 1 MPa, the rate of temperature decline is very gradual. When the pressure differential is elevated to 7 MPa, the extraction temperature of the model on the 3000th day is only 110 °C, roughly half of the temperature recorded at 1 MPa. The disparity in pressure difference between injection and production wells considerably affects the rate of change in outlet temperature of production wells. The formation mechanism of the previously stated phenomena primarily has two components. The increase in pressure differential leads to a higher seepage rate of the heat transfer medium. A significant pressure differential between the injection well and the production well induces fluid to flow into the production well at an increased rate, causing a rapid decline in the temperature of the adjacent rock layer, which ultimately leads to a notable decrease in the outlet temperature of the mining fluid. An elevation in injection pressure will lead to a proportional rise in reservoir pore pressure. If the original stress field of the reservoir remains relatively stable, a rise in pore pressure will consequently lead to a decrease in effective stress. The alteration of stress conditions will facilitate the elastic expansion of the rock matrix, enhance reservoir porosity and fracture network connection, improve permeability, expedite the migration rate of the heat recovery medium, and result in a reduction of the outlet temperature of the mining wells.
Figure 6.
The change curve of outlet temperature of production well with time under different pressure settings.
3.1.4. Geothermal Production
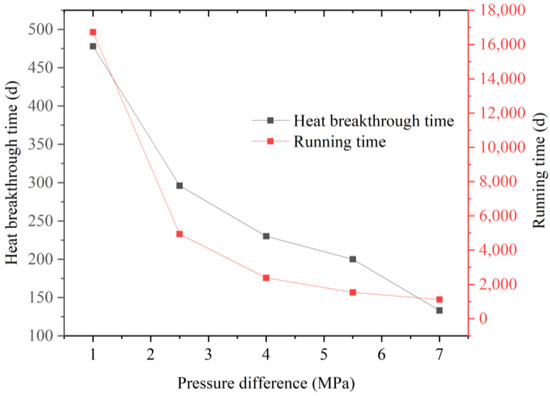
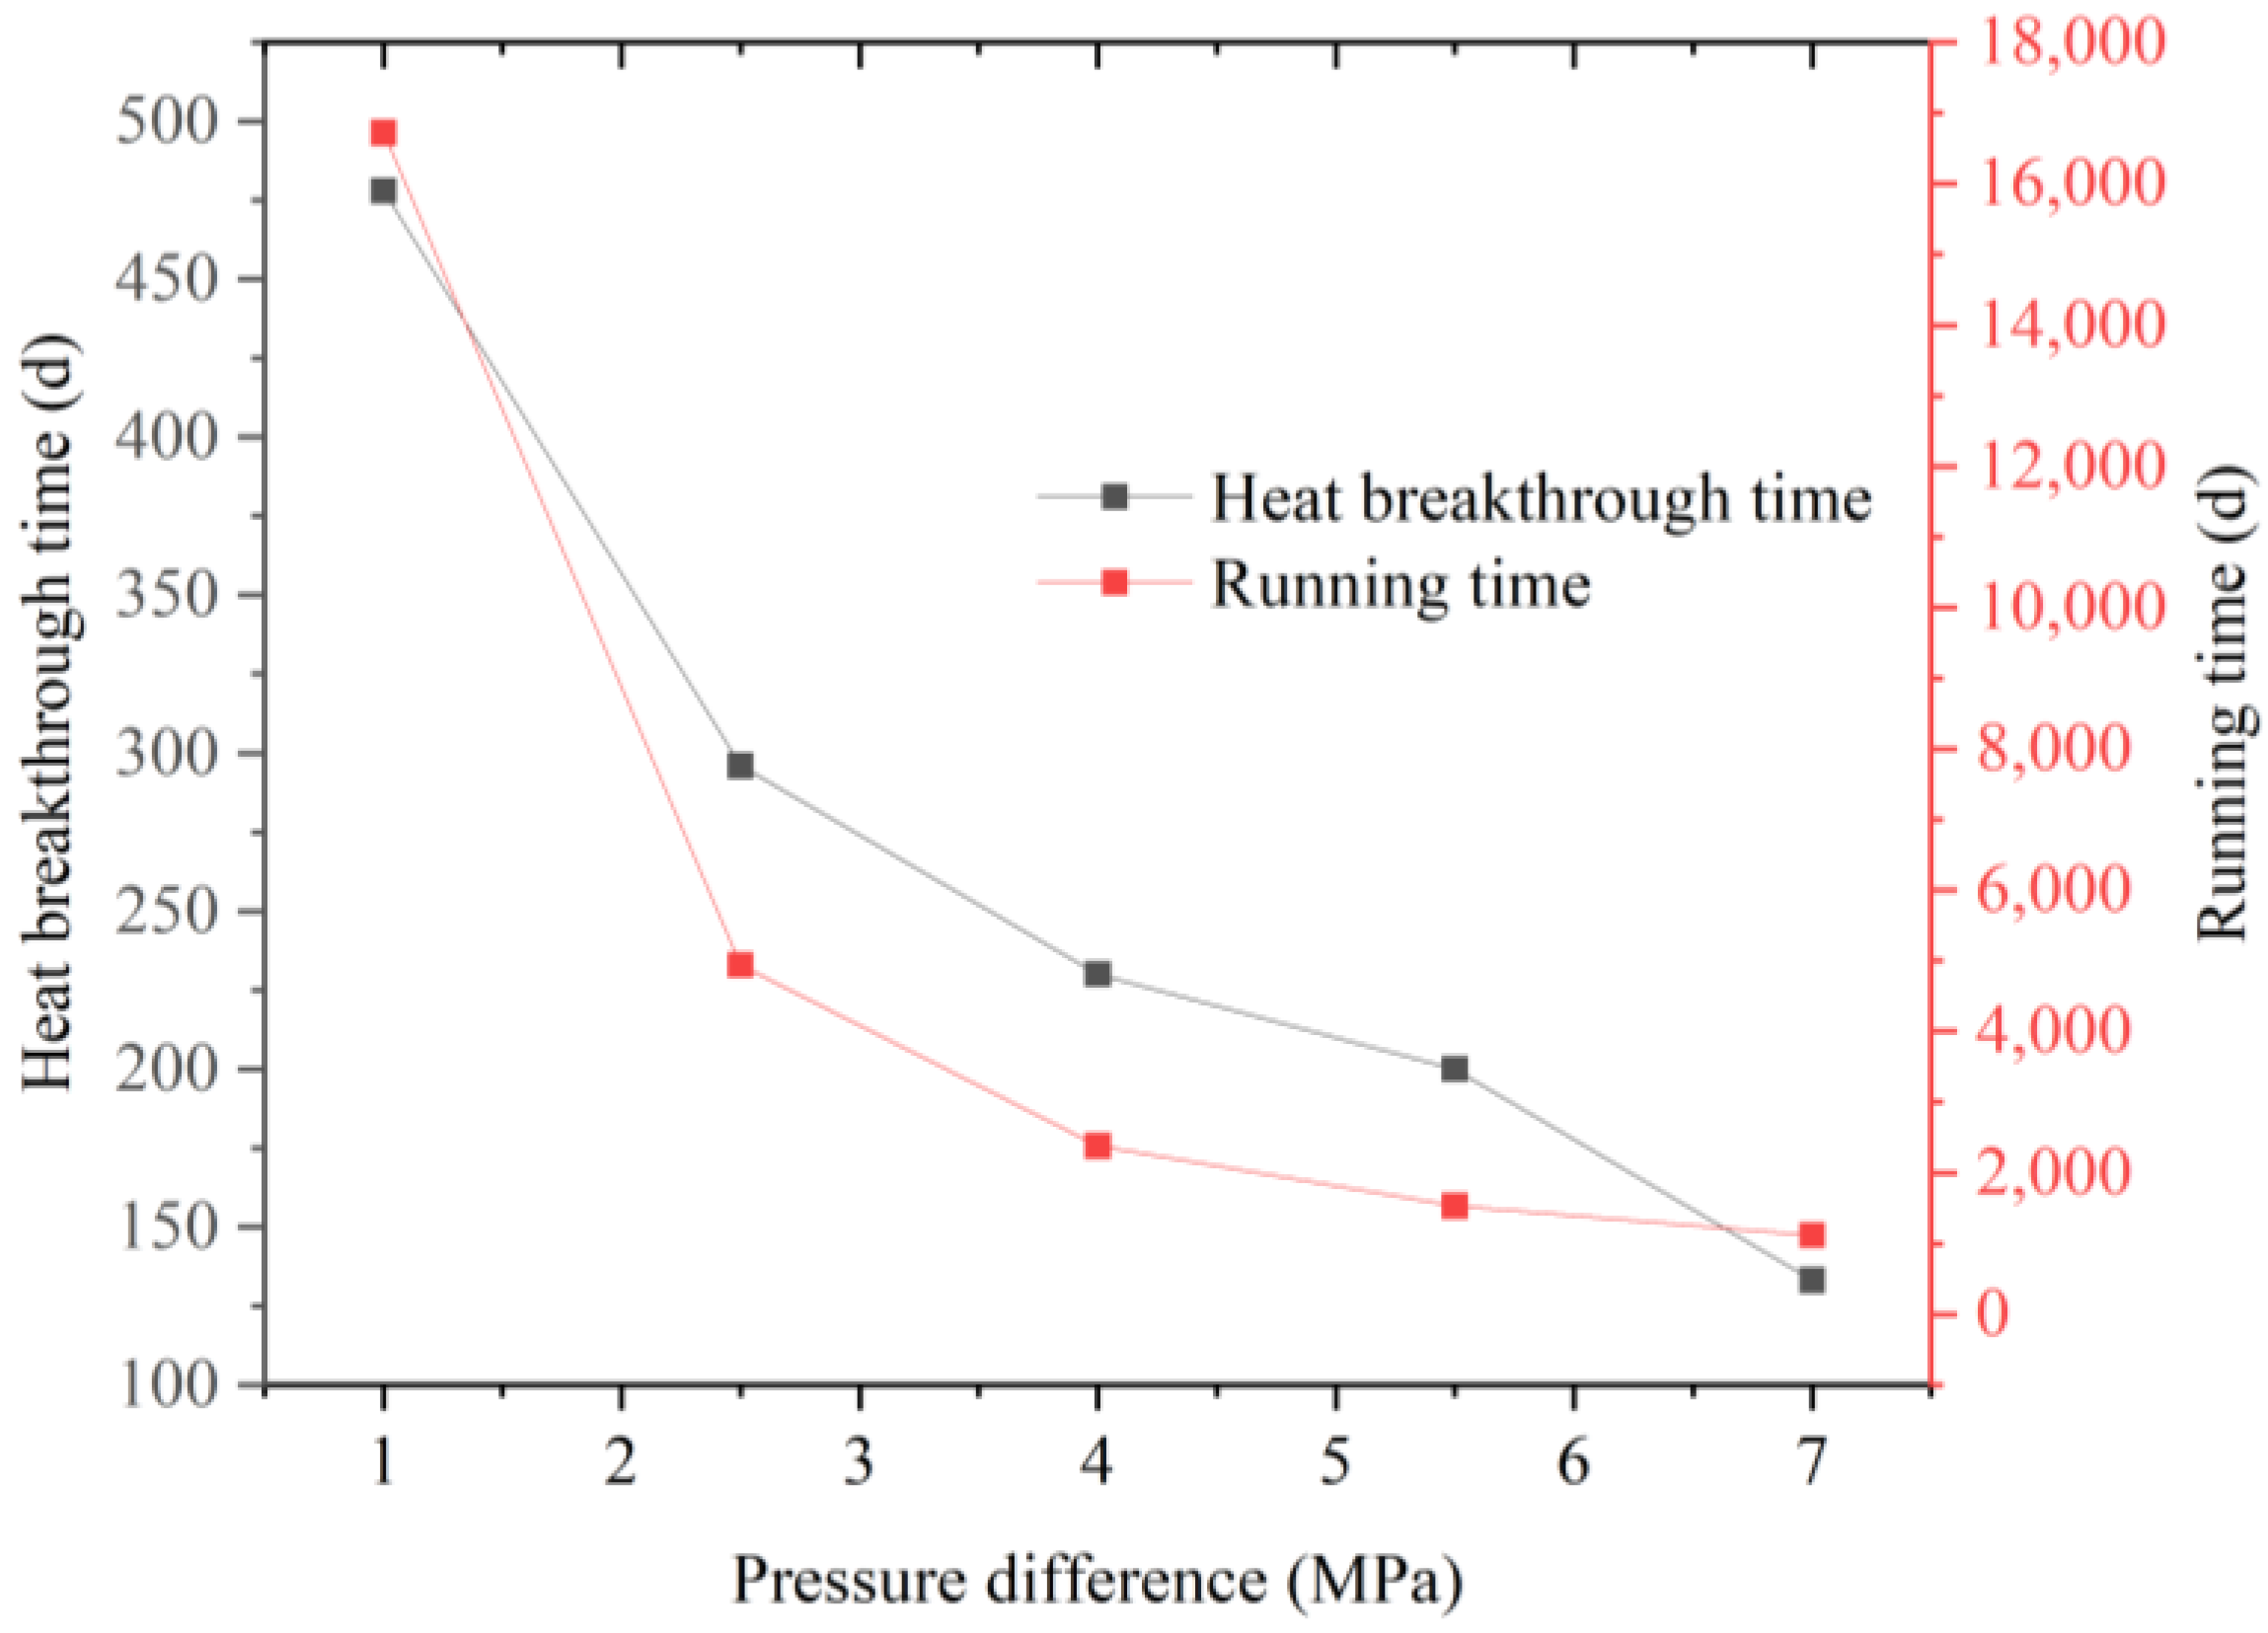
Assuming other parameters remain constant, the pressure differential between the injection–production well pressure and the reservoir pressure is varied, and the impact of this pressure differential on the geothermal well system is simulated at 1 MPa, 2.5 MPa, 4 MPa, 5.5 MPa, and 7 MPa. In conjunction with the temperature drop boundary illustrated in Figure 6 and Figure 7, it can be determined that for a pressure differential of 1 MPa, the thermal breakthrough time is 478 days, while the operational duration of the geothermal well is 16,723 days. At a pressure differential of 4 MPa, the thermal breakthrough duration is 230 days, while the operational period of the geothermal well is 2380 days. At a pressure differential of 7 MPa, the thermal breakthrough length is 130 days, whereas the operational period of the geothermal well is 1120 days. The results indicate that the pressure differential between the injection–production well and the reservoir significantly affects the heat transfer process of the geothermal system. An increase in the pressure difference between the injection–production well and the reservoir leads to an elevated seepage rate of fluid within the thermal reservoir, hence enhancing the convective heat transfer rate between the rock mass and the circulating fluid. Under conditions of increased injection–production pressure differentials, the thermal breakthrough time will be significantly diminished, thereby reducing the production cycle of geothermal wells.
Figure 7.
Thermal breakthrough time and operation time of geothermal system under different pressure settings.
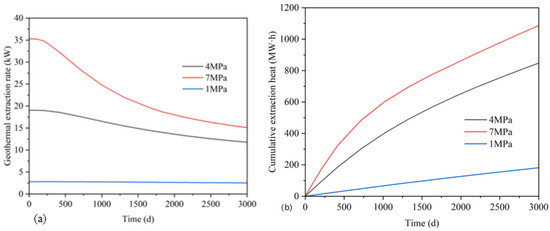
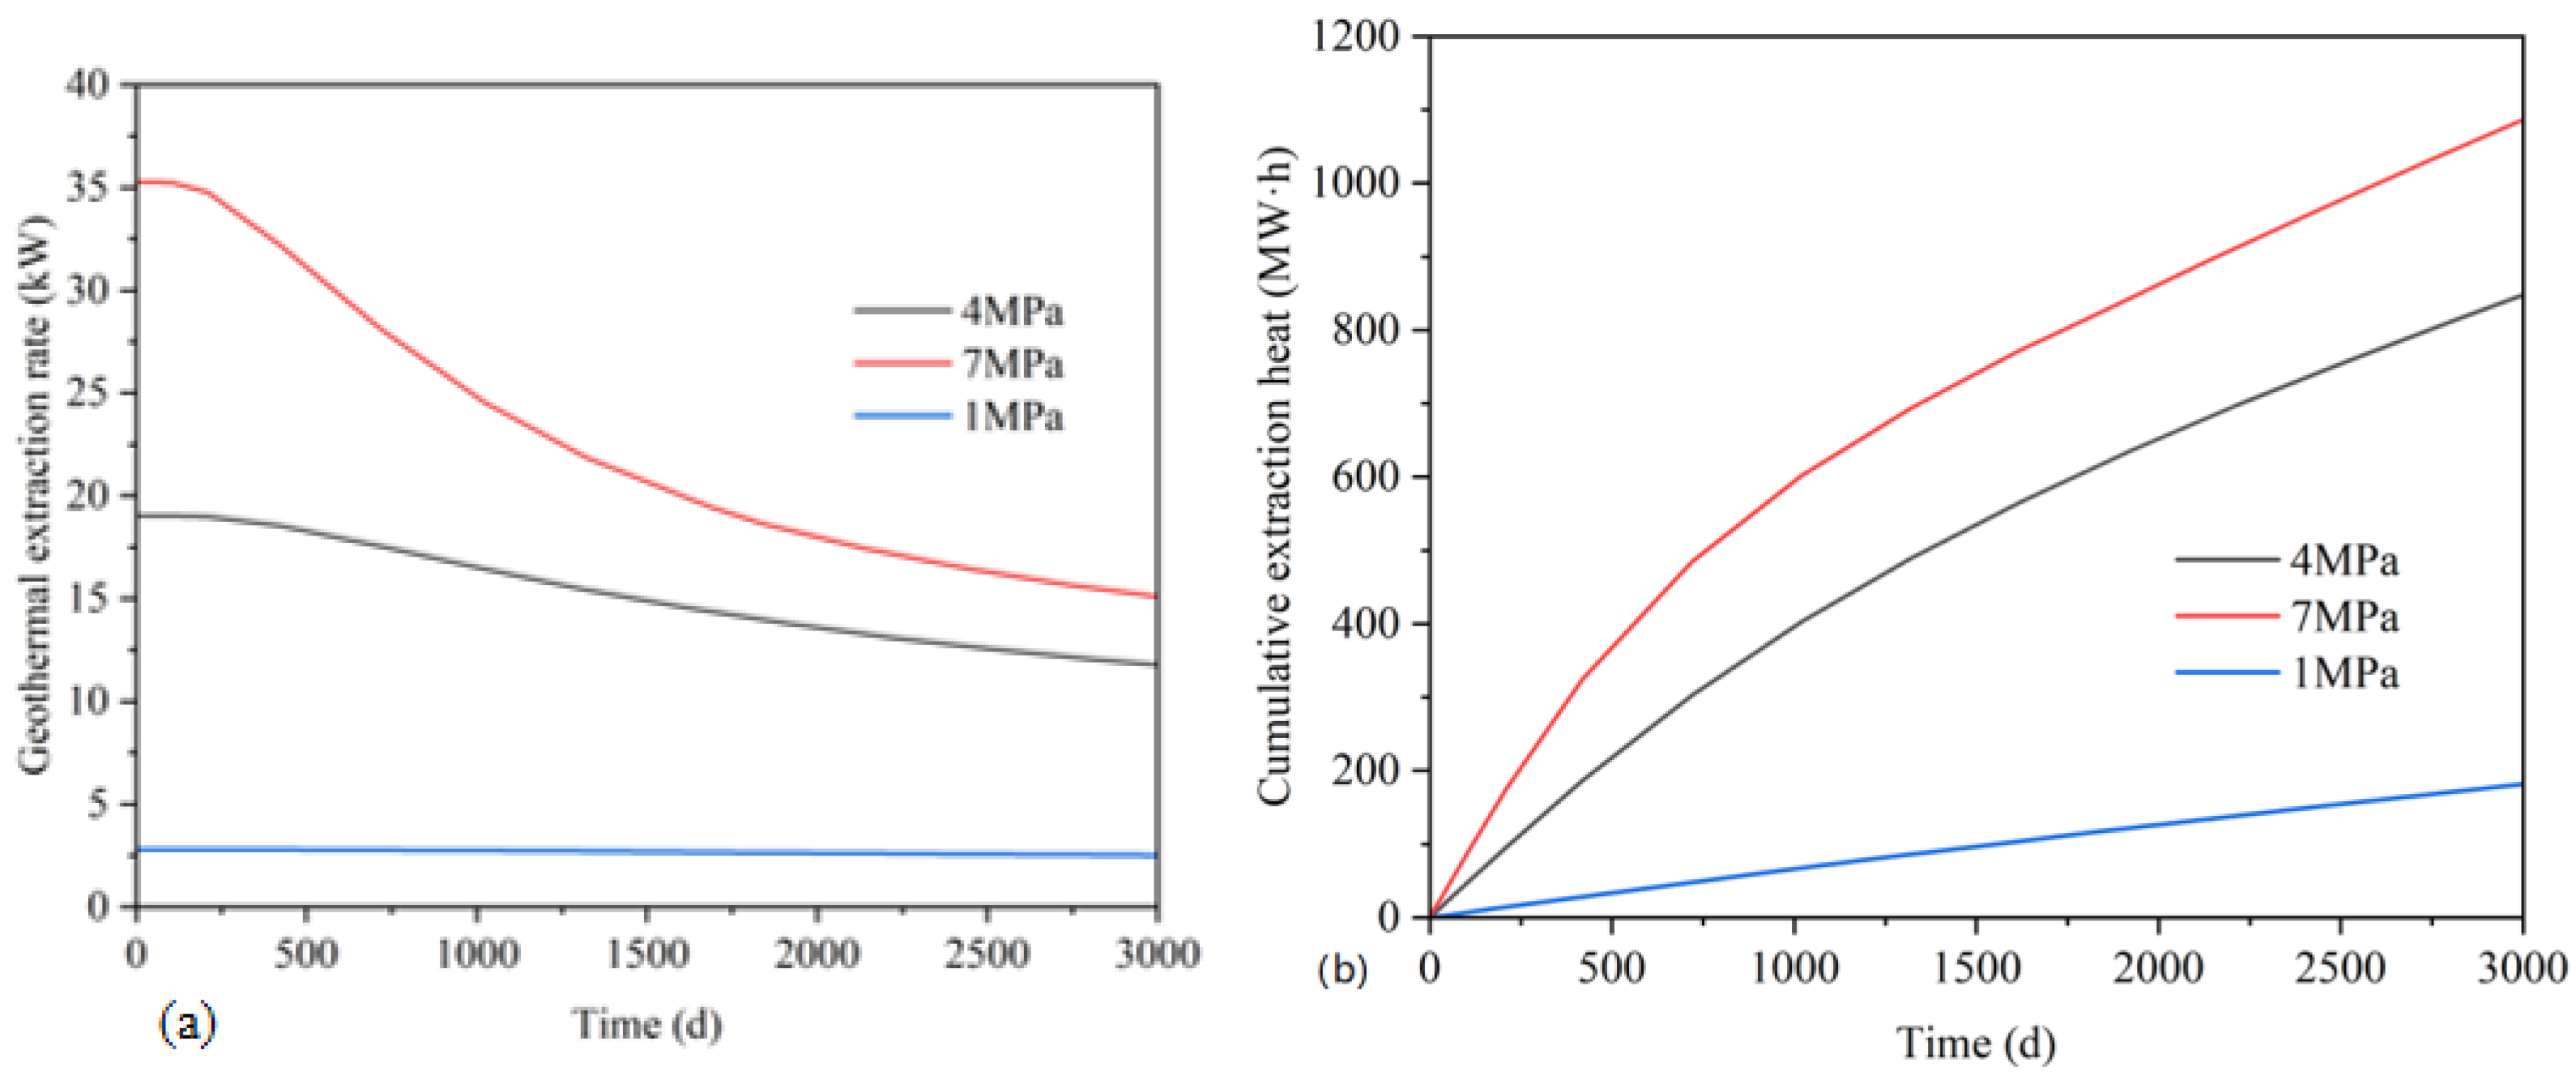
A substantial disparity in the geothermal extraction rate across varying pressure settings over the 3000-day numerical simulation period is shown in Figure 8a. At a pressure differential of 7 MPa, the attenuation rate of geothermal extraction is markedly greater than that at a 4 MPa pressure difference, while the attenuation rate at 1 MPa is the lowest. The geothermal extraction rate consistently rises with an increase in the pressure differential; thus, a greater pressure difference correlates with enhanced geothermal extraction efficiency. After 100 days of operation, the geothermal extraction at pressure differentials of 1 MPa and 7 MPa yielded 2.81 kW and 35.24 kW, respectively, with a difference of 12.54 times between the two values. After 3000 days of continuous mining, the geothermal extraction power diminished to 2.52 kW and 16.32 kW, respectively, exhibiting a disparity of 6.03 times. The cumulative extracted geothermal data in Figure 8b indicate that a greater pressure differential correlates with an increased cumulative extraction of geothermal energy. During the 3000-day numerical simulation period, the extraction heat at a pressure differential of 1 MPa was 180.86 MWh; however, at a pressure differential of 7 MPa, it attained 1090.04 MWh, making the latter 6.03 times greater than the former. Consequently, despite the geothermal extraction rate diminishing more rapidly under large pressure differentials, its overall heat production during the extraction cycle remained superior to that under low pressure differentials. It can be concluded that in geothermal exploitation, a substantial pressure differential between the injection and production wells, relative to reservoir pressure, can markedly enhance the heat recovery efficiency of geothermal wells; however, an excessive pressure differential will considerably reduce the heat recovery duration of these wells. Consequently, an appropriate pressure differential must be determined to optimize the economic advantages of geothermal wells.
Figure 8.
Variation of geothermal extraction rate and cumulative geothermal extraction under different pressure settings. (a) Geothermal extraction rate. (b) Cumulative extraction of geothermal energy.
3.2. Effect of Injection Temperature on Thermal Reservoir
Diverse injection temperatures provide different effects on geothermal extraction. This section analyzes the impacts on the geothermal system caused by fluctuations in injection temperature. According to the selection results of the pressure differential in the previous section, the pressure difference between the injection well and the production well, along with the initial reservoir pressure in all simulations in this section, is set at 4 MPa, utilizing water as the heat recovery working medium.
3.2.1. Change of Stress Field
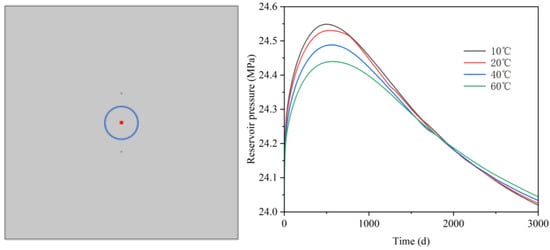
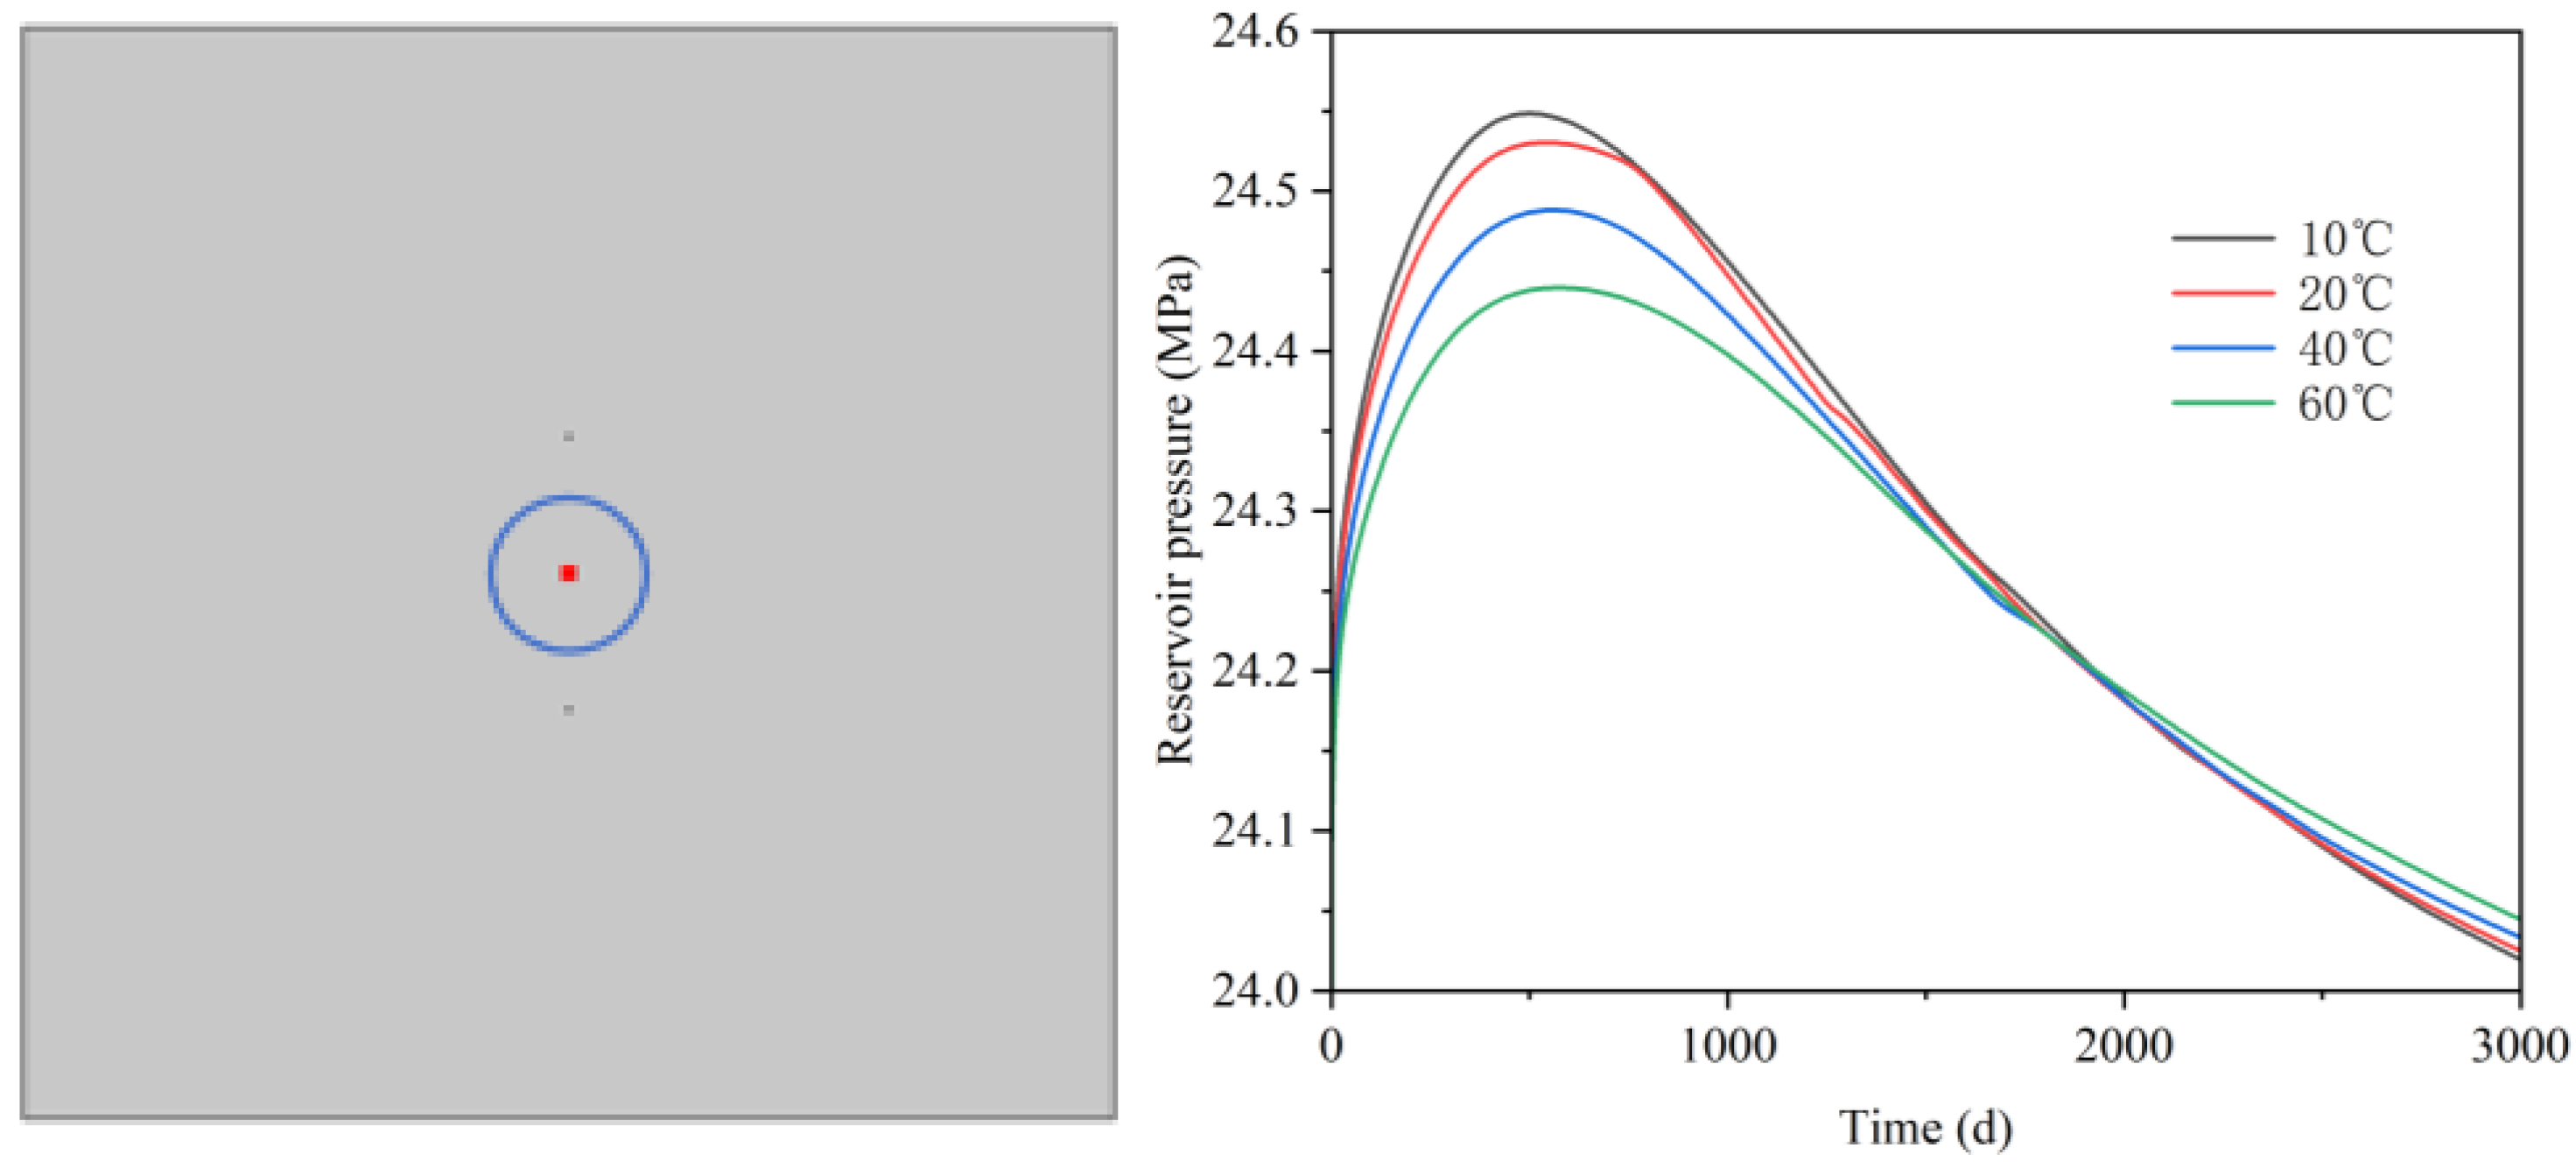
As shown in Figure 9, the increasing injection temperature does not change the trend of rock stress rising first and then falling, but it does change the size of the peak stress. As the injection temperature rises from 10 °C to 60 °C, the peak stress diminishes from 0.56 MPa to 0.45 MPa. The latter portion of the graph indicates that after 1500 days, the reservoir pressure at varying injection temperatures exhibits minimal variation. This suggests that, during the extended operation of the geothermal system, fluctuations in injection temperature have a negligible effect on changes in reservoir pressure.
Figure 9.
The variation of reservoir pressure at the midpoint (40, 40) of injection–production wells at different injection temperatures.
3.2.2. Permeability Change
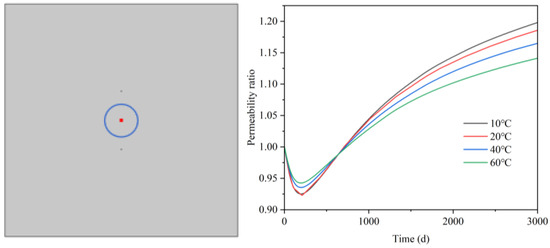
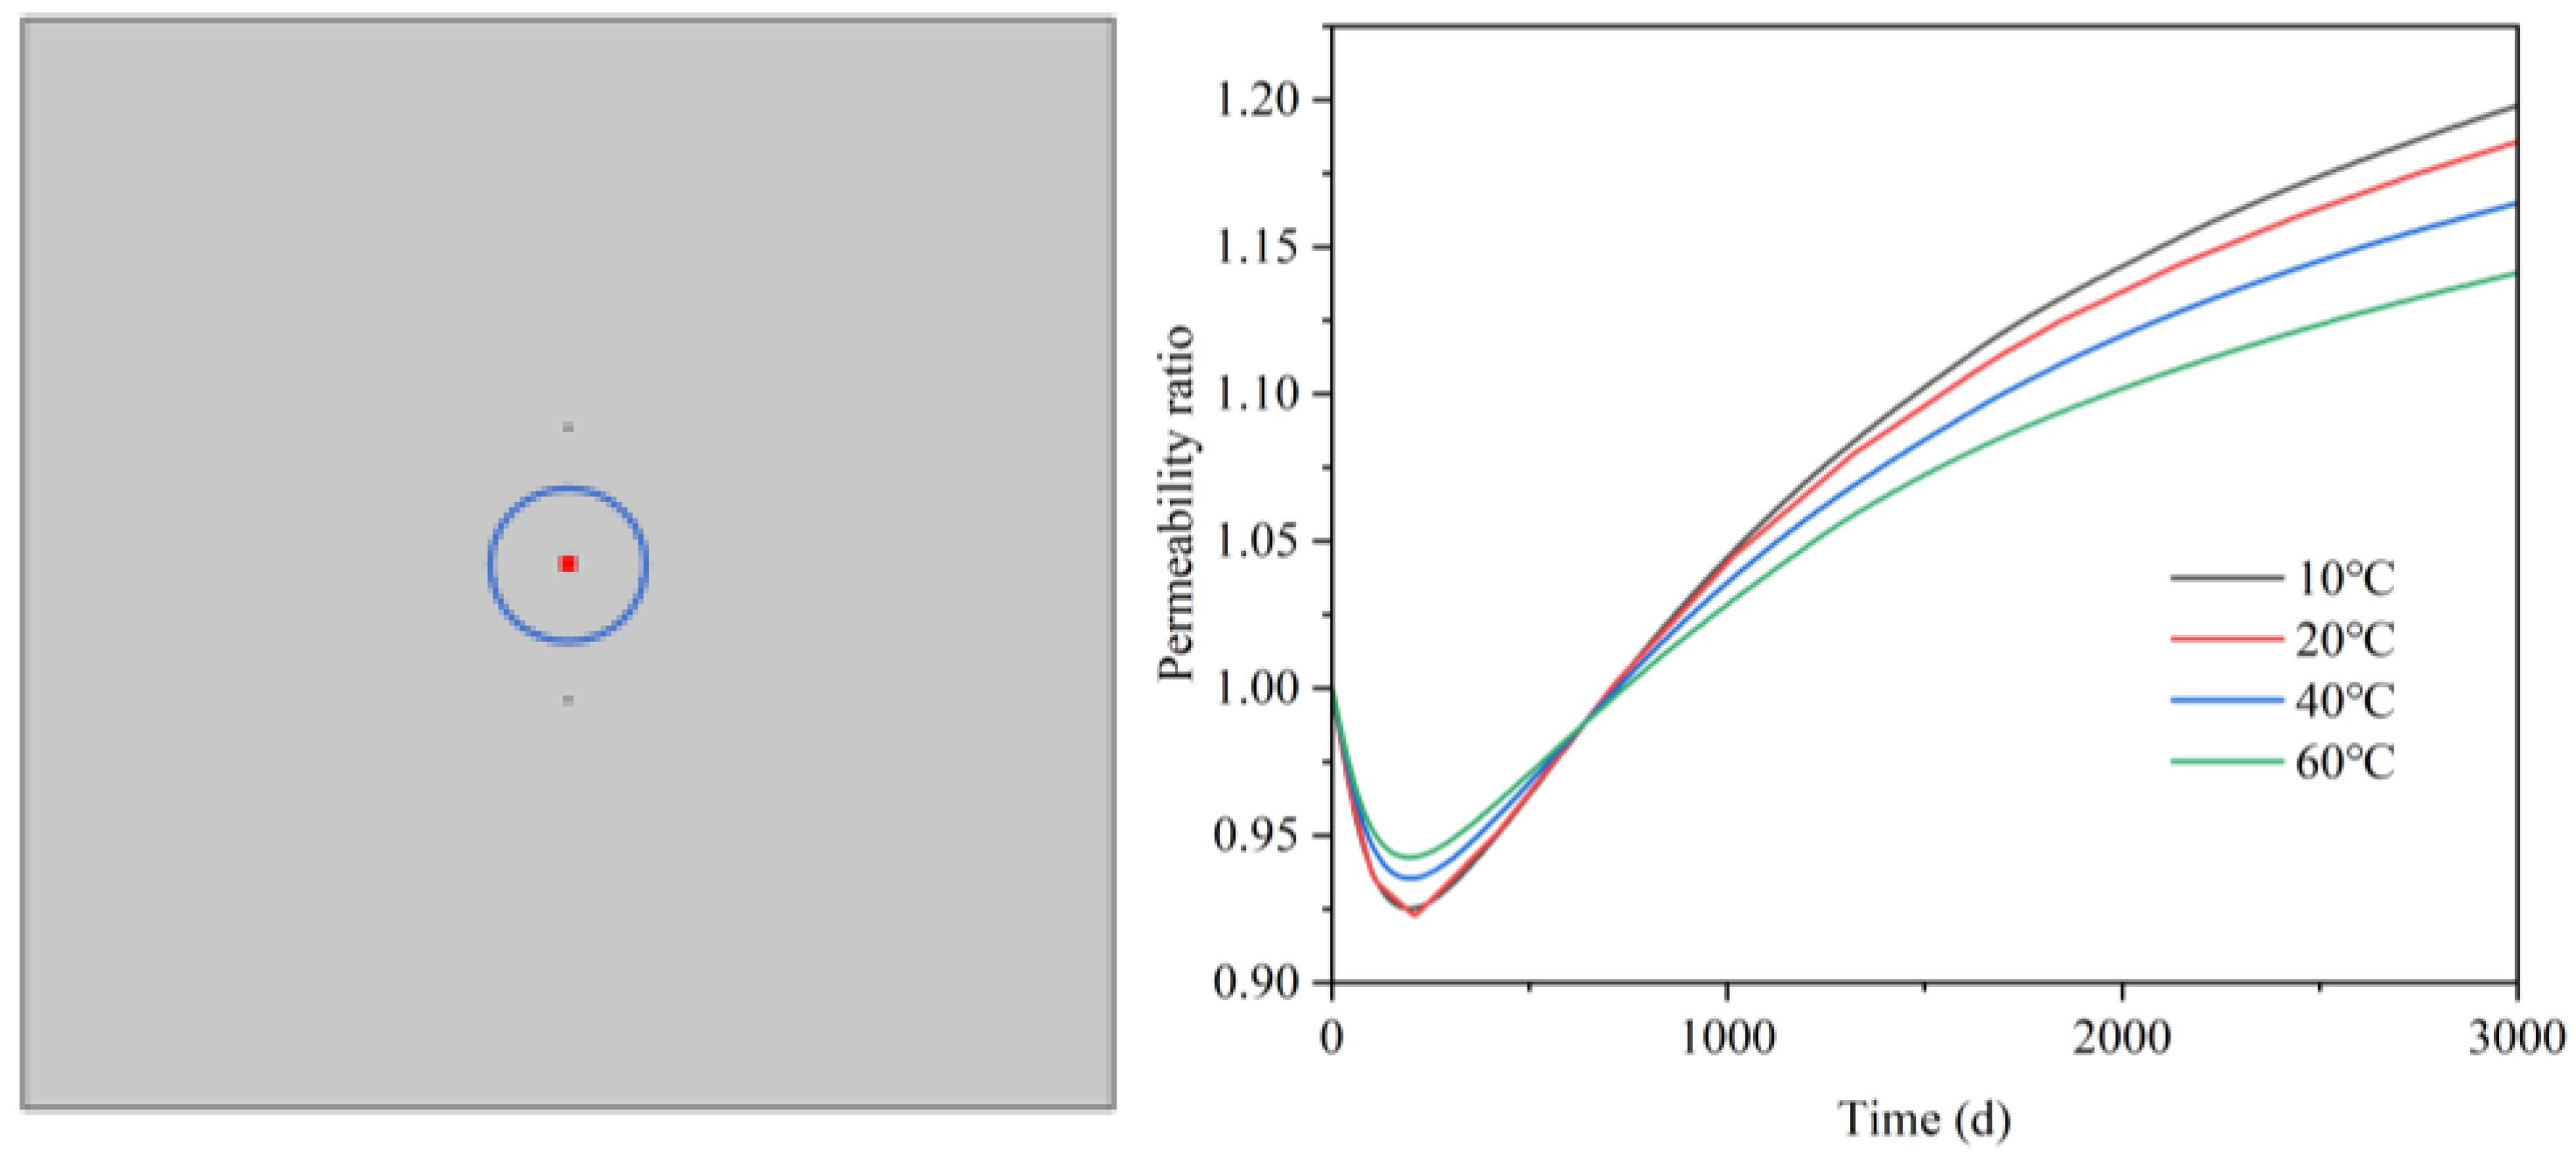
Figure 10 is the variation curve of the permeability ratio at the geometric center of the model with the mining time at different injection temperatures.
Figure 10.
The change law of permeability at the midpoint (40, 40) of injection–production wells at different injection temperatures.
The curve on the right side of Figure 10 indicates that the permeability trend at varying injection temperatures is generally consistent. During the initial phase of mining, the introduction of low-temperature water causes the rock to contract, leading to the closure of micro-fractures inside the rock and a minor reduction in permeability. The model’s permeability at each injection temperature exhibits minimal variation, and this condition persists for around 100 days. As mining advances, permeability increases, and reduced injection temperatures correlate with a greater rise in permeability. On the 3000th day of mining, the permeability at an injection temperature of 20 °C grew by 19% relative to the original permeability; however, at an injection temperature of 60 °C, the rise was only 15%, resulting in a disparity of 4% between the two temperatures. The model’s low starting permeability suggests that changes in injection temperature have a limited impact on the geothermal system. The change in porosity in this study determines the variation in permeability. The continuous infusion of low-temperature heat recovery working fluid into the thermal reservoir results in limited shrinkage of the rock skeleton, hence augmenting rock porosity. As the influence range nears the central point, the permeability at that place consistently increases, with reduced injection temperatures leading to a more significant boost in permeability.
3.2.3. Temperature Field Changes
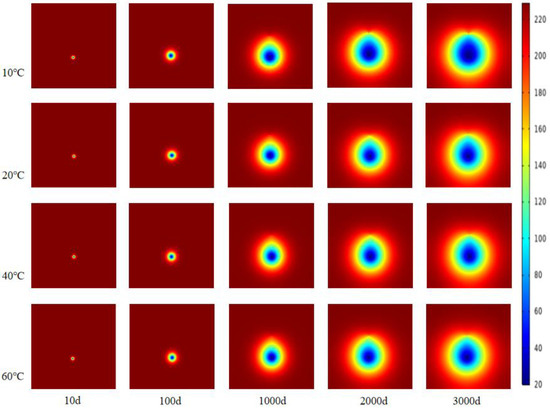
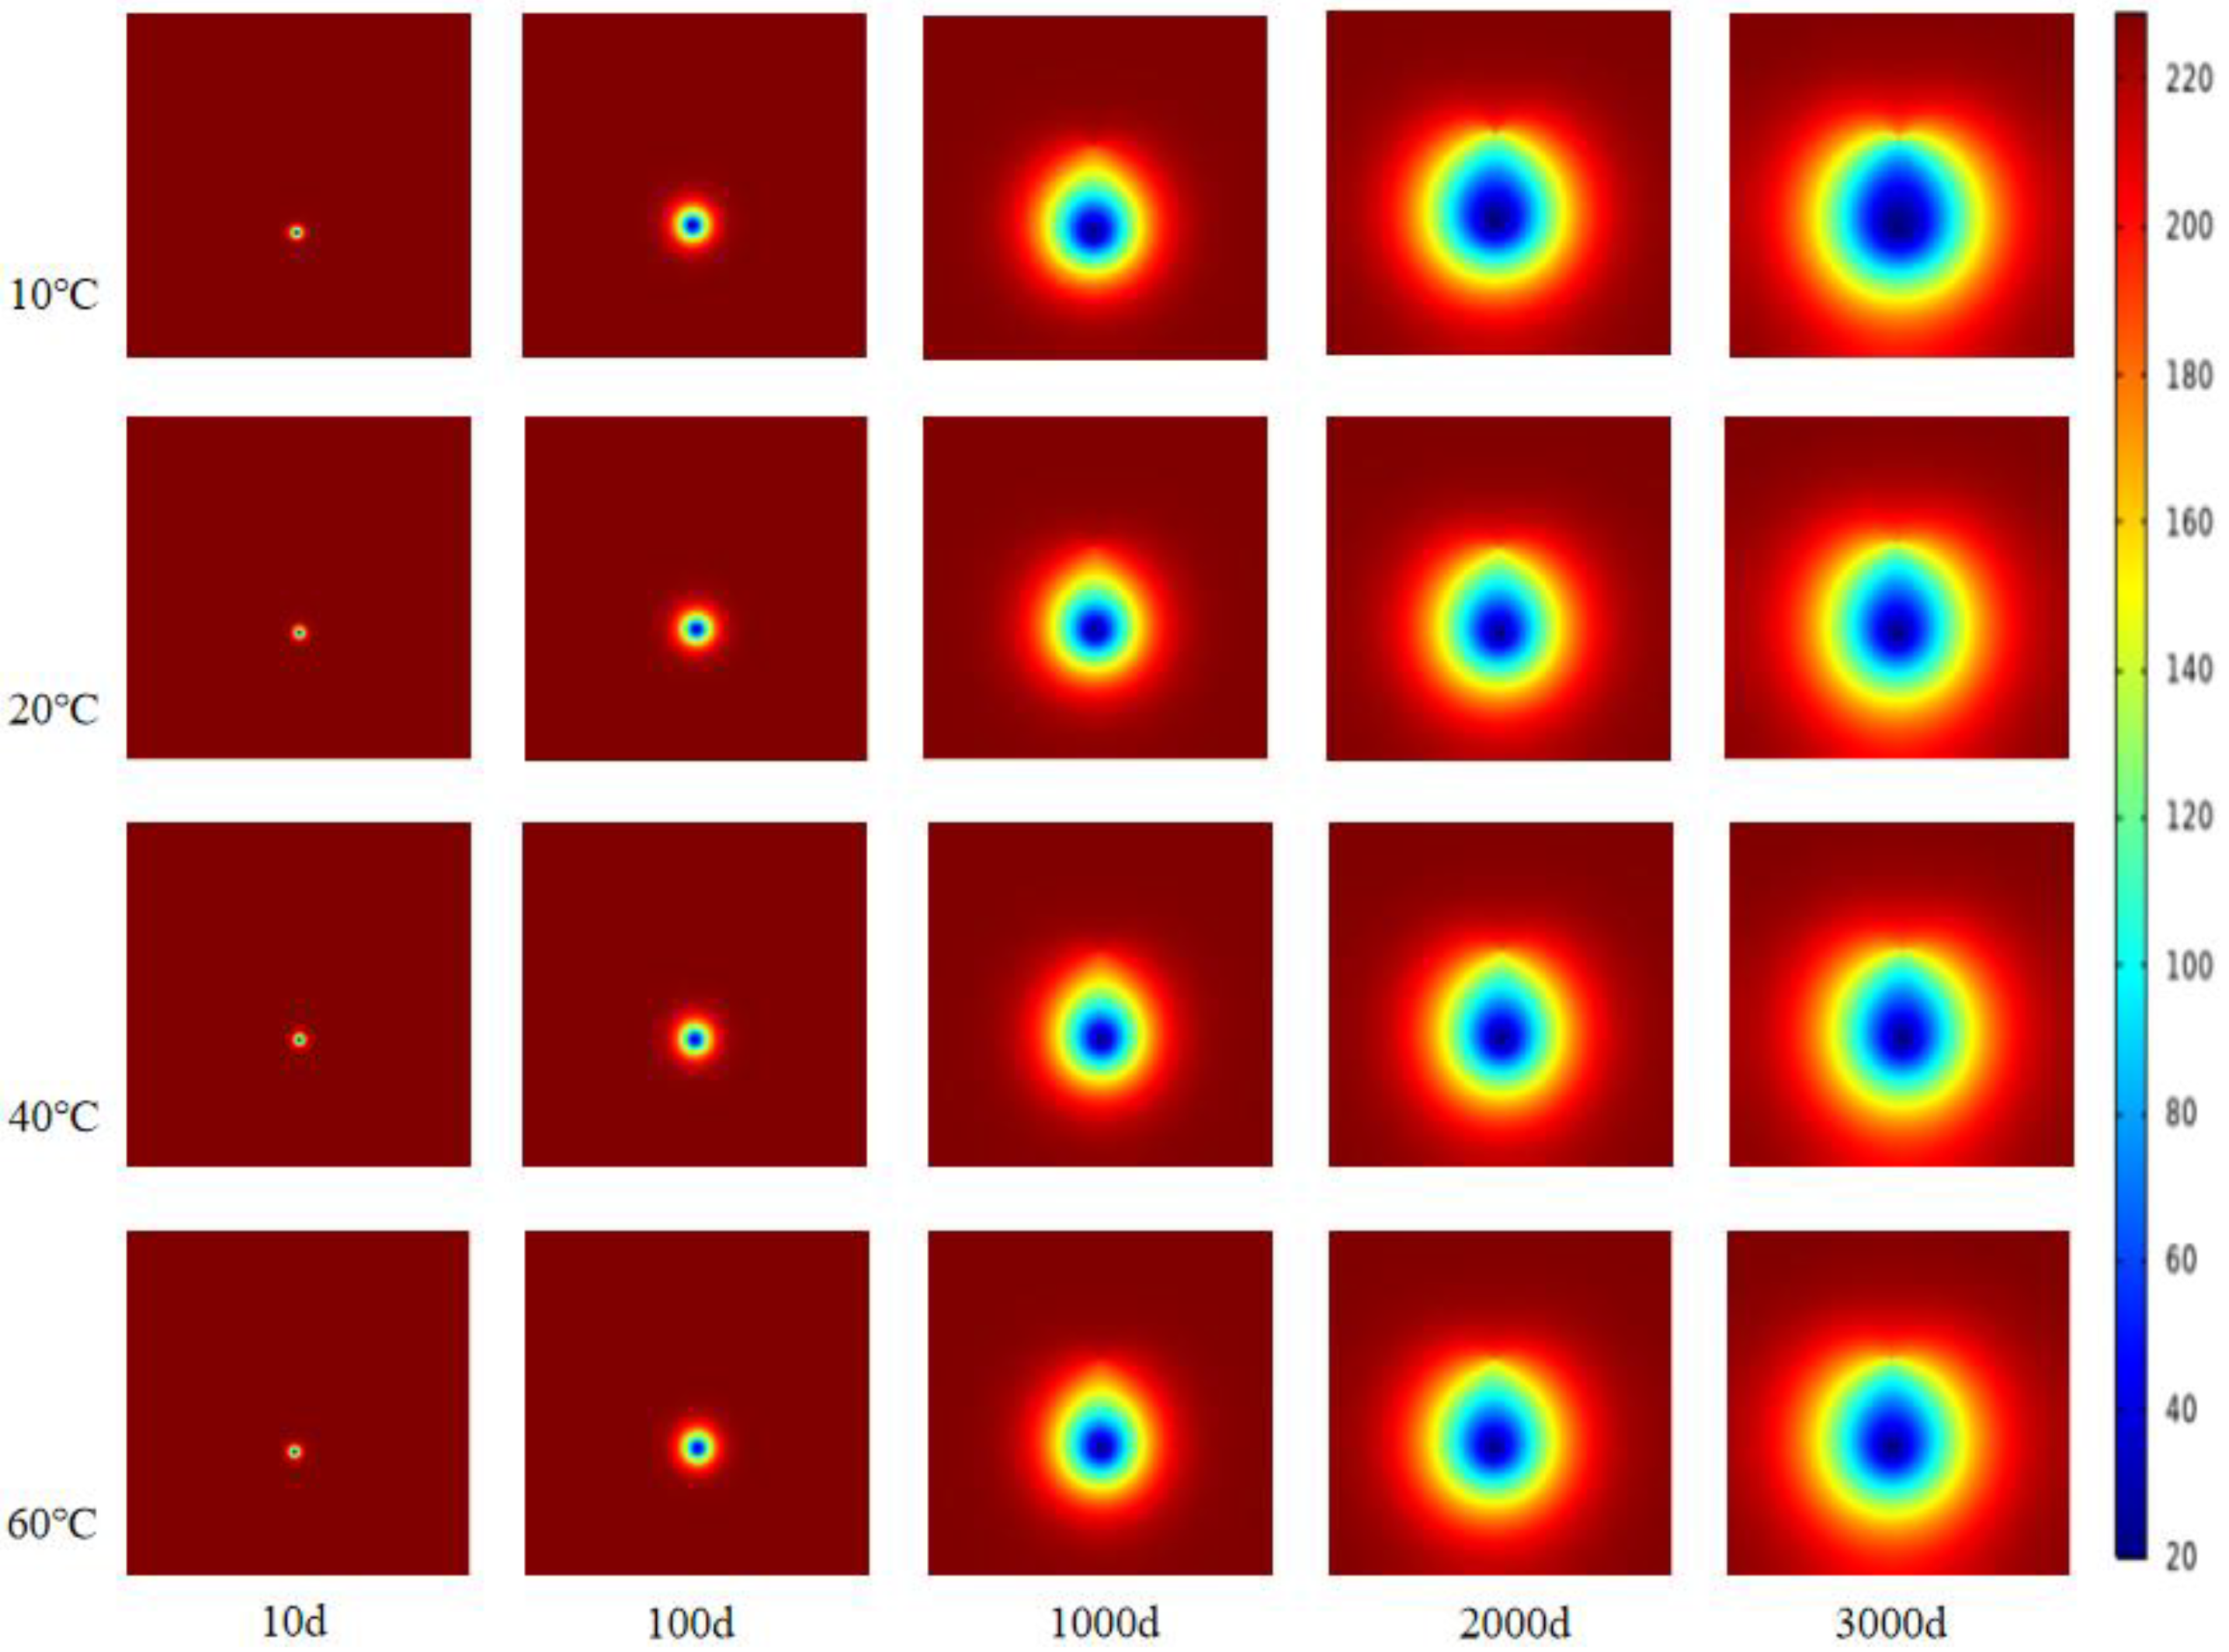
The temperature distribution within the thermal reservoir at intervals of 10, 100, 1000, 2000, and 3000 days is presented in Figure 11. The data demonstrate that while geothermal mining continues, the temperature of the reservoir surrounding the injection well steadily decreases. The low-temperature zone of the reservoir continues to expand in all directions along the injection well and gradually approaches the production well. At an injection temperature of 20 °C, the low-temperature zone radiates outward from the injection well at its center. Experimental findings indicate that mining activities affect the reservoir by 6.5 m during a span of 100 days. Following 1000 days of mining operations, its impact extends to the vicinity of the output well. As the mining duration reaches 2000 days, the temperature field contour exhibits a characteristic “finger” distribution, with the production well positioned at the forefront of the finger. After 3000 days, the cold front significantly alters the temperature distribution pattern of the reservoir surrounding the production well. Due to the “finger-like advance” phenomenon, when the mining duration extends from 10 days to 3000 days, the geothermal resources between the injection well and the production well are progressively extracted, while the reservoir extraction rate in other regions remains minimal.
Figure 11.
Temperature distribution of thermal reservoir at different injection temperatures.
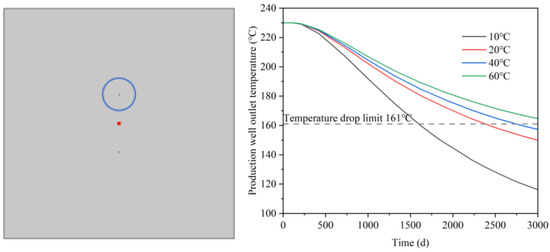
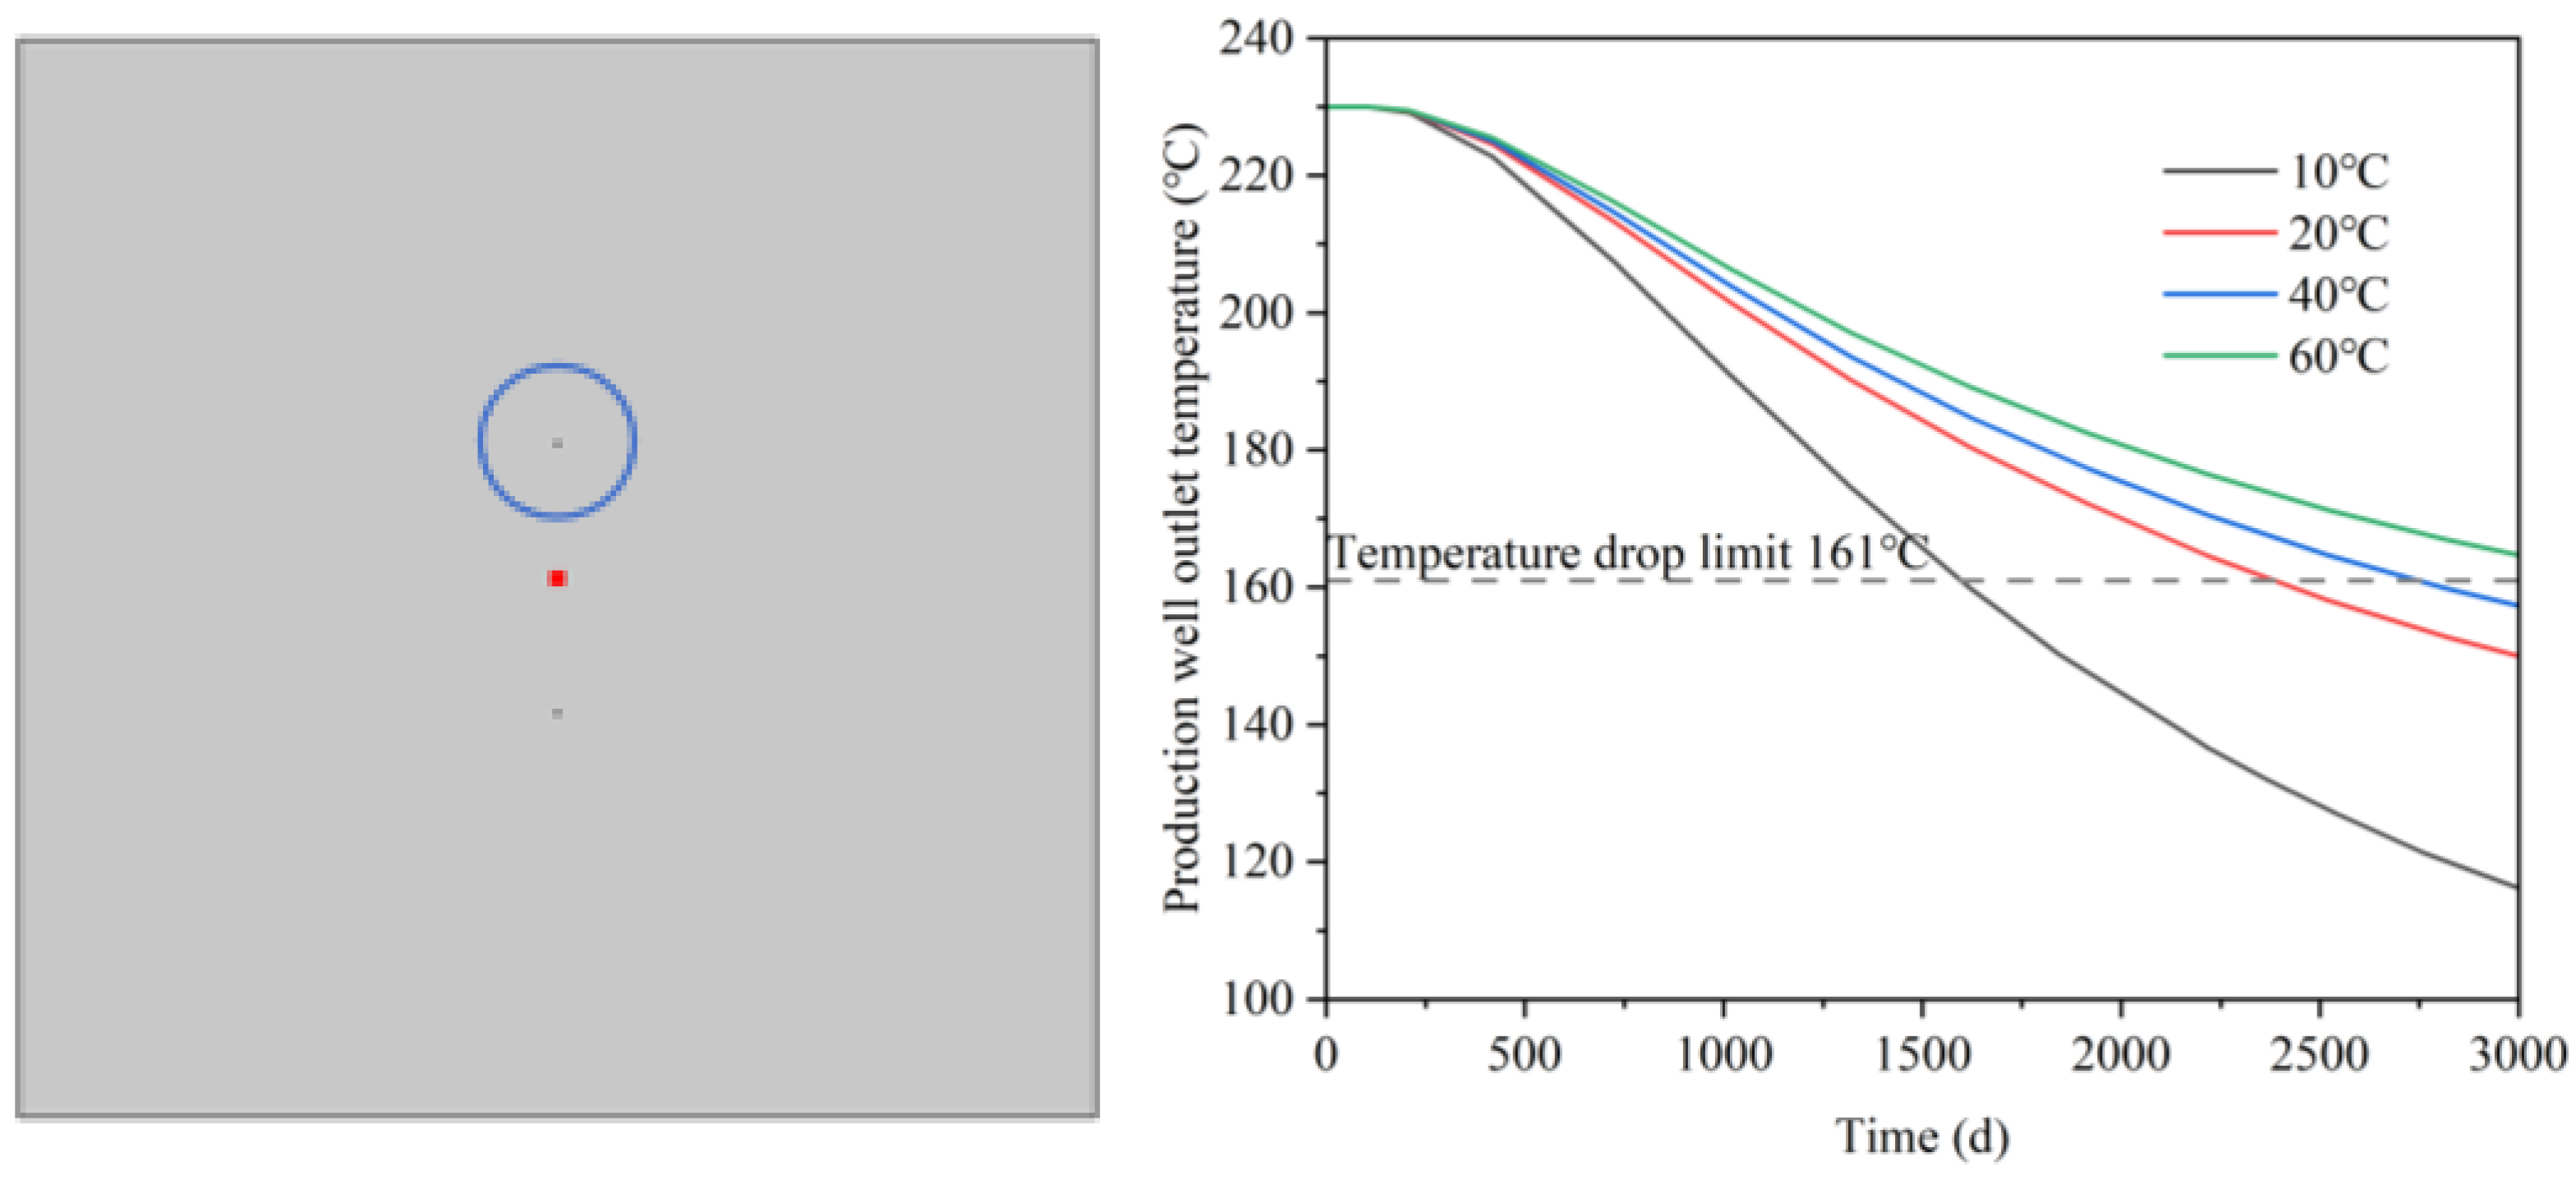
The analysis of the experimental data in Figure 12 indicates a clear two-stage pattern in the correlation between production temperature and time across different injection temperature conditions. The initial phase endures for approximately 210 days, aligning with the stable production period. The outlet temperature of the production well maintains the reservoir’s initial temperature of 230 °C, after which it commences to decline. The decline rate at this stage has a negative association with the injection temperature; specifically, a lower injection temperature leads to a more accelerated decline rate and a greater final decline. Following 3000 days of mining, the recovery temperature for the group with a 20 °C injection temperature is 148.12 °C, which is 9.26 percentage points lower than the 163.24 °C observed for the group with a 60 °C injection temperature. This two-phase behavior occurs because, during the initial extraction stage, the influence of the low-temperature injection medium on the thermal reservoir has not yet affected the production well, resulting in the temperature of the extracted thermal fluid corresponding to the reservoir’s initial temperature, thereby facilitating stable production. As geothermal mining advances, the extraction temperature consistently decreases. The prior analysis indicates that a decrease in injection temperature correlates with an increase in porosity and permeability, facilitating the flow of the low-temperature heat recovery working fluid from the injection well to the production well. This enhances convective heat transfer between the heat recovery working fluid and the thermal reservoir’s rock matrix, thereby amplifying the reduction in the geothermal extraction temperature.
Figure 12.
The change curve of extraction temperature with time under different injection temperature conditions.
3.2.4. Geothermal Production
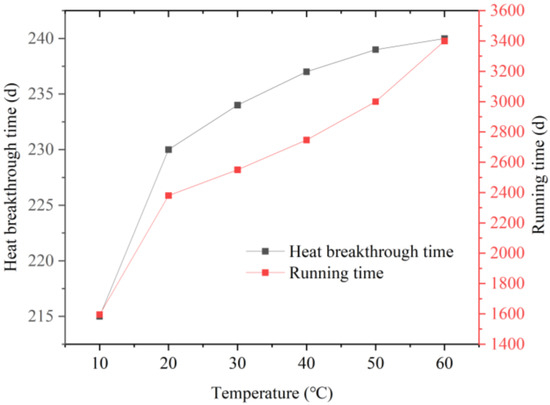
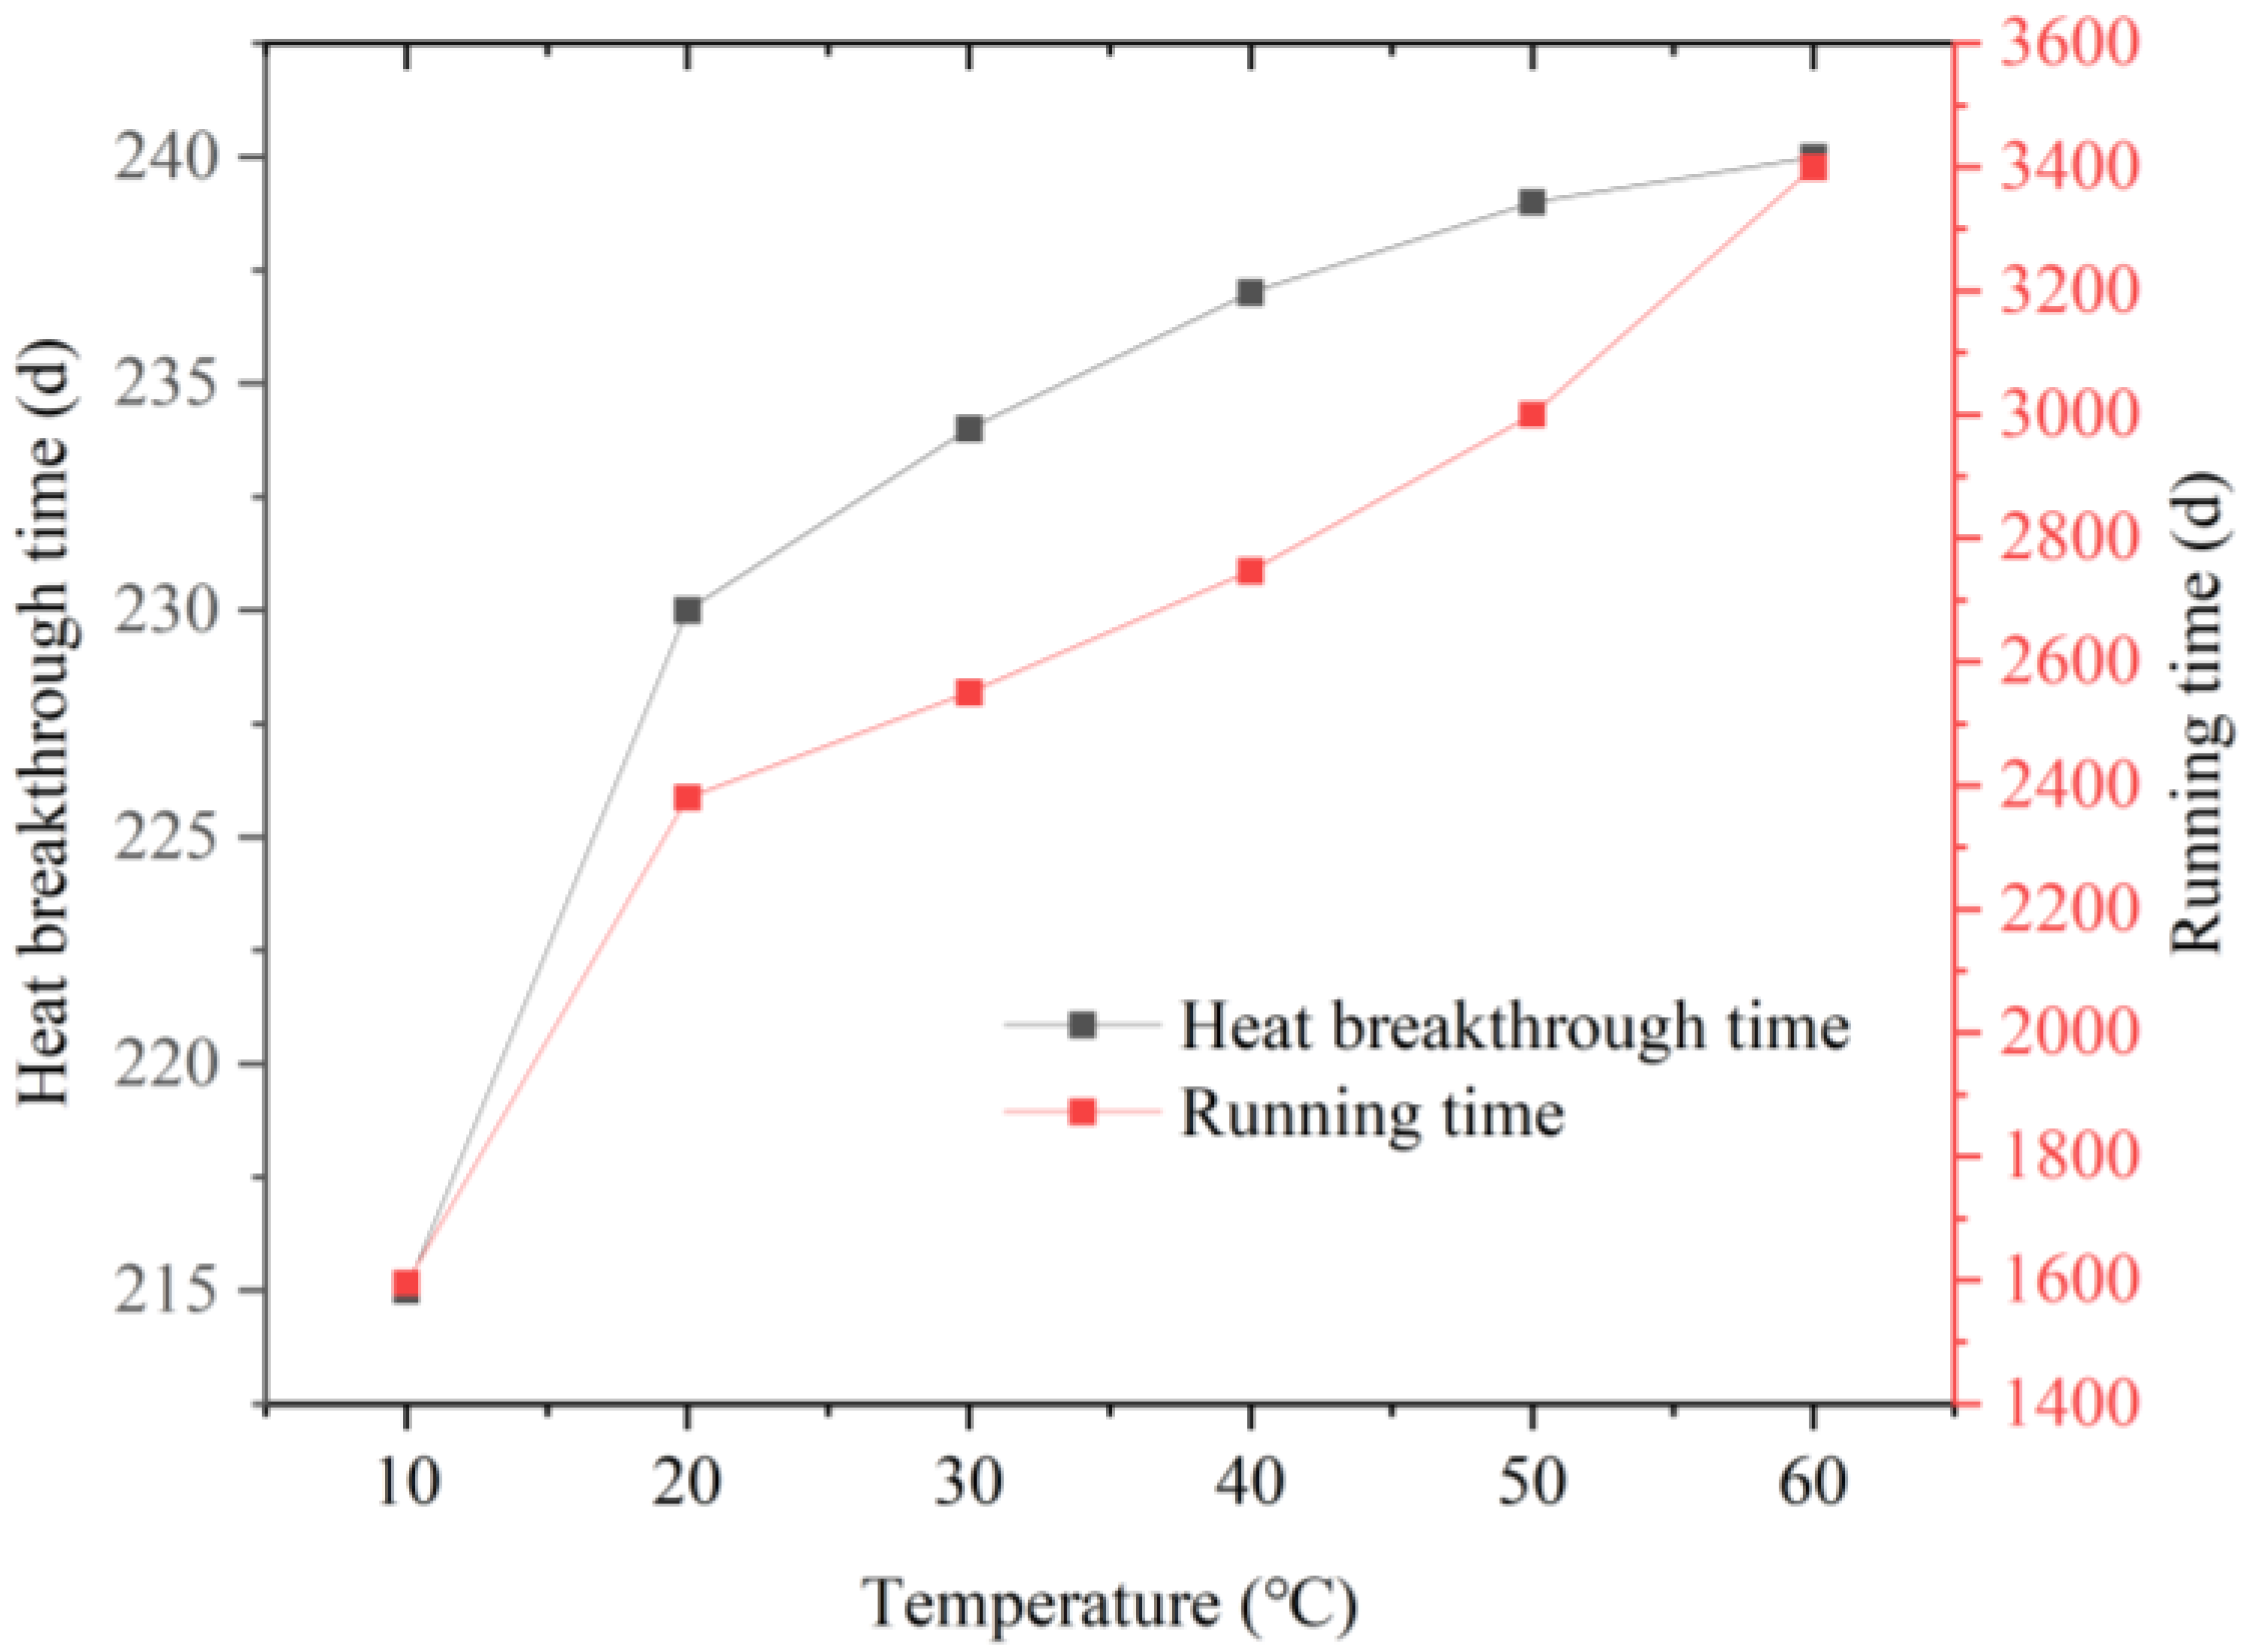
Keeping all other parameters unchanged while varying the temperature of the injected well water to 10 °C, 20 °C, 30 °C, 40 °C, 50 °C, and 60 °C, respectively, the influence of injection temperature on the heat recovery efficiency of the geothermal well system is simulated and calculated under these conditions. According to the temperature drop limits depicted in Figure 12 and Figure 13, it is apparent that at 10 °C, the thermal breakthrough time is 215 days, whereas the geothermal well lifespan is 1595 days; at 20 °C, the thermal breakthrough time is 230 days, with the geothermal well lifespan remaining at 1595 days. At 40 °C, the thermal breakthrough time is 237 days, and the geothermal well lifespan is 274 days; at 60 °C, the thermal breakthrough time is 240 days, and the geothermal well duration is 3400 days. The data demonstrate that a rise in injection temperature is associated with a prolonged thermal breakthrough time and operational lifespan of the geothermal system, whereas the growth rate increases alongside the injection temperature. The increased injection temperature leads to a small temperature gradient near the wellhead of the injection well, hence reducing the rate of thermal reservoir temperature decline and prolonging the operational lifespan of the geothermal well.
Figure 13.
Thermal breakthrough time and operation time of geothermal system at different injection temperatures.
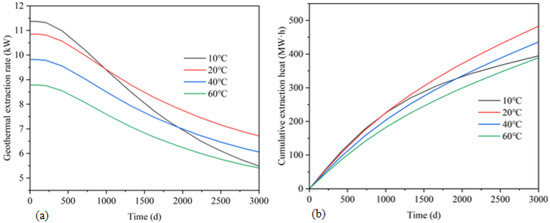
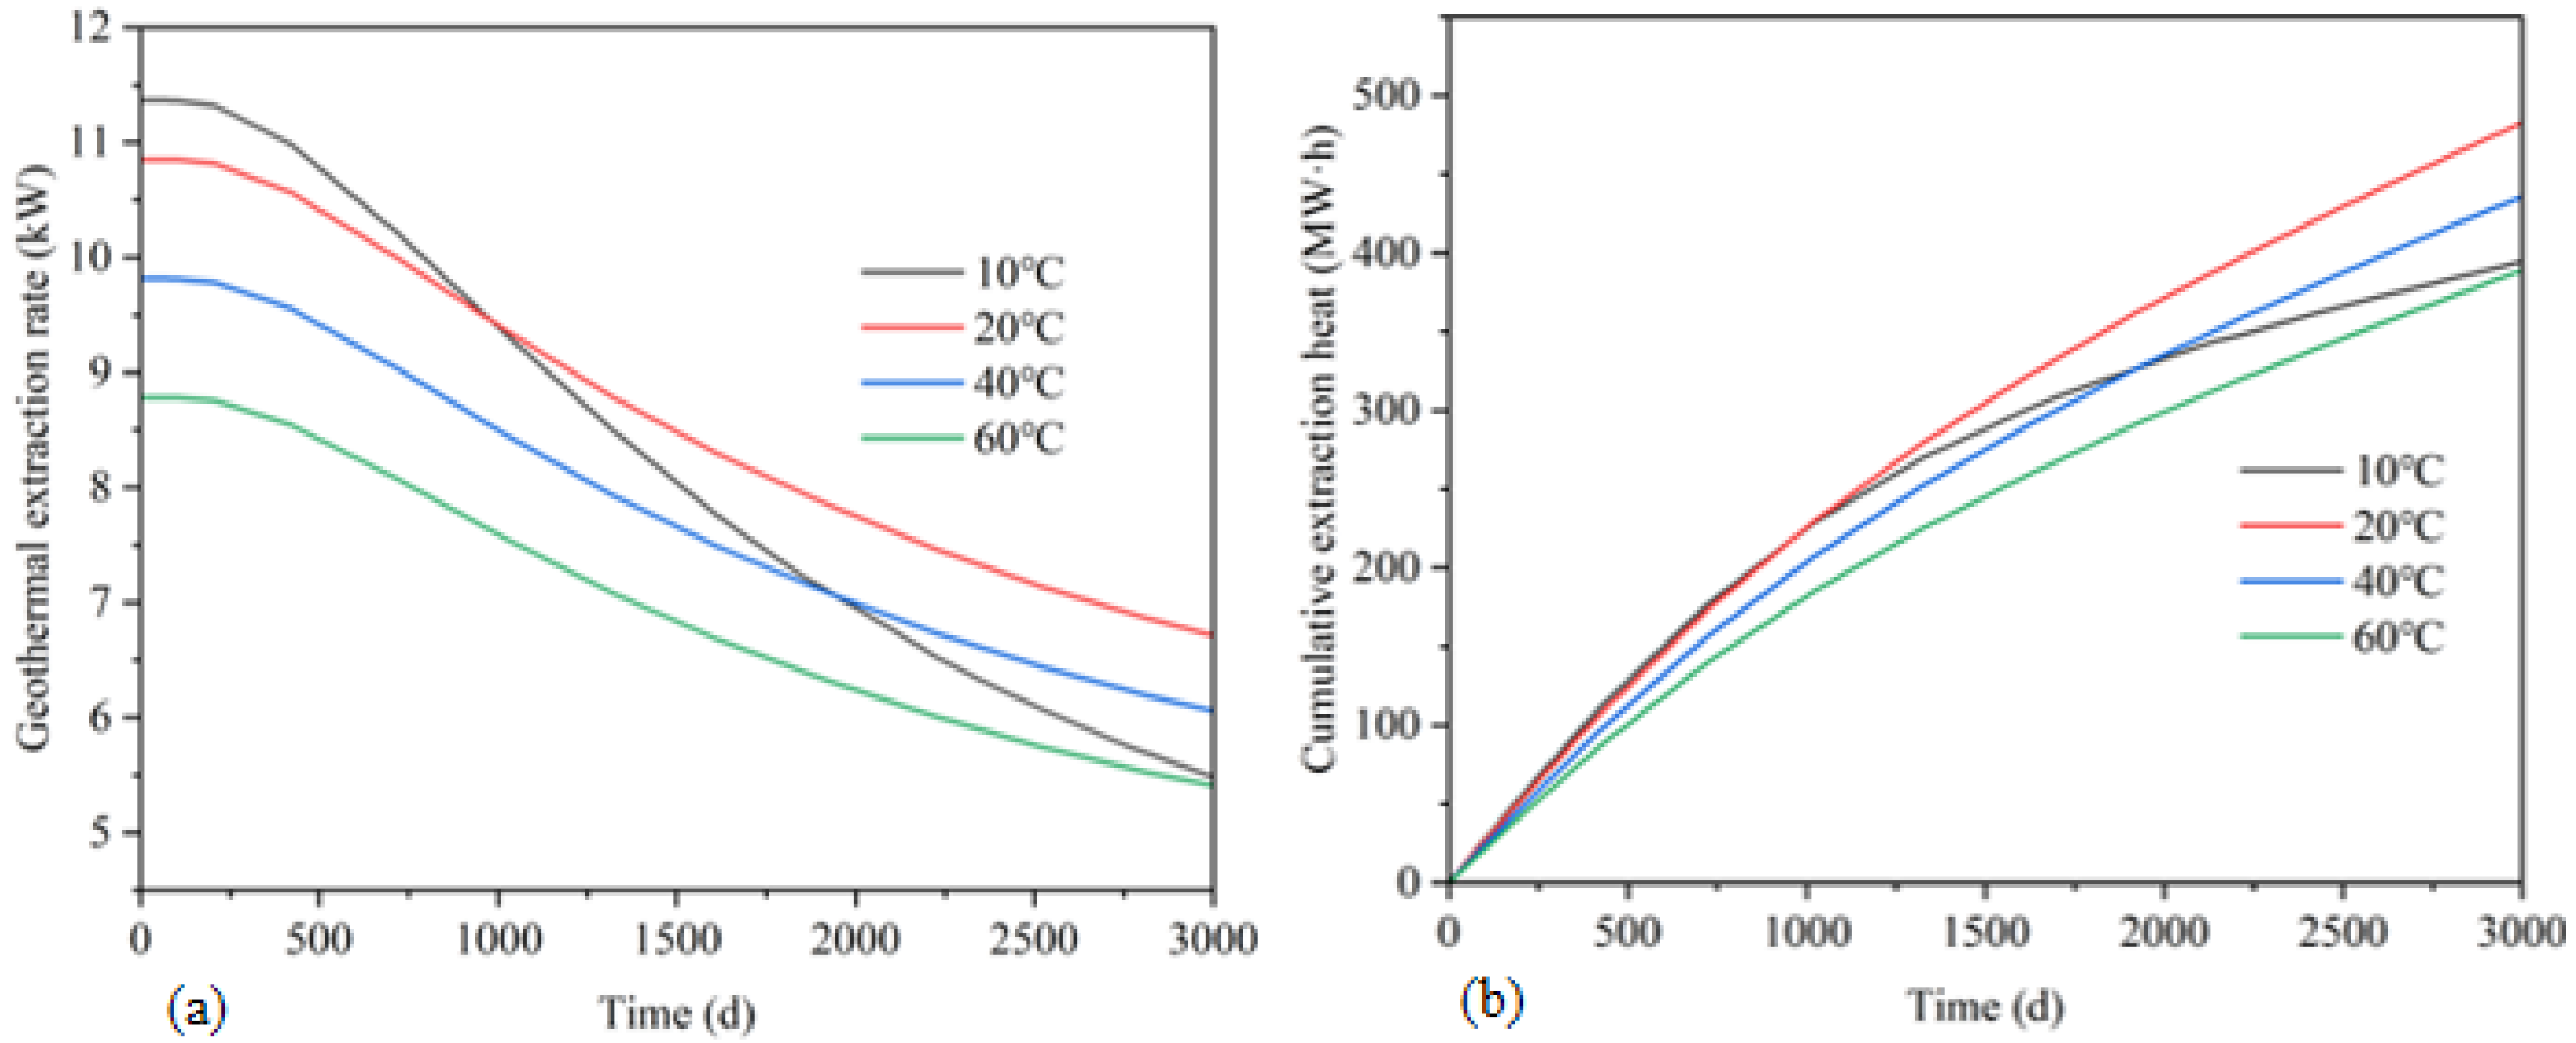
Analysis of the curve in Figure 14a reveals a negative correlation between injection temperature and geothermal extraction efficiency. After 100 days of operation, the heat energy output rate attains 10.85 kW at an injection temperature of 20 °C, but it diminishes to 8.78 kW at 60 °C, representing a decrease of 19.08% compared with the former rate. After 3000 days of operation, the production rate is 6.70 kW at 20 °C and 5.40 kW at 60 °C, representing a 19.40% decrease from the prior value. The elevated injection temperature impedes the enhancement of reservoir permeability and diminishes the effective seepage capacity. The mass flow attenuation results in a decreased production rate. Figure 14b illustrates the cumulative extraction heat. Upon reaching the 3000th day, the system accumulates 485.02 MW·h of thermal energy at 20 °C, representing a 24.14% increase over the 390.78 MW·h recorded at 60 °C. This indicates that low-temperature injection fluid can significantly enhance the geothermal output rate within the same time frame; however, an excessive temperature decrease may diminish the lifespan of the geothermal system.
Figure 14.
Variation of geothermal extraction rate and cumulative extracted geothermal energy at different injection temperatures. (a) Geothermal extraction rate. (b) Cumulative extraction of geothermal energy.
3.3. The Influence of Injection–Production Well Pattern Arrangement on Thermal Reservoir
This section analyzes the influence of different well arrangement methods on the geothermal extraction process. The corresponding scheme is shown in Scheme 3 in Table 2.
3.3.1. Temperature Field Changes
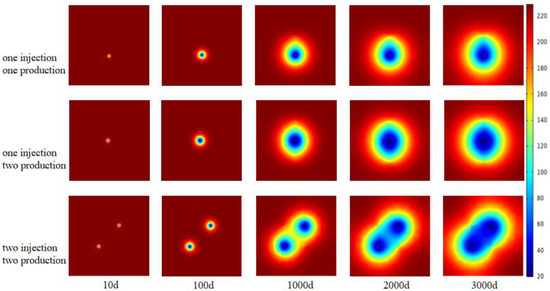
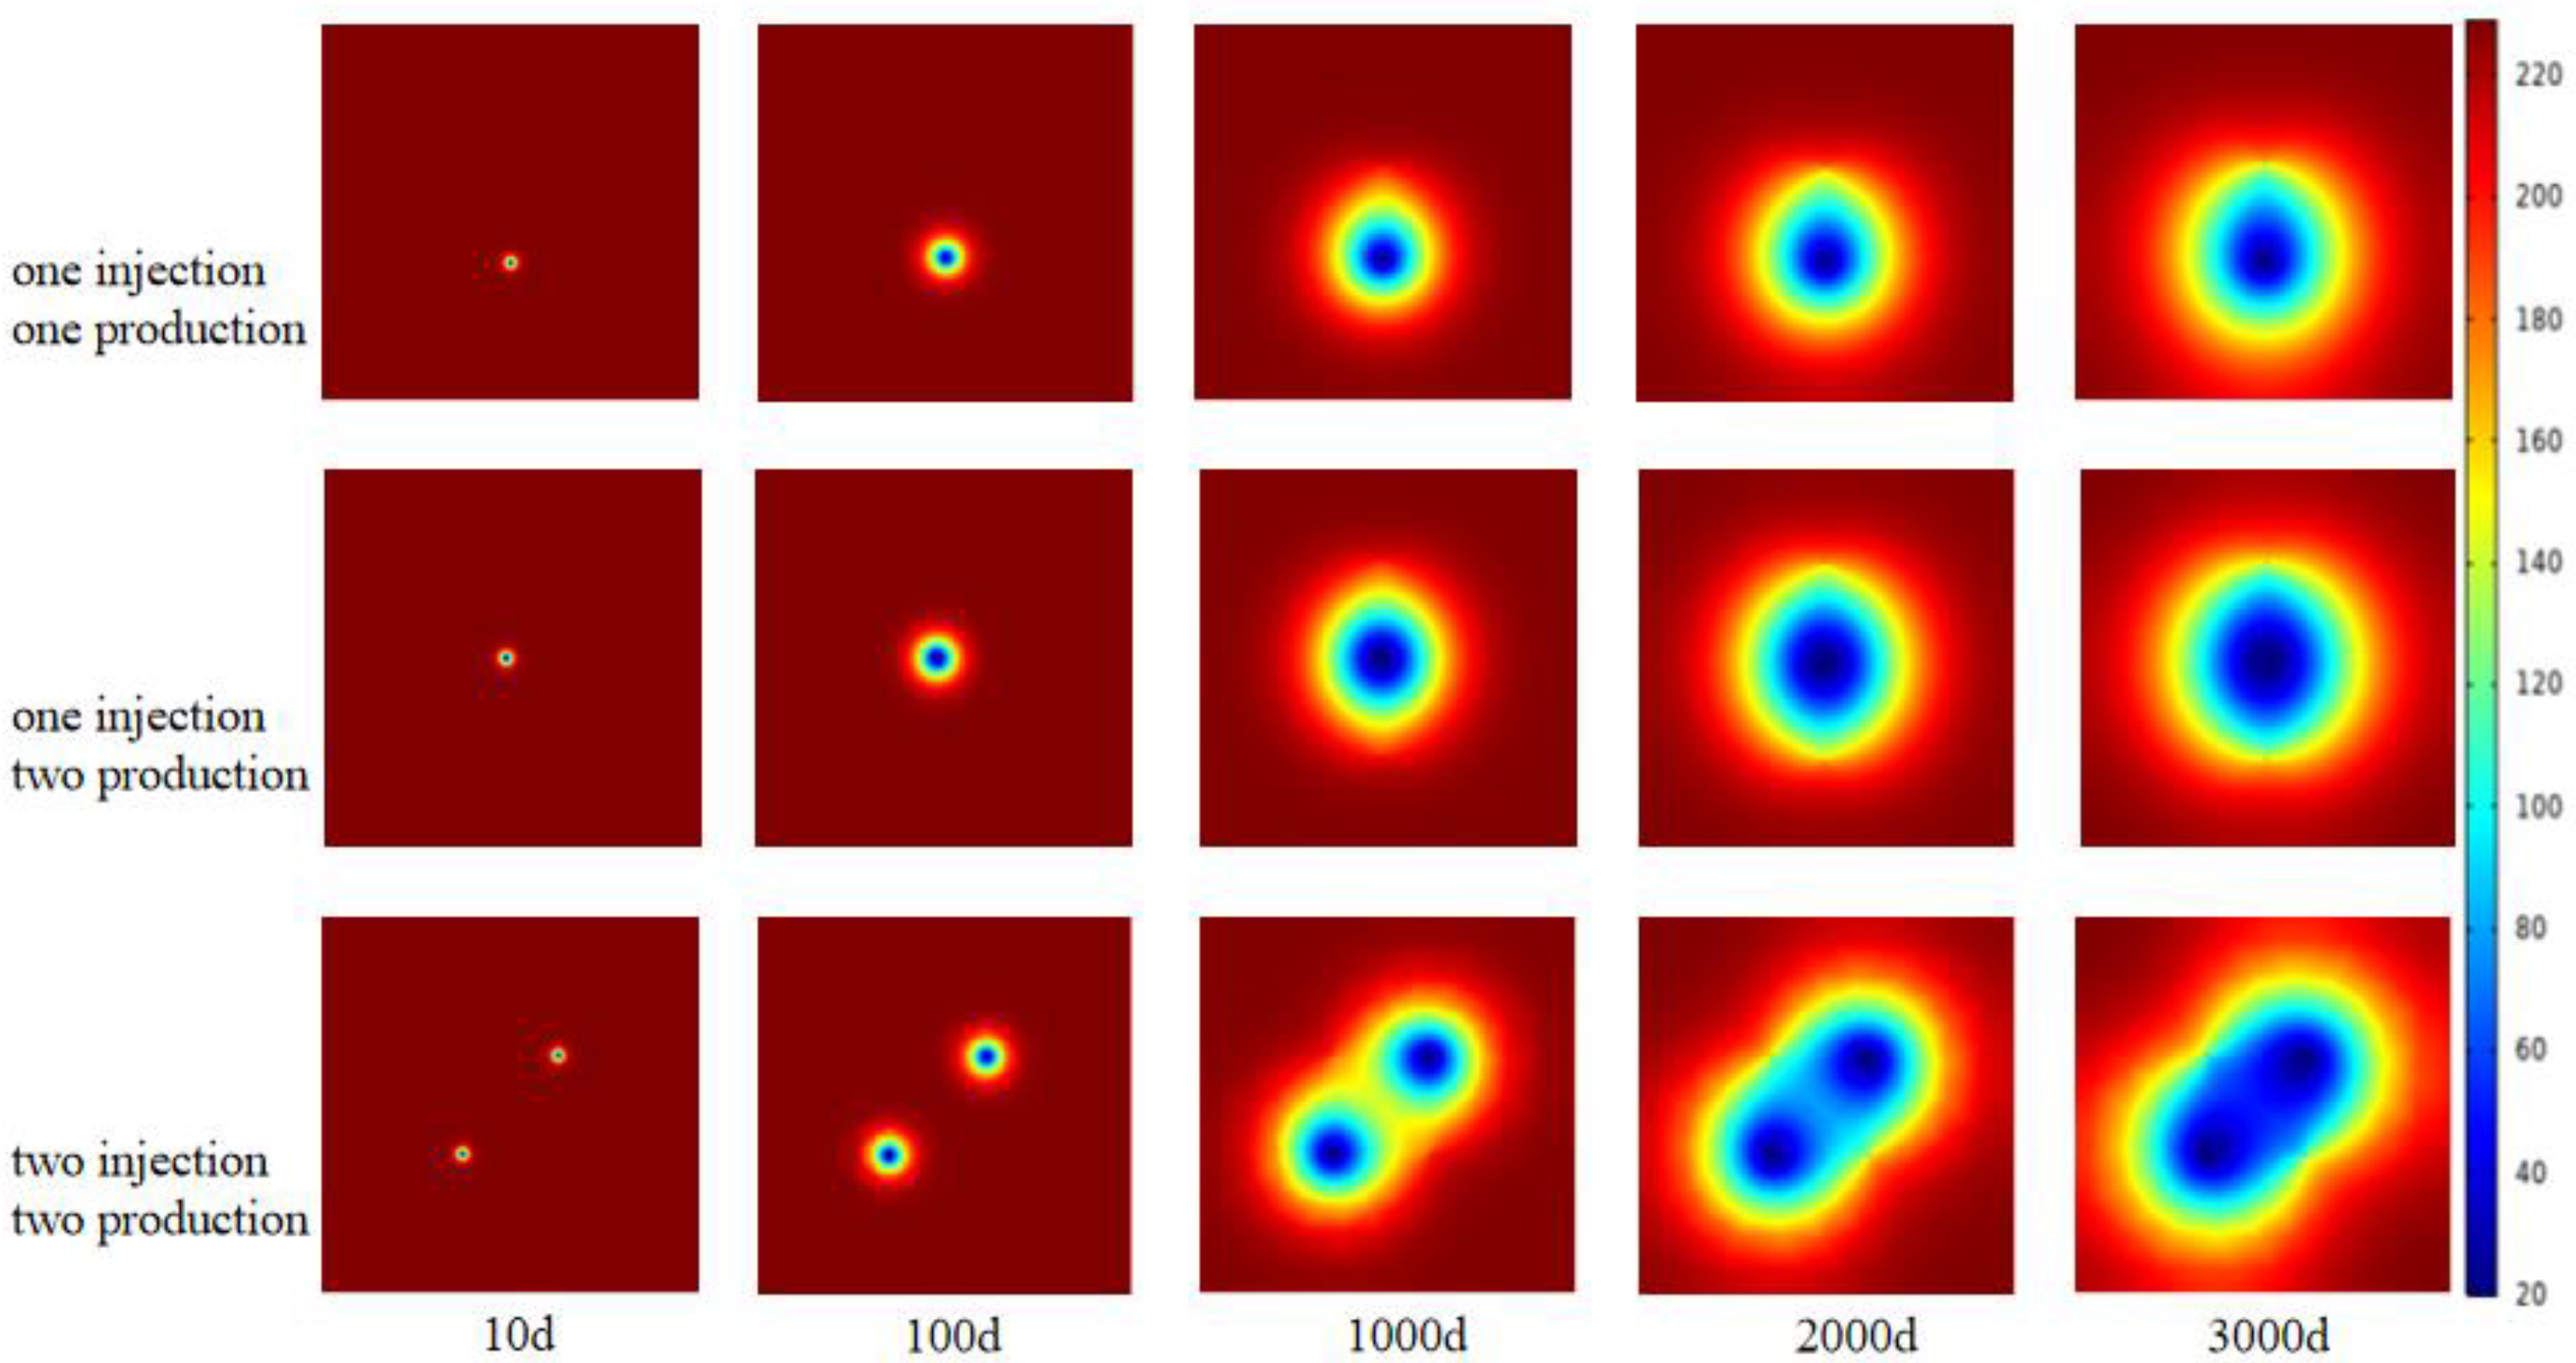
Figure 15 depicts the temperature distribution cloud diagram within the reservoir under the scenarios of “one injection and one production,” “one injection and two productions,” and “two injections and two productions,” thereby offering a lucid representation of the dynamic heat transfer process between the low-temperature injection fluid and the high-temperature rock matrix across three distinct well pattern configurations. As the mining period extends, the low-temperature region exhibits non-uniform diffusion, influenced by the pressure gradient between injection and production wells. Consequently, directional migration and extension transpire along the primary seepage channel, characterized by rapid fluid velocity towards the production well. In the single injection well mode, the progression of the cold front is largely autonomous, primarily characterized by radial expansion centered around the injection point, resulting in the formation of a singular extensive low-temperature funnel at the conclusion of extraction. Conversely, two distinct low-temperature disturbance zones are created in the reservoir owing to the presence of dual injection well sources in the configuration using “two injection and two production” wells. As time progresses into the middle and late stages, the two low-temperature halos exhibit a pronounced spatial superposition effect due to the influence of the seepage field, causing the leading edges of the cold fronts to draw nearer and ultimately converge. This inter-well thermal interference phenomenon macroscopically increases the fluid’s volume sweep range within the thermal reservoir rock mass, but it also markedly hastens the decline of the reservoir’s overall enthalpy, causing the low-temperature front to advance to the production well position sooner. This indicates that the multi-well high-density configuration compromises the long-term steady production temperature of the system by amplifying thermal interference between wells, although enhancing instantaneous heat recovery. The well layout has a nonlinear impact on the thermal breakthrough time and the longevity of geothermal wells.
Figure 15.
The temperature distribution cloud diagram of thermal reservoir under different well patterns.
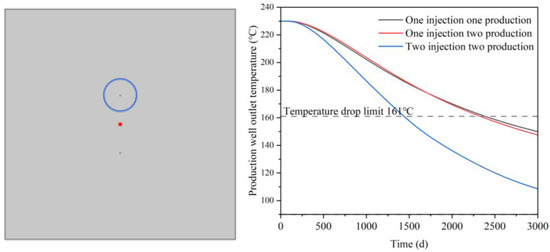
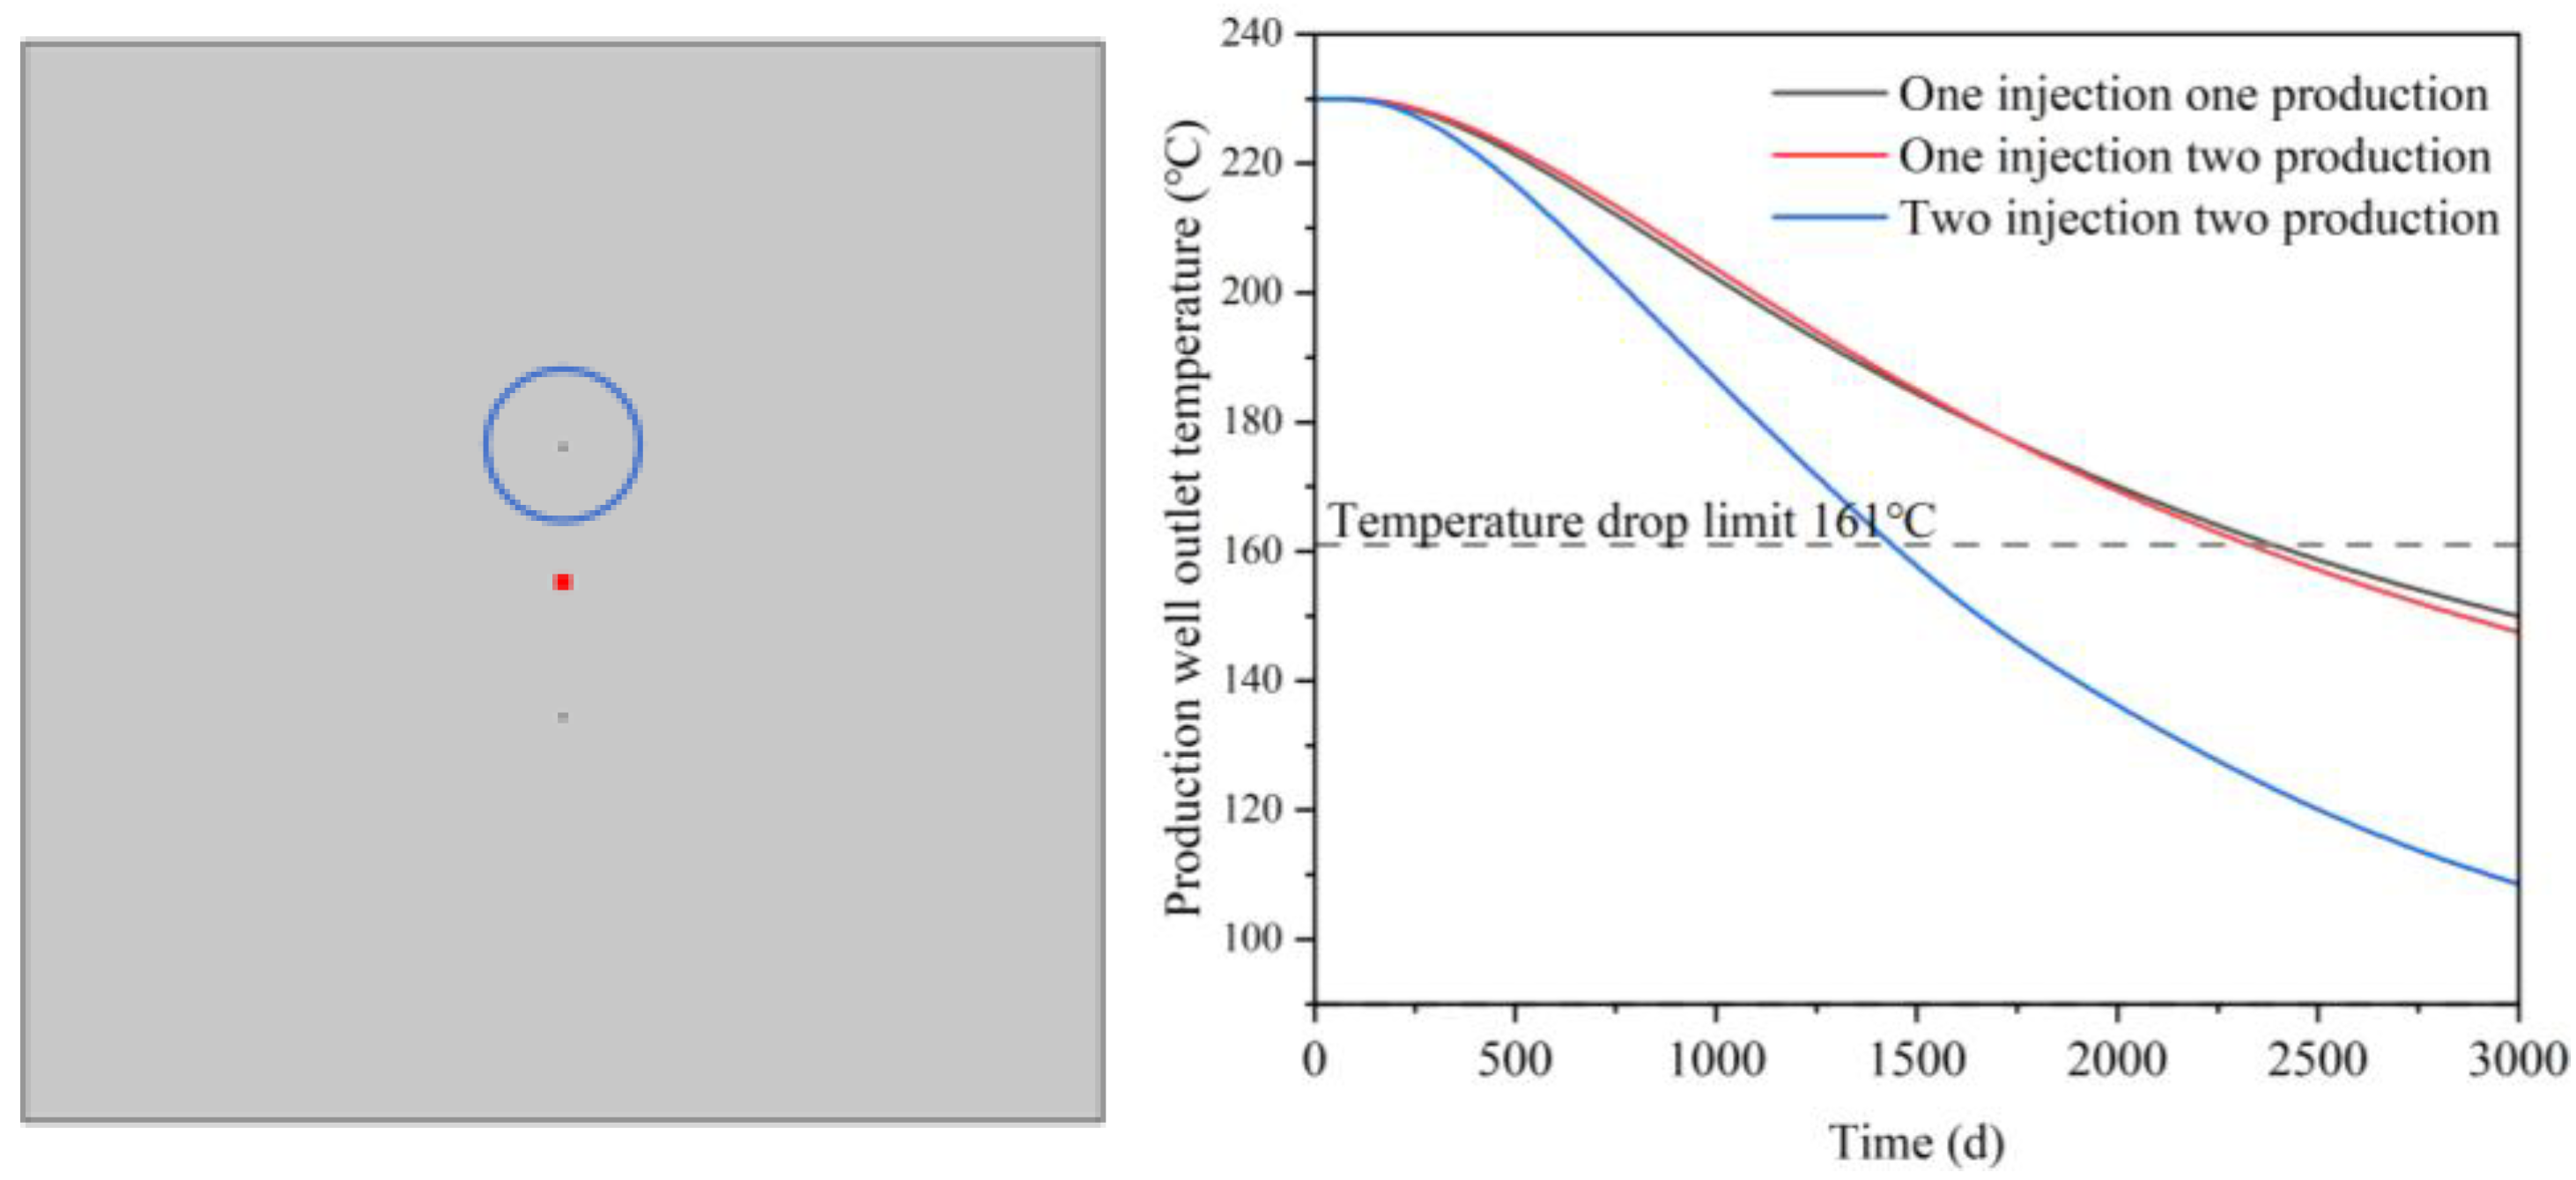
Identical temperature variation trends for “one injection and one production”, “one injection and two productions”, and “two injections and two productions” are illustrated in Figure 16. The mining temperature and the rate of temperature fall for “one injection and one production” and “one injection and two productions” show negligible variations, while they markedly differ from those of “two injections and two productions”. Simultaneously, when juxtaposed with the water temperature of the mining well under the distribution method using “two injection and two mining” wells, it is observed that the temperature is elevated under the “one injection and one mining” distribution mode. On the 3000th day of mining, the geothermal extraction temperature was 148.12 °C in the “one injection and one mining” well method; however, it was 106.28 °C in the mode using “two injection and two mining” wells, representing a decrease of 39.37% compared with the former. The phenomenon occurs because the low-temperature zone created by two injection wells is larger than that produced by a single injection well, resulting in a more rapid temperature decline; specifically, the temperature reduction rate in the scenario using “two injection and two production” wells exceeds that of the “one injection and one production” well scenario.
Figure 16.
The variation curve of the outlet temperature of the production well with time under different well arrangement modes.
3.3.2. Geothermal Production
As depicted in Figure 17 and Table 3, an increase in the number of injection wells is associated with a decrease in both thermal breakthrough time and the operational duration of the geothermal system, although the rate of increase in operational time lessens as the number of injection wells increases. The proliferation of injection wells results in an elevated volume of cold water being injected, thereby accelerating the temperature decline of the thermal reservoir, which in turn reduces the thermal breakthrough time and shortens the operational lifespan of the geothermal system.
Figure 17.
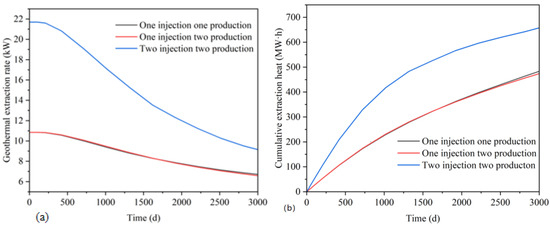
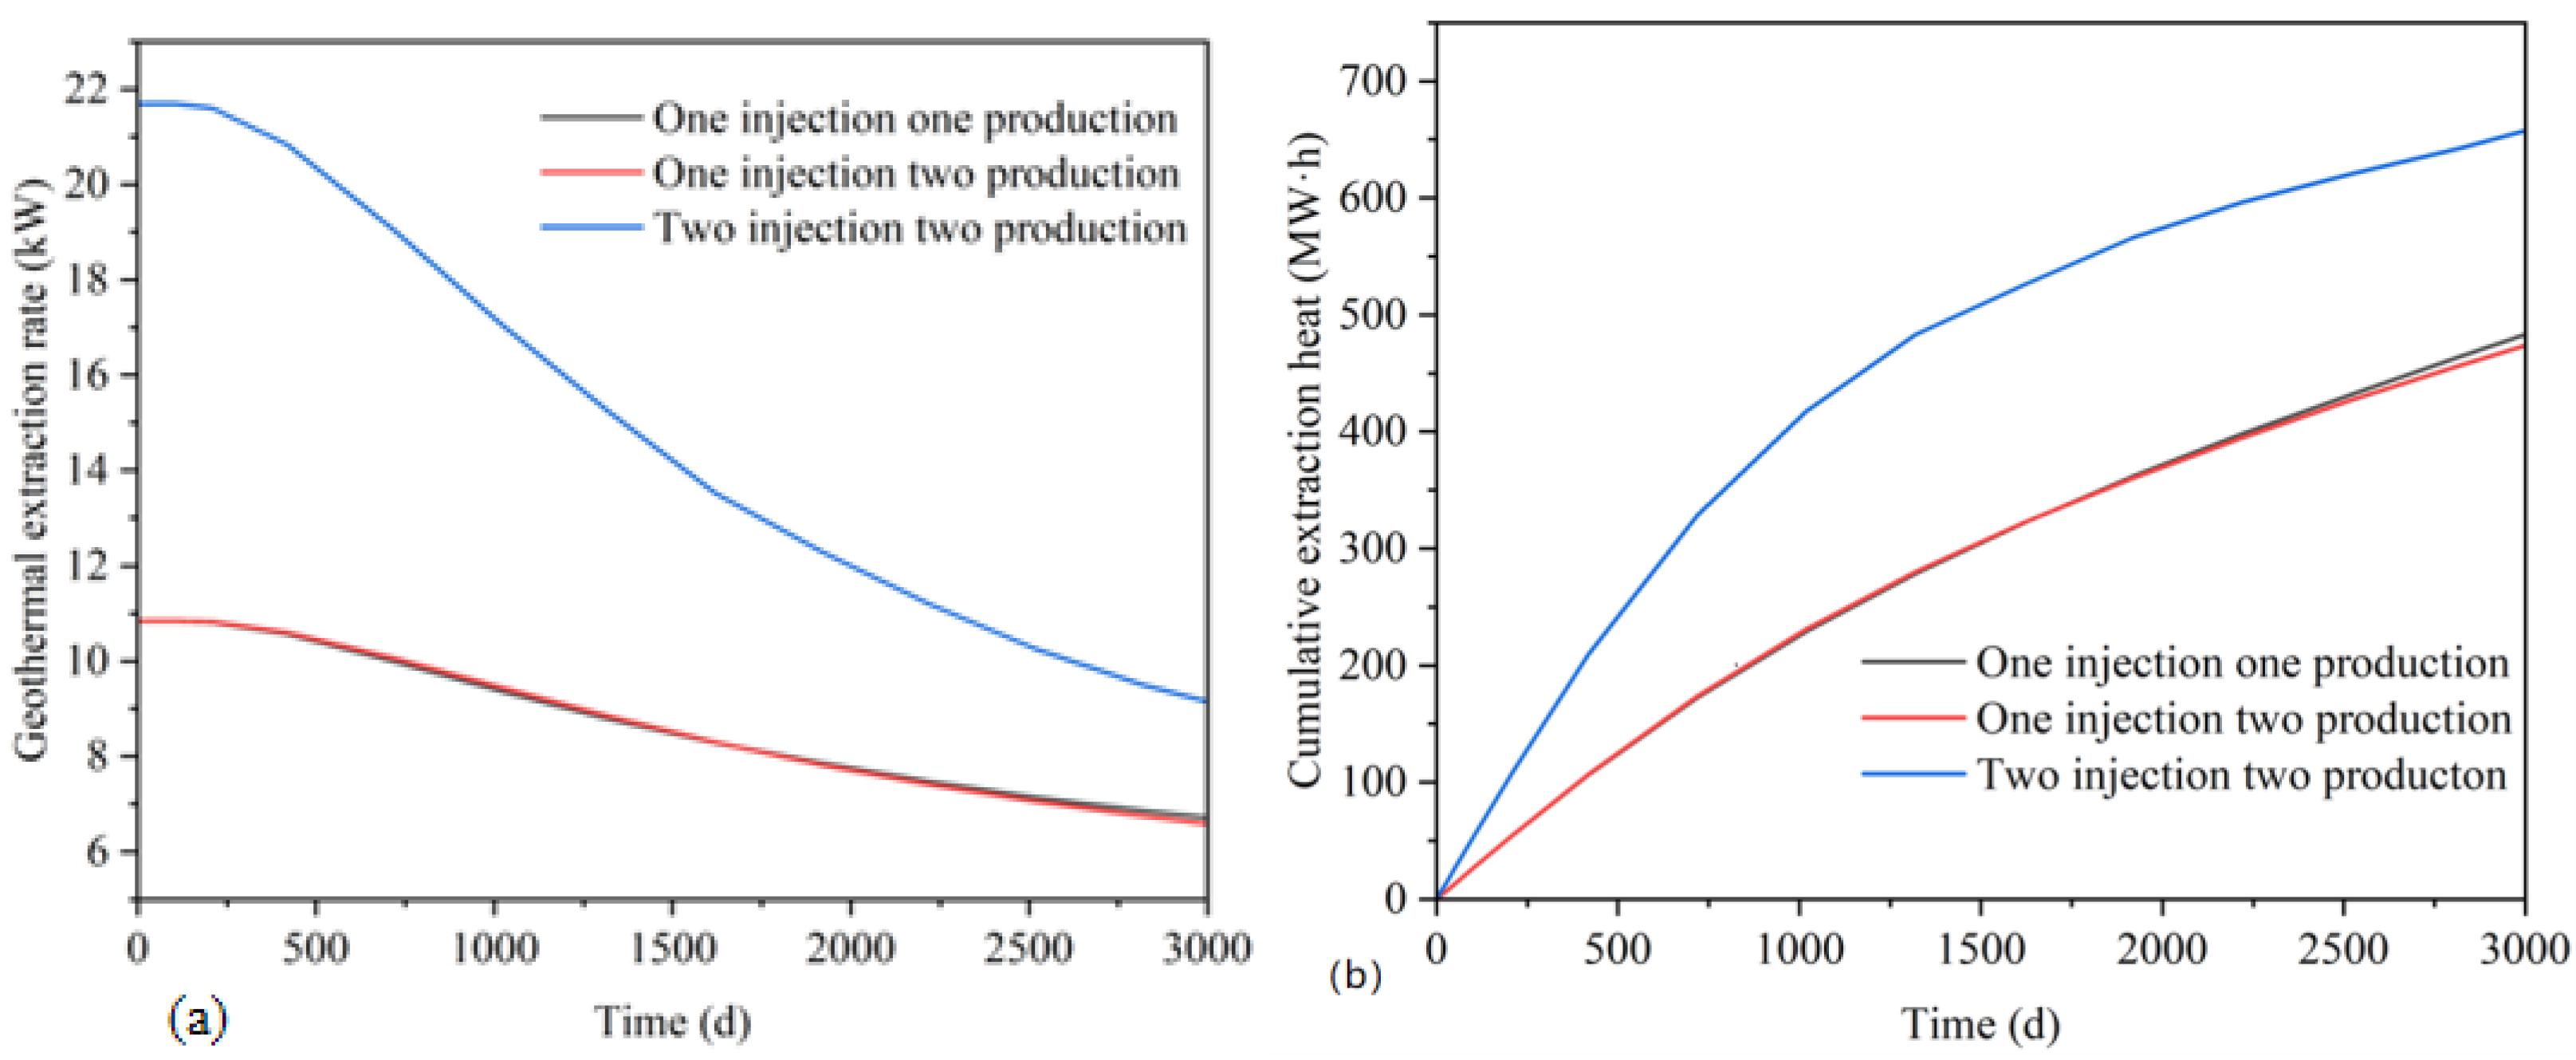
The variation of geothermal extraction rate and cumulative geothermal extraction under different well patterns. (a) Geothermal extraction rate. (b) Cumulative extraction of geothermal energy.
Table 3.
Thermal breakthrough time and operation time of geothermal system under different well patterns.
The comparison in Figure 17a demonstrates that the geothermal extraction rate escalates with an increase in the number of injection and production wells. On the 100th day, the geothermal extraction rate for one injection and one production well is 10.85 kW, whereas for two injection and two production wells, it is 21.69 kW, indicating that the former is approximately half of the latter. On the 3000th day, the geothermal extraction rate of one injection well and one production well is 6.70 kW, whereas the extraction rate of two injection wells and two production wells is 9.10 kW, representing a 35.82% reduction compared with the latter. This is due to the fact that in the two-well concept, the region impacted by geothermal mining is more extensive, meaning the extracted area is greater. Figure 17b illustrates that on the 3000th day of production, the cumulative geothermal energy extracted from one injection well and one production well is 485.02 MW·h, while the cumulative heat recovery from two injection wells and two production wells is 659.11 MW·h, representing an increase of 35.89% over the former. It is evident that augmenting the quantity of injection–production wells can significantly enhance geothermal output within the same time frame.
3.4. Quantitative Sensitivity Analysis of Development Parameters
To systematically evaluate the relative influence of the investigated parameters on the Enhanced Geothermal System (EGS) performance, a quantitative sensitivity summary including the percentage of change is presented in Table 4. The analysis indicates that the injection–production pressure differential exerts the most dominant control over the system’s operational dynamics. Increasing the pressure differential from 1 MPa to 7 MPa yields a massive 502.68% increase in cumulative heat extraction but drastically reduces the operational lifespan by 93.30%. The well pattern configuration ranks second in influence; transitioning from a single doublet to a multi-well pattern accelerates heat recovery by 35.89% but intensifies spatial thermal interference, reducing the lifespan by 39.50%. Conversely, the injection temperature demonstrates the lowest sensitivity regarding thermal breakthrough time (only a 4.17% reduction), though reducing it from 60 °C to 20 °C can moderately enhance the cumulative heat by 24.14%. For practical engineering applications, these findings suggest that operators should prioritize optimizing the fluid pressure differential to balance immediate heat output with long-term reservoir sustainability.
Table 4.
Quantitative comparison and sensitivity ranking of EGS development parameters.
4. Discussions
This study established a fully coupled thermo-hydro-mechanical numerical model to systematically elucidate the synergistic influence of injection–production pressure differential, injection temperature, and well configuration on the heat extraction efficacy of improved geothermal systems. This research concept aligns with the prevailing trajectory of contemporary EGS development parameter optimization. This paper underscores the impact of injection–production parameters on thermal breakthrough, aligning with Liu’s research [4] and further quantifying the specific influence range of pressure differentials on thermal breakthrough duration and system operational lifespan. The finding that reducing injection temperature enhances short-term heat recovery efficiency while diminishing system longevity aligns with numerous research conclusions regarding heat exchange between the working fluid and the reservoir, highlighting the intrinsic conflict between thermal convection efficiency and the reservoir cooling rate. This paper validates that augmenting the quantity of injection–production wells can significantly enhance the heat recovery area and concurrent production, aligning with the perspective of Cai [10] et al. on enhancing efficiency through the optimization of well group configuration based on well pattern models.
Moreover, this study has deepened the existing research in terms of coupling depth, parameter coordination, and engineering pertinence. In contrast to the partial neglect of mechanical deformation or the application of a simplified coupling model, the fully coupled THM model developed in this paper systematically elucidates the feedback mechanism of stress field variations on the dynamic evolution of permeability and more explicitly delineates the internal physical chain of the coupling process of “permeability increase–cold front fingering intensification” under conditions of high pressure differentials, which supports the result of Zeng et al. [6] regarding the influence of fracture factors on control effects. This paper elucidates the microscopic trajectory of effective conductivity within the fracture network by altering the stress state, viewed through the lens of the macroscopic engineering parameter of the injection–production pressure differential. This paper’s primary contribution lies in the systematic analysis and optimization of the parameter group comprising “pressure difference–temperature–well pattern,” distinguishing it from most studies that concentrate on a singular parameter or the fracture itself. It elucidates the relationship between each parameter and both heat recovery efficiency and system longevity, emphasizing the coordinated selection of short-term output and long-term stability. This multi-objective collaborative optimization serves as a valuable expansion of current research that typically examines the impact of parameters. This study integrates a numerical model with the distinct geological and thermophysical parameters of the Huazhou-Huayin region in the Guanzhong Basin, thereby rendering the research conclusions both theoretically valuable and regionally significant for engineering applications, addressing the limitations associated with the generalization of geological backgrounds in certain research models.
This study provides a quantitative reference for balancing short-term economic benefits and long-term sustainability in hot dry rock projects like the Guanzhong Basin. In EGS development, “optimality” must not rely solely on instantaneous power. Simulations demonstrate that maximizing short-term heat extraction (e.g., a 7 MPa pressure differential or multi-well patterns) rapidly depletes thermal resources and drastically shortens the system’s lifespan. To balance immediate returns against reservoir thermal degradation, a dynamic “high-to-low” operational strategy is recommended: initially applying a high pressure differential to stimulate early production, followed by a gradual reduction to prolong the economic recovery lifespan.
When extrapolating to field scales, the model’s limitations must be acknowledged: the 2D geometry neglects out-of-plane thermal recharge and 3D stress dissipation; the constant viscosity assumption simplifies fluid rheology changes; and for early-stage high-pressure injection in low-porosity hot dry rock, a local thermal non-equilibrium (LTNE) model would be more precise. Although these simplifications yield relatively conservative lifespan predictions, the core trade-offs revealed remain robust. Future work should develop fully coupled 3D models incorporating LTNE and temperature-dependent viscosity to precisely capture nonlinear thermo-hydraulic behaviors. Furthermore, integrating intelligent algorithms for life cycle multi-objective optimization will help accurately calibrate the optimal timing and magnitude of dynamic pressure regulation, providing robust decision support for commercial EGS development.
5. Conclusions
The development of hot dry rock geothermal resources in the Guanzhong Basin represents a complex thermo-hydro-mechanical (THM) coupled process. Based on a site-specific numerical model incorporating regional geological and thermophysical data, this study systematically evaluated the synergistic effects of pressure differentials, injection temperature, and well configuration. The primary findings and engineering guidelines are as follows:
(1) Fluid pressure differential and dynamic operational strategy: The injection–production pressure differential is the most dominant factor governing system performance. While a high pressure differential significantly enhances reservoir permeability and short-term heat extraction rates, it concurrently accelerates thermal breakthrough and drastically shortens the system’s operational lifespan. To balance immediate economic returns with long-term reservoir sustainability, a dynamic “high-to-low” operational strategy is recommended for field engineering. Operators should apply a high pressure differential during the initial stages to stimulate production and establish robust seepage channels, followed by a gradual reduction in pressure to mitigate thermal depletion and prolong the economic lifespan of the well;
(2) Injection temperature optimization: Fluctuations in injection temperature exert a relatively minor impact on the long-term macroscopic stress field of the thermal reservoir. However, moderately lowering the injection temperature induces localized thermal contraction, which improves the reservoir’s permeability characteristics and increases fluid seepage velocity. This optimizes the convective heat exchange process, thereby reliably enhancing overall geothermal mining efficiency;
(3) Well pattern configuration: The spatial arrangement of well networks critically dictates the thermal sweep volume. Increasing the density of injection and production wells (e.g., transitioning from a single doublet to multi-well arrays) can markedly improve cumulative geothermal extraction within a given time frame. Nevertheless, this configuration necessitates careful inter-well spacing design to delay the severe thermal interference caused by converging cold fronts.
Author Contributions
Conceptualization, Q.Z.; methodology, Q.Z.; software, W.Z.; validation, K.C. and X.W.; formal analysis, K.C.; investigation, R.Y.; data curation, W.Z.; writing—original draft, W.Z.; writing—review and editing, Q.Z.; visualization, R.Y.; supervision, S.C. and M.H. All authors have read and agreed to the published version of the manuscript.
Funding
This work is supported by the National Key Laboratory Fund Project of China Nuclear Uranium Industry (NKLUR-2024-YB-016), the National Natural Science Foundation of China (No. 52404155), Basic Research Program of Jiangsu (No. BK20231071), and the China Post-doctoral Science Foundation (No. 2025T180904 and No. 2024M753523), which are gratefully acknowledged.
Institutional Review Board Statement
Not applicable.
Informed Consent Statement
Not applicable.
Data Availability Statement
The original contributions presented in this study are included in the article. Further inquiries can be directed to the corresponding authors.
Acknowledgments
The authors would like to thank the anonymous reviewers for their insightful comments that helped improve the quality of this manuscript. During the preparation of this manuscript, the authors used Gemini (version 3.0) for the purposes of improving language readability and polishing the scientific writing. The authors have reviewed and edited the output and take full responsibility for the content of this publication.
Conflicts of Interest
Author Quan Zhang is employed by National Key Laboratory of Uranium Resources Exploration-Mining and Nuclear Remote Sensing (CNNC), which provided the financial and funding support for this research project. The funding sponsors had no role in the design of the study; in the collection, analyses, or interpretation of data; in the writing of the manuscript; or in the decision to publish the results. The remaining authors declare that the research was conducted in the absence of any commercial or financial relationships that could be construed as a potential conflict of interest.
References
- Zheng, K.Y.; Chen, Z.H. Hot dry rock development in China: A long way to go. Sino-Glob. Energy 2017, 22, 21–25. [Google Scholar]
- Jing, T.Y.; Zhao, W.T.; Gao, S.W.; Wang, J.Y.; Zhang, J. Practice and technical feasibility study of hot dry rock geothermal development. Sino-Glob. Energy 2018, 23, 17–22. [Google Scholar]
- Aliyu, M.D. Advanced 3D thermo-hydro-mechanical modelling of thermal aperture evolution in enhanced geothermal systems. Energy Convers. Manag. 2025, 342, 120129. [Google Scholar] [CrossRef] [Scilit]
- Liu, G.H.; Zhao, Z.H.; Xu, H.R.; Zhang, J.P.; Kong, X.J.; Yuan, L.J. A robust assessment method of recoverable geothermal energy considering optimal development parameters. Renew. Energy 2022, 201, 426–440. [Google Scholar] [CrossRef] [Scilit]
- Liu, S.; Yan, Y.; Zhang, L.; Song, W.; Feng, Y.; Feng, G.; Chen, J. Study on Reasonable Well Spacing for Geothermal Development of Sandstone Geothermal Reservoir—A Case Study of Dezhou, Shandong Province, China. Energies 2025, 18, 4149. [Google Scholar] [CrossRef] [Scilit]
- Zeng, Z.; Shen, W.; Wang, M.; Li, Z.; Wang, X.; Ding, J. Numerical simulation of multi-field coupling in geothermal reservoir heat extraction of enhanced geothermal systems. J. Pet. Explor. Prod. Technol. 2024, 14, 1631–1642. [Google Scholar] [CrossRef] [Scilit]
- Du, X.; Jiang, Y.X.; Yang, F.; Lu, D.T. Thermo-hydro-mechanical fully coupled model for enhanced geothermal system and numerical solution method based on finite volume method. Renew. Energy 2024, 237, 121559. [Google Scholar] [CrossRef] [Scilit]
- Ma, Y.Y.; Li, S.B.; Zhang, L.G.; Liu, S.Z.; Liu, Z.Y.; Li, H.; Shi, E.X. Study on the effect of well layout schemes and fracture parameters on the heat extraction performance of enhanced geothermal system in fractured reservoir. Energy 2020, 202, 117811. [Google Scholar] [CrossRef] [Scilit]
- Ma, Y.Y.; Li, S.B.; Zhang, L.G.; Liu, S.Z.; Wang, M. Heat extraction performance evaluation of U-shaped well geothermal production system under different well-layout parameters and engineering schemes. Renew. Energy 2023, 203, 473–484. [Google Scholar] [CrossRef] [Scilit]
- Cai, X.L.; Liu, Z.W.; Xu, K.; Li, B.Z.; Zhong, X.; Yang, M.H. Numerical simulation study of an Enhanced Geothermal System with a five-spot pattern horizontal well based on thermal-fluid-solid coupling. Appl. Therm. Eng. 2025, 258, 124649. [Google Scholar] [CrossRef] [Scilit]
- Janiga, D.; Kwaśnik, J.; Wojnarowski, P. Utilization of Discrete Fracture Network (DFN) in Modelling and Simulation of a Horizontal Well-Doublet Enhanced Geothermal System (EGS) with Sensitivity Analysis of Key Production Parameters. Energies 2022, 15, 9020. [Google Scholar] [CrossRef] [Scilit]
- Nassereddine, A.; Zerpa, L.E. On the Feasibility of Deep Geothermal Wells Using Numerical Reservoir Simulation. Processes 2024, 12, 1369. [Google Scholar] [CrossRef] [Scilit]
- Chen, Y.; Ma, G.W.; Wang, H.D.; Li, T. Evaluation of geothermal development in fractured hot dry rock based on three dimensional unified pipe-network method. Appl. Therm. Eng. 2018, 136, 219–228. [Google Scholar] [CrossRef] [Scilit]
- Chen, Y.; Ma, G.W.; Wang, H.D.; Li, T.; Wang, Y. Application of carbon dioxide as working fluid in geothermal development considering a complex fractured system. Energy Convers. Manag. 2019, 180, 1055–1067. [Google Scholar] [CrossRef] [Scilit]
- Okoroafor, E.R.; Horne, R.N. Temperature-dependent viscosity: Relevance to the numerical simulation of enhanced geothermal systems. Therm. Sci. Eng. Prog. 2022, 34, 101439. [Google Scholar] [CrossRef] [Scilit]
- Huang, Q.; Guo, N.; Huang, H.B.; Yu, J.; Hu, M.B. Method to improve heat extraction in enhanced geothermal systems with heterogeneous fracture network. Adv. Appl. Math. Mech. 2024, 17, 1–30. [Google Scholar] [CrossRef] [Scilit]
- Xiong, F.; Zhu, C.; Feng, G.; Zheng, J.; Sun, H. A three-dimensional coupled thermo-hydro model for geothermal development in discrete fracture networks of hot dry rock reservoirs. Gondwana Res. 2023, 122, 331–347. [Google Scholar] [CrossRef] [Scilit]
- Guo, T.K.; Zhang, Y.L.; He, J.Y.; Gong, F.C.; Chen, M.; Liu, X.Q. Research on geothermal development model of abandoned high temperature oil reservoir in North China oilfield. Renew. Energy 2021, 177, 1–12. [Google Scholar] [CrossRef] [Scilit]
- Pruess, K. On production behavior of enhanced geothermal systems with CO2 as working fluid. Energy Convers. Manag. 2008, 49, 1446–1454. [Google Scholar] [CrossRef] [Scilit]
- Magliocco, M.J.; Glaser, S.D.; Kneafsey, T.J. Laboratory and Numerical Studies of Heat Extraction from Hot Porous Media by Means of Supercritical CO2. Transp. Porous Media 2015, 108, 85–104. [Google Scholar] [CrossRef] [Scilit]
- Biagi, J.; Agarwal, R.; Zhang, Z. Simulation and optimization of enhanced geothermal systems using CO2 as a working fluid. Energy 2015, 86, 627–637. [Google Scholar] [CrossRef] [Scilit]
- Qiao, M.Z.; Jing, Z.F.; Feng, C.C.; Li, M.H.; Chen, C.; Zou, X.P.; Zhou, Y.J. Review on heat extraction systems of hot dry rock: Classifications, benefits, limitations, research status and future prospects. Renew. Sustain. Energy Rev. 2024, 196, 114364. [Google Scholar] [CrossRef] [Scilit]
- Miranda, M.M.; Raymond, J.; Dezayes, C.; Wigston, A.; Perreault, S. Multiscale fracture networks and their impact on hydroshearing response in the Canadian Shield (Kuujjuaq, Canada). Geomech. Geophys. Geo-Energy Geo-Resour. 2023, 9, 85. [Google Scholar] [CrossRef] [Scilit]
- Aliyu, M.D.; Chen, H.P. Enhanced geothermal system modelling with multiple pore media: Thermo-hydraulic coupled processes. Energy 2018, 165, 931–948. [Google Scholar] [CrossRef] [Scilit]
- Qu, H. Numerical Simulation of Heat Flow Coupling in Dry Hot Rock Mining in Shaanxi Province. Master’s Thesis, Chang’an University, Xi’an, China, 2023. [Google Scholar] [CrossRef]
- Rao, S.; Jiang, G.Z.; Gao, Y.J.; Hu, S.B.; Wang, J.Y. The thermal structure of the lithosphere and heat source mechanism of geothermal field in Weihe Basin. Chin. J. Geophys. 2016, 59, 2176–2190. [Google Scholar]
- Xu, Y.G.; Chung, S.L.; Ma, J.; Shi, L. Contrasting Cenozoic Lithospheric Evolution and Architecture in the Western and Eastern Sino-Korean Craton: Constraints from Geochemistry of Basalts and Mantle Xenoliths. J. Geol. 2004, 112, 593–605. [Google Scholar] [CrossRef] [Scilit]
- Li, X.C.; Ma, Z.Y.; Zhang, X.L.; Guo, S.; Meng, Y.; Dang, S.S. Genetic model of the Dongda geothermal field in Guanzhong Basin, Shaanxi Province. Geol. China 2016, 43, 2082–2091. [Google Scholar]
- Hong, Z.L.; Zhng, Y.L.; Zhou, Y. Research on the modes of occurrence and application of geothermal resources in the middle and deep layers of the piedmont area in southern Guanzhong Basin. Geol. China 2019, 46, 1224–1235. [Google Scholar]
- Lin, A.; Rao, G.; Yan, B. Flexural fold structures and active faults in the northern–western Weihe Graben, central China. J. Asian Earth Sci. 2015, 114, 226–241. [Google Scholar] [CrossRef] [Scilit]
- Li, R.X.; Liu, C.J.; Wei, G.F.; Zhao, F.S. Origin and source of dissolved hydrocarbon gas in geothermal water, Weihe Basin. Nat. Gas Geosci. 2009, 20, 774–780. [Google Scholar]
- Zhou, Y.; Jiang, S.; Ke, T.T.; An, C.; Wang, H.; Zhang, L.; Jia, H.L.; Jiang, C.; Zhao, H.Q.; Guo, H.; et al. Heat source mechanism and mining potential of dry hot rock resources in Huayin Huazhou area, Shaanxi Province. Geol. China 2025, 1–16. Available online: https://link.cnki.net/urlid/11.1167.p.20240923.1837.006 (accessed on 28 February 2026).
- Huang, J.J.; Zhou, Y.; Teng, H.Q.; Liang, X.Y.; Gao, J.B.; Cao, X.F.; Xue, S.Z.; Cui, Y. On the occurrence characteristics and the estimation of geothermal water in Xi’an Sag, Guanzhong Basin. Northwest. Geol. 2021, 54, 196–203. [Google Scholar]
- Zhou, Y.; Mu, G.X.; Zhang, H.; Wang, K.; Liu, J.Q.; Zhang, Y.G. Geothermal field division and its geological influencing factors in Guanzhong basin. Geol. China 2017, 44, 1017–1026. [Google Scholar]
- Wang, J.Y.; Hu, S.B.; Pang, Z.H.; He, L.J.; Zhao, P.; Zhu, C.Q.; Rao, S.; Tang, X.Y.; Kong, Y.L.; Luo, L.; et al. Estimate of geothermal resources potential for hot dry rock in the continental area of China. Sci. Technol. Rev. 2012, 30, 25–31. [Google Scholar]
- Sun, Z.X.; Xu, Y.; Lv, S.H.; Xu, Y.; Sun, Q.; Cai, M.Y.; Yao, J. A thermo-hydro-mechanical coupling model for numerical simulation of enhanced geothermal systems. J. China Univ. Pet. (Ed. Nat. Sci.) 2016, 40, 109–117. [Google Scholar]
- Jiang, X.X.; Zhu, C.Q.; Ding, R.; Xie, F.; Qiu, N.S. Evaluating the exploitation and utilization prospects of hot dry rock in Bohai Bay Basin: Understanding based on numerical simulations for exploitation optimization. Coal Geol. Explor. 2024, 52, 93–103. [Google Scholar]
- Qu, Z.Q.; Zhang, W.; Guo, T.K.; Sun, J.; Gong, F.C.; Tian, Y.; Li, X.L. Numerical simulation of heat mining performance of hot dry rocks with fracture network based on a local thermal non-equilibrium model. J. China Univ. Pet. (Ed. Nat. Sci.) 2019, 43, 90–98. [Google Scholar]
- Wang, Z.L. Study on the Coupled Thermal-Hydrologic-Mechanical Model in Fractured Rock Mass and Its Application. Master’s Thesis, China University of Mining and Technology, Xuzhou, China, 2015. [Google Scholar]
- DBJ/T166-2020; Technical Regulation for Medium Deep Geothermal Buried Pipe Heating System. Shaanxi Geothermal Association: Xi’an, China, 2020.
- Chen, T.R.; Liu, G.; Liao, S.M. Impacts of boundary conditions on reservoir numerical simulation and performance prediction of enhanced geothermal systems. Energy 2019, 181, 202–213. [Google Scholar] [CrossRef] [Scilit]
- Fan, D.Y.; Sun, H.; Yao, J.; Li, H.F.; Yan, X.; Zhang, K.; Zhang, L. Parametric analysis of different injection and production well pattern in Enhanced Geo-thermal System. J. Jilin Univ. (Earth Sci. Ed.) 2019, 49, 797–806. [Google Scholar] [CrossRef]

Disclaimer/Publisher’s Note: The statements, opinions and data contained in all publications are solely those of the individual author(s) and contributor(s) and not of MDPI and/or the editor(s). MDPI and/or the editor(s) disclaim responsibility for any injury to people or property resulting from any ideas, methods, instructions or products referred to in the content. |
© 2026 by the authors. Licensee MDPI, Basel, Switzerland. This article is an open access article distributed under the terms and conditions of the Creative Commons Attribution (CC BY) license.