


Abstract
Mineral resources serve as a critical foundation for China’s energy system, with the Ordos Basin’s Tarangole mining area being a key mineral production base in the central and western regions. To support the restoration, development, and productivity enhancement of the mining area, this research systematically investigates the geological and mechanical properties of the sandstone in the region. Herein the innovation lies in its comprehensive analysis of the influence mechanisms of multiple factors—such as geological groups, particle size, evaluation indicators, sampling depth, temperature, and creep rate—on the mechanical behavior of sandstone. The study, through engineering geological surveys and mechanical testing of frozen sandstone (including uniaxial and triaxial creep tests), led to the following key findings: (1) the sandstone in the area is prone to softening and disintegration, classified as soft to moderately soft rock (UCS range: 5.14–10.26 MPa in natural state), with a basic quality grade of IV–V. (2) The thermal conductivity and specific heat capacity of the rock vary significantly with temperature. The recommended freezing temperature is −5 °C, based on engineering experience and economic considerations. (3) Freezing can effectively enhance the strength of sandstone (e.g., the strength of medium- and coarse-grained sandstone increases by 5 MPa at −20 °C compared to −10 °C), although it still falls within the category of extremely soft rock. (4) The water-ice phase transition induced by low temperatures significantly enhances the overall strength, stiffness, and deformation resistance of saturated sandstone. Accordingly, freezing measures can effectively enhance rock mass strength under low-temperature conditions. It is recommended that mining operations be prioritized during winter or colder seasons to ensure construction safety and efficiency.
1. Introduction
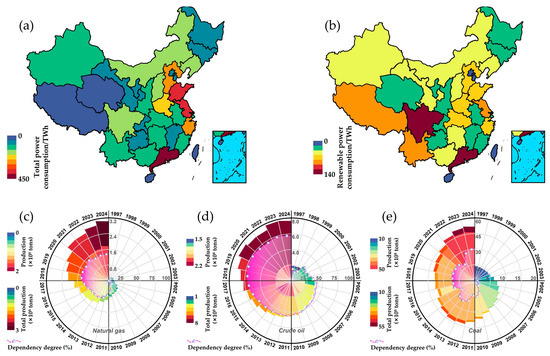
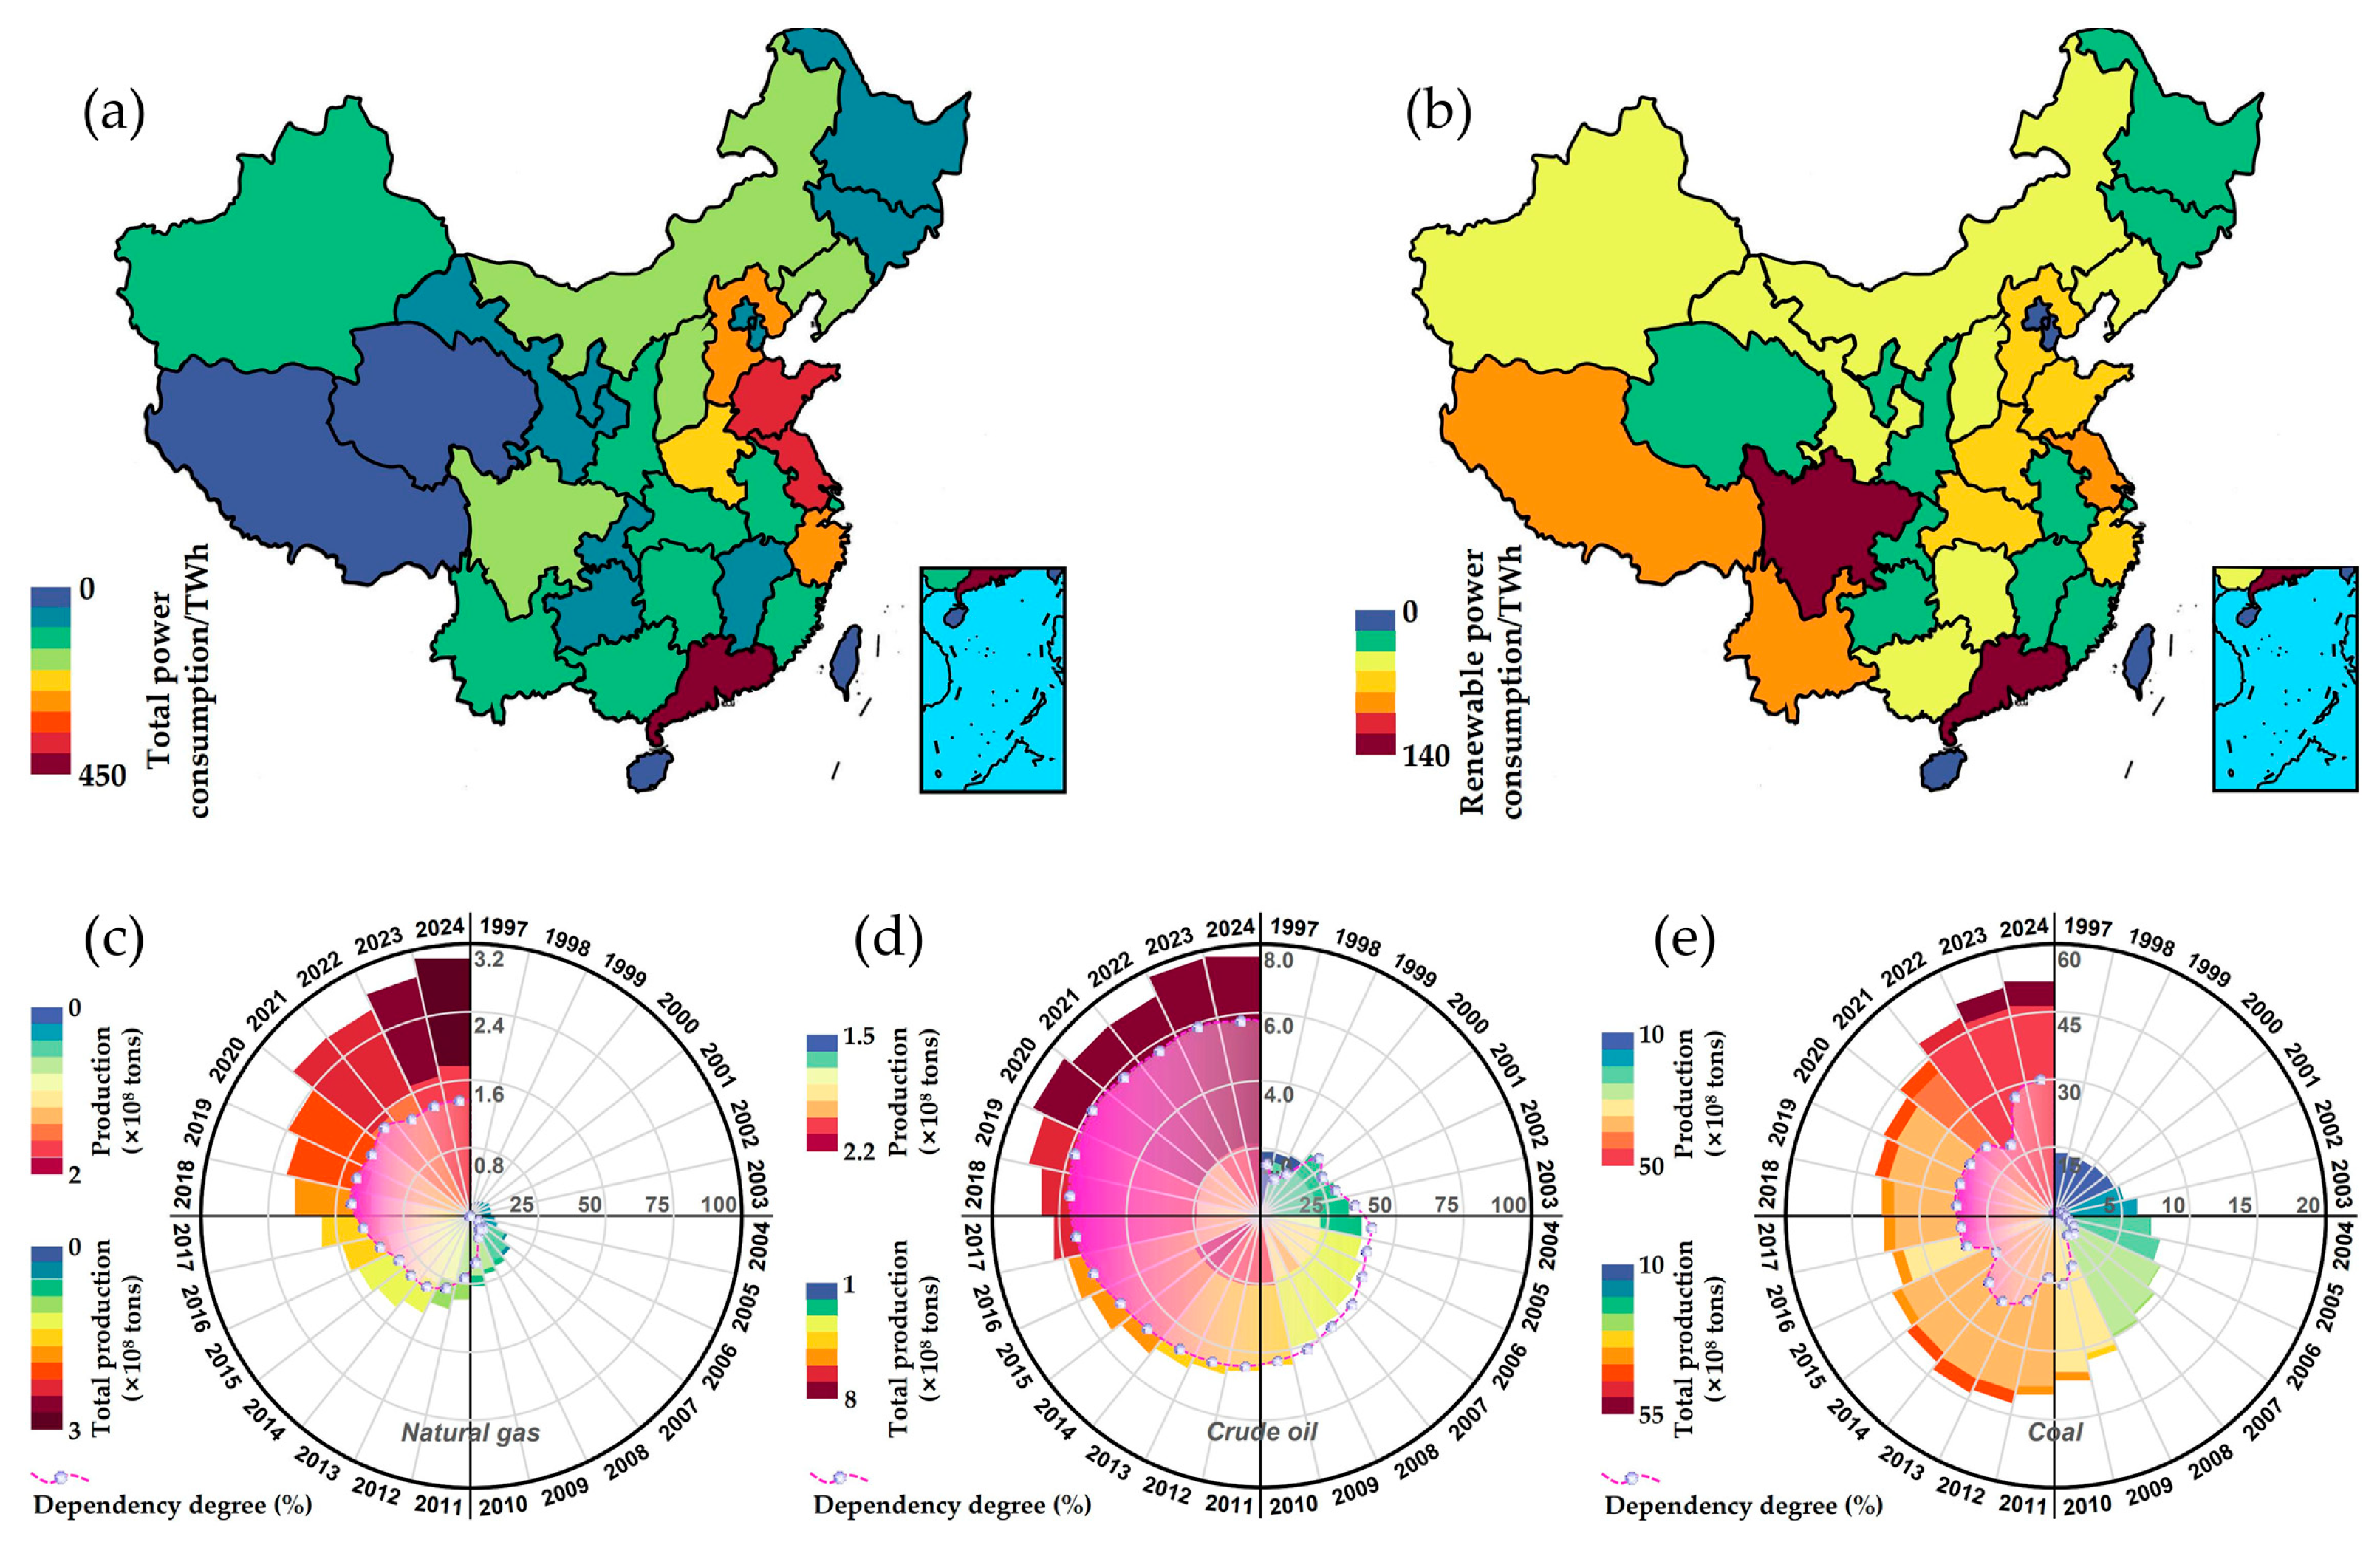
Coal, as the “ballast” and “stabilizer” of China’s energy system, has a strategic position that is closely linked to the lifeline of the national economy and the fundamental interests of energy security [1,2,3]. Coal has long maintained a dominant position, accounting for approximately 66% of China’s primary energy consumption, and this significant share is expected to persist for a considerable period in the future [4]. Based on data released by China’s National Energy Administration (CNEA), we investigated the production, imports, and external dependency of conventional fossil fuels (natural gas, crude oil, and coal) in China from 1997 to 2024, as illustrated in Figure 1 [5]. The survey revealed that the total production of fossil fuels has gradually increased, reaching 246.4 billion m3, 213 million tons, and 4.76 billion tons in 2024 (Figure 1c–e), respectively. Herein coal production remained the highest. Notably, Figure 1a depicts the annual average electricity generation by province in China over the past 28 years, with a total annual generation of 4584 TWh. Renewable energy sources, including hydropower, wind power, solar PV, and biomass, contributed an average annual generation of 1555.6 TWh, accounting for 34% of the total (Figure 1b). Driven by the dual carbon goals, China’s energy mix continues to optimize. Although coal production has peaked, its proportion in newly installed capacity is gradually decreasing, especially in regions like Inner Mongolia, where solar and wind energy are rapidly surging [6,7]. However, the mining of coal resources in recent decades has resulted in some mining areas being classified as “difficult-to-extract zones”, encompassing constraints across multiple factors such as safety, economics, technology, and the environment [8]. Moreover, the cold winters in northwestern China increase the difficulty of mining coal-rock masses under freeze–thaw conditions [9]. Thus, for some large-scale coal mining bases in northwestern China, how to reintegrate them into resource development and enhance mining safety standards represents a pressing challenge that requires urgent resolution.
Figure 1.
China’s energy distribution from 1997 to 2024. (a) Total power consumption in each province, city, and autonomous region; (b) total renewable power consumption in each province, city, and autonomous region; (c) natural gas production, import and external dependence in different years; (d) crude oil production, import and external dependence in different years; and (e) coal production, import and external dependence in different years.
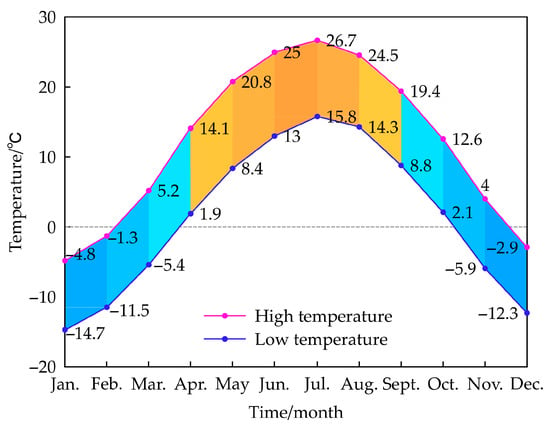
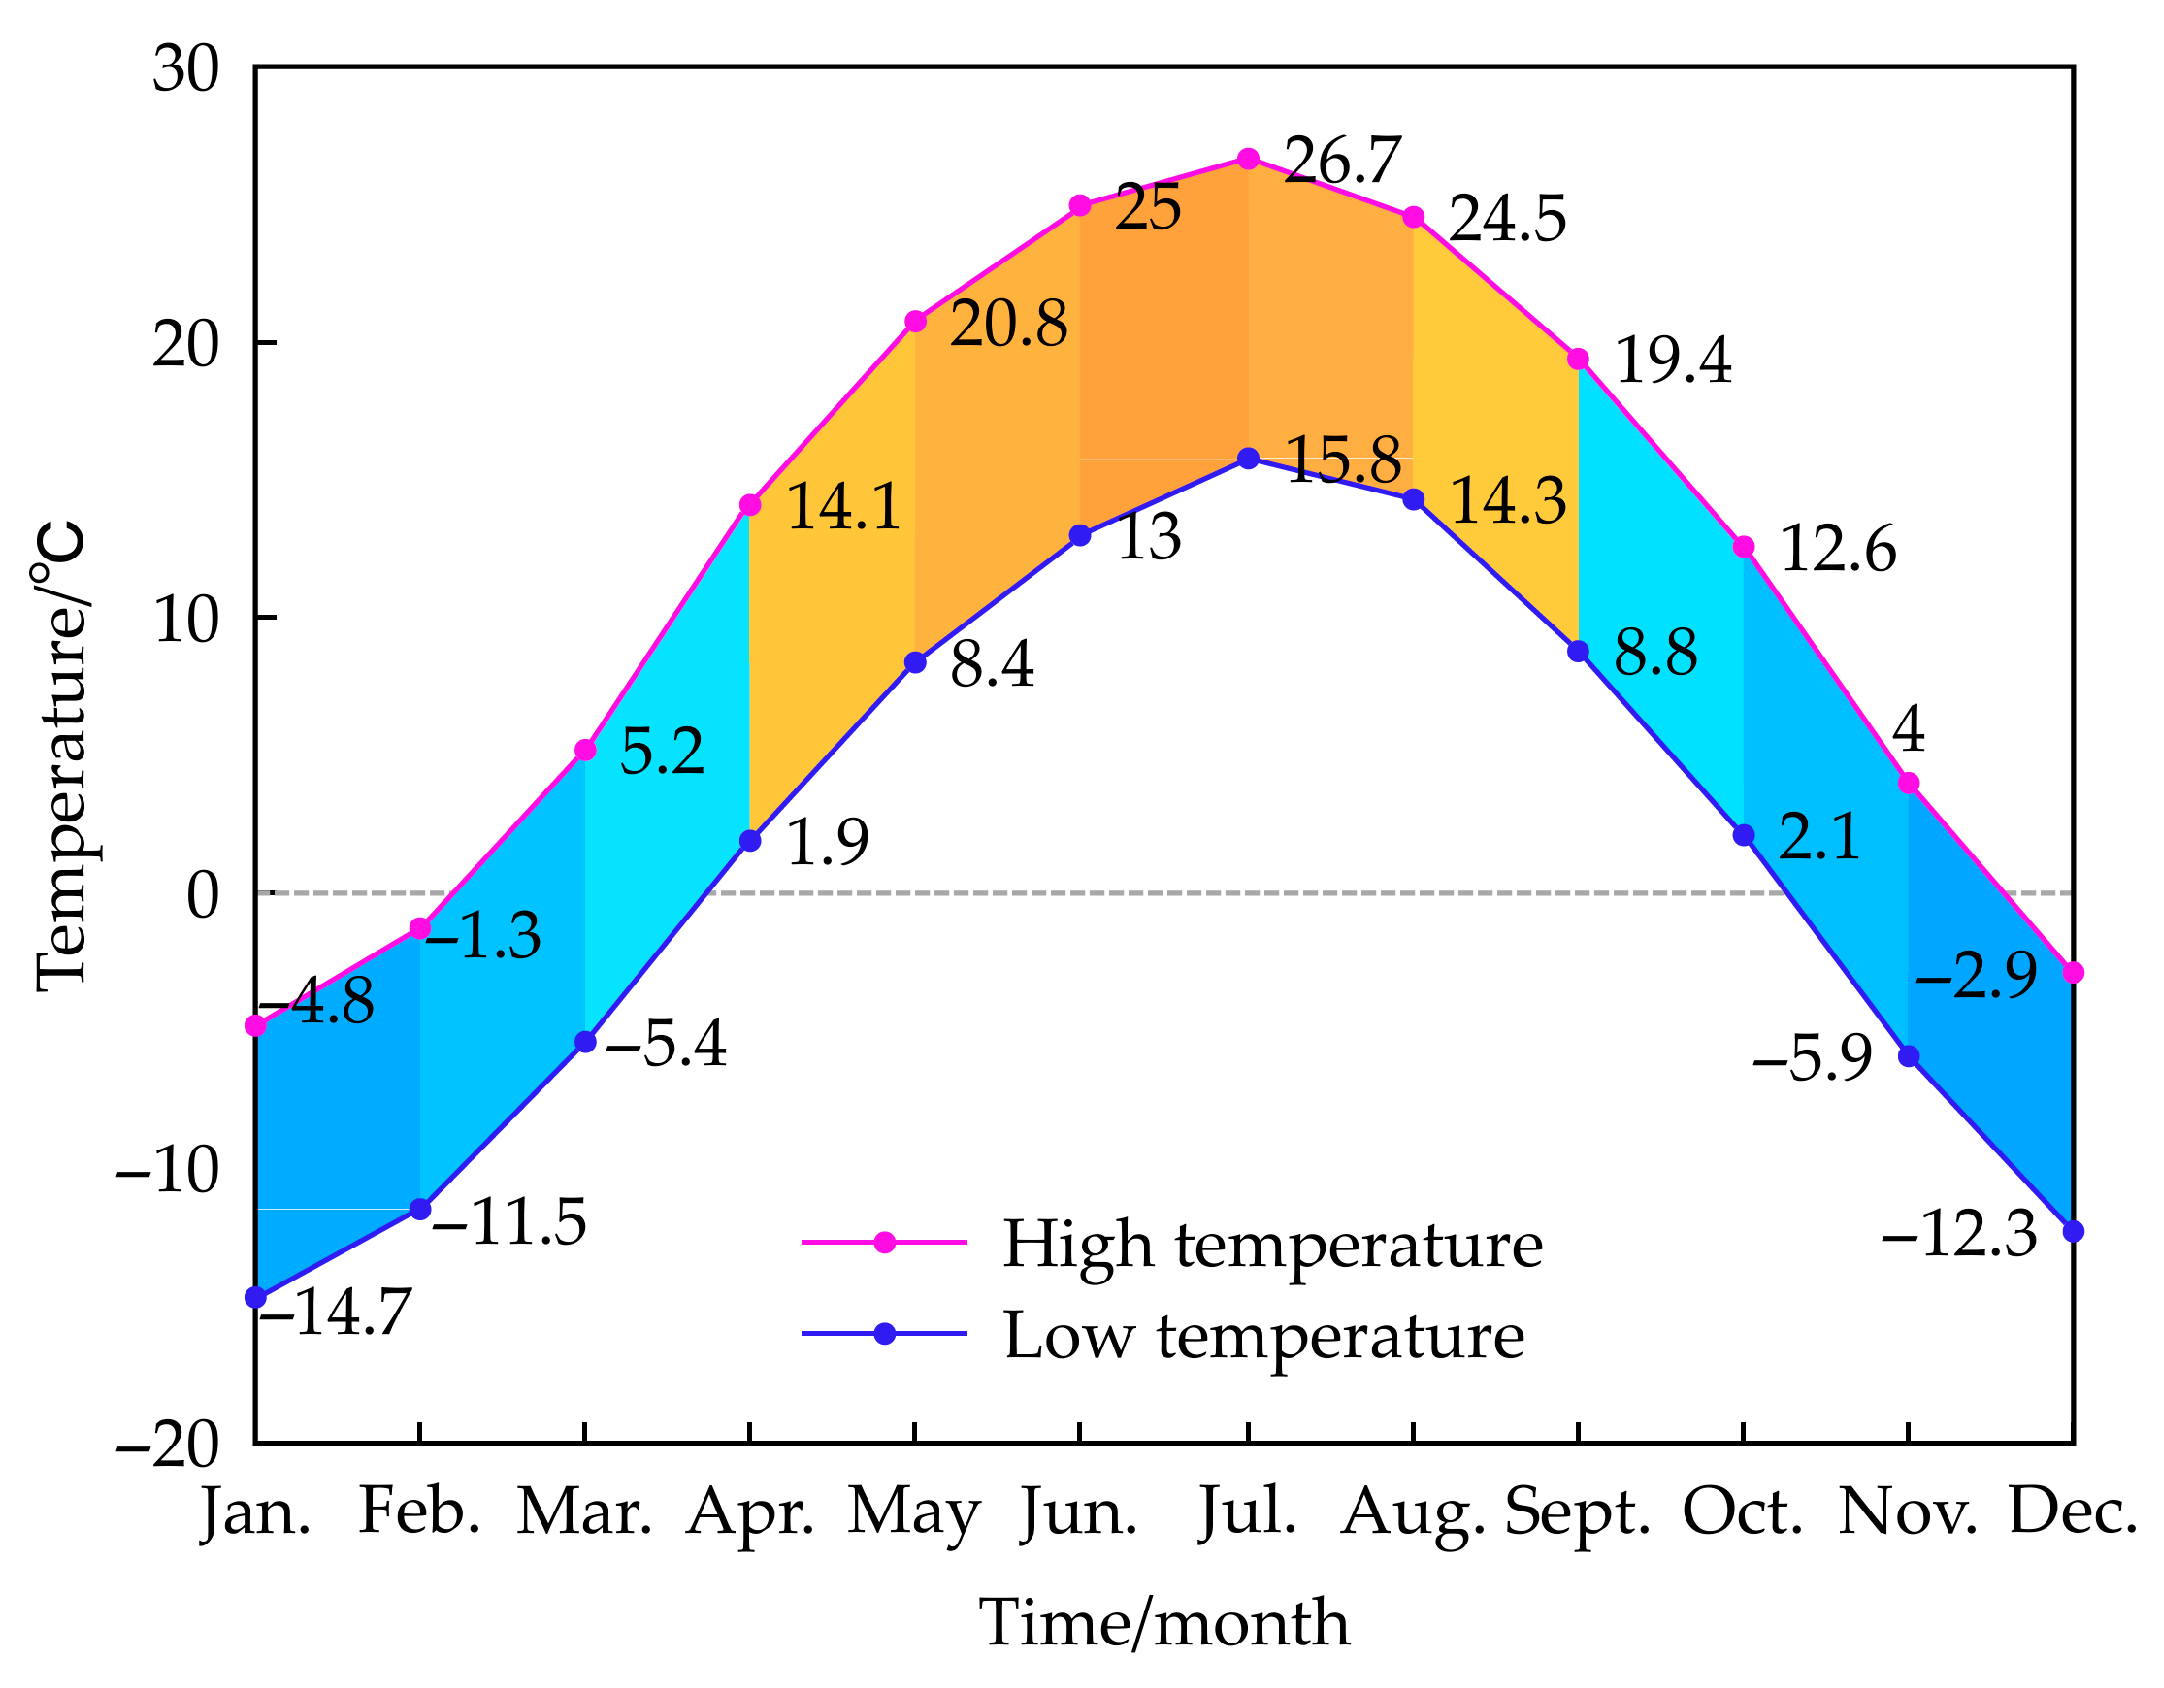
The Ordos Basin is one of China’s largest sedimentary basins, boasting abundant resources such as coal, crude oil, natural gas, and uranium. Herein the Tarangole mining area is a typical representative of the resource-rich region in the Ordos Basin, characterized by a relatively stable geological structure dominated by gently dipping monocline layers [10,11]. Previous research has shown that the proven coal reserves in this region exceed several billion tons. Here, the coal quality is mostly characterized by low ash, low sulfur, low phosphorus, and medium to high calorific value, featuring high-quality non-sticky coal and long-flame coal. It can provide an important guarantee of thermal coal for the central and eastern regions of China [12]. However, during the mine construction period, the hydrogeological conditions became extremely complex due to the high permeability of the Cretaceous porous-fissure aquifer and the Zhiluo Formation aquifer. This led to extremely difficult and costly construction treatment, and it was also the main reason for the eventual adoption of the freezing method [13]. Secondly, the excessive mining of relatively easy-to-mine coal seams over many years has led to the destruction of the overlying strata, threatening the safety of local residents and property [14]. Finally, due to the influence of altitude and climate, the temperature in the mining area remains below 0 °C for about five months each year—from November to March—with freeze–thaw cycles occurring, which seriously restrict the smooth progress of the project (Figure 2) [15,16]. Therefore, how to effectively investigate the rock properties and mechanical characteristics under freeze–thaw conditions in the Tarangole coal mining area has become the primary challenge for efficient coal mining.
Figure 2.
The monthly average high and low temperature curves for the Tarangole mining area in 2024.
In the mining process of the Tarangole coal mine, hydrogeological investigation has always been the forerunner and cornerstone, providing an indispensable scientific basis for the safe and efficient development of this complex mining area. Vervoort [17] studied the influence of hydrogeological conditions on the calculation of surface uplift in flooded, abandoned coal mines. Cravotta et al. [18] evaluated the locations, magnitude, and impact of stream-water losses from the West Creek sub-basin of the West Branch Schuylkill River into the underground Oak Hill Mine complex that extends beneath the watershed divide. In addition, under the disturbance of engineering activities, the roof strata cannot resist the redistributed stress due to their insufficient strength [19]. Research findings indicate that the lower part of the study area consists of weak rock strata (such as mudstone and coal), while the upper part is composed of hard, thick rock strata (such as sandstone). This significantly increases the risk of roof subsidence. Moreover, the unknown strength of sandstone under freeze–thaw conditions further poses a threat to coal resource mining [20,21,22]. Qiu et al. [23] conducted freeze–thaw cycle tests (with a temperature range of −20 °C to 20 °C) on sandstones under different water immersion conditions and found that both the number of freeze–thaw cycles and the immersion duration would affect the microstructure deterioration of partially immersed sandstones. Han et al. [24] investigated the deformation mechanism and evolution characteristics of red sandstone with different fracture depths under freeze–thaw cycles. Research results indicate that fissured red sandstone undergoes residual strain during freeze–thaw cycles, and the continuous accumulation of this strain can lead to irreversible damage and deformation. In terms of numerical simulation and machine learning, Jia et al. [25] developed a rock freeze–thaw damage model based on discrete elements, suggesting that as the number of freeze–thaw cycles increases, the evolution of fractures undergoes three stages: slow, rapid, and stabilization. Miao et al. [26] proposed a numerical model for freeze–thaw damage, with an error of only 2.1% between the predicted and actual values, which can provide theoretical value for the excavation of rock masses in cold regions. Zhou et al. [27] developed a genetic algorithm (GA) enhanced backpropagation neural network (BPNN) model (GA-BPNN) and a BP-aided Duncan-Chang (D-C) model to forecast the mechanical properties of freeze–thaw clay. Herein the R2 values of the models are 0.995 and 0.967, respectively, demonstrating good robustness. Zhou et al. [28] optimized the kernel scale, penalty factor, and insensitive loss coefficient of the support vector regression (SVR) model using five swarm intelligence optimization algorithms, thereby developing five hybrid models. The results show that the proposed hybrid-SVR models can provide accurate dynamic compressive strength predictions.
Although the aforementioned scholars have conducted extensive research on mechanical tests, numerical simulations, and machine learning, they lack comprehensive on-site investigations of the geological conditions and lithology of different strata in the Tarangole coal mining area. Additionally, there is a lack of multi-factor and systematic mechanical research on the hard, thick rock layers (such as sandstone) in the roof of this mining area under frozen conditions. Accordingly, in response to these two challenges, this study systematically investigated the geological and mechanical properties of sandstone in a certain mining area. Through an innovative comprehensive analysis of multiple factors such as geological groups, particle size, sampling depth, temperature, and creep rate, the influence mechanisms of these factors on the mechanical behavior of sandstone are revealed. Herein the main research findings confirm that low-temperature freezing can effectively enhance the strength and stability of rock masses. It is suggested that the mining area give priority to mining during the cold season, taking advantage of the natural strengthening effect to ensure safety and improve efficiency.
2. Engineering Background
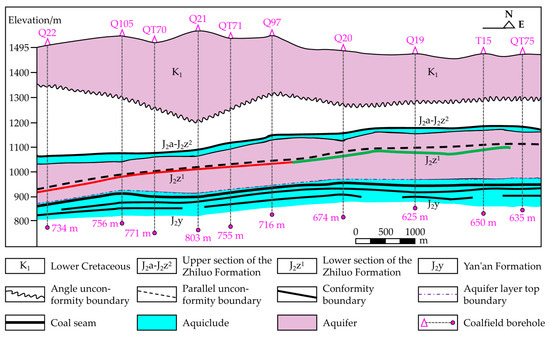
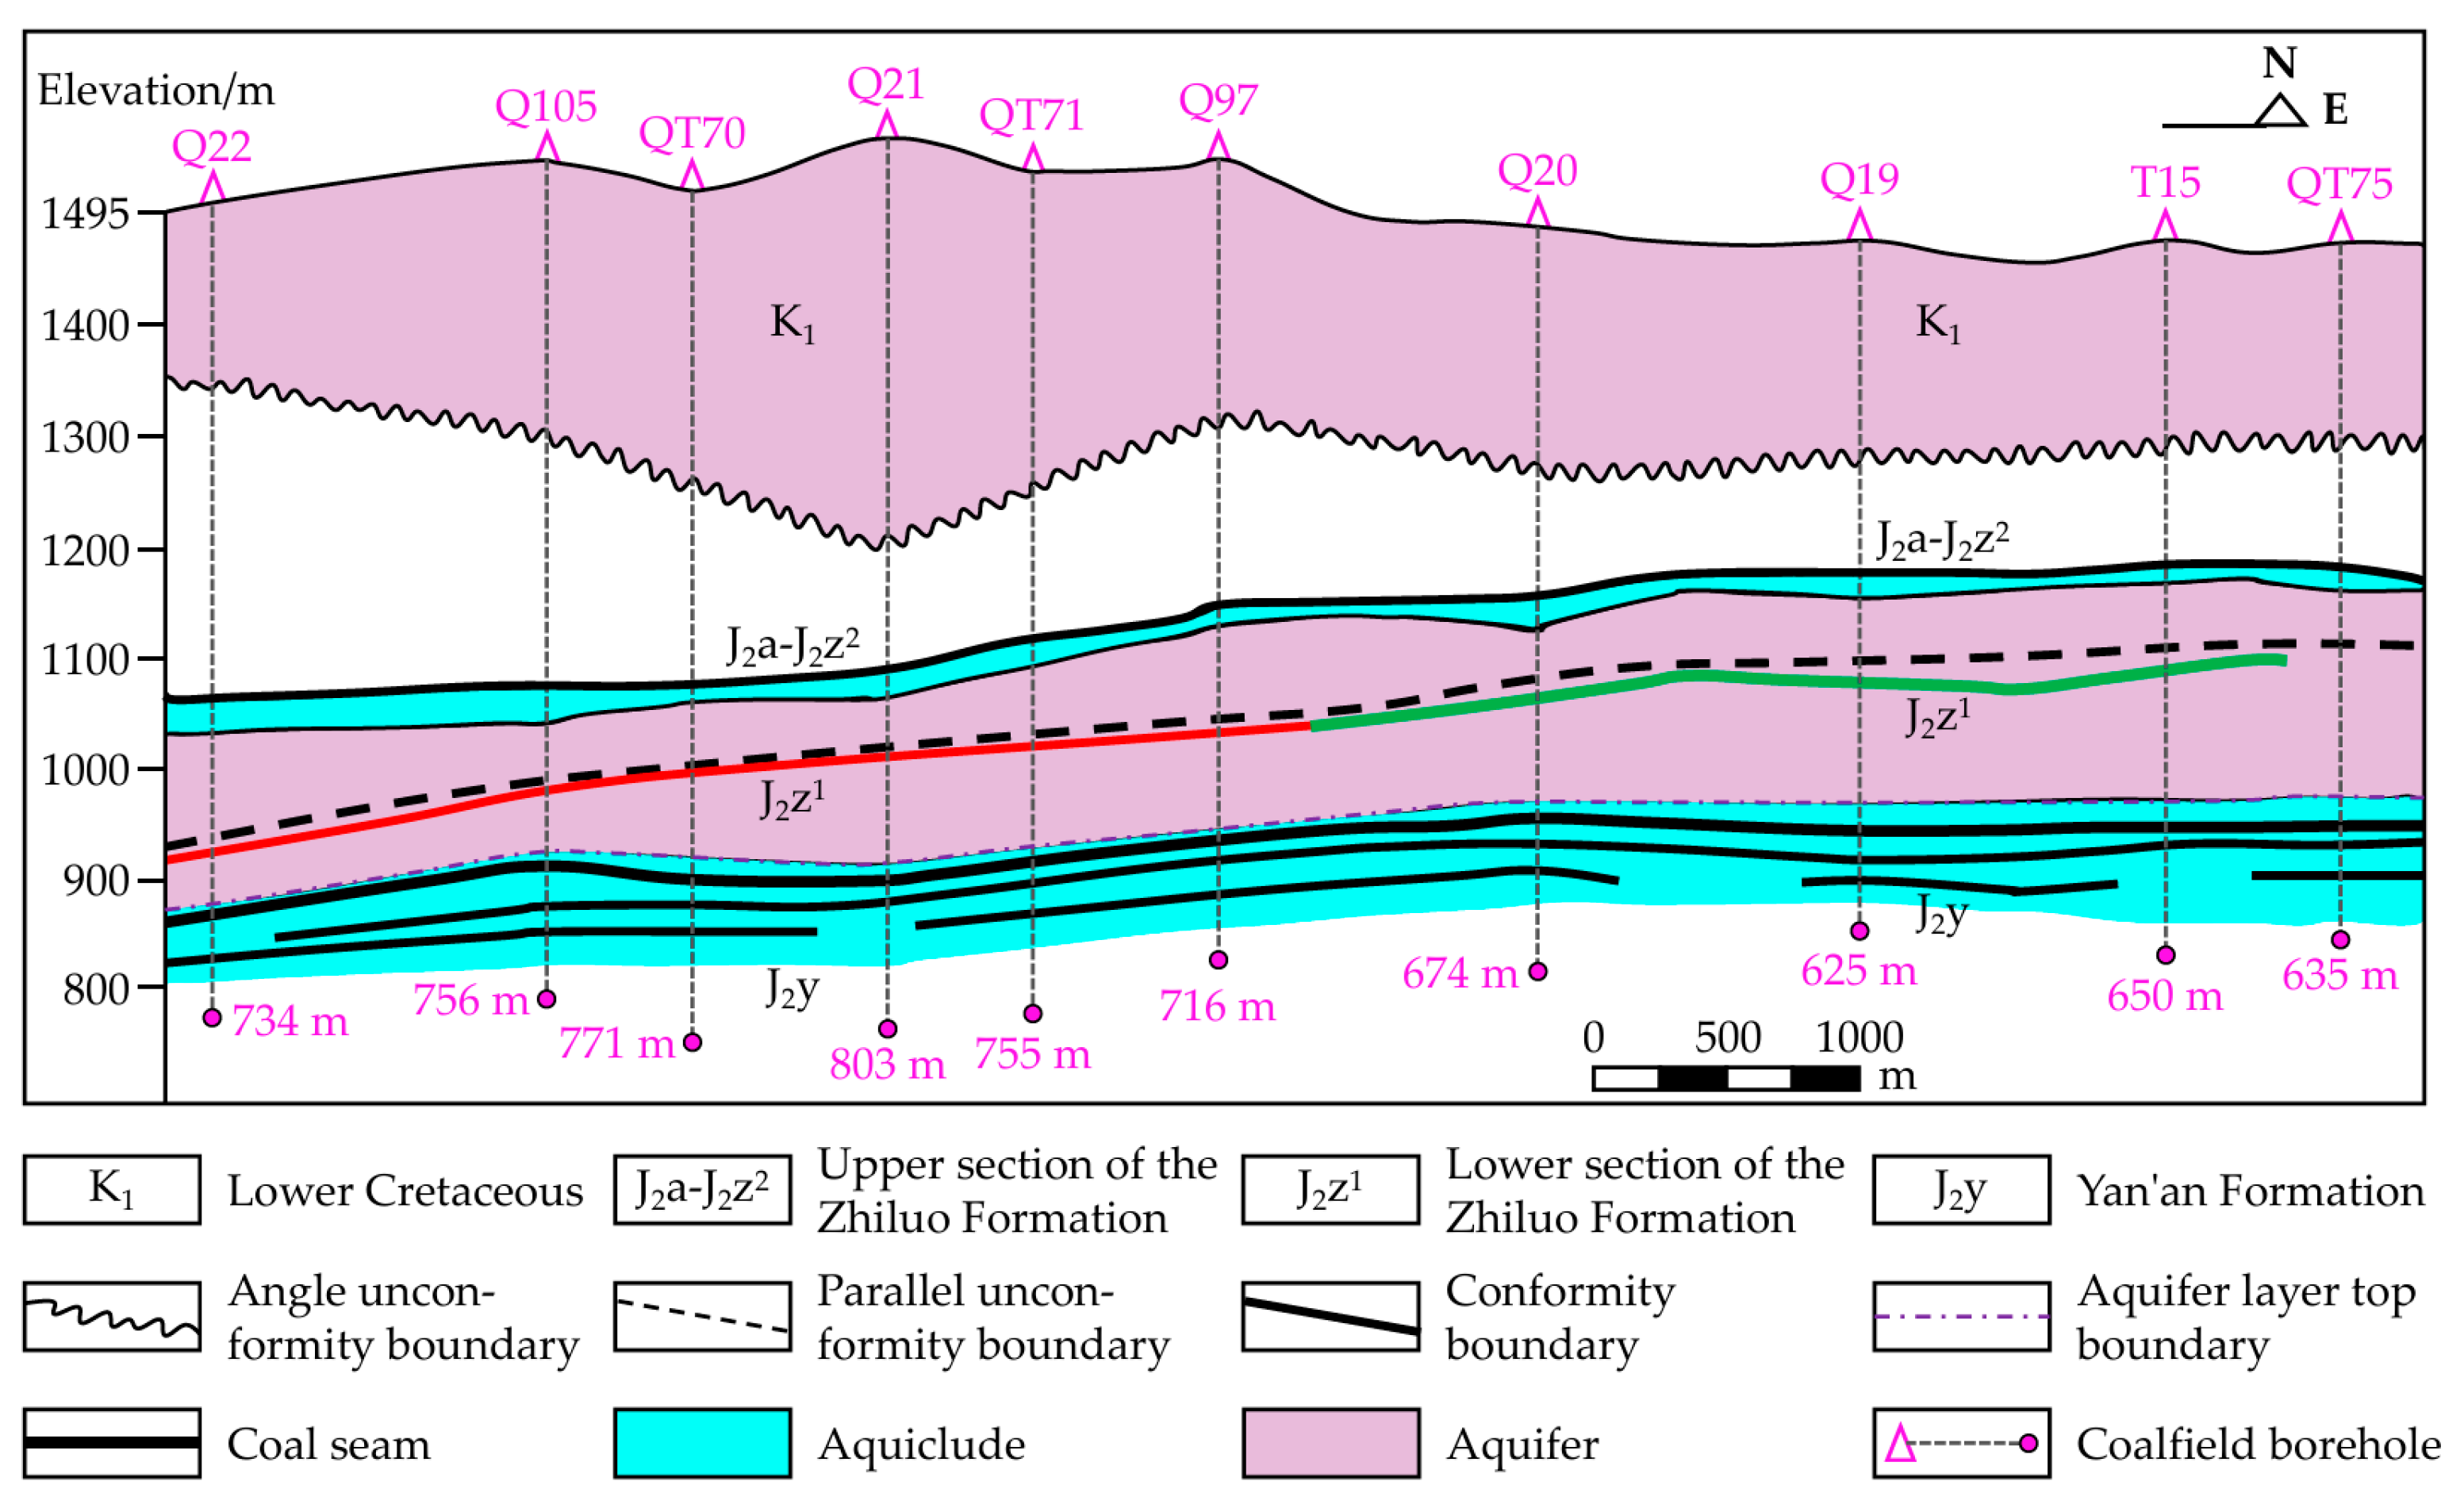
The Tarangole mining area is located in Dalad Qi, Ordos City, Inner Mongolia Autonomous Region. The area is generally wedge-shaped and irregular, with a length of about 11 km from east to west and a width of approximately 9 km from north to south, covering a total area of approximately 99 km2. Among them, the general terrain elevation ranges between 1410 and 1530 m, with an elevation difference of approximately 120 m. The freezing period usually starts in October and lasts until May of the following year. The maximum depth of frozen soil is 1.71 m, and the maximum number of days with sandstorms is 40 per year [29]. As shown in Figure 3, the ore body is in the form of a plate or lens, and its orientation is basically parallel to the strata. The vertical distance from this interface to the lower Ziluo Formation is 60 m to 100 m. The mining area has complex hydrogeological conditions, and coal seam extraction faces the direct threat of roof water. In terms of metallogenic characteristics, in addition to coal resources, it is also a typical representative of the “Tale-type” sandstone-type uranium deposit, presenting a unique resource assemblage of coal-uranium coexistence.
Figure 3.
Hydrogeological profile of the Tarangole area.
The coal seams exposed by drilling in the Tarangole coalfield consist of three layers from top to bottom. The second layer of coal is located 20 m to 32 m below the first layer, with relatively large thickness and good continuity, making it the primary exploitable coal seam in the area; the bottommost layer is located 15 m to 21 m below the middle layer, with stable thickness and good continuity, making it a secondary exploitable coal seam in the area. Through investigation, the coal-bearing strata in the study area are composed of mudstone, sandstone of various grain sizes, and coal seams. The Quaternary strata are made up of medium sand, fine sand, gravel, and clay. Herein the proportion of sandstone is approximately 80%. Therefore, in the subsequent outdoor investigations and indoor tests, we focused on analyzing the mechanical properties of sandstone.
3. Materials and Methods
3.1. Mechanical Properties of Sandstone and Soil
Loose sandy soil layer group:
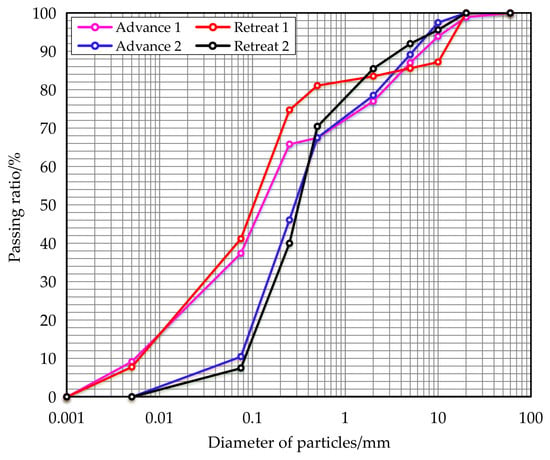
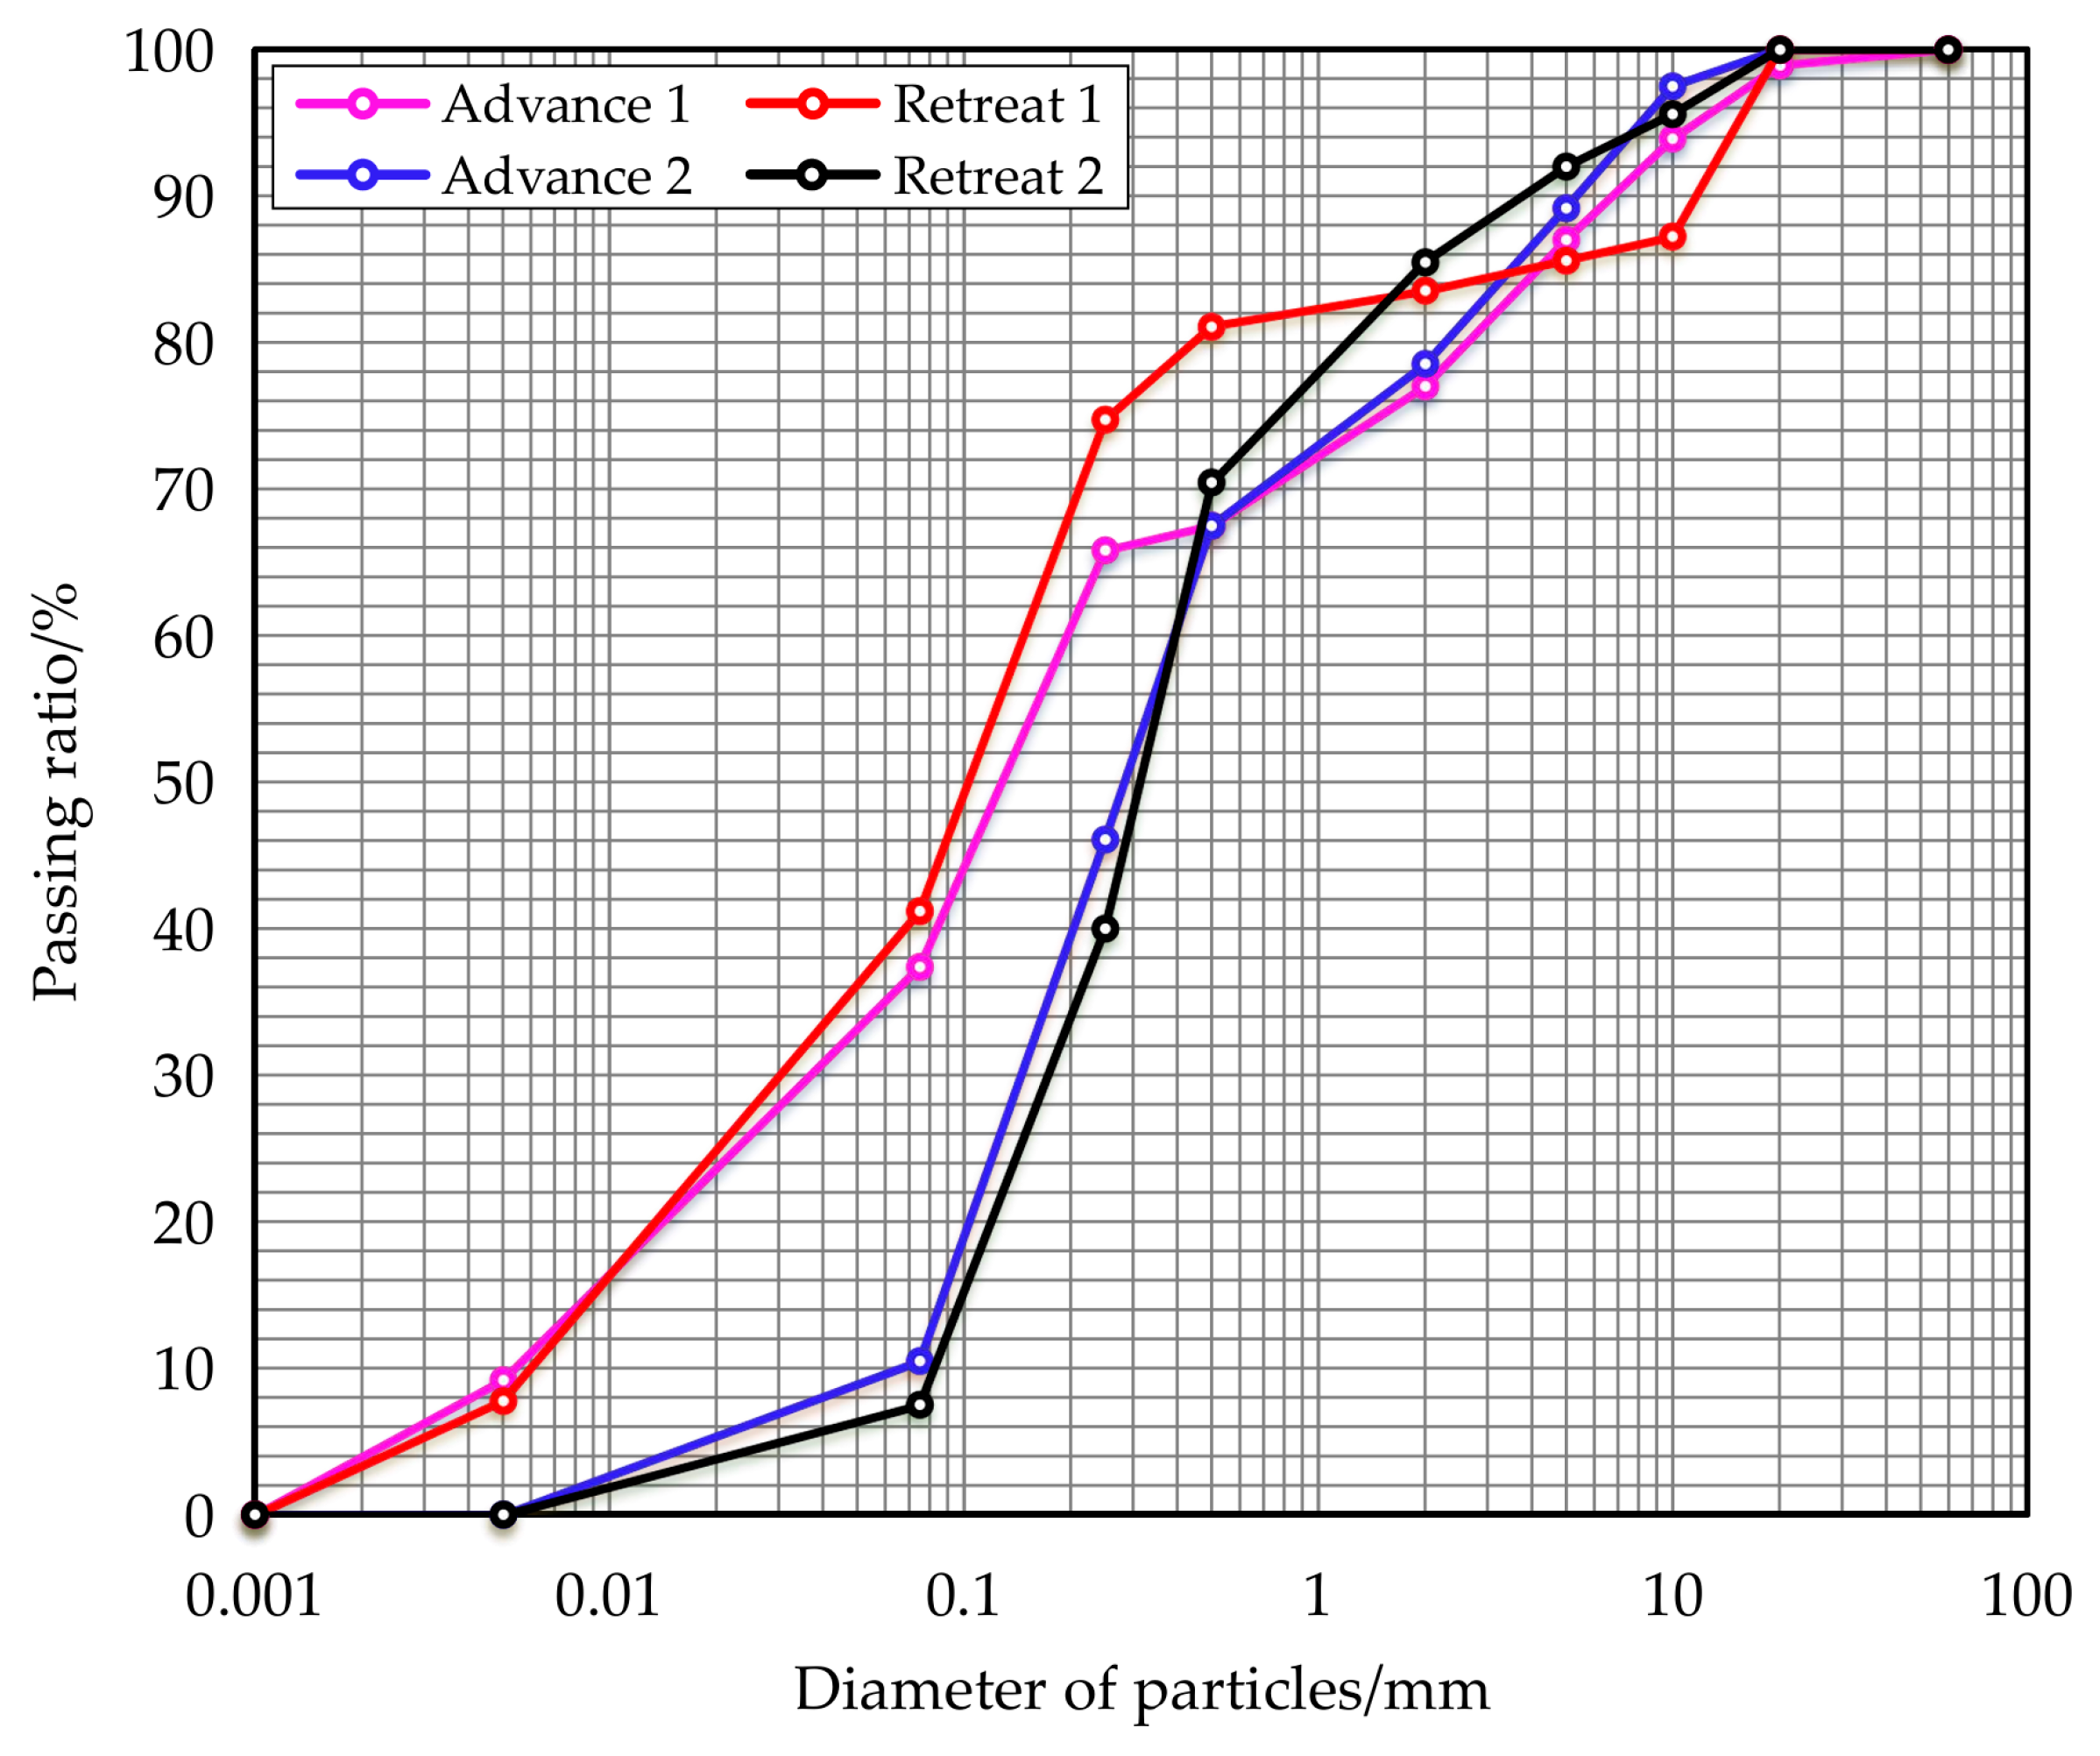
In this study, the borehole inspection passed through this group of strata. The lower part was mainly composed of loose, light yellow coarse- and fine-grained sand with relatively uniform particle size and locally interbedded thin clay layers, rich in gravel. The upper part is yellowish-brown sandy loess, containing a small amount of clay particles, with uneven soil quality. The thickness of the Quaternary strata exposed in advance inspection borehole 1 and retreat inspection borehole 1 is 12.6 m and 14.4 m, respectively. In addition, two sets of samples were collected at each site during the field test for particle analysis, moisture content determination, and permeability coefficient testing, as shown in Table 1. The coefficient of uniformity and the coefficient of curvature of the soil are provided in Table 2, and the gradation curves are presented in Figure 4.
Table 1.
Geotechnical test results.
Table 2.
Calculation of soil gradation.
Figure 4.
The gradation curve of the loose sandy soil layer group.
Based on the above coefficient calculation and curve shape, the gradation of Quaternary soil in the borehole inspection is poor. According to relevant standards, the upper soil can be regarded as silt and the lower soil as fine sand [30]. The results show that the natural moisture content ranges from 2.2% to 10.4%, with an average of 6.1%; the vertical permeability coefficient ranges from 0.0014 to 0.0092 cm/s, indicating moderate permeability.
Sandstone rock group:
This rock group is mainly composed of coarse-grained sandstone and medium-grained sandstone, with fine-grained sandstone occurring in some areas. It is developed throughout the entire borehole strata and is mainly distributed in the Zhidan Formation and the upper and middle members of the Zhiluo Formation. Furthermore, the Zhidan Formation often contains gravel and forms the basic roof or old floor of coal seams. Rocks are composed of quartz, feldspar, mica, and rock debris, among others [31]. In the core drilling and indoor mechanical tests on sandstone, medium-grained sandstone was sourced from the Zhiluo Formation (coal roof), whereas coarse-grained sandstone was not used. No mineralization occurred during these tests. Judging from the core samples on site, medium- to coarse-grained sandstone is easily crushed, can be broken apart or formed into a ball after soaking in water, has loose cementation and poor consolidation, and is classified as soft rock; fine-grained sandstone is relatively easy to crush and can leave an impression when scratched after soaking in water, classifying it as relatively soft rock; the structural surface combinations are generally poor, with bedding planes and layered structures present, resulting in relatively low rock mass integrity.
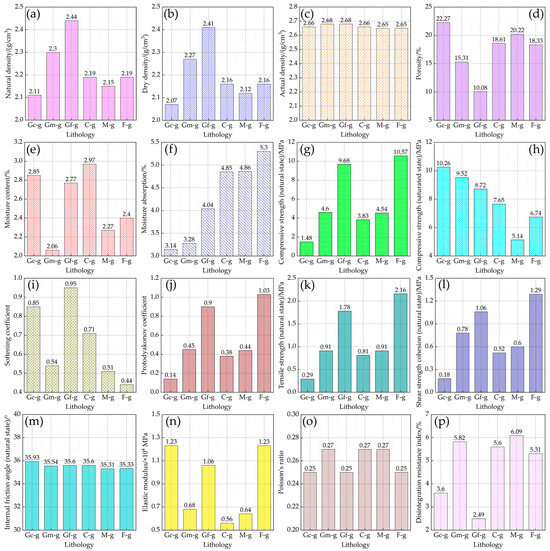
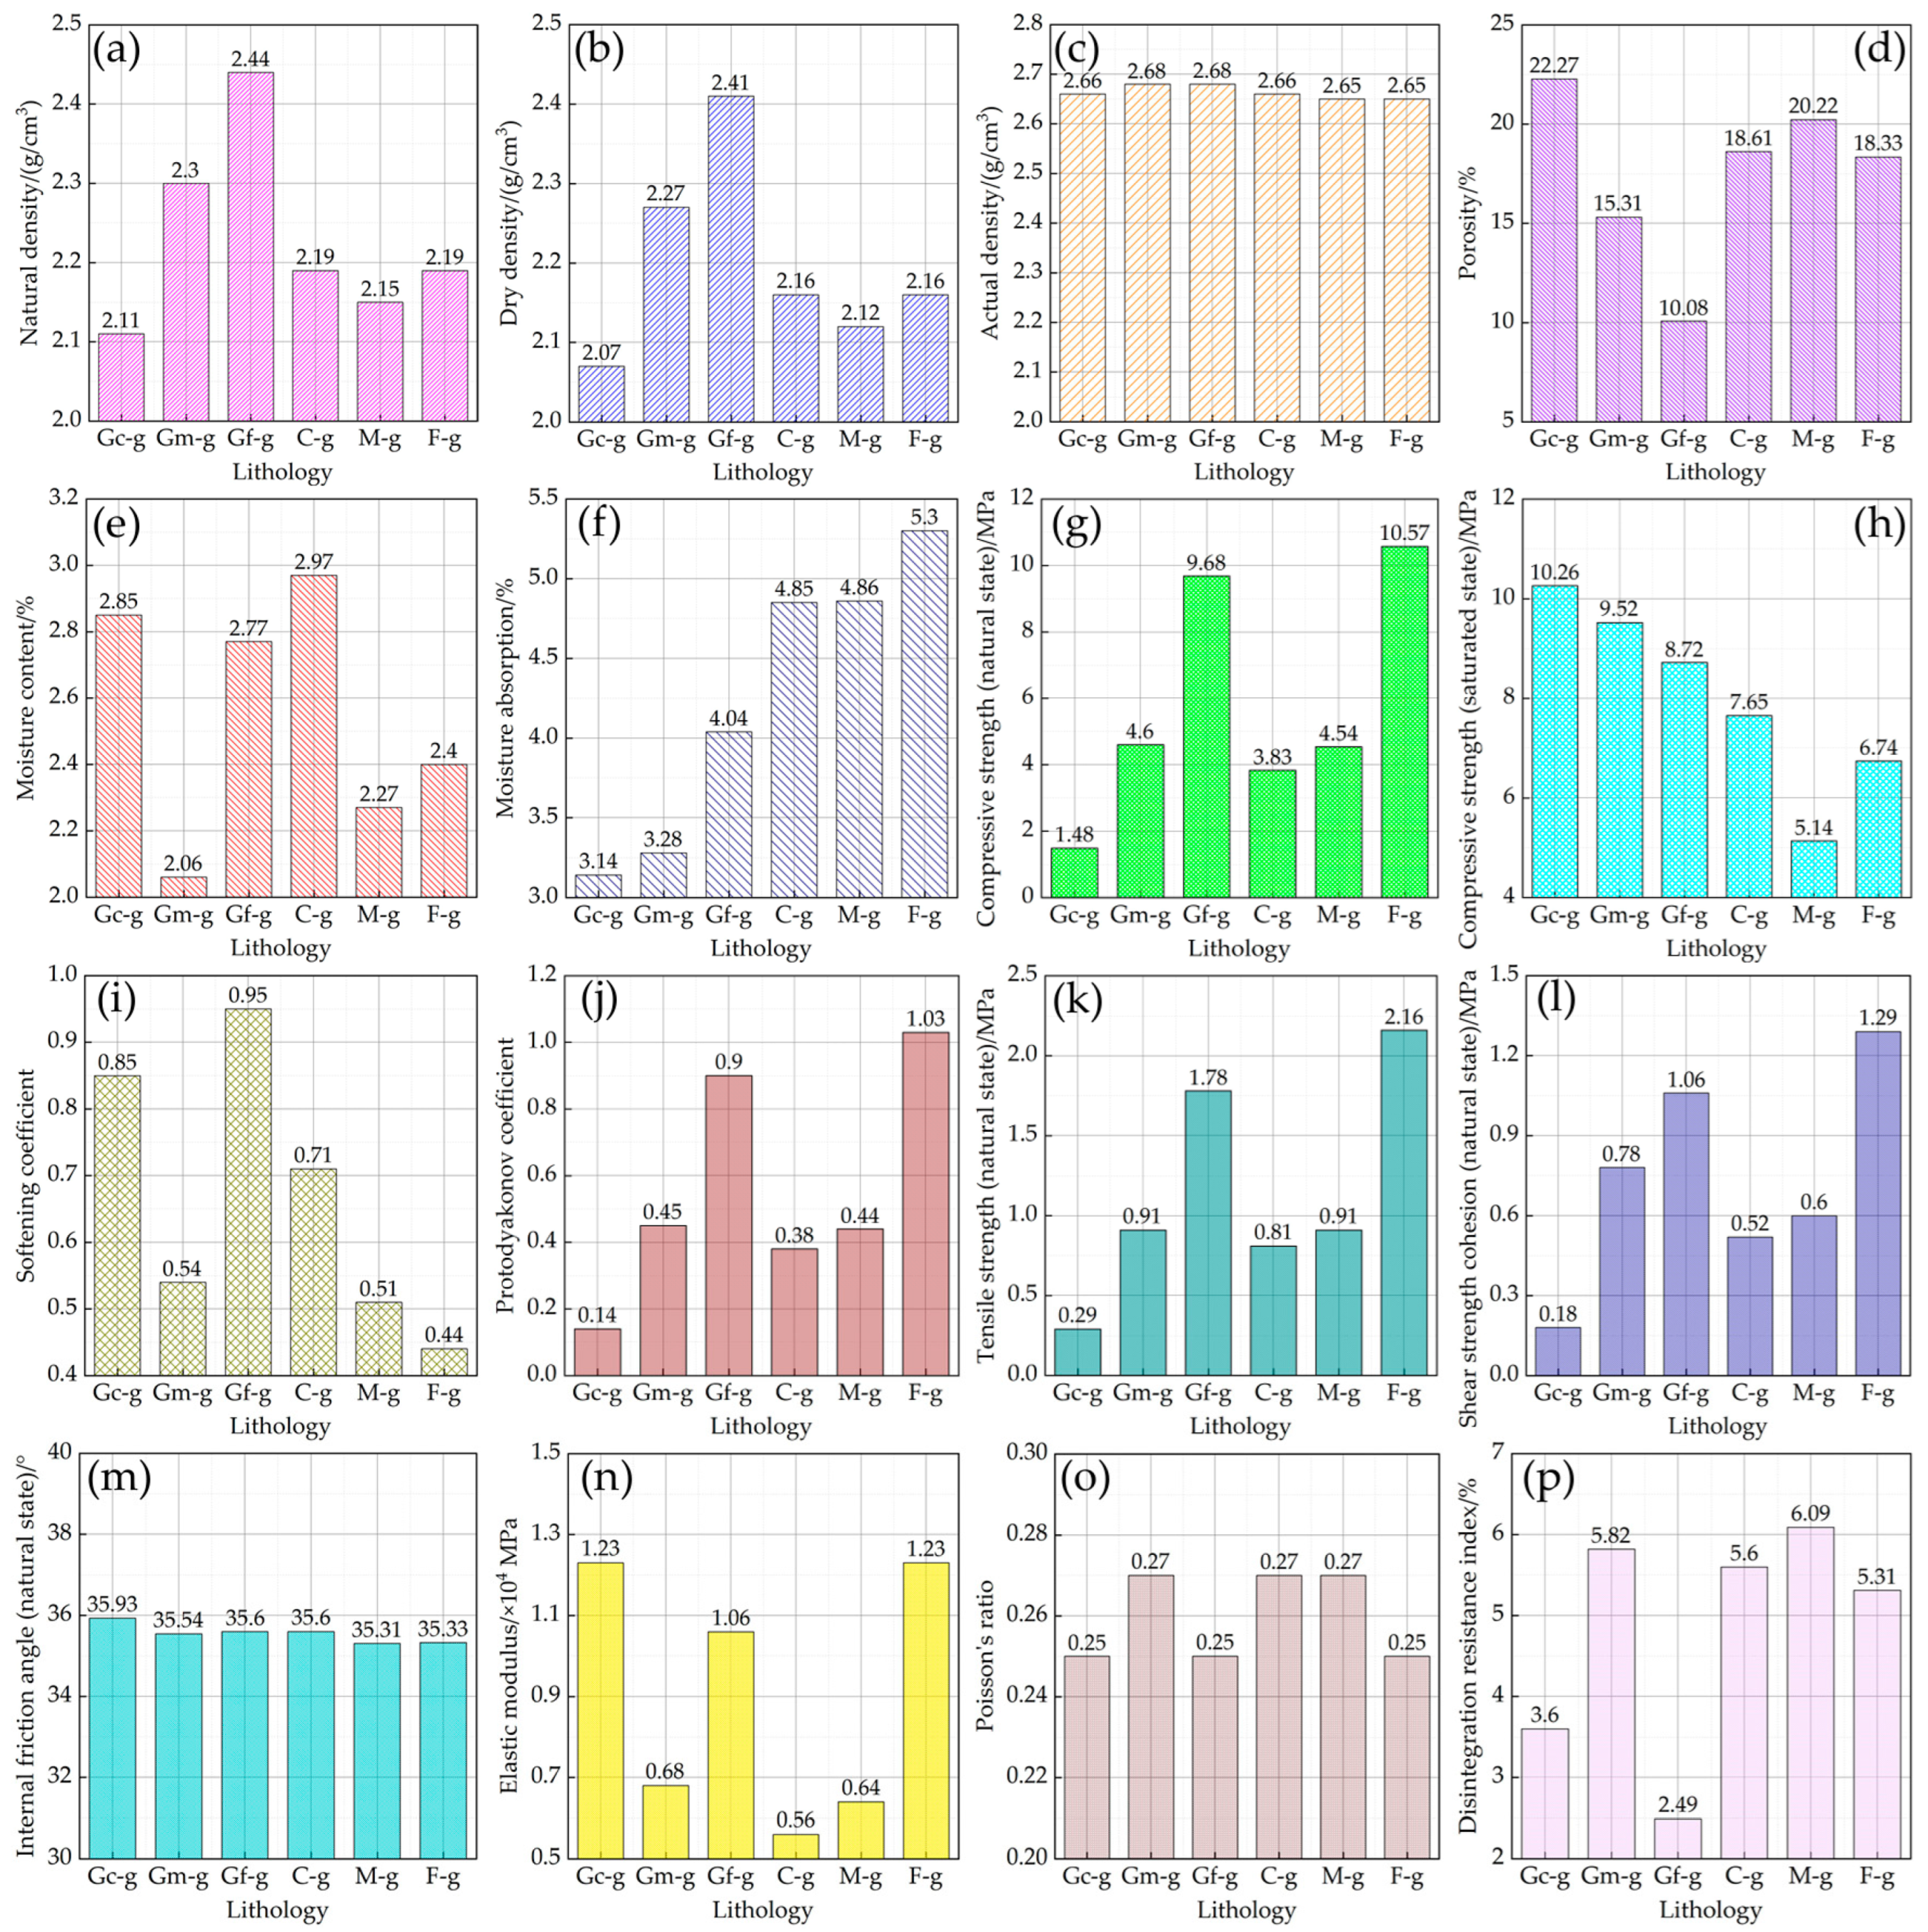
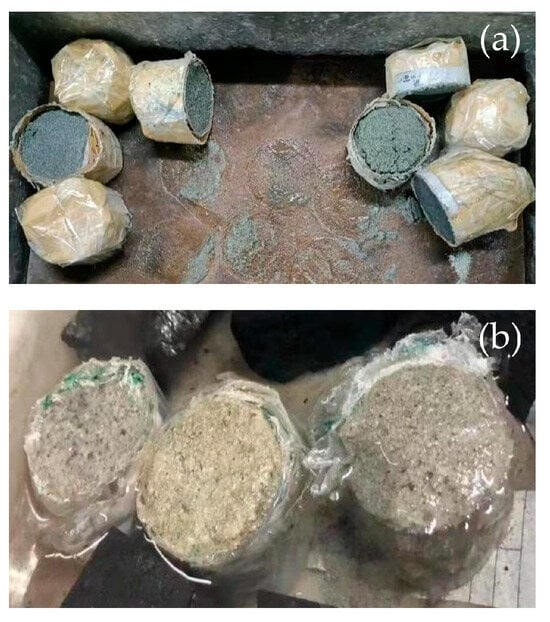
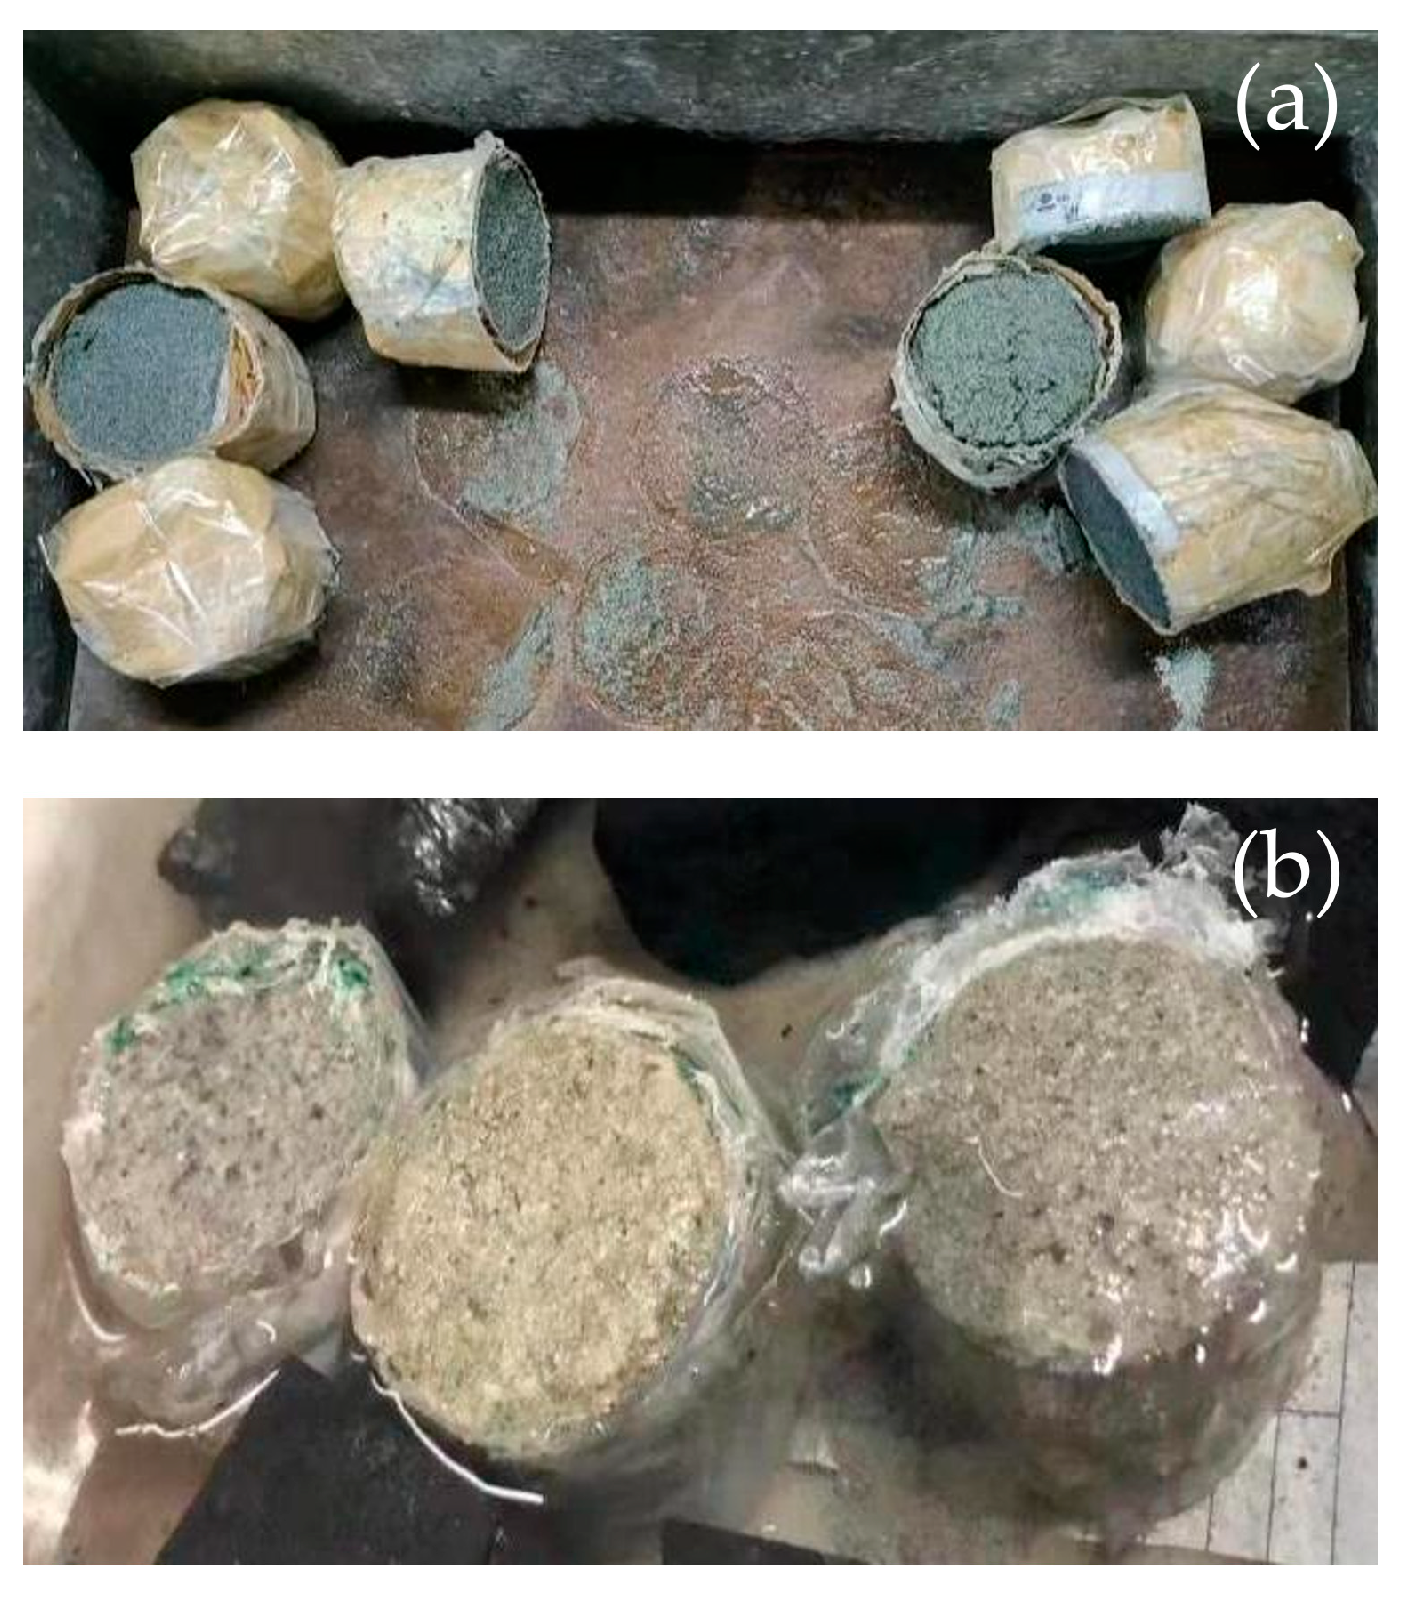
To obtain the basic mechanical properties of sandstone in its natural state within the Tarangole mining area, we conducted field mechanical tests on sandstone samples of different types and particle sizes. The results are shown in Figure 5. The density value of sandstone is not related to particle size. Herein the density of sandstone in the study area ranges from 2 to 3 g/cm3. The moisture content capacity and water absorption capacity of sandstone in its natural state are generally moderate, which indicates that sandstone is prone to reach a saturated state when exposed to water. In addition, based on the results of on-site mechanical tests, the uniaxial compressive strength (UCS) (in the natural state) ranges from 1.58 to 10.47 MPa, with an average of 5.78 MPa. The higher values in the data correspond to medium- and fine-grained sandstone, which are located in the Zhiluo Formation and the Yan’an Formation, respectively. The medium- and coarse-grained sandstone samples collected from the borehole during this inspection have loose cementation and are highly prone to softening and disintegration upon contact with water (Figure 6). Herein, the fundamental cause of this difference in the sandstone within the study area lies in its microstructure—specifically, porosity—which is controlled by grain size and the nature of internal cementation. Most of the samples could not be tested for saturated UCS, with the measured values ranging from 5.14 to 10.26 MPa and an average of 8.01 MPa. The rock hardness is classified as soft to moderately soft. The softening coefficient ranges from 0.44 to 0.95, with an average of 0.67, indicating a softening tendency in the rock. The higher values in the data correspond to fine sandstone and coarse sandstone, among which the coarse sandstone is located in the upper part of the Zhiluo Formation. Furthermore, the Protodyakonov coefficient, ranging from 0 to 2, indicates that the sandstone in the study area is a soft rock [32]. The disintegration resistance index, ranging from 2 to 7, fully demonstrates that the sandstone in the study area has poor hardness and is very brittle in nature [33]. Accordingly, the natural conditions of coal mining in the Tarangole mining area may lead to subsidence and even collapse of the overlying strata. In other words, it is necessary to investigate the mechanical properties of sandstone in a freeze–thaw environment.
Figure 5.
Physical and mechanical properties of sandstone lithology. (a) Natural density; (b) dry density; (c) actual density; (d) porosity; (e) moisture content; (f) moisture absorption; (g) compressive strength (natural state); (h) compressive strength (saturated state); (i) softening coefficient; (j) Protodyakonov coefficient; (k) tensile strength (natural state); (l) shear strength cohesion (natural state); (m) internal friction angle (natural state); (n) elastic modulus; (o) Poisson’s ratio; and (p) disintegration resistance index (notes: The full names of Gc-g, Gm-g, Gf-g, C-g, M-g, and F-g are gravelly coarse sandstone, gravelly medium sandstone, gravelly fine sandstone, coarse sandstone, medium sandstone, and fine sandstone, respectively).
Figure 6.
The sandstone samples disintegrated upon contact with water under the test conditions. (a) Section failure; and (b) Surface failure.
3.2. Rock Quality Evaluation
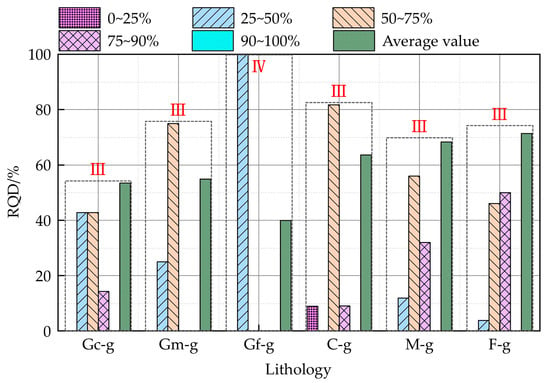
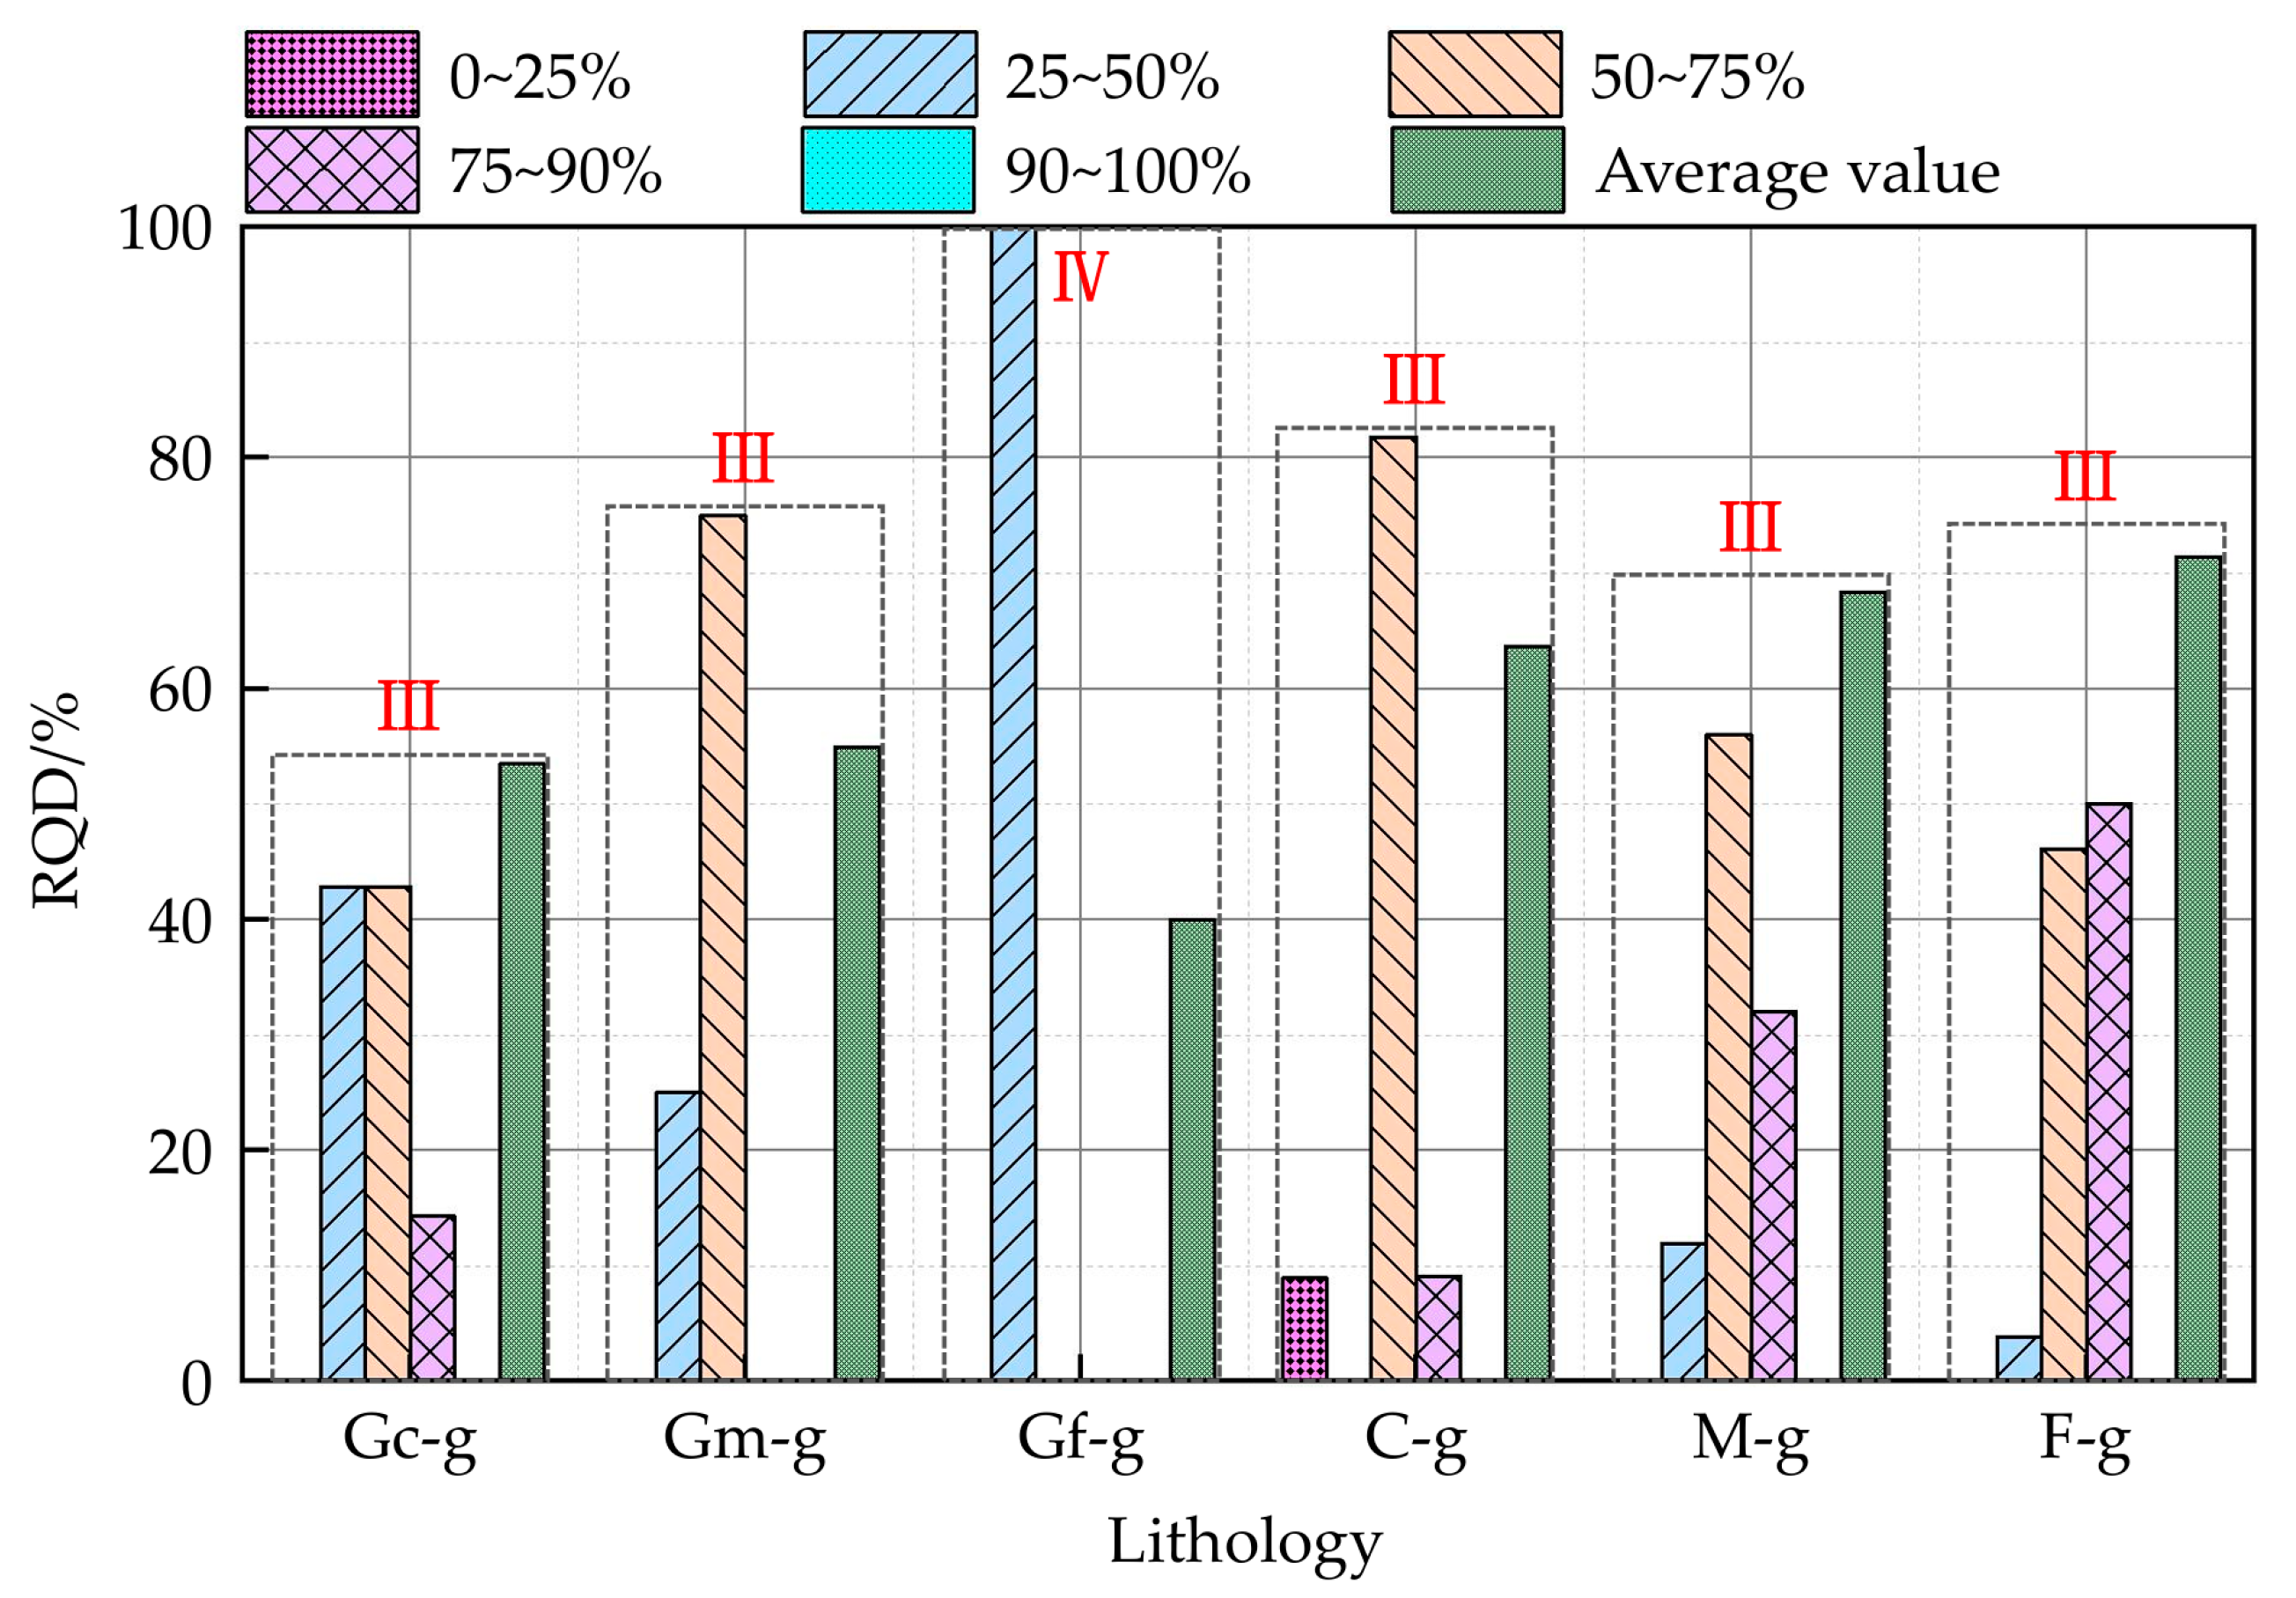
According to the “Exploration specification of hydrogeology and engineering geology in mining areas”, the Rock Quality Designation (RQD) is determined by measuring each drilling run [34]. The range and average value of RQD for different rock groups are identified, and rock and rock mass quality grades are classified based on RQD values to evaluate the integrity of rocks and rock masses. In this subsection, we selected six sandstone samples of different types and particle sizes from the study area and conducted rock mass integrity measurements to estimate the RQD values. As shown in Figure 7, the sandstone without gravel has better integrity, and the rock mass grade is at level II. However, the average RQD value of the sandstone rock group is 66.32%, with a rock quality grade of level III, described as medium quality, and the rock mass integrity is moderately complete. Among them, rocks of grade II account for 17.56%, grade III for 50.3%, grade IV for 30.62%, and grade V for 1.52%. Therefore, in combination with the mechanical parameter values of the sandstone rock group presented in Section 3.1, the hardness and integrity of the sandstone rock group were summarized, as shown in Table 3.
Figure 7.
Rock quality grades and proportions of sandstone rock groups.
Table 3.
The hardness and integrity of the sandstone rock group in the study area.
Overall, the mechanical strength of the rock in the wellbore is very low, mainly consisting of soft rocks. They tend to soften and deform when exposed to water, and many rocks even undergo disintegration and destruction. Therefore, when carrying out future shaft construction, appropriate support measures should be selected based on the actual situation, such as reducing the height of each excavation section, increasing the thickness of the shaft lining, and using anchor rods to secure the shaft lining to the surrounding rock, in order to prevent accidents and ensure safe production.
4. Results and Discussion
4.1. Development of a Thermo-Hydro-Mechanical (THM) Theoretical Model
Based on the results of in situ mechanical investigations, the mechanical properties of the rocks in the study area were obtained. In this subsection, we establish the concept of a model for freeze–thaw-induced damage, freeze–thaw-induced enhancement, and temperature-dependent creep behavior of sandstone within the THM framework. This concept reflects the correlation between dynamic creep controlled by viscoelastic mechanisms and that induced by microcracking from ice pressure, with the aim of providing a theoretical basis for subsequent in situ testing.
In the coupled THM model for saturated sandstone, the equation of state is primarily used to describe how the physical properties of pore water and soil particles (such as density and viscosity) vary with changes in variables like temperature and pressure. Under the condition of varying temperatures, considering that density, porosity, and liquid viscosity are all affected by temperature, we adopt the small deformation assumption and express the fluid density ρl, porous medium density ρs, and porosity ϕ as functions of the variables to be solved (pore pressure p and temperature T).
The viscosity of water, μl, varies negligibly with pressure and can be considered negligible; nevertheless, it changes significantly with temperature. To account for this, a polynomial expression is used to represent the viscosity of water, as follows:
where a0 = 1.794 × 10⁻³; a1 = 5.720 × 10⁻²; a2 = 1.137 × 10⁻³; a3 = 1.364 × 10⁻⁵; a4 = 8.828 × 10⁻⁸; and a5 = 2.344 × 10⁻¹⁰.
In addition, the expressions for parameters ϕ, ρl, and ρs are given respectively as shown in Equations (2)–(4).
Differentiating Equation (4) with respect to time t yields:
Among them, cϕ represents the pore compressibility coefficient of the sandstone; βϕ denotes the pore thermal expansion coefficient of the sandstone; ρl0 represents the initial density of the fluid, kg/m3; ρs0 denotes the density of the porous medium, kg/m3; cl is the compressibility coefficient of the fluid; βl is the thermal expansion coefficient of the fluid; Km is the bulk modulus of the sandstone, MPa; and βTm is the linear thermal expansion coefficient of the sandstone. Moreover, σ′ represents the effective stress, MPa; and tr(σ′) denotes the trace of the effective stress.
Then, by eliminating certain redundant variables, the seepage differential equation for p and T is derived:
By solving the temperature field equation, the temperature distribution within an object can be obtained, thereby providing a theoretical basis for optimizing design, process control, and understanding heat-related phenomena. In frozen soil, the modes of heat transfer include thermal radiation, heat conduction, and heat convection [28,29]. In the THM coupling model for saturated sandstone, the temperature field equation serves as the core equation describing heat transfer and energy conservation, fundamentally representing the mathematical formulation of the law of energy conservation. Herein, in a non-isothermal seepage system, the material system or spatial volume contains both solid and liquid components, and their thermodynamic characteristic parameters differ. Therefore, it is necessary to examine them separately [16].
- (1)
- Heat transfer equation for the rock matrix in porous mediawhere Cs represents the specific heat capacity of the sandstone, m2/(s·°C); and λs denotes the thermal conductivity coefficient of the solid, W·(m·K)−1.
- (2)
- Heat transfer equation for the fluid in porous mediawhere v represents the fluid seepage velocity, m·s−1, which we express as a relative velocity and can be obtained from Darcy’s law; C represents the specific heat capacity of water, m2/(s·°C); (ρC)eq represents the equivalent volumetric heat capacity; L represents the latent heat of the ice-water phase change, kJ·kg−1, taken as 333 kJ·kg−1; θl denotes the volumetric fraction of the liquid phase; and QG denotes the heat source term, W·m−3. In other words, in Equation (8), the first and second terms on the left-hand side represent the heat conduction term and the convection term, respectively; the third term denotes the latent heat of the ice-water phase change; the fourth term accounts for the work done by fluid pressure; as well as the fifth term represents the rate of change of thermal strain energy within the system.
In this study, the stress equation is based on the assumptions of linear thermo-elasticity. The total strain consists of stress-induced strain, pressure-induced strain, and thermal strain, expressed as the algebraic sum of these three components. Therefore, the total strain of the sandstone skeleton can be written as:
In Equation (9), expressing stress in terms of strain yields:
where G denotes the shear modulus; I represents the stress invariant.
Taking the trace of Equation (10), and rearranging using the relation 2G + 3λ = 3Kb, yields:
where Kb represents the bulk modulus of the overall system, and βTb denotes the linear thermal expansion coefficient of the overall system. Differentiating both sides of the equation with respect to time t and applying mathematical transformations yields:
Thus, the stress σ′ encompasses both the macroscopic stress σ and the internal pore pressure pI; that is, their constitutive relationship can be expressed as σ′ = σ + pI. Based on this, the THM coupling constitutive equation can be written as:
4.2. Thermal Constant Determination
Based on the conclusion drawn in Section 3 that medium- and fine-grained sand- stone have better rock integrity and rock strength, this section analyzes the mechanical characteristics of these two types of sandstone under different working conditions. The method innovation lies in its comprehensive analysis of the influence mechanisms of multiple factors—such as geological group, particle size, evaluation indicators, sampling depth, temperature, and creep rate—on the mechanical behavior of sandstone.
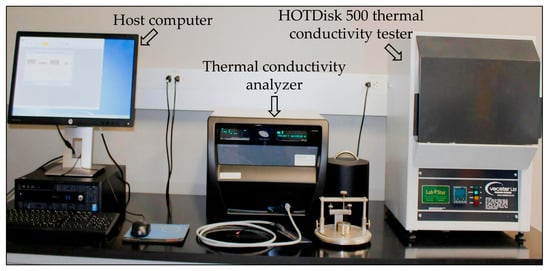
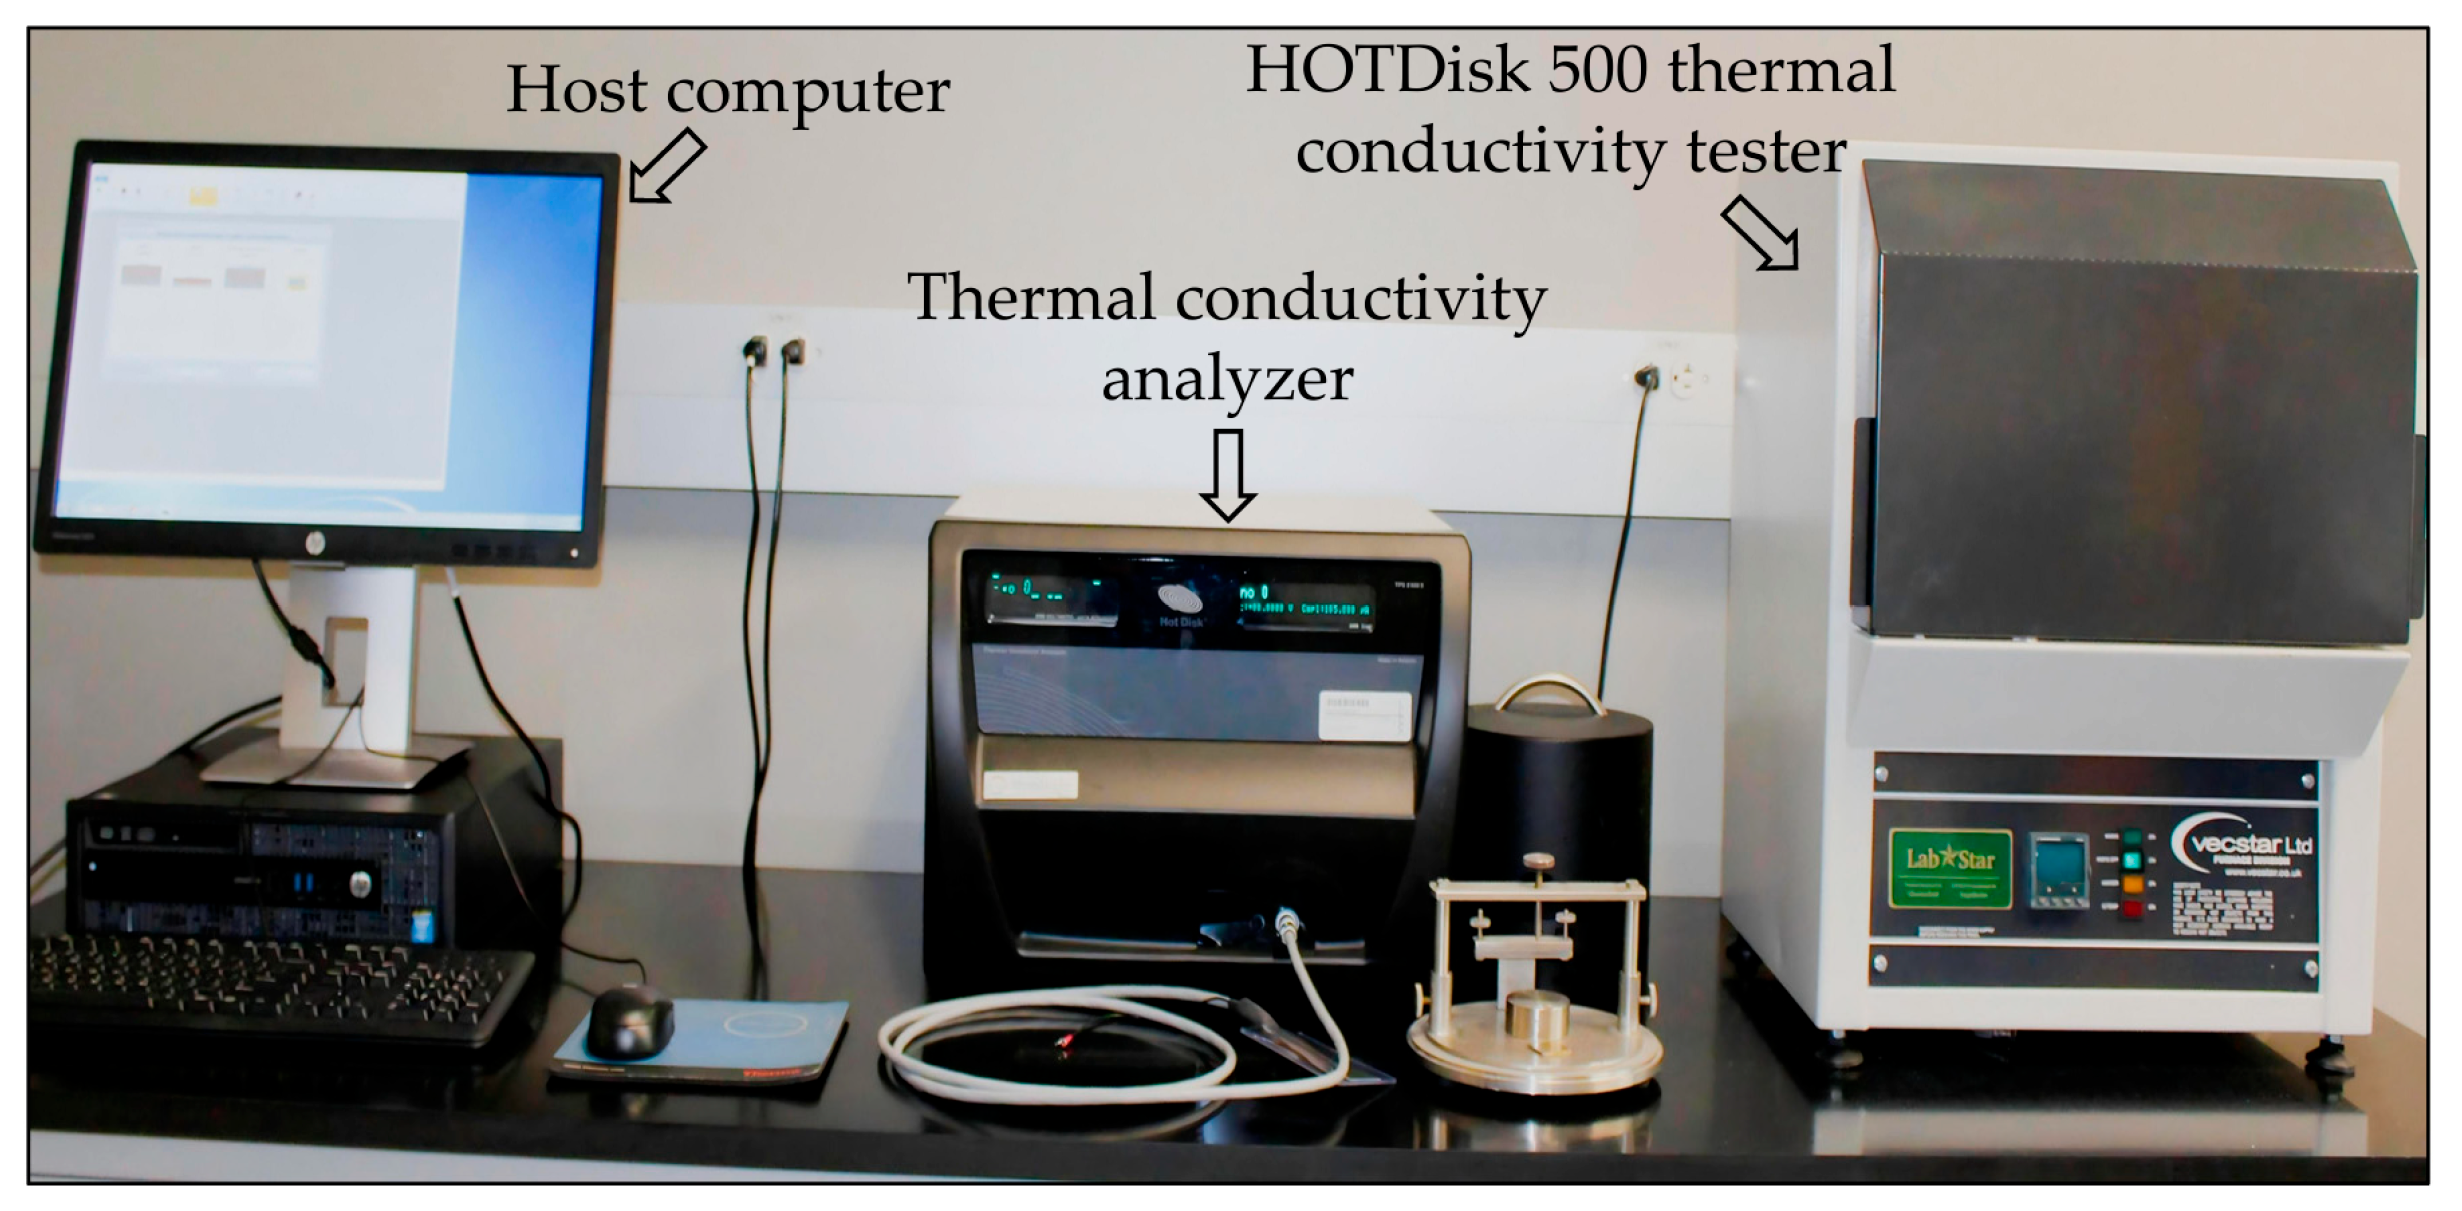
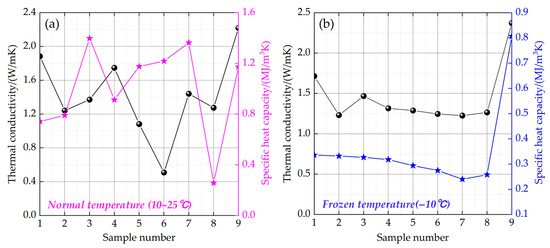
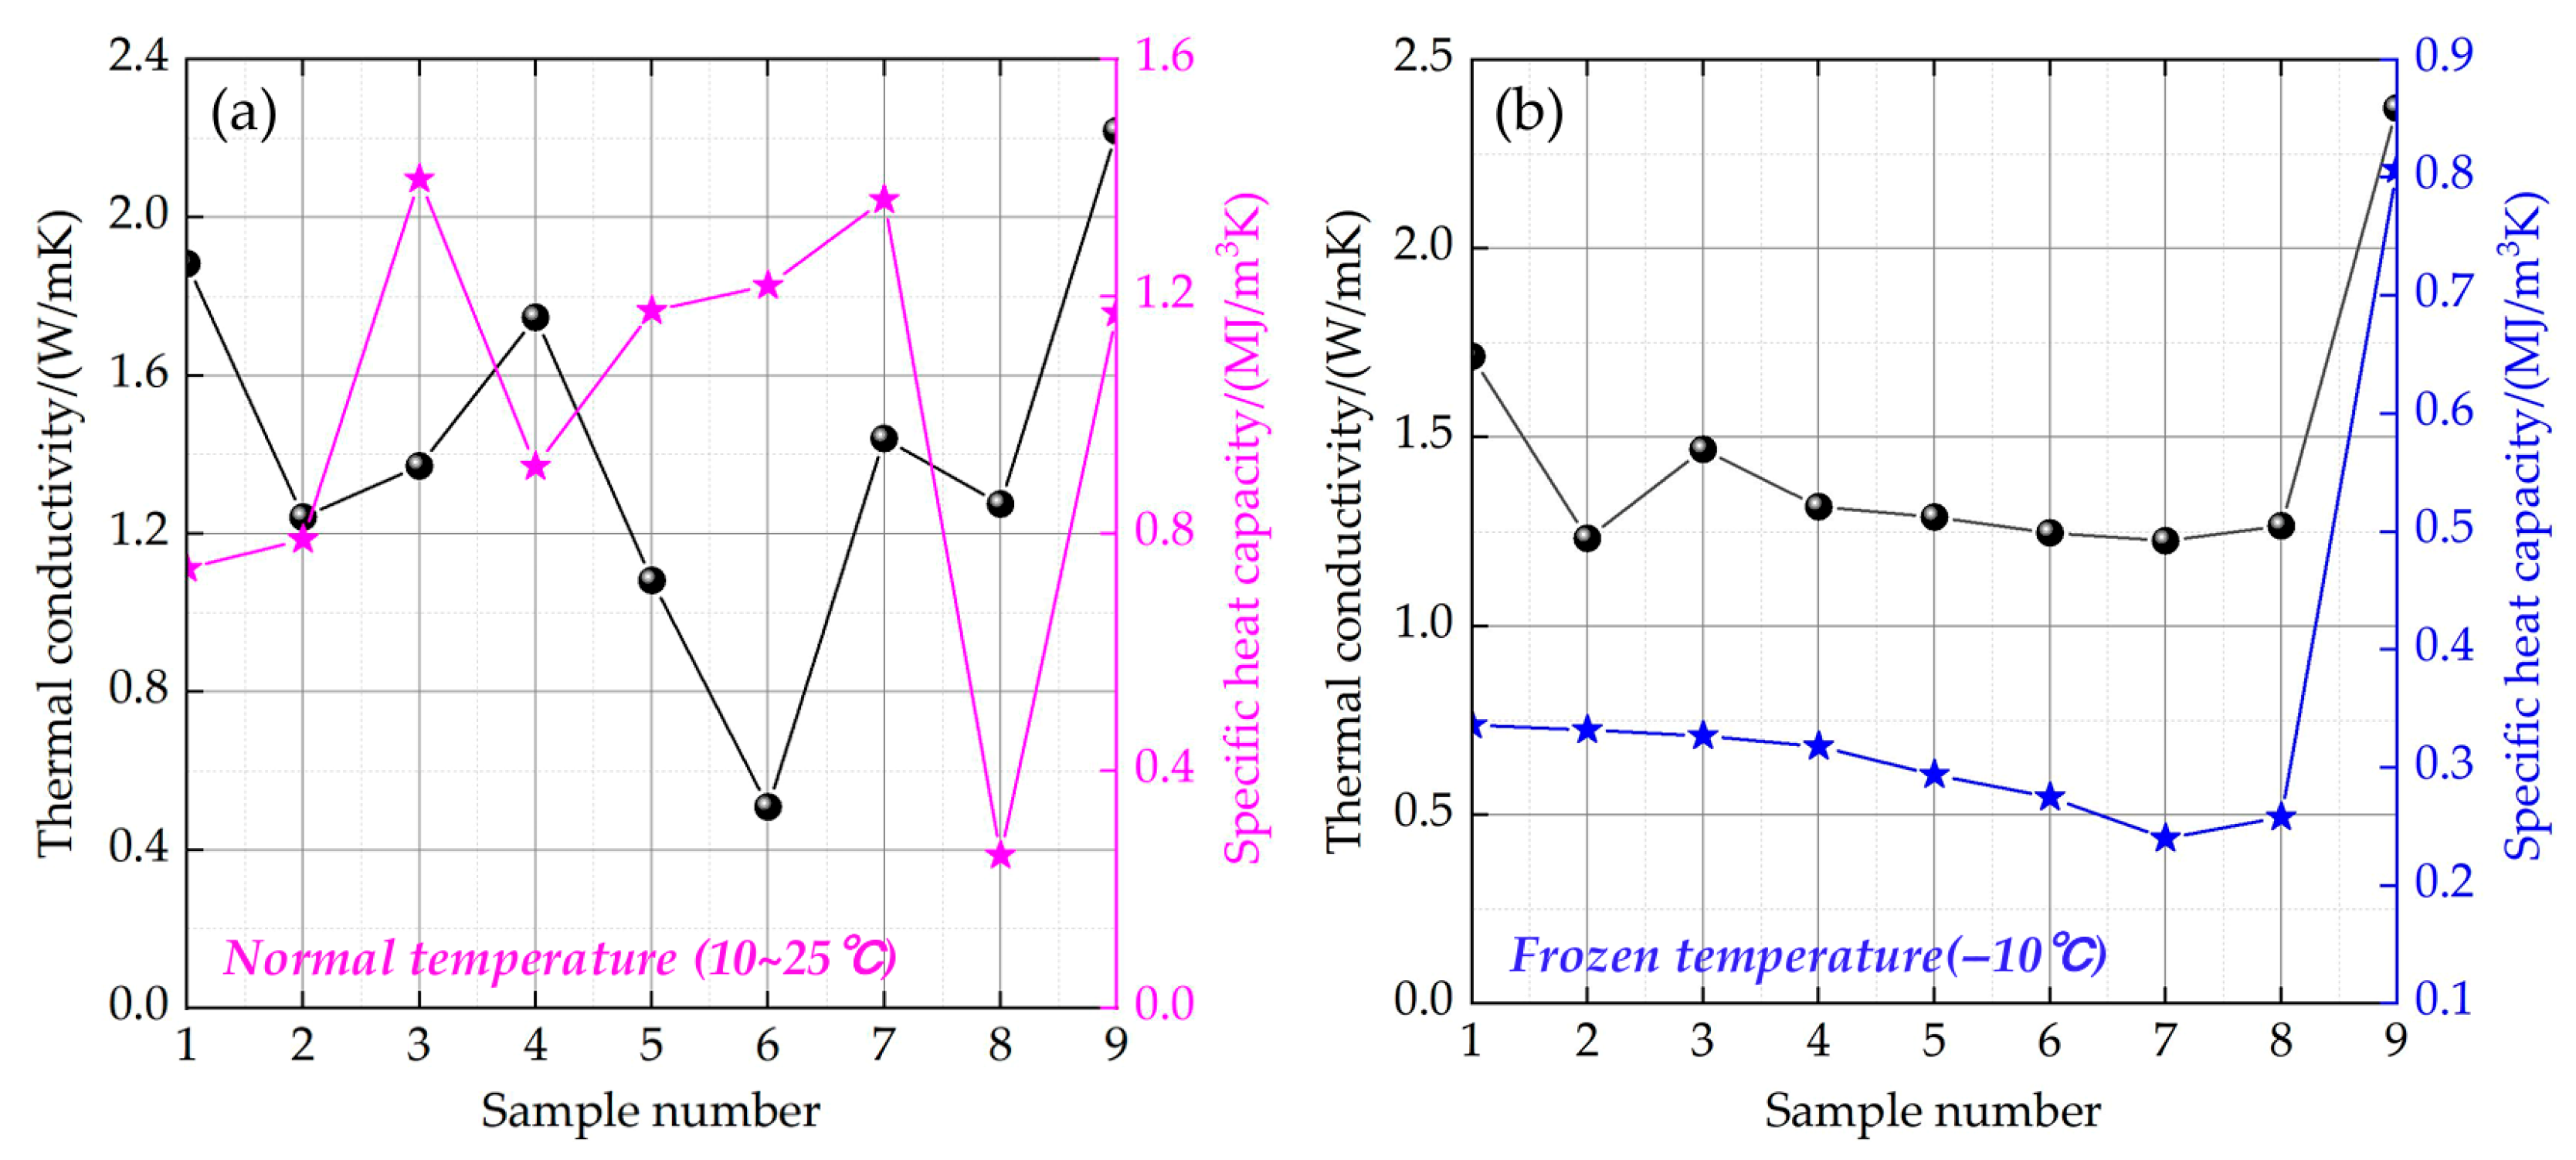
By measuring the thermal conductivity and specific heat capacity of samples from different lithologies, strata, as well as depths, we can study their physical properties [35]. Here, the test sample was vacuum-saturated. During the thermal constant determination test of frozen sandstone, the samples collected at the construction site included fine- and medium-grained sandstone, which were respectively taken from the Zhidan Group, the Zhiluo Formation, and the Yan’an Formation, with a sampling depth ranging from approximately 150 to 600 m. The main instruments used include a thermal conductivity analyzer, a pedestal, test probes, and a host computer. The thermal conductivity and specific heat capacity of the samples were measured using the HOTDisk 500 transient plane source (TPS) method thermal conductivity tester (manufactured by Hot Disk AB, Gothenburg, Sweden) (Figure 8). Based on the test measurement results, the lithology, length, sampling layer position, depth, and freezing temperature of the specimens are shown in Table 4, and the thermal constants at different temperatures are shown in Figure 9.
Figure 8.
Thermal constant measurement system for frozen sandstone.
Table 4.
Test parameters for determining the thermal properties of frozen sandstone.
Figure 9.
Test results of thermal constants of sandstone samples. (a) Normal temperature; and (b) frozen temperature.
Based on the THM theoretical model, the test results show that, firstly, compared with the thermal properties at normal temperature, under freeze–thaw conditions, the thermal conductivity values of medium and fine sandstones are higher than their specific heat capacity values (Figure 9). Secondly, factors such as lithology, stratum, frozen temperature, and depth can have a significant impact on the thermal conductivity and specific heat capacity of the samples. Finally, the thermal conductivity of medium and fine sandstone at normal temperature ranges from 0.51 to 1.89 W/mK, and the specific heat capacity of the rock at normal temperature is between 0.26 and 1.4 MJ/m3K. Its value increases with the increase in the rock’s moisture content. The thermal conductivity of the sample at −10 °C is within the range of 1.23 to 1.71 W/mK, and the specific heat capacity is between 0.24 and 0.34 MJ/m3K. This fully demonstrates that the frozen temperature range of −8.86 to −13.65 °C differs significantly from the empirical values of similar strata. Thus, compared with other temperature options and in consideration of actual engineering requirements, setting the freezing temperature at approximately −5 °C is more reasonable.
4.3. Uniaxial Compression Test and Results of Frozen Sandstone
In this study, four groups of rock samples—namely, A, B, C, and D—were selected for triaxial compression tests. All specimens were processed into standard cylindrical specimens with a diameter of 50 mm and a height of 100 mm, strictly satisfying the 2:1 height-to-diameter ratio requirement specified for triaxial testing. In terms of physical properties, the initial porosity of each sample group ranged from 13.8% to 16.5%, and the average water content ranged from 1.8% to 2.5%. To simulate the real underground environment, all samples were subjected to a rigorous vacuum saturation procedure. The specific process included drying at a constant temperature of 105 °C, followed by vacuum pumping for 4 h and subsequent immersion in deionized water for 48 h, in accordance with ASTM D4525 [28]. This ensured complete saturation of the samples and established a reliable experimental foundation for subsequent mechanical property testing. Moreover, the tests were conducted using the GCTS electro-hydraulic servo- controlled low-temperature, high-pressure rock triaxial testing system (manufactured by GCTS (Geotechnical Consulting & Testing Systems), Tempe, AZ, USA), which enabled precise temperature control and synchronized data acquisition. A cooling period of 14 h was applied to the sandstone specimens to ensure thermal equilibrium throughout the sample.
According to the requirements of the artificial frozen soil physical and mechanical test specifications, uniaxial compression tests on frozen rocks were conducted using the MTS816 electro-hydraulic servo-controlled rock testing machine (manufactured by MTS Systems Corporation, Eden Prairie, MN, USA) [36]. In this study, we conducted mechanical tests on three groups of samples under similar conditions (24 samples in total). The results showed that the test outcomes were consistent across the three groups. Therefore, we present only the most representative dataset. The specific sample grouping is shown in Table 5 below. The experimental results of freezing rocks are shown in Figure 10.
Table 5.
Grouping of samples for uniaxial compression tests on frozen rock.
Figure 10.
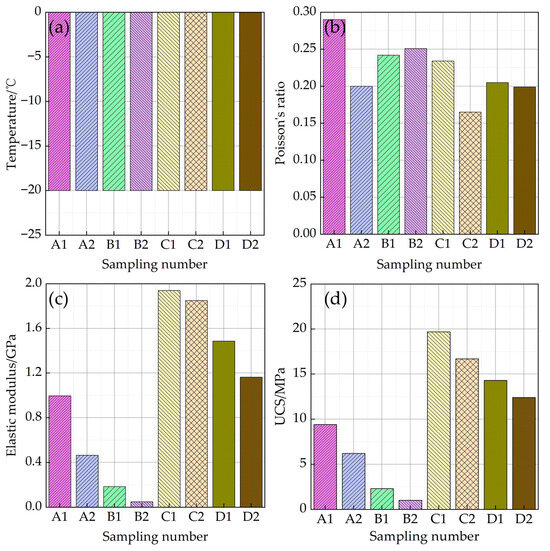
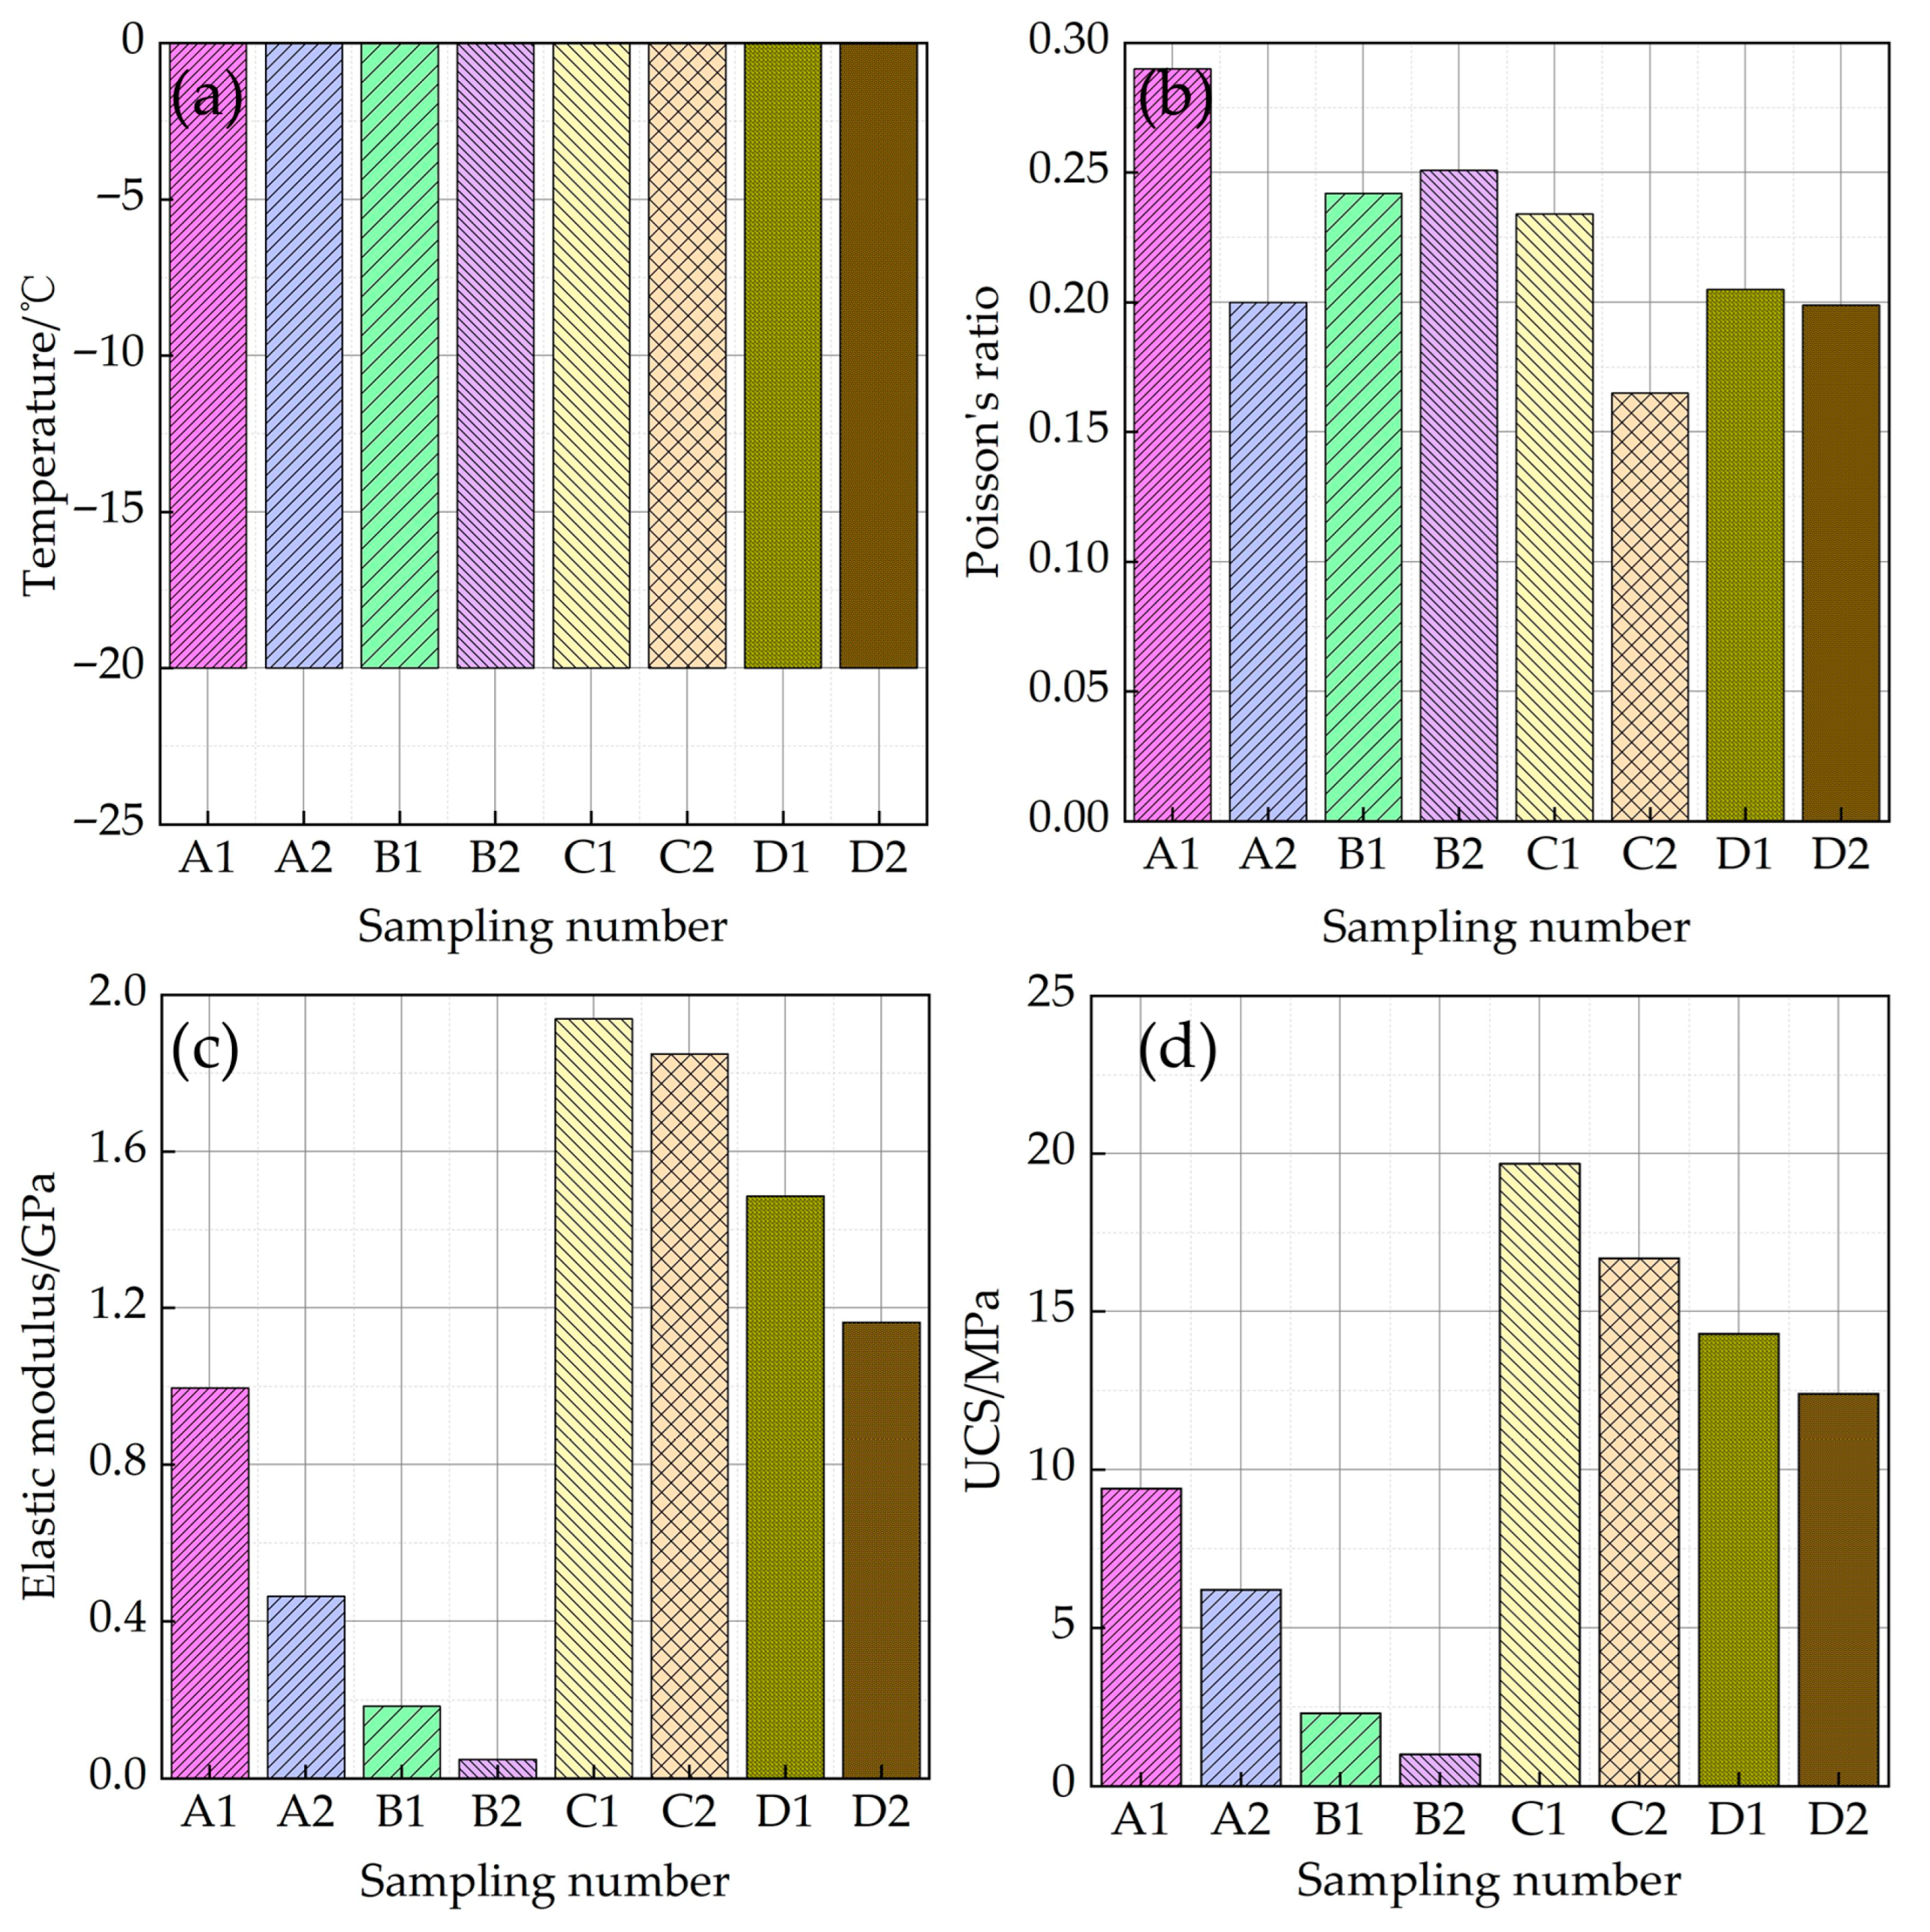
Test results of uniaxial compression on frozen rock. (a) Temperature; (b) poisson’s ratio; (c) elastic modulus; and (d) UCS.
As shown in Figure 10, with increasing stratum depth (321~678 m), primarily spanning the Zhiluo and Yan’an Groups, four samples of medium-grained sandstone and four samples of fine-grained sandstone were selected. The temperature was controlled at −20 °C (Figure 10a). Through uniaxial compression tests, the Poisson’s ratio (Figure 10b), elastic modulus (Figure 10c), and UCS (Figure 10d) were obtained for groups A to D.
The results show that in Group A samples (medium-grained sandstone of the Zhiluo Group), when the freezing temperature is −20 °C, the UCS values are 9.4 MPa (A1) and 6.2 MPa (A2), respectively. These samples are extremely prone to disintegration upon contact with water and have relatively low strength. As the depth of the stratum increases, both the elastic modulus and the UCS value decrease. This phenomenon can also be observed in the experimental results of Group B. The depth of the stratum from which the samples in Group B (medium-grained sandstone of the Zhiluo Group) were extracted increased to 400~500 m, and the UCS values decreased to 2.3 MPa (B1) and 1 MPa (B2). Therefore, compared with the medium-grained sandstone in the study area, when the freezing temperature is the same, an increase in stratum depth leads to a decrease in rock strength, which classifies it as soft rock. Samples C and D (fine-grained sandstone of the Yan’an Group) were taken from depths greater than 600 m. Their elastic modulus and UCS values were much higher than those of the medium-grained sandstone. The average UCS values of groups C and D were 18.2 MPa and 13.35 MPa, respectively, which classifies them as relatively soft rocks. In light of the hydrogeological conditions shown in Figure 3, C1 in Group C is closer to the aquiclude (which contains a large amount of gravel) and thus has the highest UCS value of 19.7 MPa. This fully demonstrates that the strength of fine-grained sandstone in the study area is higher than that of medium-grained sandstone. We believe this may be related to the water absorption capacity of sandstone: the larger the particle size, the greater the water absorption capacity of the rock and the weaker its mechanical properties [37,38]. Furthermore, based on the values of the mechanical parameters at normal temperature in Section 3.1, the UCS value in the frozen state is 2 to 3 times higher than that at normal temperature, which enhances the safety of mining mineral resources in the Tarangole coal mine.
Subsequently, to investigate the influence of temperature factors on different sandstones, the confining pressure, compressive strength, and shear parameters of rocks under freezing conditions were calculated through triaxial compression tests.
4.4. Triaxial Compression Test and Results of Frozen Sandstone
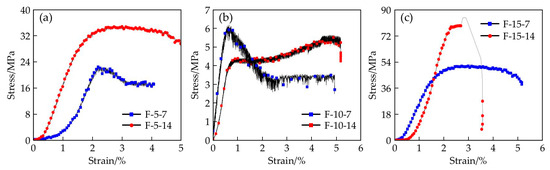
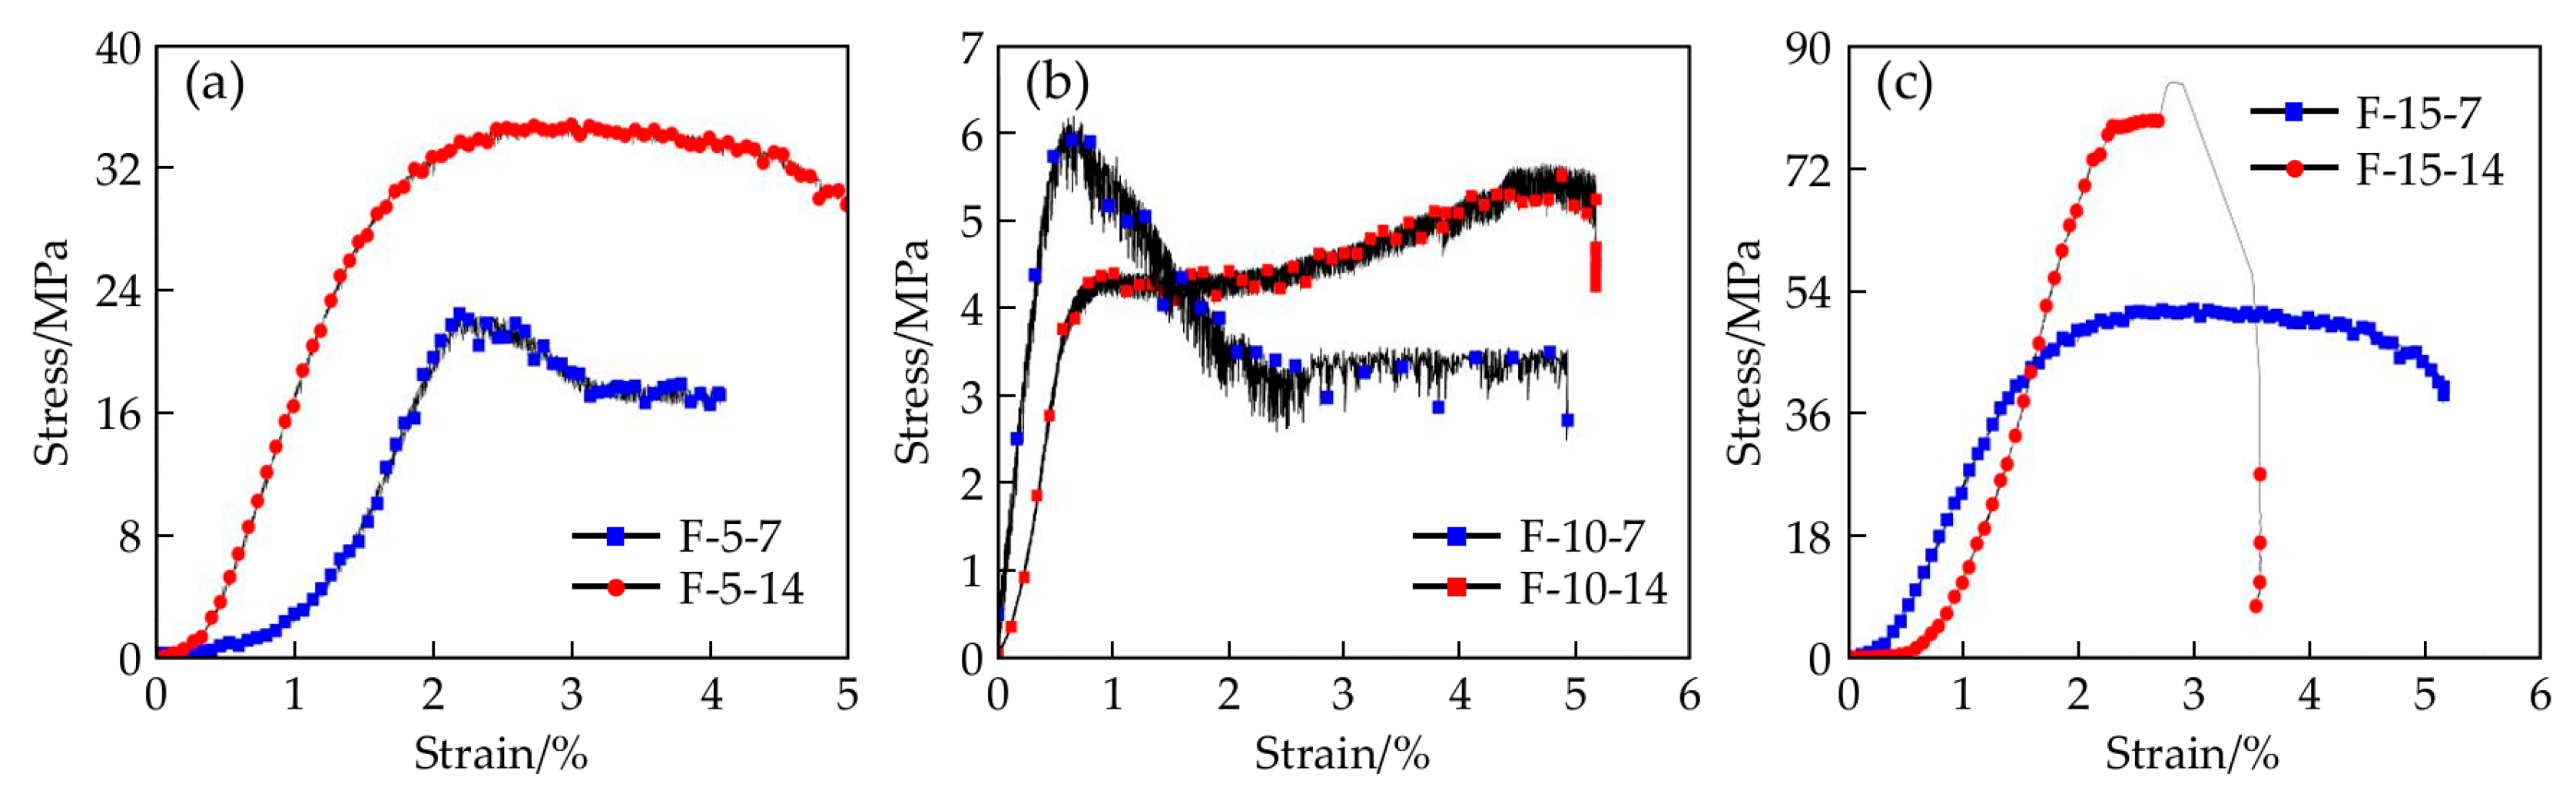
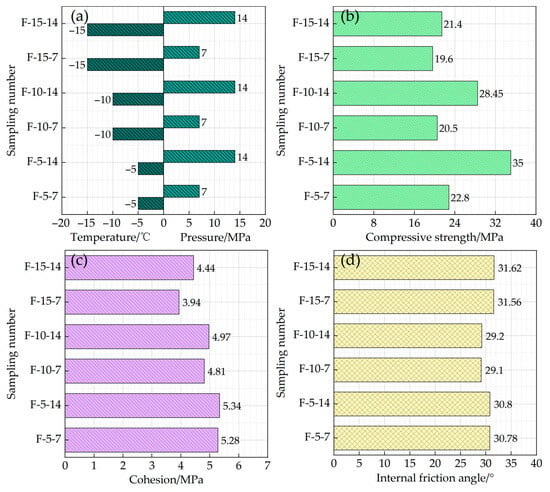
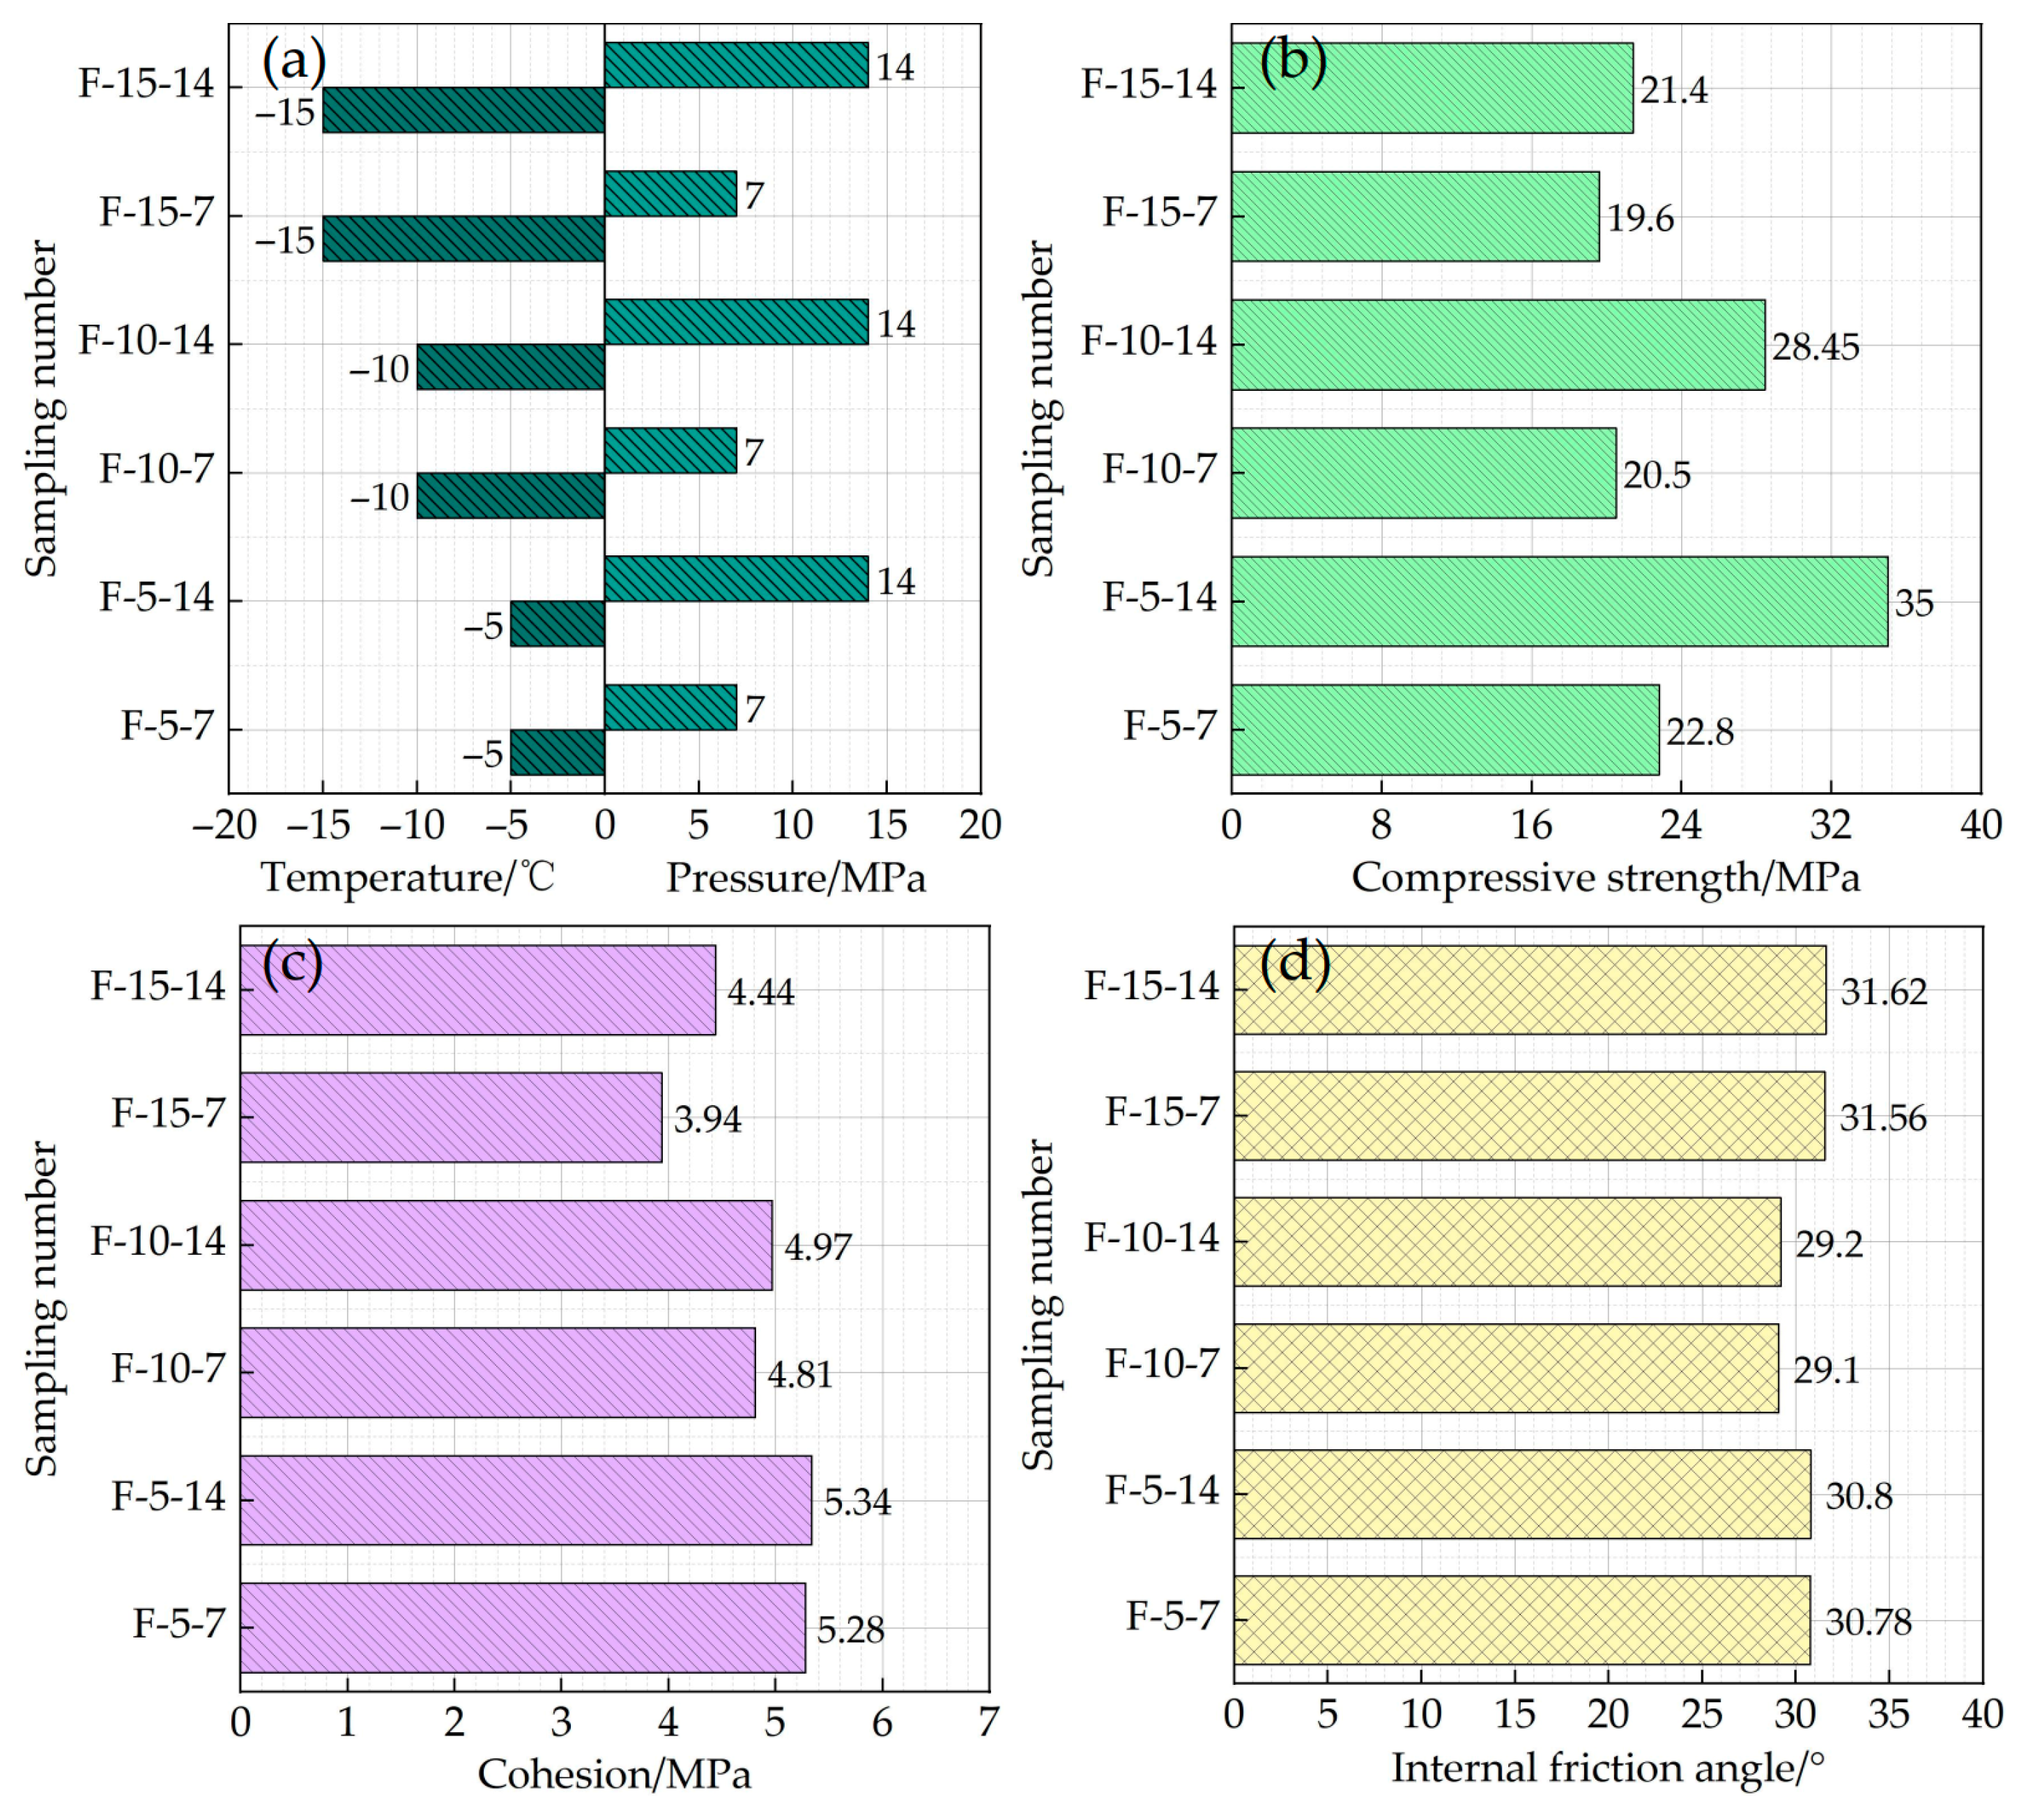
This triaxial compression test on frozen rock was conducted in accordance with “Artificial frozen soil physics mechanics performance test” [39]. Three groups of rock samples (fine-grained sandstone) were selected for the test, and the stress–strain curves are shown in Figure 11. Here, in light of the temperature gradient changes at the engineering site, the sample temperatures were set at −5 °C, −10 °C, and −15 °C, respectively, and the confining pressures were set at 7 MPa and 14 MPa, respectively, resulting in a total of six standard specimens (Figure 12a). The results of the triaxial compression test on frozen rock are shown in Figure 12.
Figure 11.
Triaxial compression test stress–strain curve. (a) Operating conditions at −5 °C; (b) operating conditions at −10 °C; and (c) operating conditions at −15 °C.
Figure 12.
Test results of triaxial compression on frozen rock. (a) Temperature and pressure; (b) compressive strength; (c) cohesive; and (d) internal friction angle.
Calculation method based on rock shear parameters:
- (1)
- First, plot the data for σ1 and σ3 and establish the relationship equation σ1–σ3.
- (2)
- According to the Mohr–Coulomb strength criterion, the calculation equations for the coefficient of friction (f), internal friction angle (φ) and cohesion (Co) are as follows:
The results of the stress–strain curve show that at −5 °C, the stress value under high confining pressure is greater than that under low confining pressure (Figure 11a). At −10 °C, the stress value under high confining pressure was initially higher than that under low confining pressure, then became lower, and eventually stabilized, indicating that the sample was damaged (Figure 11b). Similarly, damage occurred in the sample at −15 °C (Figure 11c). Therefore, it was found that when the sample temperature was maintained at −5 °C, no damage occurred, which can provide theoretical support for the mining of mineral energy resources.
As shown in Figure 12, based on the results of the uniaxial compression test in Section 4.3, we discuss the influence of different freezing temperatures and surrounding rock pressures on the fine-grained sandstone in the study area. From Figure 12b, it can be seen that the triaxial compressive strength increases with increasing confining pressure, and the difference in compressive strength becomes more pronounced as the temperature decreases (from −5 °C to −15 °C). For instance, when the temperature is −15 °C, the difference in strength between sample F-5-14 and F-5-7 is 12.2 MPa, which is much greater than the difference of 0.8 MPa at −5 °C. In addition, the Poisson’s ratio of fine-grained sandstone is less affected by changes in triaxial compressive strength, but gradually decreases with increasing temperature (Figure 12c). The internal friction angle of fine-grained sandstone does not change significantly with variations in temperature and confining pressure (Figure 12d). This is because the friction angle reflects the roughness of the sliding surface, and the freezing of internal water in the sandstone has a relatively small impact on the “roughness” of the rock [39,40]. We can conclude that the internal friction angle of the fine-grained sandstone in the study area is approximately 30°. Hence, in actual freeze–thaw engineering, the mechanical strength of fine-grained sandstone gradually weakens as the temperature drops, and the rock becomes more brittle. This is in line with the results of the on-site mechanical tests in Section 3.
4.5. Uniaxial Creep Test and Results of Frozen Sandstone
The uniaxial creep test was conducted using the TATW-500 triaxial testing system (manufactured by Changchun Chaoyang Testing Instrument Co., Ltd., Changchun, China). The test was conducted using staged loading. In data processing, the Boltzmann superposition principle was applied. The creep strain at any moment during a certain loading stage is the sum of the creep strains caused by all previous loading stages and the creep strain produced by the current load increment within that stage. Therefore, based on this principle, the strain-time curves obtained from the staged loading test are converted into strain-time curves with equal duration for each individual load level. In this staged loading and unloading creep test, each loading step lasted 25 h, and the deformation stability criterion for applying the next load level was defined as an axial creep strain rate of less than 1 × 10⁻⁴ mm/mm/h over the final 5 h—ensuring consistent test conditions and reliable results.
In this study, the loads were tested at several levels, namely 0.3 σs, 0.4 σs, 0.5 σs, 0.6 σs, and 0.7 σs (where σs represents the instantaneous UCS of artificial frozen sandstone, which can be replaced by the average value of the ultimate UCS of artificial frozen sandstone under the same temperature conditions). The creep test schemes at different frozen temperatures are shown in Table 6.
Table 6.
The creep test schemes at different freezing temperatures.
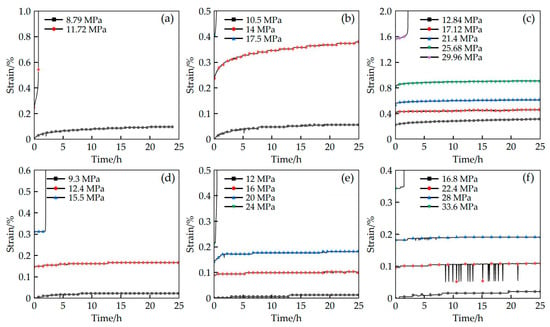
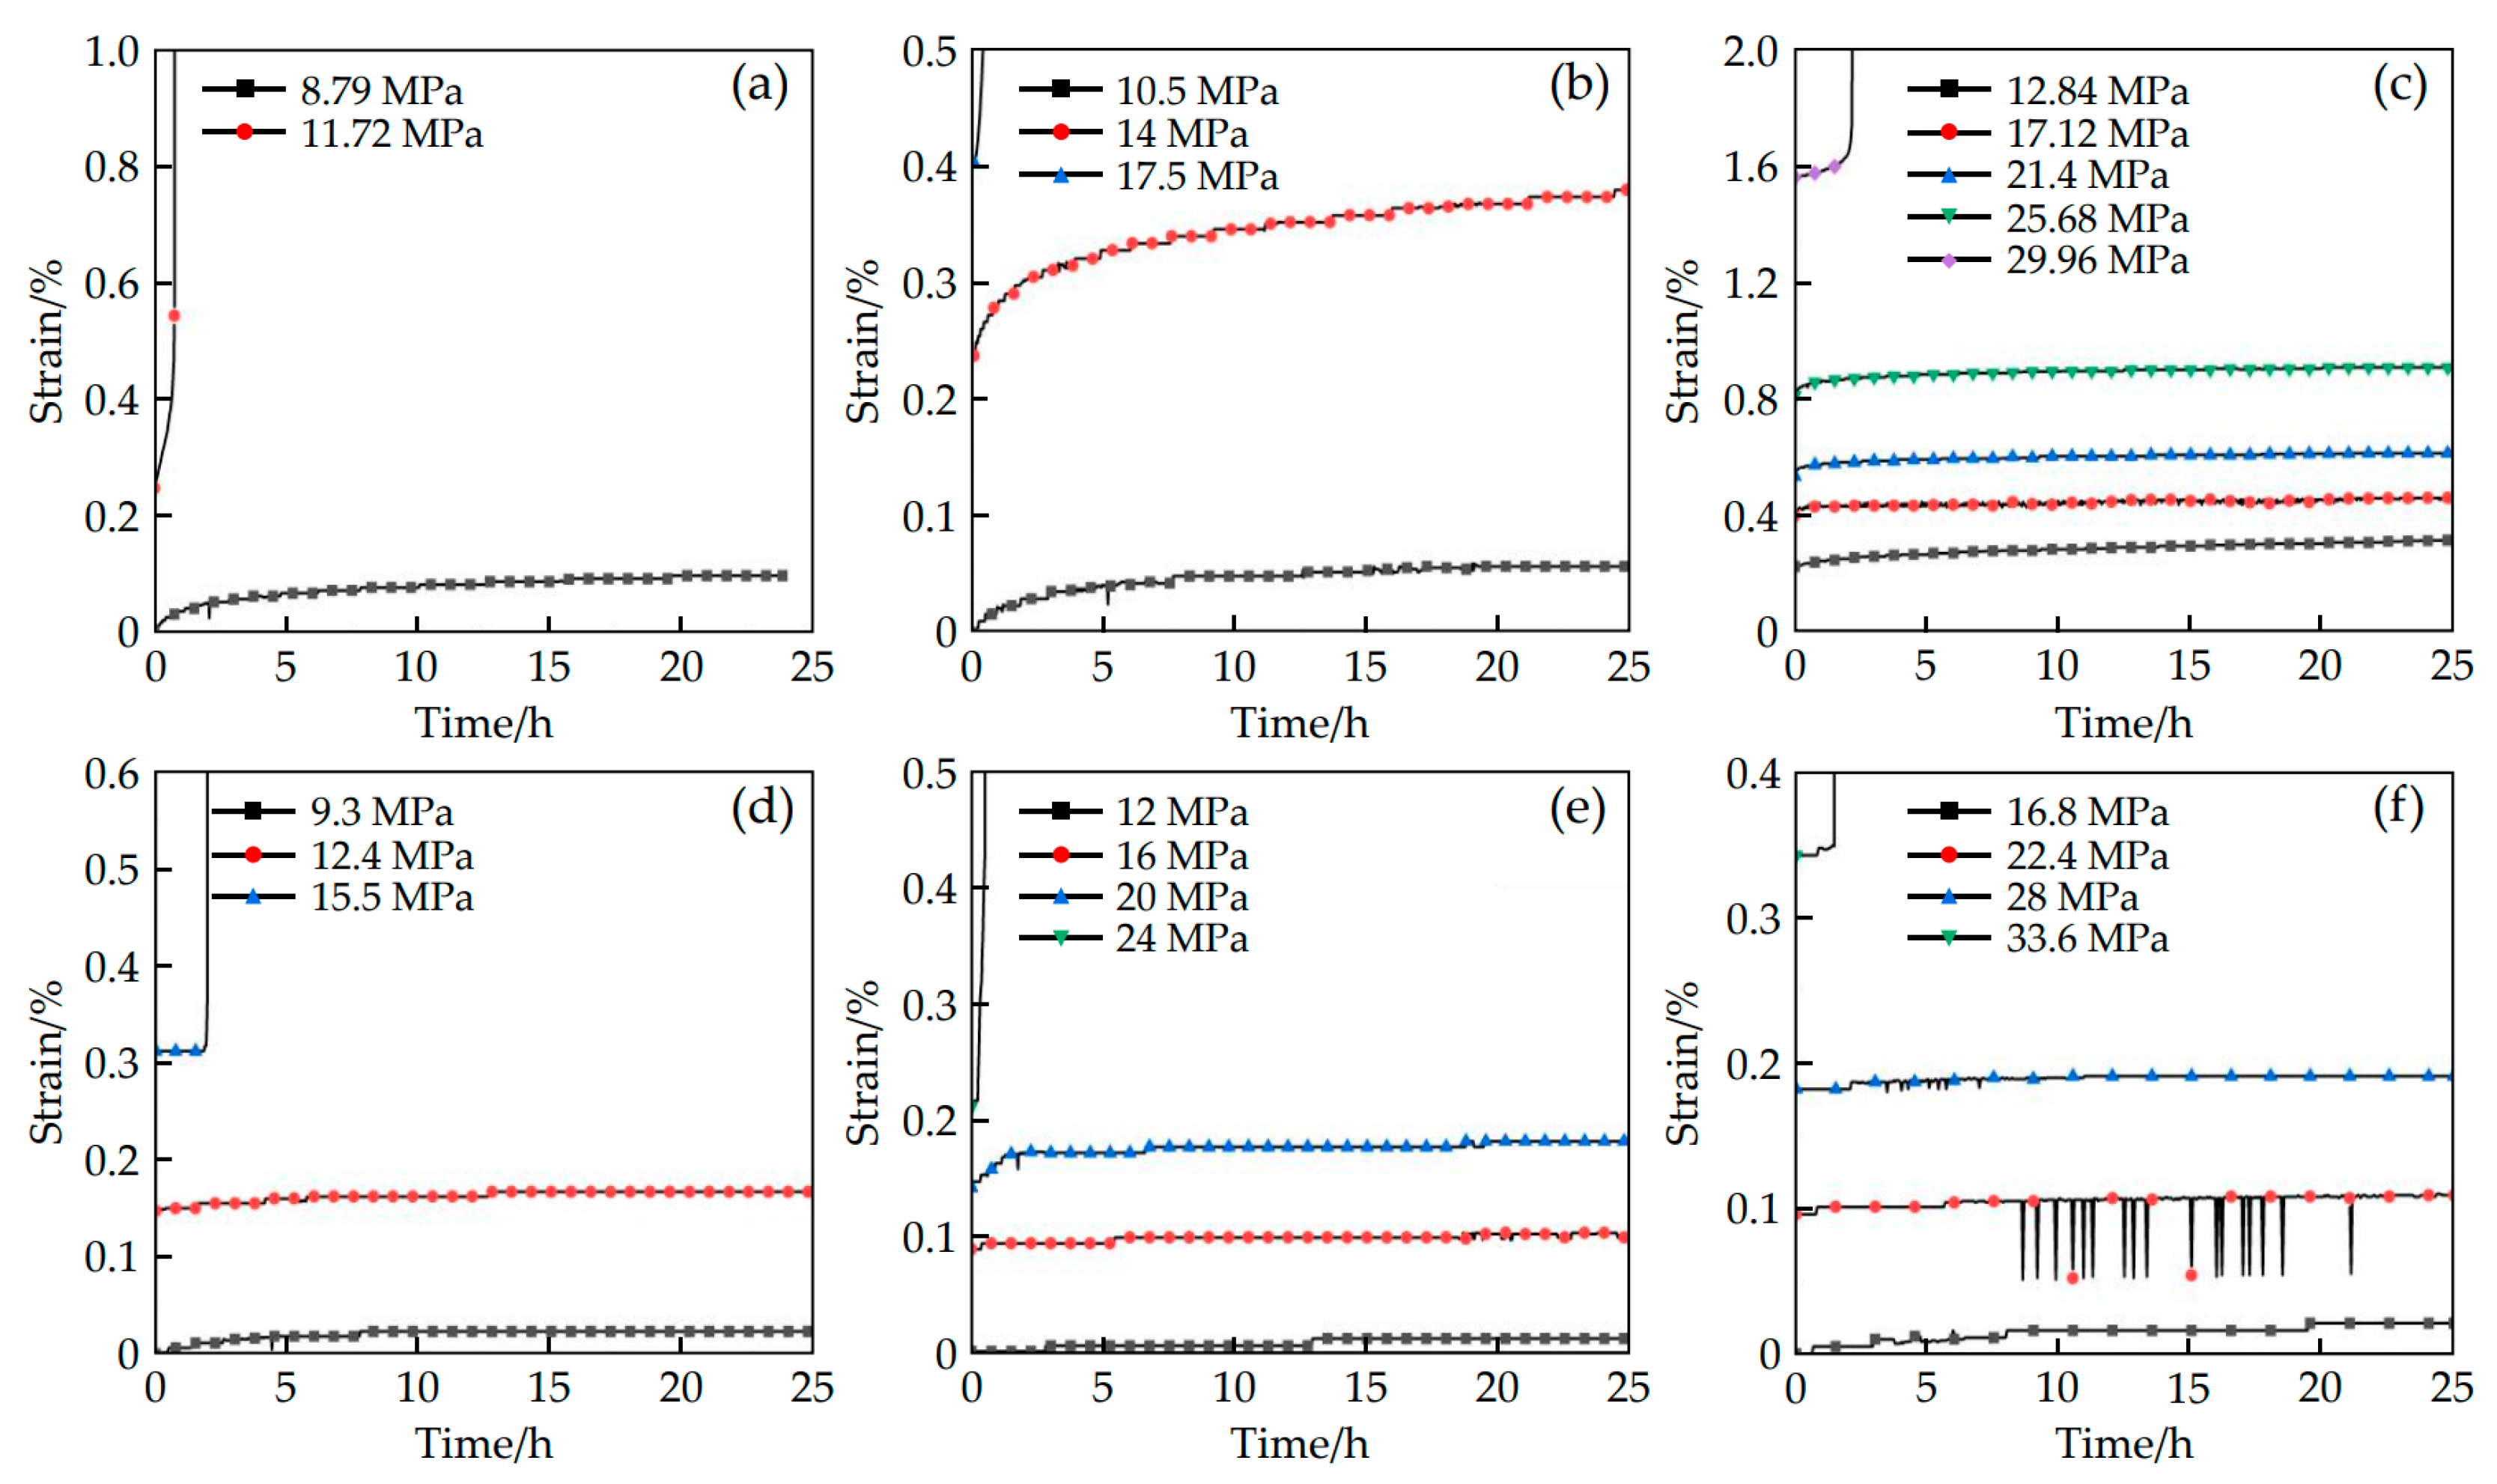
According to the above test scheme, the creep test was conducted on the well-cured specimens using the creep program of the TATW-500 testing machine, and the freezing creep curves at different freezing temperatures were obtained (Figure 13). Based on the data in Table 6, it can be seen that as the depth of the stratum (Zhiluo Group or Yan’an Group) increases, the UCS value gradually increases. Moreover, the fine-grained sand-stone of the Yan’an Group has higher strength than that of the Zhiluo Group.
Figure 13.
Creep test results under different working conditions in the triaxial state. (a) F-fg-zl-15; (b) F-fg-zl-10; (c) F-fg-zl-5; (d) F-fg-ya-15; (e) F-fg-ya-10; and (f) F-fg-ya-5.
Through creep curve analysis of sandstone from different strata under various freezing temperatures, it is found that, under lower loading levels and at different freezing temperatures, the creep curve exhibits a rapid decrease in strain rate over time, indicating decaying creep behavior. Within approximately six hours, the axial strain approaches a relatively stable value. After stabilization, as loading time increases, the axial deformation of the frozen sandstone no longer increases; the sample does not fail and can continue to bear the load (Figure 13a,b). Under high-level loading conditions, the strain curve eventually enters the progressive flow stage as time increases. In the progressive flow stage, the axial strain rate of frozen sandstone continuously increases until the specimen undergoes brittle failure (Figure 13c–f). However, in some creep tests, the samples had already failed before reaching the third loading stage (Figure 13a). This is because the specimens were in their natural state, and the sandstone itself has a certain degree of discreteness. Moreover, the processes of pressure solution and hardening during staged loading could have a certain impact on the test results. The maximum axial deformation of frozen sandstone under creep tests is much smaller than that under uniaxial compression tests. As the temperature drops from −5 °C to −15 °C, the pore water gradually freezes, including the water in micro- and nano-scale pores. This enhances the cementation effect of ice on particles (ice bonding) and the suction force generated by capillary action (low-temperature suction), thereby increasing the apparent stiffness of the rock mass. However, the phase change of water is accompanied by a volume expansion of approximately 9%, which can cause local stress concentrations in confined spaces, leading to the initiation and propagation of microcracks. Therefore, during the low-temperature freezing process, the mechanical behavior of sandstone results from a competition between the strengthening effect of ice bonding and suction and the weakening effect of frost heave-induced damage.
On the other hand, during the water-ice phase transition, as confining stress increases, the fracture mode of sandstone gradually shifts from axial splitting to multi-surface tensile-shear fracturing, indicating stress redistribution within the rock mass. Additionally, volume constraints induced by ice formation and the potential reactivation of pre-existing fractures may become more pronounced at higher stress levels [41,42]. Repeated freeze–thaw cycles directly cause deterioration of the mechanical properties of sandstone, notably a significant reduction in rock strength and stiffness. The damage to rocks caused by freeze–thaw cycles originates from changes in their internal microstructure, which constitutes the fundamental cause of the deterioration of their macroscopic properties. In addition, when microdamage caused by freeze–thaw cycles accumulates to a certain extent, it leads to intensified macroscopic deformation and a change in the damage mode. Finally, the hazards to engineering rock masses are mainly manifested in inducing rock slope instability, reducing foundation bearing capacity, and damaging surrounding rock masses.
Based on the stress–strain relationship curve of artificial frozen soil under uniaxial tests, it can be concluded that the power function can describe the relationship between stress and strain of frozen soil relatively well. However, the stress–strain relationship varies at different temperatures. Therefore, considering the influence of temperature, the following equation is proposed:
Based on the analysis of the deceleration and stabilization stages of uniaxial creep, during the deceleration creep process, the deformation rate of artificial frozen soil continuously decreases over time, exhibiting a time-dependent behavior. That is:
During the stable creep process, the deformation rate of artificial frozen soil does not change continuously over time, but remains constant (Con). That is:
From the above analysis, it is evident that creep deformation has a close relationship with time. Comprehensive studies have shown that the steady-state creep expression of artificially frozen sandstone is [43]:
where A, B, and M are all experimental parameters; T is the frozen temperature, °C; ε is creep strain, %; σ is creep stress, MPa; and t shows the creep deformation time, h.
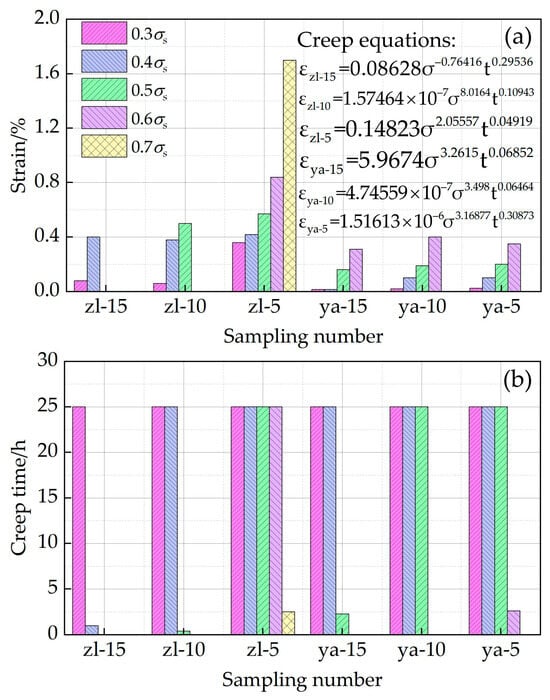
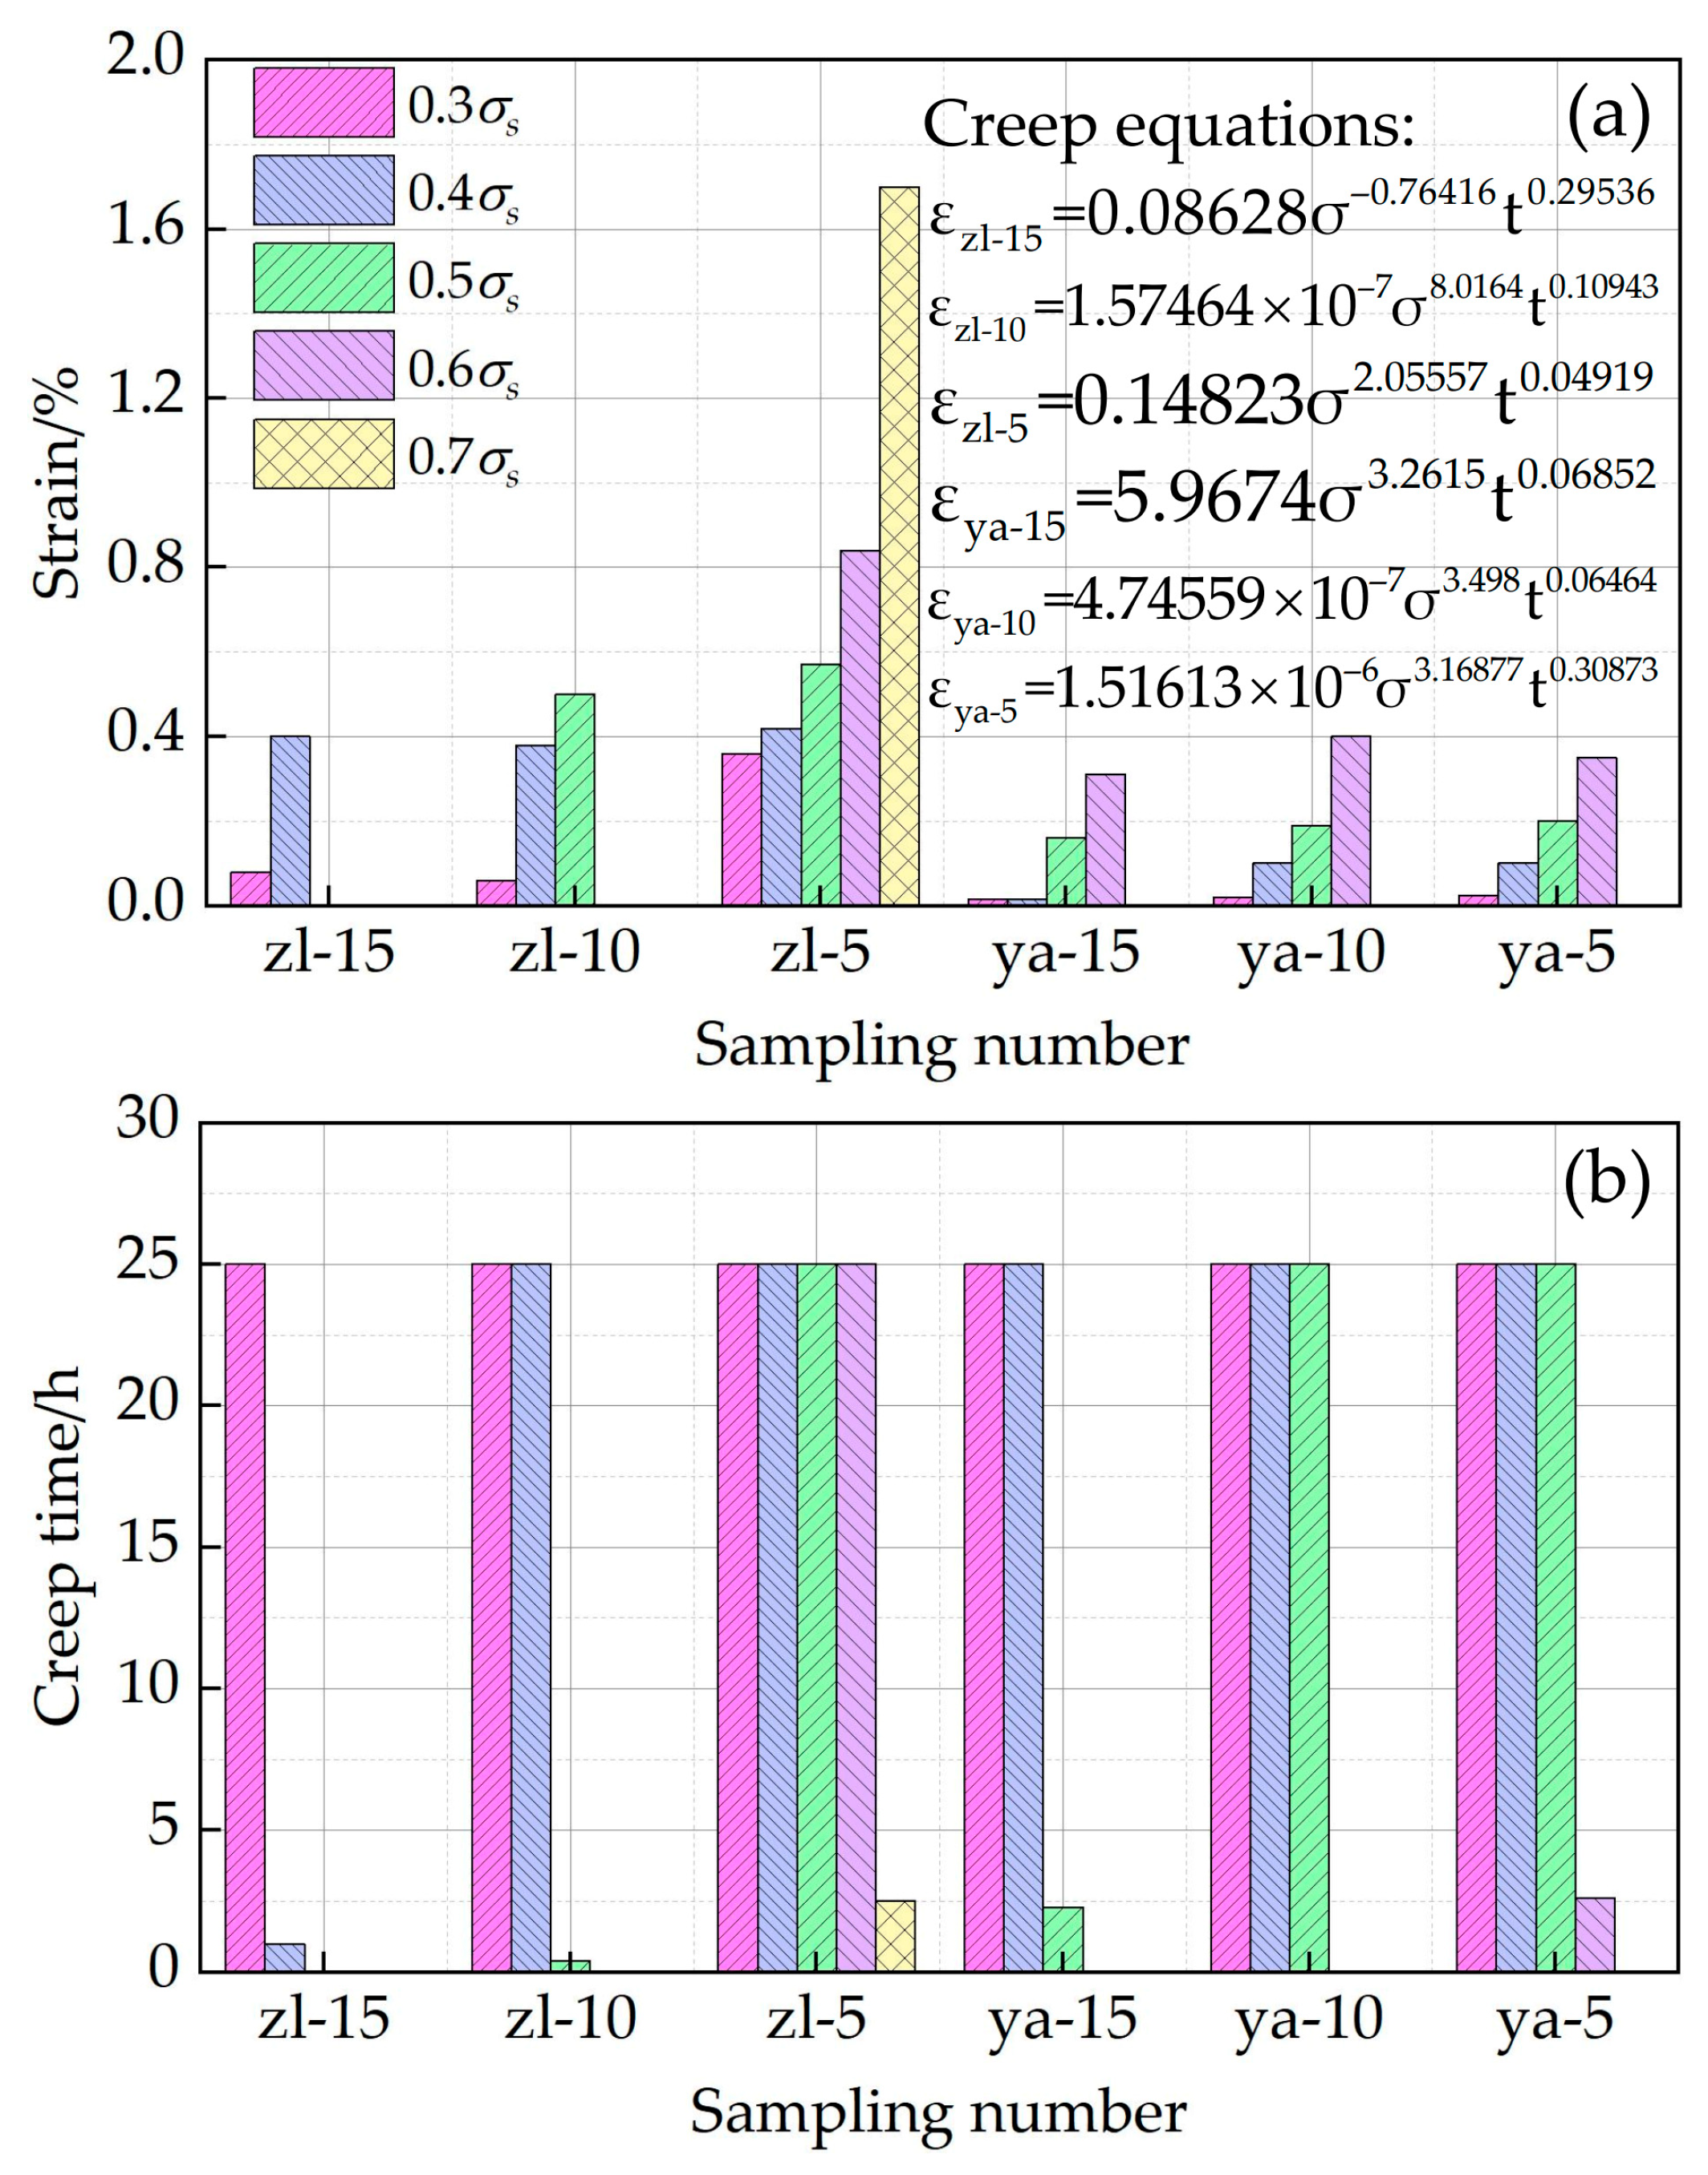
Based on the results of uniaxial creep tests and in combination with the creep constitutive equation, data fitting for artificial frozen sandstone in different strata was conducted using FLAC3D numerical analysis software (version 6.0), yielding strain (Figure 14a), time (Figure 14b), and the related creep equations shown in Figure 14 [44].
Figure 14.
Creep fitting equations under different strata and temperatures. (a) Strain; and (b) creep time.
In this study, the long-term strength of fine-grained sandstone will be determined using an approximate method. The critical value at which the rock transitions from stable creep to unstable creep is defined as the approximate long-term strength of the rock. From an experimental perspective, it is the minimum critical value at which the rock’s attenuated creep transitions to steady-state creep. In other words, in creep tests at various stress levels, the maximum stress value at which the creep rate decreases over time is taken as the long-term strength of the rock. The above uniaxial creep tests show that under low-level loading conditions, frozen sandstone exhibits a decaying creep behavior, and the specimens basically do not fail. Under high-level loading conditions, the creep curve shows a non-decaying variation pattern and the specimens fail quickly. The isochronous stress–strain curves indicate the nonlinearity during the creep process, and the variation patterns of different groups of sandstone samples are consistent, verifying the universality of the results.
Uniaxial creep tests on frozen rock show that:
- (1)
- Under lower stress levels (0.3 σs to 0.6 σs), the creep of rocks belongs to stable creep. When the stress level is higher (0.7 σs), the rocks enter the stage of unstable creep.
- (2)
- When the applied stress exceeds the long-term strength of the rock, frozen rock samples usually become unstable very quickly, which should be given due attention in construction design.
- (3)
- The main factors influencing the creep characteristics of frozen rock include temperature, stratum, stress, and time. In practical engineering, apart from strictly controlling the freezing temperature, the time factor should also be emphasized. The total deformation of the freezing wall should be minimized as much as possible to ensure the safety performance of the freezing wall.
4.6. Triaxial Creep Test and Results of Frozen Sandstone
In this subsection, the triaxial creep experiments of frozen rock physical mechanics were analyzed through curve fitting, and the basic creep parameters as well as the fitting parameters are listed in Table 7 below. Herein all the frozen rock samples are fine-grained sandstones, and the test temperature is controlled at −5 °C.
Table 7.
The triaxial creep test schemes at different freezing temperatures.
The triaxial compression creep fitting equation of sample F-fg-zl-5 is:
The triaxial compression creep fitting equation of sample F-fg-ya-5 is:
The triaxial creep test concluded that under low-temperature conditions, the overall strength of sandstone increases and its resistance to deformation enhances due to the phase change of water to ice. It also indicates that the strength and stiffness of sandstone increase as the temperature decreases, which is consistent with the results of the conventional compression test. Additionally, it can be seen from Table 7 that the resistance to deformation of sandstone does not change significantly at low temperatures, and the creep characteristics are not markedly different. For example, regarding the long-term strength of the samples in the triaxial creep test, the long-term strength of sample F-fg-zl-5 is 0.4 times its triaxial strength, and that of sample F-fg-ya-5 is 0.7 times its triaxial strength.
5. Conclusions
In this study, we conducted a systematic investigation into the geomechanical properties of sandstone in the Tarangole mining area. Through comprehensive analysis and integration of multiple factors such as stratigraphic fabric, grain size, sampling depth, temperature, and creep rate, we revealed the influence mechanisms of these factors on the mechanical behavior of sandstone. The main conclusions are as follows:
- (1)
- Based on engineering investigation and on-site mechanical tests, the sandstone in the mining area is prone to softening and disintegration and is classified as soft to medium-soft rock, with a basic quality grade of IV to V.
- (2)
- The thermal conductivity of medium-fine sandstone under freezing conditions is higher than its value under normal temperature conditions. Lithology, stratigraphic fabric, moisture content, and depth have significant influences on the thermal conductivity and specific heat capacity of the sandstone samples. For instance, the thermal conductivity at −10 °C (1.23 to 1.71 W/mK) is 2.4 times that at normal temperature. This fully demonstrates that the freezing temperature range of −8.86 to −13.6 °C differs significantly from the empirical values of similar strata. A freezing temperature of −5 °C is suggested to be more appropriate. While this provides preliminary guidance for construction, the final optimal temperature needs to be verified through more additional experimental data.
- (3)
- The results of uniaxial compression tests show that the strength of fine-grained sandstone is higher than that of medium- and coarse-grained sandstone. This might be related to the water absorption capacity of sandstone. The larger the particle size, the greater the water absorption capacity of the rock and the weaker its mechanical properties. In addition, the UCS value in the frozen state is 2 to 3 times that at normal temperature, significantly enhancing the safety of mineral resource exploitation in the study area.
- (4)
- The results of creep mechanical tests on frozen sandstone show that at low loading pressures (0.3 σs to 0.6 σs), the frozen sandstone exhibits attenuated (stable) creep, and the specimens basically do not suffer damage. However, at high loading pressures (0.7 σs), which exceed the long-term strength of the rock, unstable creep occurs and the rock samples are damaged. Under low-temperature conditions (below 0 °C), the strength and stiffness of sandstone increase as the temperature drops. The mechanism behind this lies in the phase change of water to ice, which enhances the overall strength of the sandstone and increases its resistance to deformation.
This research represents a preliminary exploration of the mechanical principles underlying mining operations in the Tarangole mining area of China. However, from the perspective of safe engineering practices, certain limitations remain. In the future, numerical simulations and machine learning methods will be integrated to validate the findings from engineering investigations and mechanical tests, with the aim of better meeting the on-site guidance requirements of practical engineering projects. In addition, acoustic emission technology will be introduced in future work to investigate the micro-damage evolution and precursor identification during the creep stage.
Author Contributions
Conceptualization, Z.L., N.L. and S.W.; methodology, S.W.; software, S.W.; validation, J.L., S.W. and Y.L.; formal analysis, Z.L. and X.T.; investigation, N.L.; resources, Z.L.; data curation, Z.L., Y.L. and X.T.; writing—original draft preparation, Z.L.; writing—review and editing, S.W. and Y.L.; visualization, N.L. and J.L.; supervision, Y.L.; project administration, Z.L.; funding acquisition, Z.L. All authors have read and agreed to the published version of the manuscript.
Funding
This research received no external funding.
Institutional Review Board Statement
Not applicable.
Informed Consent Statement
Not applicable.
Data Availability Statement
Most of the data generated during this study are included in the article. For other datasets, please contact the corresponding author with reasonable requests.
Conflicts of Interest
Authors Zhibin Li and Ning Liu were employed by CCTEG Xi’an Research Institute (Group) Co., Ltd.. Author Jianhua Li was employed by China Energy Group Hangjin Energy Company Ordos. The remaining authors declare that the research was conducted in the absence of any commercial or financial relationships that could be construed as a potential conflict of interest.
References
- Nilsson, L.J.; Pisarek, M.; Buriak, J.; Oniszk-Popławska, A.; Bućko, P.; Ericsson, K.; Jaworski, L. Energy policy and the role of bioenergy in Poland. Energy Policy 2006, 34, 2263–2278. [Google Scholar] [CrossRef] [Scilit]
- Yang, Y.; Zheng, X.; Sun, Z. Coal Resource Security Assessment in China: A Study Using Entropy-Weight-Based TOPSIS and BP Neural Network. Sustainability 2020, 12, 2294. [Google Scholar] [CrossRef] [Scilit]
- Li, Q.; Wang, Y.; Wang, J.; Gong, B.; Li, X. Numerical Simulation of Overburden Deformation Mechanism and Surface Settlement Characteristics Induced by Underground Coal Mining: A Case Study. Geol. J. 2025, 60, 1622–1637. [Google Scholar] [CrossRef] [Scilit]
- Zaghdoudi, T.; Tissaoui, K.; Maaloul, M.H.; Bahou, Y.; Kammoun, N. Asymmetric connectedness between oil price, coal and renewable energy consumption in China: Evidence from Fourier NARDL approach. Energy 2023, 285, 129416. [Google Scholar] [CrossRef] [Scilit]
- Gong, H.; Wang, B.; Liang, H.; Luo, Z.; Cao, Y. Strategic analysis of China’s geothermal energy industry. Front. Eng. Manag. 2021, 8, 390–401. [Google Scholar] [CrossRef] [Scilit]
- Liu, W.; Li, Q.; Yang, C.; Shi, X.; Wan, J.; Jurado, M.J.; Li, Y.; Jiang, D.; Chen, J.; Qiao, W.; et al. The role of underground salt caverns for large-scale energy storage: A review and prospects. Energy Storage Mater. 2023, 63, 103045. [Google Scholar] [CrossRef] [Scilit]
- Zhang, W.; Meng, Z.; Yang, J.; Song, Y.; Zhou, Y.; Zhao, C.; Yuan, J. Managing the phaseout of coal power: A comparison of power decarbonization pathways in Jilin Province. Resour. Conserv. Recycl. 2022, 180, 106216. [Google Scholar] [CrossRef] [Scilit]
- Brook, M.; Hebblewhite, B.; Mitra, R. Coal mine roof rating (CMRR), rock mass rating (RMR) and strata control: Carborough Downs Mine, Bowen Basin, Australia. Int. J. Min. Sci. Technol. 2020, 30, 225–234. [Google Scholar] [CrossRef] [Scilit]
- Schudel, G.; Plante, B.; Bussière, B.; Boulanger-Martel, V.; McBeth, J.M. Sulfide oxidation during the simulated weathering of pyrrhotite-rich tailings: Impacts of freeze-thaw cycles and chloride salinity. Cold Reg. Sci. Technol. 2023, 209, 103802. [Google Scholar] [CrossRef] [Scilit]
- Li, X.; Bao, H.; Lan, H.; Yan, C.; Qiang, S.; Sun, W.; Liu, S. Evolution characteristics of bedding-perpendicular joints development in soft-hard interbedded strata considering interface morphology: A case study of the Ordos Basin, China. Bull. Eng. Geol. Environ. 2026, 85, 4. [Google Scholar] [CrossRef] [Scilit]
- Tian, J.; Wang, Z.; Daskalopoulou, K.; Zhang, M.; Huo, Y.; Cao, Y.; Yang, J.; Liu, W.; Liu, J.; Xu, S. Hydrochemical characteristics, driving factors and health risk of fluoride in groundwater from the northwestern Ordos Basin, China. Geosci. Front. 2025, 16, 102123. [Google Scholar] [CrossRef] [Scilit]
- Ren, Q.; Li, Y.P.; Fang, P.; Zhao, S.K.; Wang, B.; Zhang, C.; Luo, B.Y.; Zhang, T.; Jia, X.Y.; Wang, Y. Research on rock burst prevention mechanism and practice in Tarangole Deep Mining Area. Saf. Coal Mines 2022, 53, 112–119. [Google Scholar] [CrossRef]
- Eremenko, A.A.; Marysyuk, V.P.; Konurin, A.I.; Darbinyan, T.P.; Samosenko, I.V. Seismic Hazard Assessment in Rock Mass during Complex Deposit Mining in Difficult Hydrogeological Conditions. J. Min. Sci. 2024, 60, 576–581. [Google Scholar] [CrossRef] [Scilit]
- Li, Q.; Wang, Y.; Li, X.; Tang, S.; Gong, B.; Jiang, S. Evolutionary characteristics of the fracture network in rock slopes under the combined influence of rainfall and excavation. Bull. Eng. Geol. Environ. 2025, 84, 47. [Google Scholar] [CrossRef] [Scilit]
- Ali, M.; Zubair, A.; Farooq, Z.; Farooq, K.; Masoud, Z. Prediction of small-strain elastic stiffness of natural and artificial soft rocks subjected to freeze-thaw cycles. J. Rock Mech. Geotech. Eng. 2025, 17, 3546–3562. [Google Scholar] [CrossRef] [Scilit]
- Lv, Z.; Yan, M.; Wu, M.; Xia, C.; Liu, W. Freeze-thaw deformation characteristics and thermo-mechanical coupled freeze-thaw deformation model of unsaturated rocks. Eng. Geol. 2025, 359, 108441. [Google Scholar] [CrossRef] [Scilit]
- Vervoort, A. Impact of the Hydrogeological Conditions on the Calculated Surface Uplift above Abandoned and Flooded Coal Mines. Geosciences 2022, 12, 454. [Google Scholar] [CrossRef] [Scilit]
- Cravotta, C.A.; Sherrod, L.; Galeone, D.G.; Lehman, W.G.; Ackman, T.E.; Kramer, A. Hydrological and Geophysical Investigation of Streamflow Losses and Restoration Strategies in an Abandoned Mine Lands Setting. Environ. Eng. Geosci. 2017, 23, 243–273. [Google Scholar] [CrossRef] [Scilit]
- Wang, B.; Zhang, J.; Lin, H.; Liu, D.; Yang, T. Study on the Structural Instability Characteristics of Interlayer Rock Strata During Mining Under Interval Goaf in Shallow Coal Seams. Appl. Sci. 2024, 14, 11870. [Google Scholar] [CrossRef] [Scilit]
- Yan, T.; Wang, W.; Chen, L.; Wang, Z.; Ren, Y. Hydrological effects of the underground hydraulic curtain with different design parameters based on numerical modeling for a co-exploitation of coal and uranium. Int. J. Coal Geol. 2022, 257, 104011. [Google Scholar] [CrossRef] [Scilit]
- Liu, B.; He, Y.; Han, Y.; Li, W.; Zeng, J.; Wang, G. Effect of Cyclic Freezing and Thawing on Permeability and Mechanical Properties of Red Sandstone Under Triaxial Compression Condition. Rock Mech. Rock Eng. 2025, 59, 1–25. [Google Scholar] [CrossRef] [Scilit]
- Yang, H.; Wu, L.; Li, X. Mechanical Behavior and Damage Mechanisms of Saturated Coal-Rock Under Cyclic Freeze-Thaw Conditions with Different Cold Conditions. Processes 2025, 13, 3675. [Google Scholar] [CrossRef] [Scilit]
- Qiu, B.; Fan, L.; Du, X. Microstructure deterioration of sandstone under freeze-thaw cycles using CT technology: The effects of different water immersion conditions. J. Rock Mech. Geotech. Eng. 2025, 17, 1599–1611. [Google Scholar] [CrossRef] [Scilit]
- Han, X.; Sun, G.; Fu, H.; Tan, C.; Huang, Z.; Yin, P.; Zhang, Q.; Fan, W.; Yin, S. Experimental Study on Deformation and Damage Evolution of Cracked Red Sandstone Under Freeze-Thaw Cycles. Appl. Sci. 2024, 14, 11174. [Google Scholar] [CrossRef] [Scilit]
- Jia, C.; Pang, R.; Yu, J.; Lei, M.; Li, Z. Investigation on freeze-thaw damage mechanism of porous rock with discrete element method. Rock Soil Mech. 2024, 45, 588–600. [Google Scholar] [CrossRef]
- Miao, Y.; Yu, W.; Jin, L.; Wang, L.; Lin, J.; Li, Y.; Lu, Z.; Jiang, J. Effect of shrinkage-induced initial damage on the frost resistance of concrete in cold regions. Eng. Fract. Mech. 2024, 312, 110652. [Google Scholar] [CrossRef] [Scilit]
- Zhou, S.; Zhou, C.; Sun, Y.; Wang, M. Predicting mechanical properties of freeze-thaw clay under varying compaction levels and confining pressures utilizing GA-BP network and machine learning-aided Duncan-Chang constitutive model. Environ. Earth Sci. 2025, 84, 331. [Google Scholar] [CrossRef] [Scilit]
- Zhou, S.; Zhang, Z.X.; Luo, X.; Huang, Y.; Yu, Z.; Yang, X. Predicting dynamic compressive strength of frozen-thawed rocks by characteristic impedance and data-driven methods. J. Rock Mech. Geotech. Eng. 2024, 16, 2591–2606. [Google Scholar] [CrossRef] [Scilit]
- Mamo, M.; Ginting, D.; Renken, R.; Eghball, B. Stability of ion exchange resin under freeze-thaw or dry-wet environment. Soil Sci. Soc. Am. J. 2004, 68, 677–681. [Google Scholar] [CrossRef] [Scilit]
- Singhal, A.; Goel, S.; Sengupta, D. Physicochemical and elemental analyses of sandstone quarrying wastes to assess their impact on soil properties. J. Environ. Manag. 2020, 271, 111011. [Google Scholar] [CrossRef] [Scilit] [PubMed]
- Wang, Z.; Liu, Y.; Song, Z.; Ni, Y.; Zhang, P. Research and Application of Rockburst Prevention Technology in the Return Airway with Deep Thick Hard Sandstone Roof. Appl. Sci. 2025, 15, 6270. [Google Scholar] [CrossRef] [Scilit]
- Xiao, P.; Liu, X.; Zhao, B. Experimental study on gas adsorption characteristics of coals under different Protodyakonov’s coefficient. Energy Rep. 2022, 8, 10614–10623. [Google Scholar] [CrossRef] [Scilit]
- Sun, Y.; Yu, C.; Jiang, S.; Chen, Y.; Wang, Z.; Duan, S.; Xie, J. Disintegration behaviors of red clay under wet-dry cycles. J. Rock Mech. Geotech. Eng. 2025, 17, 5875–5892. [Google Scholar] [CrossRef] [Scilit]
- GB/T 12719-2021; Exploration Specification of Hydrogeology and Engineering Geology in Mining Areas. State Administration of Work Safety: Beijing, China, 2021.
- Pandey, A.; Kattamuri, P.K.; Sastry, B.S. Measurement of Thermal Conductivity of Sandstone Using Lee’s Apparatus: A Case Study. Min. Metall. Explor. 2021, 38, 1997–2003. [Google Scholar] [CrossRef] [Scilit]
- Qi, C.; Guo, W.; Li, Q.; Ma, X. Decay function and damage strain model of fresh sandstone subjected to freeze-thaw cycles. Bull. Eng. Geol. Environ. 2023, 82, 181. [Google Scholar] [CrossRef] [Scilit]
- Kim, E.; Garcia, A.; Changani, H. Fragmentation and energy absorption characteristics of Red, Berea and Buff sandstones based on different loading rates and water contents. Geomech. Eng. 2018, 14, 151–159. [Google Scholar] [CrossRef]
- Basu, P.; Thomas, B.S.; Gupta, R.C.; Agrawal, V. Properties of sustainable self-compacting concrete incorporating discarded sandstone slurry. J. Clean. Prod. 2021, 281, 125313. [Google Scholar] [CrossRef] [Scilit]
- MT/T 593.4-2011; Artificial Frozen Soil Physics Mechanics Performance Test. State Administration of Work Safety: Beijing, China, 2011.
- Li, J.C.; Rong, L.F.; Li, H.B.; Hong, S.N. An SHPB Test Study on Stress Wave Energy Attenuation in Jointed Rock Masses. Rock Mech. Rock Eng. 2019, 52, 403–420. [Google Scholar] [CrossRef] [Scilit]
- Zheng, Z.; Shi, Z.; Wang, M.; Lin, H.; Li, J.; Han, D.; Li, K.; Jiang, C. Fatigue fracture and energy evolution characteristics of sandstone under water-ice phase transitions via the discrete element method. Comput. Geotech. 2025, 179, 107023. [Google Scholar] [CrossRef] [Scilit]
- Zhang, D.; Lu, G.; Wu, J.; Nie, W.; Ranjith, P.G. Effects of Ultralow Temperature and Water Saturation on the Mechanical Properties of Sandstone. Rock Mech. Rock Eng. 2023, 56, 3377–3397. [Google Scholar] [CrossRef] [Scilit]
- Yin, W.; Wang, X.Y.; Zheng, S.; Zhang, K.; Zhang, F.R. Triaxial creep test and damage model study of layered red sandstone under freeze-thaw cycles. Case Stud. Constr. Mater. 2024, 21, e03785. [Google Scholar] [CrossRef] [Scilit]
- Zhu, W.C.; Yan, B.X.; Liu, X.G.; Yang, Z.; Guan, K. Rock Creep Deformation Triggered by Dynamic Disturbance: Numerical Simulation. Int. J. Geomech. 2022, 22, 04022101. [Google Scholar] [CrossRef] [Scilit]

Disclaimer/Publisher’s Note: The statements, opinions and data contained in all publications are solely those of the individual author(s) and contributor(s) and not of MDPI and/or the editor(s). MDPI and/or the editor(s) disclaim responsibility for any injury to people or property resulting from any ideas, methods, instructions or products referred to in the content. |
© 2026 by the authors. Licensee MDPI, Basel, Switzerland. This article is an open access article distributed under the terms and conditions of the Creative Commons Attribution (CC BY) license.