


Abstract
While graph-derived signals are widely used in tabular learning, existing studies typically rely on limited experimental setups and average performance comparisons, leaving the statistical reliability and robustness of observed gains largely unexplored. Consequently, it remains unclear which signals provide consistent and robust improvements. This paper presents a taxonomy-driven empirical analysis of graph-derived signals for tabular machine learning. We propose a unified and reproducible evaluation method to systematically assess which categories of graph-derived signals yield statistically significant and robust performance improvements. The method provides an extensible setup for the controlled integration of diverse graph-derived signals into tabular learning pipelines. To ensure a fair and rigorous comparison, it incorporates automated hyperparameter optimization, multi-seed statistical evaluation, formal significance testing, and robustness analysis under graph perturbations. We demonstrate the applicability of the method through an extensive case study on a large-scale, imbalanced cryptocurrency fraud detection dataset. The analysis identifies signal categories providing consistently reliable performance gains and offers interpretable insights into which graph-derived signals indicate fraud-discriminative structural patterns. Furthermore, robustness analyses reveal pronounced differences in how various signals handle missing or corrupted relational data. These findings demonstrate the proposed taxonomy-driven evaluation method’s practical utility for fraud detection and illustrate how it can be applied in other application domains.
1. Introduction
Graph-structured data provide rich contextual information that is typically not captured with classical tabular machine learning pipelines. Such data arise naturally in many real-world applications, including fraud detection, social networks, biological networks, and knowledge graphs. Classical tabular machine learning models are typically developed under an independent and identically distributed (i.i.d.) assumption and are widely used in practice; data that violate this assumption can distort analysis and modeling when relational dependencies are ignored [1]. Consequently, modern tabular pipelines rely on feature engineering to compensate for missing relational structure [2]. For graph-structured data, graph-derived signals are quantitative representations extracted from graph structure and provide a principled way to model these dependencies, enriching machine learning pipelines with relational information [3].
This shift toward graph-derived signals places them squarely within modern tabular learning pipelines, where predictive performance is increasingly driven by representation quality rather than model complexity. Recent benchmarks in tabular machine learning underscore that predictive performance is often governed more by a model’s inductive biases and the quality of its input features than by architectural complexity alone [4]. Although these findings are derived from classical tabular settings without explicit graph structure, they provide a strong data-centric motivation for prioritizing high-quality feature representations over purely end-to-end architectures. In graph-structured domains, this perspective naturally motivates the use of explicitly extracted graph-derived signals as informative feature representations within tabular pipelines. A rigorous data-centric evaluation reinforces this perspective, demonstrating that after expert, dataset-specific feature engineering, performance gaps between advanced models shrink considerably, shifting the critical focus from model selection to representation quality [5].
Despite this critical insight, the evaluation and application of graph-derived signals often lack a similarly principled, data-centric foundation. Their empirical benefit is frequently assessed through limited, ad hoc experimental setups that report average performance improvements over a narrow set of configurations. Such narrowly defined benchmarks risk drawing biased conclusions, as model rankings and reported gains can be highly sensitive to specific preprocessing choices and evaluation protocols [6]. This practice leaves key questions unanswered: Are reported gains statistically reliable and reproducible across random seeds? Are they robust to variations in graph structure or sampling? Furthermore, given the vast and heterogeneous space of possible graph-derived signals, it is often unclear a priori which graph-derived signals are most informative for a specific downstream application task. Consequently, a shift toward evaluation methods that explicitly assess robustness and statistical reliability is crucial for a meaningful comparison of these learning approaches [5]. This lack of systematic evaluation complicates principled model design and poses challenges for drawing reliable conclusions in the field.
Recent methodological research in other technical domains similarly emphasizes the importance of systematic modeling and quantitative evaluation. For example, precision modeling in multi-camera measurement systems [7] and data-driven structural monitoring approaches for engineered infrastructure [8] illustrate the broader relevance of rigorous evaluation frameworks when analyzing complex structured systems.
To enable reliable progress, we argue that systematic analyses must (i) compare different types of graph-derived signals under a unified evaluation method, (ii) explicitly account for randomness in data splits and model training, and (iii) assess whether observed improvements are statistically significant and robust to structural changes in the underlying graph rather than incidental. In the absence of such analyses, practitioners face uncertainty when selecting graph-derived signals from a large and heterogeneous design space for downstream tabular learning tasks.
To navigate this vast design space, a taxonomy-driven perspective is essential, which will enable graph-derived signals to be grouped according to the type of graph information they encode. Such an organization supports principled comparison, improves the interpretability of empirical results, and facilitates task-specific signal selection across a large design space.
To address these challenges, we conducted a systematic, taxonomy-driven analysis of graph-derived signals in tabular machine learning. Specifically, we evaluated representative graph signal types across multiple information categories using a reproducible Systematic Evaluation Method (SEM) that incorporates multi-seed evaluation, robustness analysis under graph perturbations, and formal hypothesis testing. Rather than ranking individual methods, this study aimed to assess the statistical relevance and robustness of different classes of graph-derived signals with respect to specific downstream application tasks under controlled conditions. The core contribution of this work is a statistically grounded evaluation method that enables reliable, interpretable, and robustness-aware comparisons of graph-derived signals for tabular learning.
We demonstrate the proposed evaluation method through a practical case study in cryptocurrency transaction fraud detection. While the quantitative findings are necessarily specific to this domain, this application serves as a representative and challenging benchmark that illustrates the general applicability of the proposed evaluation method. In this fraud detection setting, relational dependencies between entities encode information that is not accessible to transaction-level features alone, as illicit activity often propagates through complex chains of interactions. By instantiating the methodology on this high-stakes task, we demonstrate how statistically grounded insights can be obtained within a concrete graph-augmented tabular learning setting.
Our evaluation was conducted on the Elliptic Bitcoin Dataset [9], a commonly used large-scale, temporal, and highly imbalanced benchmark that reflects key challenges of real-world fraud detection. We analyzed different categories of graph-derived signals, including proximity-based signals that capture local neighborhood information and structural signals that encode broader role-based patterns, to assess when and how relational information contributes measurable value beyond tabular baselines that do not incorporate graph-derived signals.
Beyond serving as a methodological demonstration, this case study offers a statistically grounded assessment of the practical utility of graph-derived signals in a security-critical application. By combining multi-seed evaluation with formal significance testing, we identify which categories of graph-derived signals yield consistent and statistically reliable performance gains in this setting. Moreover, the taxonomy-driven analysis facilitates interpretation by linking different signal categories to characteristic fraud-related patterns, such as the propagation of illicit activity through local neighborhoods. Finally, robustness experiments under controlled graph perturbations reveal substantial differences in how signal categories degrade under missing or corrupted relational data, highlighting robustness as a key criterion for practical signal selection.
Through this case study, we address the following research questions to investigate the utility, robustness, and interpretability of graph-derived signals within a representative tabular learning setting:
- RQ1 (Utility): Do graph-derived signals provide statistically significant performance improvements over tabular baselines that do not incorporate explicit graph-derived information, and does this effect vary across different categories of graph information?
- RQ2 (Robustness): How robust are the performance gains from different graph signal categories to controlled degradation (e.g., random edge removal) in the underlying graph structure?
- RQ3 (Taxonomy Guidance): To what extent does a taxonomy-driven organization of graph signals facilitate interpretable, category-level insights that can inform signal selection in graph-augmented tabular learning?
The remainder of this article is organized as follows. Section 2 provides an overview of the proposed evaluation method and its conceptual foundations. Section 3 introduces the detailed evaluation method and statistical methodology. Section 4 reviews related work on graph-based features and representation learning, while Section 5 presents the taxonomy of graph-derived signals that guides our analysis. Section 6 describes the fraud detection case study based on the Elliptic Bitcoin dataset. Section 7 details the experimental setup, including classifiers, data splits, and evaluation metrics. Section 8 reports and analyzes the experimental results, including robustness and statistical significance analyses. Finally, Section 9 concludes the paper and discusses implications for future research.
2. Overview of the Proposed Evaluation Method
The SEM introduced in this work is designed both as a methodological framework and as a practical tool for the systematic use of graph-derived signals in supervised tabular machine learning. Beyond providing a conceptual evaluation method, SEM is accompanied by a fully documented and publicly available implementation that enables direct application to graph-augmented learning tasks.
The full pipeline, including graph signal generation, standardized feature construction, multi-seed supervised evaluation, statistical validation, and robustness analysis under controlled graph perturbations, is implemented and released as an open framework. The implementation is publicly available on GitHub (https://github.com/graph-eval/graph-eval-protocol, accessed on 5 March 2026) and archived on Zenodo (https://doi.org/10.5281/zenodo.18351526, accessed on 5 March 2026) to support reproducibility and reuse. The repository contains configuration templates, environment specifications, and workflow descriptions that allow practitioners to adapt the pipeline to their own graph-based application domains. The Zenodo archive additionally provides the generated graph-derived signals and intermediate artifacts from the Elliptic case study.
SEM is intentionally designed to be task-agnostic and adaptable to any supervised learning scenario where data can be represented as a graph. The framework supports practitioners in systematically identifying which graph-derived signals provide statistically reliable and robust improvements for a given prediction task. In contrast to ad hoc feature engineering, SEM combines a taxonomy-driven organization of graph signals with a structured procedure for signal selection, validation, and interpretation under controlled experimental conditions. Because the utility of specific graph-derived signals depends on the prediction task and data characteristics, this systematic evaluation is essential for identifying signals that provide reliable benefits in a given application.
Conceptually, SEM addresses a common practical challenge: when graph-structured data are available, it is often unclear how relational information should be extracted and integrated into supervised learning pipelines in a principled and effective way. SEM enables statistically grounded comparisons that help distinguish robust and reproducible gains from random variation. Moreover, by organizing graph-derived signals into interpretable categories and evaluating them at the feature level, SEM supports transparent reasoning about which types of structural information contribute to predictive performance. This makes the framework particularly relevant for high-stakes or data-sensitive applications where reliability and interpretability are critical, especially in graph-based settings where noise, missing relations, or evolving structures can substantially affect downstream performance and robustness-aware evaluation becomes essential.
The following sections describe the conceptual foundations, data flow, and algorithmic structure of the proposed evaluation method. To make the protocol more accessible beyond domain experts, a step-by-step illustrative example with minimal input data is provided in Appendix A.
2.1. Data Flow Overview
Figure 1 provides a workflow-oriented view of the method stages introduced in Section 2.2. Conceptually, the method can be viewed as a transformation pipeline from raw graph and tabular data to statistically grounded conclusions about signal utility.
Figure 1.
Overview of the proposed evaluation method for taxonomy-guided graph signals. Solid arrows denote the core pipeline, while dashed arrows indicate optional robustness extensions via graph perturbations.
2.2. Method Stages
At a high level, the evaluation method consists of the following stages:
- 1.
- Input data foundation: A transaction graph together with associated tabular node features and labels forms the common input basis for all experiments.
- 2.
- Taxonomy-guided graph signal generation: Graph-derived signals are generated according to a structured taxonomy, including centrality-based indicators, community-related features, and node embeddings that capture structural or proximity information.
- 3.
- Standardized feature artifacts: Tabular base features and graph-derived signals are merged into standardized feature artifacts with identical and fixed data splits across all baseline and graph-augmented configurations. These artifacts serve as consistent inputs for all downstream classifiers to ensure comparability and are reused across classifiers and experimental runs without recomputation.
- 4.
- Controlled supervised evaluation: The hyperparameters of each classifier are optimized once on validation data and subsequently fixed for all multi-seed evaluations to prevent optimization bias. Models are then evaluated across multiple random seeds to quantify performance variability. Decision thresholds are tuned in a controlled manner.
- 5.
- Statistical validation: Performance differences between baseline and graph-augmented settings are assessed using paired statistical tests, specifically McNemar’s significance test, combined with robust aggregation across seeds and stability analysis.
- 6.
- Final assessment and robustness analysis: Statistical validation results and robustness analyses are combined into a final, statistically grounded assessment of signal utility, stability, and robustness.
This staged design ensures that observed improvements can be attributed to the evaluated signals rather than to differences in data splits, optimization bias, or random variation.
2.3. Method Logic (Pseudocode)
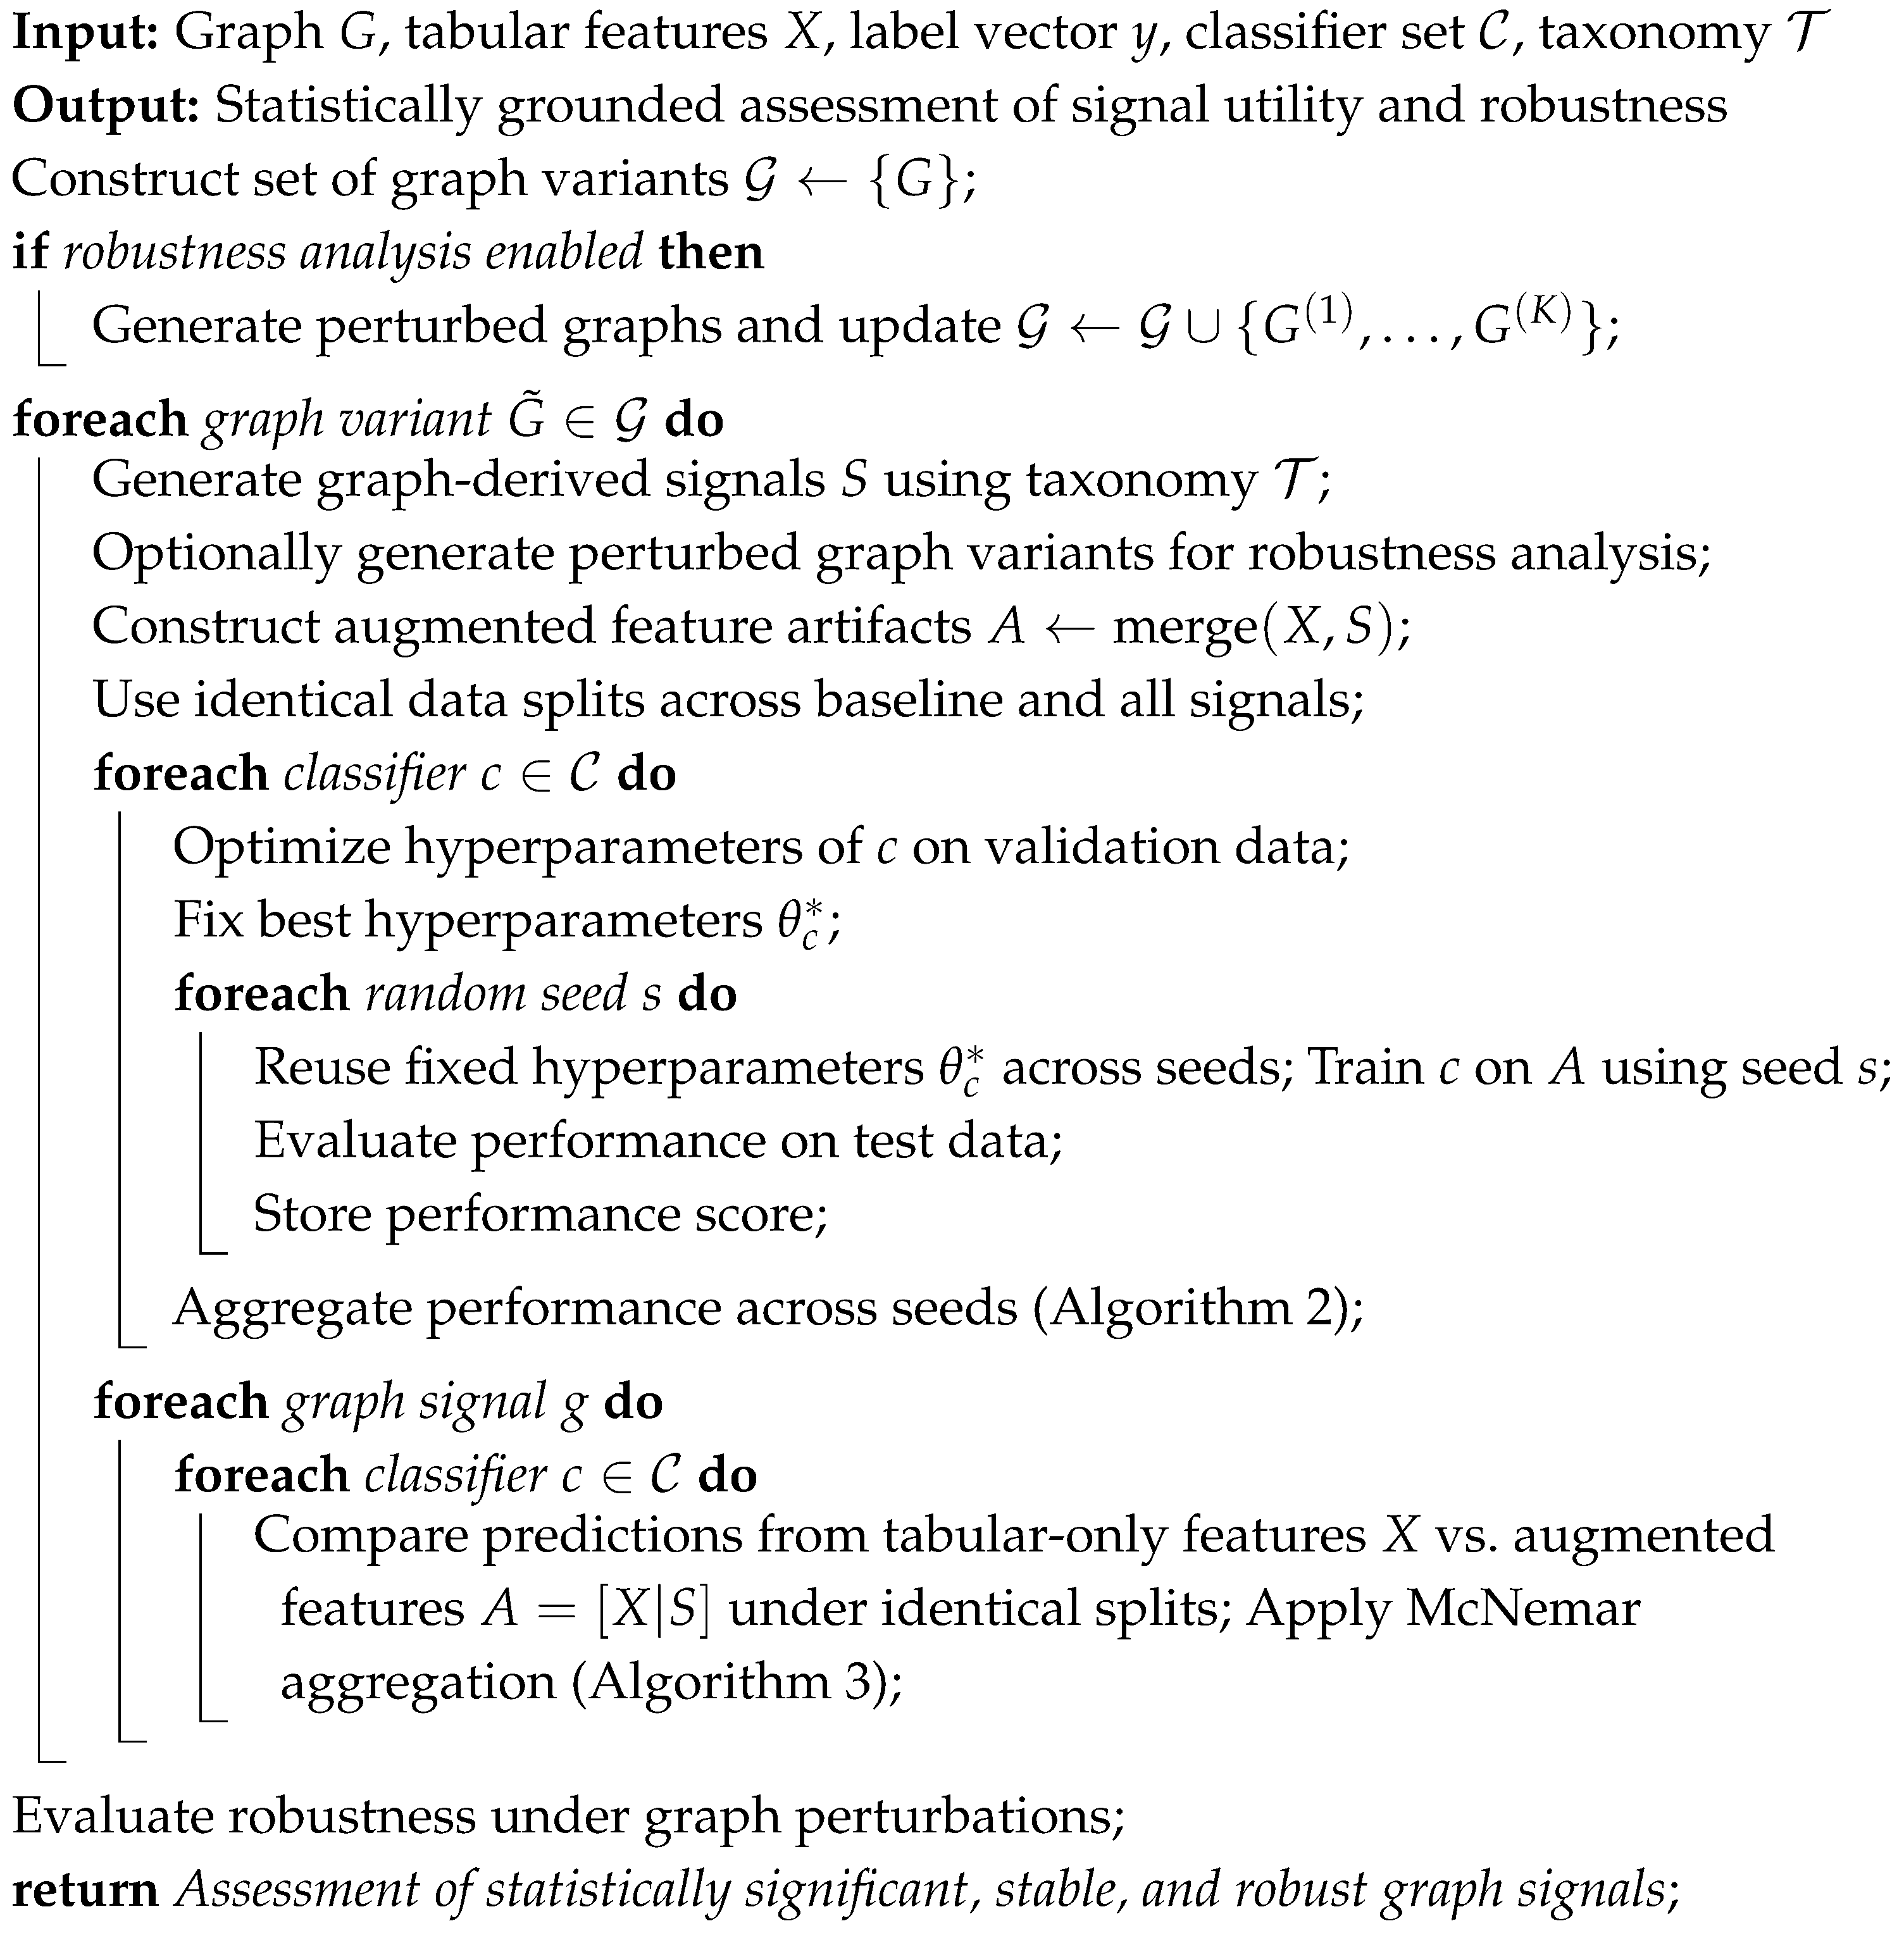
The core logic of the evaluation method is summarized in Algorithm 1.
| Algorithm 1: Systematic Evaluation Method (SEM) pipeline |
 |
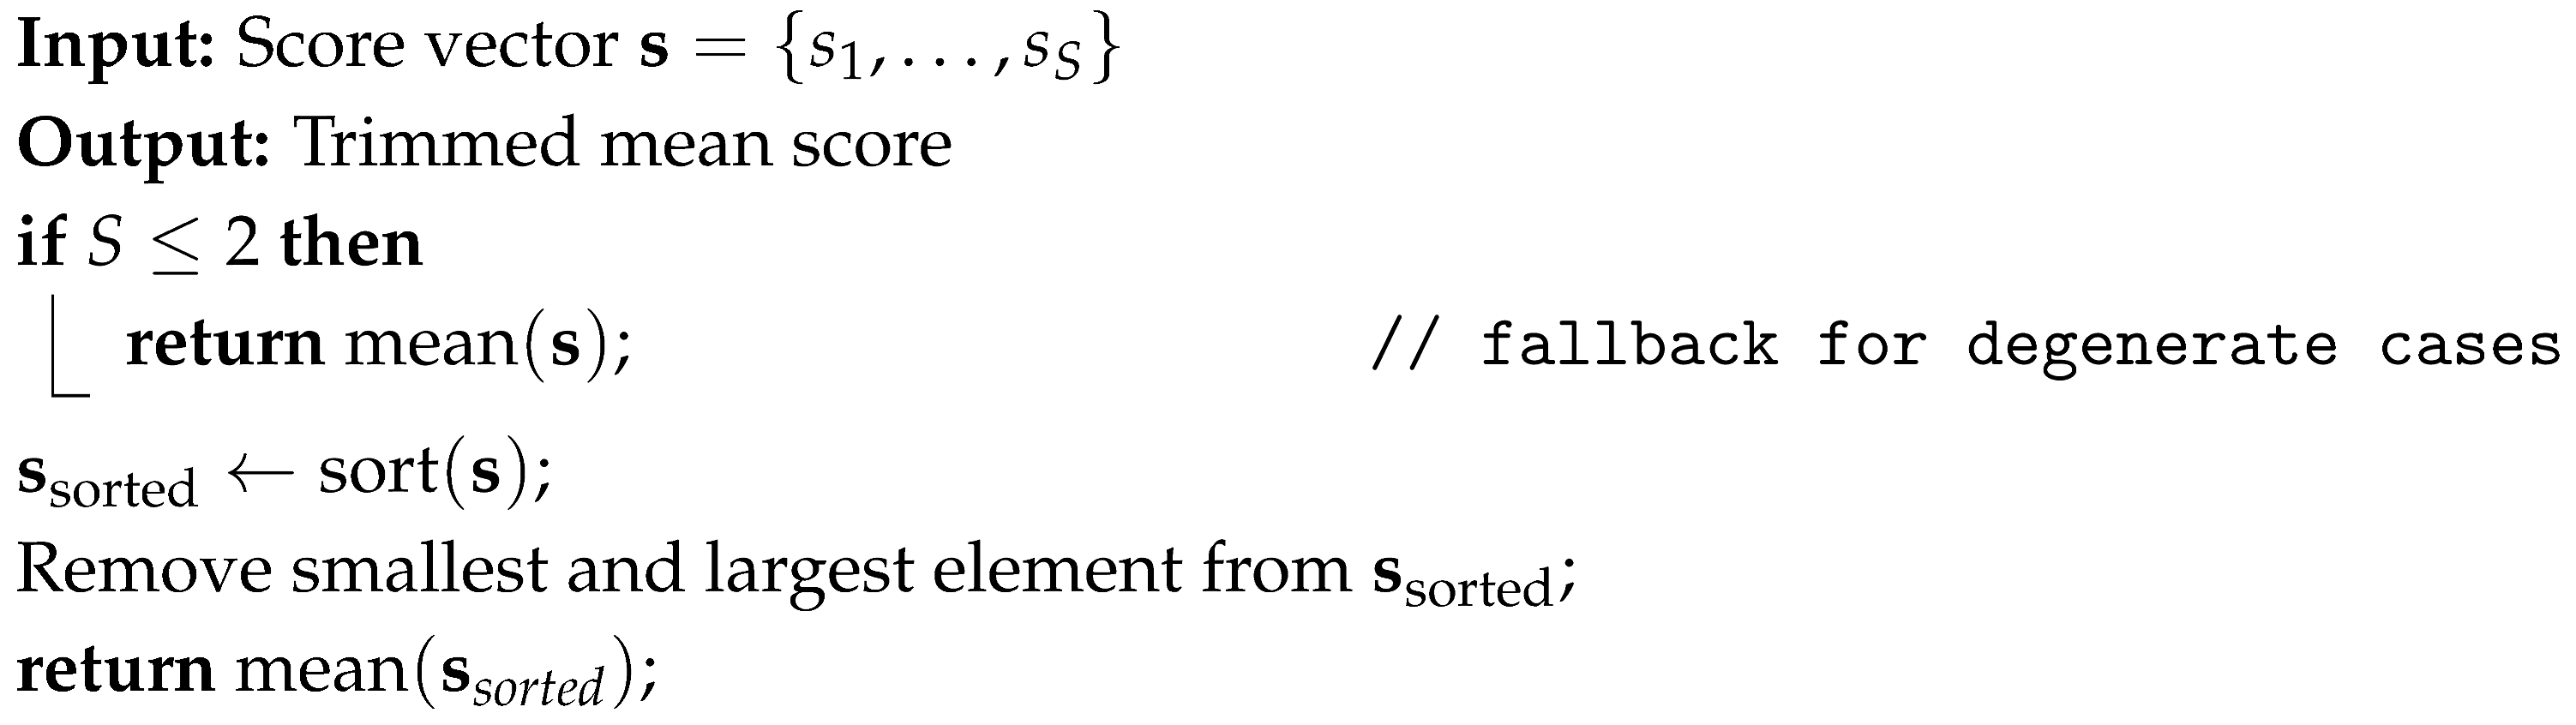
| Algorithm 2: Trimmed mean aggregation across seeds |
 |
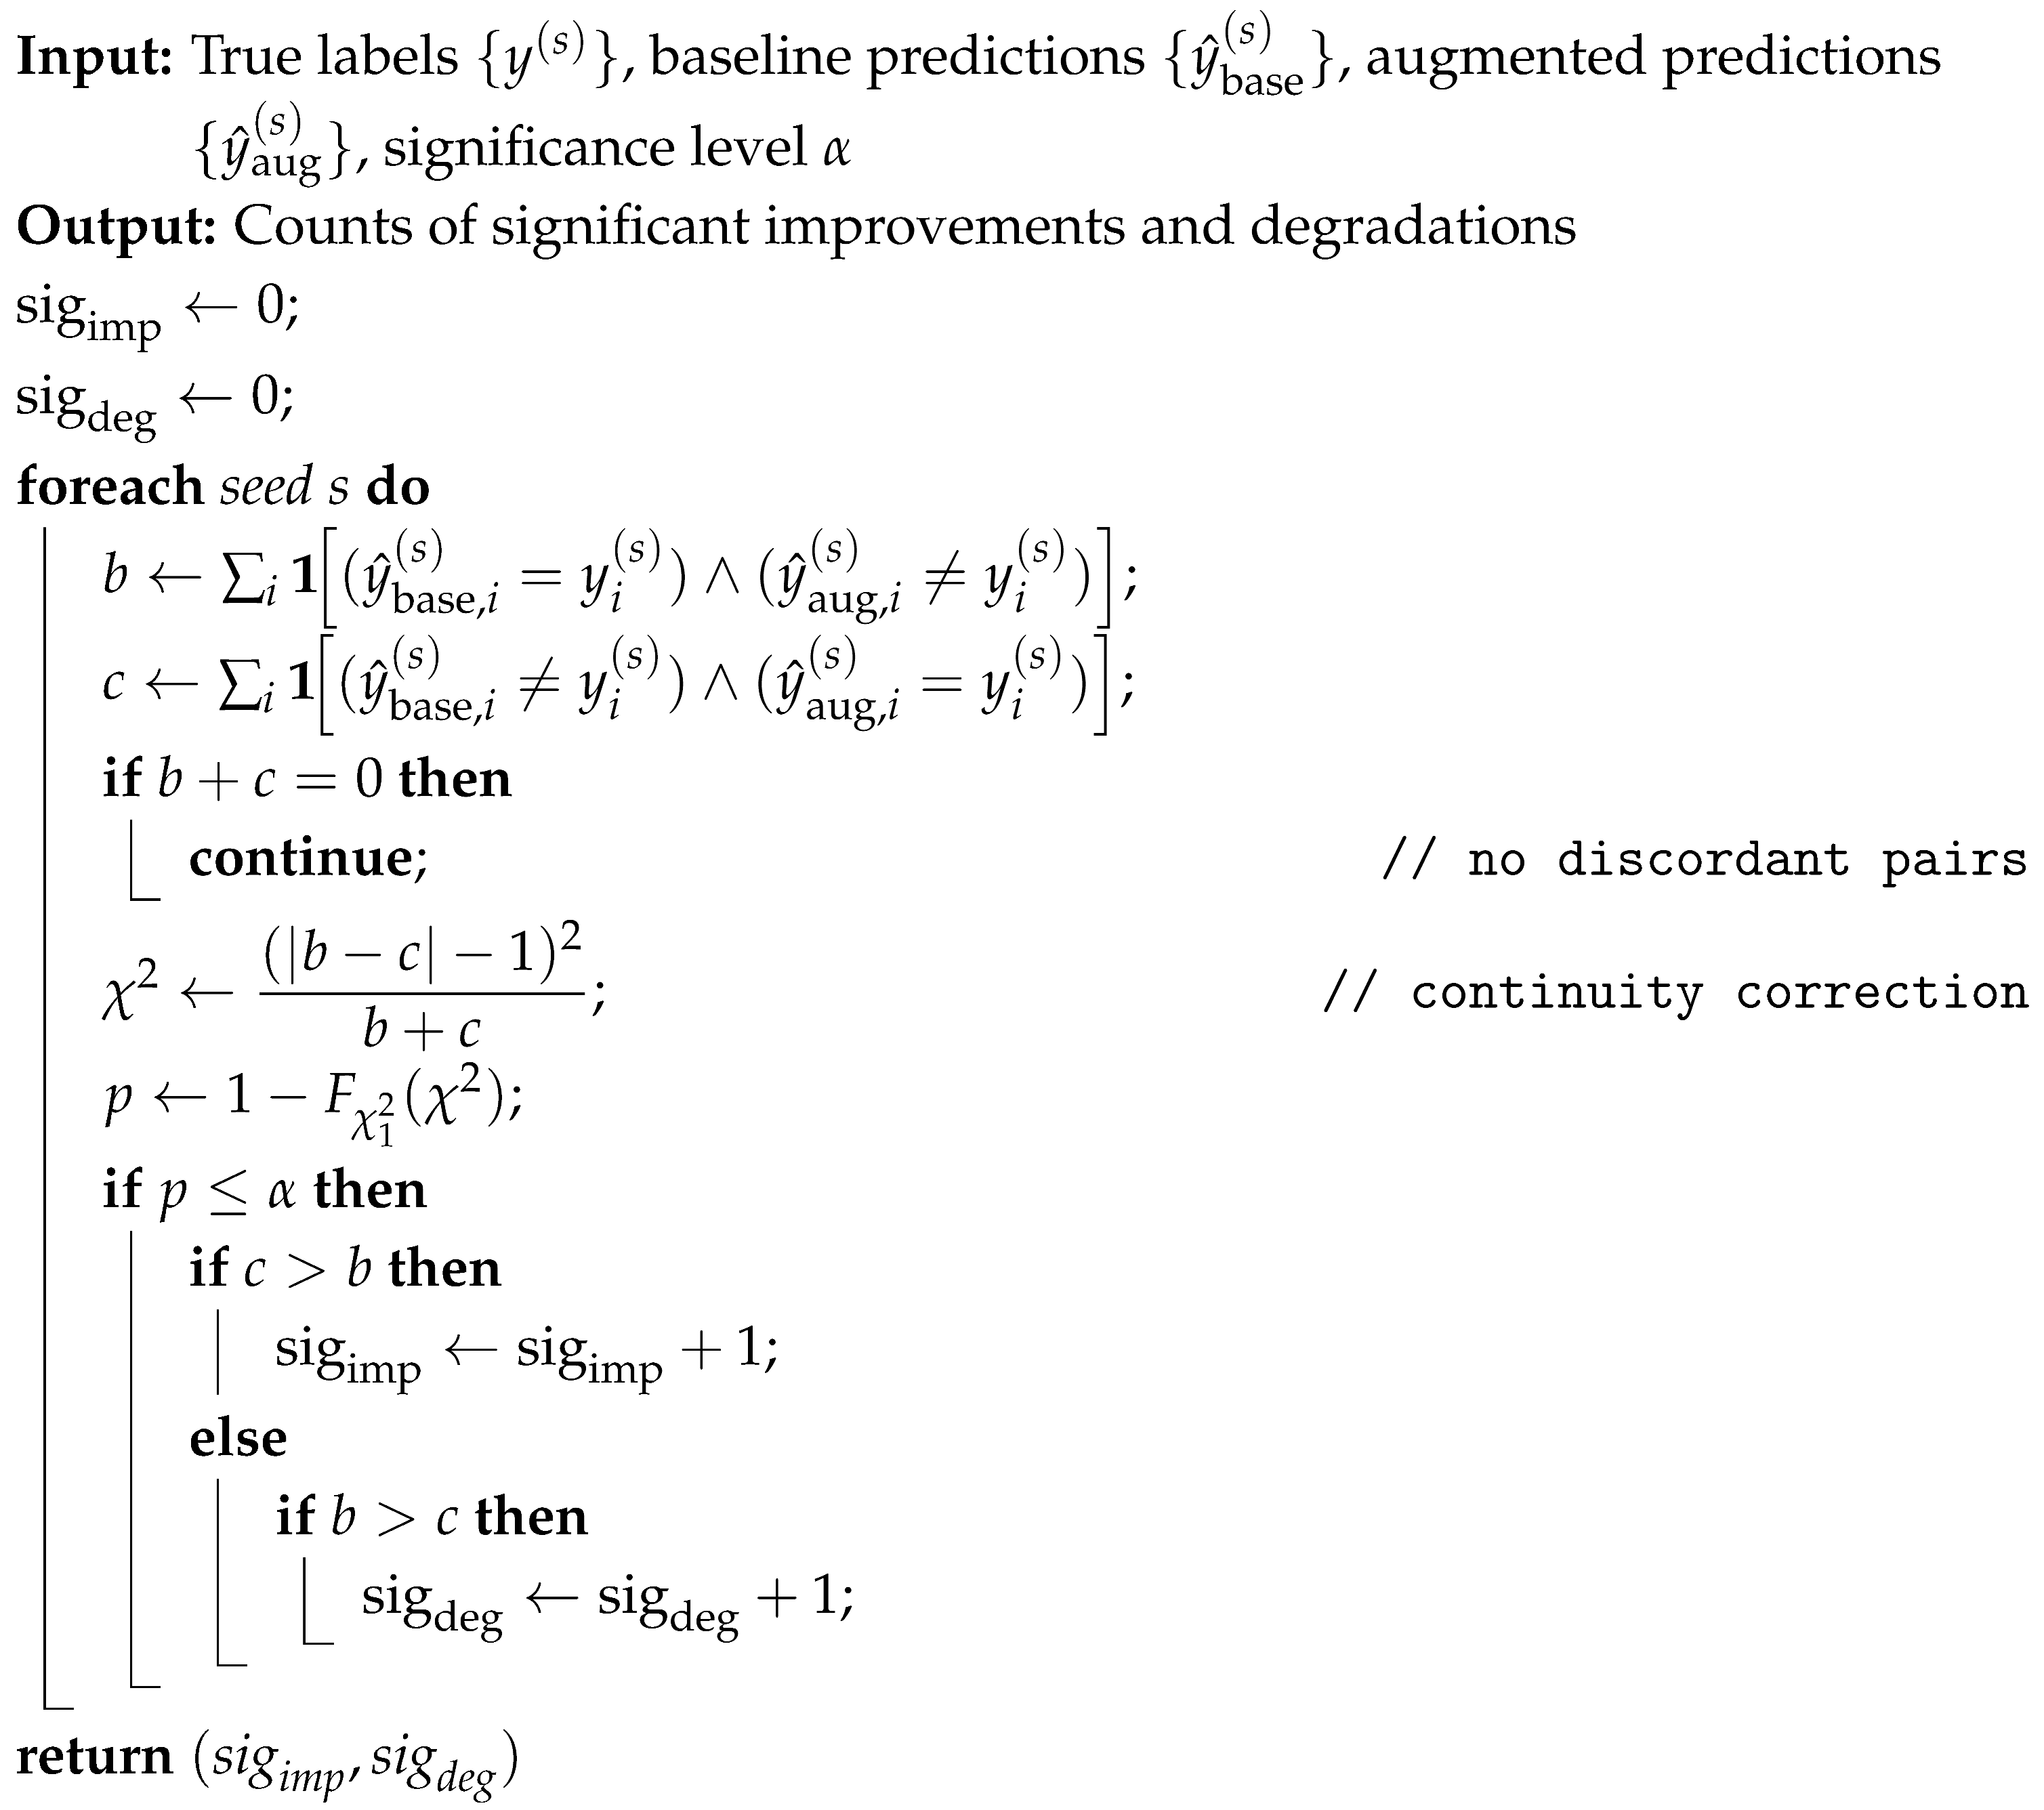
| Algorithm 3: Seed-wise aggregation of McNemar test results |
 |
3. Methodology: Evaluation Method for Graph Signal Analysis
We propose a reproducible and configurable evaluation method (SEM), designed to assess the statistical impact of graph-derived signals when integrated into classical tabular machine learning pipelines, with a design that supports reuse across transactional and non-transactional graph learning tasks. SEM is task-agnostic and enables systematic comparisons between baseline models and models augmented with graph-derived signals.
The evaluation method supports the flexible selection of subsets of graph-derived signals drawn from a predefined taxonomy of graph information types. In our experiments, we consider a diverse set of graph-derived signals, including features and embeddings spanning centrality, cohesion, community, proximity, spectral properties, structural role information, and neighborhood-based information (see Section 5).
To ensure statistically reliable conclusions, SEM explicitly accounts for randomness in both data splitting and model training. Multiple random seeds are applied consistently across baseline and graph-augmented configurations, enabling run-level comparisons. The evaluation method further supports experiments on multiple graph variants derived from the same underlying entities, such as perturbed graphs obtained through edge removal, allowing robustness analyses under structural changes.
In addition to standard multi-seed evaluation, SEM explicitly supports robustness analysis under controlled structural perturbations of the input graph. In this work, robustness is assessed by systematically removing a predefined fraction of edges prior to graph signal generation, allowing the sensitivity of different graph signal categories to degraded graph structure to be analyzed under otherwise identical experimental conditions.
For fair model comparison, each classifier underwent automated hyperparameter optimization based on Bayesian optimization using the Tree-structured Parzen Estimator [10]. Optimization was performed using cross-entropy loss, which is well suited for highly imbalanced classification settings. Depending on the classifier, additional mechanisms such as class weighting, resampling strategies, feature normalization, embedding-specific dimensionality reduction, architectural choices (where applicable), and model-specific regularization were considered during optimization. Importantly, all preprocessing steps were optimized in a model-aware manner and fitted exclusively on the training data to avoid information leakage.
All optimized models were evaluated on identical training–validation–test splits, ensuring comparability across feature configurations. Detailed results are stored in a structured format that enables automated downstream analysis. In particular, the evaluation method supports the following:
- (i)
- Aggregation of performance metrics across random seeds using trimmed aggregation to reduce the influence of outlier runs;
- (ii)
- Stability analysis via standard deviation estimates;
- (iii)
- Statistical hypothesis testing to assess whether observed performance differences between baseline and graph-augmented models are statistically significant;
- (iv)
- Computation and storage of model-specific feature importance scores for post hoc analysis.
Graph-derived signals were concatenated with task-specific base features, resulting in an augmented tabular representation. This unified representation can then be processed with standard classifiers.
Trimmed Performance Aggregation: To reduce the influence of outlier runs and obtain robust performance estimates, we aggregate -scores (harmonic mean of precision and recall) across random seeds using a symmetric trimmed mean, discarding the highest and lowest seed-level scores. Trimmed means are robust estimators of central tendency that are less sensitive to outliers than the arithmetic mean [11].
Specifically, for each fixed classifier–signal configuration , we collect -scores per random seed for both the baseline (transaction-only) model and corresponding graph-augmented model, where each seed corresponds to one complete experimental run with identical data split and training conditions. In total, the evaluation considers distinct graph signals. All analyses excluded Naive Bayes, as explained in Section 8.1.
Let denote the -score obtained for classifier c with graph signal g under random seed s. Analogously, let denote the -score of the corresponding classifier-specific baseline model under the same seed.
To obtain robust performance estimates, we apply a trimmed mean over the S seed-level scores by removing the minimum and maximum values and averaging the remaining runs. Formally, the trimmed mean -score for a given classifier–signal configuration is defined as
where denotes the index set of the remaining runs after excluding the lowest and highest -scores across seeds. The trimmed baseline performance is computed analogously. The performance gain induced by graph signal g for classifier c is then computed as the difference between the trimmed mean performances:
Positive values of indicate an improvement over the transaction-only baseline, while negative values indicate degraded performance. This aggregation strategy yields a robust central tendency estimate that mitigates the influence of extreme seed-dependent variations while preserving paired comparability between baseline and graph-augmented models. All reported -score averages and performance differences in Section 8 and the Appendix B, Appendix C, and Appendix E were computed using this trimmed aggregation across random seeds.
Statistical Significance Testing: To assess whether observed performance differences are statistically significant, we apply McNemar’s test to paired predictions obtained from baseline (transaction-only) and graph-augmented models evaluated on identical test splits. Statistical significance is assessed at the prediction level, while performance differences are reported in terms of aggregated -scores, as described in the previous section.
For a given classifier c, graph signal g, and random seed s, the test compares discordant prediction outcomes between the baseline and corresponding graph-augmented model. Let b denote the number of instances where the baseline prediction is correct and the graph-augmented prediction is incorrect, and let c denote the number of instances where the baseline prediction is incorrect and the graph-augmented prediction is correct. The McNemar test statistic with continuity correction is given by
Differences with are considered statistically significant. McNemar tests are used descriptively to assess aggregated consistency and direction of effects across runs rather than as independent discovery claims. The test is applied separately for each of the random seeds, where each seed corresponds to one complete experimental run with a fixed data split and model initialization. This ensures that statistical comparisons are fully paired at the prediction level and isolate the effect of incorporating graph-derived signals.
Rather than aggregating p-values across seeds, we summarize statistical evidence across runs by counting, for each classifier–signal combination, how often a graph-augmented model yields a statistically significant improvement versus a statistically significant deterioration relative to the baseline across the 10 seeds. Specifically, for each pair, we record the number of seeds in which the McNemar test indicates a significant improvement , and the number of seeds, a significant deterioration . These counts form the basis for the aggregated significance analyses and visualizations reported in Section 8. This aggregation strategy preserves seed-level statistical validity while providing an interpretable summary of the consistency and directionality of statistically significant effects across independent experimental runs.
Signal Concatenation and Combined Evaluation: The evaluation method supports not only the evaluation of individual graph signals but also arbitrary combinations of signals through concatenation. For any subset of graph signals drawn from the predefined taxonomy, we define the concatenated feature vector for node v as
where denotes the original transaction features; , the feature vector of graph signal g; and ∥, the concatenation operator. This design enables the evaluation of the following:
- Individual graph signals ();
- Category-level combinations (e.g., all centrality-based signals);
- Larger multi-signal combinations spanning multiple categories.
All evaluation metrics and statistical tests described above were applied identically to both individual and concatenated signal configurations, ensuring consistent comparison across granularity levels. In Section 8, we report the results for both individual graph signals and category-level concatenations; for example, ‘Centrality’ denotes the concatenation of all five centrality-based indicators listed in Table 1.
Table 1.
Representative graph signals categorized by taxonomic family with corresponding references.
4. Related Work
4.1. Classical Graph Indicators
Classical graph indicators have long been used as hand-crafted features to characterize node importance and local connectivity patterns in complex networks. Common examples include degree-based measures, centrality metrics such as PageRank and betweenness centrality, as well as clustering coefficients capturing local transitivity. These features provide interpretable summaries of node-level structures and have been widely applied in graph-based classification and fraud detection settings (see, e.g., Network Science [31]).
Community detection methods extend this perspective by capturing mesoscopic graph structure through partitioning nodes into densely connected groups. Algorithms such as the Louvain method [19], Infomap [21], and the Leiden algorithm [20] have been shown to produce stable and high-quality community assignments and are frequently used to derive node-level community features in large transaction networks.
4.2. Proximity-Based Node Embedding Methods
Unsupervised node embedding methods aim to learn continuous vector representations that preserve graph proximity and local neighborhood relationships. Random-walk-based approaches such as DeepWalk [22] and node2vec [23] generate node sequences via truncated random walks and learn embeddings by modeling node co-occurrence. These methods represent a widely adopted class of unsupervised embedding techniques for learning node representations from the graph.
4.3. Structural and Role-Oriented Embedding Methods
Beyond proximity preservation, a class of approaches explicitly focuses on capturing structural similarity or node roles, independent of local neighborhoods. These methods aim to group nodes with similar structural functions rather than relying on direct neighborhood overlap.
These approaches primarily differ in how structural similarity is operationalized and encoded through their algorithmic design choices. Representative examples include GraphWave [26], which leverages spectral graph wavelets to encode structural signatures across multiple diffusion scales, as well as role-based embedding methods such as role2vec [27] and ffstruc2vec [25], which model structural identity by capturing similarities in node roles.
4.4. Spectral Graph Embeddings
Spectral embedding techniques derive node representations from eigenvectors of the graph Laplacian, providing a principled global view of graph structure. By projecting nodes into a low-dimensional space spanned by non-trivial eigenvectors, spectral methods capture connectivity patterns beyond immediate neighborhoods. While computationally demanding for large graphs, spectral embeddings remain a foundational approach in graph representation learning (e.g., Spectral Graph Theory [24]).
4.5. Graph Neural Networks and Graph Contrastive Learning
Neighborhood-based aggregation is commonly realized through Graph Neural Networks (GNNs), which iteratively propagate and aggregate information from local neighborhoods to learn node representations. Canonical instances include Graph Convolutional Networks (GCNs), which employ normalized linear aggregation of neighboring features [28], and Graph Attention Networks (GATs), which extend this paradigm by learning adaptive, attention-based weighting schemes over neighbors [29]. These architectures have demonstrated strong performance across a wide range of node classification tasks.
More recently, Graph Contrastive Learning (GCL) has emerged as a self-supervised representation learning paradigm that aims to learn robust node embeddings by contrasting different augmented views of graph data. Representative approaches, such as Bootstrap Graph Representation Learning (BGRL) [30], a bootstrap-based contrastive method that avoids explicit negative samples, have shown promising results in downstream tasks.
4.6. Graph-Augmented Tabular Learning and Robustness
Recent work has begun to consider robustness and deployment aspects of machine learning systems in the presence of imperfect data, where dataset quality plays a critical role. Surveys on dataset quality examine issues such as noise, missing data, and lifecycle inconsistencies, and discuss evaluation and quality assessment frameworks [32].
At the same time, classical tree-based models remain highly competitive on tabular data and often outperform deep neural networks in practical scenarios [4]. This has reinforced the importance of developing feature representations that can be effectively utilized by tabular learners. Consistent observations are reported in domain-specific surveys on blockchain fraud detection, where tree-based methods such as XGBoost frequently achieve strong performance [33]. Together, these findings motivate approaches that integrate graph-derived information into tabular models as features rather than relying solely on end-to-end graph neural architectures. Related work has also explored incorporating relational inductive biases into tabular prediction; for example, TabGSL learns graph structures directly from tabular data to capture instance and feature relationships [34].
Graph-based representations have also been studied under imperfect data conditions. Imran et al. [35] compare tabular and graph-based representations in the presence of noise and missing values, suggesting that relational information can improve robustness in specific settings.
Our SEM extends these lines of work by moving from model-level comparisons to a taxonomy-driven, signal-level evaluation. Instead of focusing on a single modeling paradigm or data condition, we systematically analyze multiple categories of graph-derived signals under controlled structural variations. In addition, SEM provides a reproducible framework integrating multi-seed experimentation, statistical significance testing, and robustness analyses, enabling evidence-based selection of graph-derived signals for supervised learning tasks.
Related surveys in application domains such as healthcare note that, although graph-based methods can improve predictive performance, their results are often difficult to interpret and to compare systematically across studies [36]. This observation points to a broader need for evaluation frameworks that support interpretable and structured analysis of graph-derived information. SEM contributes to this need by enabling taxonomy-driven interpretation, allowing results to be analyzed at the level of graph signal categories rather than only at the level of end-to-end models.
5. Taxonomy of Graph Signals for Tabular Machine Learning
Graph-structured data contain rich relational information that can significantly enhance predictive models when integrated into classical tabular machine learning pipelines. As discussed in the previous section, such relational dependencies motivate the use of graph-derived signals alongside traditional tabular features [3]. However, the space of potential graph signals is vast and heterogeneous, ranging from simple local statistics to complex learned embeddings. In this work, we use the term graph signal to denote any quantitative representation derived from the graph structure that can be associated with nodes and integrated into downstream tabular learning models, including hand-crafted indicators, unsupervised embeddings, and learned neighborhood-based representations. Without a structured conceptual basis for selecting and evaluating these signals, practitioners face a signal selection problem, as it is often unclear which types of graph-derived signals are most relevant for a given downstream task.
In recent years, a wide range of graph-based methods have been proposed, capturing different aspects of network structure. Rather than treating these methods as isolated techniques, it is useful to organize them according to the type of information they extract from the graph. This section provides a concise, non-exhaustive taxonomy of graph-related information that can be incorporated into tabular machine learning models, serving as a conceptual foundation for the feature selection used in this study.
The taxonomy presented in this section builds on well-established concepts and recent work in graph representation learning and network analysis [20,21,22,23,24,25,26,27,28,29,30,31]. It consolidates commonly used categories of graph-derived signals and serves as a structured conceptual basis for the comparative evaluation conducted in this study.
We distinguish six broad categories of graph-based information, reflecting different structural perspectives on the same underlying graph: centrality, cohesion, community structure, proximity, spectral properties, and structural role information. These categories are conceptually distinct but complementary, and together, they cover a wide spectrum of graph signals commonly used in practice. Neighborhood-based features, as exploited by message-passing architectures such as GNNs, can be viewed as an aggregation mechanism that combines multiple categories rather than as a separate information type.
5.1. Centrality-Based Indicators
Centrality-based indicators quantify the importance or influence of nodes within the network. Typical examples include degree-based measures, PageRank, betweenness, closeness, or eigenvector centrality. Such indicators capture how prominently a node is positioned within the overall connectivity structure and often provide strong baseline signals for downstream classification tasks.
5.2. Cohesion-Related Indicators
Cohesion-related indicators describe the local interconnectedness of a node’s neighborhood. Measures such as clustering coefficients, core numbers, or triangle counts capture the extent to which a node participates in tightly connected substructures. These signals are particularly relevant in domains where meaningful differences in local connectivity patterns reflect distinct behavioral or structural patterns in the graph.
5.3. Community-Based Indicators
Community-related indicators focus on meso-scale structures in the graph. Community detection methods assign nodes to groups of densely connected subgraphs, providing coarse-grained structural context. Community membership indicators can serve as high-level features that summarize a node’s structural environment beyond immediate neighborhoods.
5.4. Proximity-Based Embeddings
Proximity-based embeddings encode relative closeness between nodes in a latent space, reflecting similarity induced by graph connectivity. Techniques such as DeepWalk, node2vec, or related approaches can be used to derive such proximity-based representations such that nodes with similar connectivity patterns or overlapping neighborhoods are placed close together in the representation space. These embeddings are effective at capturing distance-based similarity and local context.
5.5. Spectral Graph Embeddings
Spectral information derives from the eigenstructure of graph-related matrices, such as the adjacency matrix or the graph Laplacian. Spectral features encode global connectivity patterns and can capture structural regularities that are not easily observable through local measures alone.
5.6. Structural Role Embeddings
Structural role information aims to characterize nodes according to their position within the global topology of the graph, independent of direct proximity. Structural embedding methods focus on identifying nodes that occupy similar roles, such as hubs, bridges, or peripheral nodes, even if they are located far apart, as exemplified by approaches such as struc2vec, GraphWave, role2vec, and ffstruc2vec.
5.7. Graph Neural Networks and Graph Contrastive Learning
GNNs and recent GCL approaches constitute a powerful class of learning mechanisms that operate on graph-structured data by aggregating and transforming information from node neighborhoods. In the proposed taxonomy, these methods are viewed as integrative representation learning paradigms rather than as individual graph signal types. While these architectures are inherently capable of end-to-end classification, we employ them within our evaluation method specifically as representation learners to derive high-dimensional node embeddings, which serve as signals for the subsequent tabular analysis.
5.8. Selection of Graph Signals and Taxonomy Role
In this work, we selected a set of 24 representative graph-derived signals, with multiple representatives drawn from each category of the proposed taxonomy (see Table 1). The selection was guided by considerations of taxonomy coverage, conceptual diversity within categories, methodological maturity reflected in prior literature, and computational feasibility on large-scale graphs.
To ensure that the evaluated signals correspond to well-established and conceptually fundamental families of graph-derived information, we prioritized methods that have been repeatedly studied and validated in the literature on network analysis and graph representation learning. For classical graph-derived signals such as centrality, cohesion, community, proximity, spectral, and structural role measures, we selected methods that are widely regarded as canonical representatives of their respective families in network science and graph mining. These signals constitute standard analytical tools for characterizing local, mesoscale, and global structural properties of graphs and are routinely used as reference points in empirical network analysis [31]. Their inclusion ensures coverage of well-established structural descriptors across multiple levels of graph organization. The evaluated set consists predominantly of methods that are widely used as reference points in the literature.
Overviews and empirical studies in graph representation learning and GNNs [37,38] reflect the continued relevance of these signal families. This literature grounding helps ensure that the evaluated signals represent stable and well-understood families of graph-derived information rather than transient or highly specialized techniques.
For the GNN-based category, we selected GCNs as a canonical supervised baseline and GATs as a widely used extension incorporating attention mechanisms. Both architectures are standard reference models in GNN research and serve as representative supervised message-passing approaches. In addition, we included GCL in the form of BGRL [30] as a representative self-supervised approach. BGRL is a well-established instance of bootstrap-based graph self-supervised learning and serves as a conceptually distinct representative of the GCL family within our taxonomy-driven evaluation. As with other categories, the goal was not to identify the single best-performing GCL method, but to include a representative method from this signal family [39,40].
This study does not aim to provide an exhaustive benchmark of all existing graph-derived signals. Instead, the focus lies on category-level insights, where individual signals serve as representatives of broader information types. The taxonomy-driven design therefore supports conclusions at the level of information categories rather than specific algorithms and provides the conceptual basis for interpreting the experimental results in the following sections.
In our experimental setup, GNN- and GCL-based representations were treated consistently with other graph signals by extracting fixed node embeddings from the final encoder layer. GCN and GAT encoders were optimized in a supervised manner on the node classification task, whereas GCL was trained using a self-supervised objective. To ensure a fair evaluation and prevent data leakage, all encoder training was strictly confined to the respective training splits. All GNN-based representations were generated using a two-stage procedure consisting of encoder training followed by frozen embedding extraction. This maintains a clear separation between representation learning and downstream classification and allows comparisons between supervised, self-supervised, and purely structural graph signals under a consistent evaluation method.
The impact of adding or replacing signals within a category is inherently task-dependent, as different prediction tasks may rely on different graph patterns for label determination. However, signals within the same category are designed to capture related types of structural information. Replacing a signal with another method from the same category would therefore typically preserve the general pattern type being modeled, even if quantitative results vary. Consequently, the main conclusions of this study are intended to be interpreted at the level of signal categories rather than individual methods.
Graph signals are computed using fixed, standard parameter settings. This study focuses on the comparative evaluation of different types of graph-derived signals.
6. Case Study: Fraud Detection on Elliptic Bitcoin Transaction Graph
The proposed taxonomy and graph signal analysis were evaluated in the context of transaction fraud detection using the Elliptic Bitcoin Dataset, a widely used benchmark for illicit activity detection in cryptocurrency transaction networks [9]. The Elliptic dataset represents a temporal directed transaction graph, where nodes correspond to Bitcoin transactions and edges represent fund flows between transactions. Each node is associated with a timestamped feature vector and a binary label indicating licit or illicit activity, with a substantial portion of nodes remaining unlabeled. The graph structure introduces strong relational dependencies between samples, violating the i.i.d. assumption underlying classical tabular learning.
In addition to these relational dependencies, it is worth noting that time-series features capture temporal dynamics of individual transactions, but they primarily model entities in isolation over time. In contrast, graph-derived signals explicitly encode interactions between transactions, such as shared neighbors or connectivity patterns. Since illicit activity often propagates through networks of interacting entities, relational information provides complementary insights that cannot be captured by purely temporal modeling.
Concretely, the dataset contains 203,769 nodes and 234,355 directed edges, distributed across 49 temporal snapshots. Among the labeled transactions, the class distribution is highly imbalanced, with illicit transactions accounting for roughly 2–3% of labeled nodes, reflecting realistic fraud detection conditions. These characteristics make the Elliptic dataset a challenging and representative benchmark for evaluating graph-derived signals under severe class imbalance and structural dependency.
Rather than focusing on a single modeling paradigm, this study investigates how explicitly extracted graph-derived signals contribute to predictive performance when integrated into classical tabular machine learning pipelines. Instead of aiming to optimize end-to-end performance on the Elliptic benchmark or to propose a task-specific fraud detection model, this case study uses the dataset as a controlled experimental environment to analyze the contribution of explicitly extracted graph-derived signals. The focus is on assessing whether the inclusion of graph-derived signals leads to statistically significant and reproducible performance improvements over a transaction-only baseline, and on understanding how these effects vary across different graph signal categories. By conducting the evaluation on a well-established and widely used benchmark, the results are intended to provide general insights into the utility of different graph signal types, rather than benchmark-specific performance claims.
This experimental framing enables performance differences to be analyzed both across graph signal categories defined by the proposed taxonomy and at a more fine-grained level within individual categories, facilitating a structured interpretation of which types of graph-derived signals—such as centrality, proximity, or structural role information—are most beneficial for fraud detection under realistic conditions.
7. Experimental Setup
This section describes the concrete experimental setup used to instantiate the proposed evaluation method (SEM) on the Elliptic fraud detection benchmark. We detail the considered classifiers, data splits, evaluation metrics, hyperparameter optimization strategy, robustness settings, and statistical analysis procedures used to assess the significance of observed performance differences, ensuring full reproducibility and transparency.
7.1. Prediction Task and Baseline
The prediction task is binary node classification, where each transaction is classified as licit or illicit based on available transaction-level features. As a baseline, we consider classical tabular machine learning models trained exclusively on the original transaction features provided by the dataset, without incorporating any graph-derived signals.
We exclude the native Elliptic graph features, as they are tailored to this specific benchmark and not intended as general-purpose graph descriptors. Instead, we focus on general-purpose graph-derived signals to enable a controlled and comparable evaluation across methods and settings.
Graph-augmented models extend this baseline by concatenating graph-derived signals with the original transaction features, resulting in an augmented tabular representation processed by the same classifiers. This design enables controlled, paired comparisons between baseline and graph-augmented models.
7.2. Classifiers
To ensure broad coverage of commonly used tabular learning paradigms, we evaluated a diverse set of classifiers with different inductive biases. Specifically, the experimental setup included linear models, probabilistic classifiers, kernel-based methods, and tree-based ensemble models.
Concretely, we considered Logistic Regression (LR), Naive Bayes (NB), Support Vector Classifiers (SVCs) with both linear and radial basis function (RBF) kernels, Multilayer Perceptrons (MLPs), Random Forests (RFs), and XGBoost (XGB) [41]. This selection covers a wide range of modeling assumptions, including linear decision boundaries, probabilistic independence assumptions, margin-based classification, and non-linear ensemble learning.
All classifiers were trained and evaluated under identical experimental conditions to ensure fair comparison. Each model was optimized independently using automated hyperparameter optimization based on Bayesian optimization with a fixed budget of 50 trials per configuration. No classifier-specific tuning or manual intervention was performed outside this unified optimization framework.
7.3. Data Splits and Random Seeds
We adopted a transductive evaluation setting following standard protocols in graph machine learning [28,42], where the full graph structure is assumed to be available during training, while labels are observed only for the respective training nodes. This design choice is particularly motivated by the characteristics of the Elliptic dataset, which is known to exhibit pronounced temporal non-stationarities and regime shifts. Prior analyses of the dataset report substantial structural and label distribution changes over time, including a marked transition around later time steps [9]. In such settings, strictly time-based splits can strongly couple predictive performance to temporal concept drift rather than to the utility of specific feature representations. Our primary objective is to isolate and compare the contribution of different categories of graph-derived signals under controlled and comparable conditions. Stratified random splits therefore enable paired comparisons between transaction-only and graph-augmented models while maintaining stable class proportions under severe imbalance and ensuring that performance differences can be attributed to the signals themselves rather than to temporal regime changes. At the same time, we acknowledge the explicitly temporal nature of the Elliptic dataset and view forward-in-time generalization as an important complementary evaluation scenario. However, analyzing temporal generalization under severe concept drift constitutes a distinct research question that is orthogonal to the taxonomy-driven signal comparison pursued in this work.
To account for randomness in both data splitting and model training, we performed all experiments across multiple random seeds. This multi-seed evaluation within SEM enables run-level paired comparisons between baseline and graph-augmented models, allowing variability due to randomness to be explicitly quantified rather than implicitly averaged. Final performance summaries across seeds are reported using trimmed mean aggregation as described in Section 3. For each seed, the dataset was split into disjoint training, validation, and test sets using a stratified random split with a 60–20–20 ratio, and identical split indices were applied across all graph signal configurations.
Hyperparameter optimization was performed once for each classifier and graph signal configuration using a fixed random seed (seed = 42) for data splitting and model initialization to ensure reproducibility of the search process. The resulting optimal hyperparameters were then fixed and used consistently across all corresponding experiments, which were evaluated over multiple random seeds (seeds 1–10) to assess variability and statistical robustness.
7.4. Hyperparameter Optimization
Hyperparameter optimization was performed separately for each classifier and graph signal configuration using Bayesian optimization with a Tree-structured Parzen Estimator [10], as implemented in the hyperopt framework [6]. The optimization objective was cross-entropy loss, evaluated on the validation set. Cross-entropy (log loss) is used as a smooth surrogate objective that enables stable probabilistic optimization, while final model comparison relies on threshold-tuned -scores appropriate for the imbalanced fraud detection setting. In line with the general framework described in Section 3, classifier-specific mechanisms such as class weighting, oversampling strategies, feature normalization, and embedding-specific dimensionality reduction were included in the optimization space where applicable.
Each optimization run had a fixed number of 50 trials. The best-performing hyperparameter configuration per classifier and graph signal configuration was selected and subsequently reused across all random seeds to ensure consistent evaluation and avoid leakage between optimization and testing. To ensure full reproducibility and transparency, the complete hyperparameter search spaces for all classifiers and the fixed parameters for all graph signal generators are provided in Supplementary Material Sections S1 and S2, respectively.
7.5. Evaluation Metrics
Model performance was primarily evaluated using the -score, which balances precision and recall and is widely used for highly imbalanced binary classification, enabling direct comparison across classifiers and graph signal configurations.
Since the -score is threshold-dependent, the decision threshold is not fixed at 0.5. Instead, it is selected on the validation set to maximize the -score and then applied unchanged to the corresponding test set. This ensures alignment between model selection and the primary evaluation metric while avoiding test leakage.
We chose the -score as the primary metric because fraud detection requires decisions at a concrete operating threshold. Metrics such as the area under the receiver operating characteristic curve (ROC-AUC) or the area under the precision–recall curve (PR-AUC) summarize ranking performance across thresholds, whereas the -score evaluates performance at the selected operating point.
To assess whether observed performance differences between baseline and graph-augmented models are statistically significant, we applied McNemar’s test [43,44] to paired predictions on identical test splits, considering results with as statistically significant. Performance was aggregated across random seeds using trimmed aggregation to reduce the influence of outlier runs.
7.6. Robustness Experiments Under Graph Perturbations
Edge removal can be interpreted as a controlled structural perturbation that probes the sensitivity of graph-based methods to changes in connectivity. Perturbation-based analyses are a well-established approach in studying graph vulnerability and robustness [45]. By selectively altering the topology of the graph while leaving node attributes unchanged, this setup allows us to isolate how strongly different graph-derived signals depend on the underlying connectivity structure. If a signal encodes task-relevant structural information, perturbing the graph is expected to affect its utility; conversely, signals that rely less on specific connectivity patterns may exhibit greater stability. In this sense, edge removal acts as a diagnostic tool for structural sensitivity.
To assess the robustness of graph-derived signals to structural changes, we performed additional experiments on perturbed versions of the transaction graph. Perturbations were introduced by randomly removing a fixed proportion of edges while preserving the original node set. Specifically, edge removal rates of 25% and 50% were considered to simulate increasing levels of structural degradation.
Graph-derived signals were recomputed for each perturbed graph variant and evaluated using the same experimental configuration as for the unperturbed graph. This allows the stability of observed performance gains to be analyzed under controlled graph structure degradation.
7.7. Implementation Details and Reproducibility
All experiments were implemented using a unified experimental pipeline that ensures consistent preprocessing, model training, and evaluation across configurations. All random seeds, hyperparameter search spaces, and evaluation scripts were fixed and logged to enable full reproducibility.
All code and configuration files required to reproduce the experiments reported in this paper are publicly available, including data preprocessing, graph signal generation, model training, evaluation scripts, and robustness experiments under graph perturbations. The complete experimental setup, including configuration files and result logs, was designed to support automated downstream analysis and statistical evaluation. The experimental pipeline was implemented in Python, leveraging standard machine learning libraries and graph processing frameworks such as scikit-learn, XGBoost [41], PyTorch, the Deep Graph Library [46], and hyperopt [6] for automated hyperparameter optimization. The exact software environments and dependency versions are provided in the public repository together with the source code.
8. Experimental Results
8.1. Evaluation Overview and Reading Guide
While the empirical evaluation was conducted on a single large-scale fraud detection benchmark, the objective of this section is not to maximize task-specific performance scores, but to systematically investigate the relative utility, statistical reliability, and stability of different graph-derived signal categories under a unified and rigorous evaluation method (SEM).
This section reports the experimental results obtained by augmenting transaction-based fraud detection models with graph-derived signals. We first provide an aggregated comparison between transaction-only baselines and graph-augmented models across all evaluated classifiers and graph signal configurations, using identical data splits, random seeds, and hyperparameters obtained from a fixed optimization method to enable fully paired comparisons. This design enables fully paired, run-level comparisons between baseline and graph-augmented models.
Performance was measured using the -score, reported as the trimmed mean and standard deviation over multiple random seeds. All results follow the evaluation method described in Section 7, with the hyperparameters fixed based on a configuration-specific optimization procedure using seed 42, and performance aggregated over ten independent runs (seeds 1–10) using trimmed -score statistics. All reported random seeds affect only data splitting and model training, including initialization and optimization stochasticity. Graph-derived signals were computed deterministically for a given graph and are held fixed across all runs.
To assess the robustness and statistical relevance of observed performance differences, we additionally applied paired McNemar significance tests at a significance level of ; we summarize the results across random seeds by counting statistically significant improvements and deteriorations per classifier–signal configuration.
The results are presented at multiple levels of aggregation. We first analyze overall performance trends across graph signal categories, followed by classifier-specific effects, stability across random seeds, and statistical significance patterns. Graph signals are grouped into conceptual categories, namely centrality, cohesion, community, proximity, spectral, and structural, as well as a separate category of GNN-based representations. Category-level results were obtained by explicitly concatenating all individual graph signals within a category, as described in Section 3. In addition, detailed results for all 24 individual graph signals are reported in Appendix B, with corresponding variability statistics provided in Appendix C.
For aggregated performance comparisons across classifiers, we exclude Naive Bayes from classifier-averaged aggregates and report averages over the remaining classifiers. Naive Bayes results are nevertheless shown in all tables for completeness and transparency, allowing readers to inspect the behavior of a classical probabilistic baseline under graph-augmented feature spaces. Due to its conditional independence assumption, Naive Bayes is inherently limited in leveraging correlated and interaction-based feature structures induced by graph-derived signals. This leads to performance behavior on a markedly different scale compared to the other evaluated classifiers, which in turn can bias cross-classifier aggregates. As a result, it is less informative for aggregated comparisons aimed at summarizing trends across classifiers with broadly comparable modeling assumptions. For completeness, classifier-averaged results including Naive Bayes are provided in Supplementary Section S5. These do not alter the overall conclusions of the study.
In the following, Section 8.2 focuses on aggregated performance trends across graph signal categories. Section 8.3 and Section 8.4 analyze classifier-specific effects and stability across random seeds, respectively. A formal statistical significance analysis is provided in Section 8.5, followed by a robustness study under graph perturbations in Section 8.6.
8.2. Overall Performance Impact of Graph Signals
Across all evaluated classifiers included in the aggregated analysis, the integration of graph-derived signals leads to consistent performance improvements over the transaction-only baseline. Figure 2 summarizes the average -score improvements across graph signal categories relative to the transaction-only baseline. Averaged over classifiers and random seeds, most graph signal categories yield positive gains in -score, indicating that relational information captured from the transaction network provides complementary predictive power beyond node-local transaction features. The detailed per-classifier performance across all signal categories is shown in Figure 3 (-scores with standard deviations), revealing consistent improvements for most model–signal combinations. For a fine-grained breakdown of results across all 24 individual graph signals and classifiers, see Appendix B (mean -scores) and Appendix C (standard deviations across seeds).
Figure 2.
Average -score improvements across graph signal categories relative to the transaction-only baseline, aggregated over classifiers and random seeds (trimmed aggregation).
Figure 3.
Per-classifier -scores across graph signal categories. Cell values report mean -scores with standard deviations across random seeds. Bold values highlight the average improvement over the transaction-only (TRX) baseline. Color intensity indicates relative performance differences with respect to the transaction-only (TRX) baseline (green = improvement, red = degradation).
Among all evaluated categories, GNN-derived representations achieve the strongest average performance gains. Notably, GNNs are the only method class in this study that explicitly incorporate feature information from neighboring nodes during representation learning. While GNN-derived representations achieve the strongest average performance, the upper-bound analysis in Supplementary Materials (Figure S1 in Section S3) shows that proximity-based graph signals achieve the highest absolute -score across all evaluated graph signal categories.
Proximity- and community-based signals consistently outperform purely structural or spectral representations. This pattern aligns with the intuition that relational closeness and shared transactional context are particularly informative in fraud detection settings, where illicit activity often propagates through localized neighborhoods. Although proximity- and community-based signals are treated as distinct categories in our taxonomy, both encode aspects of relational closeness at different levels of abstraction. The stronger performance of proximity-based representations suggests that modeling relational proximity in a continuous and fine-grained manner can provide richer information than discrete group assignments in this setting.
Overall, these results show that graph-based augmentation is generally beneficial in this setting, while also highlighting that performance gains are strongly dependent on the type of relational information being incorporated. In particular, representations that explicitly capture relational proximity and neighborhood context tend to yield the most pronounced improvements, whereas more global or purely structural descriptors provide only limited additional benefit. While these average performance gains provide a first indication of the benefits of graph-derived signals, their statistical reliability and robustness are examined in the following sections, including a formal significance analysis in Section 8.5.
8.3. Classifier-Specific Effects
Building on the aggregated category-level trends shown in Figure 2, which summarize average effects across classifiers, we analyze how graph signal effectiveness varies across individual classifiers, as shown in Figure 3, reflecting differences in model capacity and inductive bias.
Before turning to classical classifiers, we briefly discuss the role of GNN-derived representations, which serve as a key source of graph signals in our evaluation. To contextualize the performance of GNN-derived representations, we additionally compare end-to-end GNN models with configurations where fixed node embeddings extracted from the trained GNN encoders are concatenated with transaction-level features and processed with classical tabular classifiers. While end-to-end GNNs achieve strong predictive performance on the Elliptic dataset, the corresponding embedding-based configurations yield higher average -scores when combined with optimized tabular models. This observation suggests that, in the evaluated setting, GNNs primarily serve as effective representation learners, whereas downstream tabular classifiers provide more flexible decision boundaries under severe class imbalance. Importantly, this comparison is intended as an interpretative aid rather than a direct architectural comparison, as both approaches are evaluated under different modeling assumptions.
Tree-based ensemble models, particularly Random Forests and XGBoost, exhibit strong and stable performance gains across most graph signal categories. This behavior is consistent with the ability of tree-based ensembles to handle heterogeneous and partially redundant feature sets, which may facilitate the effective integration of complementary graph-derived signals. These models benefit consistently from additional structural features, with improvements observed across centrality, community, proximity, and GNN-based representations. This observation is consistent with recent findings in tabular machine learning, which show that tree-based ensemble models often outperform deep learning approaches when combined with informative feature representations, due to their robustness to heterogeneous feature scales and their ability to exploit complementary feature interactions [4]. SVCs show substantial relative improvements over the transaction-only baseline across multiple graph signal categories. However, these improvements are accompanied by increased variability, indicating higher sensitivity to both feature selection and random initialization.
Linear models such as LR and shallow neural models (MLPs) display moderate but robust improvements, suggesting that even comparatively simple classifiers can exploit graph-derived signals when properly optimized. In contrast, Naive Bayes classifiers show minimal sensitivity to graph augmentation, with performance remaining largely unchanged across signal categories. Overall, these results highlight that the effectiveness of graph-derived signals depends on the choice of downstream classifier, and that models with higher expressive capacity tend to benefit more consistently from additional relational information.
8.4. Stability and Variance Across Random Seeds
To assess the stability of observed improvements, we analyzed the variability in -scores across random seeds. Across most classifiers and graph signal categories, the standard deviation of performance remains comparable to or lower than the standard deviation observed for the transaction-only baseline. Observed variability is generally low, with standard deviations typically remaining in the range of a few thousandths in -score. Figure A2 reports the standard deviation of -scores across random seeds for individual graph signals and classifiers. Consistent patterns are observed when variability is aggregated at the graph signal category level (see Figure 2), confirming that stability trends persist beyond individual signal realizations. Observed performance improvements generally exceed the corresponding run-to-run variability, indicating that effect sizes are not dominated by random fluctuations.
This observation suggests that performance gains introduced by graph signals are not driven by favorable random initializations or specific data splits. Instead, the consistently low variance across runs indicates that graph augmentation yields reliable and reproducible improvements within the evaluated setting. In several cases, graph augmentation even reduces variability, indicating a stabilizing effect on model behavior. An exception is observed for SVCs combined with certain centrality-based signals, which exhibit increased variance. Nevertheless, the overall pattern indicates that improvements induced by graph-derived signals are generally robust and reproducible across runs.
8.5. Statistical Significance Analysis
To statistically validate the observed performance gains, we conducted paired McNemar tests to assess whether observed improvements are statistically significant across random seeds, following the paired, run-level testing method described in Section 3. Figure 4 visualizes the aggregated McNemar test outcomes at the graph signal category level, summarizing the number of statistically significant improvements versus degradation levels across classifiers. The top row summarizes net significance patterns across all classifiers, revealing that significant improvements dominate significant degradation levels for all examined graph categories, with GNN-derived representations, proximity-based embeddings, and community-based signals exhibiting the strongest and most consistent dominance of significant improvements over degradations.
Figure 4.
Aggregated McNemar test outcomes for graph signal categories across classifiers. Each cell represents the balance of statistically significant improvements () versus degradation. Darker green shades indicate higher frequencies of significant performance gains, while darker red shades indicate more frequent significant degradations relative to the transaction-only baseline.
Overall, these results confirm that the observed performance gains from graph-derived signals are not only numerically meaningful but also statistically reliable under paired, run-level significance testing. Appendix D provides a fine-grained, per-signal breakdown of McNemar test outcomes across classifiers and runs on a signal level.
8.6. Robustness Under Graph Perturbations
This section reports the results of the edge-dropping robustness experiments introduced in Section 7.6. All graph-derived signals were computed on randomly sparsified transaction graphs with 25% and 50% edge removal, while all other aspects of the experimental setup remained unchanged. To ensure comparability across perturbation levels, all classifiers were evaluated using the previously determined optimal hyperparameters.
Figure 5 illustrates the average relative to the transaction-only baseline across graph signal categories as a function of increasing edge removal aggregated across classifiers. Additional details are reported in Appendix E, where detailed result matrices for each edge removal level are provided in Figure A5 and Figure A6, and classifier-specific robustness trends are illustrated in Figure A7. As illustrated in Figure 5, increasing edge removal leads to distinct degradation profiles across graph signal categories, indicating that robustness under structural perturbation varies substantially across different types of graph-derived signals.
Figure 5.
Average relative to the transaction-only baseline across graph signal categories under increasing edge removal.
Proximity-based signals exhibit the steepest performance degradation under edge removal, with average -score improvements declining rapidly as the graph becomes sparser. This behavior indicates a strong dependence on multi-hop neighborhood structure, which is particularly sensitive to random edge deletion.
Community-based signals show a more gradual but consistent decrease in performance, suggesting moderate robustness under structural degradation. While these signals remain beneficial under mild perturbations, their effectiveness diminishes as community structure becomes increasingly fragmented.
Cohesion- and centrality-based signals display relatively mild degradation on average; however, their robustness is not uniform across classifiers (see Figure A7 in Appendix E). For some downstream models, these signals remain stable under moderate edge removal, whereas for others, their contribution deteriorates, indicating classifier-dependent sensitivity.
Structural embeddings exhibit heterogeneous robustness behavior. While certain classifiers retain stable or only mildly degraded performance under edge removal, others show notable declines, highlighting that robustness for this category depends strongly on the interaction between the embedding method and the downstream classifier (see Figure A7 in Appendix E).
In contrast, GNN-derived representations demonstrate the strongest overall robustness across perturbation levels. Although performance declines with increasing edge removal, GNN-based signals consistently retain positive improvements relative to the transaction-only baseline, even under substantial graph sparsification.
The observed degradation patterns are consistent with the type of structural information encoded by each signal category. As illustrated in Figure 5, proximity-based embeddings exhibit the steepest performance decline. This higher sensitivity is theoretically expected, as these methods rely heavily on local neighborhood connectivity and random-walk co-occurrence statistics, which are systematically disrupted by random edge removal. Removing edges alters short-range paths and local transition probabilities that are fundamental to these representations.
In contrast, community-based and structural-role signals show more gradual degradation (for example, community-based signals in Figure 5 maintain a positive even at 50% removal). This relative stability aligns with their design, as they capture more global or mesoscale graph properties (such as cluster membership or structural roles) that are less dependent on individual edges and therefore more robust under moderate random perturbations. These differences are consistent with the taxonomy-driven categorization and provide a principled explanation for the robustness patterns observed in our experiments.
Overall, these results show that robustness under graph perturbations is highly signal- and classifier-dependent. Categories exhibiting similar average performance under the full graph can differ markedly in their sensitivity to structural degradation, underscoring the importance of evaluating robustness alongside effect size when assessing the practical utility of graph-derived signals.
9. Discussion
The results presented in Section 8 provide the empirical basis for addressing the research questions posed in the Introduction. In this section, we synthesize these findings to answer the research questions by relating performance, robustness, and interpretability patterns to different categories of graph-derived signals in the considered application setting.
Specifically, this discussion examines whether graph-derived signals provide statistically reliable performance improvements over transaction-only baselines and how these effects vary across signal categories (RQ1), how robust the observed performance gains are under controlled graph perturbations (RQ2), and to what extent a taxonomy-driven organization of graph signals supports interpretable, category-level insights into characteristic fraud-related patterns (RQ3).
The experimental results presented in Section 8 were obtained from a deliberately controlled and statistically grounded evaluation method (SEM). By flexibly combining taxonomy-driven graph signal integration, automated hyperparameter optimization, multi-seed evaluation, and formal significance testing, the proposed evaluation method enables reliable, comparable, and interpretable assessment of graph-derived signals for tabular learning.
This study set out to systematically evaluate whether, and under what conditions, graph-derived signals provide measurable, statistically reliable, and robust performance benefits for graph-augmented tabular machine learning. Considering fraud detection on transaction networks as a case study, the results provide convergent evidence that incorporating relational information yields consistent and statistically significant improvements over transaction-only baselines. At the same time, they reveal that the magnitude, stability, and robustness of these gains depend strongly on the type of graph-derived signal, the downstream classifier, and the quality of the underlying graph structure.
9.1. Effectiveness of Graph-Derived Signals
Across classifiers, graph signal categories, and individual graph signals, the integration of graph-derived signals leads to consistent and statistically reliable improvements over the transaction-only baseline, with gains observed across the large majority of evaluated classifier–signal combinations rather than being confined to isolated configurations. This indicates that relational information captured from the transaction graph provides complementary predictive power beyond node-local transaction features.
From a qualitative perspective, the effectiveness of graph-derived signals is strongly influenced by the type of relational information they encode. Signals that encode local relational proximity and neighborhood context emerge as particularly beneficial in this setting. This observation aligns with the intuition that illicit behavior in transaction networks often propagates through localized neighborhoods, making proximity-aware representations well suited for fraud detection tasks. In contrast, more global or frequency-based representations provide only limited additional benefit, suggesting that not all forms of structural information are equally informative for this application domain.
Although proximity- and community-based signals are treated as distinct categories within the proposed taxonomy, both capture aspects of relational closeness at different levels of abstraction. The stronger performance of proximity-based representations suggests that modeling relational proximity in a continuous and fine-grained manner can convey richer information than discrete group assignments in the evaluated fraud detection setting. This highlights the importance of considering not only which structural properties are encoded, but also how they are represented when assessing the utility of graph-derived signals.
Altogether, these findings show that the effectiveness of graph-based augmentation is closely linked to the alignment between signal type, representation granularity, and the relational characteristics of the underlying task.
9.2. Classifier-Specific Interactions and Model Capacity
The effectiveness of graph signals varies substantially across classifiers, reflecting differences in model capacity and inductive bias. Tree-based ensemble models, particularly Random Forests and XGBoost, benefit most consistently from graph-based augmentation. These models are well suited for exploiting heterogeneous, potentially redundant feature sets and exhibit stable improvements across nearly all graph signal categories. These findings align with broader evidence that, in tabular learning settings, model performance is often driven more by feature quality than by architectural complexity [4]. While this prior work highlights the general importance of feature quality in classical tabular learning, it does not address how relational information from graphs can be systematically evaluated when multiple graph representation strategies are available. In practice, graph-derived features are often selected in an ad hoc manner or replaced entirely by end-to-end GNN models without systematically assessing their statistical reliability, robustness, or reproducibility. Our work addresses this need by introducing a taxonomy-driven and statistically grounded evaluation protocol for graph-derived signals in tabular learning.
SVCs show pronounced relative improvements over the transaction-only baseline across many graph signal configurations. However, these gains are accompanied by increased variability across random seeds, reflecting the known sensitivity of support vector machine (SVM)-based models to data splits, feature scaling, and hyperparameter settings. While graph signals can substantially enhance SVC performance, these results underscore the importance of careful model tuning and stability analysis when using margin-based classifiers in graph-augmented settings.
Linear models and shallow neural networks display more moderate but robust improvements, suggesting that even comparatively simple classifiers can benefit from relational information when graph-derived signals are appropriately constructed. In contrast, Naive Bayes classifiers exhibit minimal sensitivity to graph augmentation, indicating limited compatibility between conditional independence assumptions and graph-derived signal representations.
9.3. Stability, Variability, and Robustness
Beyond average performance gains, the stability of graph-augmented models across random seeds is a critical consideration. The results demonstrate that standard deviations of -scores remain low across most classifiers and graph signal categories, typically on the order of a few thousandths. In many cases, graph augmentation even reduces run-to-run variability relative to the transaction-only baseline, indicating a stabilizing effect on model behavior.
Importantly, graph signal categories exhibiting similar average performance under the full graph can differ markedly in their robustness to structural perturbations, highlighting that average effect size alone is insufficient for assessing practical utility without explicit robustness evaluation. From a practical perspective, these findings imply that the choice of graph-derived signals should be informed not only by average performance under ideal graph conditions, but also by the expected level of noise, incompleteness, or uncertainty in the underlying graph structure. Robustness patterns vary substantially across graph signal categories and perturbation levels, underscoring the importance of signal-type-aware robustness evaluation when selecting graph-derived indicators for downstream tasks. Observed performance gains generally exceed corresponding run-to-run variability, suggesting that improvements reflect systematic effects of incorporating relational information rather than random fluctuations. Finally, the results indicate that the benefit of graph-derived signals is not entirely classifier-invariant, suggesting that signal selection and classifier choice should be considered jointly when designing graph-augmented tabular learning pipelines.
9.4. Statistical Significance of Performance Improvements
Paired McNemar significance tests provide a statistical assessment of performance differences between graph-augmented models and transaction-only baselines. Across a large number of paired comparisons arising from the multi-classifier, multi-signal-group, and multi-seed evaluation setup introduced in Section 3, a substantial majority of comparisons yield statistically significant improvements over the transaction-only baseline. This pattern persists when results are aggregated at both the graph signal category level and the individual signal level, indicating that beneficial effects are systematic rather than incidental.
Proximity-based and GNN-derived representations exhibit particularly strong and consistent significance patterns, while spectral features show mixed outcomes, aligning with their limited average performance improvements. Importantly, significant degradations are rare overall and occur primarily in isolated classifier–signal combinations rather than as systematic trends.
9.5. Interpretation and Methodological Implications
The findings of this study demonstrate that incorporating graph-derived signals into tabular learning pipelines yields statistically significant and reproducible performance improvements in the context of cryptocurrency transaction fraud detection. From a methodological perspective, SEM enables a systematic and taxonomy-driven integration of diverse graph-derived signals into tabular learning pipelines. Flexible signal grouping, controlled hyperparameter optimization, and formal statistical evaluation allow practitioners to identify which types of graph signals yield statistically significant and stable benefits for a given downstream task. In particular, the results highlight the importance of selecting graph signal types that align with the structural characteristics of the target problem, as both performance impact and robustness under structural perturbations vary substantially across signal categories.
Moreover, the inclusion of controlled structural perturbations provides a practical mechanism to assess how different graph signal categories respond to incomplete or degraded graph structure. The observed heterogeneity in degradation patterns underscores that robustness is highly dependent on signal type and should be considered explicitly during signal selection.
In the evaluated cryptocurrency transaction fraud setting, GNN-based representations achieve the strongest overall performance gains. Notably, GNNs are the only class of methods considered in this study that explicitly incorporate feature information from neighboring nodes during representation learning. While multiple factors may contribute to their effectiveness, this observation highlights the potential relevance of local relational context in this application domain.
Beyond GNN-based representations, proximity-based and community-oriented graph signals also exhibit strong and consistent performance improvements, suggesting that relational closeness and mesoscopic grouping information are particularly informative. In contrast, purely structural or spectral representations show more heterogeneous effects. Importantly, these observations are specific to the analyzed transaction network and should not be interpreted as a general ranking of graph signal types across domains.
Beyond predictive performance, the taxonomy-driven evaluation of graph signal categories provides a basis for the pattern-oriented analysis of downstream tasks. By examining which types of graph-derived signals yield consistent and robust improvements, the evaluation method supports high-level interpretations of which structural aspects of the graph are informative for the task, such as fraud detection in transaction networks.
To complement the taxonomy-driven performance analysis with model-level explanations, we conducted a feature importance analysis using SHAP (SHapley Additive exPlanations) [47]. This post hoc analysis provides insights into which families of graph-derived signals are most influential for the final model decisions. Detailed results and methodological notes are provided in the Supplementary Materials, Section S4.
Beyond these model-level insights, it is important to distinguish between the generality of the proposed framework and the task-specific nature of the empirical findings. The proposed evaluation method is intended as a general and transferable framework for supervised learning on graph-structured data, whereas the empirical findings reported here are necessarily tied to the characteristics of the analyzed transaction network fraud detection task. The relative effectiveness and robustness of specific graph signal categories depend on task-specific factors such as relational structure, task-relevant structural patterns, and data quality. The aim of this study is therefore not to establish universal rankings of graph-derived signals, but to demonstrate how statistically grounded and taxonomy-driven evaluation can be conducted in a controlled setting. Applying the framework to other tasks and datasets may yield different performance patterns, which can be systematically analyzed using the same methodology.
9.6. Practical Implications and Business Value
The empirical results of this study have direct practical implications for fraud detection systems operating under severe class imbalance and regulatory constraints. They demonstrate that explicitly extracted graph-derived signals can yield consistent and statistically significant improvements in fraud detection performance when integrated into classical tabular machine learning pipelines, improving both precision and recall, which are critical performance dimensions in financial crime detection. From a practical perspective, the primary contribution of the proposed evaluation method lies not in prescribing a fixed ranking of graph signal types for a given application task but in providing a systematic and statistically grounded procedure to assess their utility for a given downstream task.
As demonstrated in the presented fraud detection case study, the relative effectiveness, stability, and robustness of graph-derived signals vary substantially across signal categories and classifiers. Importantly, these patterns are task-dependent and should not be assumed to generalize across application domains. The proposed evaluation method enables practitioners to identify, under controlled experimental conditions, which types of graph-derived signals provide statistically significant and robust benefits for their specific task, data characteristics, and operational constraints. In practical terms, this implies that signal selection should account for known data quality constraints of the application. For example, in settings where transaction graphs are expected to be incomplete or partially observed, such as when access to certain transaction channels is limited, the results of our case study suggest that placing greater emphasis on more coarse-grained or role-based graph signal categories may yield more stable performance than relying primarily on proximity-based signals, which exhibited pronounced sensitivity to graph perturbations.
In regulated environments, interpretability and auditability are often as important as predictive performance. Several graph signal categories that perform particularly well in the evaluated setting, such as community-based indicators, are inherently interpretable and provide transparent representations of relational structure. This facilitates signal-level transparency and model auditability without relying on opaque end-to-end graph neural architectures.
Finally, the robustness experiments in our case study highlight that different graph signal categories exhibit markedly different sensitivity to incomplete or degraded graph structure. In the evaluated fraud detection setting, this allows practitioners to identify which types of graph-derived signals remain informative when transaction graphs are sparse, partially observed, or subject to data loss. The proposed evaluation method therefore provides a principled mechanism to assess, for a given downstream task, which graph-derived signals retain predictive utility under an incomplete or degraded graph structure.
9.7. Limitations and Future Directions
While the proposed evaluation method and taxonomy-driven analysis were intended to be generic and applicable to a broad range of graph-augmented tabular learning tasks, the empirical results presented in this study were obtained from a single large-scale cryptocurrency fraud detection benchmark. Consequently, the quantitative performance gains, robustness patterns, and relative effectiveness of different graph signal categories should be interpreted in the context of this specific application setting.
Different application tasks may exhibit different relational structures, label generation processes, and noise characteristics, which can lead to different relative usefulness of graph signal categories and graph patterns. The proposed evaluation method is designed to support such task-specific assessment rather than to establish universal rankings of graph-derived signals.
At the same time, the Elliptic dataset constitutes a challenging and representative real-world benchmark, characterized by strong relational dependencies, severe class imbalance, temporal non-stationarity and regime shifts in fraud activity over time, as well as noisy graph structure. These properties make it well suited for stress-testing the statistical reliability and robustness of graph-derived signals. The observed patterns, such as the strong effectiveness of proximity-based signals and their pronounced sensitivity to graph perturbations, are therefore indicative of how different types of graph-derived signals behave under realistic conditions, rather than being benchmark-specific performance claims.
Importantly, the primary contribution of this work lies not in the absolute performance levels achieved on this dataset, but in the systematic, statistically grounded evaluation method and taxonomy-driven perspective. These components are directly transferable to other application domains and datasets, enabling comparable analyses of graph-derived signals beyond the specific case study considered here.
From a practical perspective, future work will further increase the degree of protocol automatization to reduce configuration effort and facilitate use in new domains. This includes higher-level wrappers and templates for dataset ingestion and signal selection, as well as more streamlined and user-friendly execution of the full pipeline from signal generation to statistical validation and robustness analysis.
The set of graph-derived signals evaluated within each category is necessarily non-exhaustive. Although representative signal types are selected to cover a broad spectrum of structural information, additional graph signals and alternative formulations may further enrich the analysis. Extending the set of signal representatives per category may provide finer-grained insights into category-internal variability.
Several design choices were made to prioritize comparability and statistical rigor, which also introduce constraints; graph signals were computed deterministically and fixed across random seeds, enabling clean paired comparisons across classifiers and evaluation runs. However, this setup did not explicitly capture additional uncertainty arising from alternative graph construction procedures or stochastic graph signal generation. Similarly, while hyperparameter optimization was applied consistently across models, broader hyperparameter spaces, additional optimization trials, or alternative optimization objectives may further improve absolute performance.
Despite extensive measures to mitigate variability, including automated hyperparameter optimization, multiple random seeds, diverse classifier families, formal significance testing, and trimmed performance aggregation, residual stochastic effects, and dataset-specific biases may still contribute to the observed results, as in all empirical machine learning studies.
Finally, we note that the proposed taxonomy constitutes an abstraction of a continuous and heterogeneous design space. While the categories capture distinct types of structural information, boundaries between categories are not always strict, and certain graph signals may exhibit characteristics of multiple groups. The taxonomy is therefore intended as a practical organizing scheme rather than a rigid classification.
Future work may extend the proposed evaluation method along several directions, including evaluating additional graph signal representatives and classifier families, incorporating stochastic or task-adaptive graph signal generation, extending robustness analysis to dynamic or temporally evolving graphs, and exploring alternative evaluation methods beyond binary fraud detection. More generally, the proposed evaluation method provides a foundation for the systematic and extensible benchmarking of graph-derived signals under controlled experimental conditions.
10. Conclusions
This paper introduces a systematic, taxonomy-driven evaluation method (SEM) for assessing graph-derived signals in tabular machine learning. The proposed evaluation method provides a conceptual framework that enables a structured and interpretable comparison across fundamentally different types of relational information. The method combines multi-seed statistical evaluation, formal significance testing, and robustness analysis under graph perturbations to enable fair and reliable comparisons.
Applied to a large-scale cryptocurrency fraud detection case study, the taxonomy-guided method yields three key insights. First, while graph-derived signals consistently provide statistically significant improvements over tabular baselines, their effectiveness varies substantially across the distinct categories defined by the taxonomy. Proximity-based and GNN-derived signals emerge as particularly impactful, suggesting that localized relational patterns are highly discriminative for fraud detection. Second, robustness under structural perturbations is highly signal-dependent, revealing distinct degradation profiles per category. For instance, while proximity-based signals perform well on the complete graph, they degrade rapidly under edge removal, making them less suitable for applications with incomplete or noisy transaction data. Third, the taxonomy-driven analysis provides interpretable insights by linking these highly discriminative signal categories to characteristic structural fraud patterns, such as the reliance on localized transaction neighborhoods.
Overall, this work demonstrates the importance of assessing graph-derived signals using statistically grounded evaluation criteria beyond average performance comparisons. Accordingly, meaningful evaluation requires the effect size, statistical reliability, and robustness under structural uncertainty to be considered jointly, capturing complementary aspects of signal utility. Moreover, these aspects should not be conflated when assessing practical applicability. The proposed taxonomy further facilitates interpretable insights in applied domains. Using fraud detection as a representative case study, we show how the proposed evaluation method enables principled and reproducible assessment of the conditions under which graph-derived signals provide measurable value for tabular machine learning models.
Methodologically, SEM provides an application-agnostic framework for the informed selection of graph signals based on complementary criteria such as performance, statistical reliability, and robustness. In practical applications, this enables practitioners to make evidence-based decisions about which graph-derived information to extract and incorporate for reliable performance improvements, instead of relying on ad hoc experimentation or intuition.
By systematically identifying signals that are not only accurate but also stable under perturbations, SEM helps reduce the risk of deploying models that depend on fragile relational patterns. Because the full pipeline is openly available and configurable, the method can be readily transferred to other domains where data can be represented as graphs, supporting more reliable and transparent graph-augmented machine learning workflows in practice.
Supplementary Materials
The following supporting information can be downloaded at: https://www.mdpi.com/article/10.3390/app16052624/s1. The Supplementary Materials are provided as a separate PDF and include Section S1 (Classification Hyperparameters), Section S2 (Graph Signal Generation Parameters), Section S3 (Peak Performance Gains per Graph Signal Category), Section S4 (Taxonomy-Driven Post-Hoc Interpretability), and Section S5 (Additional Aggregation Analyses), together with Tables S1–S3 and Figures S1–S4.
Author Contributions
Methodology, M.H., J.H., R.B. and G.W.F.d.B.; software, M.H.; writing—original draft preparation, M.H.; writing—review and editing, J.H., R.B. and G.W.F.d.B.; visualization, M.H.; supervision, J.H., R.B. and G.W.F.d.B. All authors have read and agreed to the published version of the manuscript.
Funding
This research received no external funding.
Institutional Review Board Statement
Not applicable.
Informed Consent Statement
Not applicable.
Data Availability Statement
The data and source code supporting the findings of this study are publicly available from the GitHub repository at https://github.com/graph-eval/graph-eval-protocol, accessed on 5 March 2026. The experimental source code and result artifacts are also available on Zenodo at https://doi.org/10.5281/zenodo.18351526, accessed on 5 March 2026.
Acknowledgments
The authors would like to thank Mª Mercedes Carmona Martínez and Vinny Flaviana Hyunanda from Universidad Católica San Antonio de Murcia (UCAM), as well as Claudia Schmitz from the FOM University of Applied Sciences, for their kind administrative support throughout the doctoral process.
Conflicts of Interest
The authors declare no conflicts of interest.
Appendix A. Illustrative Example of Applying SEM
To illustrate how the Systematic Evaluation Method (SEM) can be applied in practice, this appendix presents a simplified, domain-neutral example. The goal is to demonstrate the sequence of steps and the logic of the protocol rather than to provide a realistic dataset or optimized results.
Scenario.
Consider a node classification task on a small network. Nodes represent entities (e.g., users, devices, or organizations), and edges represent relationships or interactions between them. The task is to predict a binary label for each node, such as risk vs. non-risk or relevant vs. non-relevant.
- 1.
- Stage 1: Input Preparation. The input consists of (i) a graph structure, (ii) basic tabular node attributes (for example, activity count and average interaction value), and (iii) labels for supervised learning. At this stage, the data are prepared in a consistent format, and a fixed train–test splitting strategy is defined. For illustration, consider a tiny graph with four nodes and five edges. Two nodes may be used for training, one for validation, and one for testing. To ensure reproducibility, the split is defined by a fixed random seed.
- 2.
- Stage 2: Graph Signal Generation. Next, several graph-derived signals are constructed. For example, one might compute simple neighborhood statistics (e.g., number of neighbors), proximity-based measures (e.g., distance to labeled nodes), or community-related indicators. These signals represent different types of structural information encoded in the graph.In practice, SEM stores such signals as reusable feature artifacts (e.g., in Parquet format), allowing the same signals to be evaluated across multiple classifiers without recomputation.
- 3.
- Stage 3: Standardized Feature Artifacts. The generated graph signals are combined with the tabular attributes to form augmented feature sets. All feature sets are standardized and aligned with identical data splits to ensure fair comparisons across configurations.
- 4.
- Stage 4: Controlled Supervised Evaluation. A supervised classifier is trained on the baseline tabular features and on the augmented feature sets. Hyperparameters are optimized on validation data and then fixed. The evaluation is repeated across multiple random seeds to quantify performance variability.
- 5.
- Stage 5: Statistical Validation. To assess whether observed differences are meaningful, SEM applies paired statistical tests that compare predictions from baseline and graph-augmented models on the same test instances. This helps determine whether improvements are statistically reliable rather than due to random variation.
- 6.
- Stage 6: Robustness Analysis. To simulate realistic conditions, the graph can be perturbed, for example by randomly removing a fraction of edges (e.g., 25%). The evaluation is then repeated to examine which signals remain stable under degraded data conditions.
Outcome.
The final SEM output is not only a performance ranking but a structured assessment of which types of graph-derived signals provide statistically significant and robust benefits. This allows practitioners to make informed decisions about which structural information is most useful for their specific application. For instance, the analysis might reveal that neighborhood-based signals consistently improve performance, while certain community signals show higher sensitivity to missing edges.
Remark.
While simplified, this example illustrates how SEM can be transferred to many domains where relational data can be represented as graphs. The same logic applies whether the network represents transactions, social interactions, biological relations, or communication patterns.
Appendix B. Mean F1-Score per Individual Graph Signal
We analyzed the distribution of performance changes across all classifier–graph signal combinations, as illustrated in Figure A1. Out of 144 evaluated combinations (6 classifiers × 24 graph signals), 123 (85.4%) yield an improvement in -score relative to the transaction-only baseline, while only 21 (14.6%) result in a decrease. Averaged across all graph signal combinations, graph augmentation leads to a mean -score increase of +0.031, indicating that performance gains are not confined to isolated configurations but occur consistently across models and signal types. The corresponding variability of these performance estimates across random seeds is reported in Appendix C, allowing effect magnitude and stability to be assessed jointly.
Figure A1.
Mean -scores across classifiers and graph signals. Cell values report the mean -score aggregated over the trimmed middle eight runs. Color intensity indicates relative performance differences with respect to the transaction-only baseline (green = improvement, red = degradation).
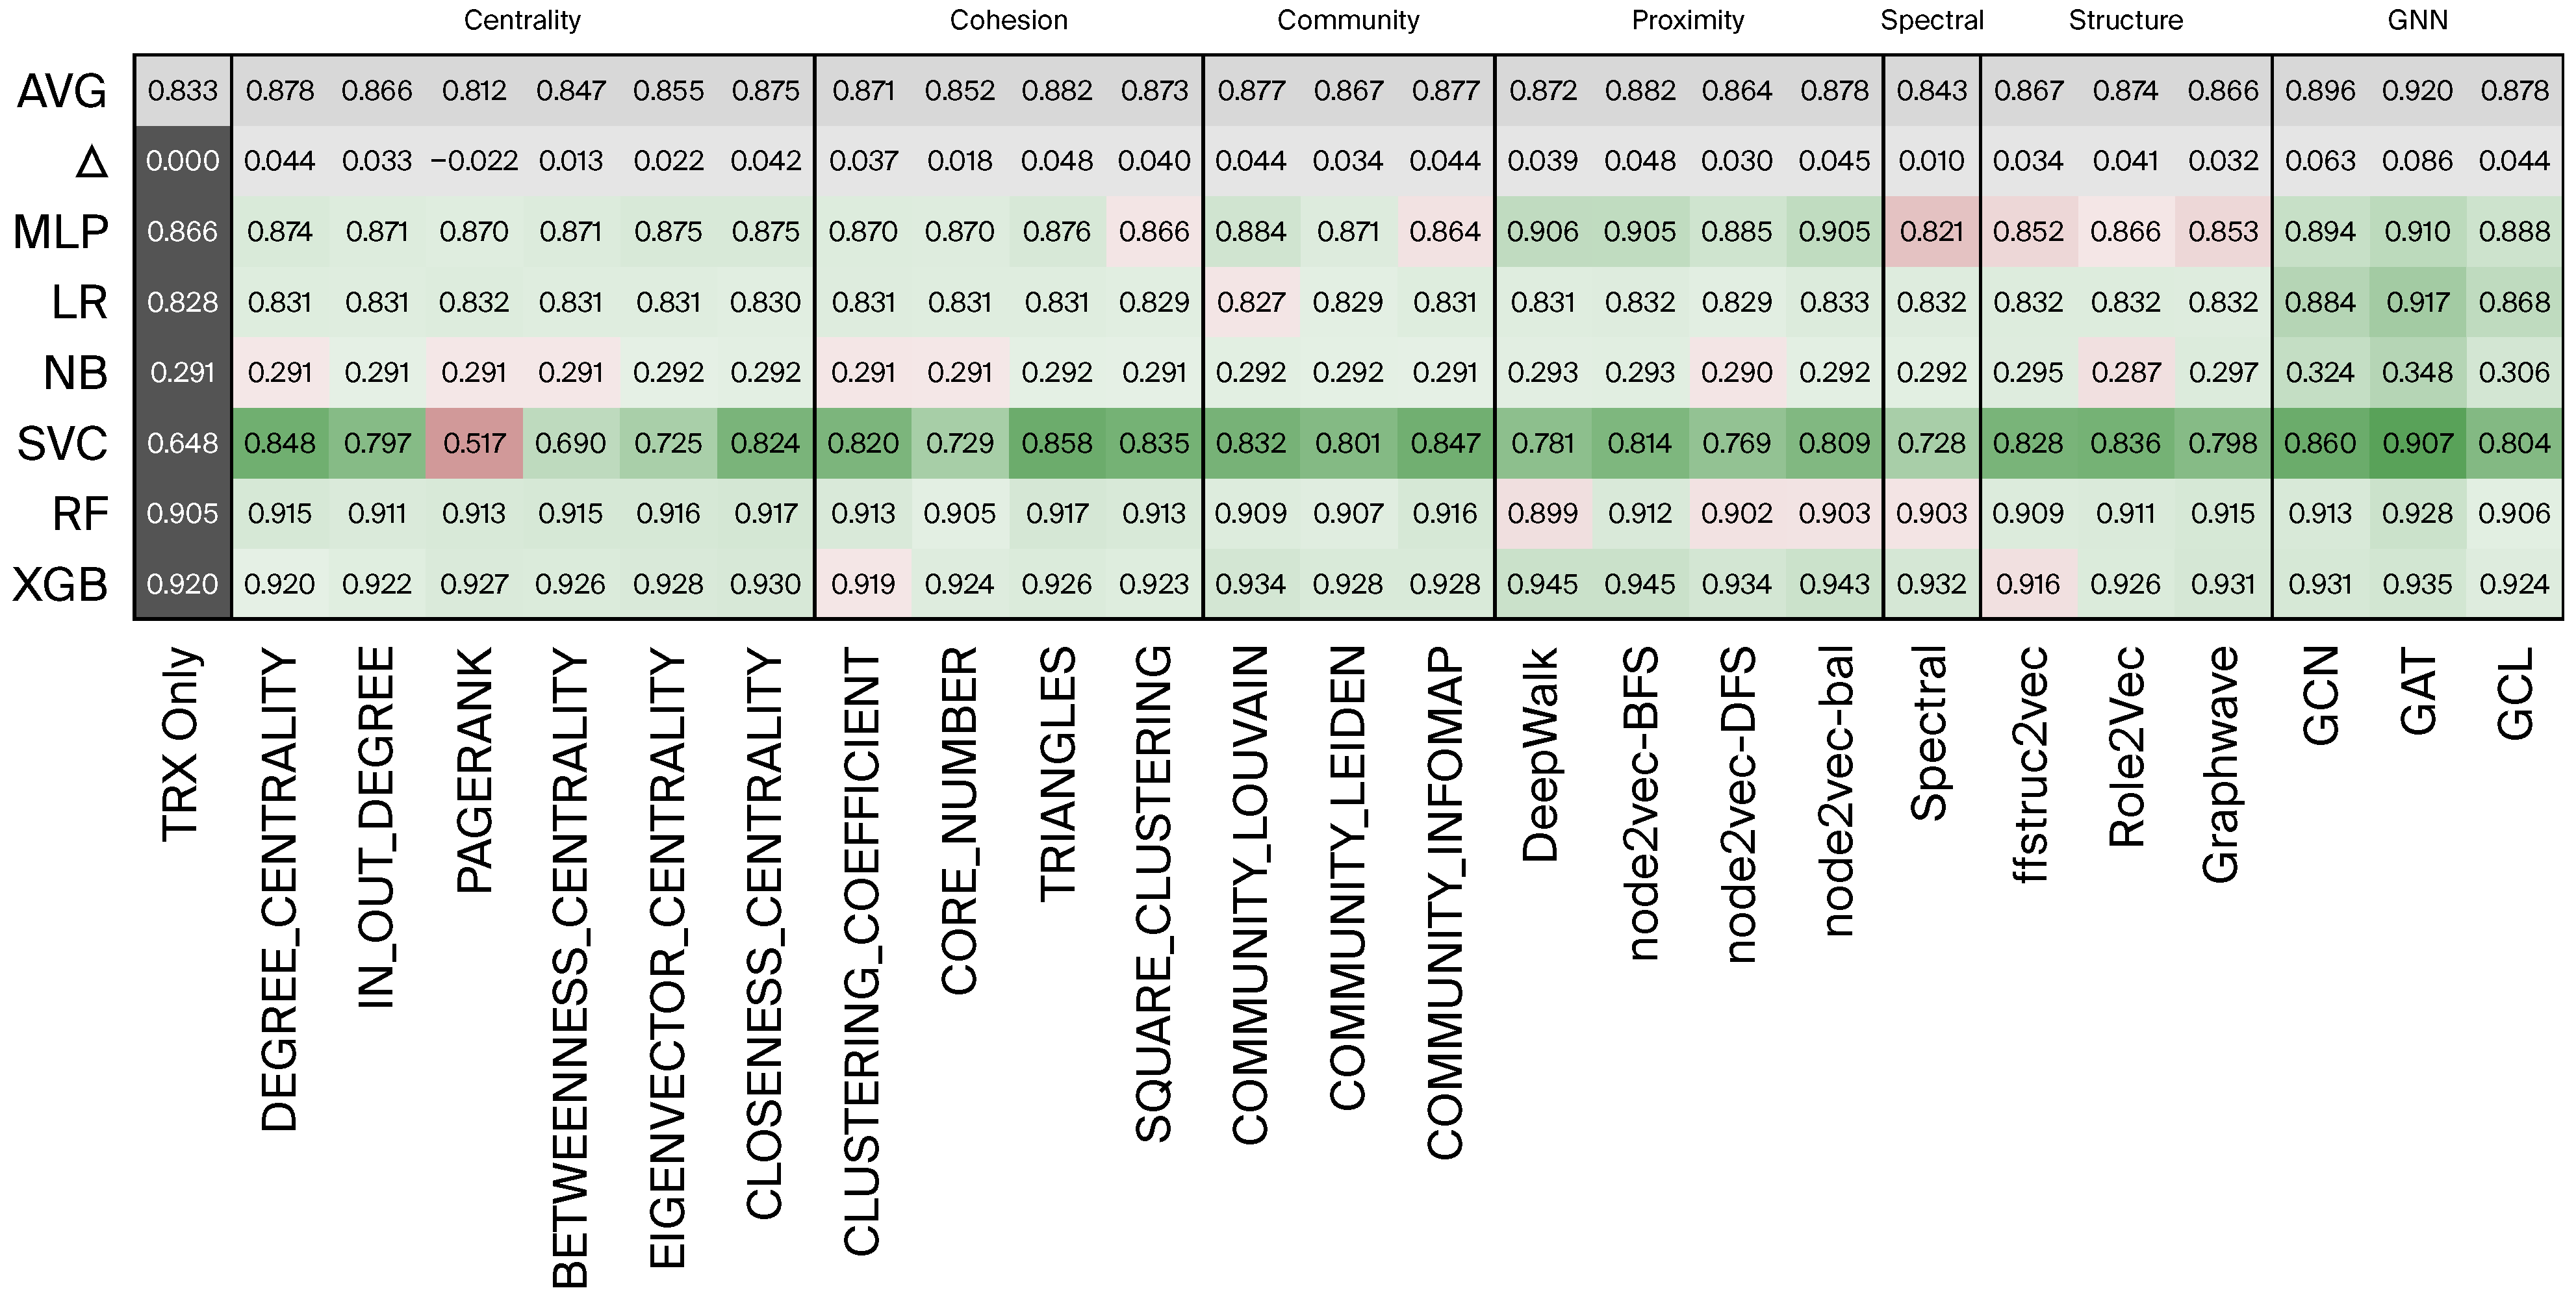
Appendix C. Standard Deviation per Individual Graph Signal
This appendix reports the standard deviation of -scores across random seeds for each classifier–graph signal combination. Together with the mean performance values in Appendix B, these results support the stability of graph-derived signals to be assessed alongside their average effect size.
Figure A2.
Standard deviation of -scores across random seeds. Values report the standard deviation of -scores over the trimmed middle eight runs. Darker shading indicates higher variability. Graph signals are grouped by category.
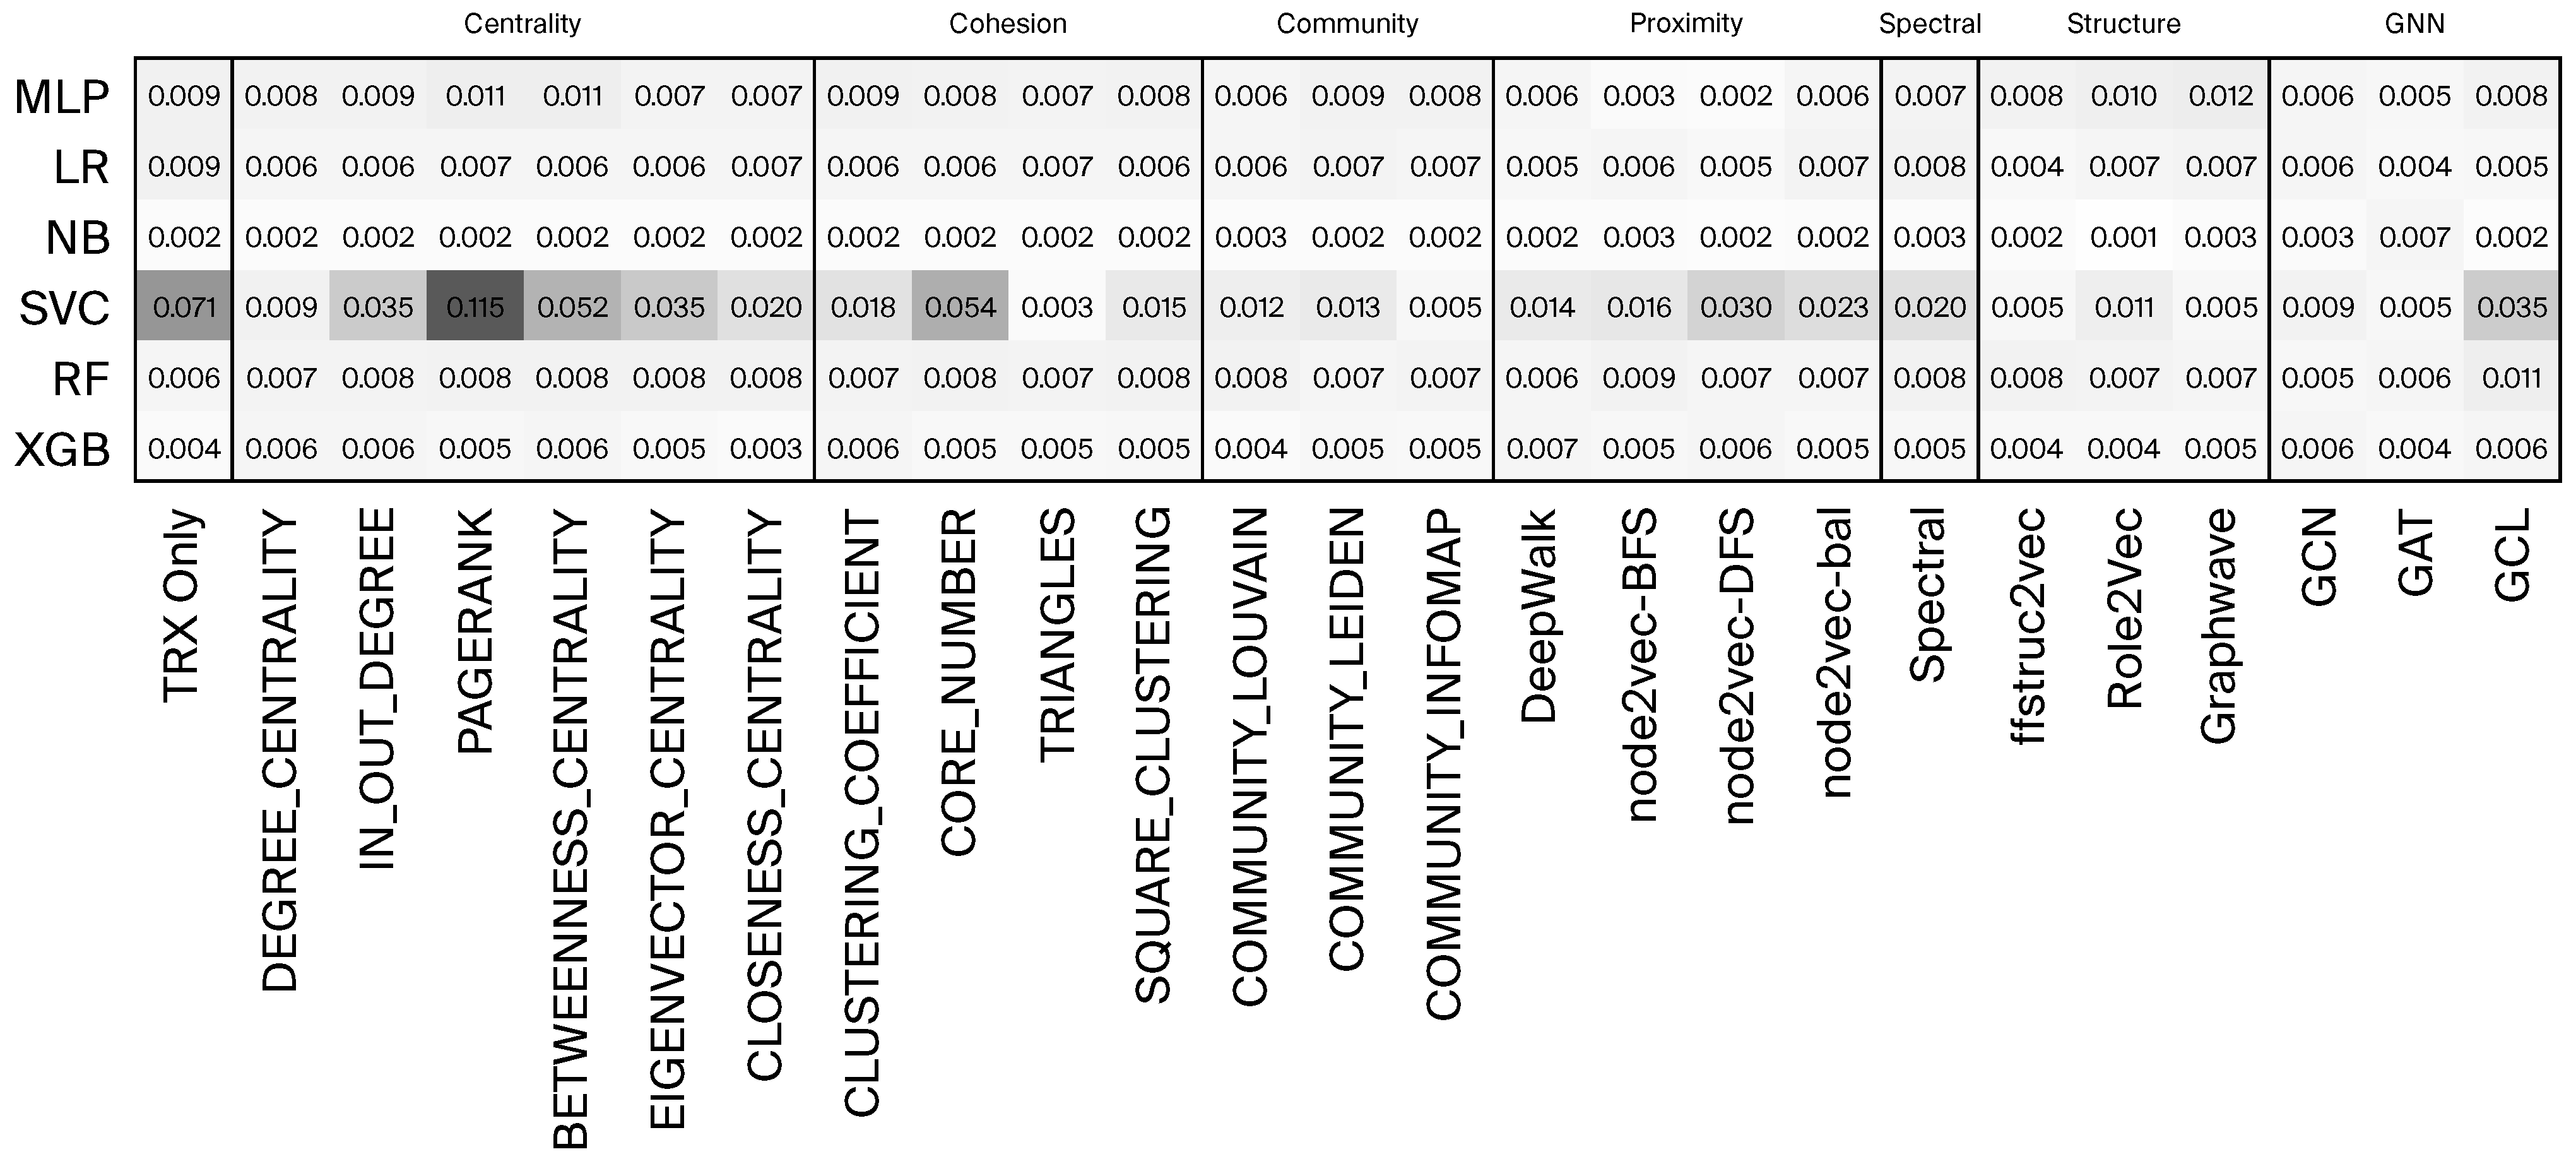
Appendix D. Statistical Significance Assessment via McNemar Tests per Individual Signal
Across all evaluated configurations, a total of 1440 paired comparisons were conducted (6 classifiers × 24 graph signals × 10 random seeds). Of these, 628 comparisons (43.6%) show a statistically significant improvement over the transaction-only baseline at a significance level of , whereas only 101 comparisons (7.0%) exhibit a significant degradation. This asymmetry indicates a strong overall bias toward beneficial effects of graph-based augmentation.
Figure A3.
Signal-level aggregation of McNemar test outcomes across classifiers and runs (). Cells show the number of statistically significant improvements versus degradations (#better/#worse) for each classifier and graph signal combination, aggregated over ten random seeds. Color intensity reflects the net balance between improvements and degradations.
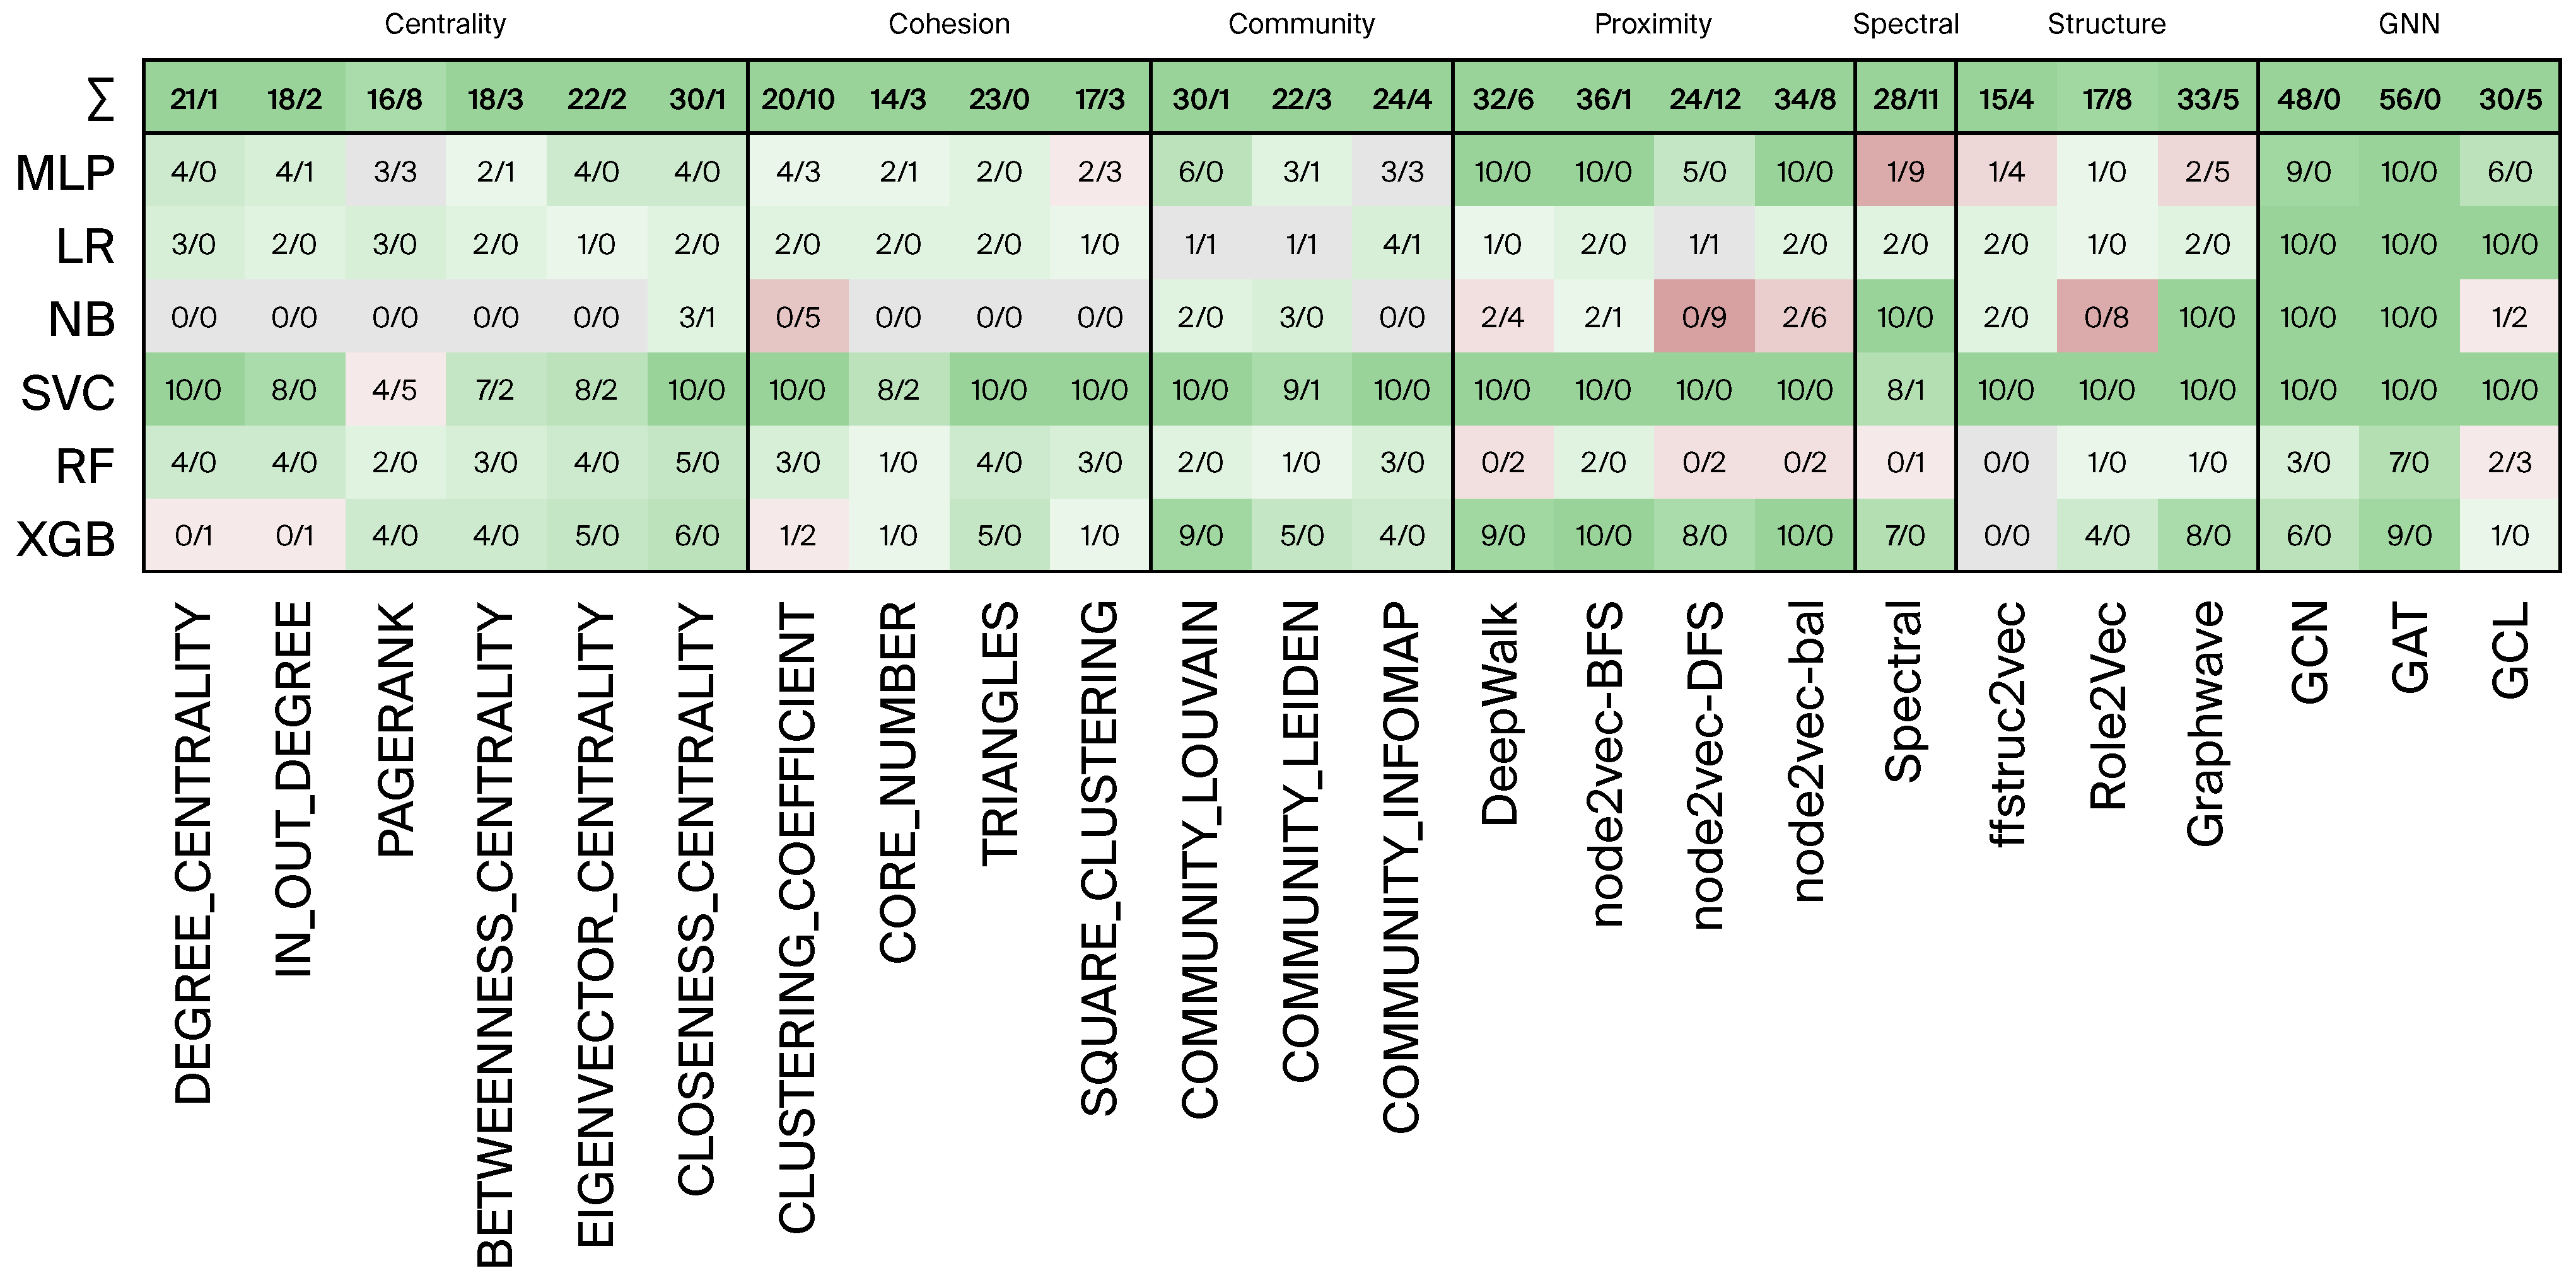
Appendix E. Robustness Analysis Under Graph Perturbations
Figure A4.
Performance comparison under structural graph perturbations with 0% edge removal (transaction-only reference). Cell values report mean -scores with standard deviations across random seeds. Bold values highlight the average improvement over the transaction-only (TRX) baseline. Color intensity indicates relative performance differences with respect to the transaction-only (TRX) baseline (green = improvement, red = degradation).
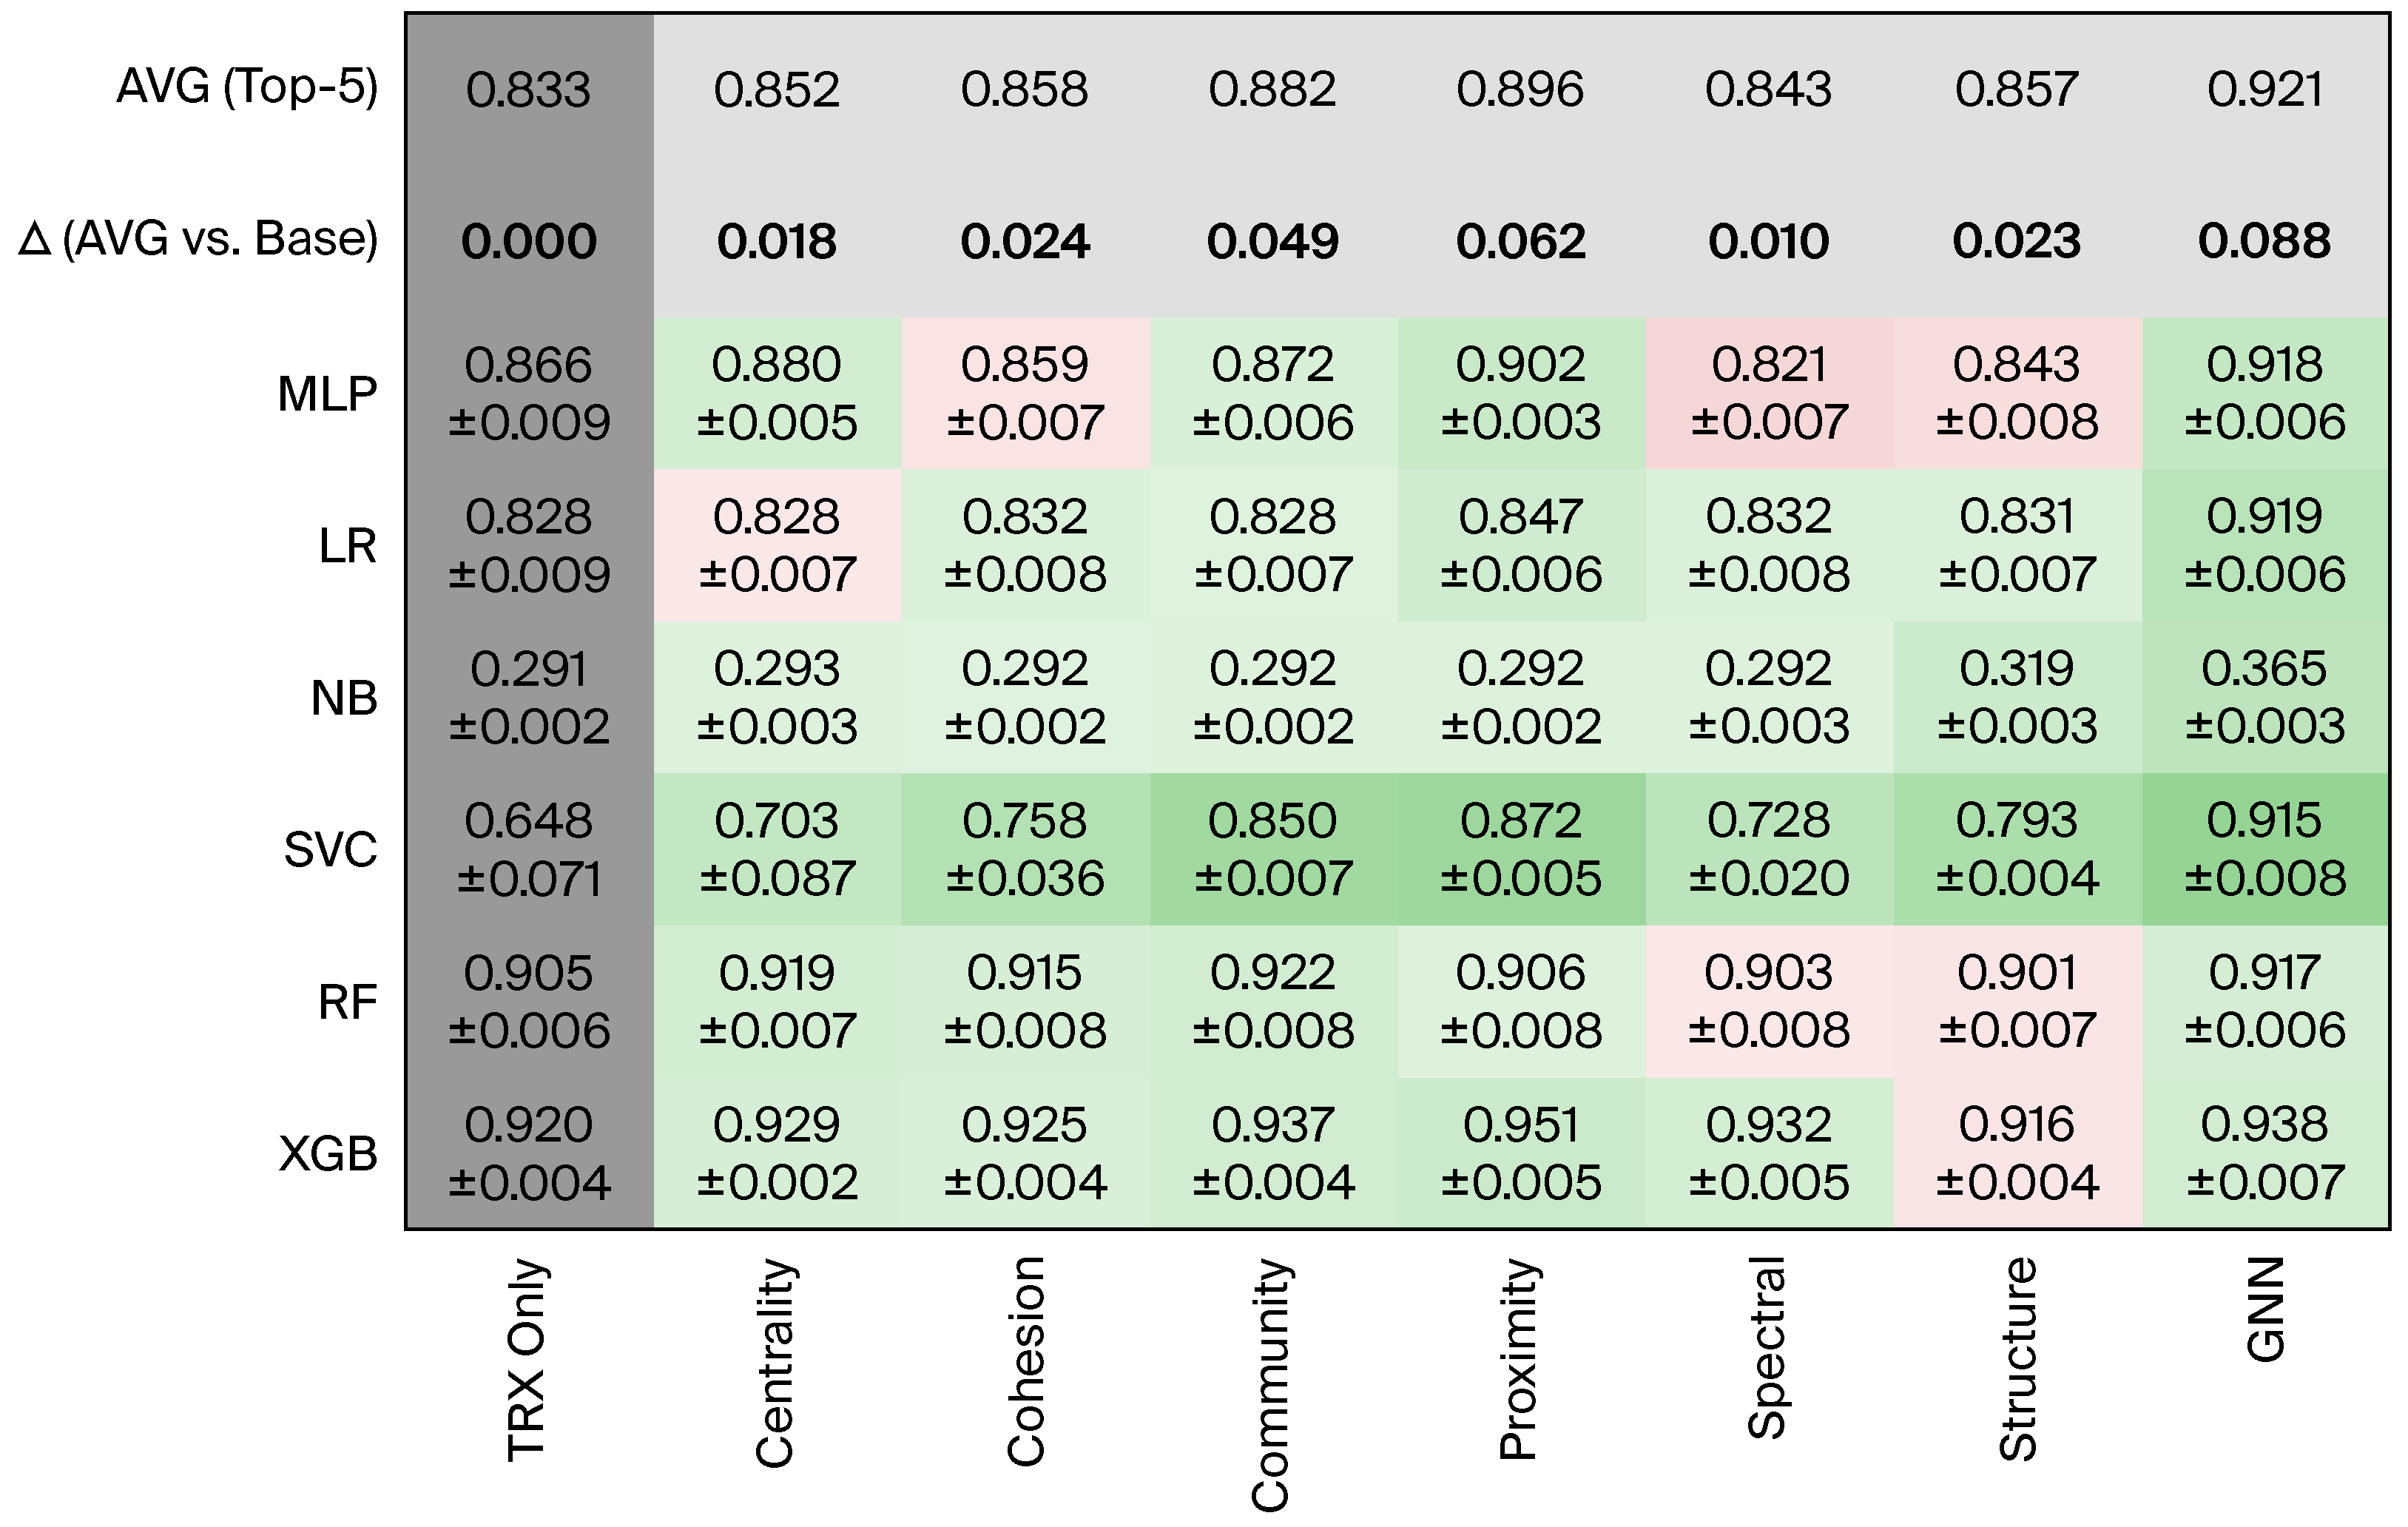
Figure A5.
Performance comparison under moderate structural degradation with 25% random edge removal (transaction-only reference). Cell values report mean -scores with standard deviations across random seeds. Bold values highlight the average improvement over the transaction-only (TRX) baseline. Color intensity indicates relative performance differences with respect to the transaction-only (TRX) baseline (green = improvement, red = degradation).
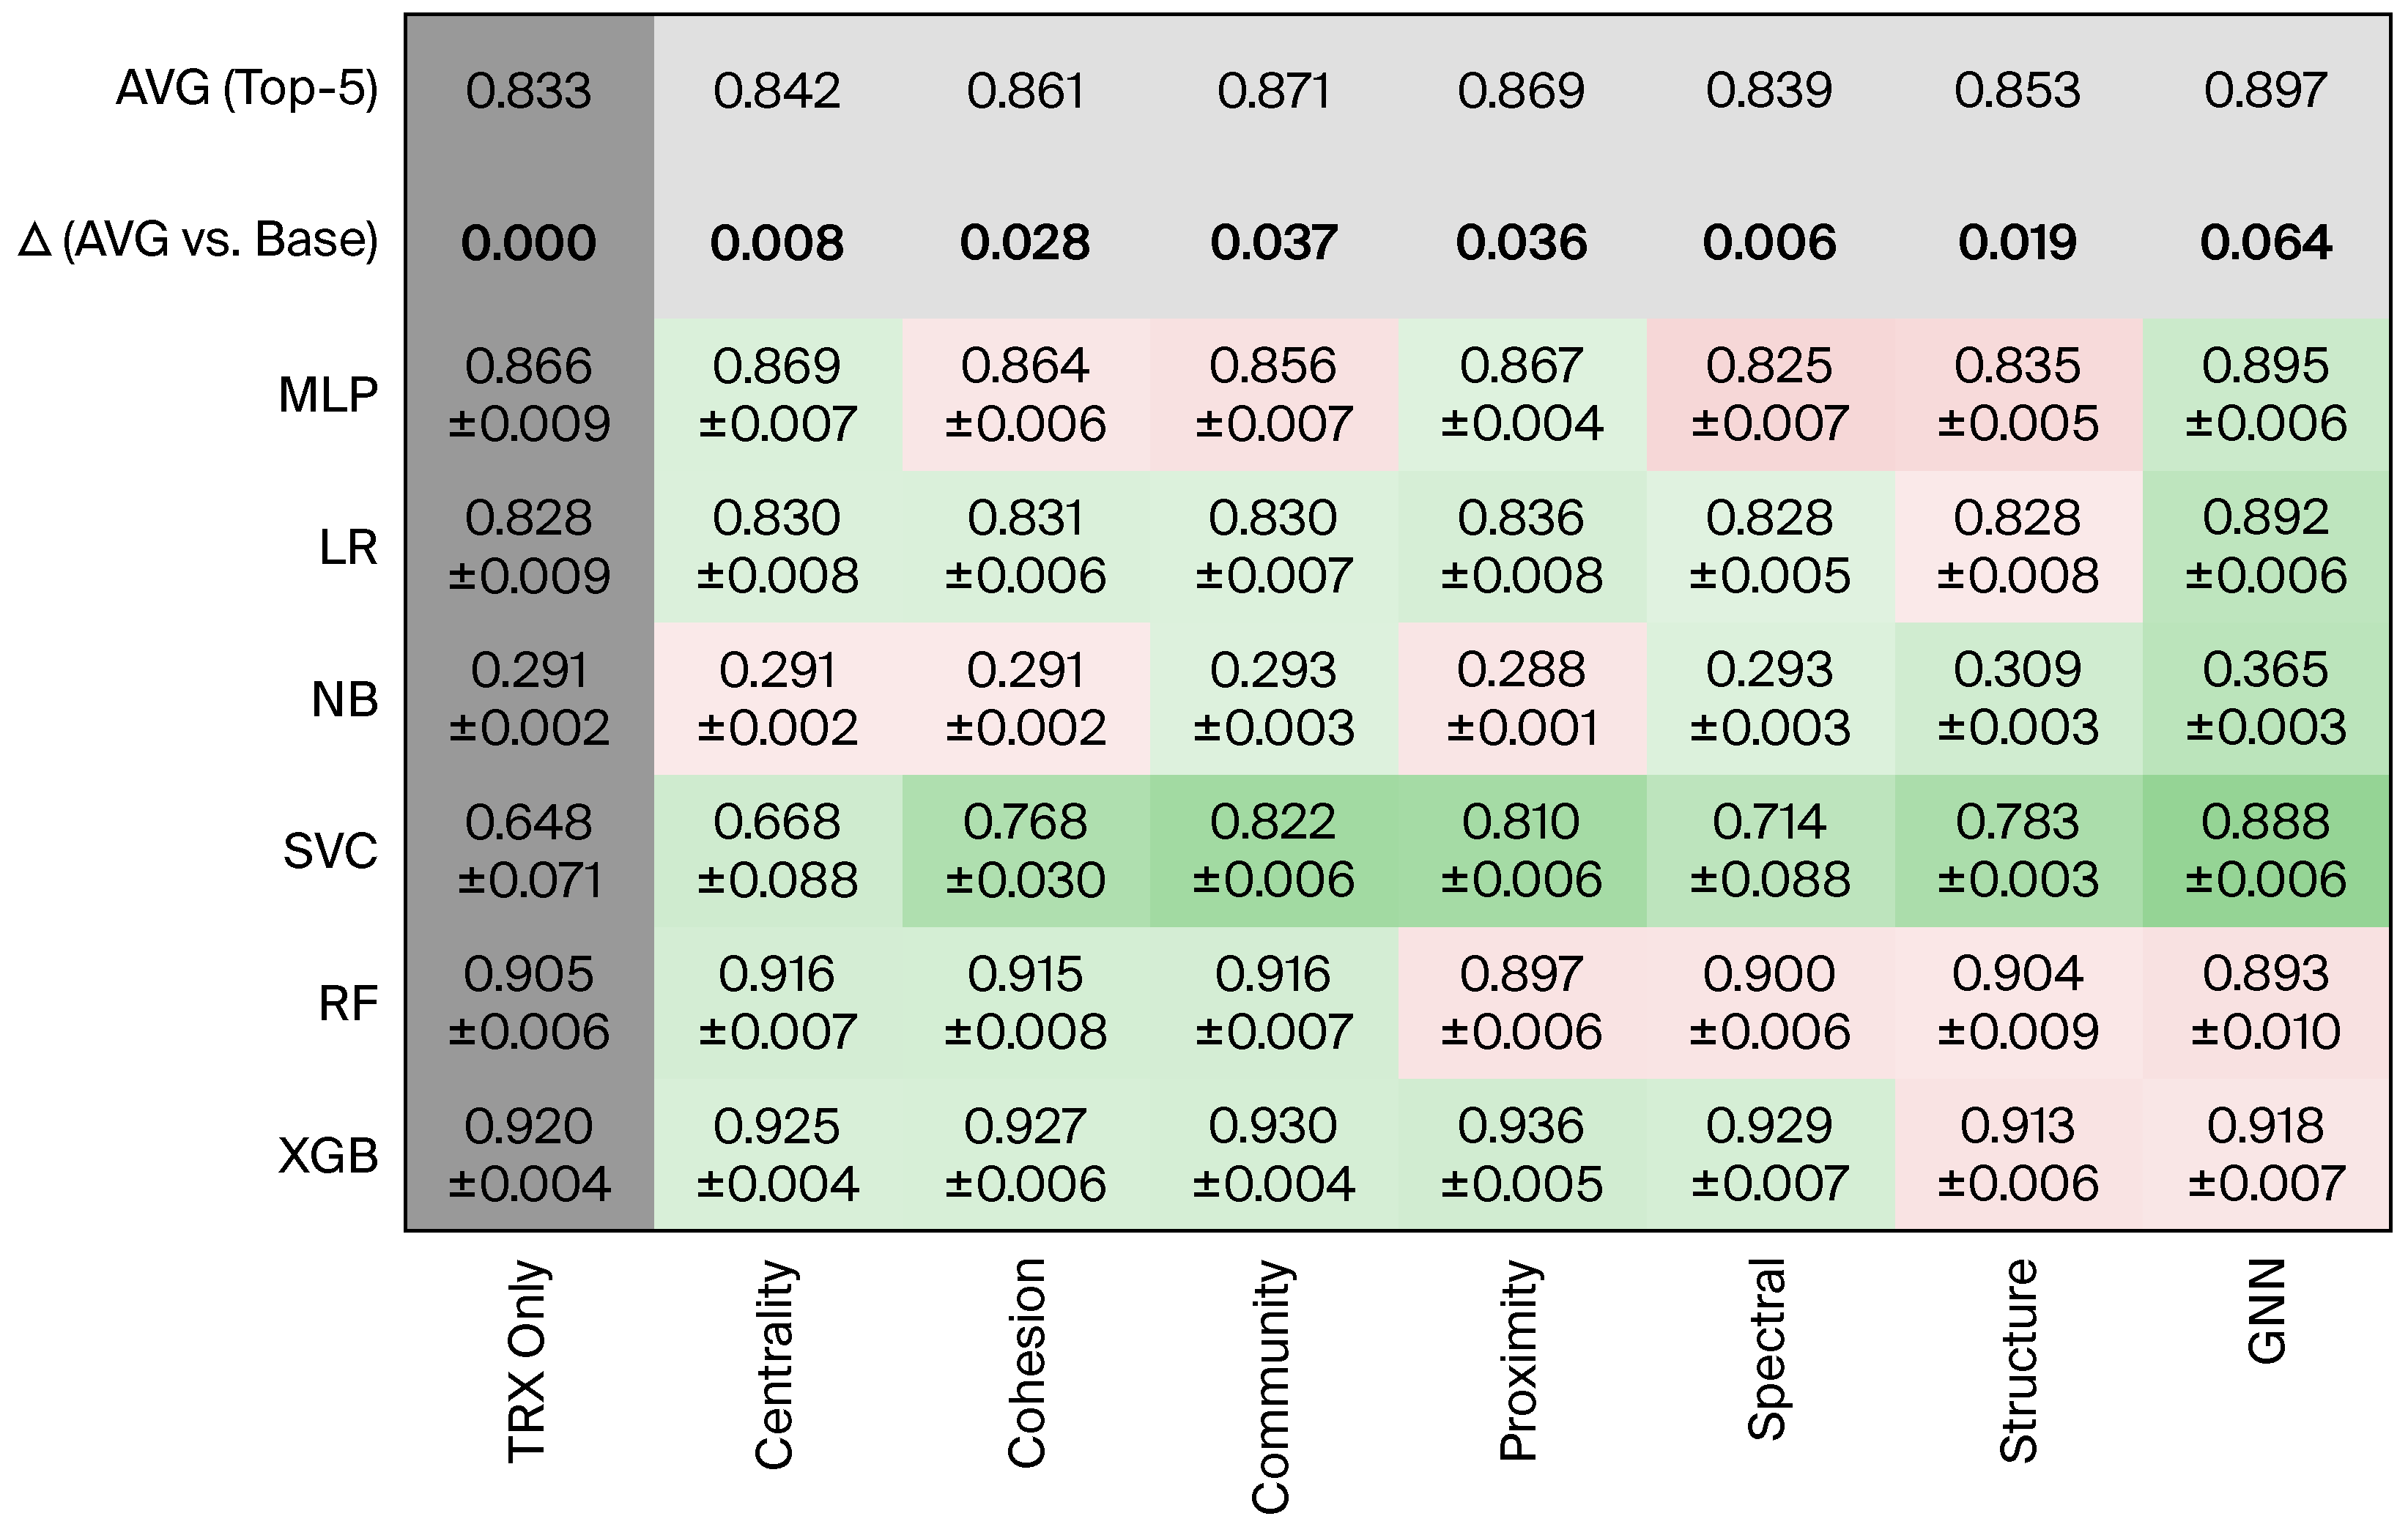
Figure A6.
Performance comparison under stronger structural degradation with 50% random edge removal (transaction-only reference). Cell values report mean -scores with standard deviations across random seeds. Bold values highlight the average improvement over the transaction-only (TRX) baseline. Color intensity indicates relative performance differences with respect to the transaction-only (TRX) baseline (green = improvement, red = degradation).
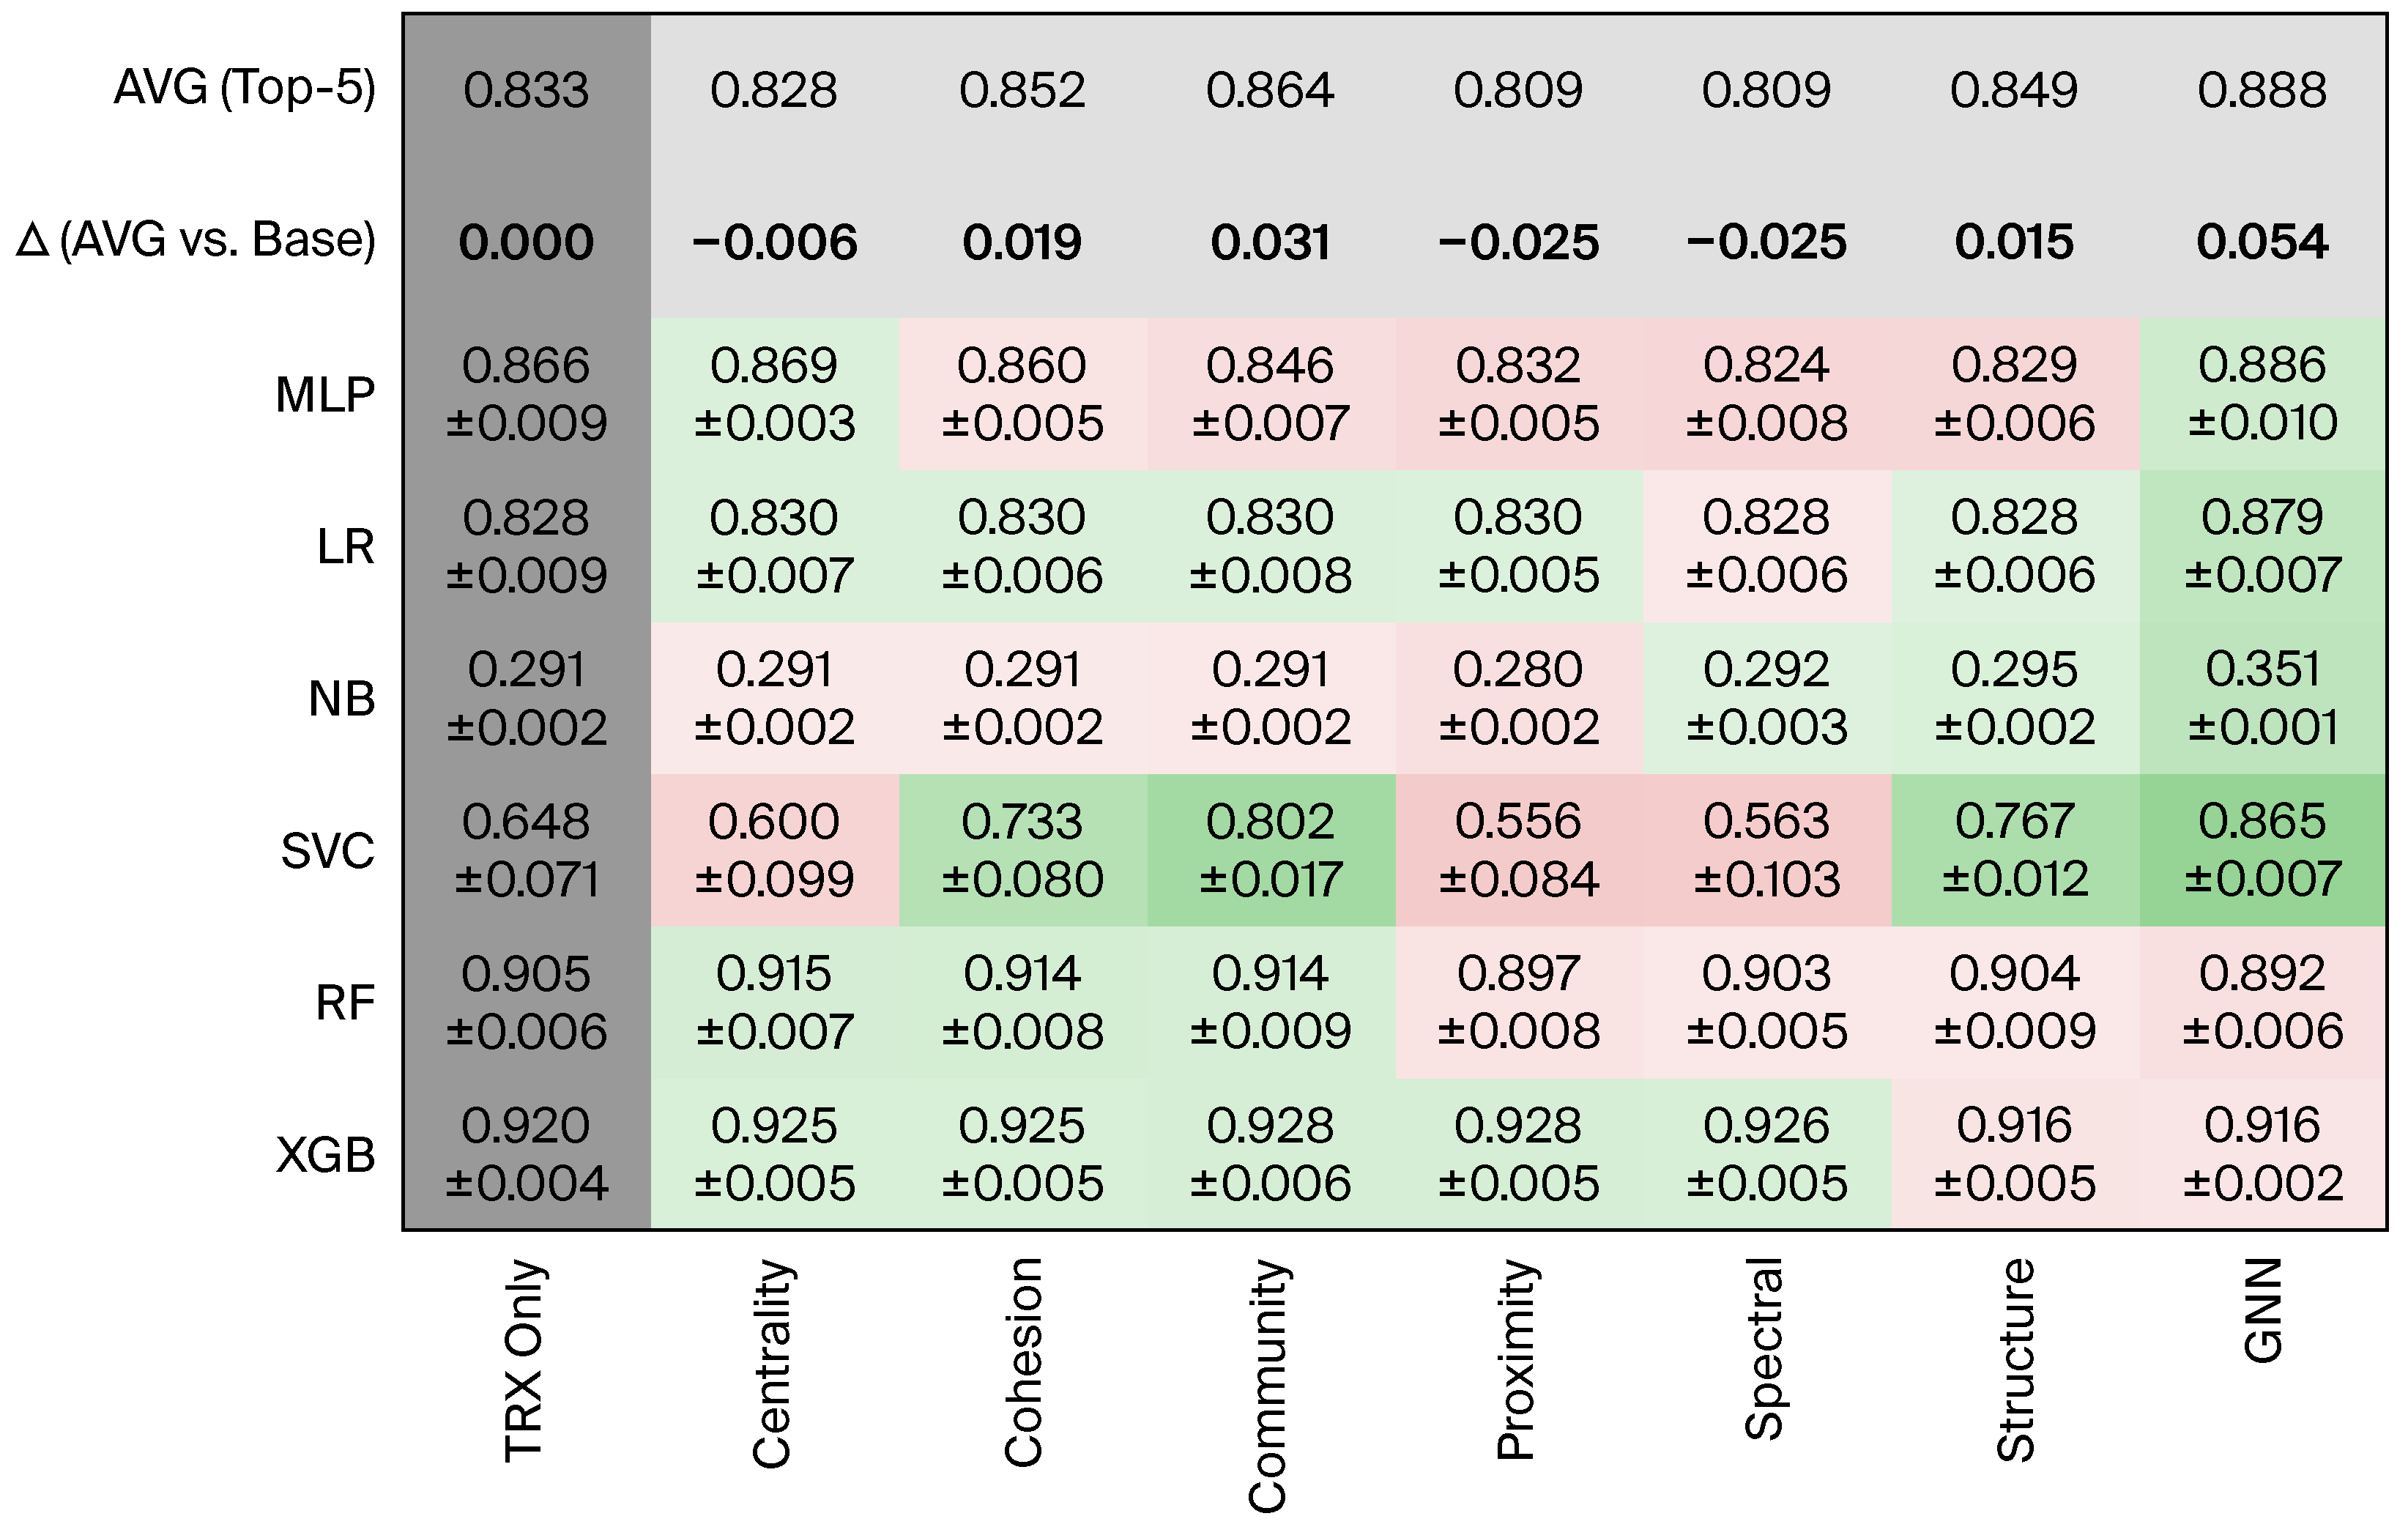
Figure A7.
Classifier-specific robustness trends illustrating how average improvements relative to the transaction-only baseline evolve under increasing levels of random edge removal (0%, 25%, 50%) for different graph signal categories.
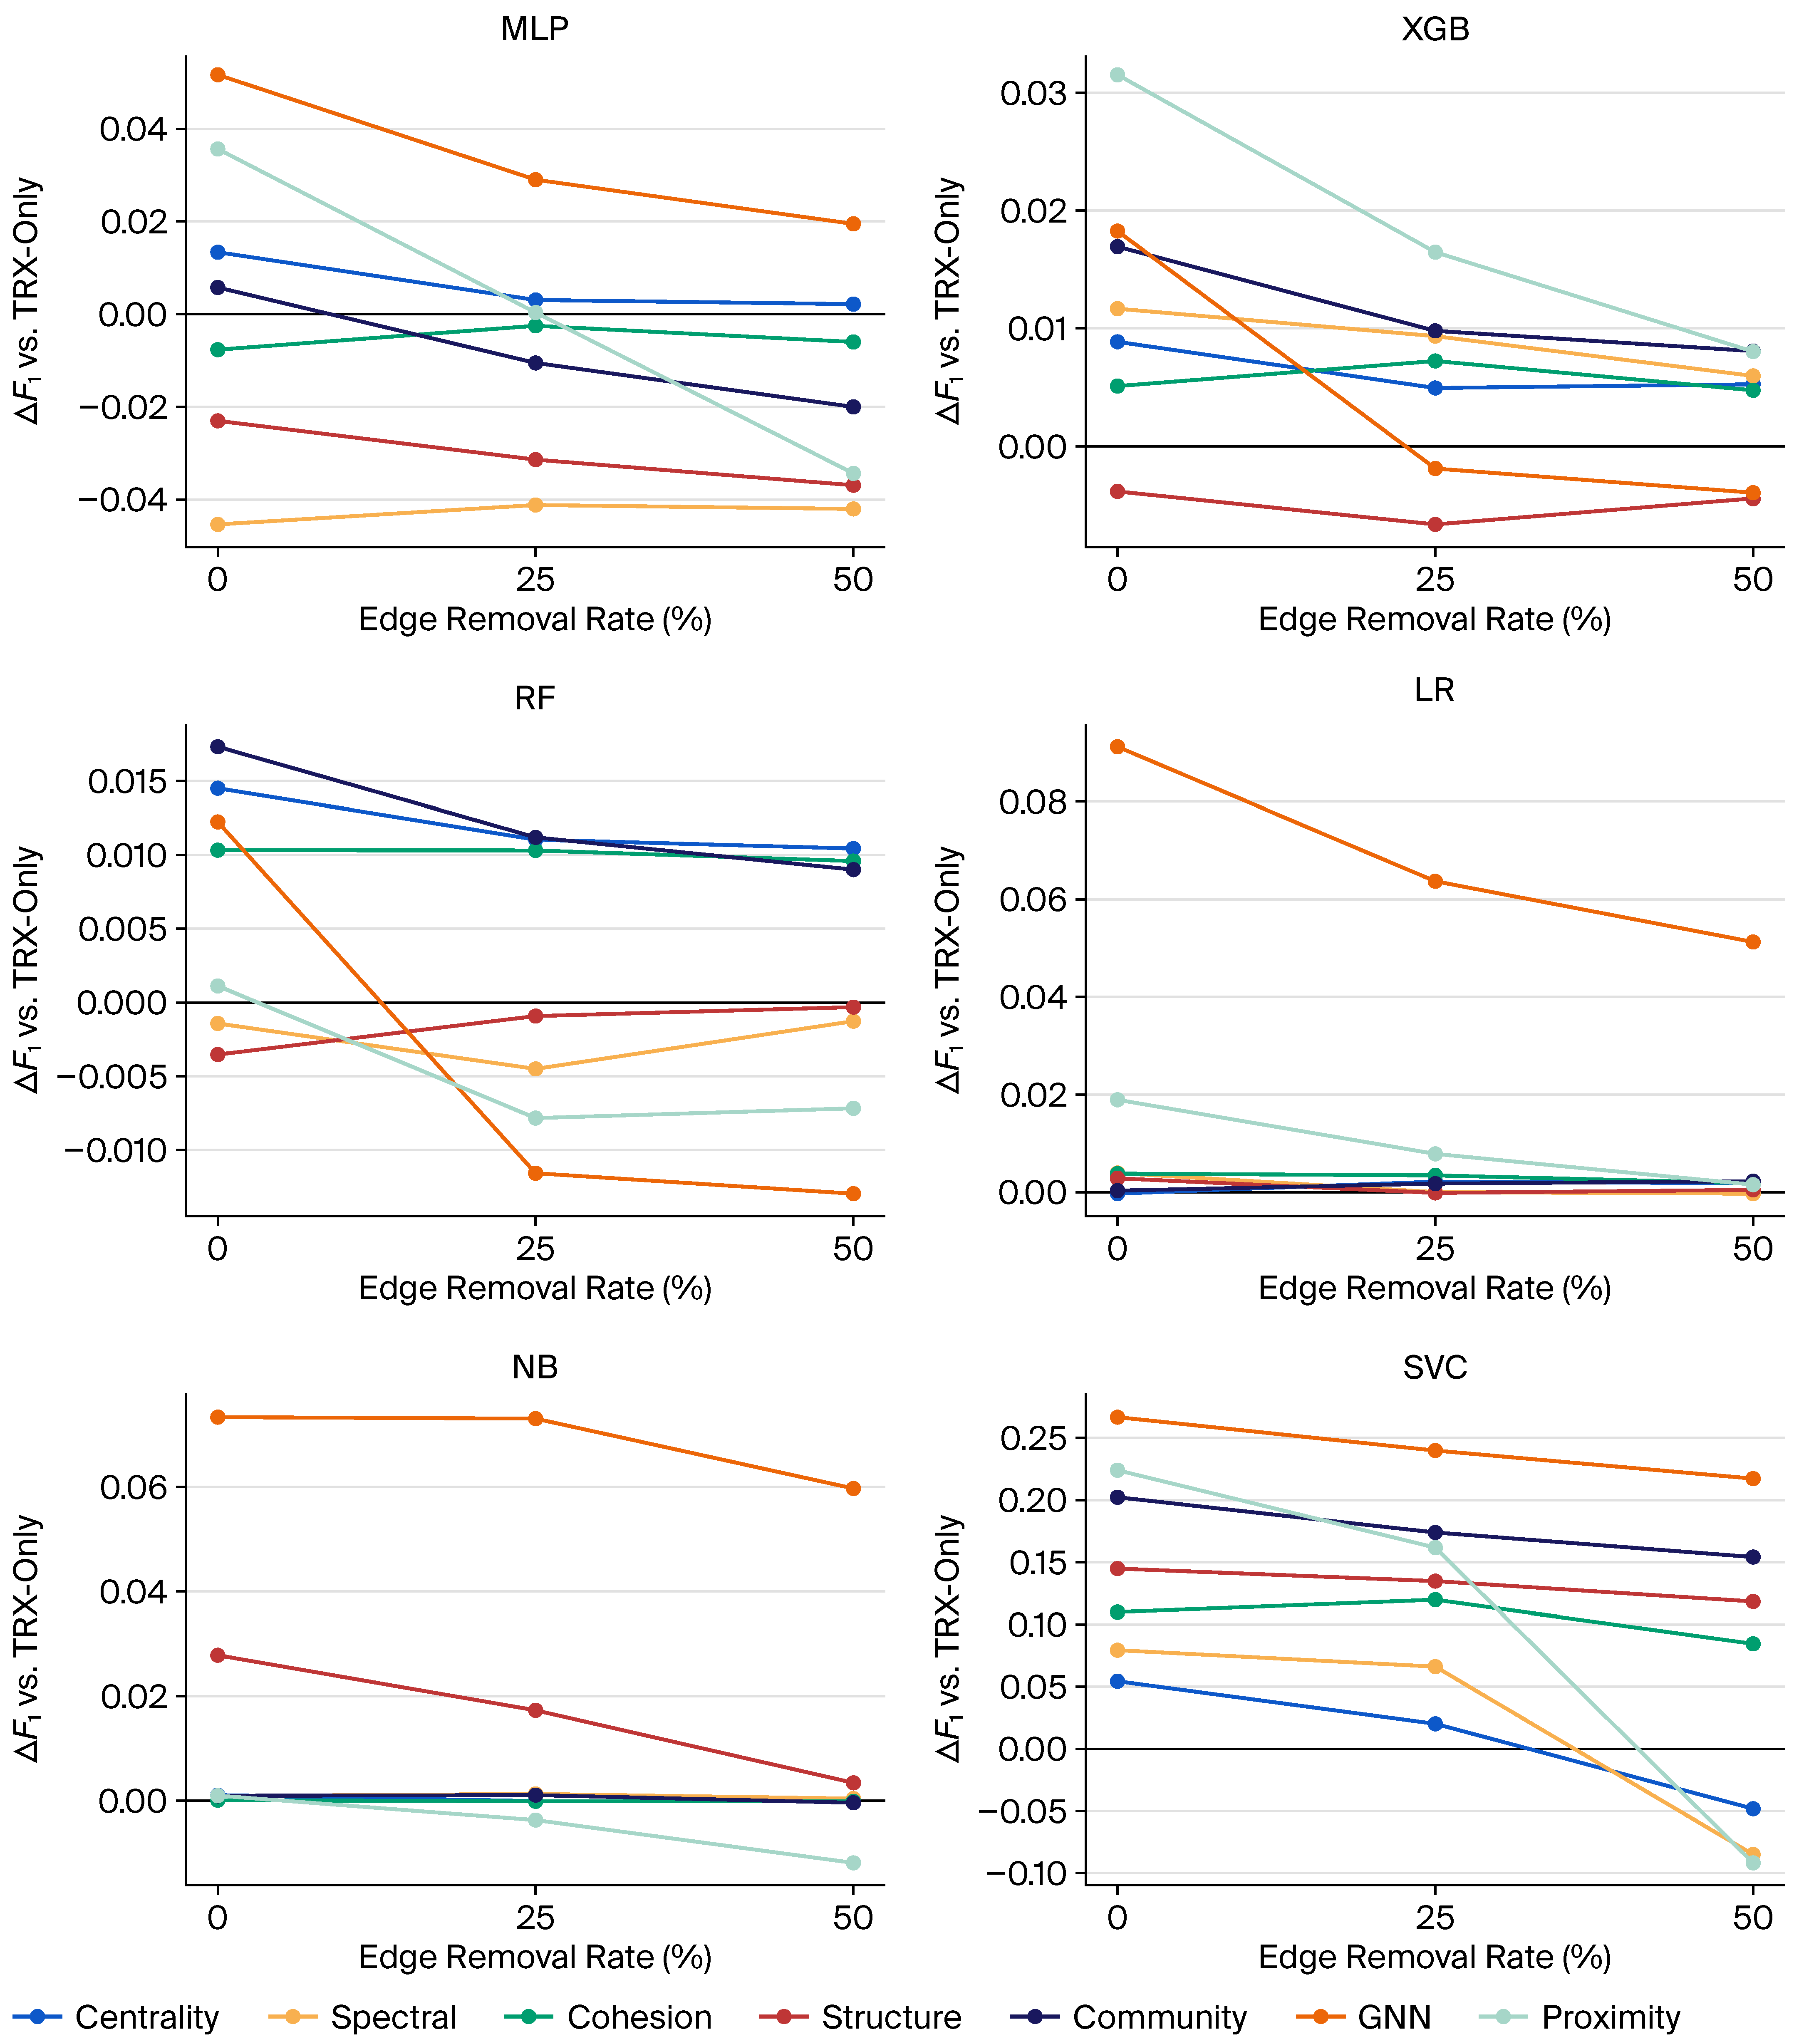
References
- Bishop, C.M. Pattern Recognition and Machine Learning; Information Science and Statistics; Springer: New York, NY, USA, 2006. [Google Scholar]
- Ryan, M.; Massaron, L. Machine Learning for Tabular Data: XGBoost, Deep Learning, and AI; Manning Publications: Shelter Island, NY, USA, 2021. [Google Scholar]
- Hamilton, W.L. Graph Representation Learning; Synthesis Lectures on Artificial Intelligence and Machine Learning; Springer: Cham, Switzerland, 2020; Volume 14, pp. 1–159. [Google Scholar] [CrossRef] [Scilit]
- Grinsztajn, L.; Oyallon, E.; Varoquaux, G. Why do tree-based models still outperform deep learning on tabular data? arXiv 2022, arXiv:2207.08815. [Google Scholar] [CrossRef] [Scilit]
- Bartelt, C.; Lüdtke, S.; Marton, S.; Stuckenschmidt, H.; Tschalzev, A. A Data-Centric Perspective on Evaluating Machine Learning Models for Tabular Data. In Advances in Neural Information Processing Systems; Neural Information Processing Systems Foundation, Inc.: San Diego, CA, USA, 2024; pp. 95896–95930. [Google Scholar] [CrossRef] [Scilit]
- Bergstra, J.; Yamins, D.; Cox, D.D. Making a Science of Model Search: Hyperparameter Optimization in Hundreds of Dimensions for Vision Architectures. In Proceedings of the 30th International Conference on Machine Learning (ICML 2013); JMLR: Cambridge, MA, USA, 2013; pp. 115–123. [Google Scholar]
- Yin, Z.; Chen, Y.; She, P.; Liu, C.; He, X.; Lv, S. Modeling the measurement precision of a multi-camera system. Opt. Lett. 2025, 50, 6489–6492. [Google Scholar] [CrossRef] [Scilit]
- Shi, Y.; Wang, Y.; Wang, L.N.; Wang, W.N.; Yang, T.Y. Bridge Cable Performance Warning Method Based on Temperature and Displacement Monitoring Data. Buildings 2025, 15, 2342. [Google Scholar] [CrossRef] [Scilit]
- Weber, M.; Domeniconi, G.; Chen, J.; Weidele, D.K.; Bellei, C.; Robinson, T.; Leiserson, C.E. Anti-Money Laundering in Bitcoin: Experimenting with Graph Convolutional Networks for Financial Forensics. In Proceedings of the 25th ACM SIGKDD International Conference on Knowledge Discovery and Data Mining; ACM: New York, NY, USA, 2019; pp. 240–248. [Google Scholar] [CrossRef] [Scilit]
- Bergstra, J.; Bardenet, R.; Bengio, Y.; Kégl, B. Algorithms for hyper-parameter optimization. In Proceedings of the Advances in Neural Information Processing Systems, Granada, Spain, 12–15 December 2011; Volume 24, pp. 2546–2554. [Google Scholar]
- Wilcox, R.R. Introduction to Robust Estimation and Hypothesis Testing, 3rd ed.; Academic Press: San Diego, CA, USA, 2012. [Google Scholar]
- Freeman, L.C. Centrality in Social Networks: Conceptual Clarification. Soc. Netw. 1979, 1, 215–239. [Google Scholar] [CrossRef] [Scilit]
- Page, L.; Brin, S.; Motwani, R.; Winograd, T. The PageRank Citation Ranking: Bringing Order to the Web; Technical Report; Stanford InfoLab: Palo Alto, CA, USA, 1999. [Google Scholar]
- Bonacich, P. Factoring and weighting approaches to status scores and clique identification. J. Math. Sociol. 1972, 2, 113–120. [Google Scholar] [CrossRef] [Scilit]
- Watts, D.J.; Strogatz, S.H. Collective dynamics of ‘small-world’ networks. Nature 1998, 393, 440–442. [Google Scholar] [CrossRef] [Scilit]
- Seidman, S.B. Network structure and minimum degree. Soc. Netw. 1983, 5, 269–287. [Google Scholar] [CrossRef] [Scilit]
- Newman, M. Networks, 2nd ed.; Oxford University Press: Oxford, UK, 2018. [Google Scholar]
- Blondel, V.D.; Guillaume, J.L.; Lambiotte, R. Fast unfolding of communities in large networks: 15 years later. arXiv 2023, arXiv:2311.06047. [Google Scholar] [CrossRef] [Scilit]
- Blondel, V.D.; Guillaume, J.L.; Lambiotte, R.; Lefebvre, E. Fast unfolding of communities in large networks. J. Stat. Mech. Theory Exp. 2008, P10008. [Google Scholar] [CrossRef] [Scilit]
- Traag, V.A.; Waltman, L.; van Eck, N.J. From Louvain to Leiden: Guaranteeing well-connected communities. Sci. Rep. 2019, 9, 5233. [Google Scholar] [CrossRef] [Scilit] [PubMed]
- Rosvall, M.; Bergstrom, C.T. Maps of random walks on complex networks reveal community structure. Proc. Natl. Acad. Sci. USA 2008, 105, 1118–1123. [Google Scholar] [CrossRef] [Scilit] [PubMed]
- Perozzi, B.; Al-Rfou, R.; Skiena, S. DeepWalk. In Proceedings of the 20th ACM SIGKDD International Conference on Knowledge Discovery and Data Mining; ACM: New York, NY, USA, 2014; pp. 701–710. [Google Scholar] [CrossRef] [Scilit]
- Grover, A.; Leskovec, J. node2vec: Scalable Feature Learning for Networks. In Proceedings of the 22nd ACM SIGKDD International Conference on Knowledge Discovery and Data Mining; ACM: New York, NY, USA, 2016; pp. 855–864. [Google Scholar] [CrossRef] [Scilit]
- Chung, F.R.K. Spectral Graph Theory: CBMS Conference on Recent Advances in Spectral Graph Theory, Held at California State University at Fresno, June 6–10, 1994, reprint ed.; Regional Conference Series in Mathematics; American Mathematical Society: Providence, RI, USA, 2009; Volume 92. [Google Scholar]
- Heidrich, M.; Heidemann, J.; Buchkremer, R.; Fernández de Bobadilla, G.W. ffstruc2vec: Flat, Flexible, and Scalable Learning of Node Representations from Structural Identities. Appl. Sci. 2026, 16, 1644. [Google Scholar] [CrossRef] [Scilit]
- Donnat, C.; Zitnik, M.; Hallac, D.; Leskovec, J. Learning Structural Node Embeddings via Diffusion Wavelets. In Proceedings of the 24th ACM SIGKDD International Conference on Knowledge Discovery and Data Mining; ACM: New York, NY, USA, 2018; pp. 1320–1329. [Google Scholar] [CrossRef] [Scilit]
- Ahmed, N.K.; Rossi, R.A.; Lee, J.B.; Willke, T.L.; Zhou, R.; Kong, X.; Eldardiry, H. Role-Based Graph Embeddings. IEEE Trans. Knowl. Data Eng. 2022, 34, 2401–2415. [Google Scholar] [CrossRef] [Scilit]
- Kipf, T.N.; Welling, M. Semi-Supervised Classification with Graph Convolutional Networks. In Proceedings of the 5th International Conference on Learning Representations (ICLR), Toulon, France, 24–26 April 2017. [Google Scholar] [CrossRef] [Scilit]
- Veličković, P.; Cucurull, G.; Casanova, A.; Romero, A.; Liò, P.; Bengio, Y. Graph Attention Networks. In Proceedings of the International Conference on Learning Representations (ICLR), Vancouver, BC, Canada, 30 April–4 May 2018. [Google Scholar] [CrossRef] [Scilit]
- Thakoor, S.; Tallec, C.; Azar, M.G.; Munos, R. Bootstrapped Representation Learning on Graphs. arXiv 2021, arXiv:2102.06514. [Google Scholar] [CrossRef] [Scilit]
- Barabási, A.L. Network Science; Cambridge University Press: Cambridge, UK, 2016. [Google Scholar]
- Gong, Y.; Liu, G.; Xue, Y.; Li, R.; Meng, L. A survey on dataset quality in machine learning. Inf. Softw. Technol. 2023, 162, 107268. [Google Scholar] [CrossRef] [Scilit]
- Farrukh, H.; Zafar, S.; Rehman, Z.U.; Shah, A.A.; Alshammry, N. Blockchain-Based Fraud Detection: A Comparative Systematic Literature Review of Federated Learning and Machine Learning Approaches. Electronics 2025, 14, 4952. [Google Scholar] [CrossRef] [Scilit]
- Liao, J.C.; Li, C.T. TabGSL: Graph Structure Learning for Tabular Data Prediction. arXiv 2023, arXiv:2305.15843. [Google Scholar] [CrossRef] [Scilit]
- Imran, G.; Rashid, M.M.; Sultana, N.; Farzana, W.; Jony, M.R.H.; Mridha, M.F.; Alfarhood, S.; Safran, M.; Che, D. Tabular and graph-based representations for noise and missing data in robust machine learning. Array 2026, 29, 100697. [Google Scholar] [CrossRef] [Scilit]
- Machine Learning and Graph Signal Processing Applied to Healthcare: A Review. Bioengineering 2024, 11, 671. [CrossRef] [Scilit]
- Zhou, J.; Cui, G.; Hu, S.; Zhang, Z.; Yang, C.; Liu, Z.; Wang, L.; Sun, M. Graph Neural Networks: A Review of Methods and Applications. AI Open 2020, 1, 57–81. [Google Scholar] [CrossRef] [Scilit]
- Jin, J.; Heimann, M.; Jin, D.; Koutra, D. Toward Understanding and Evaluating Structural Node Embeddings. ACM Comput. Surv. 2021, 16, 58. [Google Scholar] [CrossRef] [Scilit]
- Liu, Y.; Jin, M.; Pan, S.; Zhou, C.; Zheng, Y.; Xia, F.; Yu, P.S. Graph Self-Supervised Learning: A Survey. IEEE Trans. Knowl. Data Eng. 2023, 35, 5879–5900. [Google Scholar] [CrossRef] [Scilit]
- Ju, W.; Wang, Y.; Qin, Y.; Mao, Z.; Xiao, Z.; Luo, J.; Yang, J.; Gu, Y.; Wang, D.; Long, Q.; et al. Towards Graph Contrastive Learning: A Survey and Beyond. arXiv 2024, arXiv:2405.11868. [Google Scholar] [CrossRef] [Scilit]
- Chen, T.; Guestrin, C. XGBoost: A Scalable Tree Boosting System. In Proceedings of the 22nd ACM SIGKDD International Conference on Knowledge Discovery and Data Mining; Krishnapuram, B., Shah, M., Smola, A., Aggarwal, C., Shen, D., Rastogi, R., Eds.; ACM: New York, NY, USA, 2016; pp. 785–794. [Google Scholar] [CrossRef] [Scilit]
- Yang, Z.; Cohen, W.W.; Salakhutdinov, R. Revisiting Semi-Supervised Learning with Graph Embeddings. In Proceedings of the 33rd International Conference on Machine Learning; JMLR: Cambridge, MA, USA, 2016; Volume 48, pp. 40–48. [Google Scholar]
- McNemar, Q. Note on the sampling error of the difference between correlated proportions or percentages. Psychometrika 1947, 12, 153–157. [Google Scholar] [CrossRef] [Scilit]
- Pembury Smith, M.Q.R.; Ruxton, G.D. Effective use of the McNemar test. Behav. Ecol. Sociobiol. 2020, 74, 133. [Google Scholar] [CrossRef] [Scilit]
- Freitas, S.; Yang, D.; Kumar, S.; Tong, H.; Chau, D.H. Graph Vulnerability and Robustness: A Survey. IEEE Trans. Knowl. Data Eng. 2023, 35, 5915–5934. [Google Scholar] [CrossRef] [Scilit]
- Wang, M.; Zheng, D.; Ye, Z.; Gan, Q.; Li, M.; Song, X.; Zhou, J.; Ma, C.; Yu, L.; Gai, Y.; et al. Deep Graph Library: A Graph-Centric, Highly-Performant Package for Graph Neural Networks. In Proceedings of the 14th USENIX Symposium on Operating Systems Design and Implementation; USENIX Association: Berkeley, CA, USA, 2020; pp. 120–134. [Google Scholar] [CrossRef] [Scilit]
- Lundberg, S.M.; Lee, S.I. A Unified Approach to Interpreting Model Predictions. In Advances in Neural Information Processing Systems; Curran Associates, Inc.: Red Hook, NY, USA, 2017; Volume 30, pp. 4765–4774. [Google Scholar]
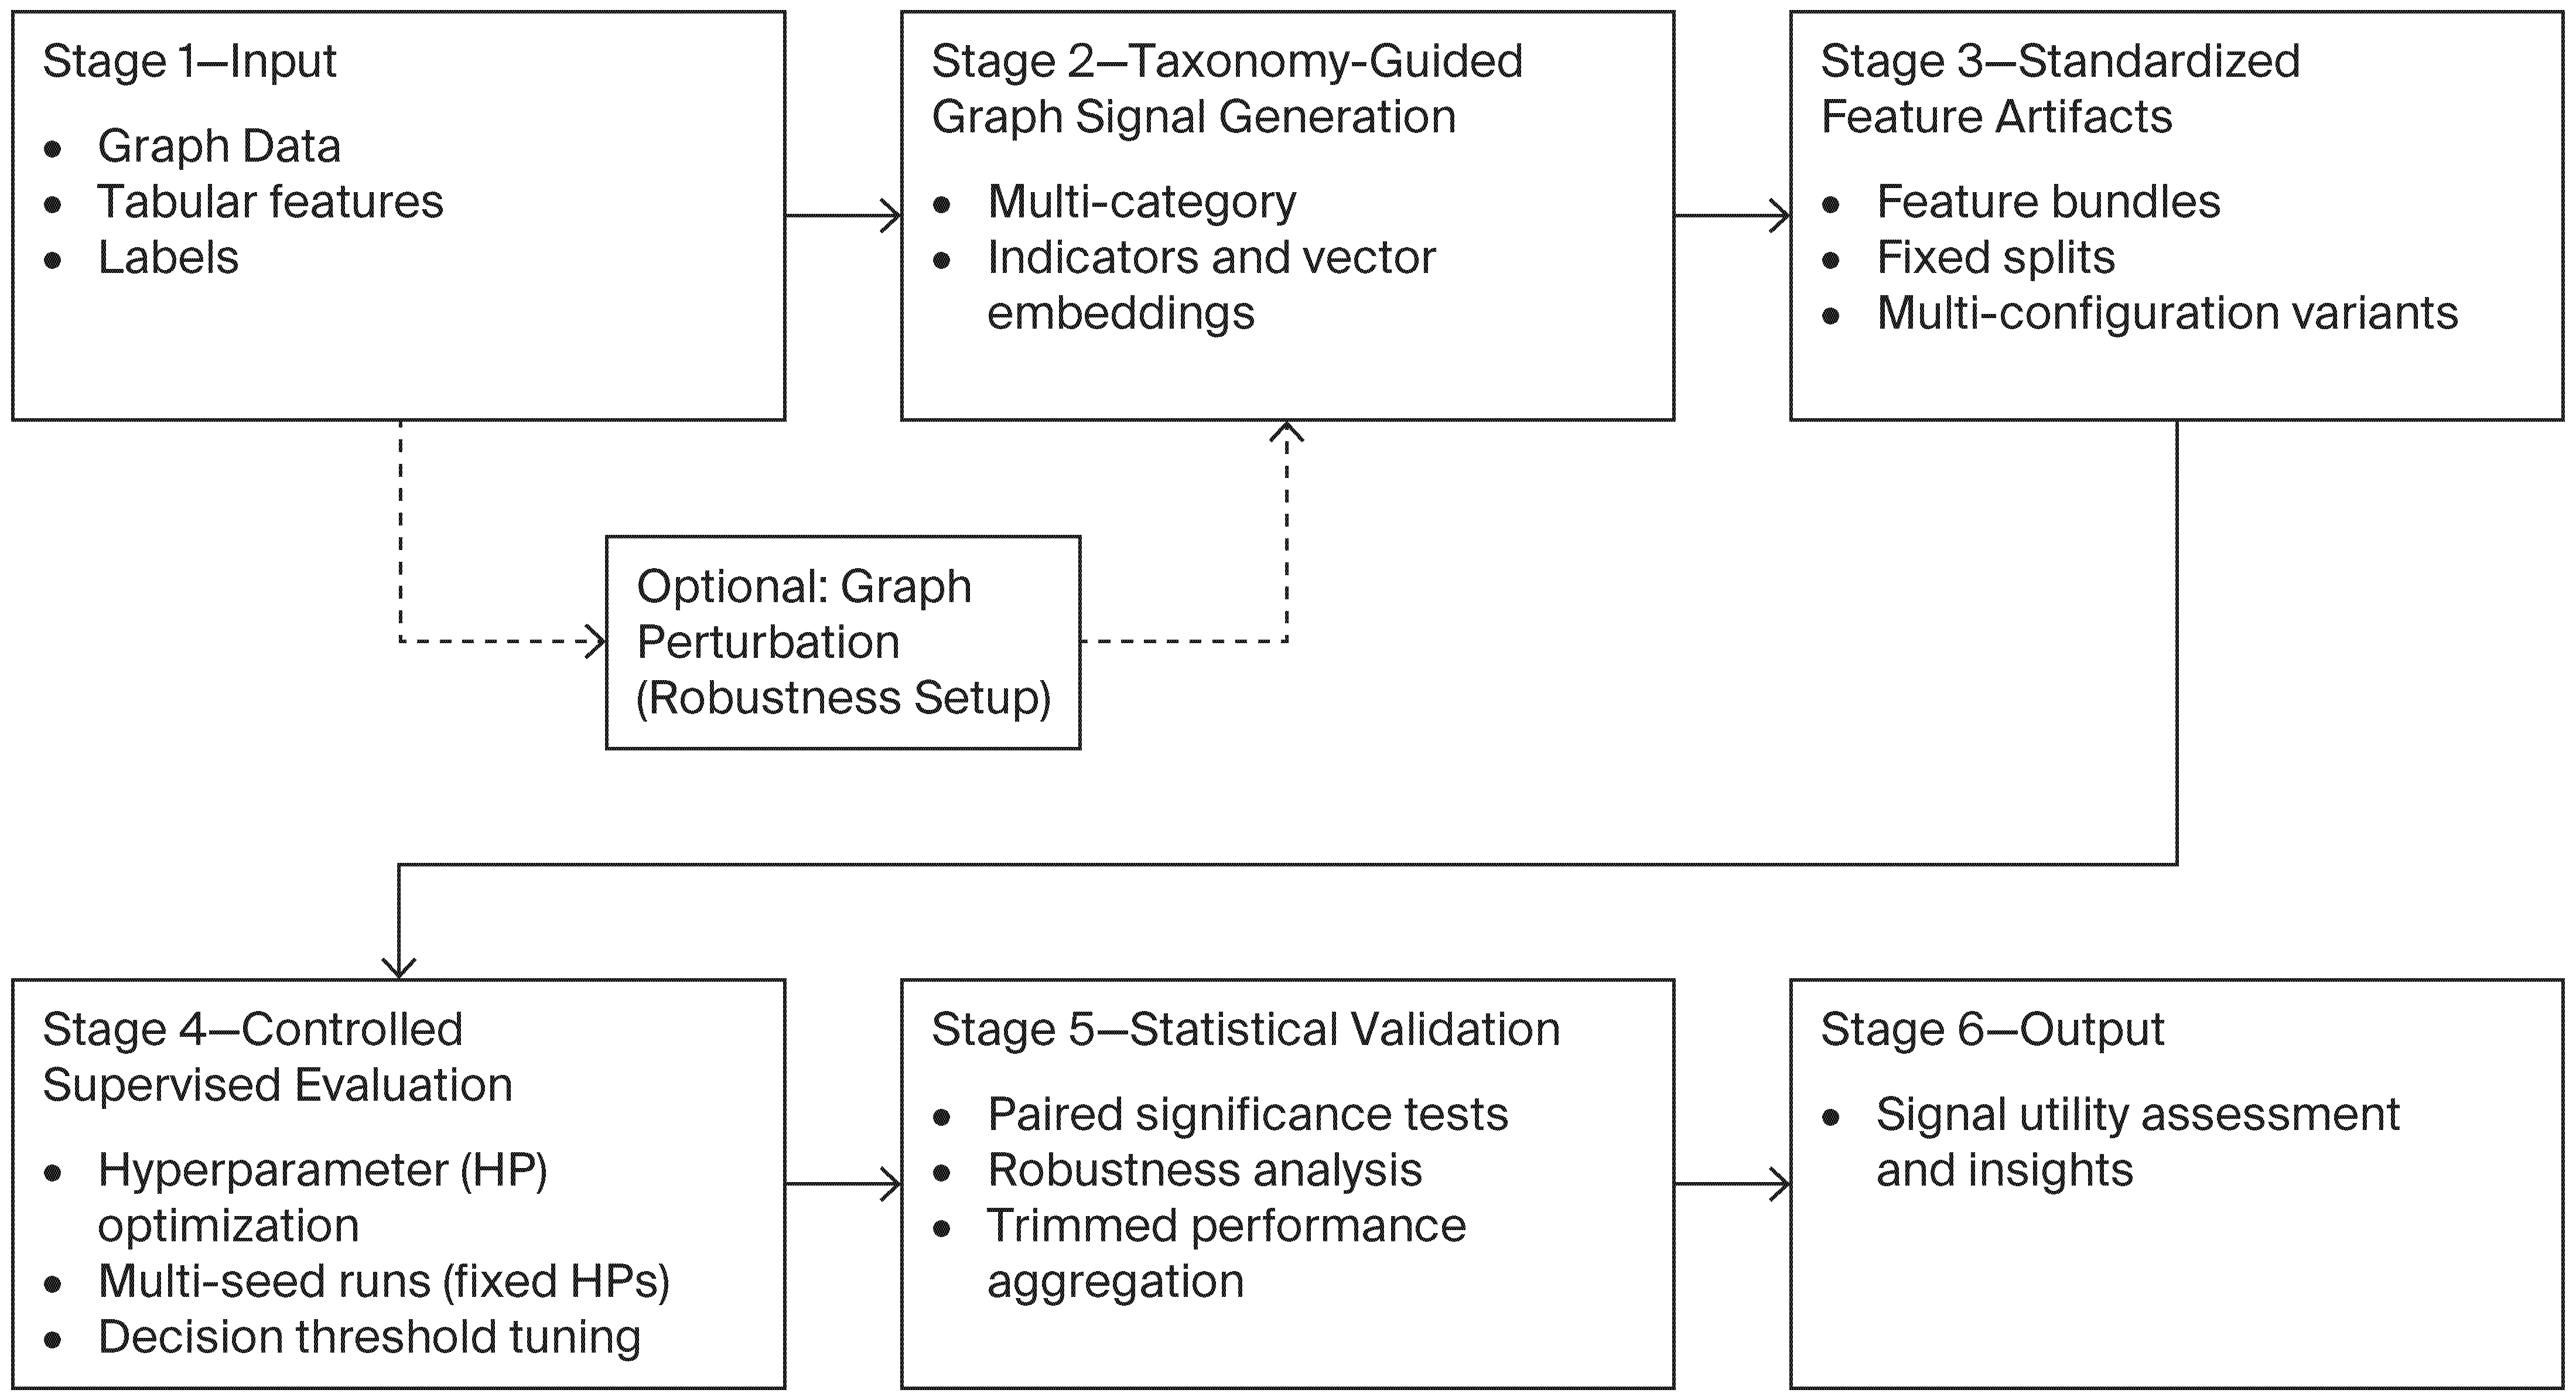
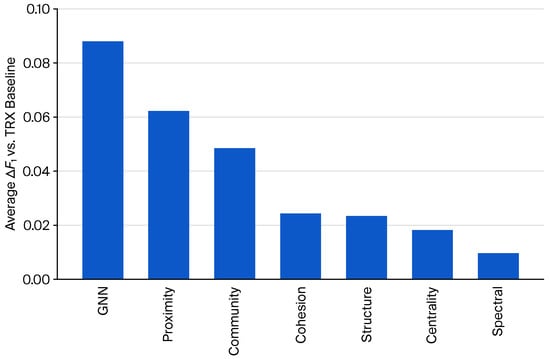
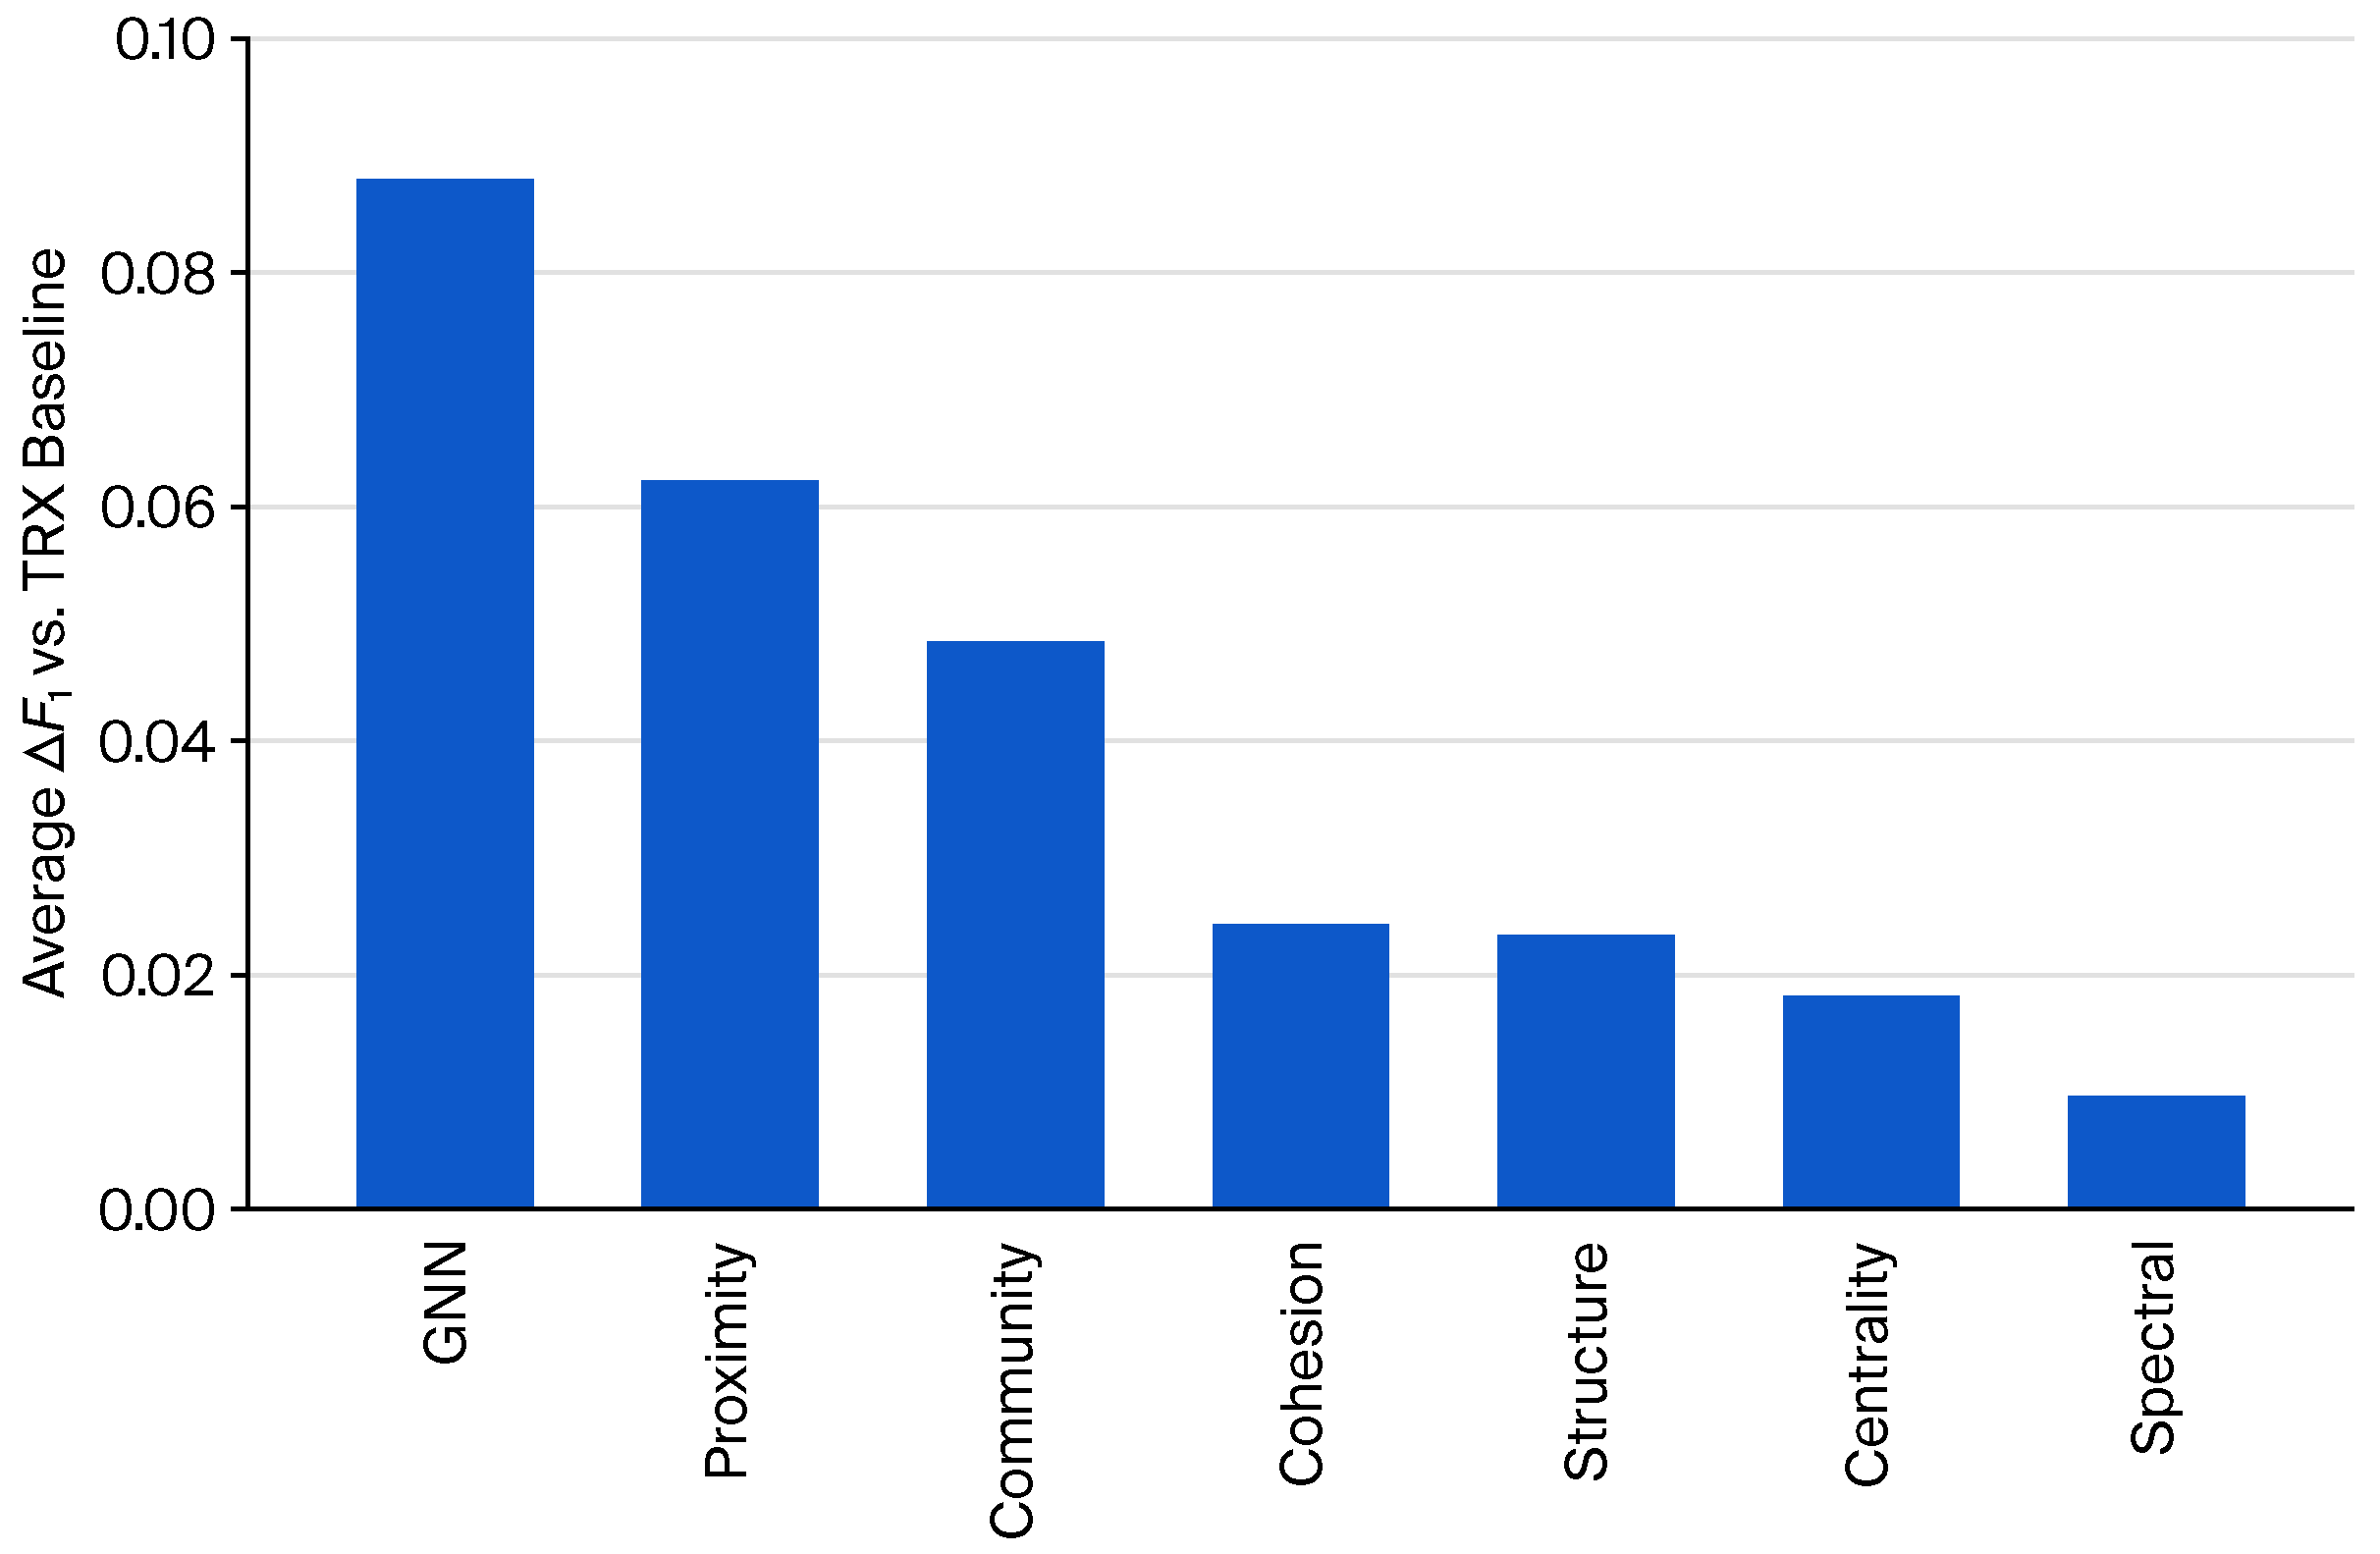
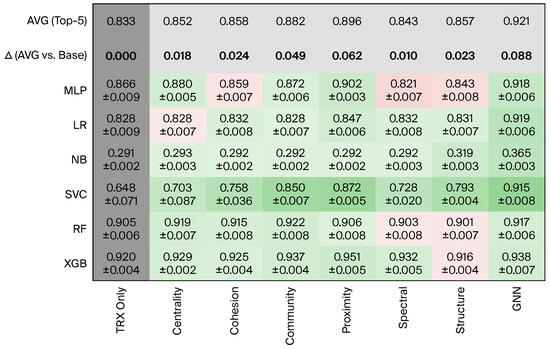
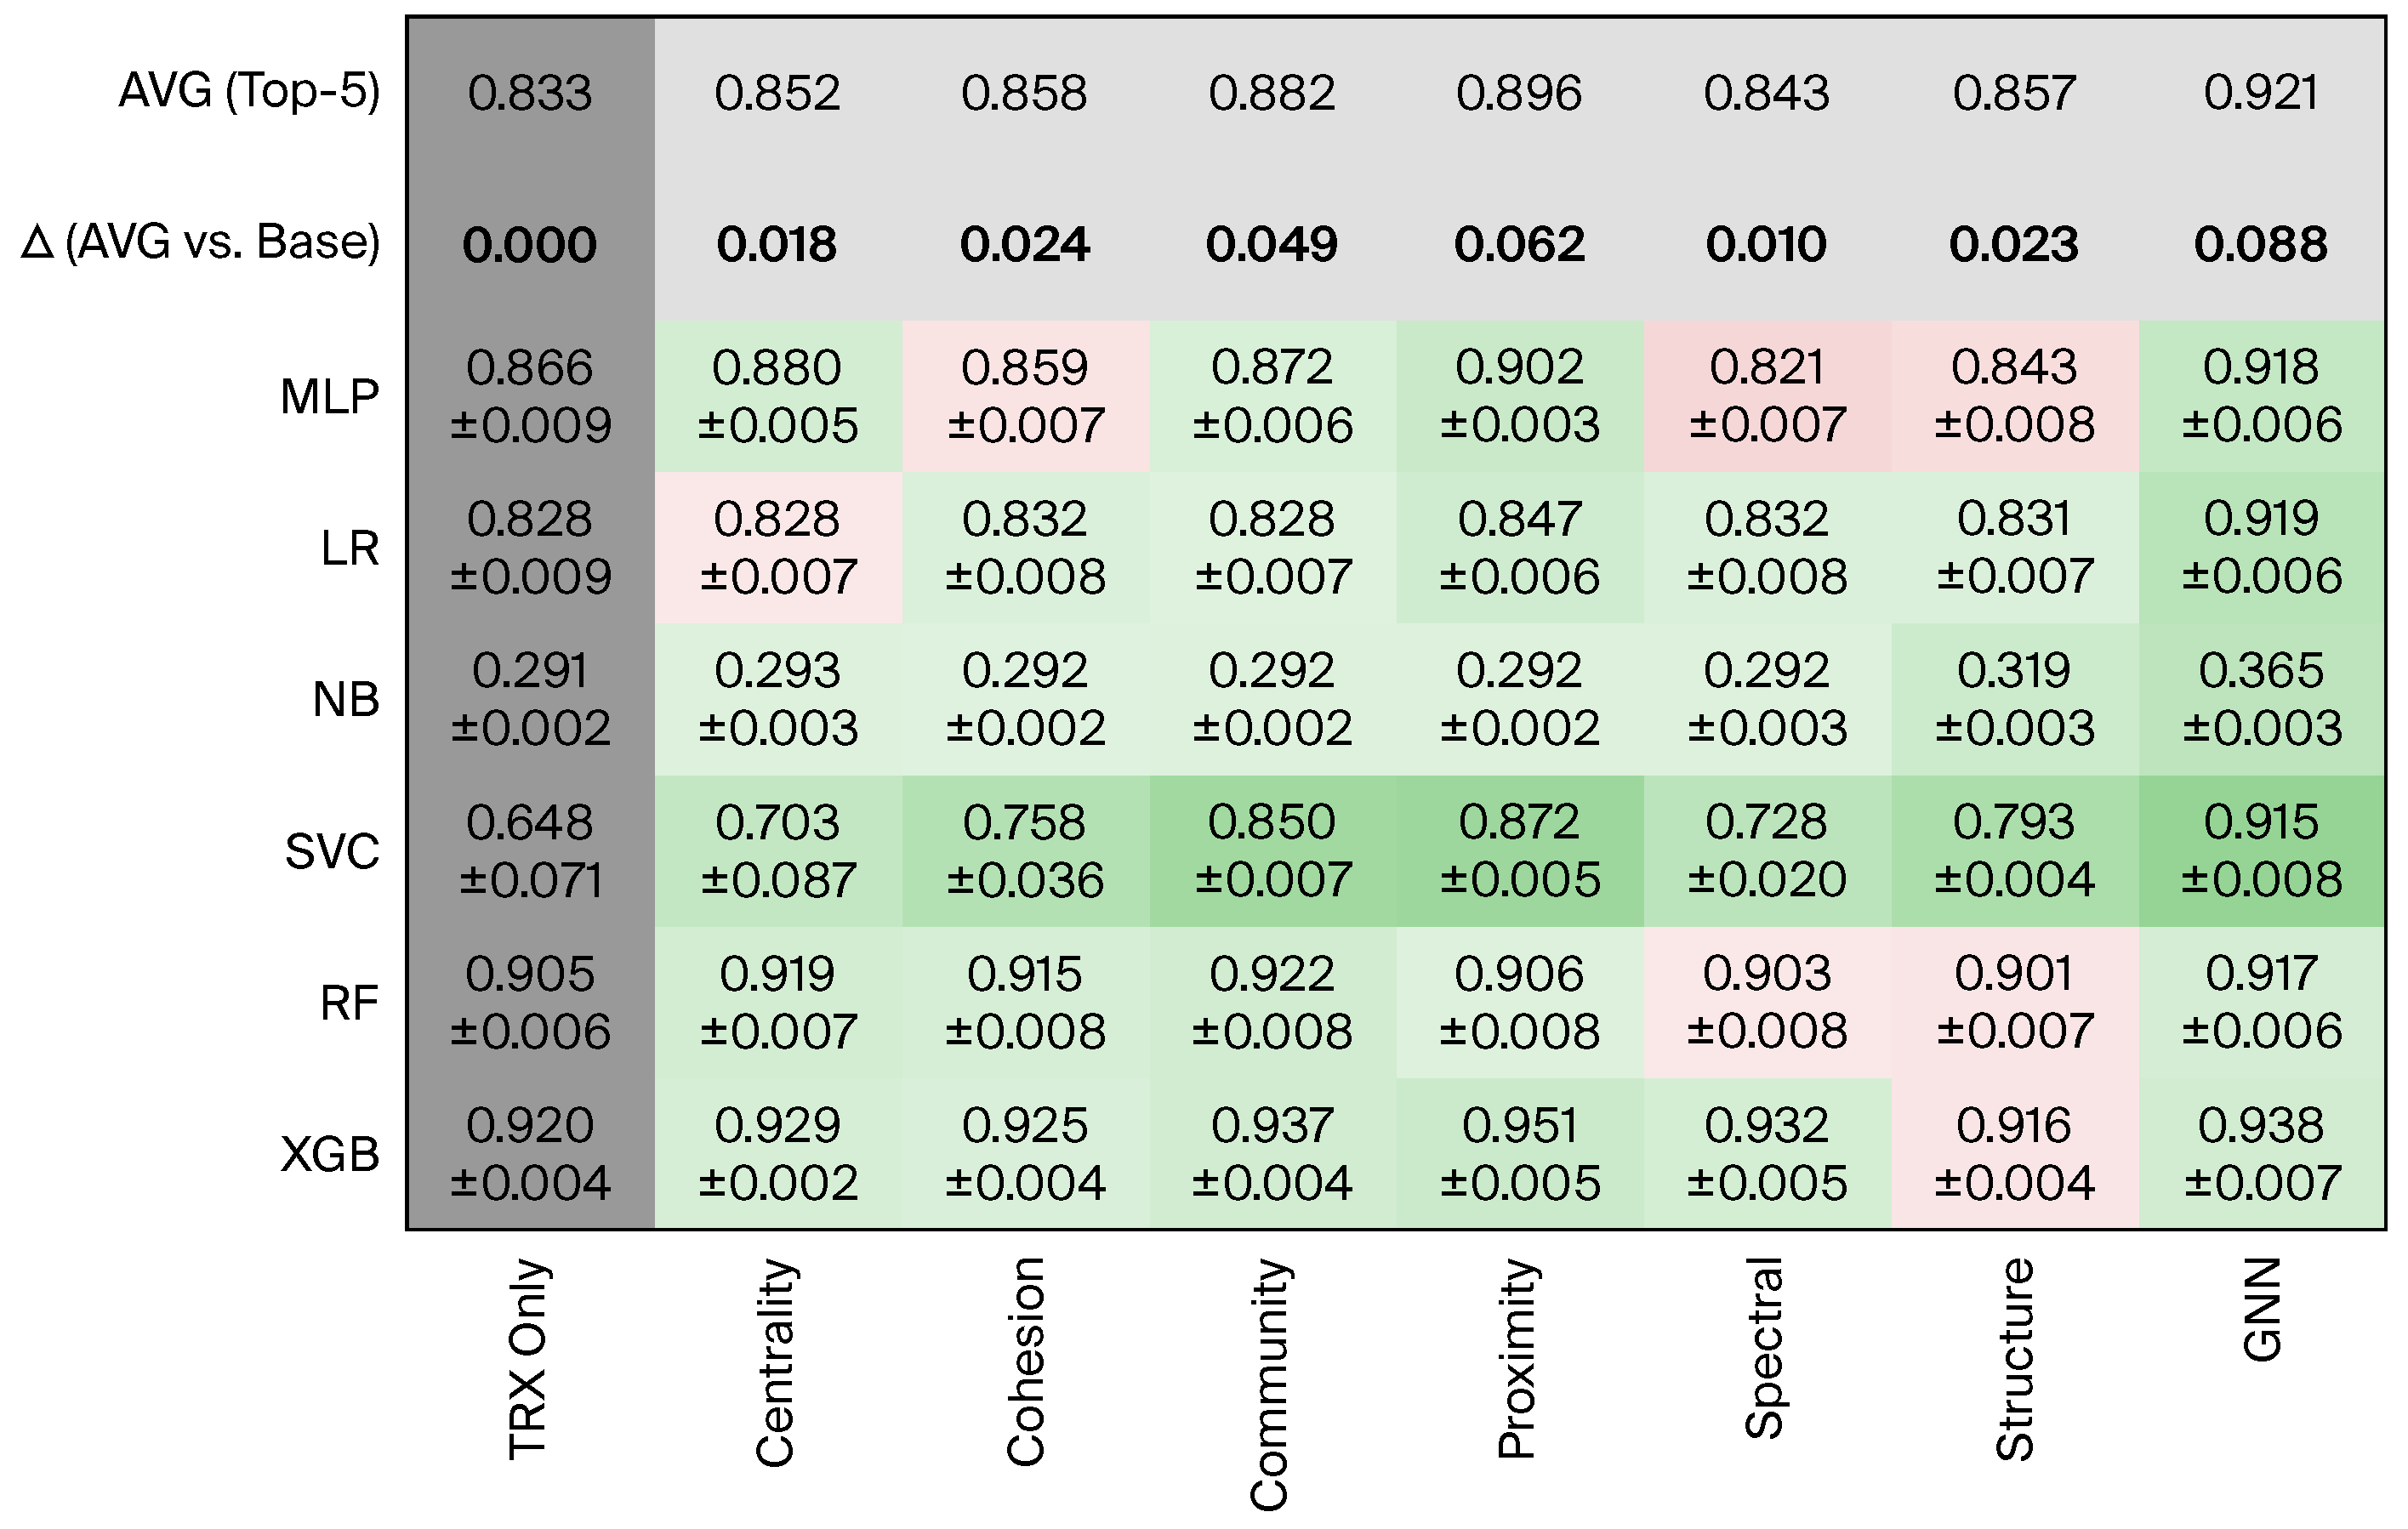
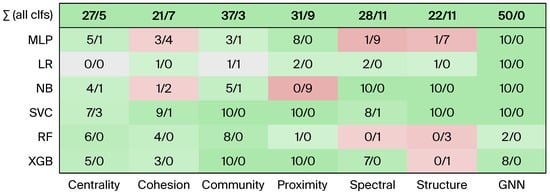
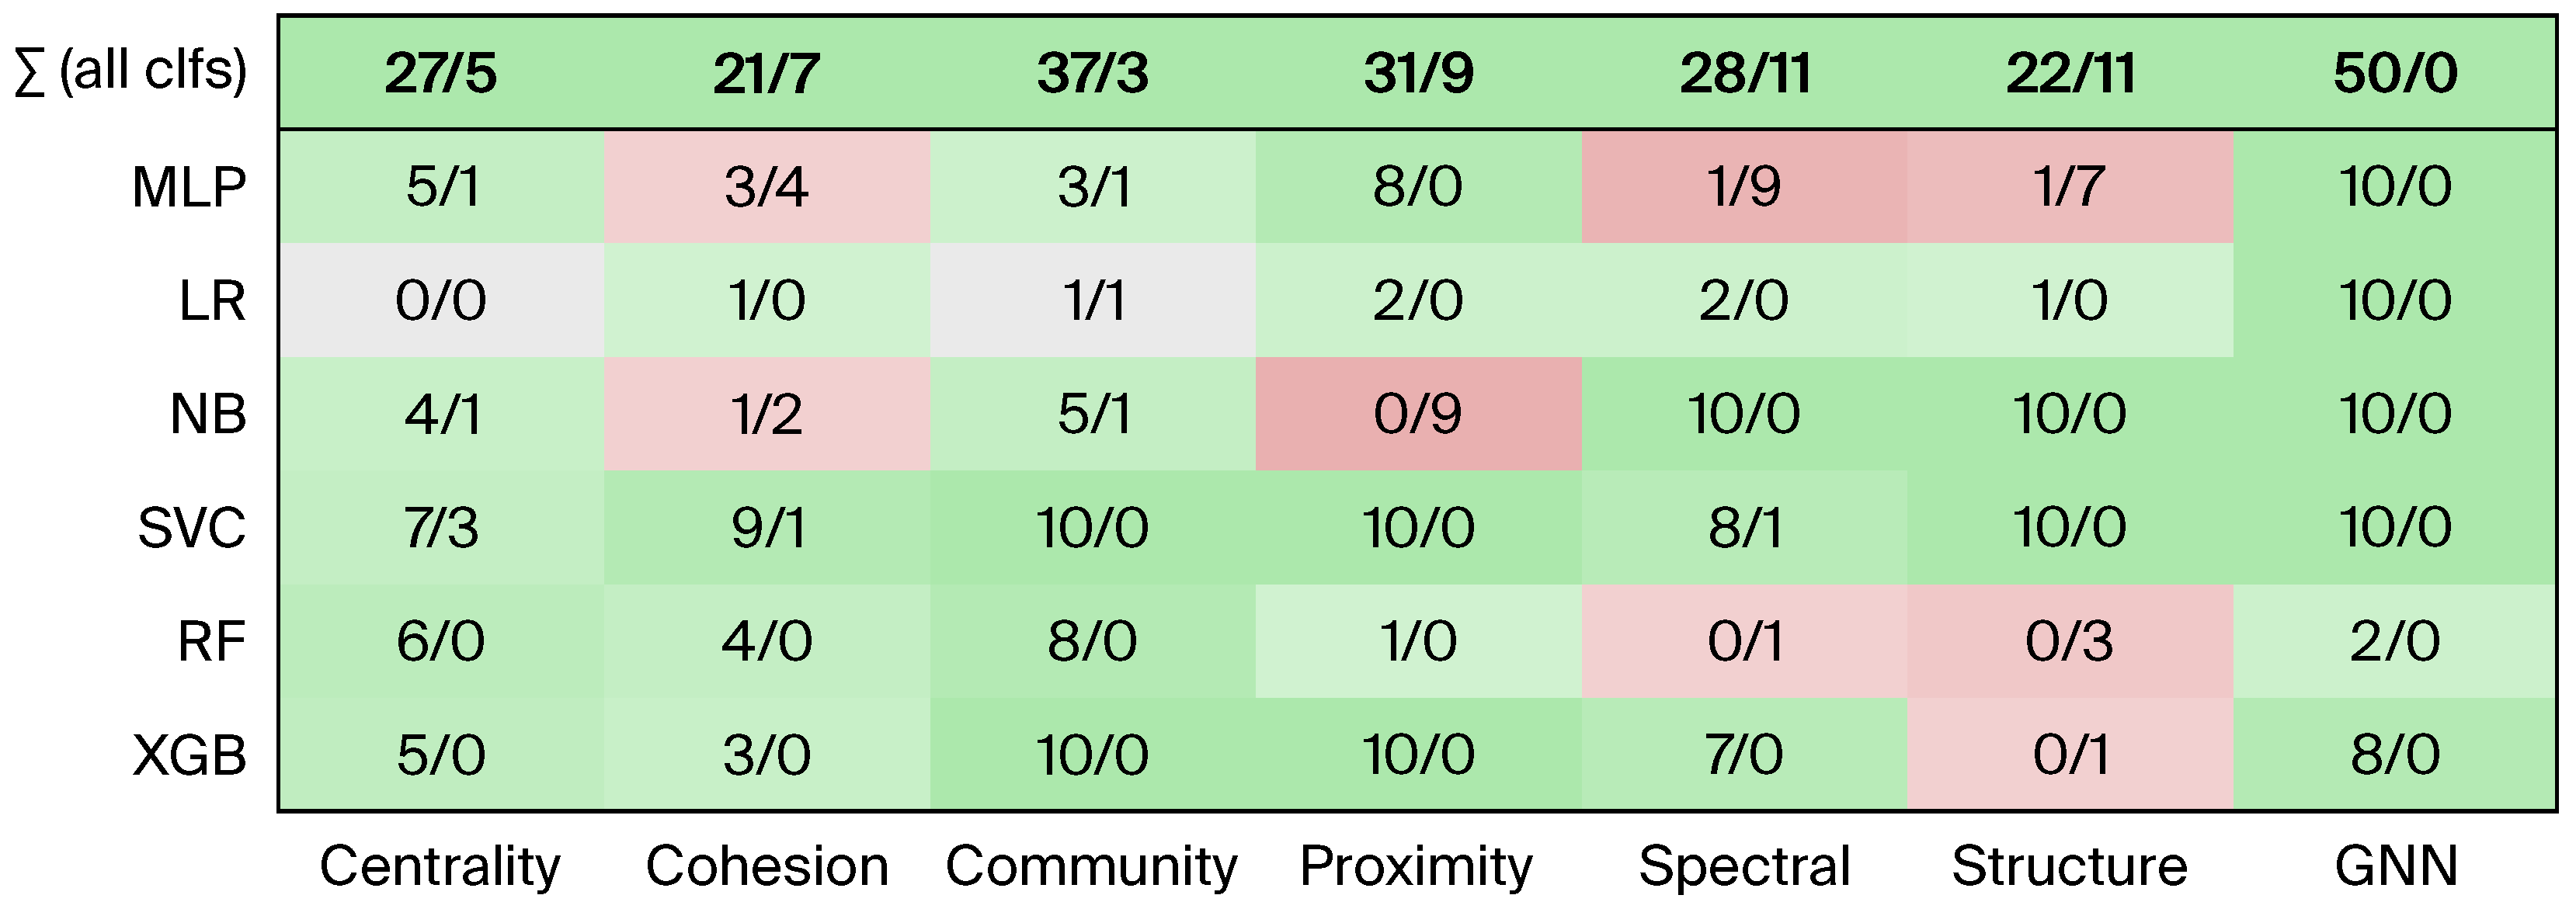
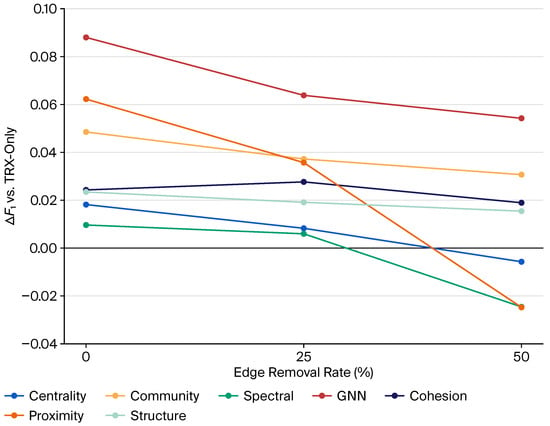
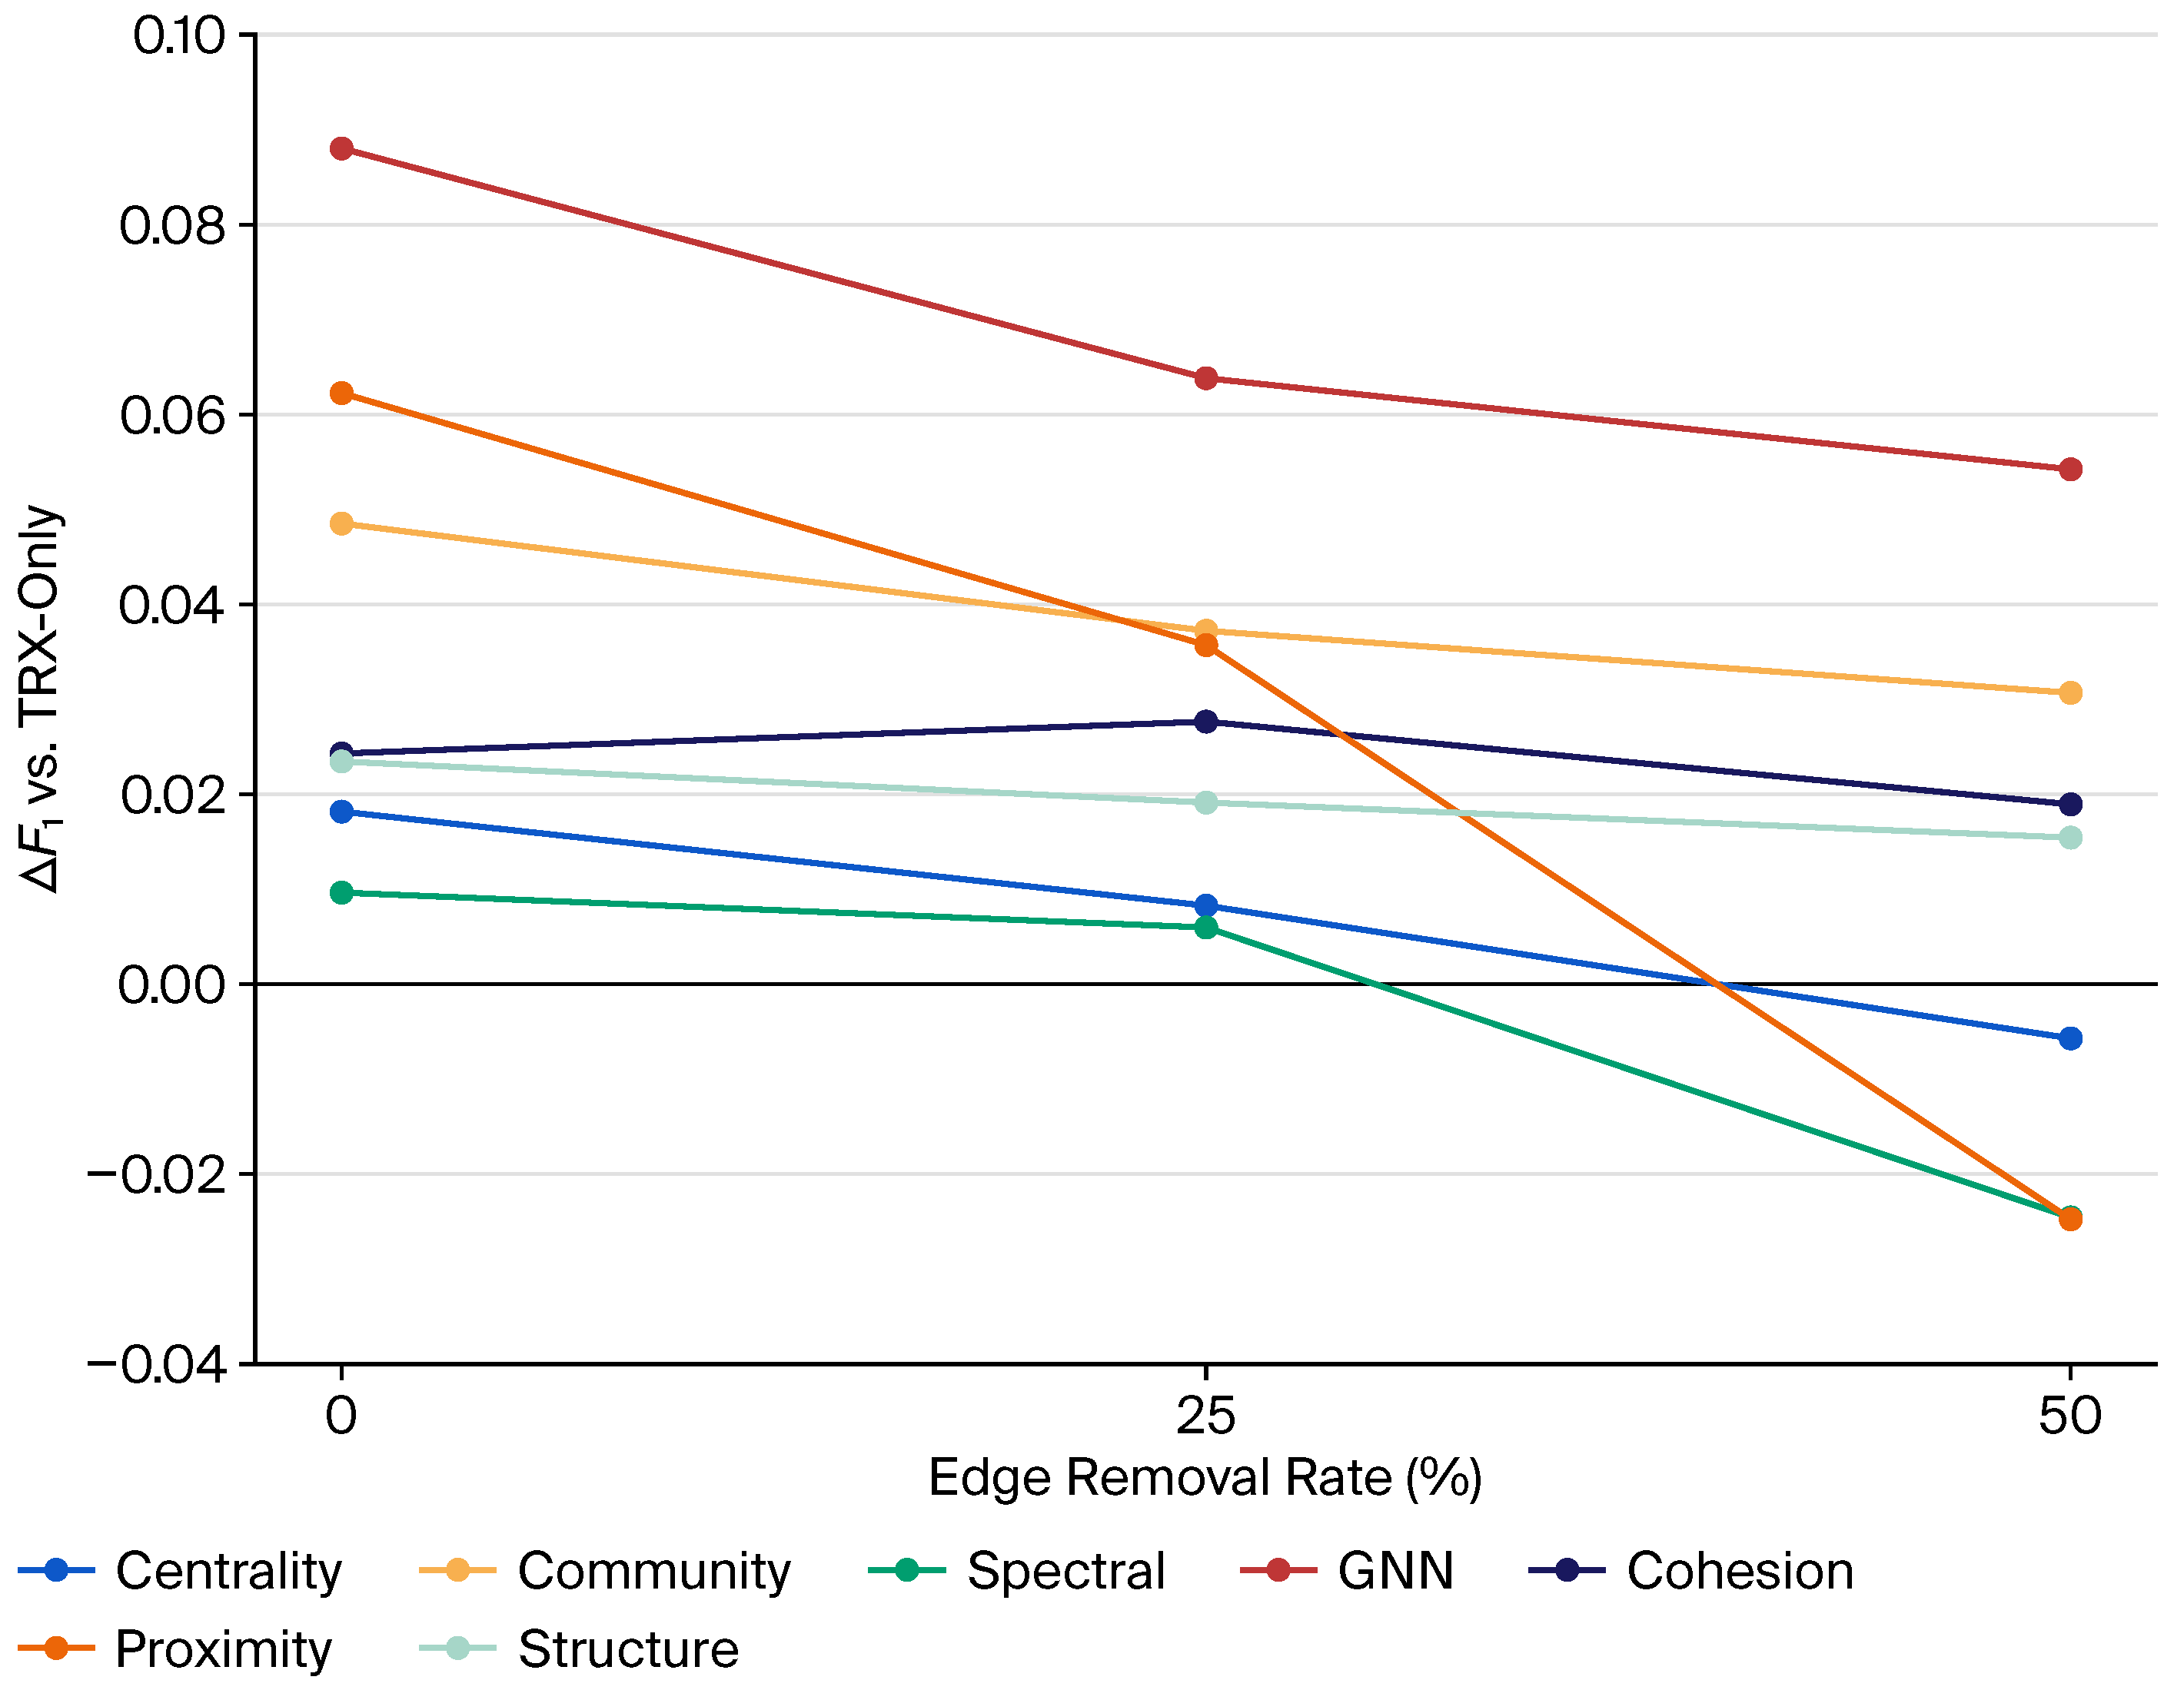

Disclaimer/Publisher’s Note: The statements, opinions and data contained in all publications are solely those of the individual author(s) and contributor(s) and not of MDPI and/or the editor(s). MDPI and/or the editor(s) disclaim responsibility for any injury to people or property resulting from any ideas, methods, instructions or products referred to in the content. |
© 2026 by the authors. Licensee MDPI, Basel, Switzerland. This article is an open access article distributed under the terms and conditions of the Creative Commons Attribution (CC BY) license.