


Abstract
Vapour-compression refrigeration and cooling systems represent a significant share of global electricity consumption, being estimated to account for approximately 10% to 20% of the worldwide electricity demand, which highlights their critical impact on energy efficiency and sustainability. In this context, improving the thermodynamic and exergoeconomic performance of refrigeration cycles, as well as the appropriate selection of the refrigerant, has become a key research priority. Therefore, this work aims to comparatively evaluate the energy, exergy, exergy cost, and exergoeconomic performance of three vapour-compression refrigeration cycle configurations: a simple cycle, a two-stage cycle with a flash tank, and a two-stage cycle with a flash tank and a mixing chamber. Six refrigerants (R134a, R600a, R290, R1234yf, R1234ze (E), and R717) were analysed under evaporation temperatures of 228–238 K and condensation temperatures of 298–308 K. The performance evaluation was carried out using the Fuel–Product–Residue (FPR) methodology, considering the coefficient of performance (COP), exergy efficiency, system irreversibilities, and exergy and exergoeconomic costs. The results indicate that the incorporation of the mixing chamber increases the COP by up to 7% and the exergy efficiency by up to 6% compared to the simple cycle, while reducing exergoeconomic costs by up to 10% for the most favourable refrigerants. Among the working fluids analysed, R600a exhibits the best overall performance (COP up to 4.3 and an exergy efficiency of 33%), followed by R290 and R717, whereas R1234yf shows the lowest efficiencies (COP ≈ 3.7 and exergy efficiency ≈ 28%) and the highest exergoeconomic costs. These findings demonstrate that the design of vapour-compression refrigeration systems should involve the joint selection of the cycle configuration and the refrigerant based on integrated energy, exergy, and exergoeconomic criteria. Overall, the results highlight that both the refrigerant and the cycle configuration must be selected simultaneously, considering energy, exergy, and exergoeconomic criteria, to achieve more efficient and sustainable industrial applications.
1. Introduction
The increase in global energy demand has led to a significant rise in energy prices, creating an urgent need to reduce energy consumption and decrease dependence on conventional resources such as crude oil and natural gas [1,2]. In response, the use of alternative energy sources (solar, biomass, geothermal, and wind) has been promoted to alleviate this pressure, particularly in the industrial sector [3]. In this sector, electric motors, refrigeration, and air-conditioning systems account for a substantial share of energy consumption due to the intensive use of compressors [4,5].
Refrigeration and air conditioning play a fundamental role in modern life, ensuring thermal comfort, improving quality of life, and supporting a wide range of industrial processes. Their energy consumption, however, is estimated at 26–30% of total global energy use, contributing significantly to global warming and, in some cases, to ozone layer depletion [6]. International regulations aimed at mitigating climate change therefore demand more efficient and environmentally responsible technologies. In this context, the selection of refrigerants with low global warming potential (GWP), such as hydrofluoroolefins (HFOs), has gained increasing importance as a pathway toward more sustainable refrigeration [7].
Since compressors constitute the primary source of energy consumption in refrigeration and air-conditioning systems, their optimisation is essential. One approach to reducing energy consumption is to approximate the compression process to an internally reversible compression, thereby decreasing irreversibilities associated with friction and turbulence, although such improvements are often limited by economic constraints [8]. Another effective strategy is to reduce the specific volume of the gas through precooling and intercooling during compression, as volume is proportional to temperature, thereby lowering both the required energy and operating costs [9].
Vapour-compression refrigeration systems are widely used in both air-conditioning applications and industrial refrigeration. However, when the pressure ratio exceeds approximate values of 4 to 5, single-stage compression becomes inefficient due to increased compression work and high discharge temperatures. For this reason, the process is divided into multiple compression stages. In each stage, the gas is compressed, cooled, and then transferred to the next stage until the final discharge pressure is reached [10,11]. Multistage compression reduces the total energy consumption of the cycle, particularly when the pressure ratio is high. The energy savings depend on both the number of stages and the optimal distribution of the total pressure ratio, defined as [12]. For a constant isentropic efficiency , the ideal pressure ratio per stage is given by:
The performance of refrigeration systems has been widely investigated both experimentally and theoretically. First-law (energy) analysis evaluates energy conservation, while second-law (exergy) analysis identifies irreversibilities and quantifies exergy destruction in each component, providing a rigorous basis for improving the overall efficiency of refrigeration systems [13,14,15].
In both industrial and domestic applications, refrigeration systems capable of operating over a wide temperature range are required, from values close to absolute zero (≈4 K) to conditions near ambient temperature (≈300 K); therefore, system selection depends on the required cooling capacity as well as investment and operating costs [16]. The selection of the refrigerant in two-stage compression systems is critical, as it directly affects the energetic, exergetic, and environmental performance of the cycle. The refrigerant must exhibit suitable thermodynamic properties across different pressure and temperature levels, ensuring stability and efficiency during intermediate compression, condensation, and evaporation.
Traditionally, halogenated refrigerants have been widely used due to their high efficiency, chemical stability, and compatibility with conventional materials. R134a (1,1,1,2-tetrafluoroethane) has been one of the most common options for medium-temperature applications owing to its favourable thermodynamic behaviour and operational reliability. Ammonia (R717), in turn, has historically served medium- and large-capacity industrial applications because of its excellent thermodynamic performance, high COP, and high exergy efficiency, combined with zero ODP and zero GWP; its toxicity and safety requirements, however, have limited domestic use. The high global warming potential of R134a (GWP ≈ 1430) has driven the search for more sustainable alternatives [17].
Refrigerants such as R404A and R507A, traditionally employed in commercial and industrial applications due to their good performance and operational stability, face increasing restrictions because of their high GWP, with values close to 3920 and 3985, respectively [18,19]. In response to these limitations, natural refrigerants such as ammonia (R717) and carbon dioxide (R744) have re-emerged as viable alternatives [20,21,22]. Within the group of natural refrigerants, hydrocarbons, particularly R290 (propane) and R600a (isobutane), have gained increasing interest as substitutes for high-GWP synthetic refrigerants; both exhibit zero ODP and GWP values below 5. R290 is characterised by high refrigeration capacity and moderate operating pressures, making it suitable for commercial applications and higher-capacity systems. In contrast, R600a operates at lower pressures and exhibits lower irreversibilities during the compression process, making it especially attractive for low-capacity systems and multistage configurations. Nevertheless, the high flammability of both refrigerants (A3 classification) imposes limitations on refrigerant charge and requires compliance with specific safety regulations [23,24]. More recently, refrigerants from the HFO family, such as R1234yf and R1234ze (E), have been established as direct substitutes for R134a in medium-temperature applications due to their low GWP (below 1), similar thermodynamic properties, and moderate flammability (A2L classification). Their rapid adoption is attributed to their balance between energy efficiency, reduced environmental impact, and compatibility with existing technologies [25,26,27].
Exergoeconomic analysis overcomes the limitations of conventional design methods, which often lead to oversized equipment and efficiency losses, by integrating thermodynamic, economic, and environmental principles to relate exergy destruction explicitly to costs and overall system performance [13,28,29]. The exergy cost theory developed by Valero provides a rigorous framework for assigning costs to energy flows and establishing causal relationships between resource consumption and economic costs [30]. Early applications by d’Accadia in industrial plants demonstrated its usefulness in identifying dominant irreversibilities [31], and subsequent studies extended the approach to single-stage compression cycles, optimising key operating parameters [32,33]. In two-stage and multistage configurations, exergoeconomics has enabled the evaluation of cost redistribution and simultaneous improvements in exergy efficiency, COP, and operating costs through multi-objective optimisation [34,35]. Complementary approaches, such as the advanced exergy analysis of Tsatsaronis, further distinguish between avoidable and unavoidable exergy destruction [36]. Additionally, virtual sample-based methods have been proposed for the monitoring and calibration of thermal systems, such as those developed by Sun et al. [37,38], which employ autoencoders and large language models (LLMs) to optimise information and enable fault diagnosis without extensive operational datasets, highlighting the growing incorporation of data-driven techniques in the analysis and optimisation of thermal systems. Based on the above, this work develops a comparative exergoeconomic study of three vapour-compression refrigeration system configurations: a single–stage (simple) system, a two-stage system with a flash tank, and a two-stage system with a flash tank and a mixing chamber. Unlike previous studies that typically address only energy or exergy performance, the present research evaluates exergy destruction, exergy cost, and exergoeconomic cost using the Fuel–Product–Residue (FPR) methodology. The principal contribution is the systematic comparison of advanced refrigeration configurations and multiple refrigerants under identical operating conditions, including synthetic low-GWP refrigerants and natural refrigerants such as ammonia (R717). The study quantifies exergy destruction and the costs associated with each component, identifies the components that contribute most to residue formation, particularly the condenser (an aspect scarcely addressed in the literature), and analyses the combined effect of intercooling type and refrigerant selection on exergy efficiency, COP, and exergoeconomic costs. These results provide objective criteria for the design and operation of more efficient and sustainable refrigeration systems.
2. Case Study
2.1. Description of the Simple and Two-Stage Configurations of the Vapour-Compression Refrigeration Cycle
Vapour-compression refrigeration remains the dominant technology for cooling applications ranging from domestic appliances to industrial cold storage. The basic cycle, shown schematically in Figure 1, circulates a working fluid through four processes: compression of low-pressure vapour, heat rejection at high pressure, throttling to the low-pressure side, and heat absorption in the evaporator. Under moderate temperature lifts, a single compressor efficiently handles the entire pressure ratio. However, as the temperature difference between the cold and hot reservoirs increases, single-stage compression faces fundamental limitations that motivate the use of multistage configurations.
Figure 1.
Schematic diagrams of the simple vapour-compression cycle and two-stage refrigeration system configurations: Simple, FIC, and FIC + MC.
The pressure ratio is a key parameter for compressor performance. When exceeds approximately 8–10, corresponding to temperature lifts above 50–60 K, single-stage compression is limited by several effects [39]. These include the reduction of volumetric efficiency in positive-displacement compressors due to the re-expansion of residual vapour in the clearance volume during suction; the increase in discharge temperatures, which can degrade the lubricating oil and damage components such as valves; and the deviation from isothermal compression, which increases thermodynamic irreversibilities. Two-stage compression with intercooling mitigates these limitations by splitting the pressure ratio into two smaller steps and removing superheat between stages.
This work analyses two configurations of two-stage vapour-compression refrigeration cycles, as shown in Figure 1. Each configuration combines a low-pressure (LP) cycle and a high-pressure (HP) cycle connected through an intercooling system. The compression process is split between a low-pressure compressor (LPC), operating from to , and a high-pressure compressor (HPC), operating from to . The main difference between the two configurations lies in how the superheated vapour leaving the LPC is conditioned before entering the HPC.
The low-pressure (LP) cycle begins when the refrigerant exits the evaporator as saturated vapour at state 1 (, ). The low-pressure compressor (LPC) compresses this vapour, increasing its pressure from to , and its temperature from to . This compression requires a power input of .
The superheated vapour leaving the LPC at state 2 enters the intermediate cooling system, where it undergoes isobaric cooling at until reaching state 8 (, ). This process optimises energy consumption for subsequent compression in the high-pressure compressor (HPC).
In this study, two distinct configurations of the intermediate cooling system are explored:
- Configuration with flash intercooling chamber (Figure 1): In this arrangement, a flash intercooling chamber (FIC) functions as the primary cooling mechanism. The superheated vapour from the low-pressure cycle (state 2) is cooled and condensed through interaction with the partially evaporated liquid from the throttling process (state 6). This heat exchange improves system efficiency by increasing the refrigerant mass flow rate towards the HPC, by combining the vapour streams from both the low-pressure cycle and the evaporated fraction of liquid from the low-pressure expansion valve (LPEV).
- Configuration with flash intercooling and vapour-mixing chambers (Figure 1): This configuration integrates both a flash intercooling chamber (FIC) and a vapour-mixing chamber (MC) to optimise the intermediate cooling process. The system manages two distinct flow paths: the superheated vapour from the LPC (state 2) is directed to the MC, while the liquid-vapour mixture from the HPEV (state 6) enters the FIC. Within the FIC, the mixture separates into its constituent phases: saturated liquid (state 8) and saturated vapour (state 7). Subsequently, the MC facilitates mixing of the saturated vapour from the FIC with the superheated vapour from the LPC, resulting in a higher vapour mass flow rate at state 3. Meanwhile, the saturated liquid fraction (state 8) is directed towards the LPEV for subsequent processing.
The vapour at state 3 undergoes further compression in the HPC, raising its pressure from to and its temperature from to , with a power input . The resulting superheated vapour enters the condenser at state 4, where it releases heat to the surrounding medium, desuperheats, and condenses to a saturated liquid at state 5 (). This liquid then passes through the HPEV, undergoing an isenthalpic expansion from to and producing a liquid–vapour mixture at state 6 ().
The refrigerant leaving the intermediate cooling system (state 8) expands through the LPEV to evaporator pressure (state 9). In the evaporator, the low-pressure mixture absorbs heat from the refrigerated space, evaporating to saturated vapour at state 1 and completing the cycle. The operation of these configurations is governed by two main parameters: the evaporation temperature () and the condensation temperature (). For the two-stage configurations, an intermediate pressure () is additionally introduced to define the interaction between the LP and HP cycles.
2.2. Operating Conditions and Refrigerant Selection
Table 1 lists the operating conditions adopted for all configurations. An evaporation temperature of 238 K was chosen because it corresponds to low-temperature refrigeration applications such as frozen food storage, cold chambers, and industrial freezing processes, assuming a constant refrigerated space (cold chamber) temperature of 243 K as the thermal boundary condition for the evaporator. A reference cooling capacity of 100 kW was imposed, representing medium-scale industrial refrigeration systems. Similarly, the condensation temperature of 298 K was selected to represent typical ambient heat rejection conditions in practical installations operating under moderate climatic environments, where condensers reject heat to air or cooling water near ambient temperature. The isentropic efficiency of 0.73 for both compressors is consistent with values reported in the literature for semi-hermetic reciprocating compressors operating under similar conditions [11].
Table 1.
Operating conditions for the analysed refrigeration system configurations.
Six refrigerants were selected for this comparative study based on three criteria: (i) suitability for low-temperature two-stage applications, (ii) representation of different refrigerant families and environmental profiles, and (iii) current industrial relevance or emerging potential as sustainable alternatives. The selected refrigerants include two hydrocarbons (R600a and R290), two hydrofluoroolefins (R1234yf and R1234ze (E)), one hydrofluorocarbon (R134a), and one natural inorganic refrigerant (R717). R134a is used as the baseline reference due to its widespread application in medium-temperature refrigeration and its well-documented thermodynamic behaviour, while R717 is included because of its high thermodynamic efficiency and long-standing use in large-scale industrial refrigeration systems.
Figure 2 presents the pressure–enthalpy (P–h) diagrams of the selected refrigerants, enabling a direct comparison of their saturation regions and operating pressure ranges. Differences in the shape and extent of the saturation dome reflect the thermodynamic characteristics of each refrigerant: the hydrocarbons R600a and R290 exhibit broader domes at moderate pressures, and the HFOs R1234yf and R1234ze (E) show intermediate behaviour with pressure levels comparable to R134a, whereas R717 operates at higher pressures and exhibits a large latent heat of vaporisation, reflecting its high critical temperature.
Figure 2.
Pressure–enthalpy (P–h) diagrams of the analysed refrigerants, showing saturation domes and operating pressure ranges.
Figure 3 presents the temperature–entropy (T-s) diagrams of the selected refrigerants. The slope of the saturated vapour curve, , determines the thermodynamic classification of refrigerants as wet (), dry (), or isentropic () [40]. This classification describes the behaviour during isentropic compression from saturated vapour: wet refrigerants tend to form liquid droplets, while dry refrigerants produce superheated discharge. The width of the saturation dome, characterised by the entropy of vaporisation , reflects the latent heat available for phase-change processes.
Figure 3.
Temperature–entropy (T–s) diagrams of the selected refrigerants, showing saturation domes and critical points.
Table 2 summarises the thermodynamic characteristics of the selected refrigerants evaluated at condensation conditions ( K). The saturation curve slope was computed numerically from property data, and the classification threshold was set at kJ/(kg K)2 for isentropic behaviour. The reduced temperature quantifies the proximity to critical conditions.
Table 2.
Thermodynamic characteristics of the selected refrigerants at K.
Table 2 reveals clear groupings among the refrigerants. The hydrocarbons R600a and R290 exhibit the widest saturation domes ( kJ/(kg K)) and high latent heats ( kJ/kg), which favour effective phase separation in the flash intercooler. The HFOs R1234yf and R1234ze (E), together with R134a, show intermediate saturation dome widths and nearly isentropic saturation curves. In contrast, R717 exhibits a relatively narrow saturation dome in entropy terms but a markedly high latent heat and entropy of vaporisation, reflecting its large specific refrigeration capacity and strong suitability for industrial low-temperature applications.
From an environmental perspective, the selected refrigerants can be grouped into two categories based on their Global Warming Potential (GWP). The first category comprises ultra-low GWP refrigerants (GWP < 10): R1234yf (GWP < 1), R600a and R290 (GWP ≈ 3), R1234ze (E) (GWP ≈ 7), and R717 (GWP ). These refrigerants comply with current and future regulatory frameworks, including the EU F-gas Regulation, and represent viable long-term solutions for sustainable refrigeration systems. The second category includes high-GWP refrigerants (GWP > 1000), represented in this study by R134a (GWP ≈ 1430), which remains widely used but is subject to increasing regulatory pressure under the Kigali Amendment. Table 3 presents the safety classifications of the analysed refrigerants according to ASHRAE Standard 34.
Table 3.
Environmental and safety characteristics of the selected refrigerants.
3. Methodology
3.1. Energy Analysis
The energy analysis of the vapour-compression refrigeration cycles is based on the following assumptions:
- Steady-state operation with stable flow.
- Adiabatic processes in the compressors and throttling valves.
- Negligible changes in potential and kinetic energy of the refrigerant.
- All thermodynamic calculations were performed using in-house routines developed in the Julia programming language. Refrigerant properties were evaluated through the CoolProp library [41], an open-source package implementing high-accuracy equations of state for pure fluids and mixtures.
- Dead-state temperature K.
3.1.1. Single-Stage Baseline
The single-stage cycle provides a baseline against which two-stage performance is measured. Table 4 defines the thermodynamic states using the numbering convention of Figure 1. State 1 represents saturated vapour at evaporating conditions; isentropic compression to would reach state 2s, but irreversibilities in the actual compressor yield the higher-enthalpy state 2. Condensation at constant pressure produces saturated liquid at state 3, and isenthalpic throttling returns the refrigerant to evaporating pressure at state 4 as a two-phase mixture.
Table 4.
Thermodynamic states for the single-stage cycle.
For a specified cooling capacity , the refrigerant mass flow rate follows from an energy balance on the evaporator:
The compressor power input is then
The coefficient of performance, defined as cooling produced per unit work input, is:
3.1.2. Two-Stage Cycles
Dividing the compression process requires selecting an intermediate pressure. The geometric mean
equalises the pressure ratio across both stages and minimises total compression work for an ideal gas with constant specific heats [39]. Real refrigerants deviate from ideal-gas behaviour, particularly near saturation, and the true optimum depends on property variations along the compression path [42]. Nevertheless, Equation (5) provides a consistent basis for comparing configurations across different working fluids without introducing optimisation as a confounding variable.
Table 5 extends the state-point definitions to two-stage cycles. The low-pressure loop circulates mass flow through the evaporator, LPC, and low-pressure expansion valve. The high-pressure loop handles mass flow through the HPC, condenser, and high-pressure expansion valve. These flows differ because vapour generated in the flash process joins the high-pressure stream.
Table 5.
Thermodynamic states for two-stage cycles.
In the mixing chamber, superheated vapour from the LPC combines adiabatically with saturated vapour from the flash tank:
Solving for the HPC inlet enthalpy gives
The refrigerant mass flow rate in the low-pressure (LP) cycle is determined as:
The mass flow rate in the high-pressure (HP) cycle can be expressed using the ratio , which defines the relationship between the mass flow rates of the HP and LP cycles:
The parameter , derived from the mass and energy balances of the intermediate cooling system, is expressed as:
In the two-stage vapour-compression refrigeration cycle with intercooling, the power supplied to the LPC and HPC is determined by the product of the enthalpy change during compression and the refrigerant mass flow rate circulating through each compressor. These powers can be expressed in terms of isentropic efficiency as follows:
where and are the refrigerant enthalpies at the outlet of the LPC and HPC, respectively, for isentropic processes from to and from to .
The total compression power required by the refrigeration cycle is the sum of the powers supplied to both compressors:
The cooling capacity can be expressed in terms of the low-pressure cycle mass flow rate and the enthalpy change in the evaporator:
The heat flow rejected in the condenser is calculated from the mass and energy balances and is expressed as:
The COP retains its definition as the ratio of cooling capacity to total compressor power:
3.2. Exergy Analysis
3.2.1. Reference Environment and Standard Chemical Exergy
Exergy calculations require a reference environment, defined as a state of thermodynamic equilibrium against which the system is compared. In this work, the reference environment model proposed by Szargut [43] is employed. This model is characterised by a standard temperature ( K) and a standard pressure ( kPa).
3.2.2. Exergy of a Flow Stream
In the absence of nuclear, magnetic, electrical, surface-tension, gravitational, and kinetic energy changes, the specific exergy of a substance is the maximum work obtainable as it is brought to thermal, mechanical, and chemical equilibrium with the reference environment [43]. This is expressed as follows:
where is the specific physical exergy and is the specific chemical exergy. The exergy of a matter flow is expressed as , where is the mass flow rate of the substance.
Chemical exergy values are considered negligible in refrigeration processes that do not involve chemical mixtures or reactions. Chemical exergy terms must not be neglected when the chemical composition of a stream changes, as in mixed refrigerant processes during separation or mixing. Neglecting them leads to errors in exergy calculations for both separators and mixers, incorrectly attributing irreversibilities, especially in adiabatic vapour–liquid separators operating at phase equilibrium. Only when the separator feed consists of a single component in the two-phase region do chemical exergy terms naturally balance, allowing correct irreversibility calculation using only thermo-mechanical exergy terms [44]. In this work, chemical exergy is not considered, since no refrigerant mixtures are employed nor do chemical reactions occur.
3.2.3. Physical Exergy
Physical exergy quantifies the work potential associated with bringing a flow to thermal and mechanical equilibrium with the environment at and , while its chemical composition remains unchanged [45]. The specific physical exergy is expressed as:
3.2.4. Exergy Associated with Work Transfer
The exergy associated with mechanical work is equivalent to the mechanical work itself :
3.2.5. Exergy Associated with Heat Transfer
The exergy associated with heat transfer is:
3.2.6. Exergy Balances
The exergy balance for each component follows the fuel–product decomposition, such that , where and are the exergy flows of fuel and product, respectively, and is the exergy flow associated with irreversibilities, which, according to the Gouy–Stodola theorem, is expressed as . Table 6 and Table 7 present the exergy balances associated with fuel, product, waste, and irreversibilities of the components comprising the simple configuration and the FIC and FIC + MC configurations.
Table 6.
Fuels, products, residues, and irreversibilities of the components in the refrigeration configuration simple.
Table 7.
Fuels, products, residues, and irreversibilities of the components in the refrigeration configuration with flash intercooling and flash-vapour mixing intercooling.
3.2.7. Exergy Performance Indicators
- Exergy Efficiency
The exergy efficiency of a component for each configuration is determined from the ratio of the exergy flow associated with its useful product to that associated with its fuel, i.e.,
For the configurations, exergy efficiency is determined as the ratio between the exergy flow associated with the cooling capacity and that associated with the power supplied to the compressor:
- Defect Efficiency
For a reversible process, exergy efficiency equals one; when the process is irreversible, the ratio of to is defined as defect efficiency. For each component, it is determined as:
For the cycles, defect efficiency is determined as:
3.3. Thermoeconomic Analysis
3.3.1. Productive Structure
To perform the thermoeconomic study, the development of the productive structure is the starting point. A productive structure is a set of blocks representing the system components, which are interconnected through exergy flows that can be fuel, product, or residue (, , or ) [46]. Components are classified as productive (those with a defined production purpose) or dissipative (those that destroy part of the exergy of their fuel before releasing it to the environment) [47].
Figure 4 shows the productive structure of the simple configuration, in which the system has a single resource input: the power supplied to the compressor. This power is used as a resource for other elements, resulting in two system outputs. On one hand, the useful product of the system, corresponding to the exergy associated with the heat extracted in the evaporator; and on the other hand, the generated residue, represented by the heat dissipated in the condenser. In this refrigeration system (Figure 5), the set of productive components is , and the dissipative component is .
Figure 4.
Productive structure of the simple configuration.
Figure 5.
Productive structure of the FIC configuration.
Figure 5 shows the productive structure of the FIC configuration. The external fuels are the power supplied to the low-pressure (LP) and high-pressure (HP) compressors; the useful product is the exergy associated with the heat flow extracted from the cold chamber; and the residue is the heat released to the environment during condensation.
The power entering as fuel to the HPC is used to generate the difference in exergy flows in the compression process. This difference in exergy flows combines with to generate the product , which constitutes the fuels for the COND, HPEV, and FIC. In the COND, its fuel, , is used to dissipate energy to the environment; while in the HPEV, the fuel is transformed into , which will serve as fuel for the FIC, whose product is . In the LPC, the fuel from the environment is used to generate the difference in exergy flows , which when combined with generates the product , that joins with the FIC product to form the product , which becomes the fuel for the LPEV and EVAP. The LPEV product, , feeds both the EVAP and . Finally, in the EVAP, the fuel is used to obtain the useful product of the system, .
In the FIC refrigeration system (Figure 5), the set of productive components is ; and the dissipative component is .
Figure 6 shows the productive structure of the FIC + MC configuration. As in Figure 5, the external fuels entering the refrigeration cycle are the power supplied to the LPC and HPC. The useful product of the cycle is the exergy associated with the heat flow extracted from the refrigerated space, which is absorbed by the refrigerant in the evaporator. The residue generated in the system corresponds to the heat released to the environment during condensation of the refrigerant in the condenser. Unlike the productive structure presented in Figure 5, the product of and is now used to form the fuel of the vapour-mixing chamber (MC). In turn, the product of the latter combines with that of the HPC to form the product , which is used as fuel for the COND, HPEV, and again for the FIC. In this refrigeration configuration, the productive components are the same as the FIC structure, , but with the addition of the MC. The dissipative component remains .
Figure 6.
Productive structure of the FIC + MC configuration.
3.3.2. FPR Model
The cost formation process links the product of each component to either the fuel of another component or a residual stream. Symbolic thermoeconomics, derived from exergy cost theory [48,49,50], formalises this process through the Fuel–Product–Residue (FPR) table. The FPR table maps the productive structure at the process level, identifying which components produce fuels for other components and where the fuels originate [50]. Its elements are expressed as distribution coefficients representing the proportion of the product of component j allocated as fuel or residue to component i [46].
In this work, the elements of Table 8, Table 9 and Table 10 contain the internal exergy exchanges between processes (see the sections in gold colour) and are expressed in terms of the distribution coefficients associated with productive components and those associated with dissipative components (see the grey section), which are expressed in terms of the coefficient , and indicate the proportion in which the product of component i is used as fuel in the j-th component. These coefficients correspond to the elements of matrices and , as shown in the following expressions:
where
Table 8.
Fuel–Product–Residue (FPR) model for the simple configuration.
Table 9.
Fuel–Product–Residue (FPR) model for the FIC configuration.
Table 10.
Fuel–Product–Residue (FPR) model for the FIC+MC configuration.
Table 8 shows the distribution of component products within the simple configuration. The compressor (C) product serves as fuel for the expansion valve (EV) and the evaporator (EVAP), and the remaining component products are similarly redistributed. The components contributing to the formation of the system residue, i.e., the physical exergy associated with the condensation heat dissipated in the condenser, are the compressor (C) and the expansion valve (EV). For the configuration with a flash tank, presented in Table 9, the elements that contribute to the formation of the system residue are the high-pressure compressor (HPC) and the high-pressure expansion valve (HPEV). In turn, for the configuration with a flash tank and a vapour mixing chamber (Table 10), the residue is generated by the vapour mixing chamber (MC), the high-pressure compressor (HPC), and the high-pressure expansion valve (HPEV).
3.3.3. Exergy Cost
The exergy cost balance [48,50] is expressed as:
While the fuel and residue costs are obtained as:
The accumulation of irreversibilities along the product cost formation processes in each element is expressed as follows:
where is the () matrix of cost operators and is defined as:
where is the () identity matrix.
3.3.4. Exergoeconomic Costs
The exergoeconomic cost balance of the extended productive component together with the dissipative component is calculated using the following equation:
where is the exergoeconomic cost associated with the product, with the fuel, and with the residue, and represents the non-exergetic operation and maintenance costs [51]. In matrix notation [50,52], the above expression can be written as:
where
The capital and maintenance cost of each component is calculated as:
where is the capital cost of component k, is the maintenance factor, and CRF is the capital recovery factor.
The capital recovery factor is expressed as:
where i is the annual interest rate and n is the economic lifetime of the system, expressed in years.
The capital cost functions used for the main components of the two-stage refrigeration system are presented in Table 11.
Table 11.
Capital cost functions of the system components [51].
The heat transfer area of both the condenser and the evaporator was determined using the Log Mean Temperature Difference (LMTD) method, expressed as:
A value of was adopted for the evaporator, while was considered for the condenser, which are representative of heat exchangers operating in vapour-compression refrigeration systems [53].
4. Results
4.1. Energy Performance Analysis
Figure 7 shows the variation of the refrigerant mass flow rate, , as a function of the condensation and evaporation temperatures for the Simple, FIC, and FIC + MC cycle configurations. For all configurations and for all refrigerants analysed, the mass flow rate increases as the condensation temperature rises. This behaviour is directly related to the decrease in the specific refrigeration effect at higher condensation pressures, since the enthalpy difference across the evaporator is reduced. Because the system cooling capacity is kept constant at 100 kW, a lower specific refrigeration effect must be compensated by a higher refrigerant mass flow rate. Conversely, when the evaporation temperature increases, the specific refrigeration effect rises due to a larger enthalpy difference in the evaporator, which explains the reduction in the required mass flow rate observed in the charts.
Figure 7.
Variation of the refrigerant mass flow rate with condensation and evaporation temperatures for the Simple, FIC, and FIC + MC configurations.
When comparing the different refrigerants using R134a as a reference and under fixed operating conditions, and , the Simple configuration shows mass flow rate decreases of 42.7% with R600a and 47.1% with R290, while the most significant reduction corresponds to R717, reaching 87.0%. These reductions are explained by the higher specific cooling capacity of these refrigerants, particularly in the case of R717, whose high latent heat of evaporation allows the required cooling capacity to be achieved with a substantially lower mass flow rate. In contrast, R1234ze (E) and R1234yf exhibit increases in mass flow rate of 13.4% and 33.8%, respectively, indicating a lower specific cooling capacity and, therefore, the need for higher refrigerant flow rates to operate under the same conditions.
In the FIC configuration, the relative trend among refrigerants is maintained, although with higher absolute mass flow rate values due to the presence of the flash tank, which modifies the refrigerant distribution within the system. In this case, R600a and R290 show mass flow rate reductions of 43.3% and 46.9%, respectively, while R717 reduces the mass flow rate by 85.5% compared to R134a. Conversely, R1234ze (E) and R1234yf increase the mass flow rate by 10.2% and 26.9%, respectively, once again confirming their lower specific cooling capacity.
For the FIC + MC configuration, a similar behaviour is observed. R600a and R290 present mass flow rate reductions of 42.7% and 47.0%, respectively, while R717 exhibits a decrease of 86.0% compared to R134a. In contrast, R1234ze (E) and R1234yf show increases of 11.5% and 28.8%, respectively. Although the incorporation of the mixing chamber slightly modifies the absolute values of the mass flow rate, the relative differences among refrigerants are preserved, indicating that the mass flow rate behaviour is mainly governed by the intrinsic thermodynamic properties of the refrigerant rather than by the cycle configuration.
Figure 8 shows the variation of the total power supplied to the compressors, , as a function of the condensation and evaporation temperatures for the Simple, FIC, and FIC+MC cycle configurations. For all configurations and for all refrigerants analysed, the compressor power requirement increases as the condensation temperature rises. This behaviour is primarily associated with the increase in the pressure ratio caused by the larger thermal lift between the evaporation and condensation levels. As the condensation temperature increases, the discharge pressure rises while the suction pressure remains approximately fixed, leading to higher specific compression work and, consequently, greater total compressor power demand.
Figure 8.
Variation of the total compressor power with condensation and evaporation temperatures for the Simple, FIC, and FIC + MC configurations.
Conversely, the power required by the compressors decreases systematically as increases for all refrigerants and configurations. This behaviour is due to the reduction in the pressure ratio associated with a lower thermal lift, which reduces the specific compression work and, consequently, the total power demand of the system.
Under fixed operating conditions, K and K, and taking R134a as the reference refrigerant, the Simple configuration shows a power decrease of 1.14% when using R600a, while power increases of 0.50% with R1234ze (E), 0.60% with R290, 2.72% with R1234yf, and 2.92% with R717 are obtained. These differences reflect the combined effect of the thermodynamic efficiency of the cycle and the mass flow rates required by each refrigerant.
In the FIC configuration, the relative trend among refrigerants is maintained. R600a again exhibits the lowest power requirement, whereas R717 shows the highest. The inclusion of the flash tank modifies the absolute power values but does not significantly alter the relative behaviour among refrigerants.
For the FIC + MC configuration, an analogous behaviour is observed with respect to both condensation and evaporation temperatures. In particular, increasing leads to a noticeable reduction in compressor power for all cases analysed. An increase of 10 K in the evaporation temperature results in an approximate 20% reduction in the power required by the compressors, regardless of the refrigerant and cycle configuration.
Figure 9 shows the variation of the coefficient of performance (COP) as a function of the condensation temperature, for a constant evaporation temperature of 238 K, as well as its variation with the evaporation temperature while keeping the condensation temperature fixed at 298 K, for the Simple, FIC, and FIC + MC cycle configurations. For all configurations and refrigerants analysed, the COP decreases as the condensation temperature increases. This behaviour is mainly explained by the increase in the pressure ratio caused by a larger thermal lift between the evaporation and condensation levels. As the discharge pressure rises while the suction pressure remains approximately constant, the specific compression work increases, which reduces the energetic performance of the cycle. Conversely, the COP increases with increasing evaporation temperature. This effect is associated with the reduction in thermal lift and, therefore, in the pressure ratio, which lowers the specific compression work required by the compressors. In addition, higher evaporation temperatures lead to higher suction pressures and reduced compression irreversibilities, contributing to an improvement in the overall cycle efficiency. The thermal lift is therefore the dominant parameter governing the COP for the three cycle configurations.
Figure 9.
Variation of the coefficient of performance (COP) with condensation and evaporation temperatures for the Simple, FIC, and FIC + MC configurations.
Comparing the different refrigerants with R134a as a reference, the Simple configuration shows COP increases of 1.45% with R600a and 2.51% with R717, indicating that these refrigerants require lower compressor power under the same cooling capacity conditions. Conversely, decreases of 0.57% with R290, 1.96% with R1234ze (E), and 6.21% with R1234yf are recorded, reflecting higher compression work requirements and, therefore, lower performance. In the FIC configuration, the COP increases by 1.13% with R600a and 0.45% with R717, while decreases reach 0.73% with R290, 0.56% with R1234ze (E), and 2.67% with R1234yf. Finally, in the FIC + MC configuration, R600a shows an increase of 1.53% relative to R134a, while R717 presents a significant decrease of 7.01%, and the remaining refrigerants exhibit intermediate variations: −0.68% for R290, −0.23% for R1234ze (E), and −2.32% for R1234yf, under fixed operating conditions: condensation temperature and evaporation temperature .
These comparisons show that, although R600a and R717 generally provide the highest COP values, the relative efficiency of each refrigerant strongly depends on the cycle configuration. For example, R717 achieves its best performance in the Simple configuration, but its performance decreases in the FIC + MC configuration. In all cases, R1234yf presents the lowest COPs, reflecting the higher compression work required to maintain the same cooling capacity, while R290 and R1234ze (E) exhibit intermediate behaviour, lying between the extremes of higher and lower efficiency.
Table 12 compares the performance of the Simple, FIC, and FIC + CM configurations at a condensation temperature of K and an evaporation temperature of K. In terms of mass flow rate, the Simple configuration generally exhibits the lowest values for all refrigerants due to its higher specific cooling capacity, which allows the thermal load to be satisfied with lower flow rates. In contrast, the FIC and FIC+CM configurations require higher mass flow rates as a consequence of refrigerant redistribution within the flash tank.
Table 12.
Results of the Simple, FIC and FIC + MC configurations at K and K.
Despite the increase in mass flow rate, the power required by the compressors decreases when transitioning from the Simple cycle to the FIC and FIC + CM configurations. This behaviour can be explained by improved thermodynamic matching between pressure levels, which reduces the compression ratio and the specific compression work. In particular, the FIC + CM configuration presents the lowest power consumption for most refrigerants, resulting in the highest COP values.
However, the mechanism behind the performance differences among refrigerants varies depending on their thermophysical properties and operating pressures. The only exception is R717, for which the COP decreases in the FIC + CM configuration due to the increased compression power associated with its high operating pressures and the larger enthalpy rise during compression, as evidenced by the comparative data trends.
4.2. Exergy Performance Analysis
Figure 10 shows the behaviour of exergy efficiency as a function of condensation and evaporation temperatures for three refrigeration system configurations: the Simple cycle, the FIC cycle, and the FIC + MC cycle, considering the refrigerants R134a, R600a, R290, R1234yf, R1234ze (E), and R717. For all analysed configurations, exergy efficiency decreases as the condensation temperature increases, regardless of the refrigerant employed. This behaviour is directly associated with the increase in thermodynamic irreversibilities, mainly in the compressors, caused by the higher pressure ratio and electrical power demand required at elevated condensation temperatures. As the thermal lift increases, the discharge pressure rises while the suction conditions remain nearly constant, intensifying entropy generation and thus reducing exergy efficiency.
Figure 10.
Variation of the exergy efficiency with condensation and evaporation temperatures for the Simple, FIC, and FIC + MC configurations.
In the Simple cycle, R717 exhibits the highest exergy efficiency over the entire analysed range, followed by R600a, due to their higher specific refrigeration effect and relatively lower compressor power for the same cooling capacity. In contrast, R1234yf consistently shows the lowest values, which can be explained by its higher compression work and less favourable thermodynamic matching under the studied operating conditions.
A similar trend is observed for the FIC configuration, which presents overall exergy efficiency values higher than those of the Simple cycle, evidencing a thermodynamic improvement associated with internal phase separation in the flash tank. This component redistributes the refrigerant mass flow and improves the thermodynamic state at the compressor inlets, reducing irreversibilities and enhancing exergy utilisation. Nevertheless, the relative ranking among refrigerants remains consistent with the Simple configuration, indicating that refrigerant properties continue to dominate the performance differences.
However, in the FIC + MC configuration, the behaviour changes for R717, which exhibits the lowest exergy efficiency values. This can be explained by the interaction between its high operating pressures and the internal mixing process in the mixing chamber, which increases the exergy destruction due to additional irreversibilities and a larger enthalpy rise during compression. Taking R134a as a reference at a condensation temperature of , the Simple cycle shows increases of 2.46% with R717 and 1.44% with R600a, while decreases of 0.59% (R290), 1.95% (R1234ze (E)), and 6.25% (R1234yf) are observed. In the FIC cycle, increases of 1.15% (R600a) and 0.49% (R717) are obtained, with reductions of 0.70% (R290), 0.52% (R1234ze (E)), and 2.71% (R1234yf). Finally, in the FIC + MC cycle, R600a shows an increase of 1.52%, whereas R717 presents a decrease of 6.97%, and reductions of 0.67% (R290), 0.21% (R1234ze (E)), and 2.33% (R1234yf) are recorded.
When analysing the variation of exergy efficiency as a function of evaporation temperature, the charts indicate that exergy efficiency increases systematically as the evaporation temperature rises for all configurations and refrigerants. This improvement is mainly due to the reduction in the compression ratio and the associated decrease in internal irreversibilities, particularly within the compressors and throttling devices. Higher evaporation temperatures increase suction pressure and reduce specific compression work, which directly enhances the exergy performance of the system.
From a configuration perspective, the FIC + MC cycle exhibits the highest exergy efficiencies, followed by the FIC cycle and, finally, the Simple cycle. This confirms that the incorporation of advanced configurations improves the management of exergy flows through better pressure level matching, internal mass redistribution, and reduced global irreversibilities.
Figure 11, Figure 12, Figure 13, Figure 14, Figure 15 and Figure 16 show, for each refrigerant, the pie diagrams corresponding to the simple cycle, FIC, and FIC + MC configurations, all operating at a condensation temperature of K and an evaporation temperature of K. These figures represent the useful product of the system, corresponding to the exergy associated with the evaporator, kW, as well as the overall exergy efficiency, , and the defect efficiency, , associated with each element comprising the analysed cycles. This representation allows a direct comparison of the distribution of exergetic defects among the different components and configurations for each working fluid.
Figure 11.
Defect efficiency distribution across components for the three configurations using R134a.
Figure 12.
Defect efficiency distribution across components for the three configurations using R600a.
Figure 13.
Defect efficiency distribution across components for the three configurations using R290.
Figure 14.
Defect efficiency distribution across components for the three configurations using R1234yf.
Figure 15.
Defect efficiency distribution across components for the three configurations using R1234ze (E).
Figure 16.
Defect efficiency distribution across components for the three configurations using R717.
In the Simple cycle, the charts clearly show that the compressor concentrates the largest fraction of defect efficiency for all refrigerants. This confirms that single-stage compression is the dominant source of exergy destruction, primarily due to the high pressure ratio and the associated entropy generation during compression. The expansion valve represents the second most significant source of defects, especially for R1234yf and R1234ze (E), whose lower vapour densities intensify throttling irreversibility. The condenser contributes a moderate fraction, while the evaporator exhibits the lowest defect efficiency due to its role as the useful product generator.
For R717, the behaviour differs from the other refrigerants. The defect efficiency associated with the compressor is lower than that of the other refrigerants due to the lower power input required, which is a consequence of its favourable thermodynamic properties and high latent heat. Similarly, the throttling process presents a smaller contribution to the total defect compared to the other working fluids. However, the condenser concentrates a significantly larger fraction of exergy destruction, attributable to the higher discharge temperatures and the greater heat rejection rate to the environment, which increases entropy generation during heat transfer. Despite this greater contribution from the condenser, the overall redistribution of irreversibilities is more balanced, which favours a competitive exergetic performance. Consequently, the overall exergy efficiency of the Simple cycle for all refrigerants remains within a relatively narrow range between 27.34% and 29.89%.
When adopting the FIC configuration, the distribution of defect efficiency is substantially modified due to the division of the compression process into two stages. The exergetic defect is shared between the low-pressure compressor and the high-pressure compressor, reducing the concentration of irreversibilities in a single component and improving the overall management of the system. Although the sum of the defect efficiencies associated with both compressors remains dominant, a reduction in the relative contribution of the condenser and the expansion valves is observed for most refrigerants. This redistribution of defects leads to a clear increase in the overall exergy efficiency for all the fluids analysed, which rises from values close to 29% in the simple cycle to a range between 32.03% and 33.30% in the FIC configuration.
The FIC + MC configuration introduces an additional improvement through the incorporation of the mixing chamber, whose defect efficiency is practically negligible for all refrigerants. As shown in Figure 11, Figure 12, Figure 13, Figure 14 and Figure 15, this modification enables a further redistribution of exergetic defects, with a slight reduction in the defect efficiency associated with compression and expansion processes. Nevertheless, in some cases, a moderate increase in the condenser defect efficiency is observed, associated with the higher energetic level of the flow entering this component. Despite this effect, for all working fluids analysed, with the exception of R717, the FIC + MC configuration exhibits the highest overall exergy efficiency.
In contrast, for R717, Figure 16 show that the high concentration of defect efficiency in the condenser limits the benefits associated with the incorporation of the mixing chamber, resulting in a reduction of the exergy efficiency to 30.70%, which is lower than that obtained in the FIC configuration. This behaviour is also associated with an increase in the power supplied to the compressors (7.18%) and in the heat rejected by the condenser (2.18%). The increase in compressor power is mainly due to the second compression process, in which the temperature rise is 18.48% higher, leading to greater work input, increased irreversibilities, and higher defect efficiency. Although the refrigerant mass flow decreases by 6.80%, this effect is not sufficient to enhance the exergy efficiency.
4.3. Exergy Cost Analysis
Figure 17 shows the behaviour of the exergy cost of the product as a function of condensation and evaporation temperatures for the Simple, FIC, and FIC + MC cycle configurations, considering the different refrigerants analysed. For every configuration, the exergy cost of the product increases with condensation temperature and decreases as evaporation temperature rises, as a direct consequence of the higher requirement of external resources () and the increase in system irreversibilities. Higher condensation temperatures intensify the pressure ratio and entropy generation, thereby increasing the unit exergy consumption required to produce the same cooling effect.
Figure 17.
Effect of condensation and evaporation temperatures on the exergy cost of the product in Simple, FIC, and FIC + MC configurations with different refrigerants.
For the Simple configuration, taking R134a as the reference refrigerant, R600a and R717 exhibit the lowest values of the exergy cost of the product over the entire operating range analysed, with reductions on the order of 1–2%. This behaviour can be explained by their lower compressor power demand and more favourable balance between compression and heat rejection irreversibilities, as observed in the previous defect efficiency distribution analysis. In contrast, R290 and R1234ze (E) show moderate increases, while R1234yf presents the highest values of the exergy cost of the product, with increases exceeding 6%, as a result of its higher power consumption and the greater generation of irreversibilities associated with the single-stage compression process.
When the FIC configuration is implemented, the exergy cost of the product decreases significantly for all refrigerants. The division of compression into two stages reduces the pressure ratio per stage and improves thermodynamic matching, which lowers entropy generation in the compressors. As shown in the comparative curves, this structural modification leads to a consistent reduction in the exergy cost of the product. Under this configuration, R600a and R717 maintain the lowest values, since their thermophysical properties allow them to benefit more effectively from the staged compression process. Meanwhile, R1234yf continues to exhibit the highest exergy cost values, although the relative gap with respect to the reference refrigerant becomes smaller due to the global reduction of compression-related irreversibilities.
The FIC + MC configuration generally presents the lowest absolute values of the exergy cost of the product for most refrigerants. The incorporation of the mixing chamber enhances pressure-level redistribution and improves internal exergy flow management, leading to a further reduction in compression and throttling defect efficiency. This configuration reduces the external exergy input per unit of useful product for R600a, R290, R1234ze (E), and R1234yf.
However, for R717, a distinct behaviour is observed. The exergy cost of the product increases significantly with respect to R134a, reaching the highest values among all refrigerants analysed in this configuration. This result is consistent with the defect efficiency diagrams, which show a higher concentration of irreversibilities in the condenser. The mixing process increases the discharge temperature in the second compression stage, raising compressor work and heat rejection rates. Consequently, the additional entropy generation in the condenser offsets the benefit of mass flow reduction, leading to a higher exergy cost of the product.
Overall, the comparative analysis of the charts confirms that refrigerant R600a exhibits the best exergoeconomic performance across the three configurations, consistently presenting the lowest exergy cost of the product. This superior behaviour is directly associated with lower compressor power consumption and a more balanced distribution of irreversibilities, highlighting the dominant role of compression work.
Figure 18 shows the residue cost associated with the condensation heat rejected to the environment, evaluated at K and K, for the Simple, FIC, and FIC + MC cycle configurations, considering the different refrigerants analysed. This cost represents the exergoeconomic impact of the exergy rejected in the condenser and is directly related to the magnitude and distribution of the irreversibilities generated within the system components.
Figure 18.
Residual cost in Simple, FIC, and FIC + MC configurations for different refrigerants.
For all refrigerants, the Simple configuration exhibits the highest residue cost values. This behaviour is mainly explained by the concentration of irreversibilities in the single-stage compression process, which increases both the compressor power requirement and the thermal level of the flow entering the condenser. As a consequence, a larger amount of high-grade heat is rejected to the environment, increasing the exergy destruction in the condenser and, consequently, the residue cost. As supported by Table 13, residue formation in this configuration is predominantly governed by the compressor (C) and the expansion valve (EV), whose high defect efficiencies directly translate into higher rejected exergy.
Table 13.
Contribution to residual formation in Simple, FIC, and FIC + MC configurations with different refrigerants.
Among the refrigerants, R717 stands out by presenting the highest value, reaching approximately 36.12 kW. This result is consistent with the defect efficiency distribution, which shows a strong concentration of irreversibilities in the condenser. Although R717 requires a relatively lower mass flow rate and competitive compression performance, its high discharge temperatures and large heat rejection rates increase entropy generation during condensation, leading to a higher exergetic residue. In contrast, R600a exhibits the lowest residue cost in the Simple configuration, with values close to 15.39 kW, due to its lower compressor power consumption and more balanced distribution of irreversibilities between compression and heat rejection processes.
When adopting the FIC configuration, the residue cost decreases markedly for all refrigerants. This reduction is associated with the division of the compression process into two stages, which lowers the compression ratio per stage and reduces the specific compression work. As a result, the temperature at the compressor outlet decreases, leading to a lower thermodynamic potential of the heat rejected in the condenser and, consequently, a reduction in the exergy cost of the residue. According to Table 13, residue formation in this configuration is mainly associated with the high-pressure compressor (HPC) and the high-pressure expansion valve (HPEV), which concentrate the dominant defect efficiencies. The values for most refrigerants are therefore grouped within a narrower range (approximately 14.6–15.5 kW), indicating a more uniform exergoeconomic behaviour among working fluids. For R717, although the residue cost decreases significantly compared to the Simple cycle (to about 20.47 kW), it remains the highest among the refrigerants, confirming that condenser-related irreversibilities still dominate its exergy cost performance.
The FIC + MC configuration enables an additional redistribution of irreversibilities through the incorporation of the mixing chamber, which modifies the thermodynamic state at the compressor inlets and improves internal exergy management. As indicated in Table 13, residue formation in this configuration is mainly governed by the mixing chamber (MC), followed by the high-pressure compressor (HPC) and the high-pressure expansion valve (HPEV). The improved pressure matching and internal mixing processes reduce the overall compression work and the thermal level of the rejected heat, leading to an additional decrease in for most refrigerants. Compared to the FIC configuration, further reductions of approximately 5–10% are observed, reaching the lowest residue costs, particularly for R600a (around 13.22 kW), which confirms its superior exergoeconomic performance.
R717 again departs from this trend: the residue cost increases to values close to 35.87 kW, even exceeding those obtained in the FIC configuration. This increase is associated with a significant increase in condenser defect efficiency caused by higher discharge temperatures after the second compression stage and an increase in heat rejection to the environment. Consequently, the additional mixing process does not compensate for the rise in compression work and condenser irreversibilities. This confirms that, under the analysed operating conditions, the incorporation of the mixing chamber is thermodynamically and exergoeconomically less favourable for R717, as the residue cost remains dominated by condenser-related exergy destruction rather than by mass flow reductions.
4.4. Exergoeconomic Cost Analysis
Figure 19 illustrates the behaviour of the exergoeconomic cost of the product, , as a function of condensation and evaporation temperatures for the Simple, FIC, and FIC + MC configurations, considering the refrigerants R134a, R600a, R290, R1234yf, R1234ze (E), and R717. systematically increases with condensation temperature and decreases as evaporation temperature rises. This behaviour is thermodynamically consistent, since higher condensation temperatures lead to greater compressor power input and higher thermal levels of heat rejection, while higher evaporation temperatures reduce the compression ratio, the specific compression work, and the overall irreversibility generation within the cycle.
Figure 19.
Effect of condensation and evaporation temperatures on product cost in Simple, FIC, and FIC + MC configurations with different refrigerants.
For the Simple configuration, the differences among refrigerants are mainly governed by their thermophysical properties and the resulting compression work. R600a consistently exhibits the lowest values of over the entire analysed range, with reductions on the order of 1–2% relative to R134a. This superior performance is directly associated with its lower compressor power consumption and a more balanced distribution of irreversibilities between the compressor and the condenser. In contrast, R1234yf shows the highest product cost values, with increases exceeding 5%, due to its higher specific compression work and the greater concentration of irreversibilities associated with the single-stage compression process. R717, in turn, exhibits values close to those of R134a, indicating a competitive compression performance, but with a larger fraction of irreversibilities shifted towards the condenser, owing to its high discharge temperatures and greater heat rejection rates.
When the FIC configuration is adopted, a noticeable reduction in is observed for all refrigerants. Splitting the compression process into two stages reduces the compression ratio per stage and the outlet temperature of the compressors, which decreases both the power consumption and the exergy destruction in the condenser. As a result, the exergoeconomic cost of the product decreases and the differences among refrigerants become less pronounced. Under this configuration, R600a maintains the best performance due to its lower work input, whereas R1234yf still exhibits the highest , although with smaller relative deviations compared to the Simple cycle.
The FIC + MC configuration generally provides the lowest absolute values of for most refrigerants, owing to improved pressure matching and a more effective internal redistribution of irreversibilities through the mixing chamber. This leads to additional reductions of approximately 1–3% with respect to the FIC cycle, mainly due to further decreases in compression work and a lower thermodynamic potential of the rejected heat. For R717, however, increases significantly under the FIC + MC configuration. This behaviour is associated with an unfavourable redistribution of irreversibilities, with a stronger concentration in the condenser caused by higher discharge temperatures after multi-stage compression and increased heat rejection to the environment. Consequently, the benefits of internal mixing are offset by the rise in condenser-related exergy destruction, explaining the higher exergoeconomic cost of the product for this refrigerant.
Figure 20 shows the behaviour of the exergoeconomic cost of the residue, , for the Simple, FIC, and FIC + MC systems, evaluated for the different refrigerants considered. The value of depends strongly on both the working fluid and the system configuration, since it is directly governed by compressor power input, the thermal level of the heat rejected in the condenser, and the internal distribution of irreversibilities within the cycle components.
Figure 20.
Residual cost in Simple, FIC, and FIC + MC configurations for different refrigerants.
In general, the lowest residue costs are consistently obtained with R600a for all three configurations. This behaviour is associated with its lower compression work and a more balanced distribution of irreversibilities between compression and heat rejection processes, which reduces the exergy destroyed in the condenser and, consequently, the exergoeconomic penalty of the rejected heat. In contrast, R717 exhibits the highest values of , particularly in the Simple and FIC + MC systems. This is mainly due to a stronger concentration of irreversibilities in the condenser, caused by higher discharge temperatures and larger heat rejection rates, which increase entropy generation during condensation despite its favourable thermodynamic properties in compression.
When the FIC configuration is implemented, a noticeable reduction in the residue cost is observed for most refrigerants compared to the Simple cycle. This reduction can be explained by the division of the compression process into two stages, which lowers the compression ratio per stage, reduces the outlet temperature of the compressors, and decreases the thermodynamic potential of the rejected heat. As a result, both exergy destruction in the condenser and are reduced, leading to a more uniform exergoeconomic behaviour among the working fluids.
The inclusion of the mixing chamber in the FIC + MC configuration further modifies the internal redistribution of irreversibilities, which explains the different trends observed in the charts depending on the refrigerant. For fluids such as R600a and R134a, the improved pressure matching and internal mixing reduce the overall compression work and the exergy content of the rejected heat, leading to additional decreases in . However, for R717, the mixing process results in higher discharge temperatures after the second compression stage and an increase in condenser-related irreversibilities. Consequently, the exergoeconomic cost of the residue increases again in the FIC + MC system, confirming that the effectiveness of the mixing chamber is strongly dependent on the thermophysical properties of the working fluid and on how irreversibilities are redistributed within the cycle.
5. Conclusions
The results show that the performance of refrigeration systems is strongly influenced by both the operating conditions and by the cycle configuration and the refrigerant used. Under the operating conditions analysed, in all cases, an increase in condensation temperature leads to a decrease in COP and exergy efficiency, as well as an increase in the power required by the compressors, the exergy cost of the product, and the costs associated with the residue. This behaviour is explained by the increase in the compression ratio and in system irreversibilities, mainly in the compressors and the condenser. Conversely, an increase in evaporation temperature systematically improves system performance by reducing the temperature lift, thereby decreasing the compression work and the generation of irreversibilities.
From a configurational perspective, the incorporation of the flash tank (FIC) and the mixing chamber (FIC + MC) enables a more favourable redistribution of pressure levels and exergy destruction within the system. Splitting the compression process reduces the specific compression work and the discharge temperature, which lowers condenser-related irreversibilities and exergoeconomic penalties. The FIC and FIC + MC configurations therefore generally exhibit lower compressor power, higher COP and exergy efficiency, and reduced exergy costs of both the product and the residue compared to the Simple cycle, demonstrating that increased cycle complexity can enhance performance when proper thermodynamic matching is achieved.
Regarding the effect of the refrigerant, R600a consistently stands out as the fluid with the best overall performance. This refrigerant shows the highest COP and exergy efficiency values, as well as the lowest exergy costs of the product and residue across the three configurations analysed. Its good performance is associated with lower compression power requirements and reduced irreversibility generation. R717 demonstrates excellent performance in the Simple configuration and, to a lesser extent, in the FIC configuration, due to its high specific cooling capacity. However, in the FIC + MC configuration, its performance is penalized by a high concentration of irreversibilities in the condenser, which increases both the exergy cost of the product and the residue, making this configuration thermodynamically unfavourable for this refrigerant under the studied conditions.
Refrigerants R290 and R1234ze (E) show intermediate behaviour, with performance close to that of R134a and moderate variations in energetic and exergetic indicators, while R1234yf consistently exhibits the lowest COP and exergy efficiency and the highest exergoeconomic costs. This trend is explained by its higher compression work requirements and greater irreversibility generation under identical cooling capacity conditions.
The conclusions of this study are subject to the assumed operating conditions (fixed refrigeration capacity of 100 kW, steady-state operation, isentropic efficiency of 0.73, and absence of auxiliary losses). Consequently, the values of the energy, exergy, and exergoeconomic indicators could differ under real operating conditions or under different design constraints.
The selection of the refrigeration system should therefore be addressed from an integrated approach that simultaneously considers energy, exergy, and exergoeconomic criteria, as well as the refrigerant properties and the cycle configuration. Under the analysed conditions, R600a emerges as the most favourable alternative, while advanced configurations such as FIC and FIC + MC are particularly advantageous for most refrigerants, provided that irreversibilities do not become excessively concentrated in specific components.
Future work should incorporate thermal losses and chemical exergy, and apply multi-objective optimisation methodologies to simultaneously minimise energy consumption, exergy destruction, and exergoeconomic costs under variable operating conditions representative of industrial practice, complemented by experimental validation.
Author Contributions
Conceptualisation, H.D.L.-M., S.C.-H. and R.L.-L.; data curation, M.S.-P. and W.C.B.-B.; formal analysis, S.C.-H. and H.D.L.-M.; investigation, S.C.-H., M.S.-P. and H.D.L.-M.; methodology, S.C.-H., M.S.-P., H.D.L.-M., A.T.-A. and R.L.-L.; project administration, R.L.-L.; software, S.C.-H., W.C.B.-B. and H.D.L.-M.; supervision, H.D.L.-M., W.C.B.-B., A.T.-A. and R.L.-L.; validation, H.D.L.-M., M.S.-P. and S.C.-H.; visualisation, R.L.-L. and A.T.-A.; writing—original draft, S.C.-H.; and writing—review and editing, H.D.L.-M., W.C.B.-B. and R.L.-L. All authors have read and agreed to the published version of the manuscript.
Funding
This research received no external funding.
Data Availability Statement
The original contributions presented in the study are included in the article, further inquiries can be directed to the corresponding author.
Acknowledgments
The authors would like to express their gratitude to the Directorate of Scientific Research and Human Resource Training, as well as to the COMECYT Researchers Program, through the Mexiquense Council of Science and Technology (COMECYT), for the support provided for the development of this work. The authors also acknowledge the support of the National Technological Institute of Mexico/TES of Ecatepec, Division of Mechatronics and Industrial Engineering.
Conflicts of Interest
The authors declare no conflicts of interest.
Abbreviations
| COND | Condenser |
| COP | Coefficient of Operation |
| EVAP | Evaporator |
| FIC | Flash Intercooling Chamber |
| HP | High Pressure |
| HPC | High-Pressure Compressor |
| HPEV | High-Pressure Expansion Valve |
| LP | Low Pressure |
| LPC | Low-Pressure Compressor |
| LPEV | Low-Pressure Expansion Valve |
| SHV | Superheated Vapour |
| MC | Mixing Chamber |
| CC | Cold Chamber |
| HC | Hydrocarbons |
| HFC | Hydrofluorocarbons |
| HFO | Hydrofluoroolefins |
Nomenclature
| A | area; | (), |
| exergy flow; | (kW), | |
| exergetic cost; | (kW), | |
| resource flow; | (kW), | |
| exergetic cost of the resource; | (kW), | |
| h | specific enthalpy; | (kJ/kg), |
| irreversibility flow; | (kW), | |
| mass flow rate; | , | |
| P | pressure; | (bar), |
| product; | (kW), | |
| exergetic cost of the product; | (kW), | |
| q | heat per unit mass; | , |
| heat flow; | , | |
| residue; | (kW), | |
| s | specific entropy; | , |
| T | temperature; | , |
| U | overall heat transfer coefficient; | , |
| w | work per unit mass; | , |
| generated power; | (kW), | |
| x | quality; | (-) |
Greek Letters
| defect efficiency; | (-) | |
| residue distribution coefficients; | (-) | |
| y | product distribution coefficients; | (-) |
| exergy per unit mass; | (-) | |
| efficiency; | (-) | |
| pressure ratio; | (-) | |
| Exergoeconomic cost; | ||
| flow ratio; | (-) |
Subscripts
| 0 | reference state; |
| ex | exergetic; |
| 1, 2, 3, … | thermodynamic states; |
| sic | compressor isentropic; |
| ST | stack; |
| INT | intermediate; |
| f | saturated liquid; |
| g | saturated steam; |
| tp | triple point; |
| cr | critical; |
| ref | refrigerant. |
Superscripts
| PH | physical; |
| Q | heat; |
| W | work. |
Matrices
| (n × n) matrix of distribution coefficients; | |
| (n × n) matrix of distribution coefficients; | |
| (n × n) productive matrix of cost operators; | |
| identity matrix (n × n). |
References
- International Energy Agency. World Energy Outlook 2023; IEA Publications: Paris, France, 2023. [Google Scholar]
- BP & Energy Institute. Statistical Review of World Energy 2023; BP & Energy Institute: London, UK, 2023. [Google Scholar]
- REN21. Renewables 2024 Global Status Report; REN21: Singapore, 2024. [Google Scholar]
- Shi, J.; Li, T.; Zhang, H.; Peng, S.; Liu, Z.; Jiang, Q. Energy consummation and environmental emissions assessment of a refrigeration compressor based on life cycle assessment methodology. Int. J. Life Cycle Assess. 2015, 20, 947–956. [Google Scholar] [CrossRef] [Scilit]
- Saidur, R.; Hasanuzzaman, M.; Rahim, N.A. Energy use, energy savings and environmental analysis of industrial boilers and compressors. Int. J. Therm. Environ. Eng. 2010, 1, 29–36. [Google Scholar] [CrossRef] [Scilit]
- International Energy Agency. The Future of Cooling: Opportunities for Energy-Efficient Air Conditioning; IEA Reports; International Energy Agency: Paris, France, 2023. [Google Scholar]
- Tejani, A.; Gajjar, H.; Toshniwal, V.; Kandelwal, R. The impact of low-GWP refrigerants on environmental sustainability: An examination of recent advances in refrigeration systems. ESP J. Eng. Technol. Adv. 2022, 2, 62–77. [Google Scholar]
- Azizifar, S.; Banooni, S. Modeling and optimisation of industrial multistage compressed air systems using actual variable effectiveness in hot regions. Adv. Mech. Eng. 2016, 8, 1–13. [Google Scholar] [CrossRef] [Scilit]
- López-Paniagua, I.; Rodríguez-Martín, J.; Sánchez-Orgaz, S.; Roncal-Casano, J.J. Step-by-step derivation of the optimum multistage compression ratio and an application case. Entropy 2020, 22, 678. [Google Scholar] [CrossRef] [Scilit] [PubMed]
- Arora, S.C.; Arora, S.C.; Domkundwar, S. A Course in Refrigeration and Air Conditioning; Dhanpat Rai & Co.: Delhi, India, 2017. [Google Scholar]
- Stoecker, W.F.; Jones, J.W. Refrigeration and Air Conditioning, 2nd ed.; McGraw-Hill: New York, NY, USA, 2006. [Google Scholar]
- Kakaç, S.; Liu, H. Boilers, Evaporators, and Condensers; Wiley: New York, NY, USA, 2012. [Google Scholar]
- Bejan, A. Advanced Engineering Thermodynamics, 4th ed.; Wiley: Hoboken, NJ, USA, 2016. [Google Scholar]
- Kotas, T.J. The Exergy Method of Thermal Plant Analysis; Butterworth-Heinemann: Oxford, UK, 2013. [Google Scholar]
- Dincer, I.; Cengel, Y.A. Progress in Exergy Analysis of Refrigeration, Heating and Air Conditioning; Springer: New York, NY, USA, 2012. [Google Scholar]
- Jain, V.; Sachdeva, G.; Kachhwaha, S.S. Comparative performance study and advanced exergy analysis of a novel vapour compression–absorption integrated refrigeration system. Energy Convers. Manag. 2018, 172, 81–97. [Google Scholar] [CrossRef] [Scilit]
- Aderibigbe, A.A.; Ogunsola, A.D.; Fadiji, E.A.; Babatunde, I.A.; Adeyi, O.; Adeyi, A.J.; Owoo, E.A. Thermodynamic analysis of two-stage vapour compression refrigeration systems using eco-friendly refrigerants. J. Energy Res. Rev. 2024, 16, 61–71. [Google Scholar] [CrossRef] [Scilit]
- Bolaji, B.O. Performance investigation of ozone-friendly R404A and R507 refrigerants as alternatives to R22 in a window air-conditioner. Energy Build. 2011, 43, 3139–3143. [Google Scholar] [CrossRef] [Scilit]
- Minor, B.; Spatz, M. Evaluation of refrigerants for replacement of R404A. In Proceedings of the ASHRAE/NIST Refrigerants Conference, Yokohama, Japan, 16–22 August 2015. [Google Scholar]
- ASHRAE. ASHRAE Handbook—Fundamentals; ASHRAE: Atlanta, GA, USA, 2017. [Google Scholar]
- Lorentzen, G. The revival of carbon dioxide as a refrigerant. Int. J. Refrig. 1994, 17, 292–301. [Google Scholar] [CrossRef] [Scilit]
- Nekså, P. CO2 heat pump systems. Int. J. Refrig. 2002, 25, 421–427. [Google Scholar] [CrossRef] [Scilit]
- Devotta, S.; Padalkar, A.S.; Sane, N.K. Performance assessment of HC-290 as a drop-in substitute to HCFC-22 in a window air conditioner. Int. J. Refrig. 2005, 28, 594–604. [Google Scholar] [CrossRef] [Scilit]
- Corberán, J.M.; Segurado, J.; Colbourne, D.; Gonzálvez, J. Review of standards for the use of hydrocarbon refrigerants in A/C, heat pump and refrigeration equipment. Int. J. Refrig. 2008, 31, 748–756. [Google Scholar] [CrossRef] [Scilit]
- Çakır, M.T.; Tunçıl, İ. Effect of condenser and refrigerant type on two-stage vapour compression refrigeration performance: An experimental study. Politek. Derg. 2023, 26, 983–990. [Google Scholar] [CrossRef] [Scilit]
- Kontomaris, K.; Kulankara, S.; Kauffman, J.P. A reduced global warming potential replacement for HFC-134a in centrifugal chillers: XP10 measured performance and projected climate impact. HVAC&R Res. 2013, 19, 857–864. [Google Scholar] [CrossRef] [Scilit]
- Ji, S.; Liu, Z.; Pan, H.; Li, X. Energy, exergy, environmental and exergoeconomic (4E) analysis of an ultra-low temperature cascade refrigeration system with environmental-friendly refrigerants. Appl. Therm. Eng. 2024, 248, 123210. [Google Scholar] [CrossRef] [Scilit]
- Selbaș, R.; Kızılkan, Ö.; Şencan, A. Thermoeconomic optimisation of subcooled and superheated vapour compression refrigeration cycles. Energy 2006, 31, 2108–2128. [Google Scholar] [CrossRef] [Scilit]
- Tsatsaronis, G.; Moran, M. Definitions and nomenclature in exergy analysis and exergoeconomics. Energy 2007, 32, 249–253. [Google Scholar] [CrossRef] [Scilit]
- Valero, A.; Torres, C. Exergy Cost Theory: The Fundamentals; CIRCE: Zaragoza, Spain, 2006. [Google Scholar]
- d’Accadia, M.D.; de Rossi, F.; Vanoli, L. Thermoeconomic analysis and diagnosis of a refrigeration plant. Energy Convers. Manag. 1998, 39, 1577–1584. [Google Scholar] [CrossRef] [Scilit]
- Ahamed, J.U.; Saidur, R.; Masjuki, H.H. A review on exergy and energy analysis of vapour compression refrigeration systems. Renew. Sustain. Energy Rev. 2011, 15, 1593–1600. [Google Scholar] [CrossRef] [Scilit]
- Alihosseini, N.; Jahangiri, A.; Ameri, M. Energy, exergy, exergoeconomic, and exergoenvironmental analyses and multi-objective optimization of parallel two-stage compression on the domestic refrigerator-freezer. Int. J. Air-Cond. Refrig. 2024, 32, 11. [Google Scholar] [CrossRef] [Scilit]
- Lourenco, A.B.; Nebra, S.A.; Santos, J.J.C.S.; Donatelli, J.L.M. Application of an alternative thermoeconomic approach to a two-stage vapour compression refrigeration cascade cycle. J. Braz. Soc. Mech. Sci. Eng. 2015, 37, 903–913. [Google Scholar] [CrossRef] [Scilit]
- Tahmasebzadehbaie, M.; Sayyaadi, H. Optimal design of a two-stage refrigeration cycle for natural gas pre-cooling in a gas refinery considering the best allocation of refrigerant. Energy Convers. Manag. 2020, 210, 112743. [Google Scholar] [CrossRef] [Scilit]
- Morosuk, T.; Tsatsaronis, G. Advanced exergy-based methods used to understand and improve energy-conversion systems. Energy 2019, 169, 238–246. [Google Scholar] [CrossRef] [Scilit]
- Sun, Z.; Yao, Q.; Jin, H.; Xu, Y.; Hang, W.; Chen, H.; Li, K.; Shi, L.; Gu, J.; Zhang, Q.; et al. A novel in-situ sensor calibration method for building thermal systems based on virtual samples and autoencoder. Energy 2024, 297, 131314. [Google Scholar] [CrossRef] [Scilit]
- Sun, Z.; Yao, Q.; Shi, L.; Jin, H.; Xu, Y.; Yang, P.; Xiao, H.; Chen, D.; Zhao, P.; Shen, X.; et al. Virtual sample diffusion generation method guided by large language model-generated knowledge for enhancing information completeness and zero-shot fault diagnosis in building thermal systems. J. Zhejiang-Univ.-Sci. A 2025, 26, 895–916. [Google Scholar] [CrossRef] [Scilit]
- Stoecker, W.F. Industrial Refrigeration Handbook; McGraw-Hill: New York, NY, USA, 1998; ISBN 978-0-07-061623-3. [Google Scholar]
- Chowdhury, S.; Roy, R.; Mandal, B.K. A review on energy and exergy analysis of two-stage vapour compression refrigeration system. Int. J. Air-Cond. Refrig. 2019, 27, 1930001. [Google Scholar] [CrossRef] [Scilit]
- Bell, I.H.; Wronski, J.; Quoilin, S.; Lemort, V. Pure and pseudo-pure fluid thermophysical property evaluation and the open-source thermophysical property library CoolProp. Ind. Eng. Chem. Res. 2014, 53, 2498–2508. [Google Scholar] [CrossRef] [Scilit]
- Torrella, E.; Larumbe, J.A.; Cabello, R.; Llopis, R.; Sanchez, D. A General Methodology for Energy Comparison of Intermediate Configurations in Two-Stage Vapour Compression Refrigeration Systems. Energy 2011, 36, 4119–4124. [Google Scholar] [CrossRef] [Scilit]
- Szargut, J. Exergy Method: Technical and Ecological Applications; WIT Press: Billerica, MA, USA, 2005; Volume 18. [Google Scholar]
- Berstad, D.; Skaugen, G.; Wilhelmsen, Ø. Dissecting the exergy balance of a hydrogen liquefier: Analysis of a scaled-up Claude hydrogen liquefier with mixed refrigerant pre-cooling. Int. J. Hydrogen Energy 2021, 46, 8014–8029. [Google Scholar] [CrossRef] [Scilit]
- Bejan, A.; Tsatsaronis, G.; Moran, M. Thermal Design and Optimization; John Wiley & Sons: New York, NY, USA, 1996. [Google Scholar]
- Torres, C.; Valero, A.; Rangel, V.; Zaleta, A. On the cost formation process of the residues. Energy 2008, 33, 144–152. [Google Scholar] [CrossRef] [Scilit]
- Valero, A.; Lozano, M.A.; Muñoz, M. A general theory of exergy saving. Part I: On the exergetic cost; Part II: On the thermoeconomic cost; Part III: Energy saving and thermoeconomics. In Computer-Aided Engineering of Energy Systems, Vol. 3—Second Law Analysis and Modeling; Gaggioli, R.A., Ed.; ASME: New York, NY, USA, 1986; pp. 1–22. [Google Scholar]
- Valero, A.; Serra, L.; Uche, J. Fundamentals of exergy cost accounting and thermoeconomics. Part I: Theory. J. Energy Resour. Technol. Mar. 2006, 128, 1–8. [Google Scholar] [CrossRef] [Scilit]
- Lozano, M.A.; Valero, A. Theory of the exergetic cost. Energy 1993, 18, 939–960. [Google Scholar] [CrossRef] [Scilit]
- Torres, C.; Valero, A. The exergy cost theory revisited. Energies 2021, 14, 1594. [Google Scholar] [CrossRef] [Scilit]
- Roy, R.; Mandal, B.K. Energy, exergy and economic optimisation of a two-stage refrigeration system using low-GWP alternative refrigerants for high-temperature lift applications. J. Braz. Soc. Mech. Sci. Eng. 2023, 45, 403. [Google Scholar] [CrossRef] [Scilit]
- Feidt, M.; Valero-Capilla, A. Advances in Thermodynamics and Circular Thermoeconomics: Fundamentals and Criteria; John Wiley & Sons: Hoboken, NJ, USA, 2023. [Google Scholar]
- Incropera, F.P.; DeWitt, D.P.; Bergman, T.L.; Lavine, A.S. Fundamentals of Heat and Mass Transfer, 7th ed.; Wiley: Hoboken, NJ, USA, 2017. [Google Scholar]
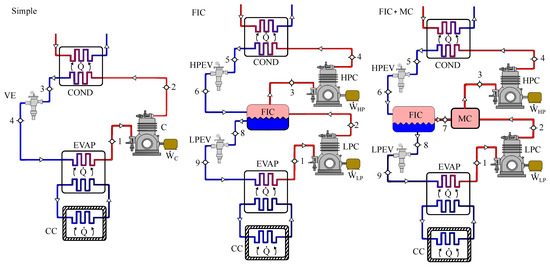
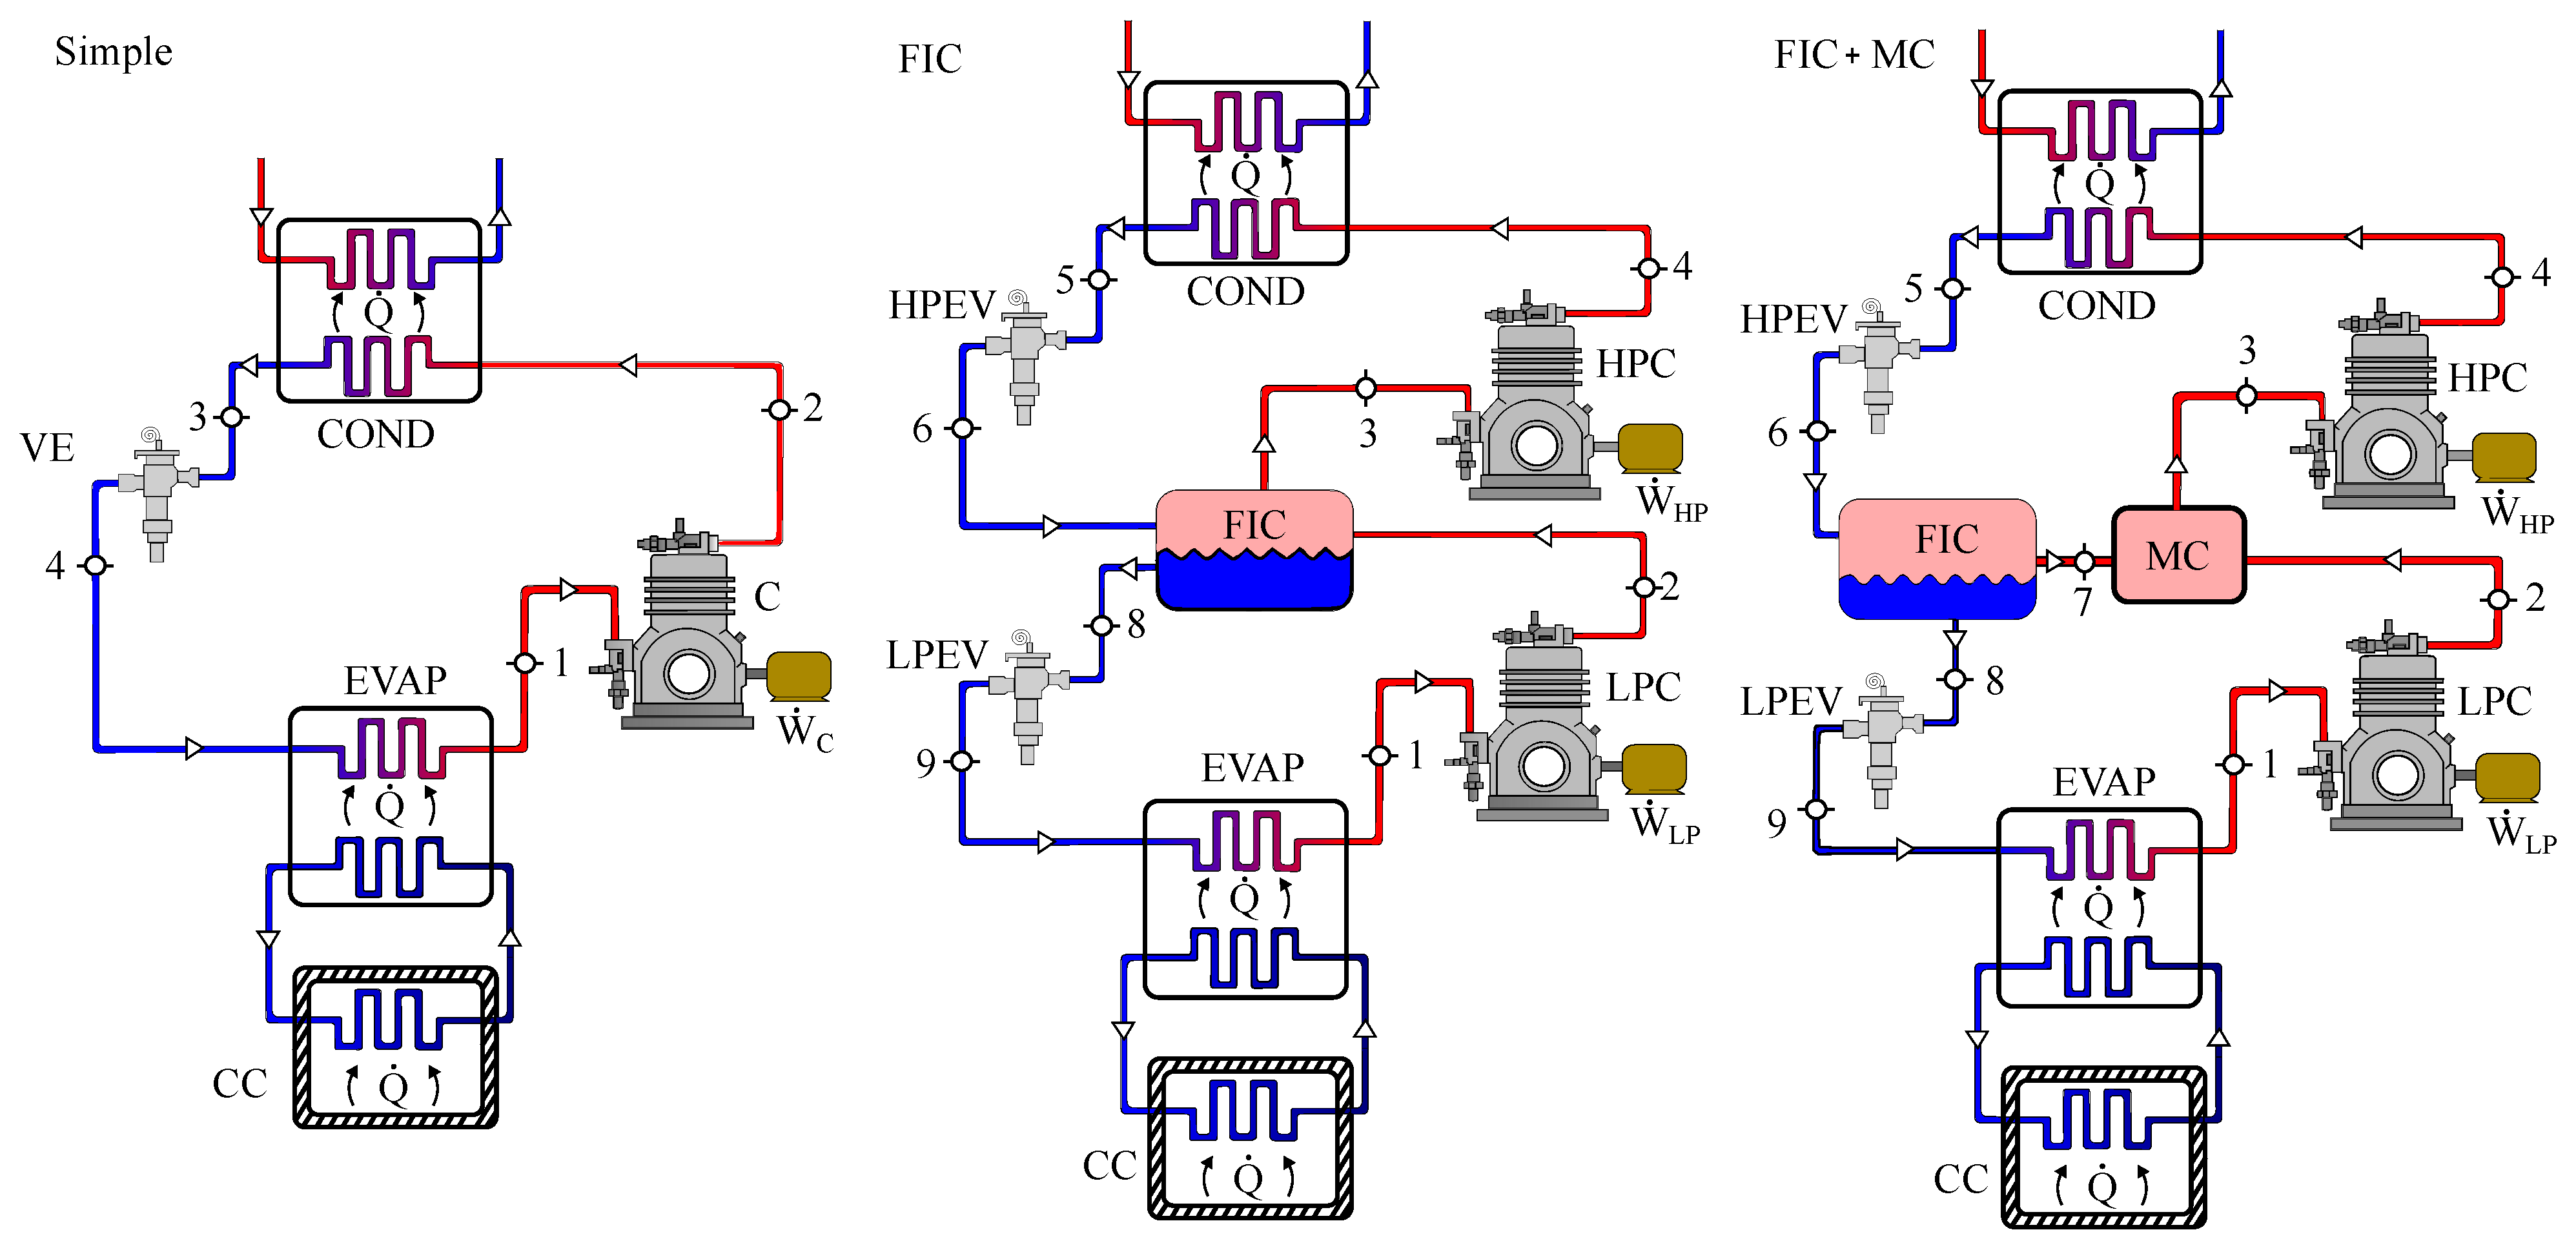
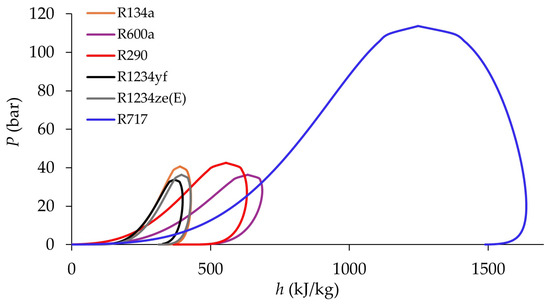
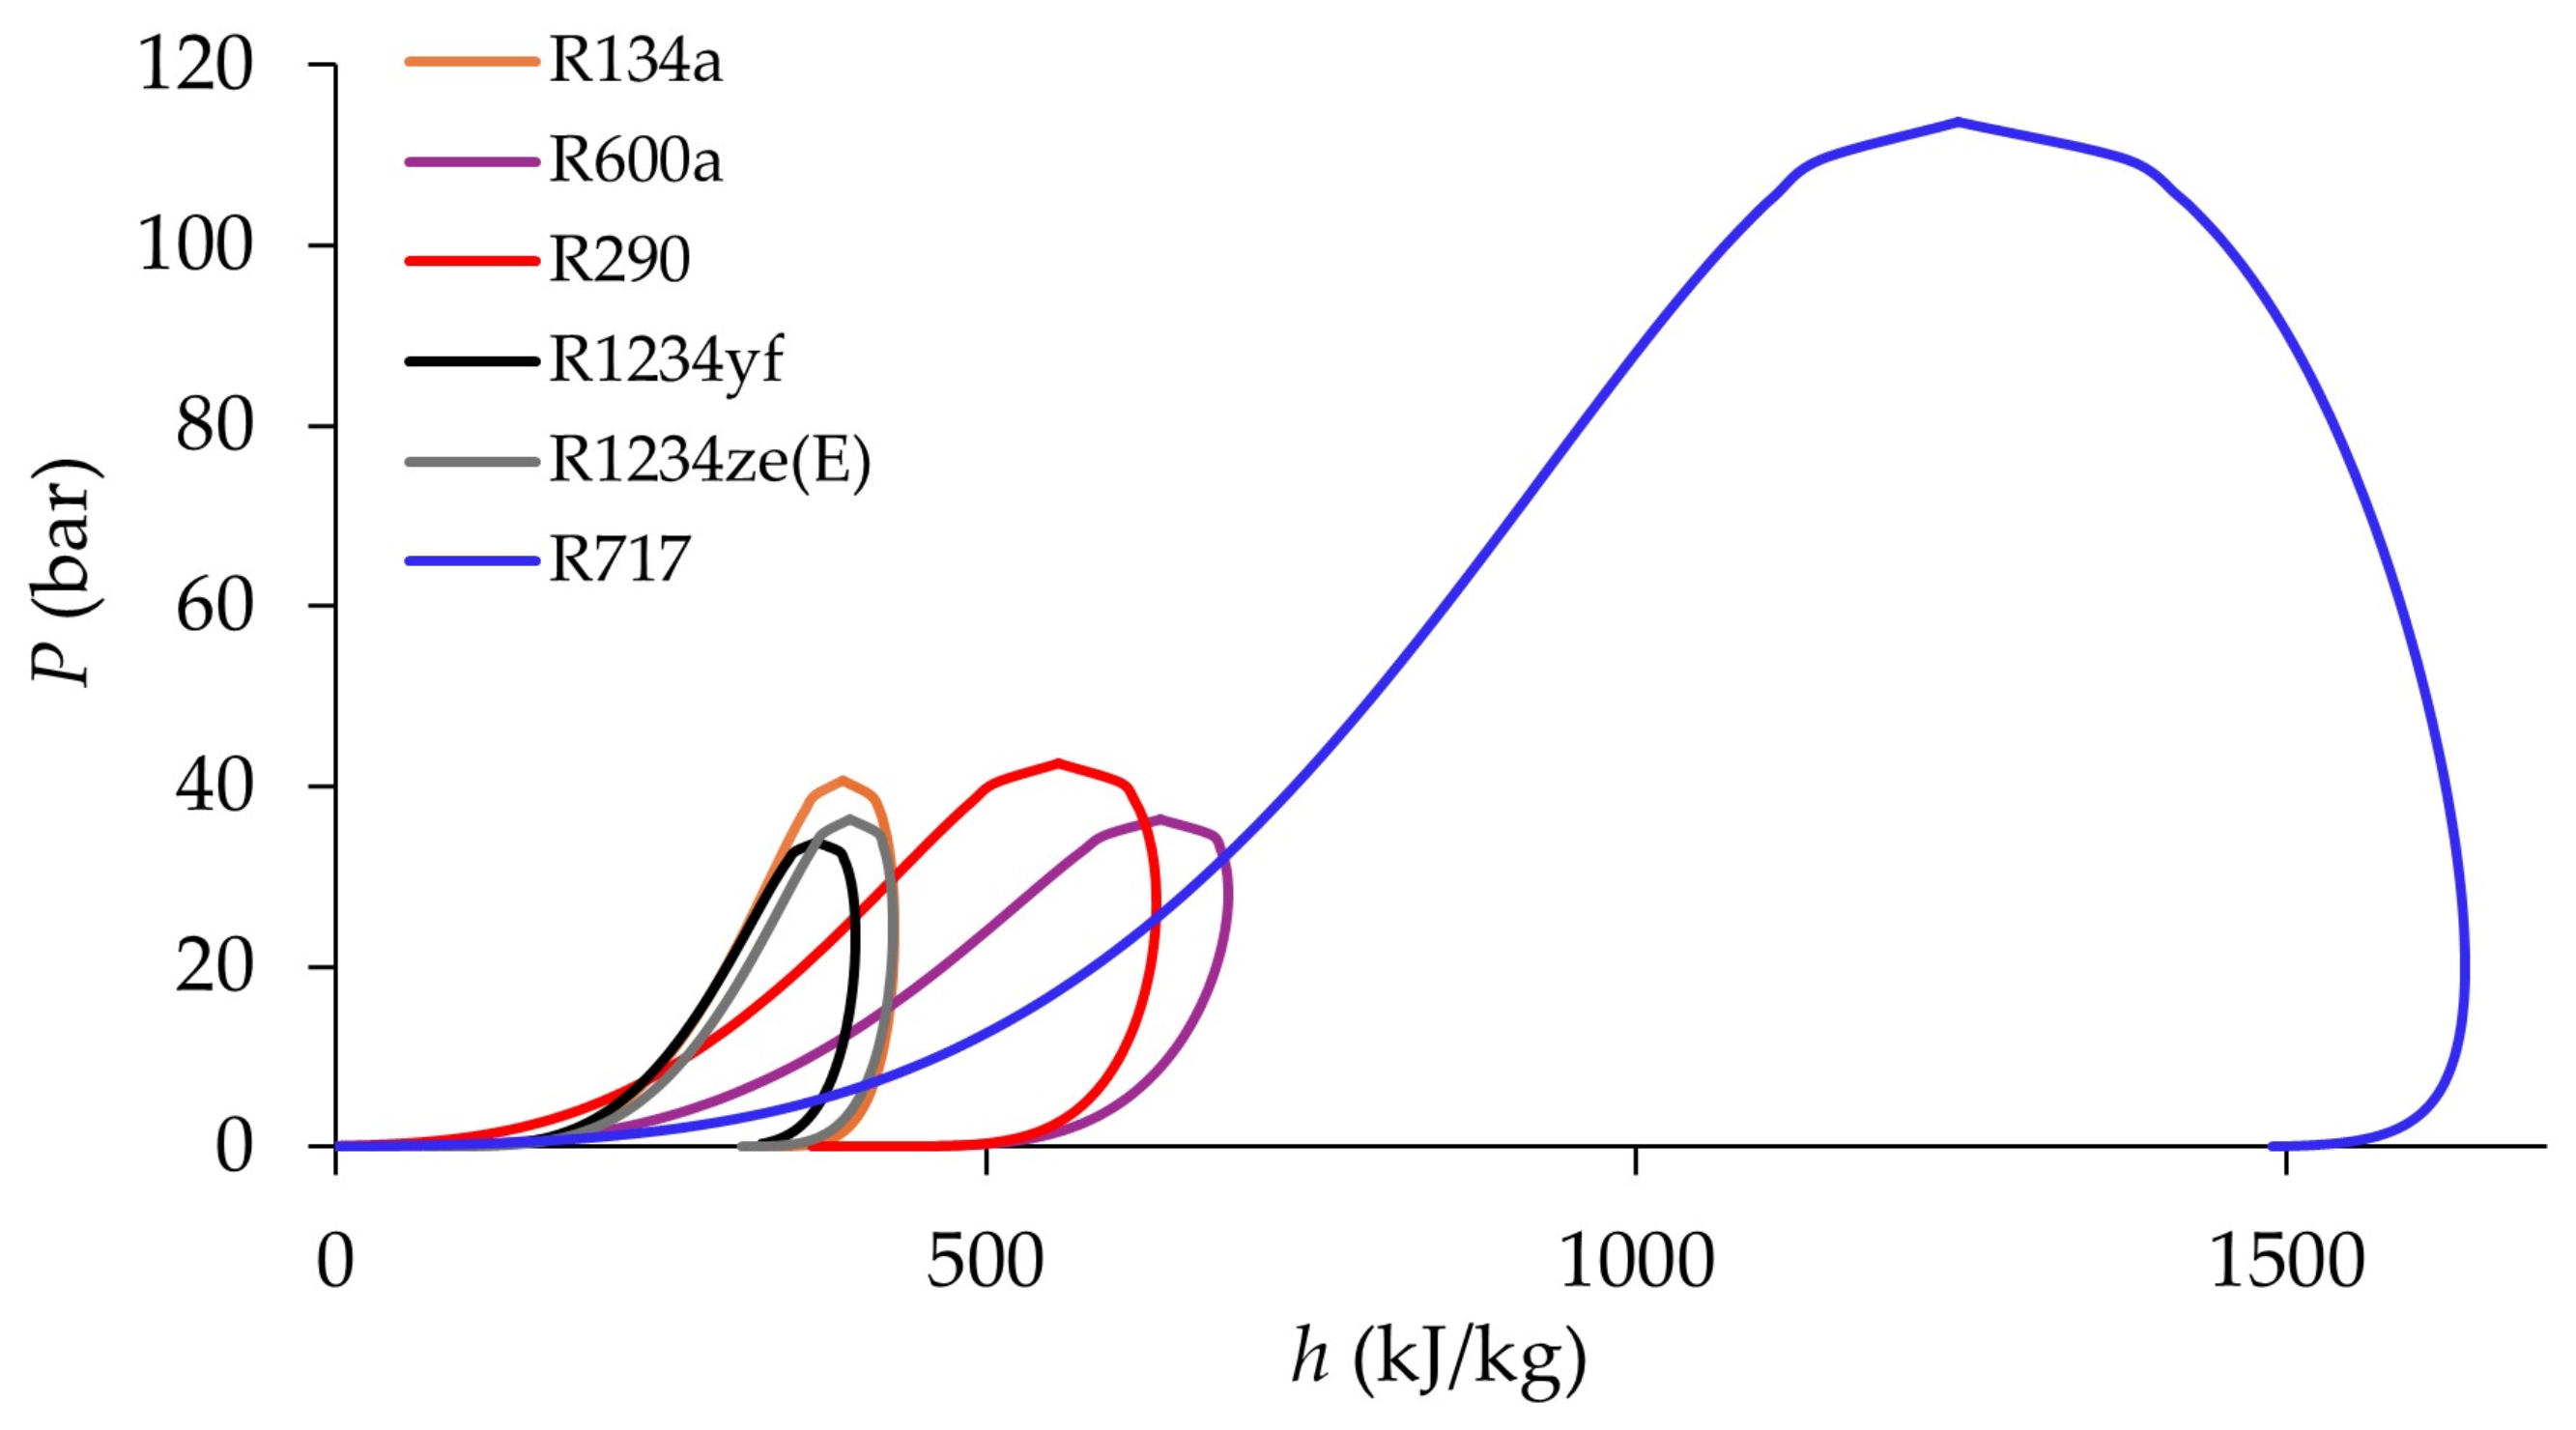
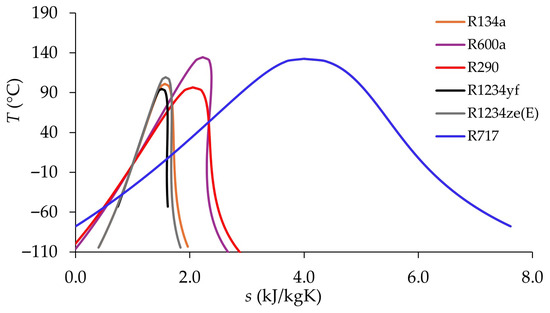
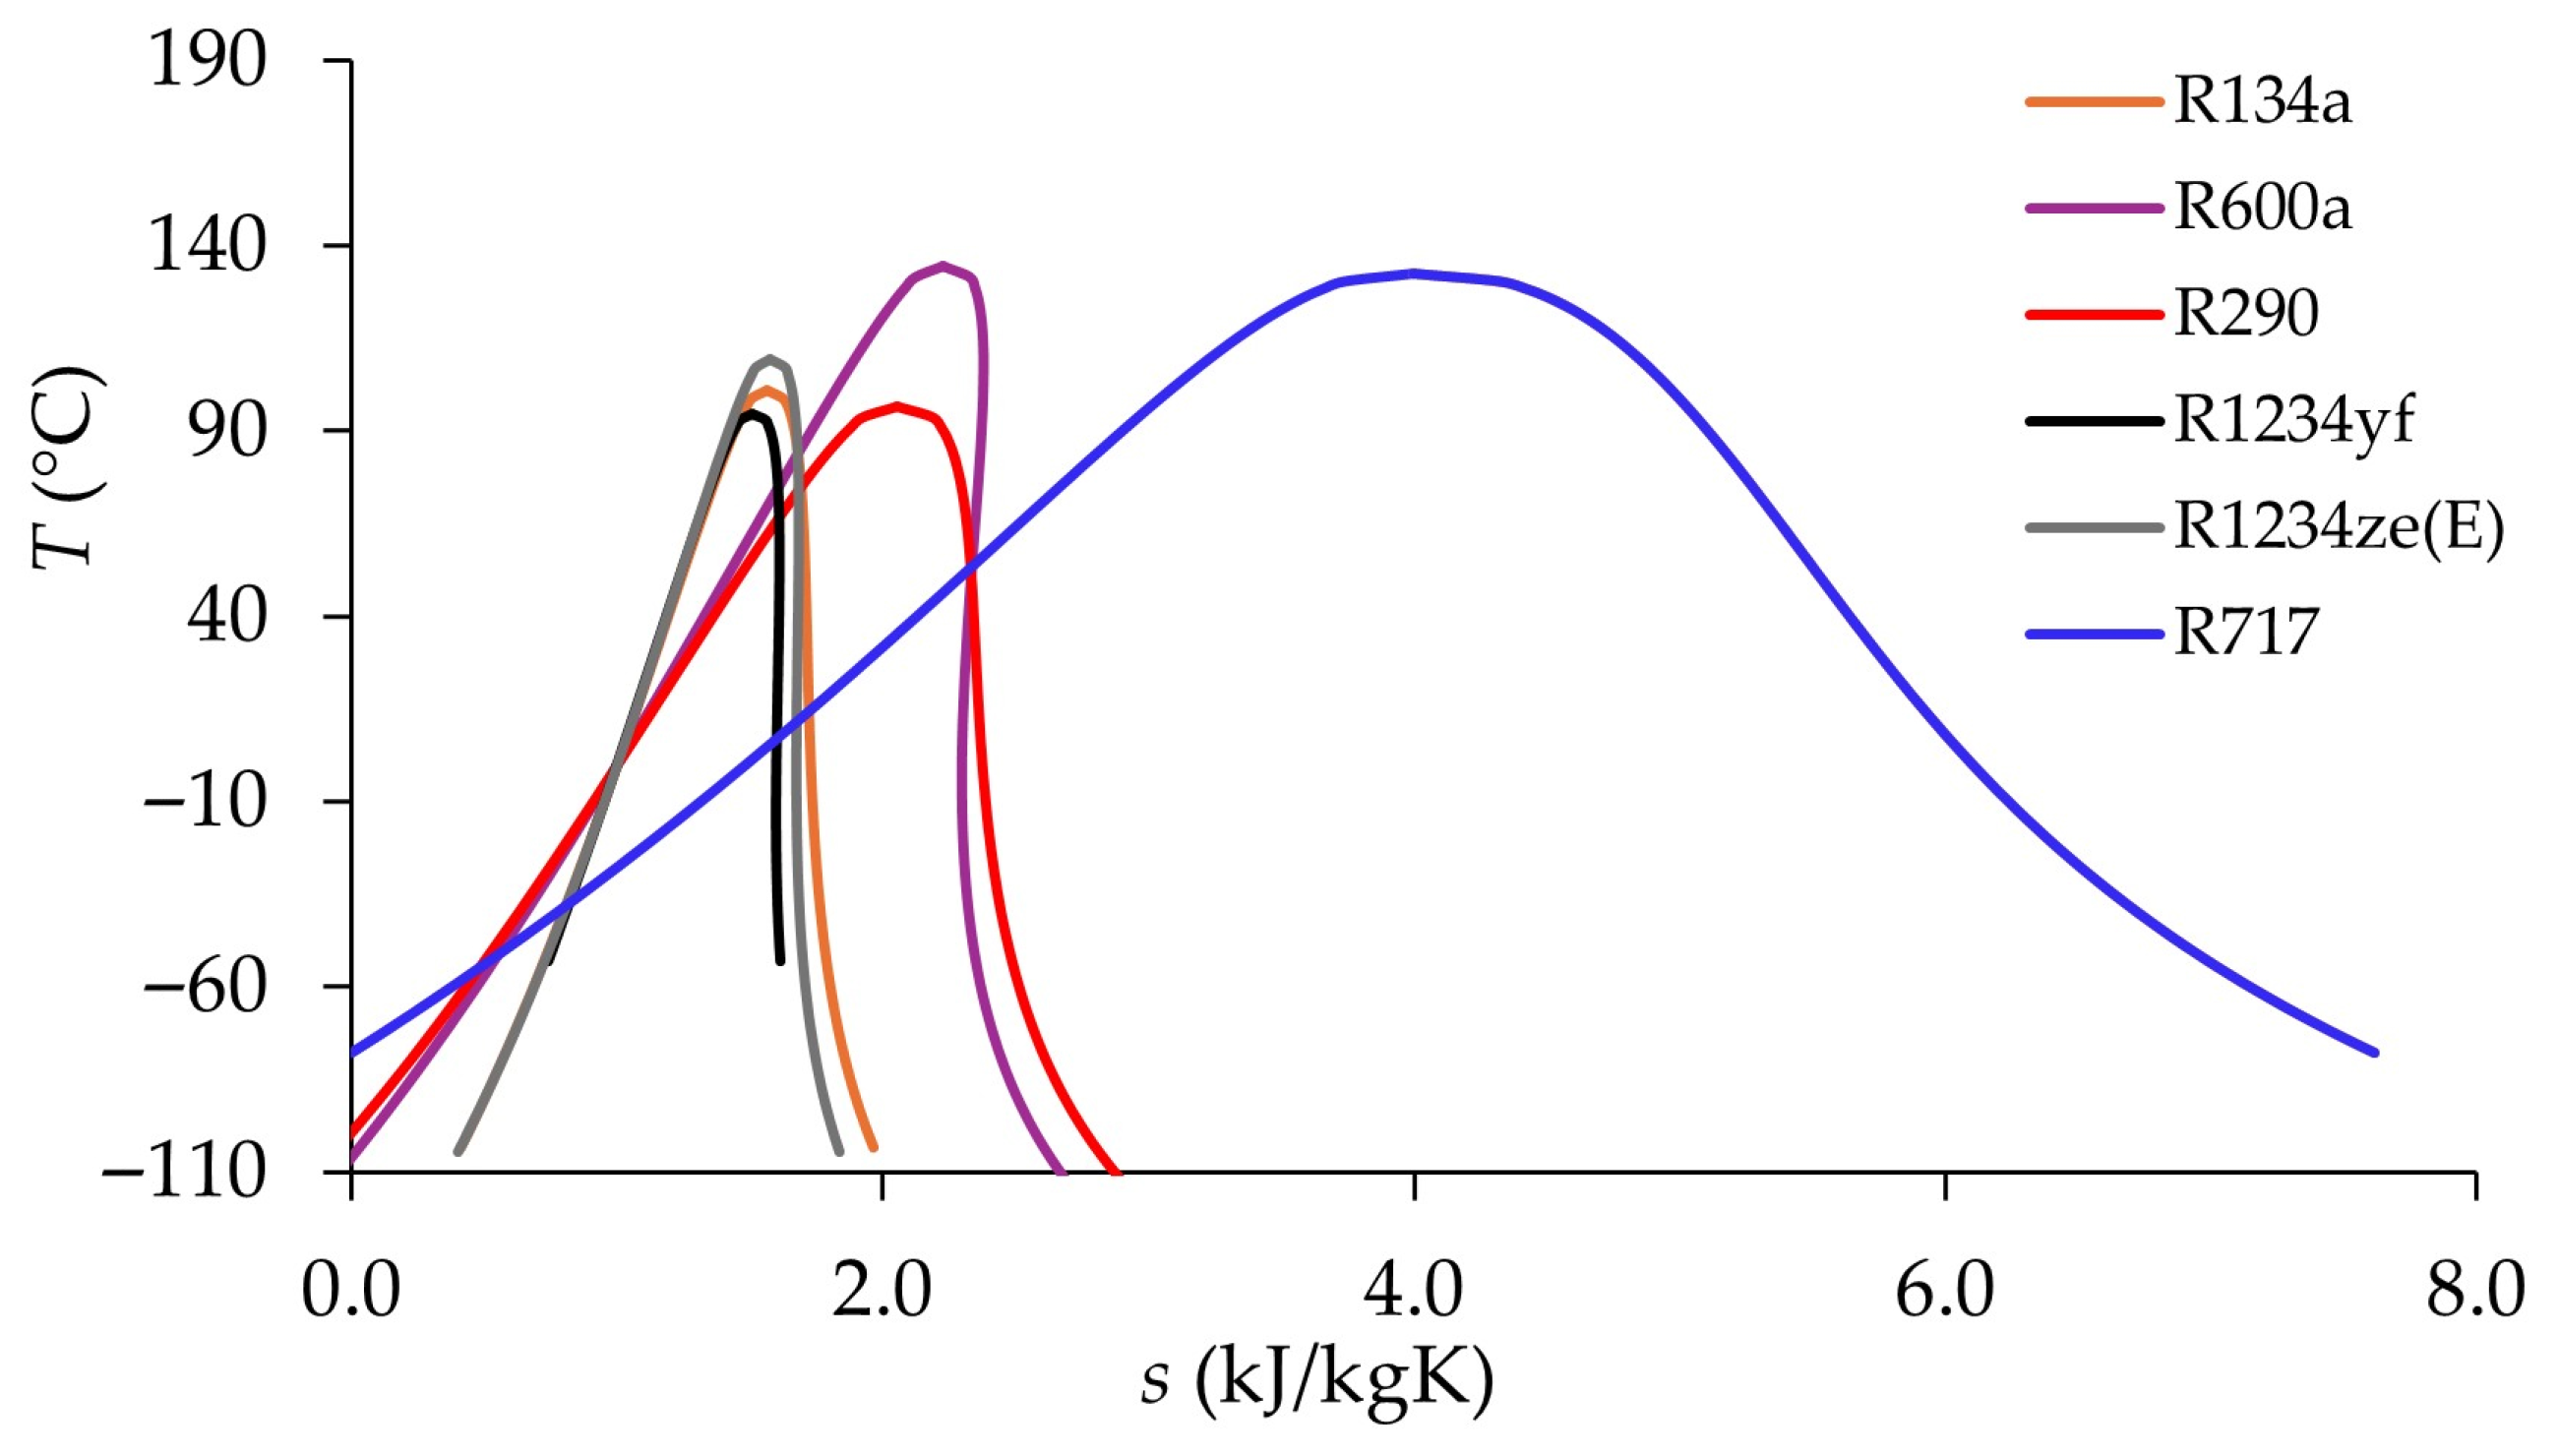
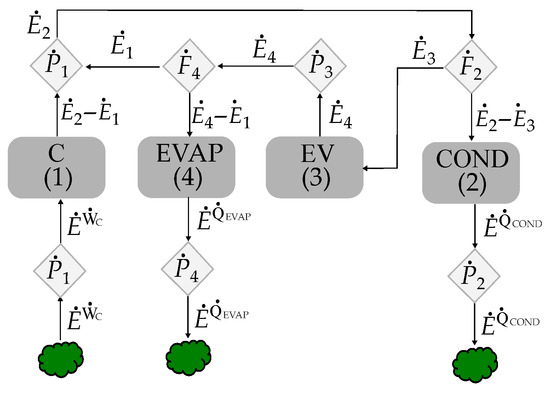
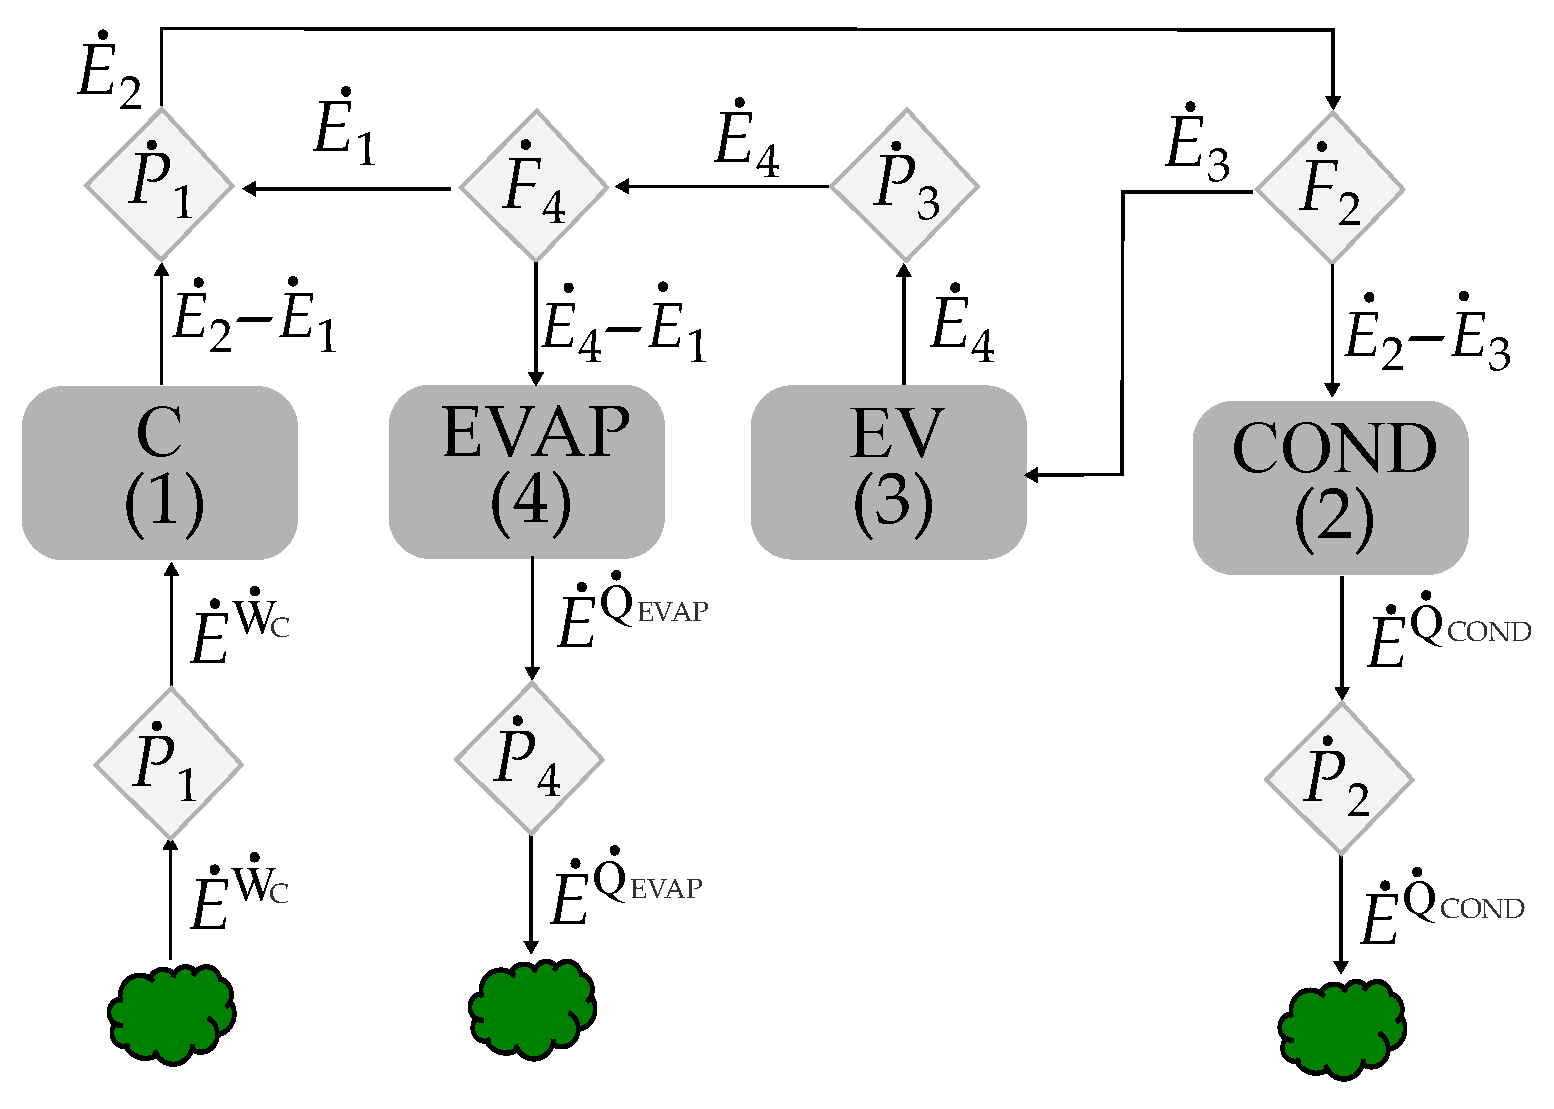
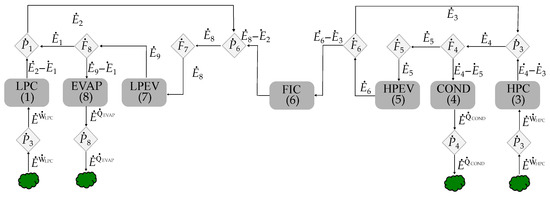
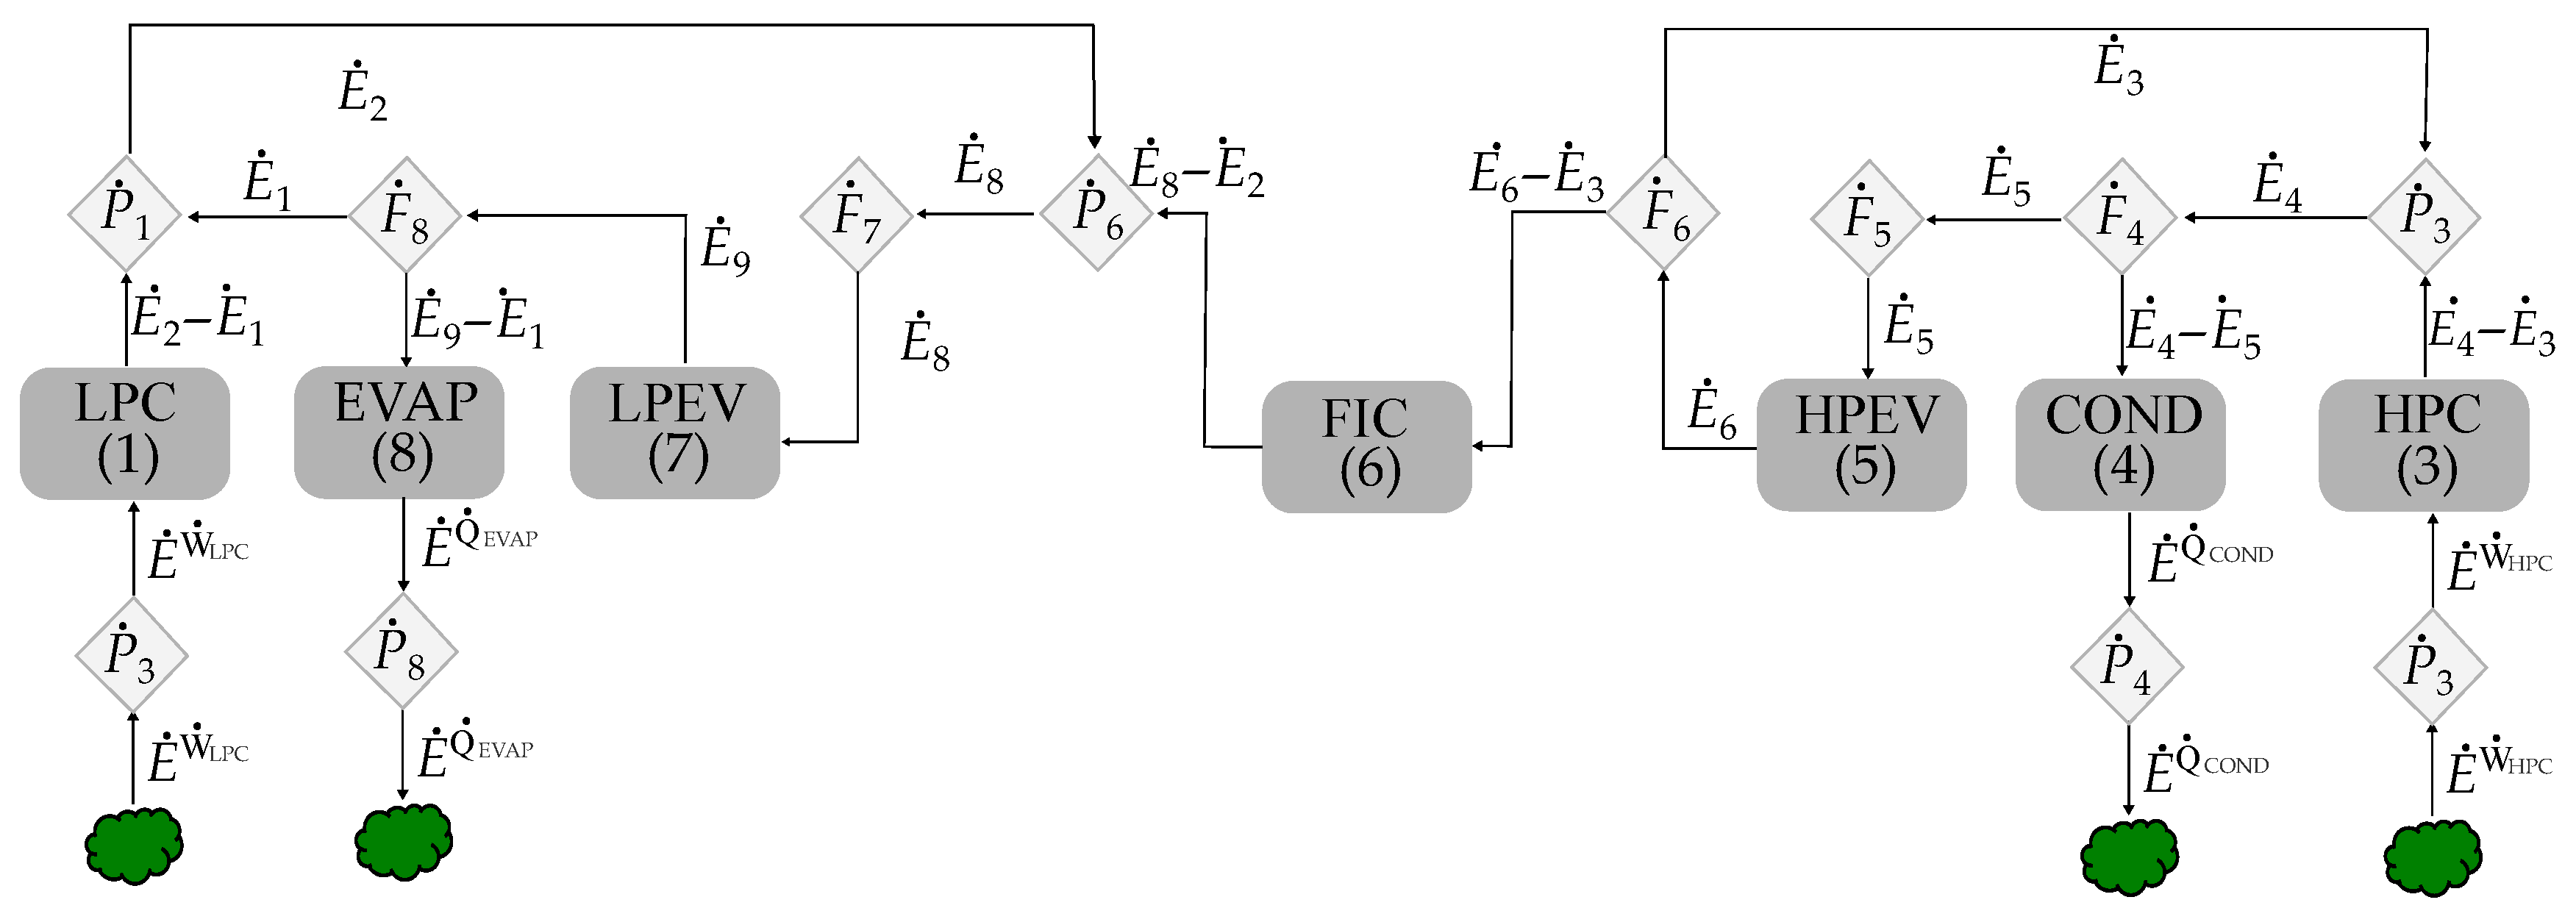
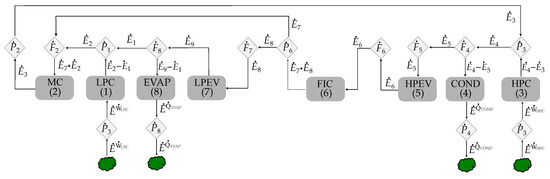
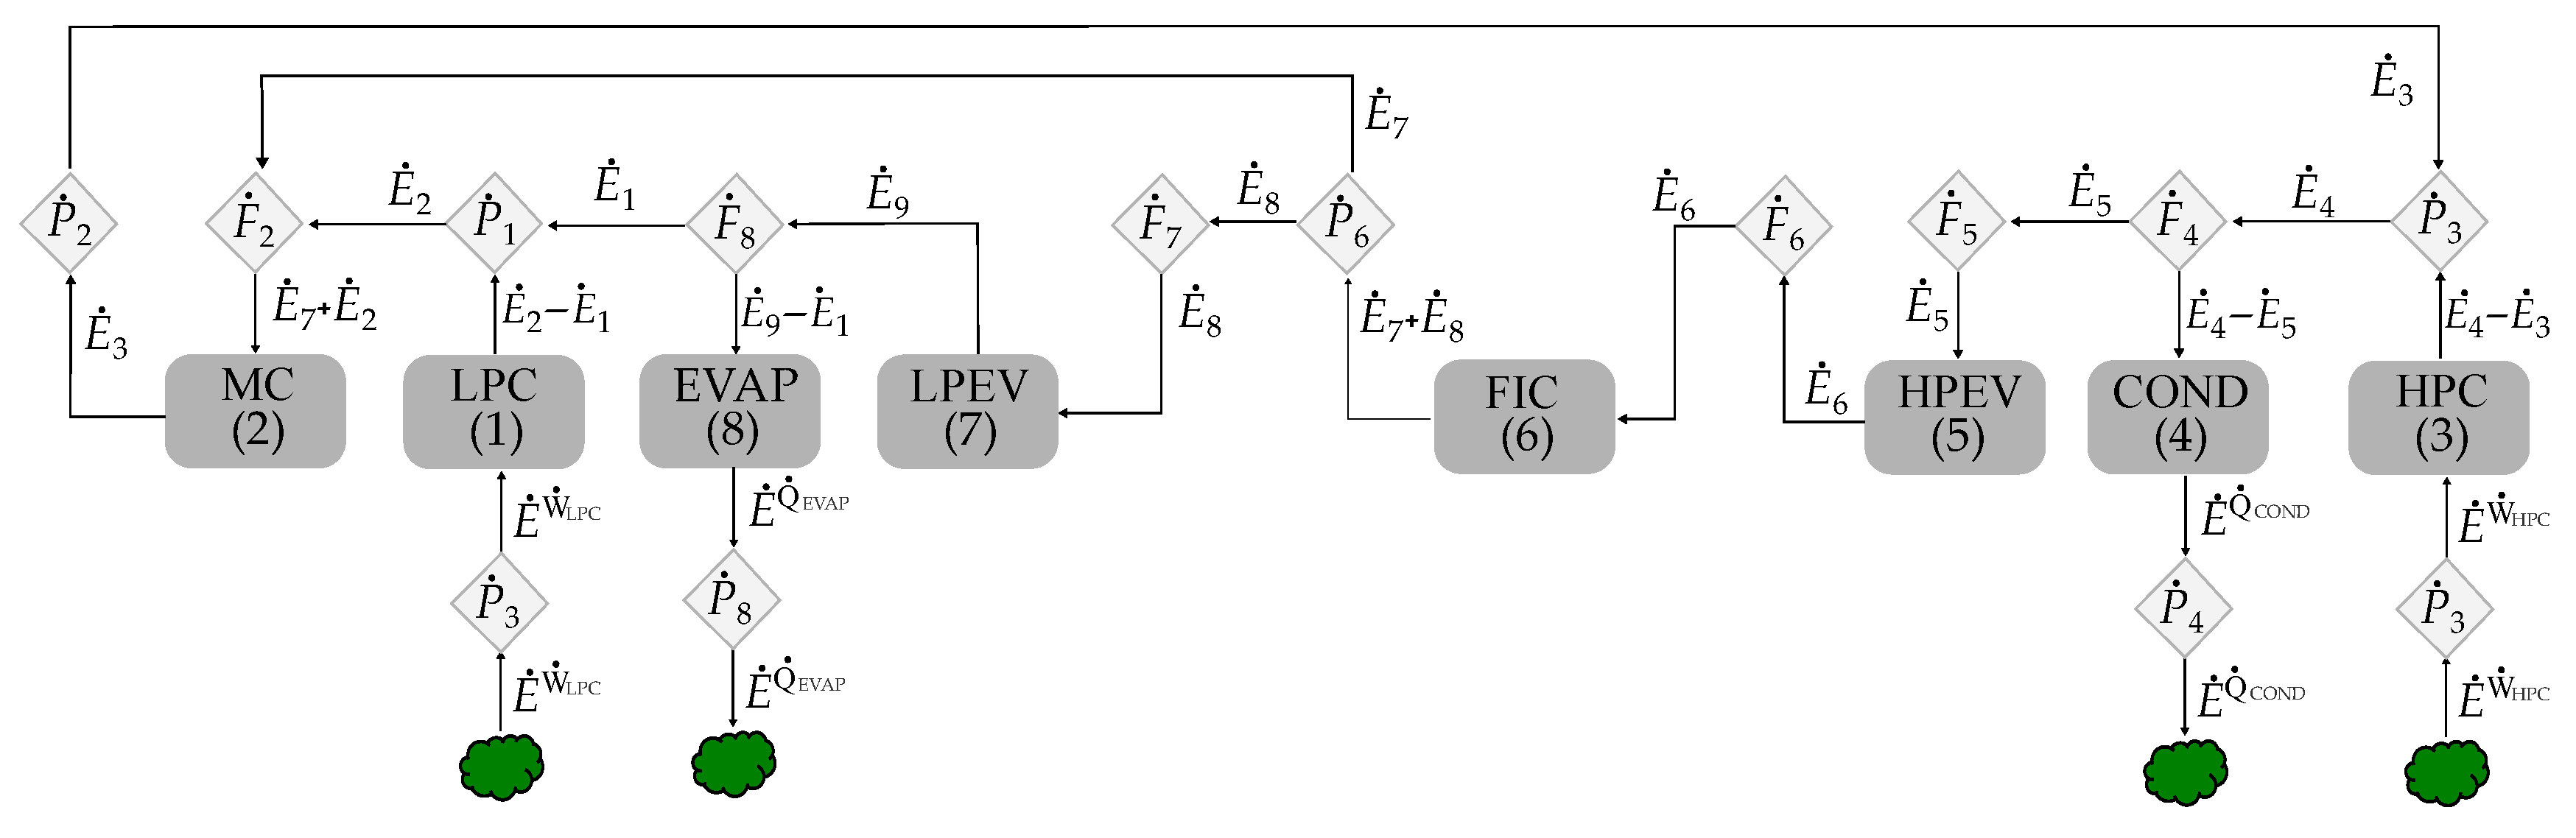
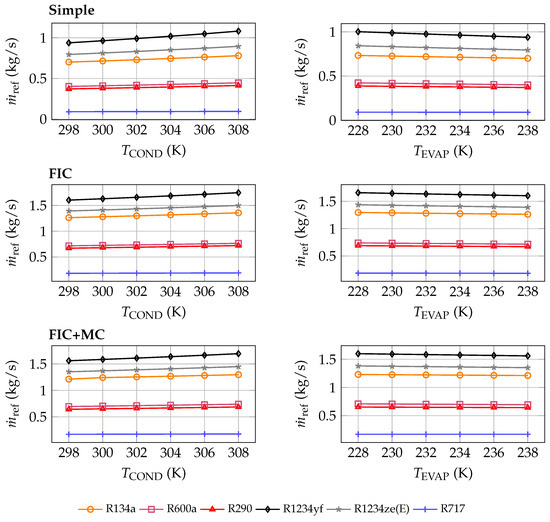
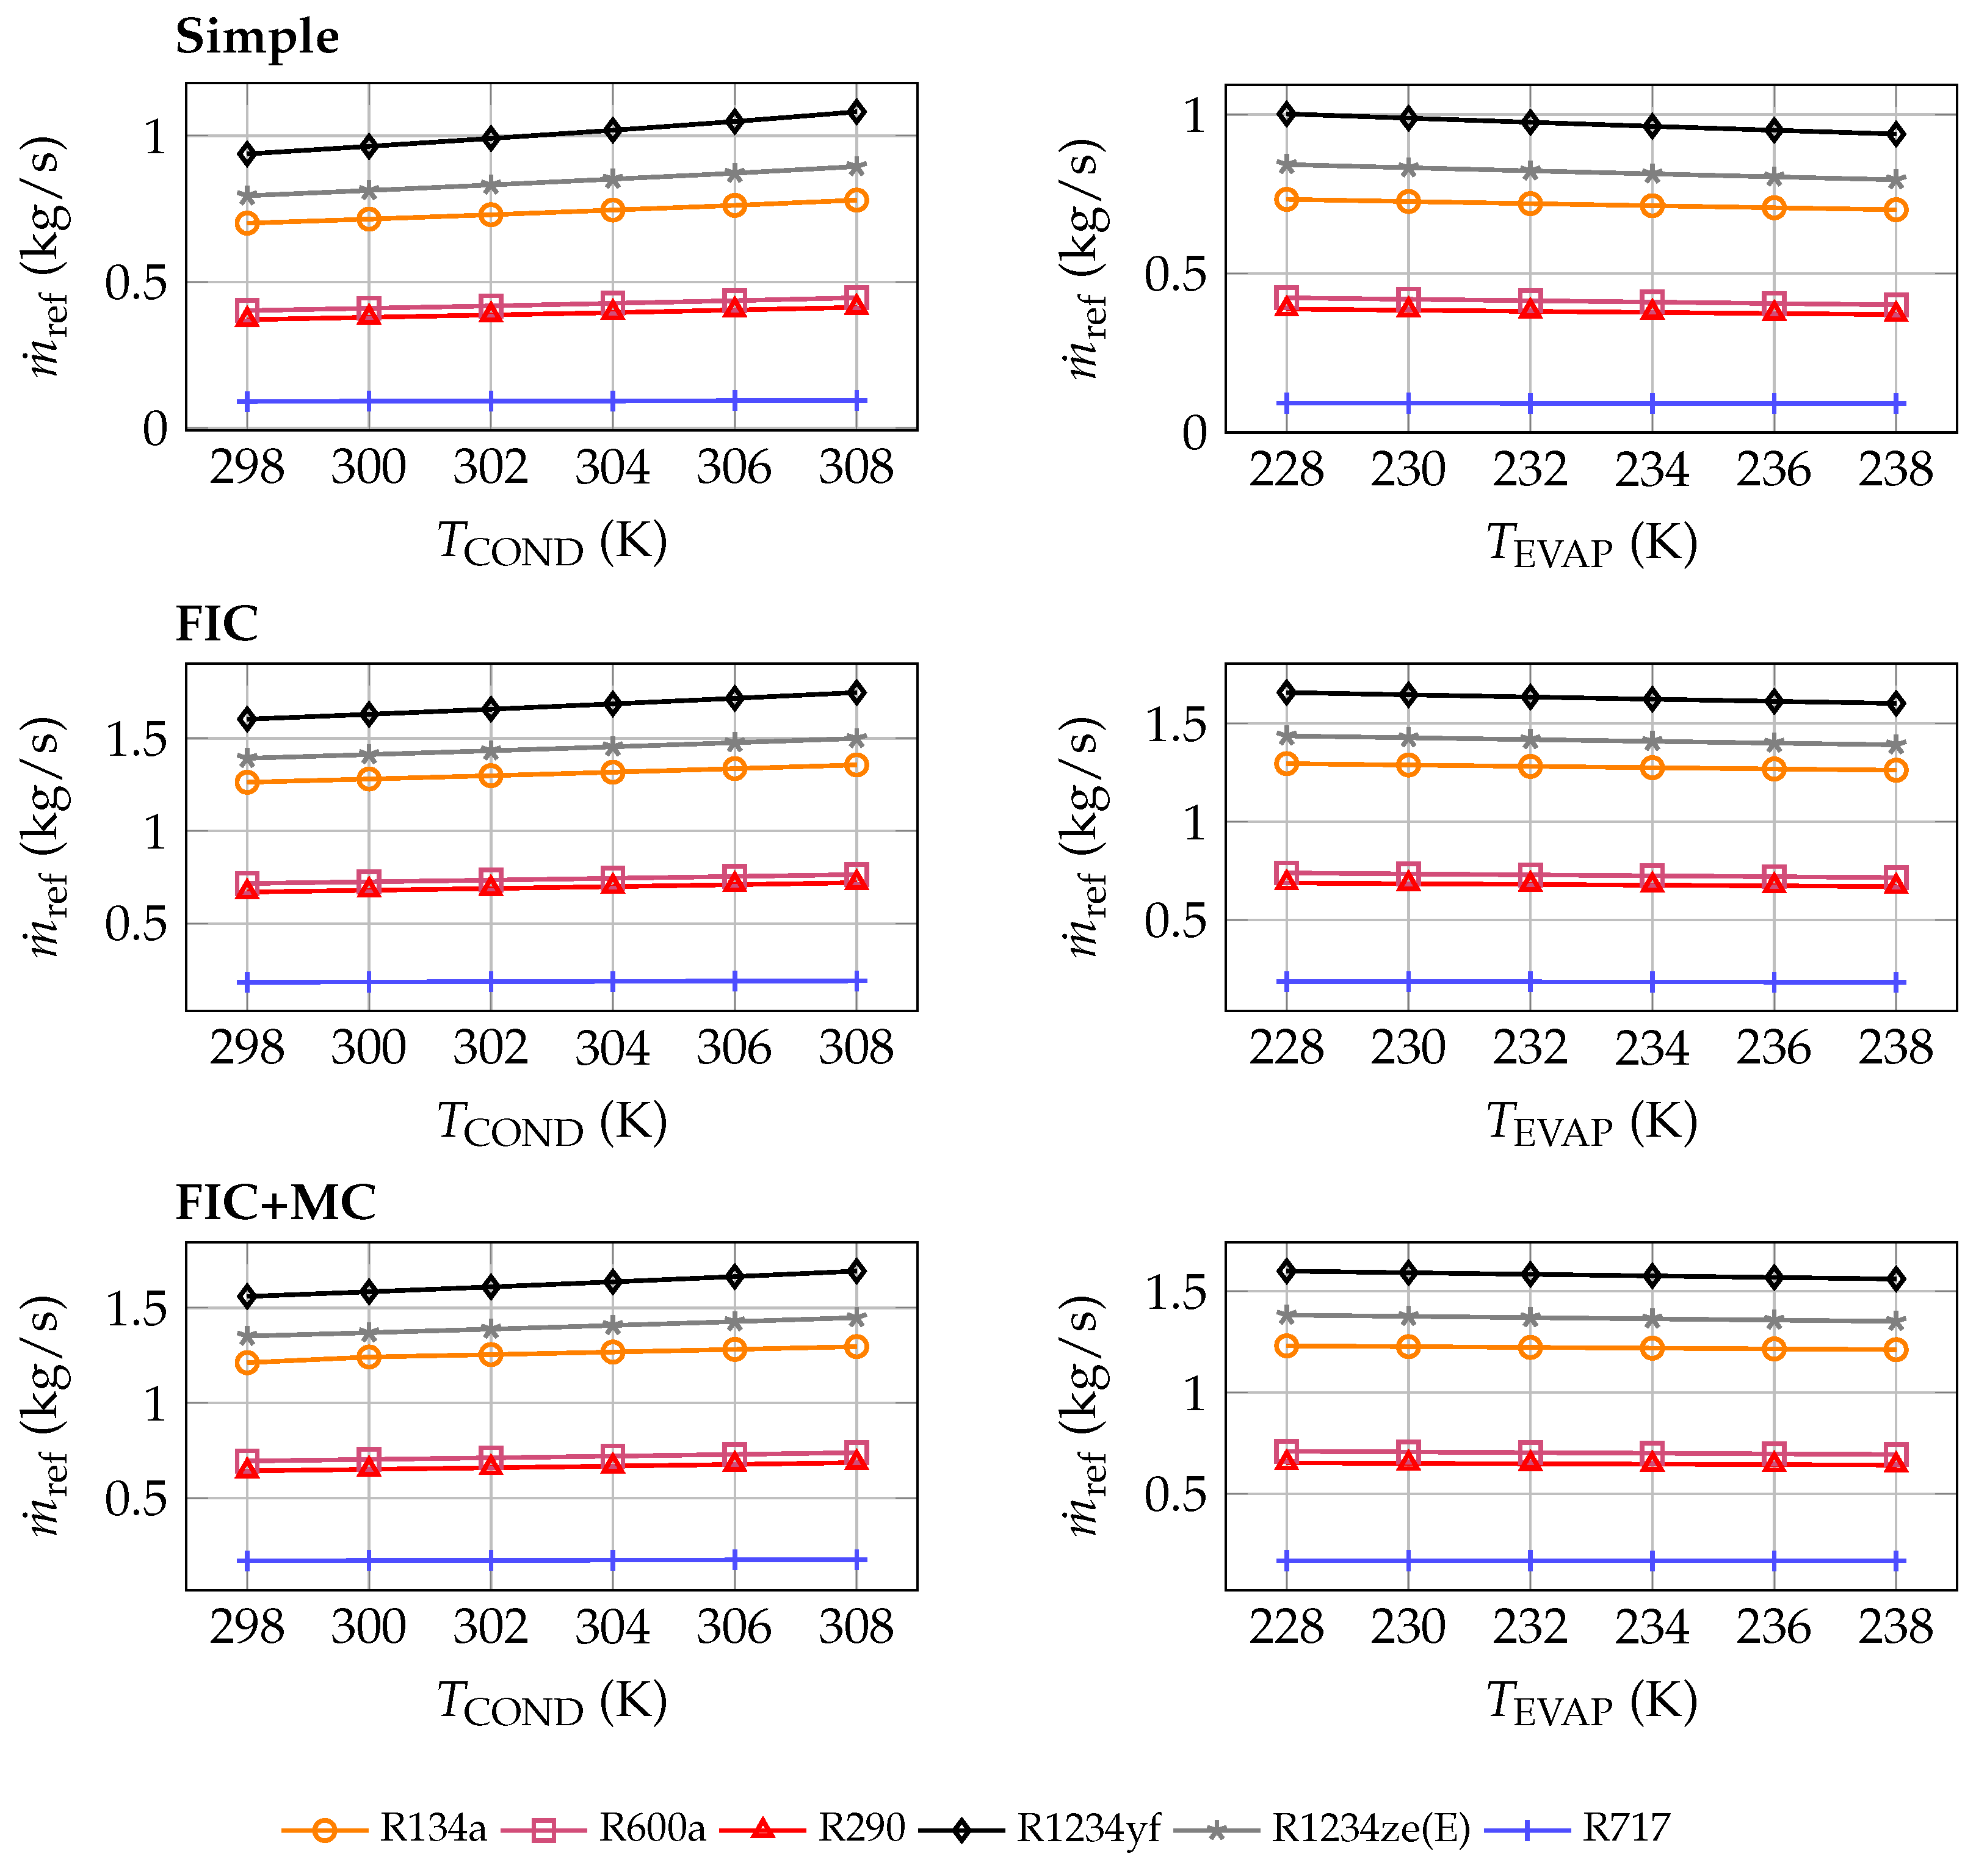
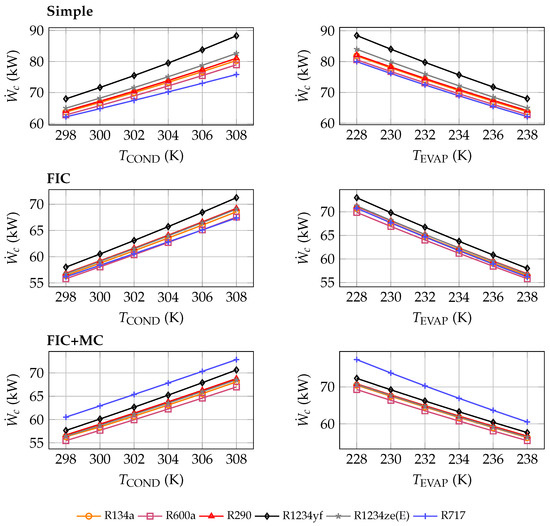
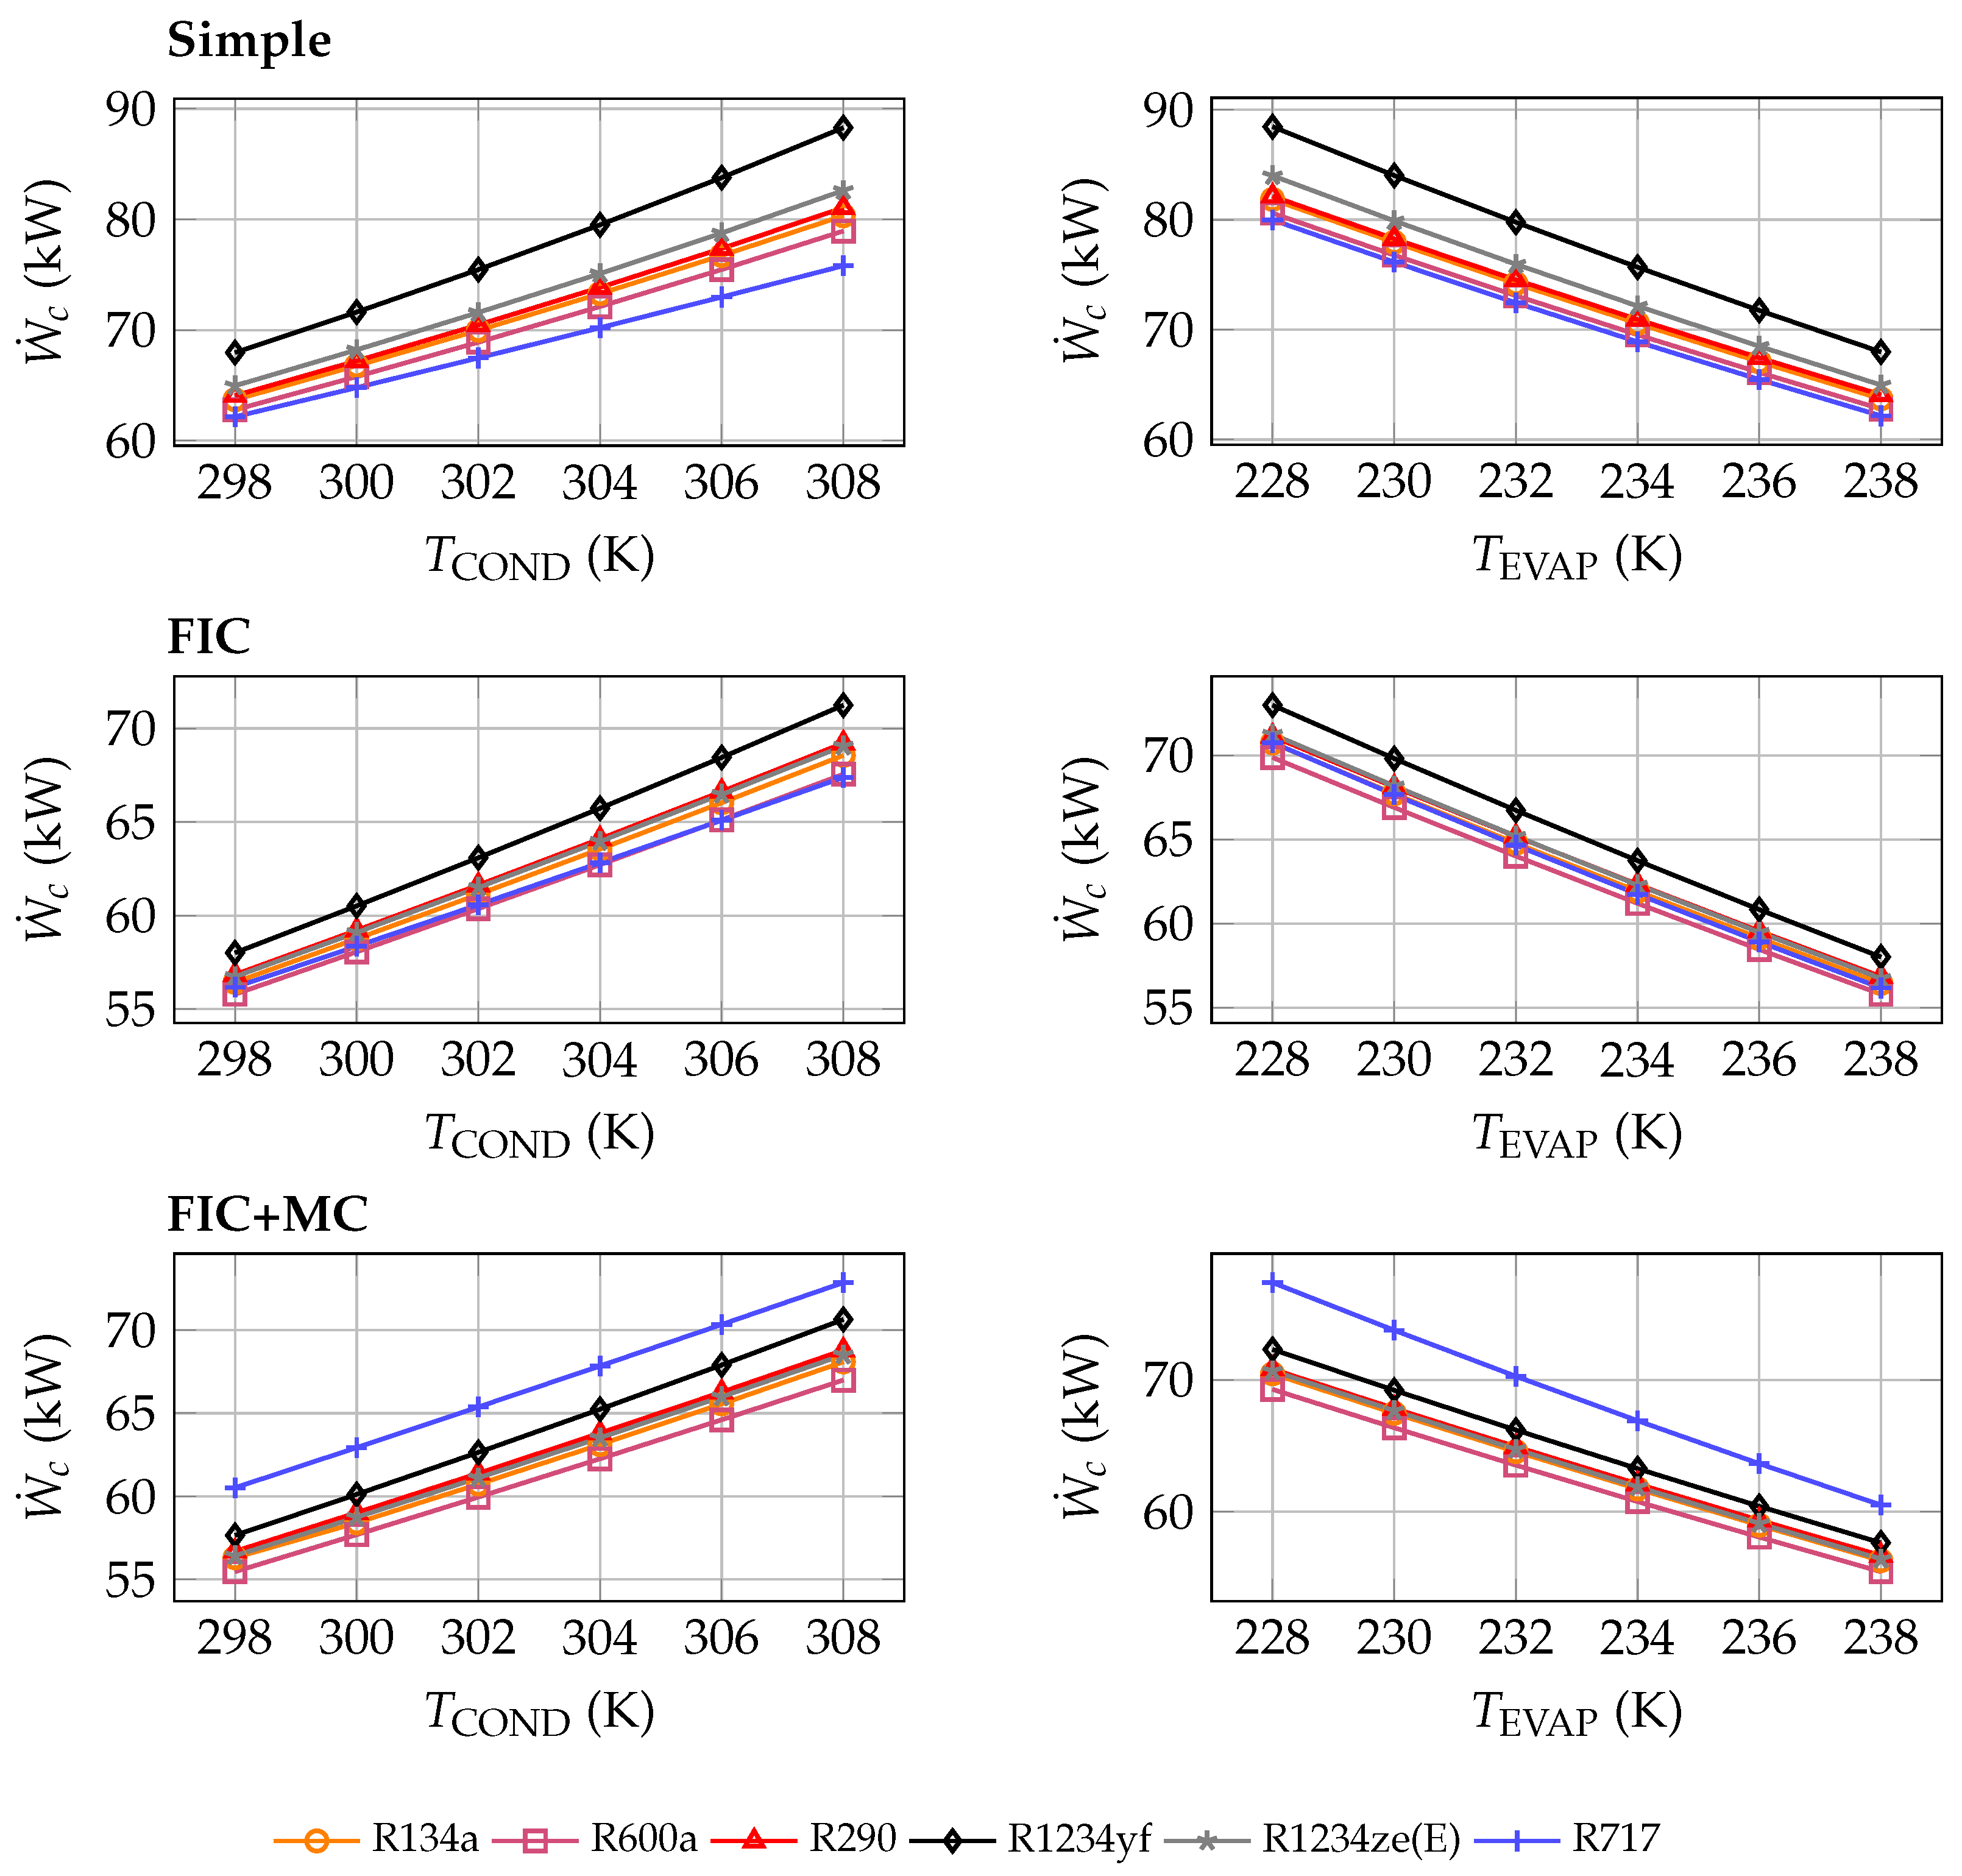
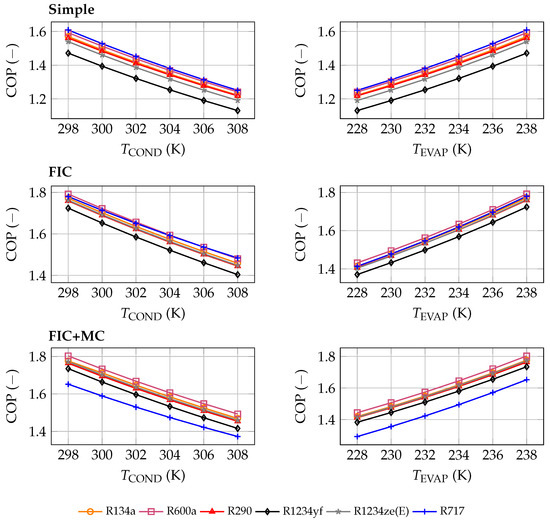
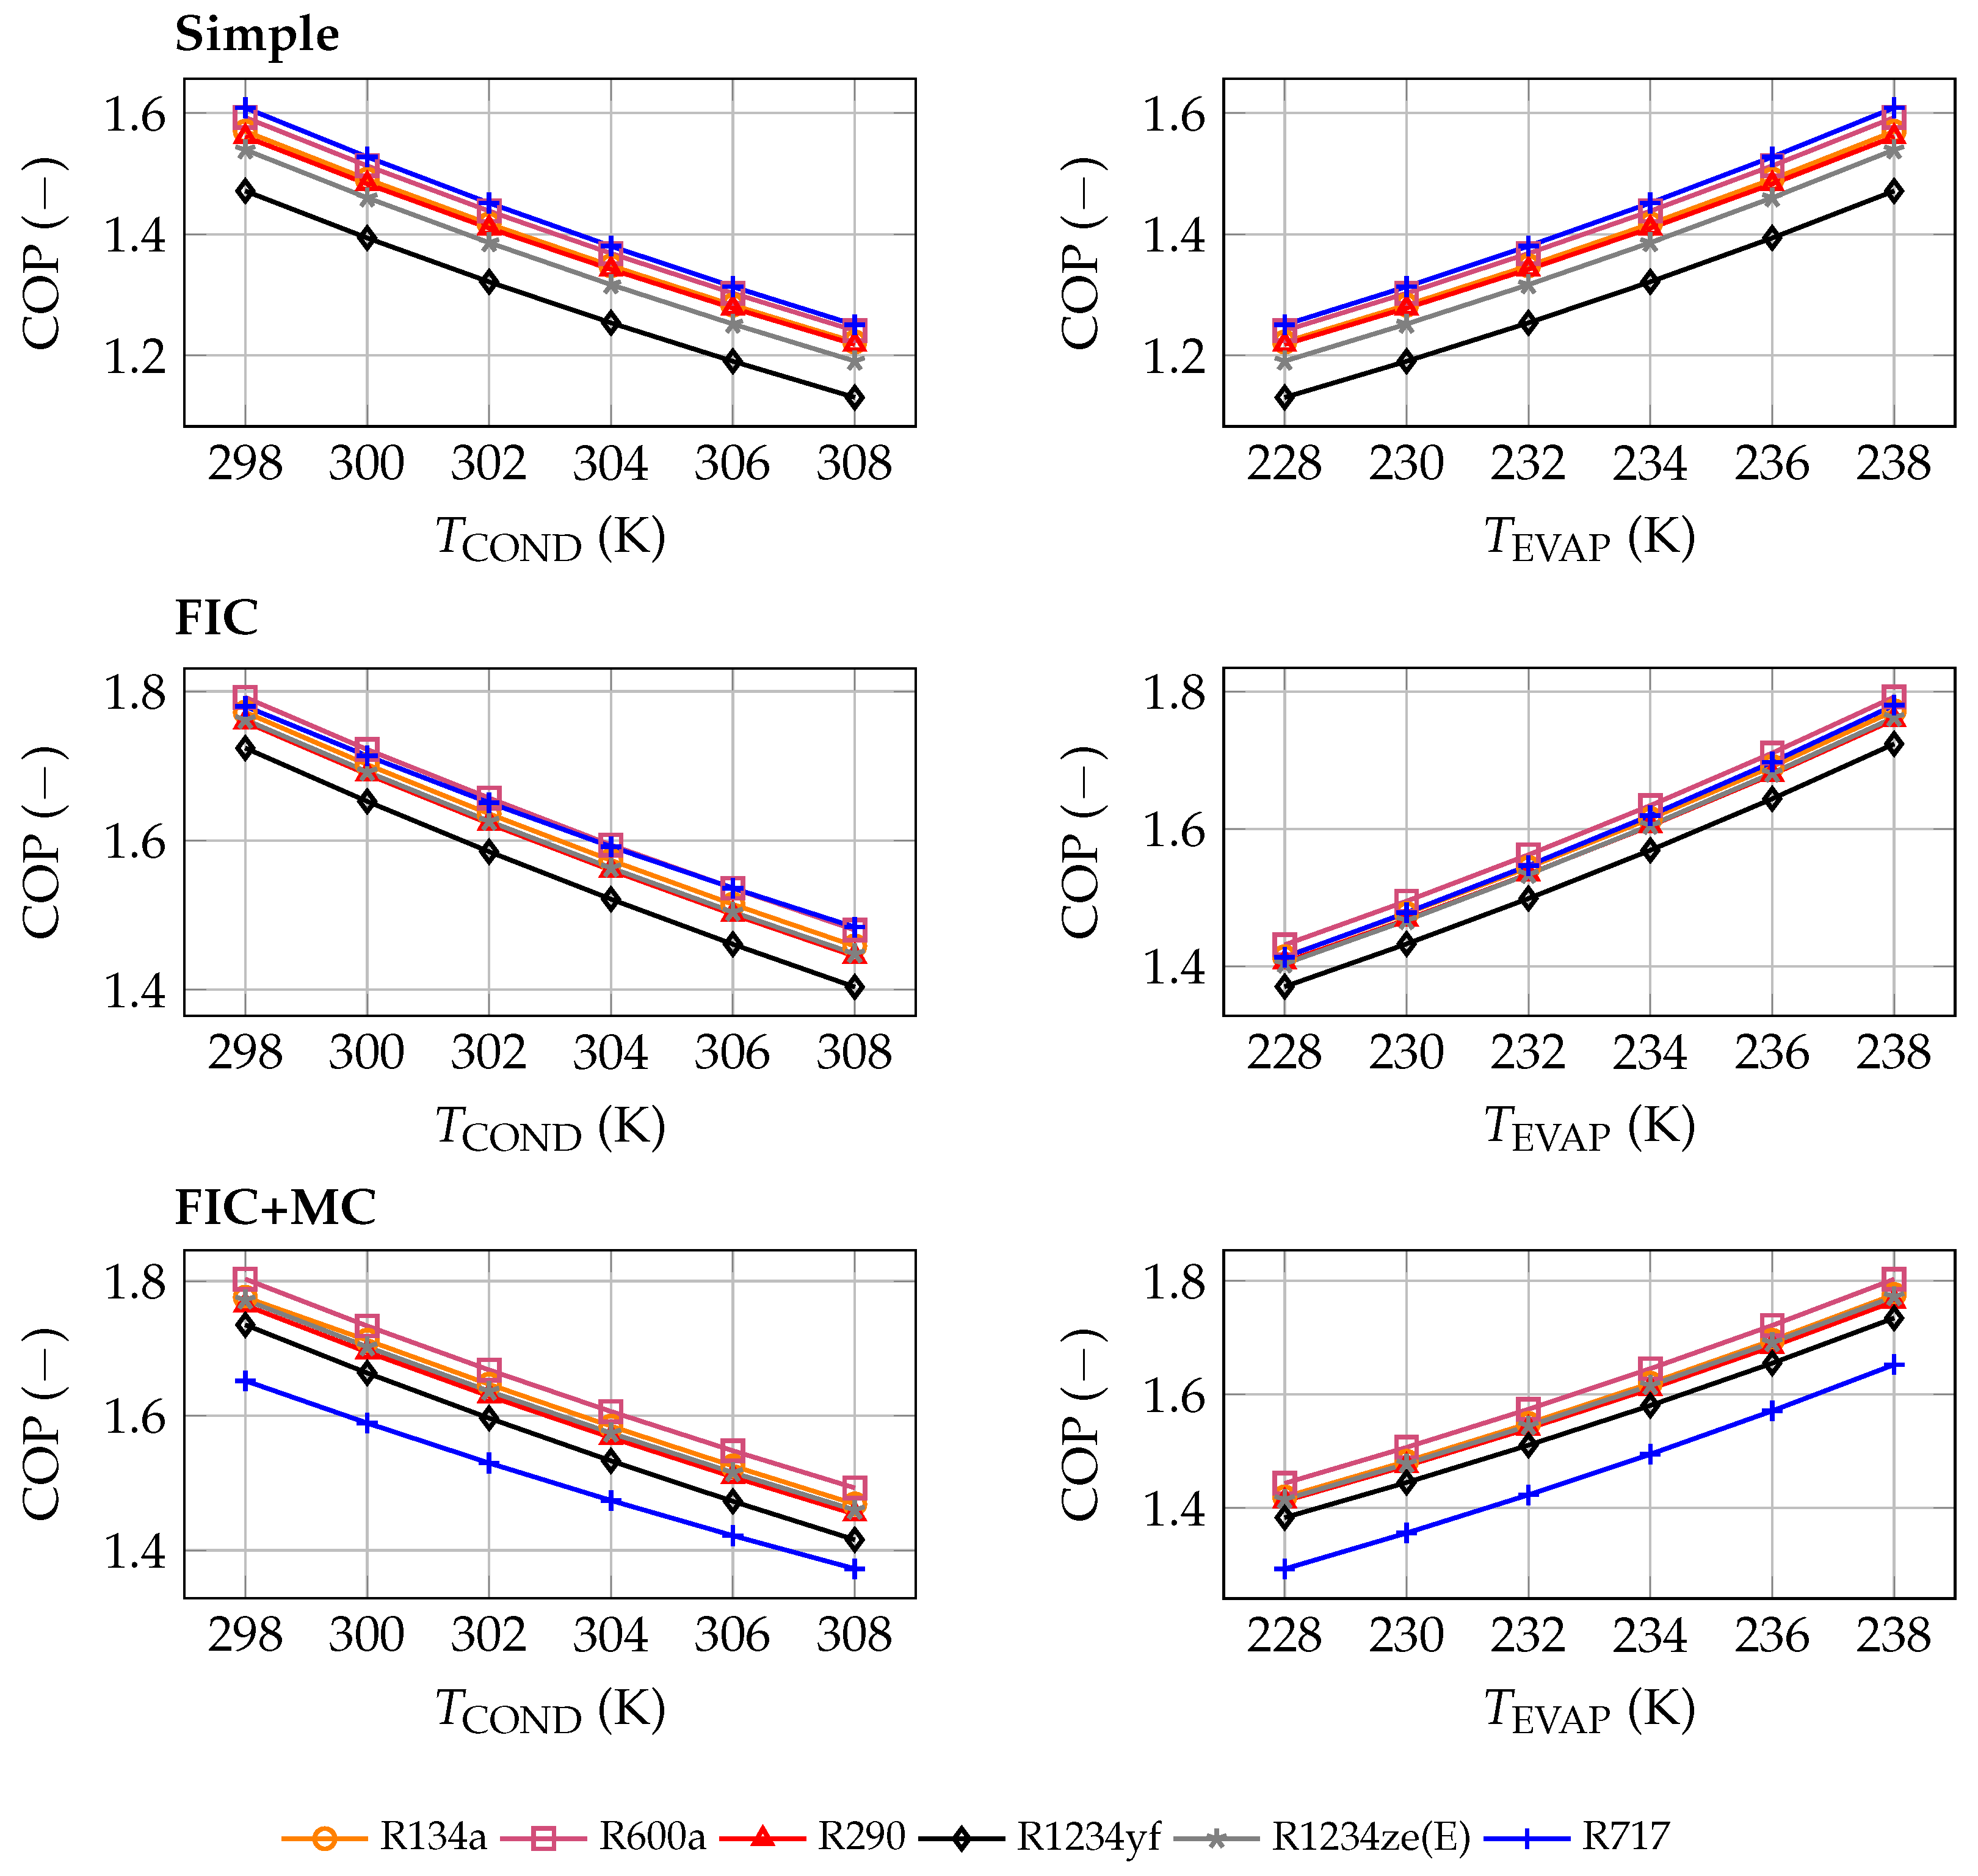
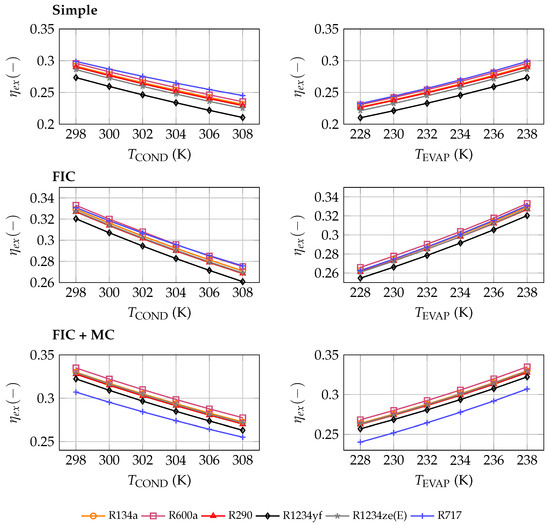
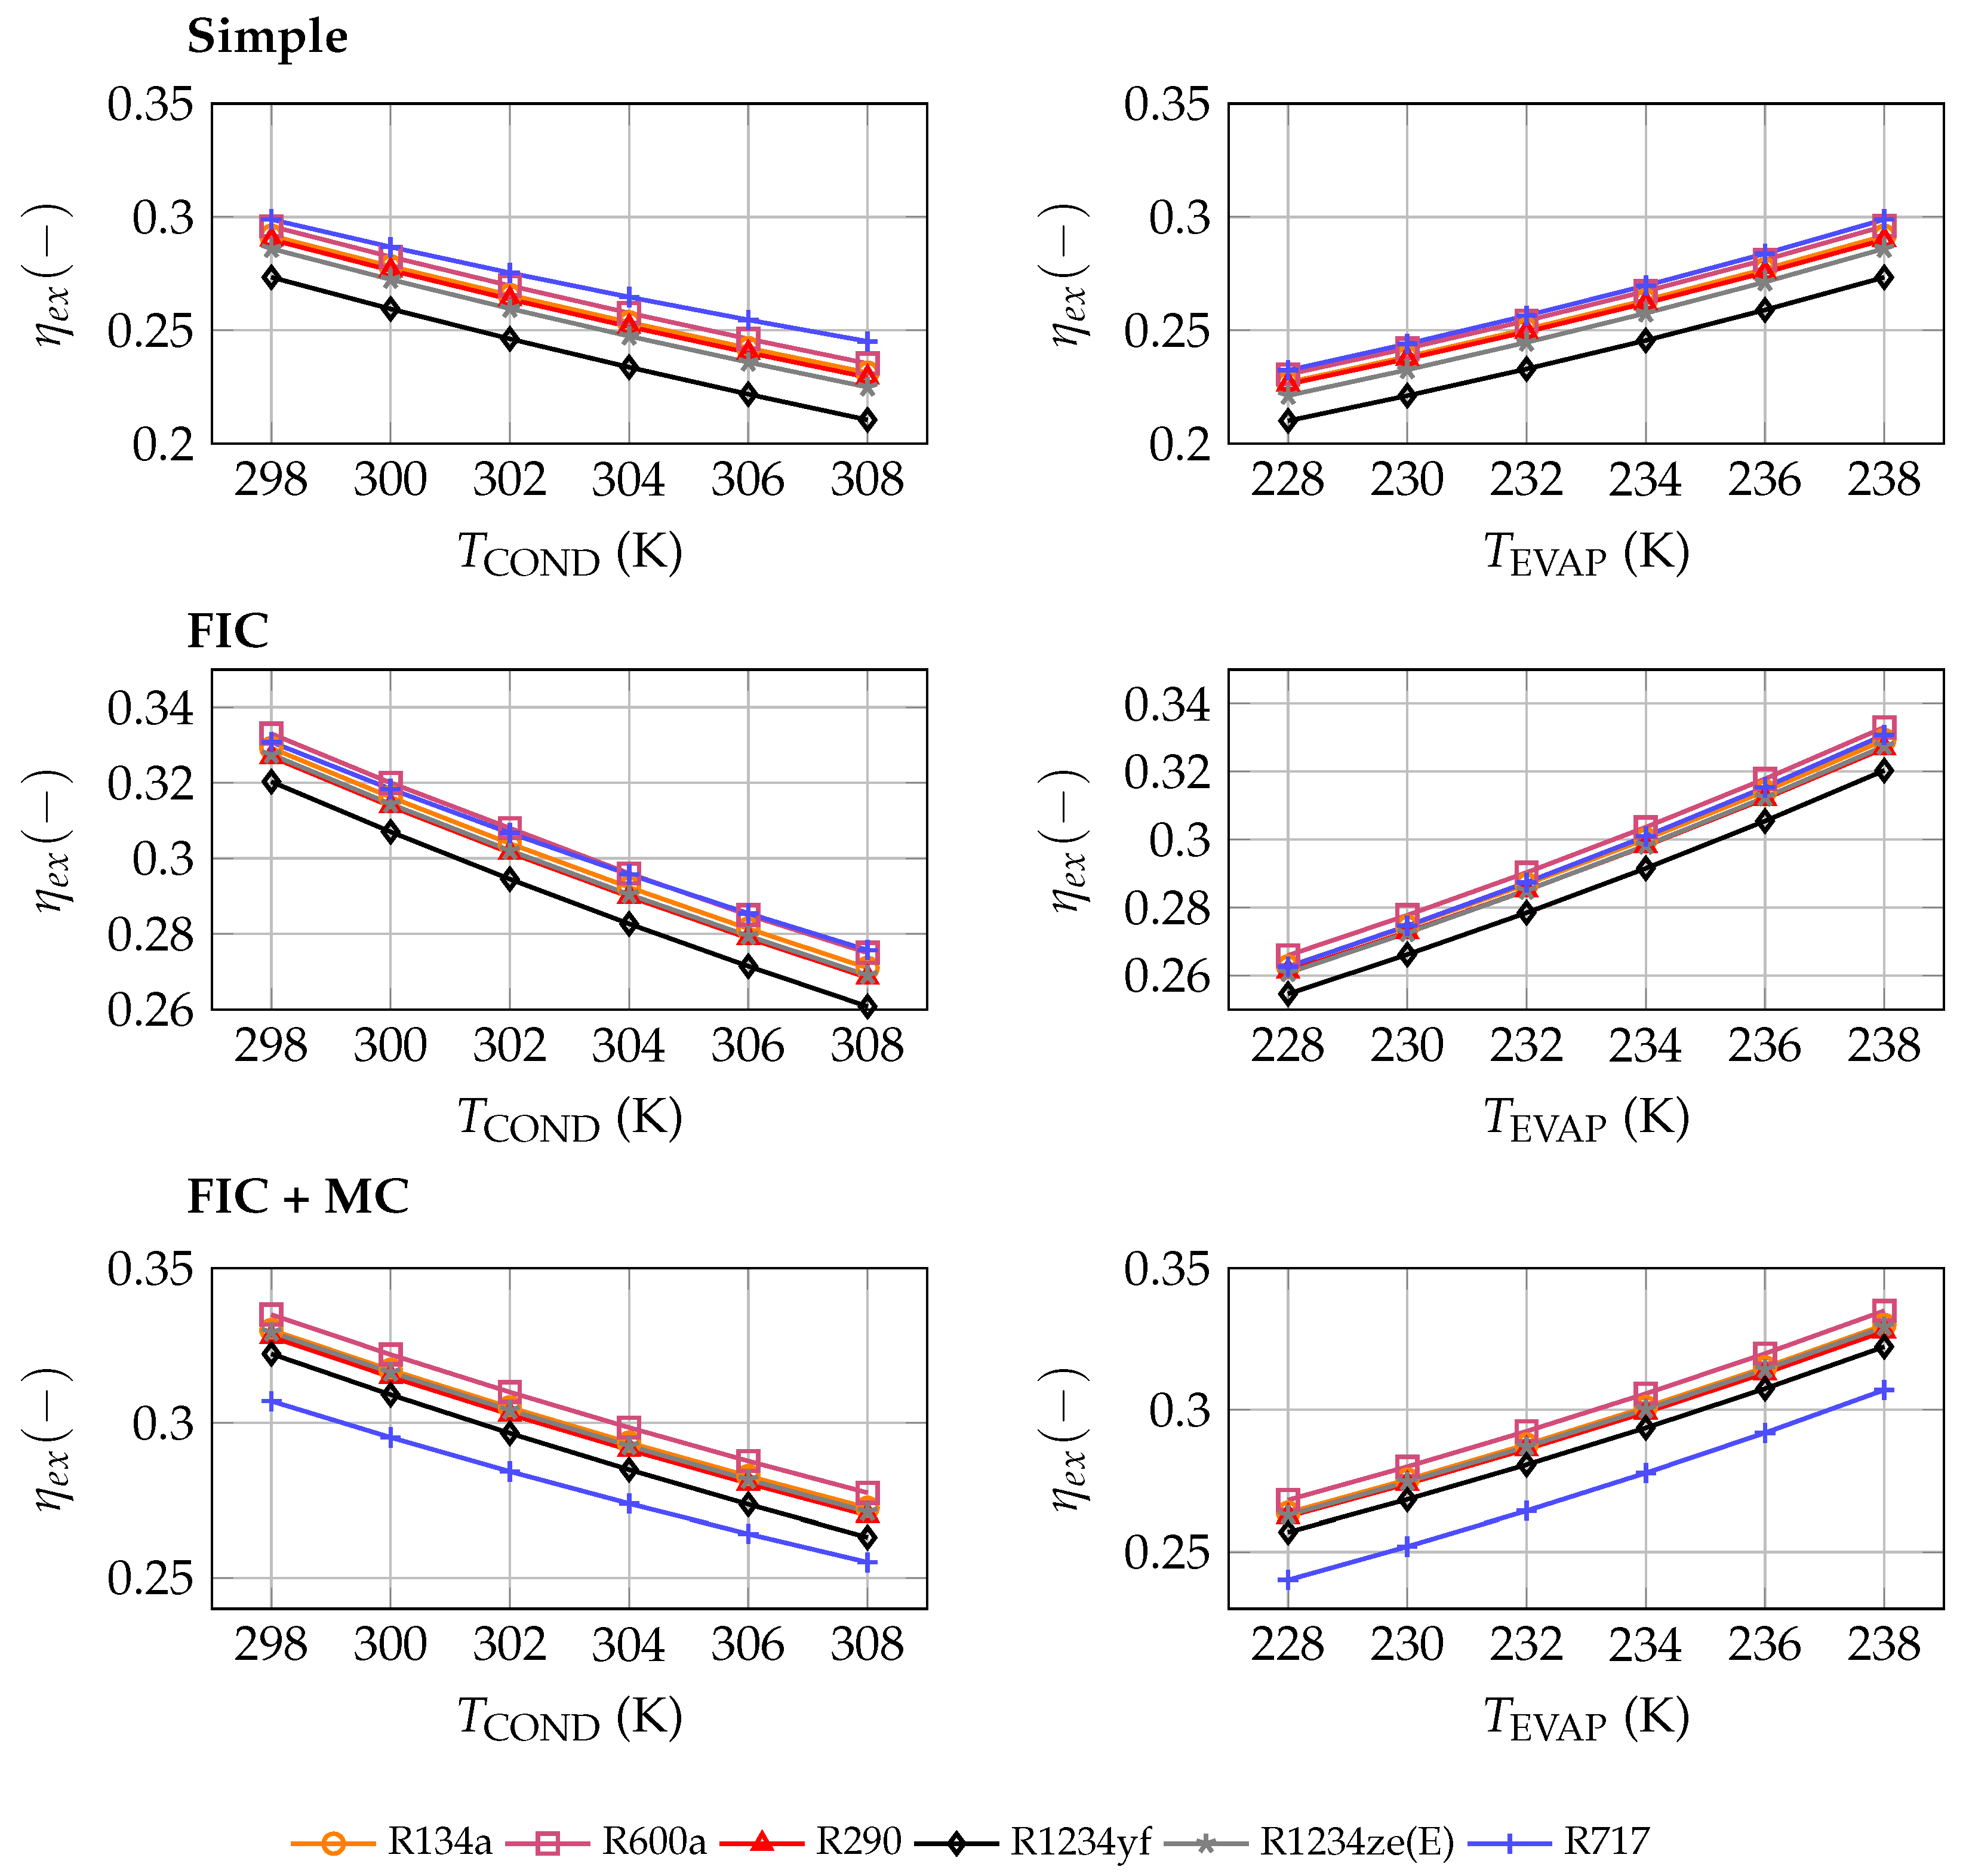
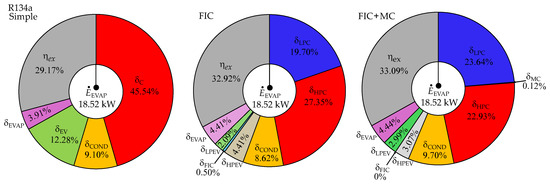
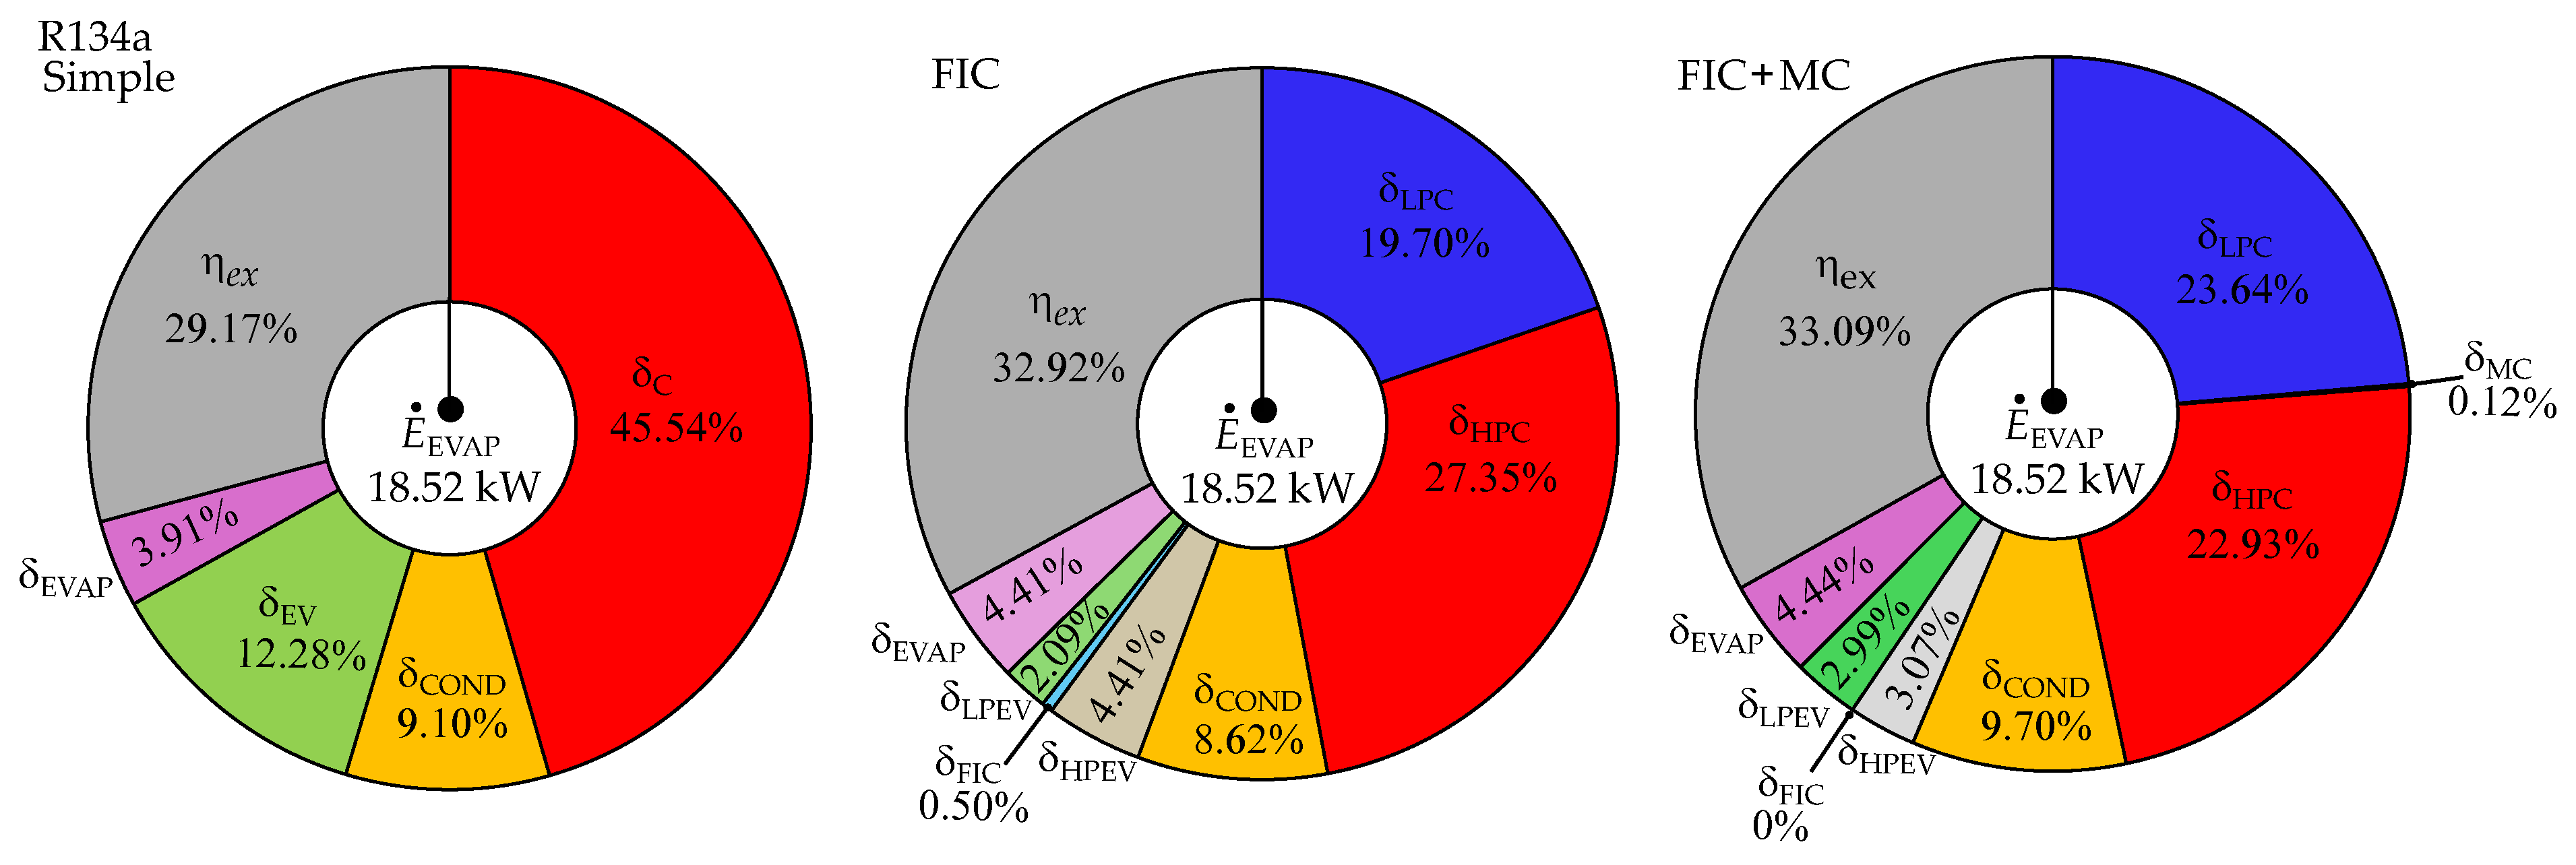
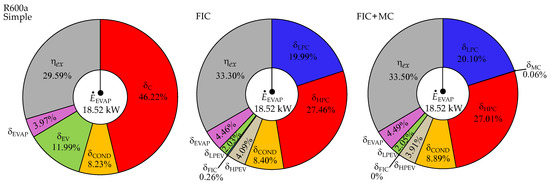
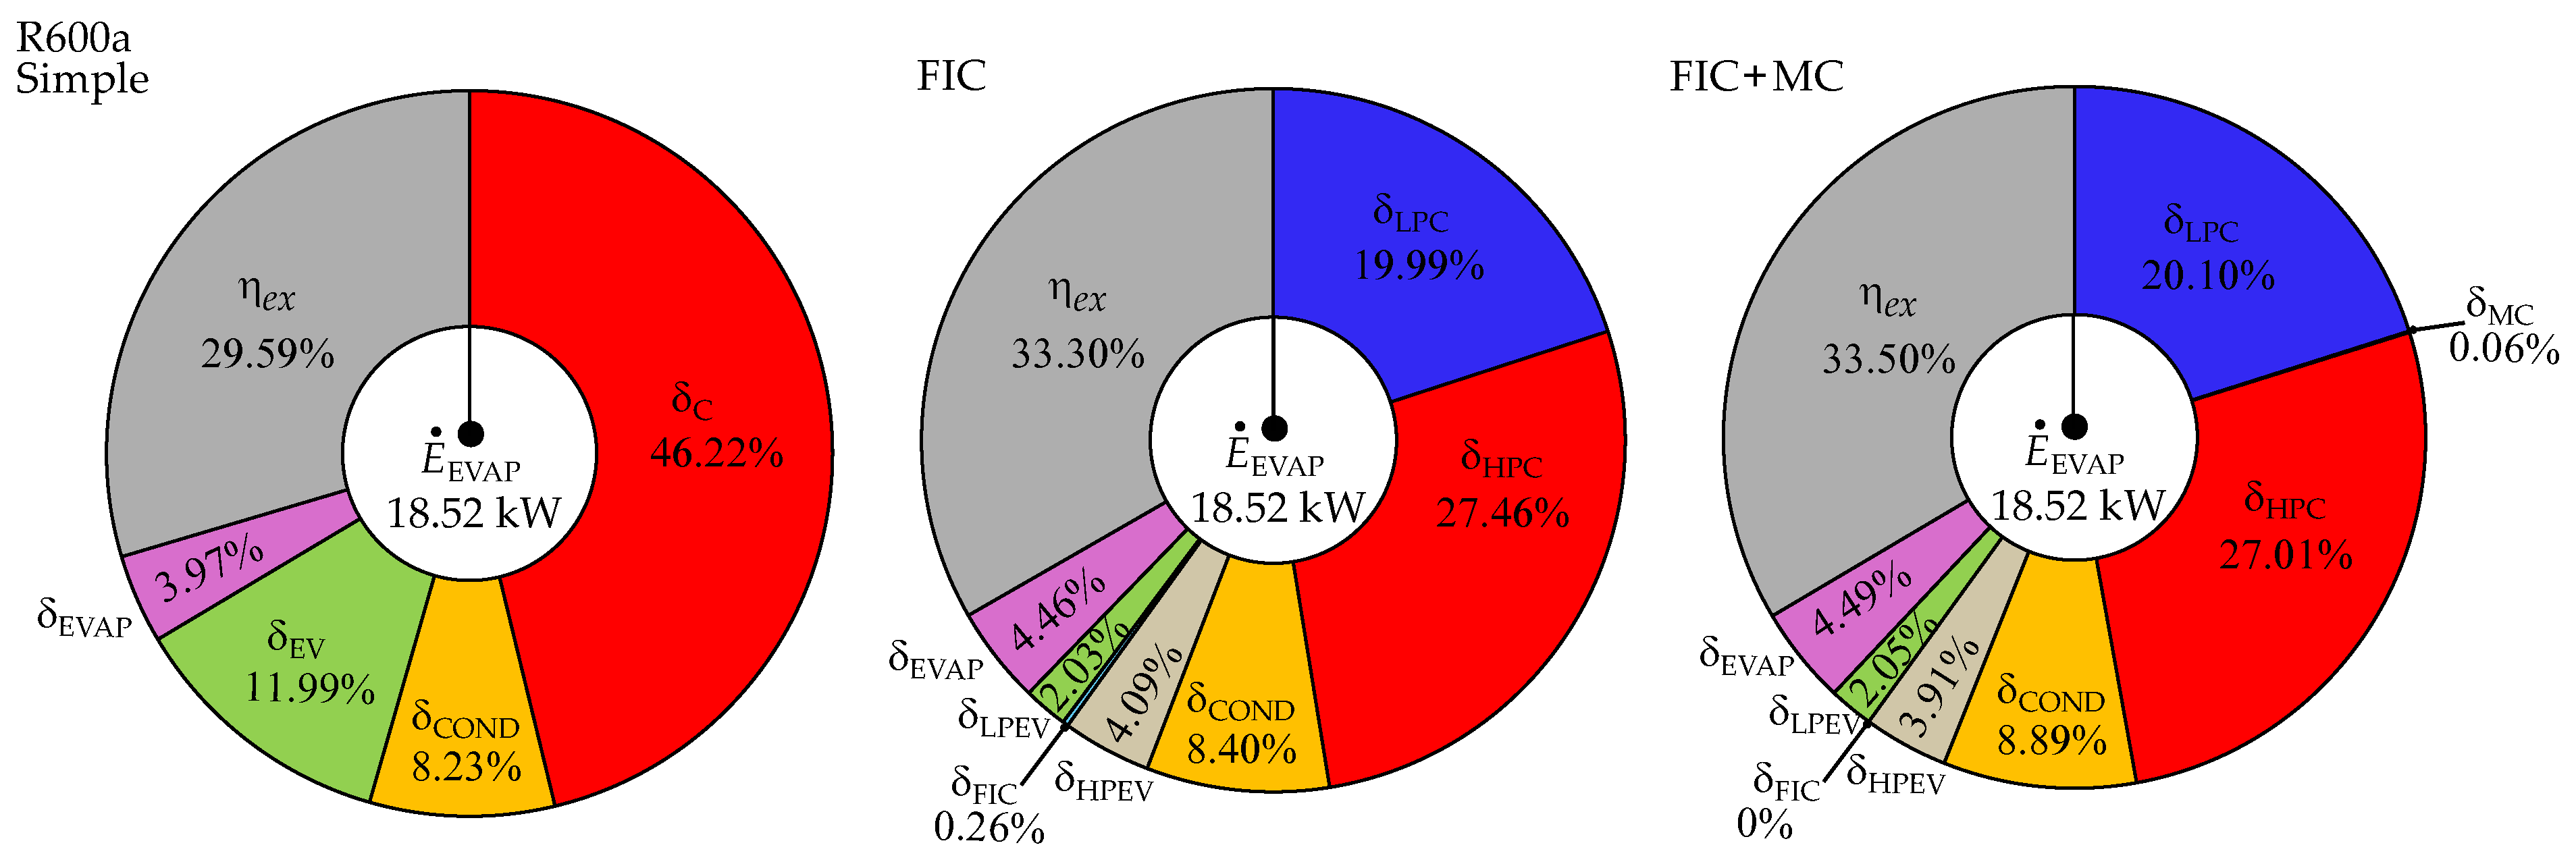
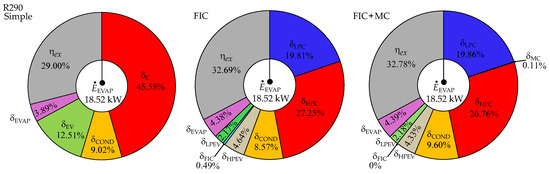
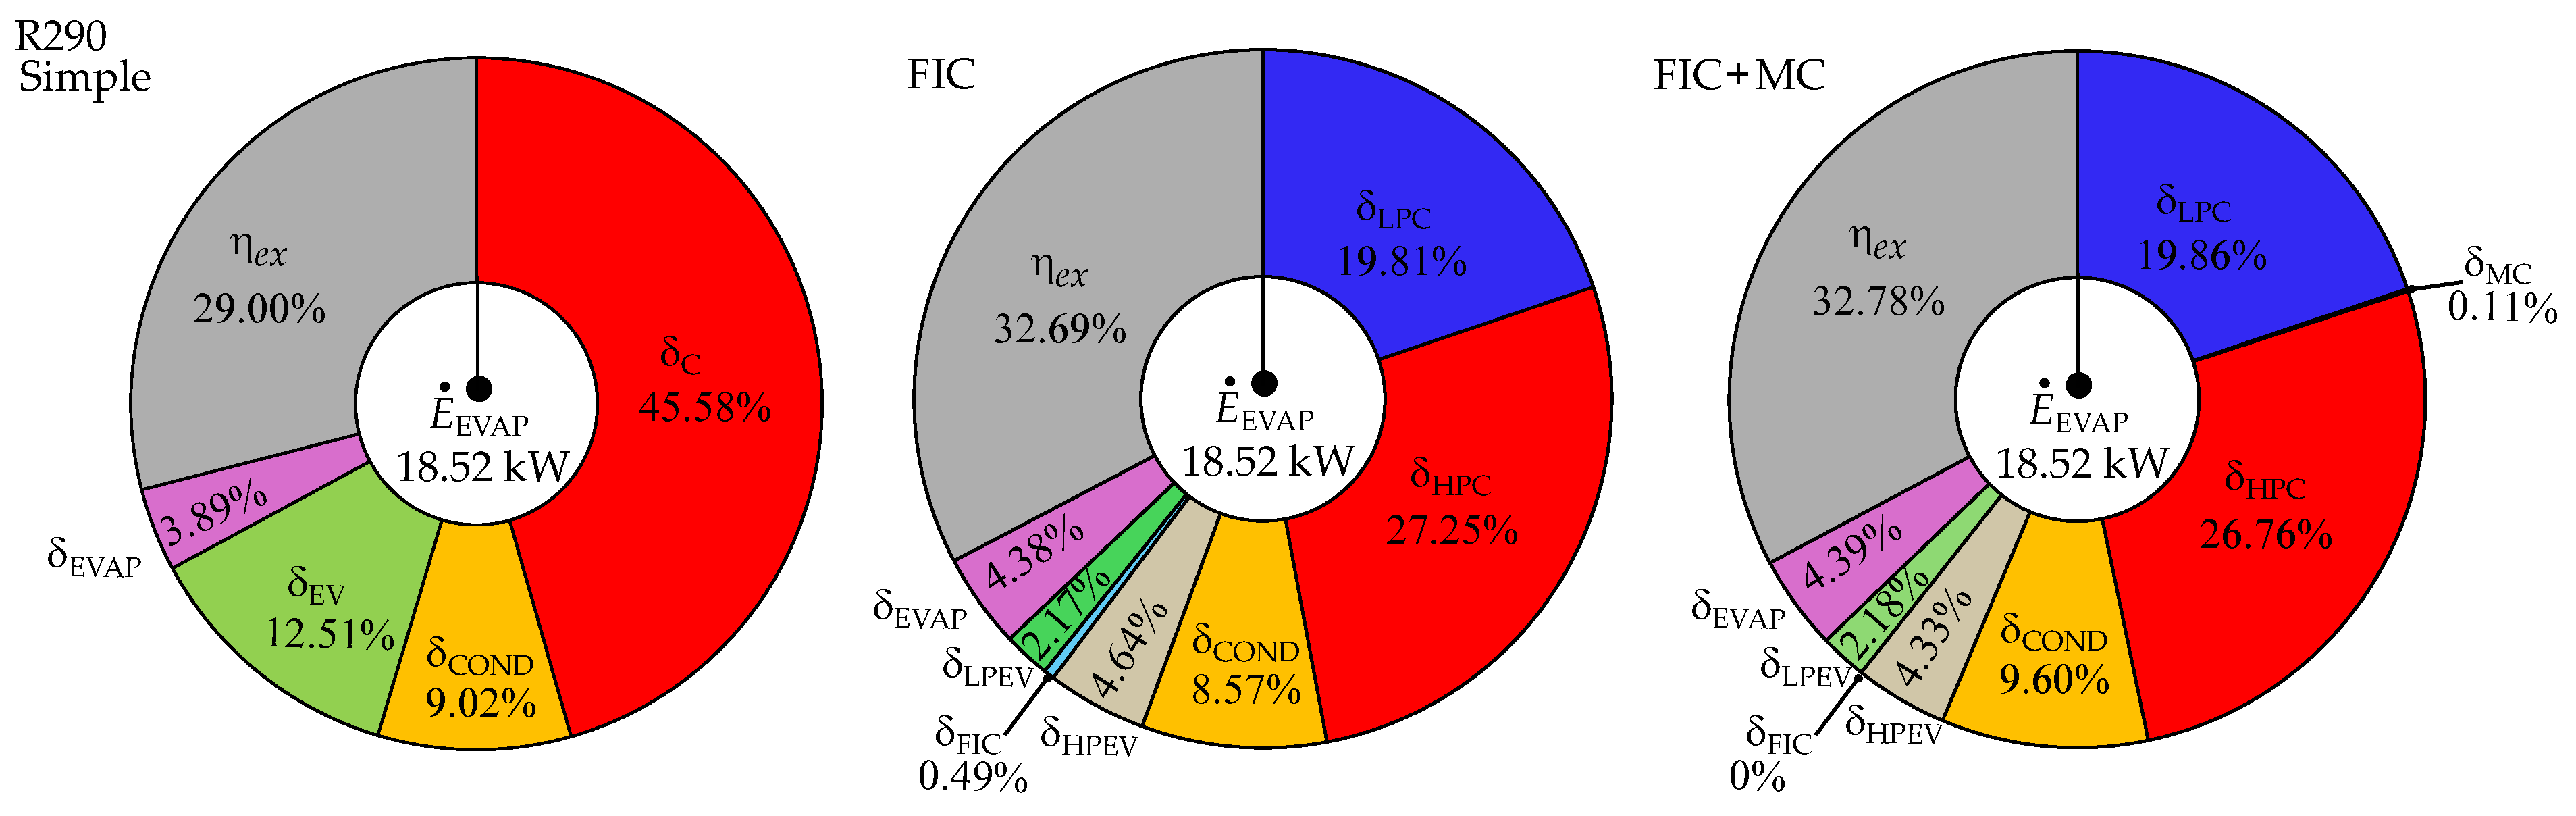
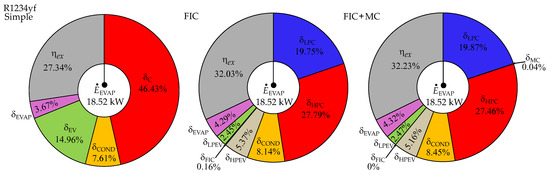
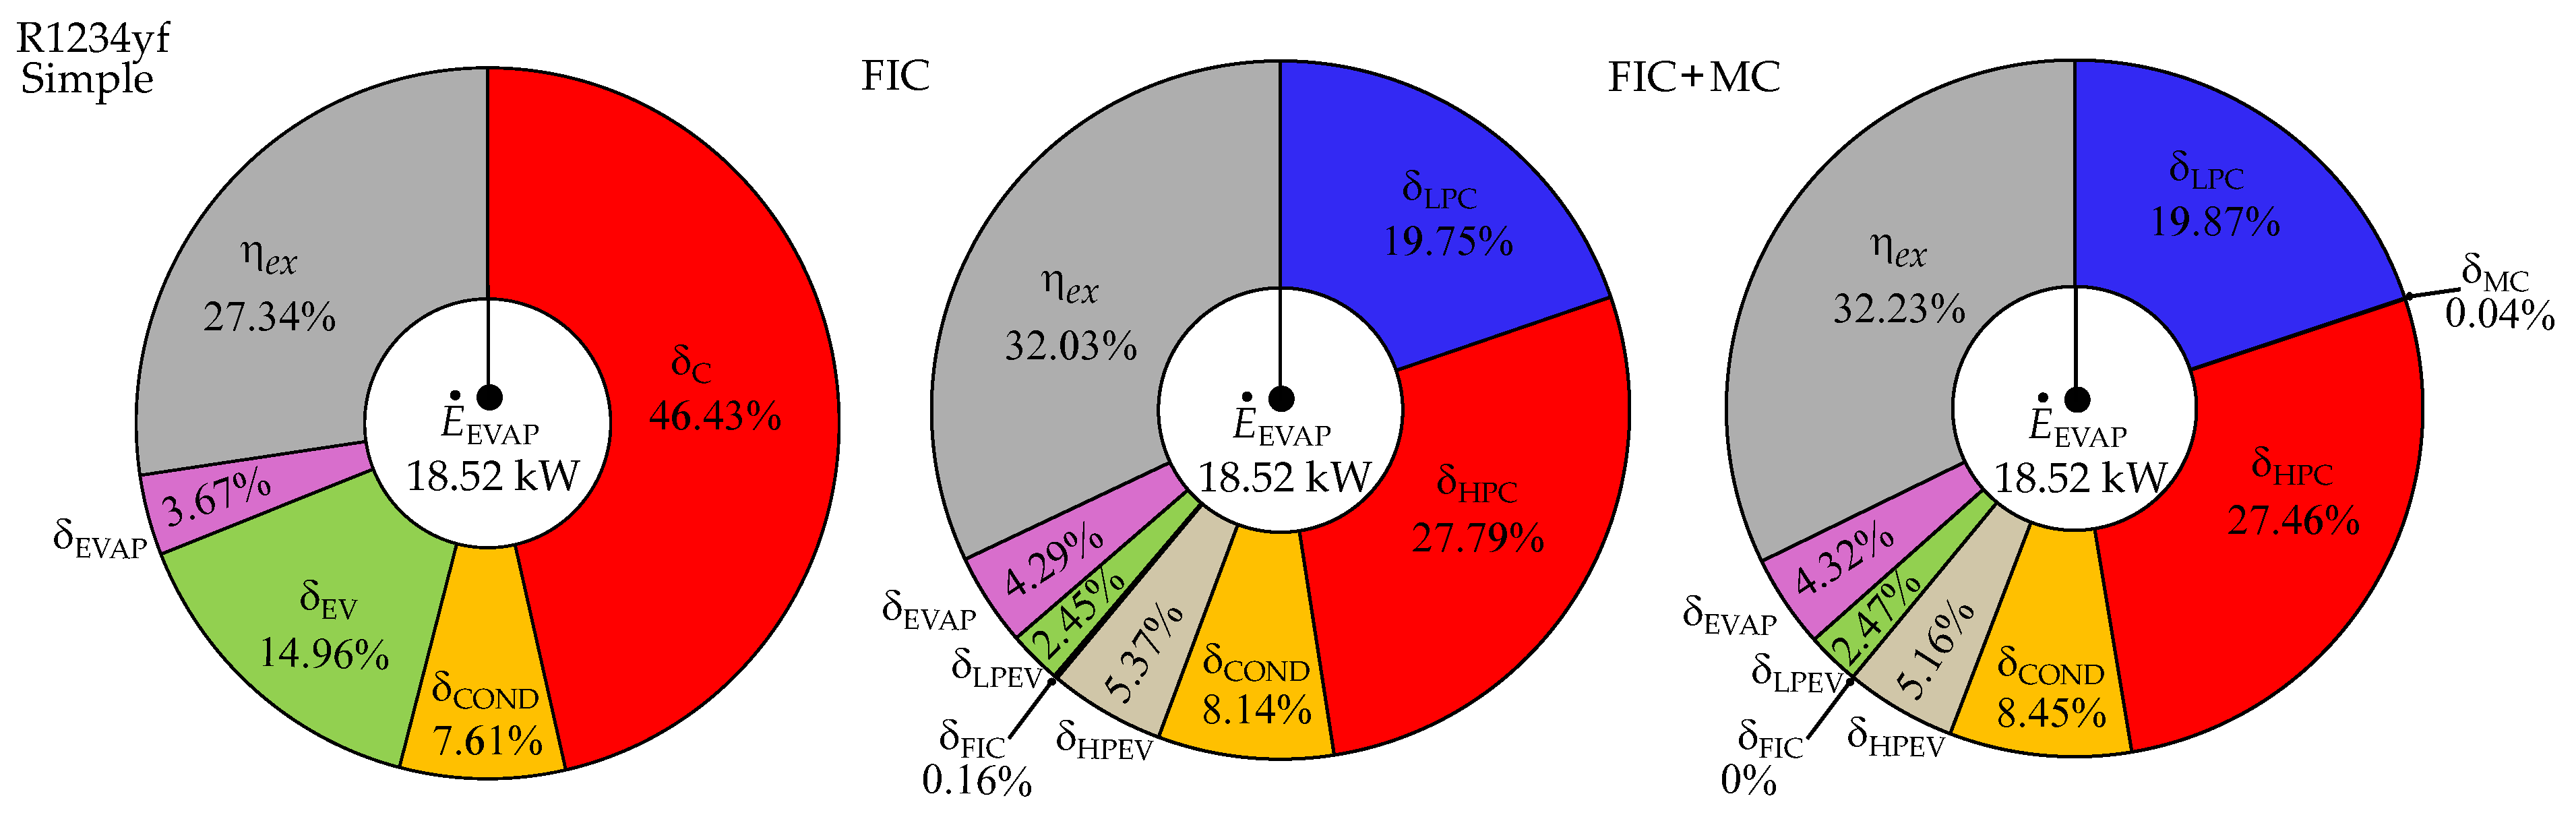
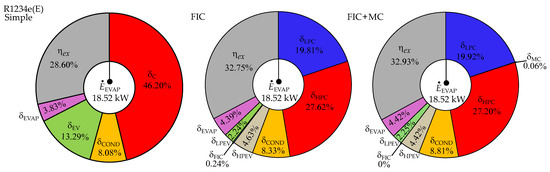
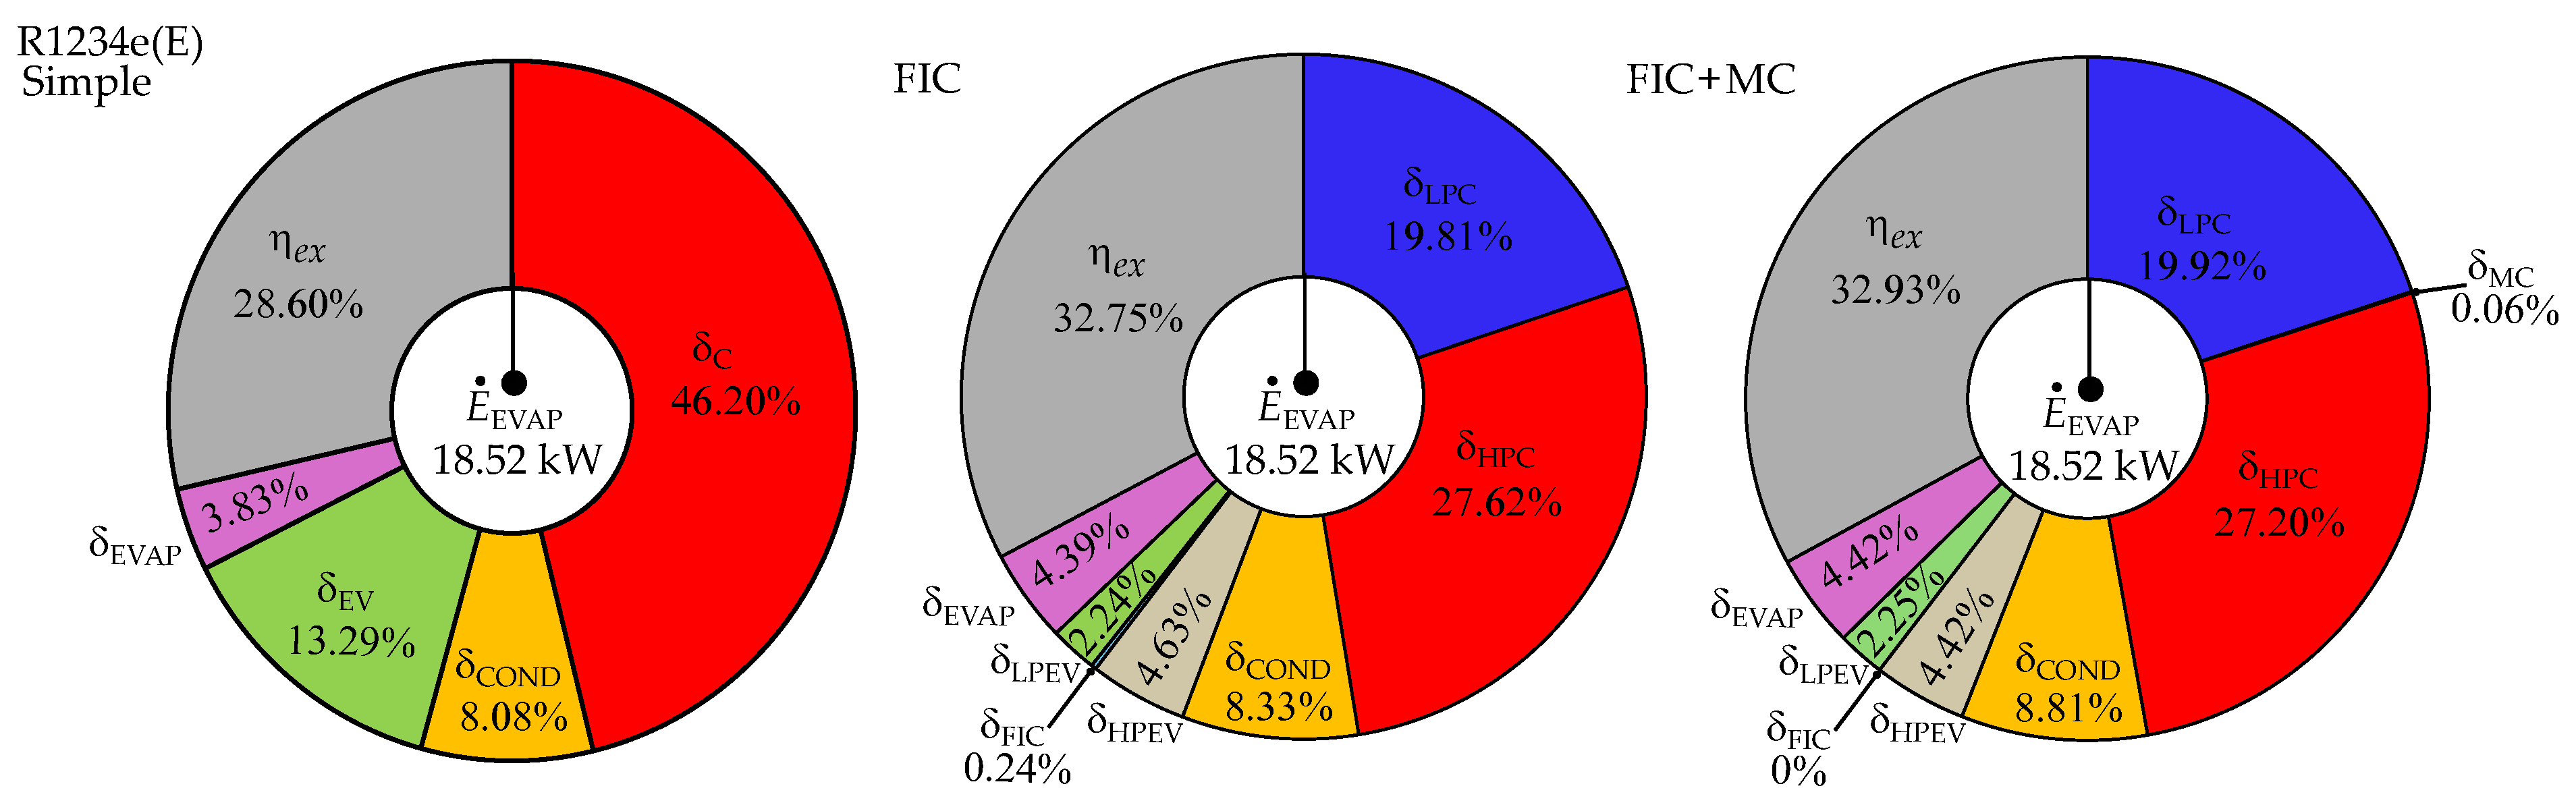
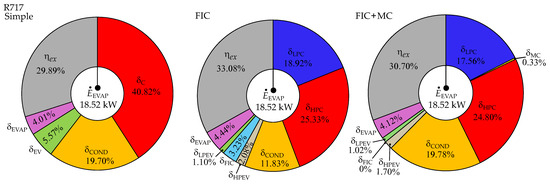
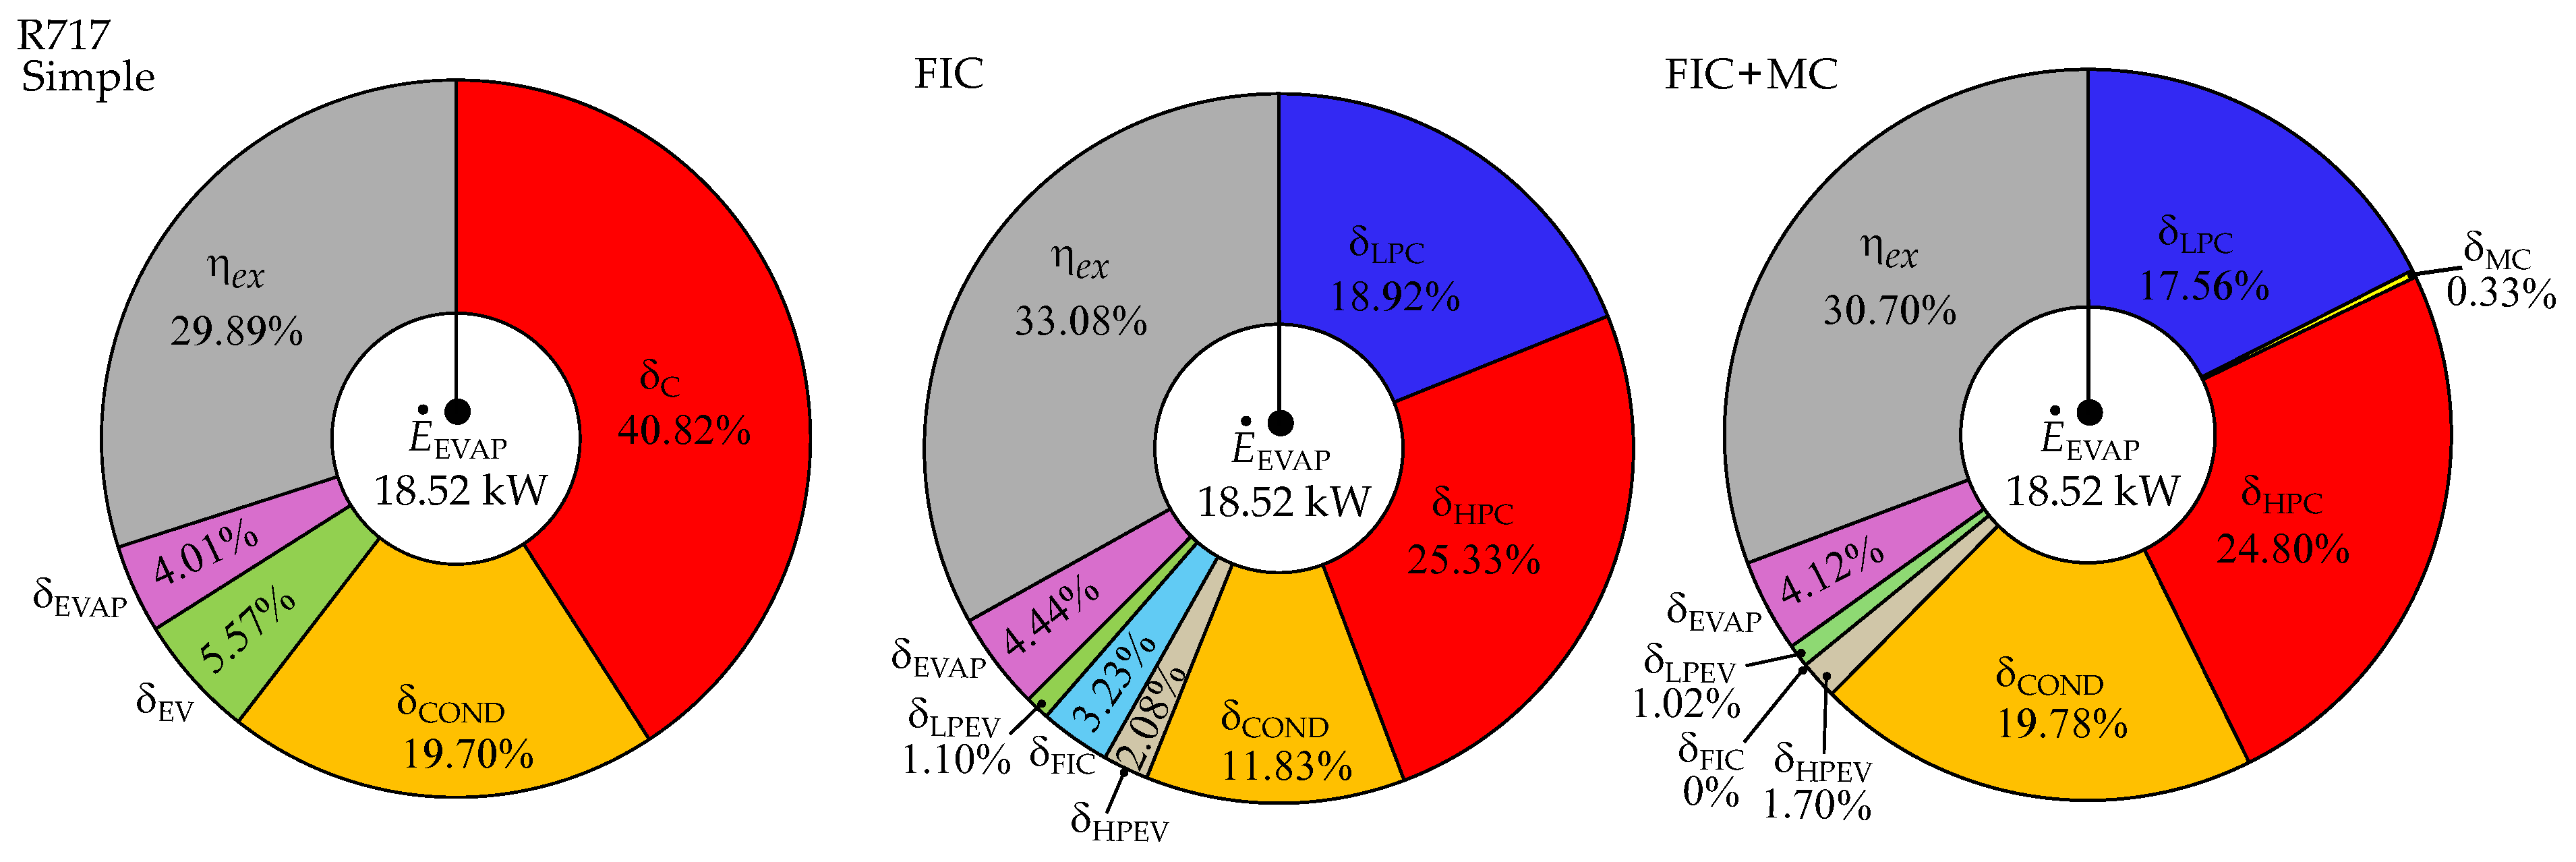
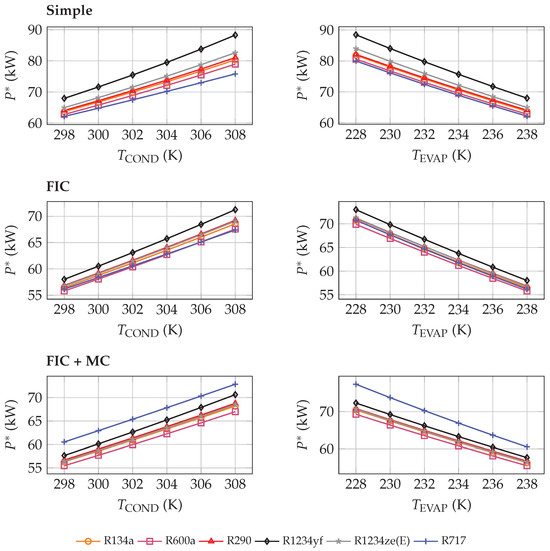
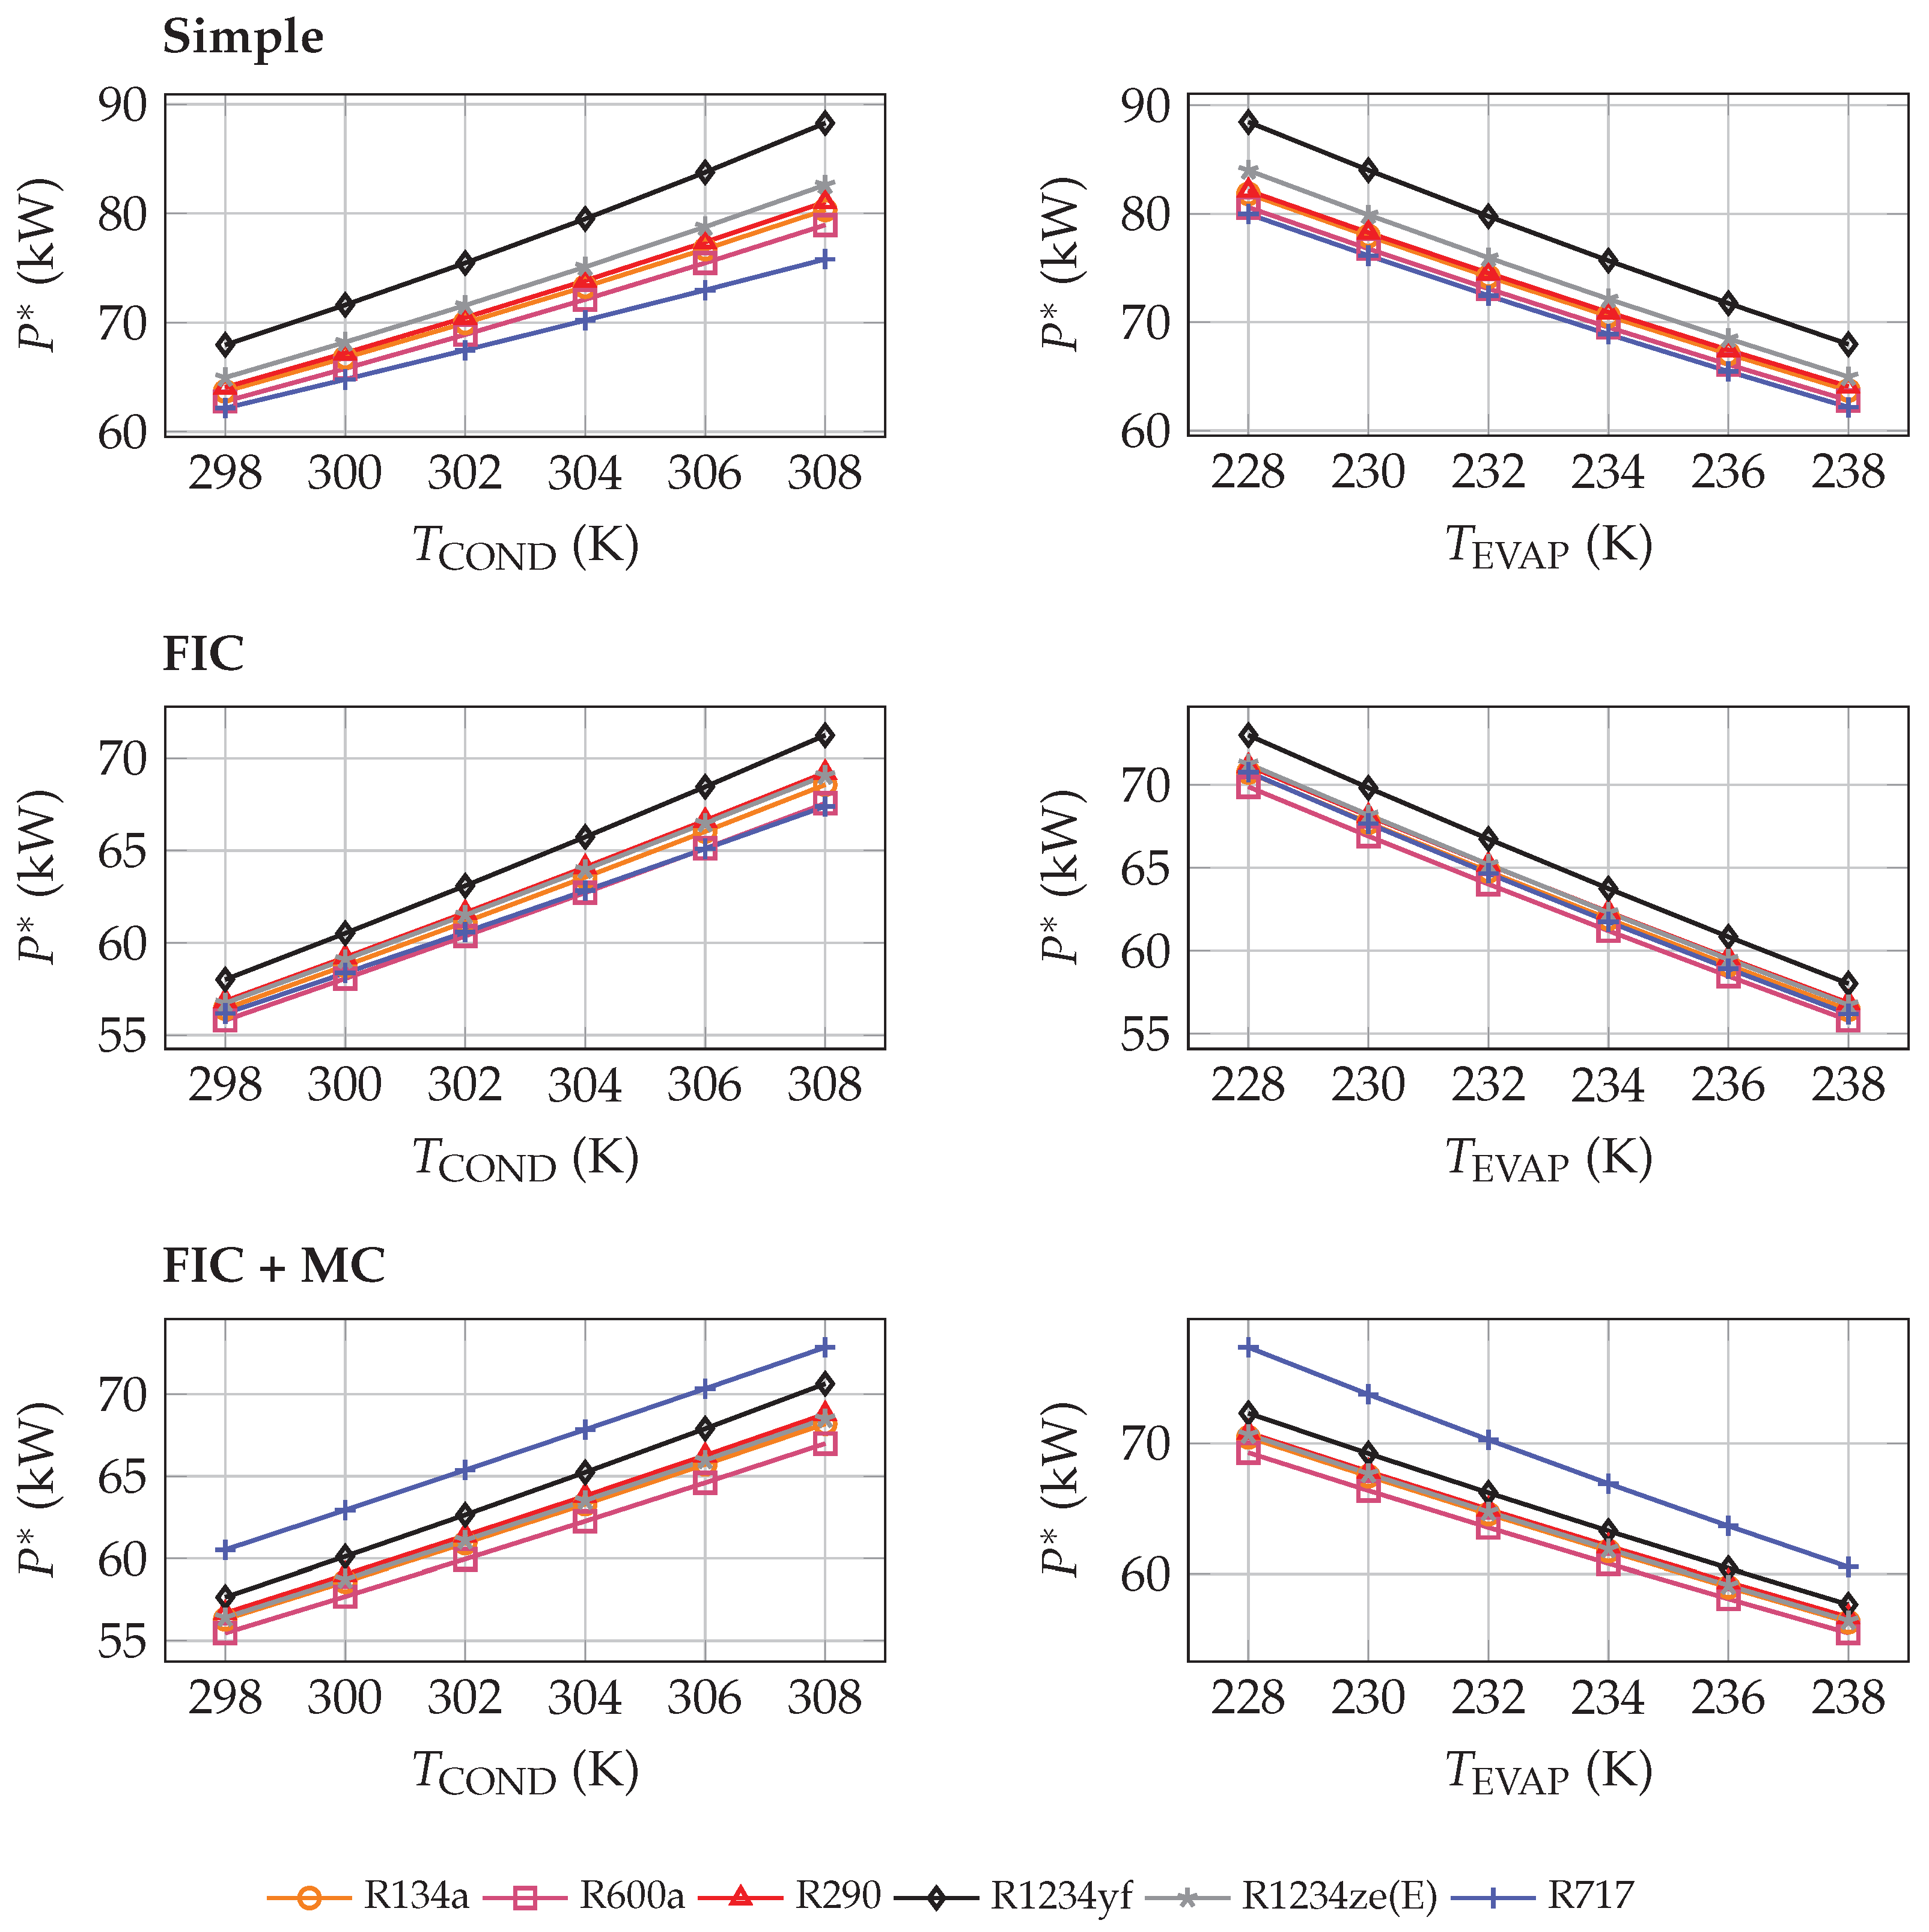
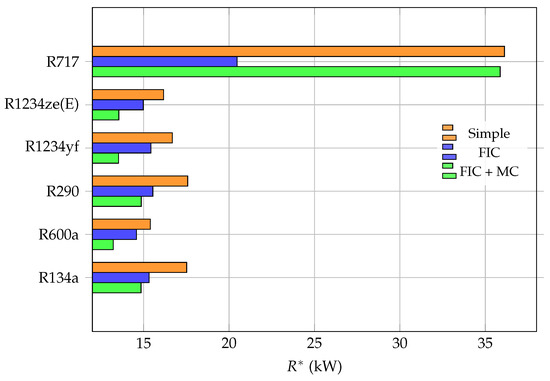
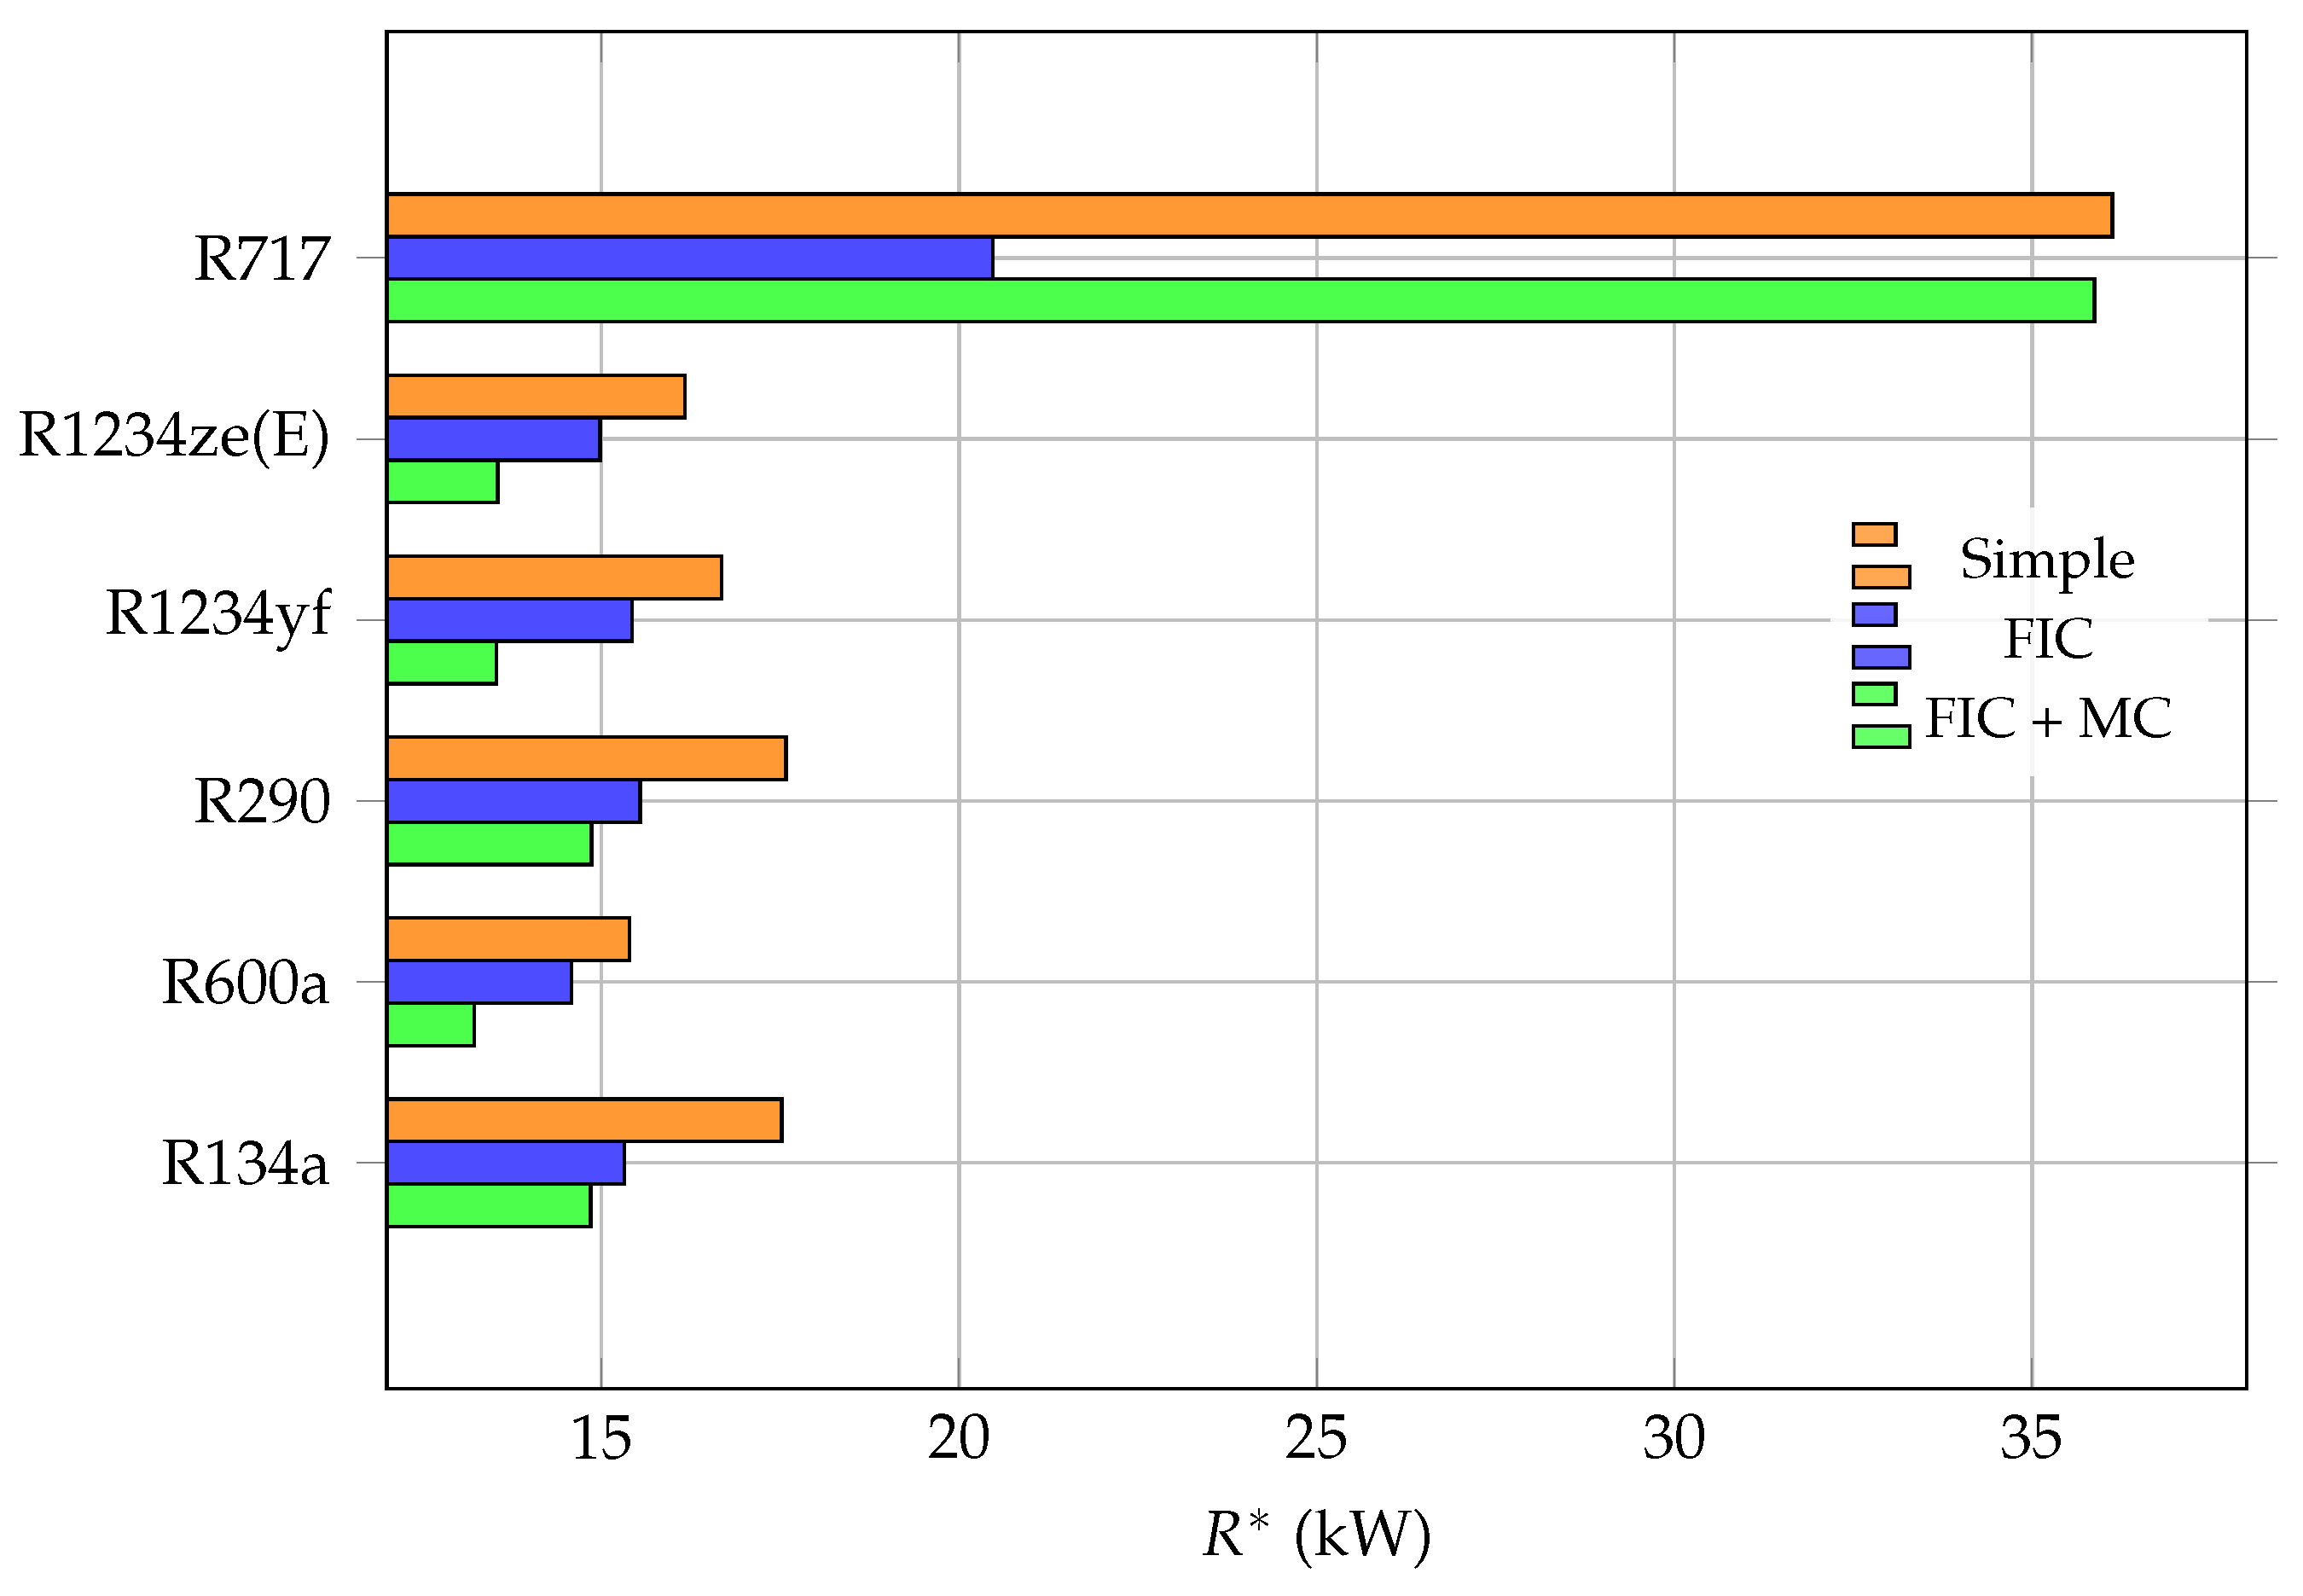
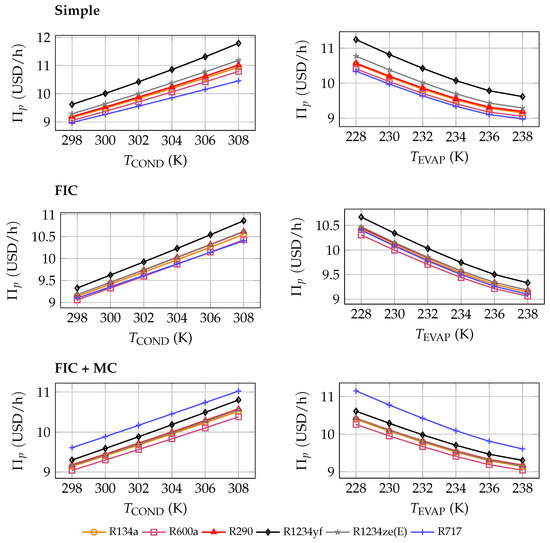
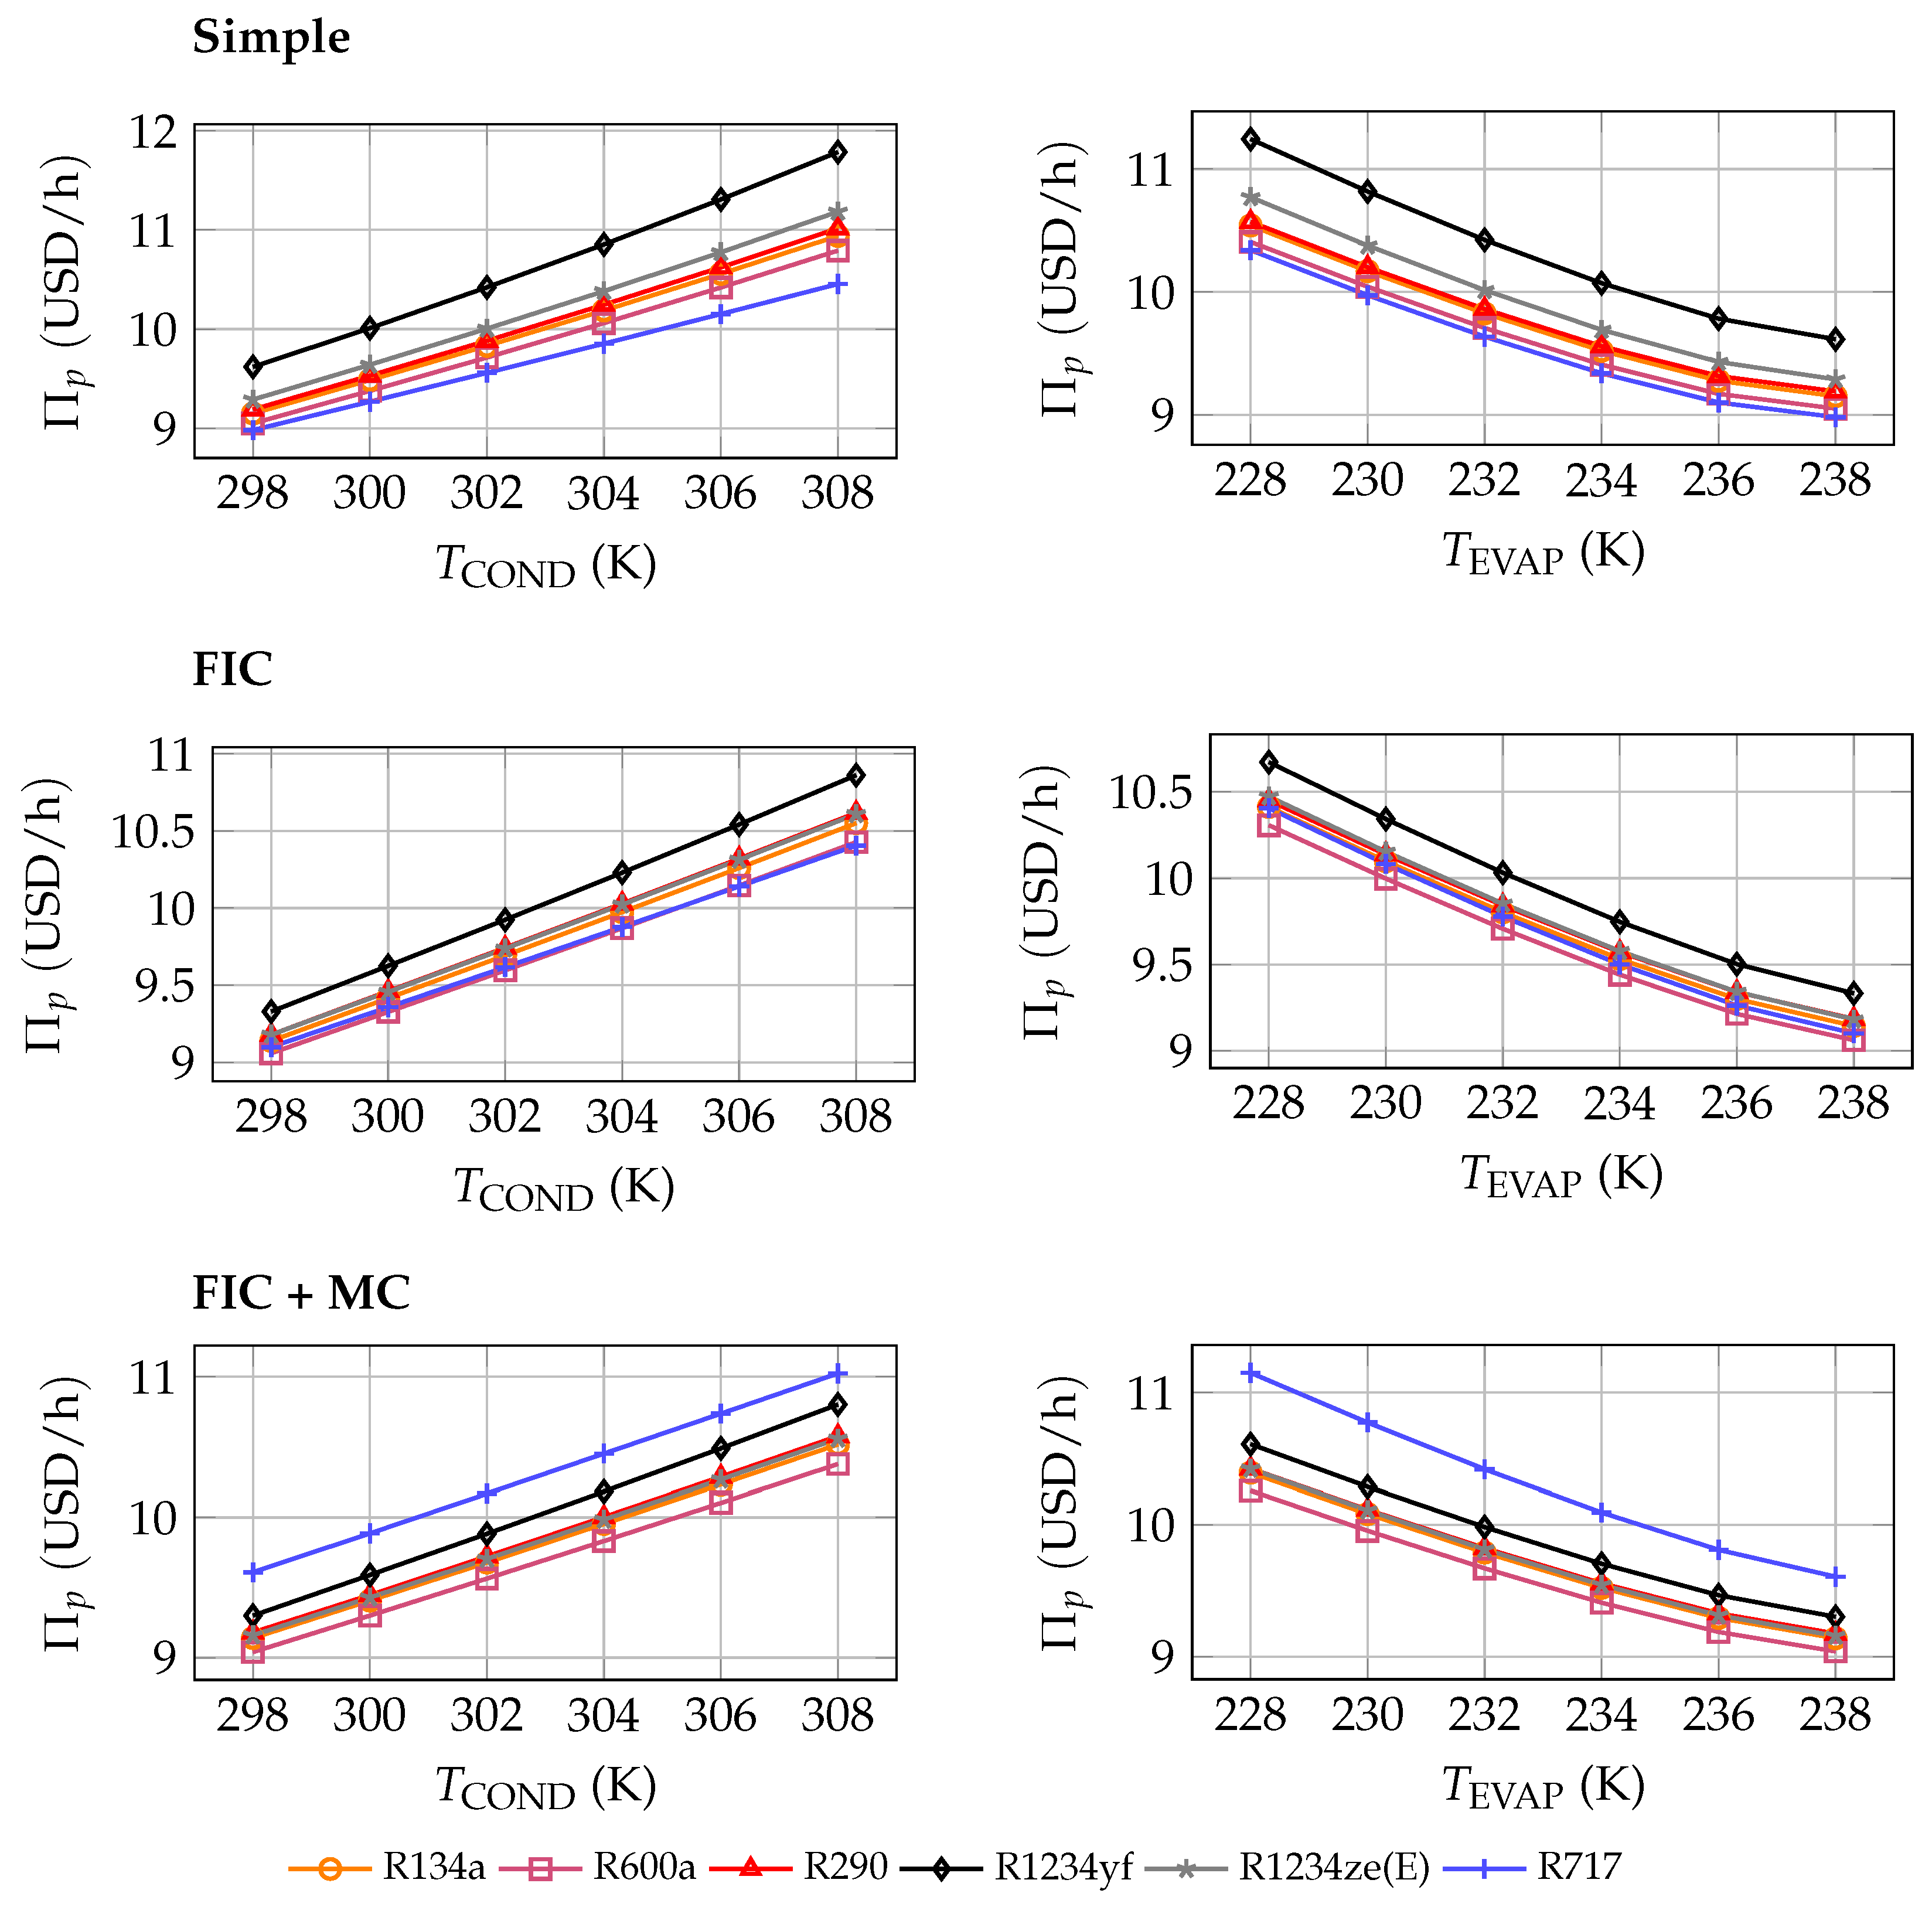
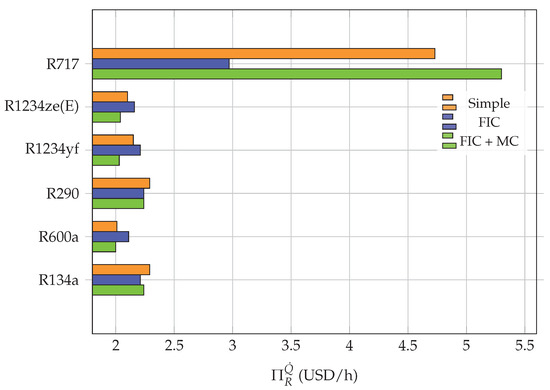
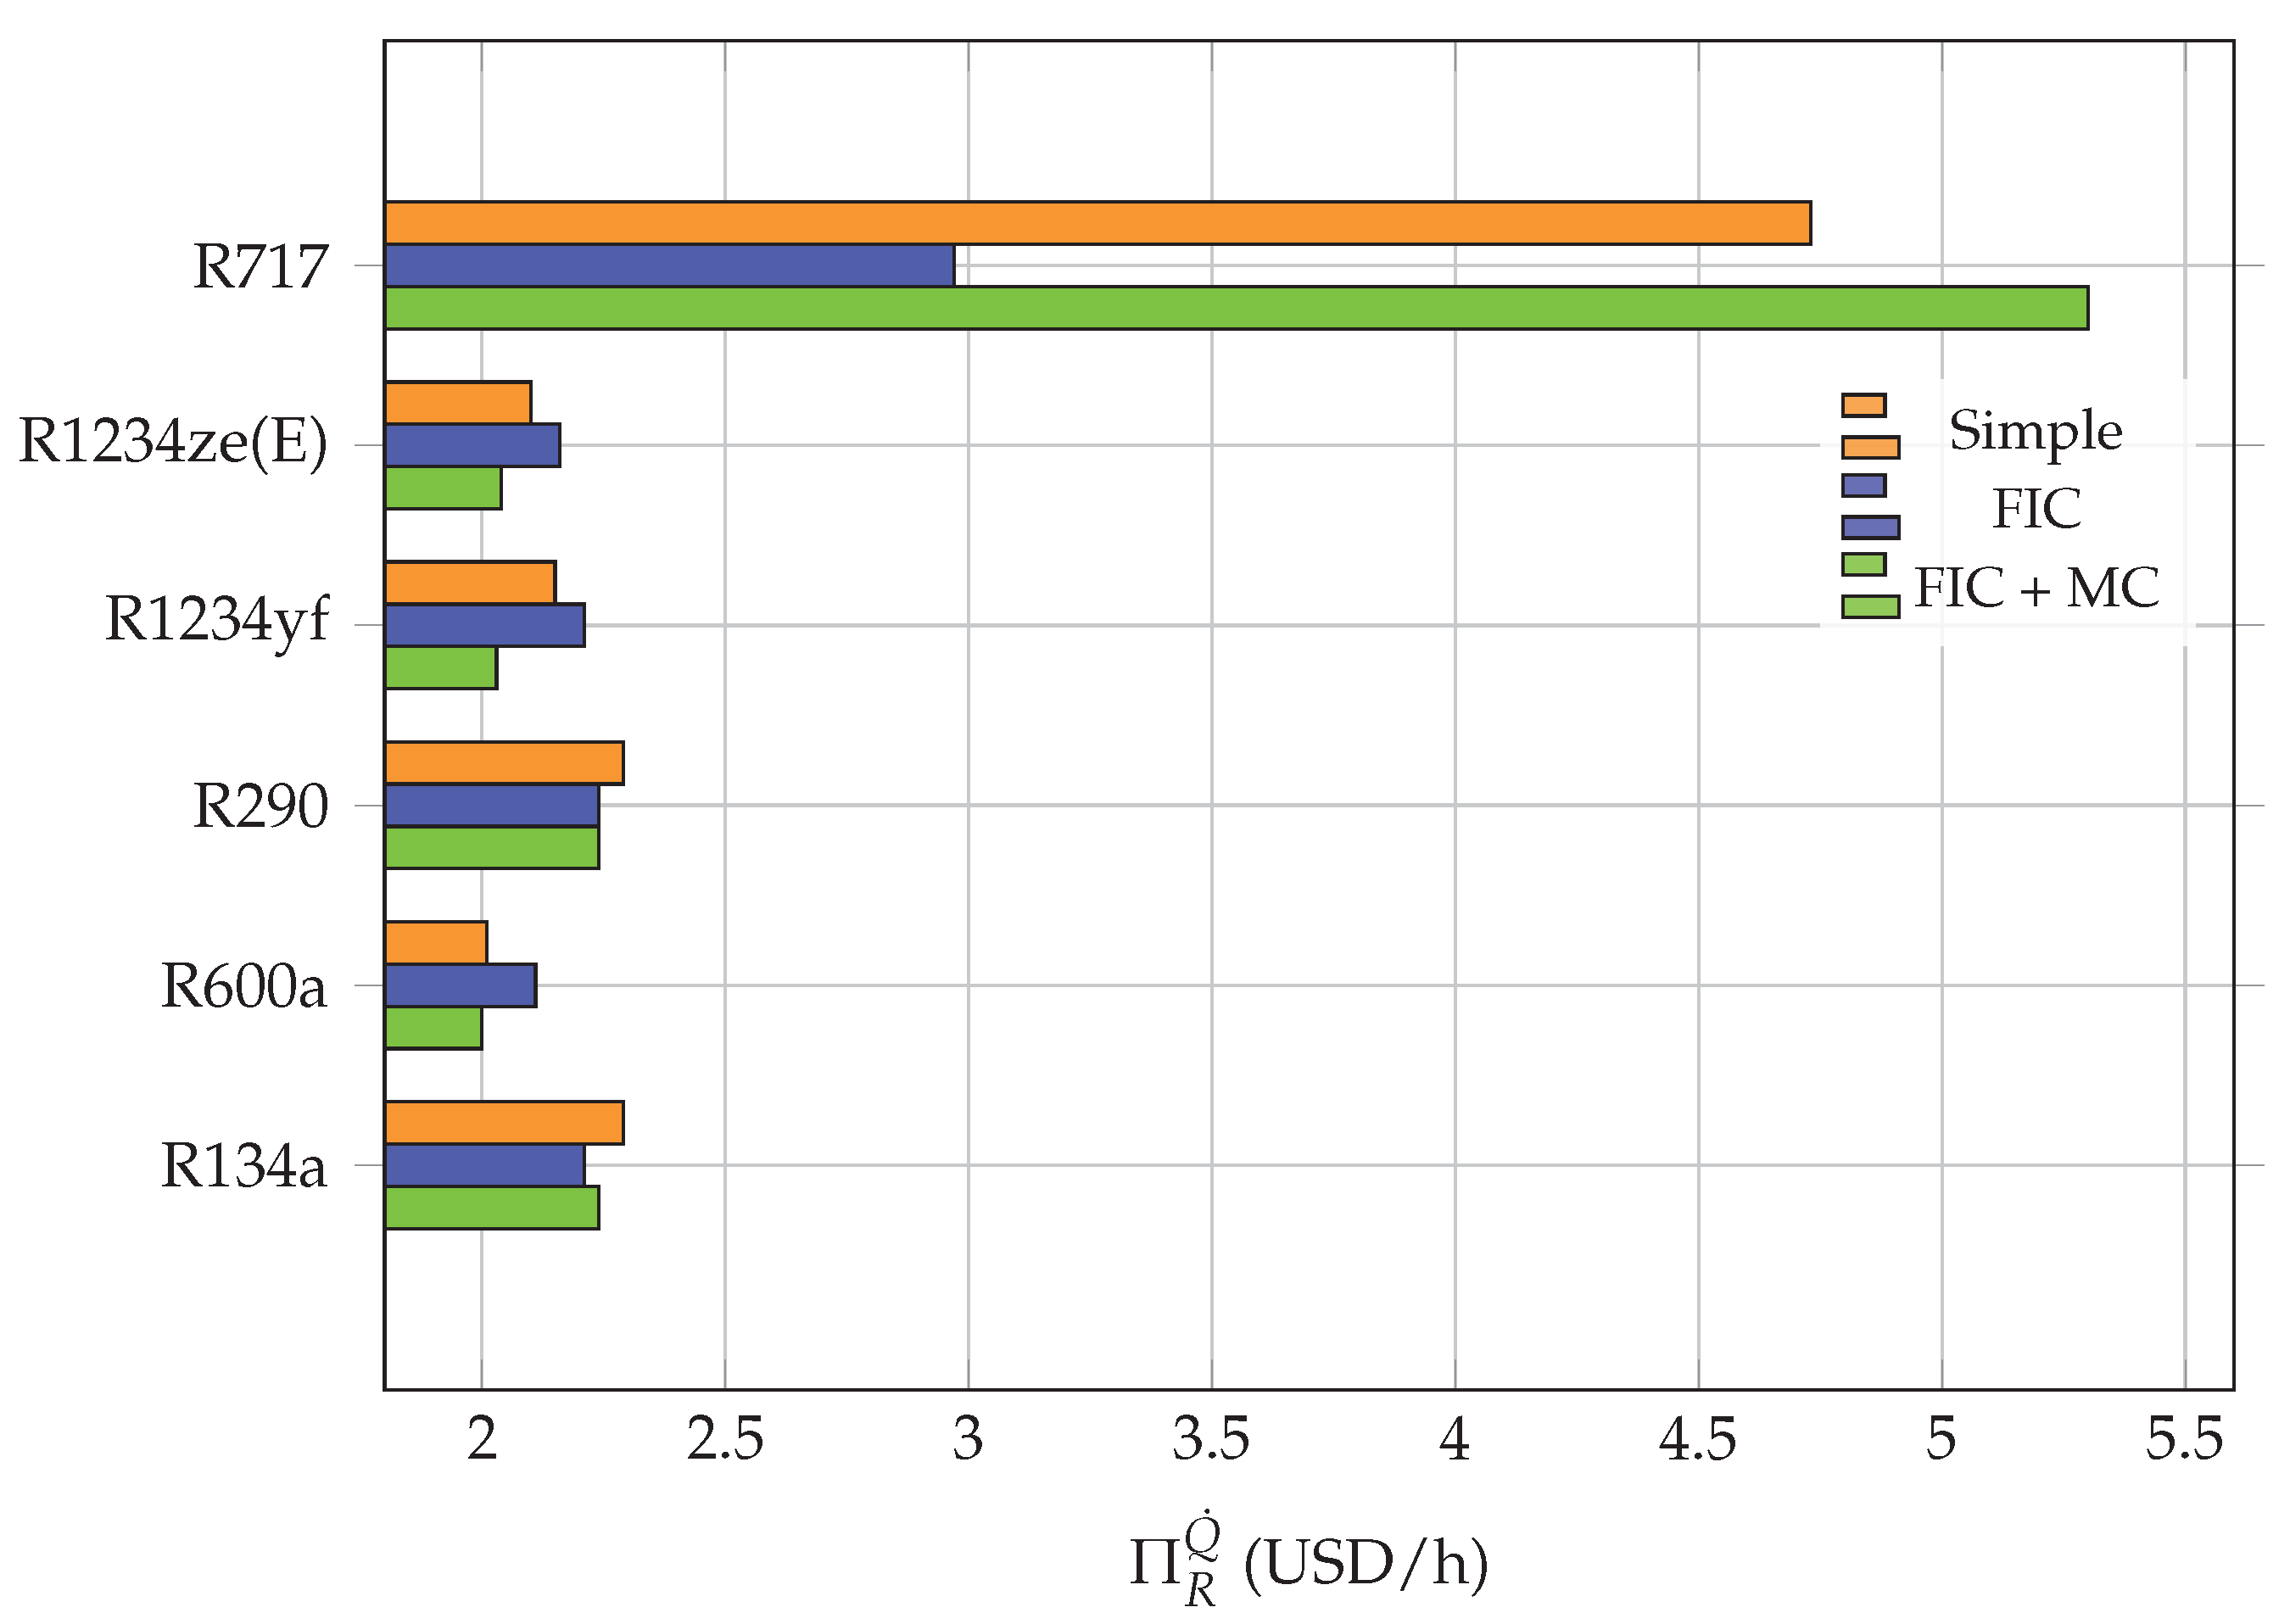

Disclaimer/Publisher’s Note: The statements, opinions and data contained in all publications are solely those of the individual author(s) and contributor(s) and not of MDPI and/or the editor(s). MDPI and/or the editor(s) disclaim responsibility for any injury to people or property resulting from any ideas, methods, instructions or products referred to in the content. |
© 2026 by the authors. Licensee MDPI, Basel, Switzerland. This article is an open access article distributed under the terms and conditions of the Creative Commons Attribution (CC BY) license.