


Abstract
Unmanned aerial vehicles (UAVs) can soar like birds by harvesting natural wind energy, significantly extending flight endurance. Thermal updrafts and orographic updrafts are the two primary wind fields exploited by birds during migration and foraging, with the latter being more prevalent in mountainous terrain. Due to computational constraints of current onboard avionics, a simple yet accurate model that adequately characterizes the horizontal distribution of orographic updrafts has not yet been established, limiting existing autonomous energy-harvesting flight techniques to thermal updraft environments. This paper investigates the height-dependent horizontal distribution of vertical winds over isolated and continuous range using RANS numerical simulations. The results show that the horizontal structure of updrafts over an isolated hill closely resembles that of thermal updrafts, allowing direct adoption of existing thermal updraft models. A new horizontal distribution model for orographic updrafts is proposed, which demonstrates high precision with a maximum RMSE of only 0.088 m/s at various altitudes when compared to numerical simulation results. Compared with existing models for continuous ridges, this model significantly improves the consistency in describing the horizontal distribution patterns of orographic updrafts and provides a more reasonable characterization of the updraft distribution in regions above the ridgeline; consequently, it is well-suited for the real-time and efficient prediction of terrain-induced updrafts for small UAVs.
1. Introduction
Raptors (griffon vultures) and other large birds, such as storks, cranes, and pelicans [1,2], numbering in the millions, routinely exploit atmospheric wind energy (updrafts) during foraging and migration to sustain prolonged soaring flight without flapping their wings [3,4,5]. Similarly, unmanned aerial vehicles (UAVs) can harness this renewable energy source during missions through “bird-inspired autonomous soaring technology,” thereby significantly extending endurance and range [6,7].
However, existing autonomous soaring techniques are limited to static soaring within thermal updrafts and cannot be extended to orographic updraft environments. Orographic updrafts represent another prevalent form of natural lift, especially in mountainous regions. Observational data on griffon vultures indicate that exploiting orographic updrafts is a primary mode of static soaring during routine foraging activities [1]. The inability of current bird-inspired autonomous soaring methods to utilize orographic updrafts severely restricts the broader application and deployment of soaring technology on UAVs.
The core issue preventing bio-inspired autonomous soaring technology from exploiting terrain-induced updraft environments lies in the need to develop a reasonable, simplified orographic updraft model capable of accurately characterizing horizontal distribution patterns. This stems from current limitations in UAV onboard computational power and the general absence of high-precision anemometers, which hinder accurate perception of surrounding airflow and rapid solving of complex flow models. Consequently, UAVs cannot rapidly identify surrounding updraft conditions in real-time like birds or complete predictions of orographic updraft horizontal distributions.
Numerical simulation research on mountainous wind fields primarily focuses on horizontal wind speed, acceleration and orographic updrafts. Some studies simultaneously consider thermal and orographic updrafts [8,9], examining their nonlinear interactions affecting overall updraft distributions over mountains. While both updraft types coexist, thermal updrafts are short-lived, absent at night, and rare in autumn, winter or under low-sunlight conditions [10,11,12]. Their mutual influence duration is brief. In avian soaring studies that inspire UAV applications, thermal and orographic updrafts are typically investigated as distinct flight modes [5,13,14,15,16,17]. Thus, this study exclusively addresses single-source orographic updrafts.
Through wind tunnel experiments, Shen et al. [18] analyzed the streamwise and vertical wind fields over a typical three-dimensional isolated hill and evaluated their impact on wind-induced deflection of spanning cables. However, their study primarily concentrated on vertical wind field characteristics near the mountain surface, lacking research on the horizontal distribution of updrafts above ridge height. In contrast, Jackson and Hunt proposed a wind speed profile model for two-dimensional symmetric slopes [19], employing mean wind speed as a key parameter. Their work established a methodology for mountainous wind field analysis based on the wind speed acceleration ratio. Ishihara et al. conducted wind tunnel experiments on a representative isolated hill [20], comparing results with undisturbed atmospheric boundary layer (ABL) flows. They observed maximum perturbations in streamwise and vertical wind speed variances at the mountain summit and leeward slope. Yan et al. developed a Reynolds-Averaged Navier–Stokes (RANS) modeling approach for neutral ABL flows using the standard k-ε turbulence model [21]. Their method effectively assessed terrain effects on surface wind speed over complex topography, demonstrating strong agreement with wind tunnel data and long-term field observations. On the other hand, orographic updrafts near urban buildings represent another wind field type utilized by urban birds. Mohamed et al. analyzed the feasibility and advantages of simulating turbulent wind fields around buildings, examining flow structures and high-turbulence zones for UAV navigation control [22]. Guerra-Langan et al. simulated UAV flight control performance using updrafts around buildings under varying turbulent wind conditions and validated behavioral patterns of seagulls under high wind speeds [23].
Bencatel et al. provided a comprehensive survey of airflow models applicable to bio-inspired autonomous soaring technologies [24]. Based on an extensive literature analysis, the majority of research efforts have concentrated on thermal updraft models, with minimal exploration of orographic updrafts. Langelaan conducted preliminary investigations into orographic updraft modeling using potential flow theory, though these efforts remained rudimentary [25,26]. Allen [27] established an empirical thermal updraft model based on meteorological balloon measurements, introducing the concepts of convective velocity and mixed-layer depth. This model adopts a three-dimensional frustum of a cone structure, with the radii of its upper and lower circles adjusted according to empirical wind field data. Lawrance introduced a bubble-based 3D model under updraft hypothesis, incorporating both ascending and descending airflow components [28]. Drawing from manned glider flight theory, Gedeon designed a quadratic-weighted Gaussian function to characterize thermal updrafts, emphasizing horizontal distribution patterns [29]. Wharington directly employed a Gaussian function to describe vertical wind speed magnitude and radial distribution within updrafts, focusing on the ascending core [30]. This simplified model effectively captured the fundamental structure of thermal updrafts while meeting requirements for simulation and real-flight applications, subsequently becoming the preferred approach for thermal updraft field modeling [31,32,33].
Given the current computational constraints of onboard UAV systems and real-time prediction requirements, a simplified model capable of characterizing the distribution patterns of orographic updrafts is essential. This study focuses on investigating the dynamics of terrain-induced updraft fields and developing a horizontal updraft distribution model to address the critical challenge of applying bio-inspired autonomous soaring technology in orographic environments. We employ numerical simulations to characterize the horizontal distribution patterns of updrafts at varying altitudes over two typical three-dimensional terrains: isolated hills and mountain ranges. For both isolated hills and mountain ridges, the maximum updraft intensity consistently occurs at two-thirds of the mountain height on the windward slope. The horizontal distribution of updrafts over isolated hills closely resembles that of thermal updrafts, allowing direct application of existing thermal updraft models. A novel Orographic Updrafts Horizontal Distribution Model (OUHDM) is proposed for mountain ranges. Compared with Langelaan’s wind field model, the OUHDM demonstrates a significant improvement in the consistency of describing the horizontal distribution patterns of orographic updrafts. Moreover, it provides a more reasonable characterization of the updraft distribution in the regions above the ridgeline, making it highly suitable for the real-time and efficient prediction of terrain-induced updrafts for UAVs.
In this study, Section II details the numerical simulation methodology, Section III discusses the horizontal distribution patterns of updraft fields in two mountainous terrains. Based on the findings from Section III, Section IV proposes the OUHDM. Compared to the existing orographic model, the new model demonstrates significantly improved consistency with the numerical simulation results from Section II in describing the horizontal distribution of updrafts above ridge height.
2. Numerical Model
2.1. Governing Equations
In this study, air is treated as an incompressible ideal fluid. The governing equations for the RANS method in a Cartesian coordinate system are expressed as follows:
In the equations above, and represent the mean velocity components, is the mean pressure, is the kinematic viscosity, , are the fluctuating velocity components, is the fluid density.
In wind field simulations involving buildings and mountainous terrains, the Realizable k-ε turbulence model has been widely used. Studies have demonstrated that this model not only offers high computational efficiency but also achieves higher accuracy in numerical predictions. Compared to the standard k-ε model, the Realizable k-ε model introduces a new dissipation rate (ε) equation, enabling more precise simulation of boundary layer flows, flow separation around bluff bodies, and flows over curved surfaces. The transport equations for the Realizable k-ε model are expressed as follows:
In the equations, , are the turbulent Prandtl numbers related to and , with values taken as 1 and 1.2, respectively, is the molecular dynamic viscosity, and is the turbulent dynamic viscosity, represents the turbulent kinetic energy generated by velocity gradients, , , , is the rate-of-strain tensor, .
2.2. Computational Configuration
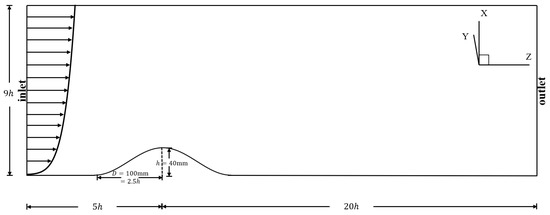
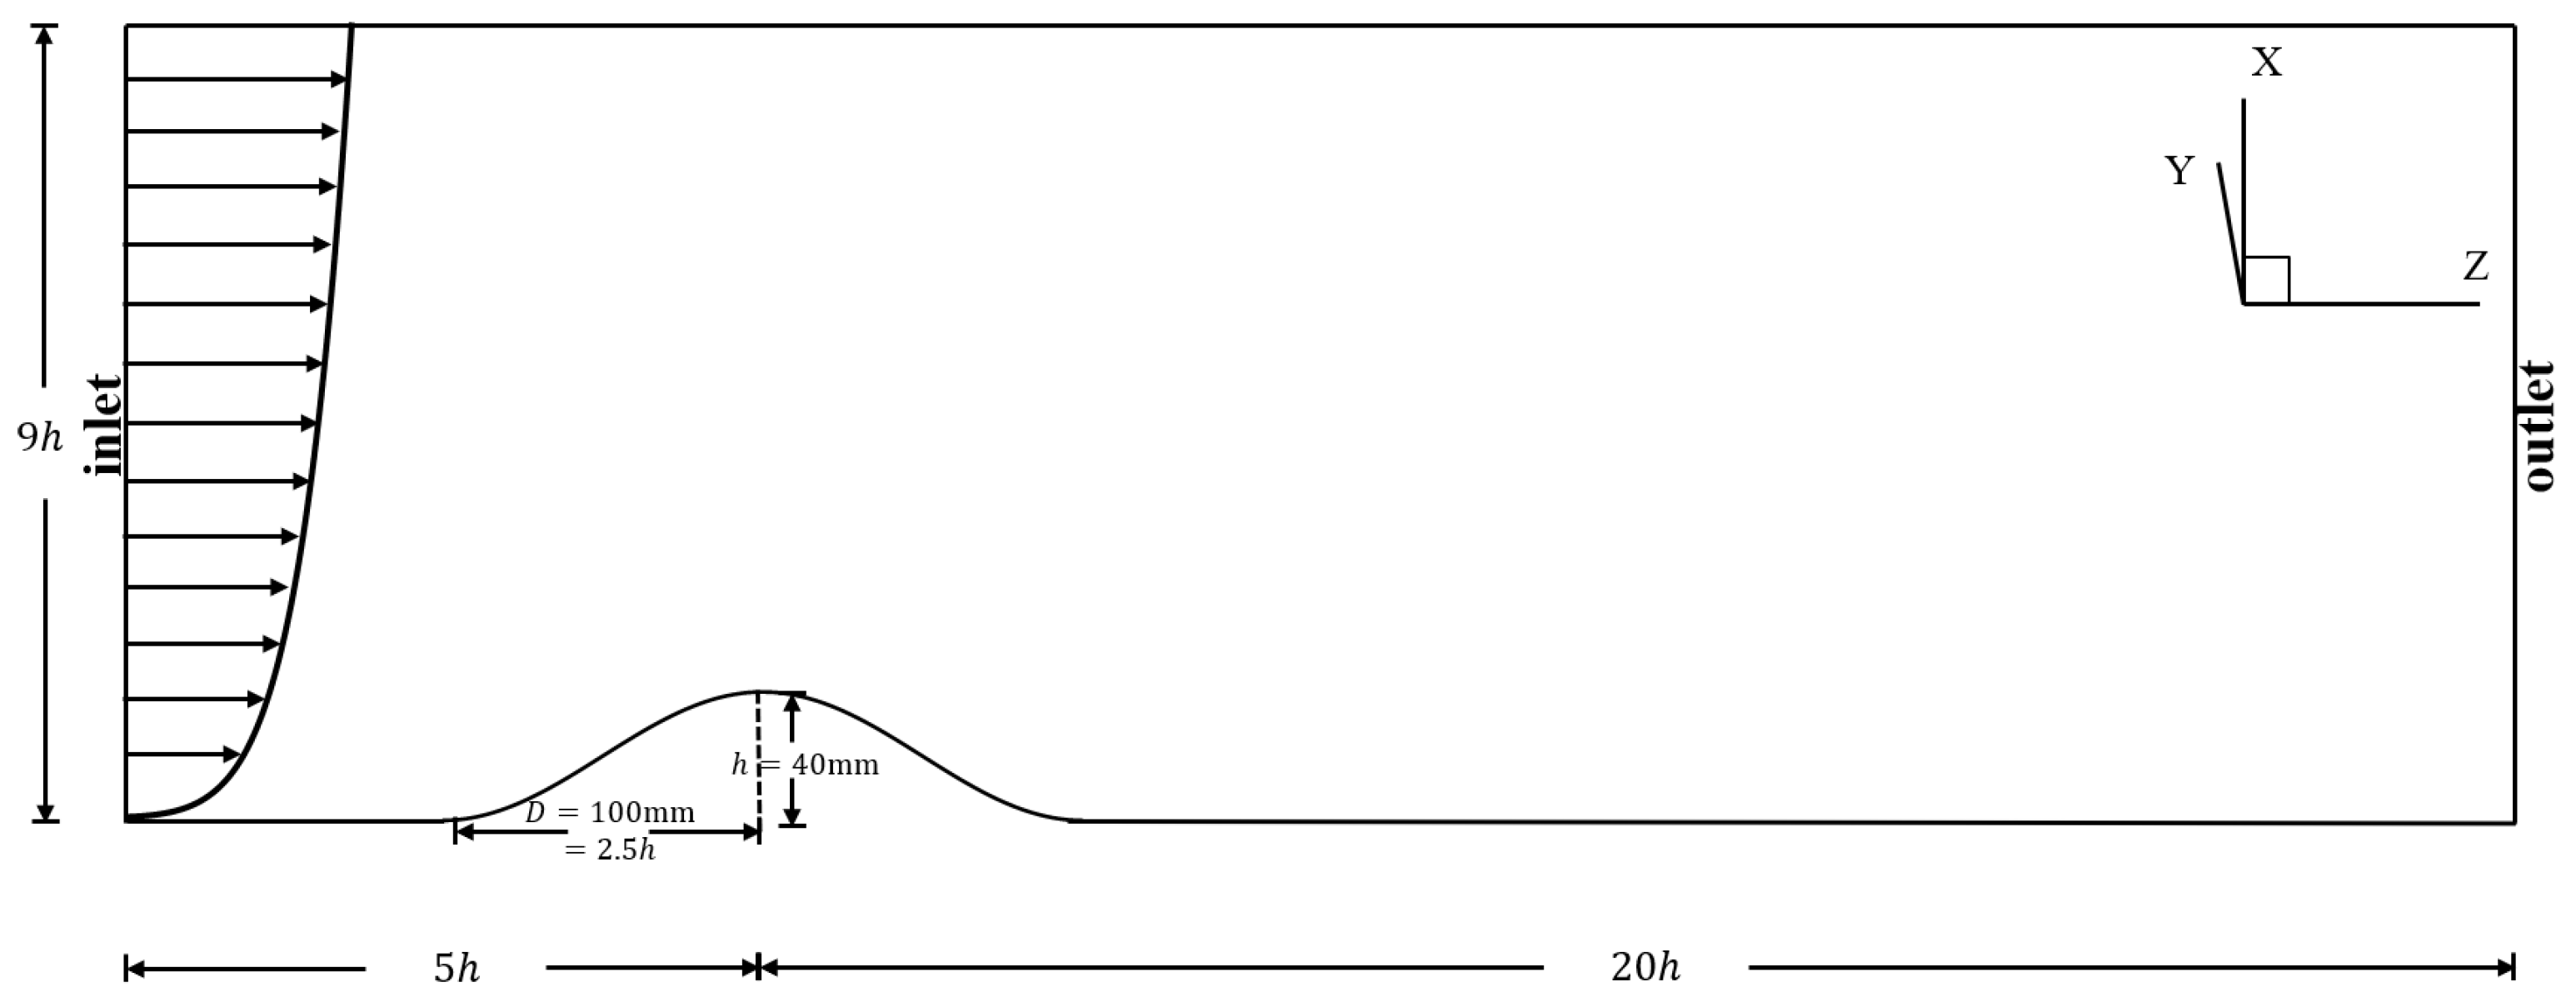
This model encompasses both isolated hills and mountain ranges. In the model, represents the maximum height of the hill, set to 40 mm, while denotes the base width of the hill, set to 100 mm. For mountain ranges, the ridge length, is set to 400 mm, whereas for isolated hills, is set to 0. The parameters of the terrain are consistent with those used in Ishihara’s wind tunnel experiments, ensuring alignment with established research, as shown in Figure 1.
Figure 1.
Computational Domain for Simulating the Wind Field over Typical Mountainous Terrain.
The hill is positioned at a distance of 8 from both lateral boundaries and the top of the computational domain. The total dimensions of the computational domain in the x, y and z directions are 25, and , respectively. When simulating the wind field of the isolated hill, is set to 0. The blockage ratio of the entire flow field is kept below 5%, ensuring sufficient flow development within the computational domain. Both the isolated hill and the continuous range are placed 0.2 m () downstream from the inlet. A 1:1000 scale model of the hill was utilized to facilitate a more direct comparison with wind tunnel experimental results of the same dimensions, thereby verifying the reliability of the computational findings. Furthermore, to ensure the generalizability of these results to full-scale mountain terrains, all length dimensions in this study were non-dimensionalized relative to the hill height.
2.3. Mesh System
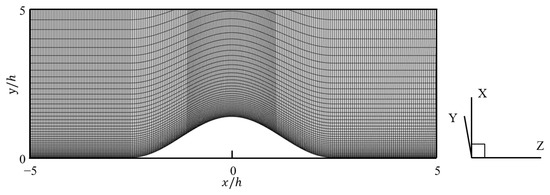
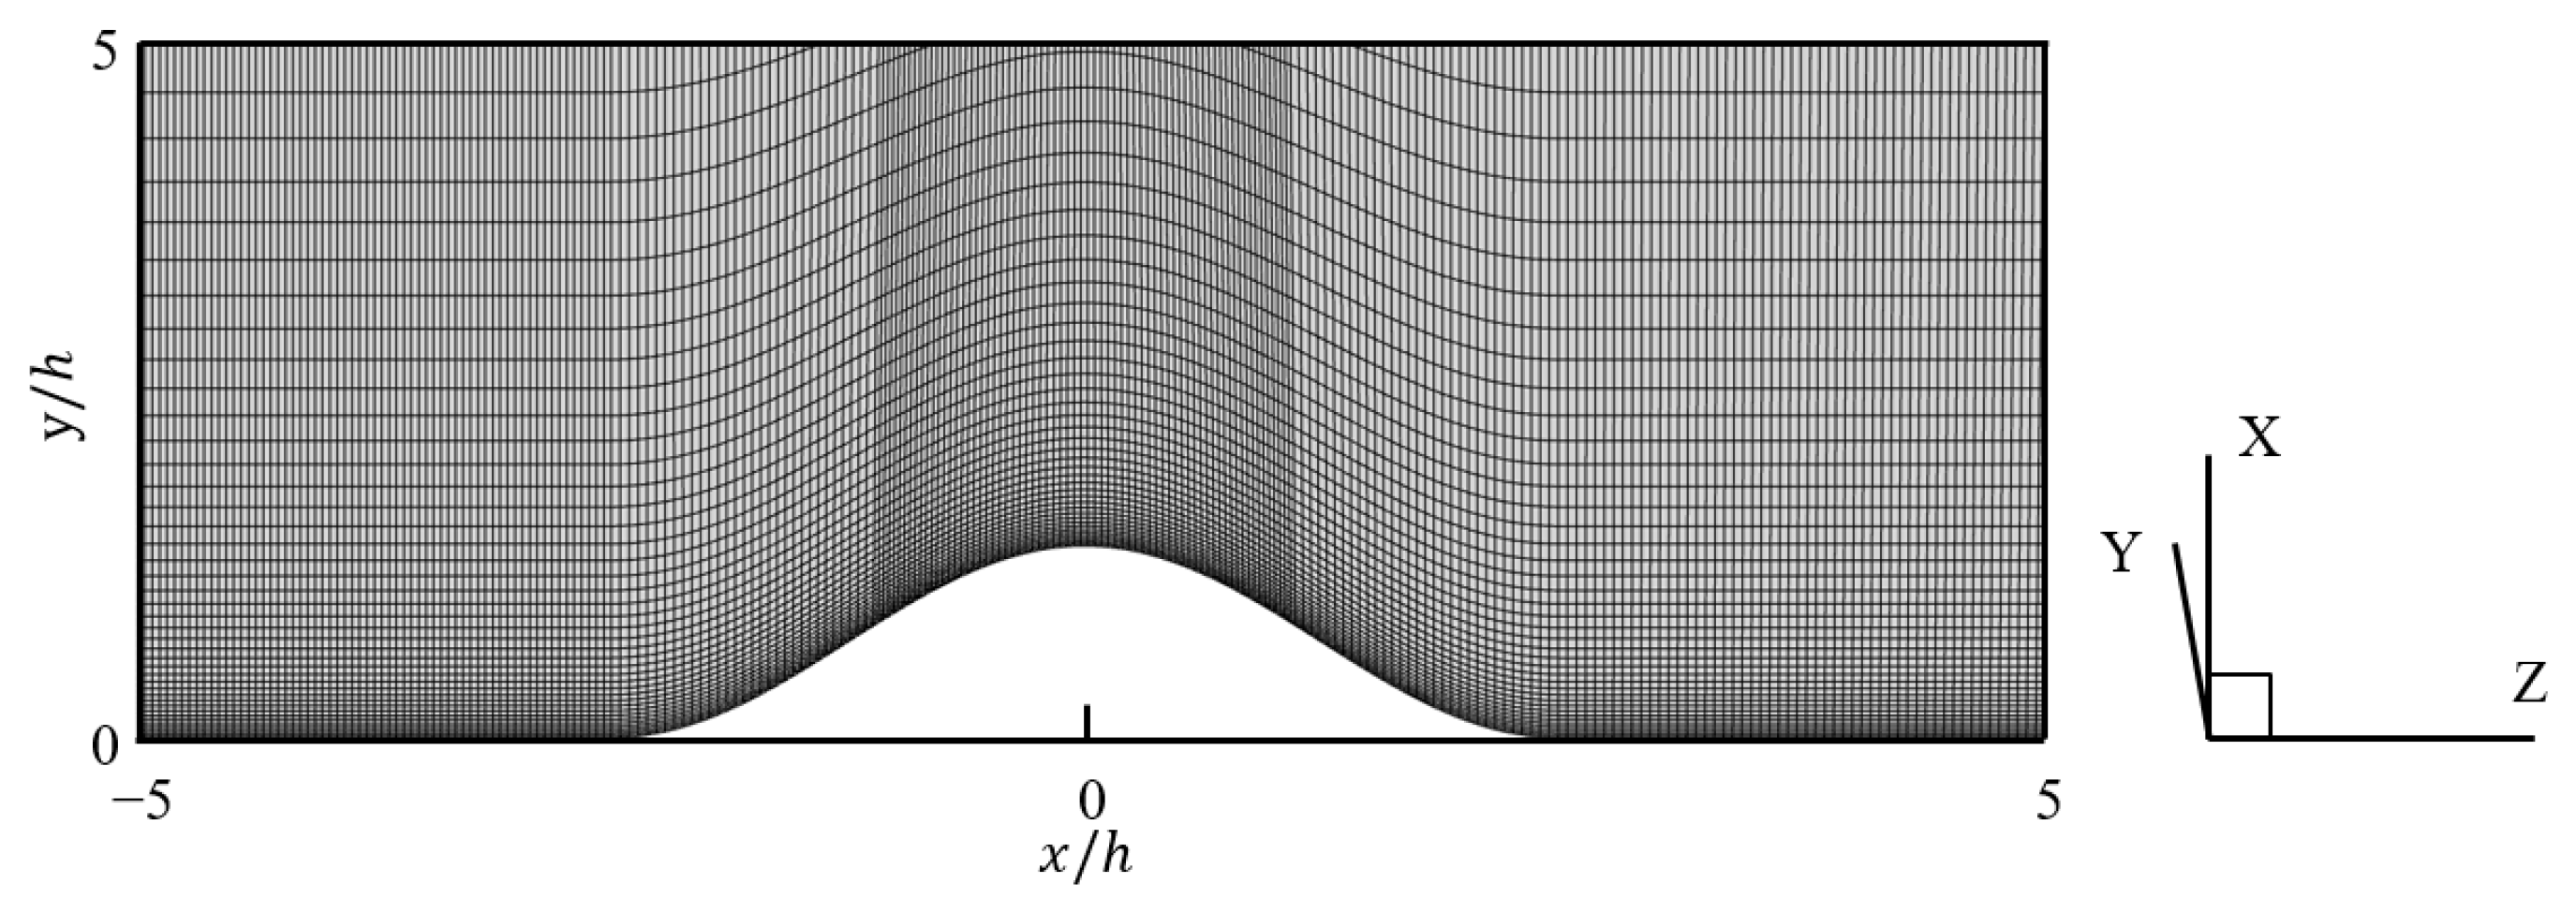
In establishing the CFD computational mesh, two types of mesh designs were employed to ensure calculation accuracy while minimizing computational time and the total number of grid cells, with the horizontal mesh spacing locally refined around the 3D hill. The refined region extends 0.4 m from the inlet to the downstream leeward side, totaling a length of 10 (equivalent to twice the diameter of the hill base). This area covers the primary range of variations in updrafts generated by the topographic uplift [8,18], as shown in Figure 2. The horizontal grid cells are square in shape, with the grid lengths set to 5 mm, 4 mm, 3 mm, and 2 mm. To accurately represent the curved geometry of the terrain, body-fitted grid arrangement was used. The first vertical layer grid lengths were set to 2 mm, 1 mm, 0.75 mm, and 0.5 mm, with a vertical growth factor of 1.1. This approach ensures a finer resolution near the surface of the hill and in regions with higher flow gradients, allowing for accurate simulation while keeping the total mesh size manageable.
Figure 2.
Schematic of Mesh Division for Mountain Terrain Cross-Section.
In this study, a grid independence test was conducted to assess the impact of mesh size on the computational results. The normalized wind speed at the center of the mountain peak for four different mesh sizes was compared with the isolated hill terrain results from Ishihara’s study. The simulation results from the third and fourth mesh sizes showed an absolute error that closely matched the wind tunnel measurement data. As a result, the third mesh configuration was chosen for subsequent calculations.
2.4. Boundary Conditions
In natural environments, the wind speed near the ground decreases as the distance from the surface decreases due to friction. The curve that describes how the average horizontal wind speed varies with height is known as the wind speed profile. There are three widely used wind profile models: the exponential law empirical model [34], the logarithmic law theoretical model [35], and the composite law semi-empirical semi-theoretical model [36]. In this study, the exponential law empirical model will be used to describe the inflow wind profile at the domain inlet.
The expression for the exponential law empirical model for the wind profile is given by:
In the equation, represents the reference height, is the wind speed at the reference height, and is the exponent of the wind profile. Based on the wind tunnel experimental data from Ishihara, the fitted wind profile function is given with the following parameters: , and .
The turbulent kinetic energy and dissipation rate at the inlet of the computational domain are defined as follows [27,28]:
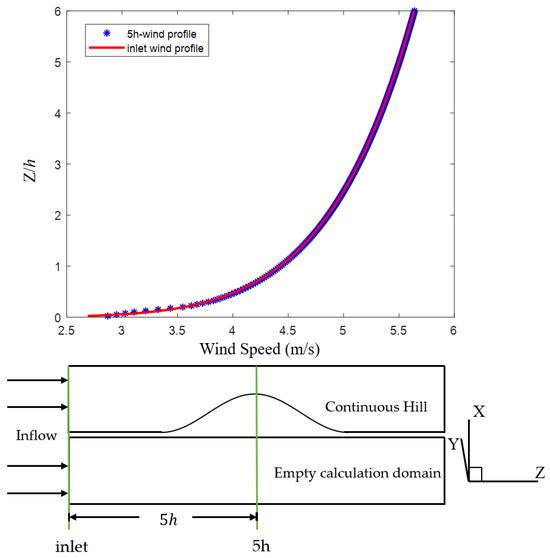
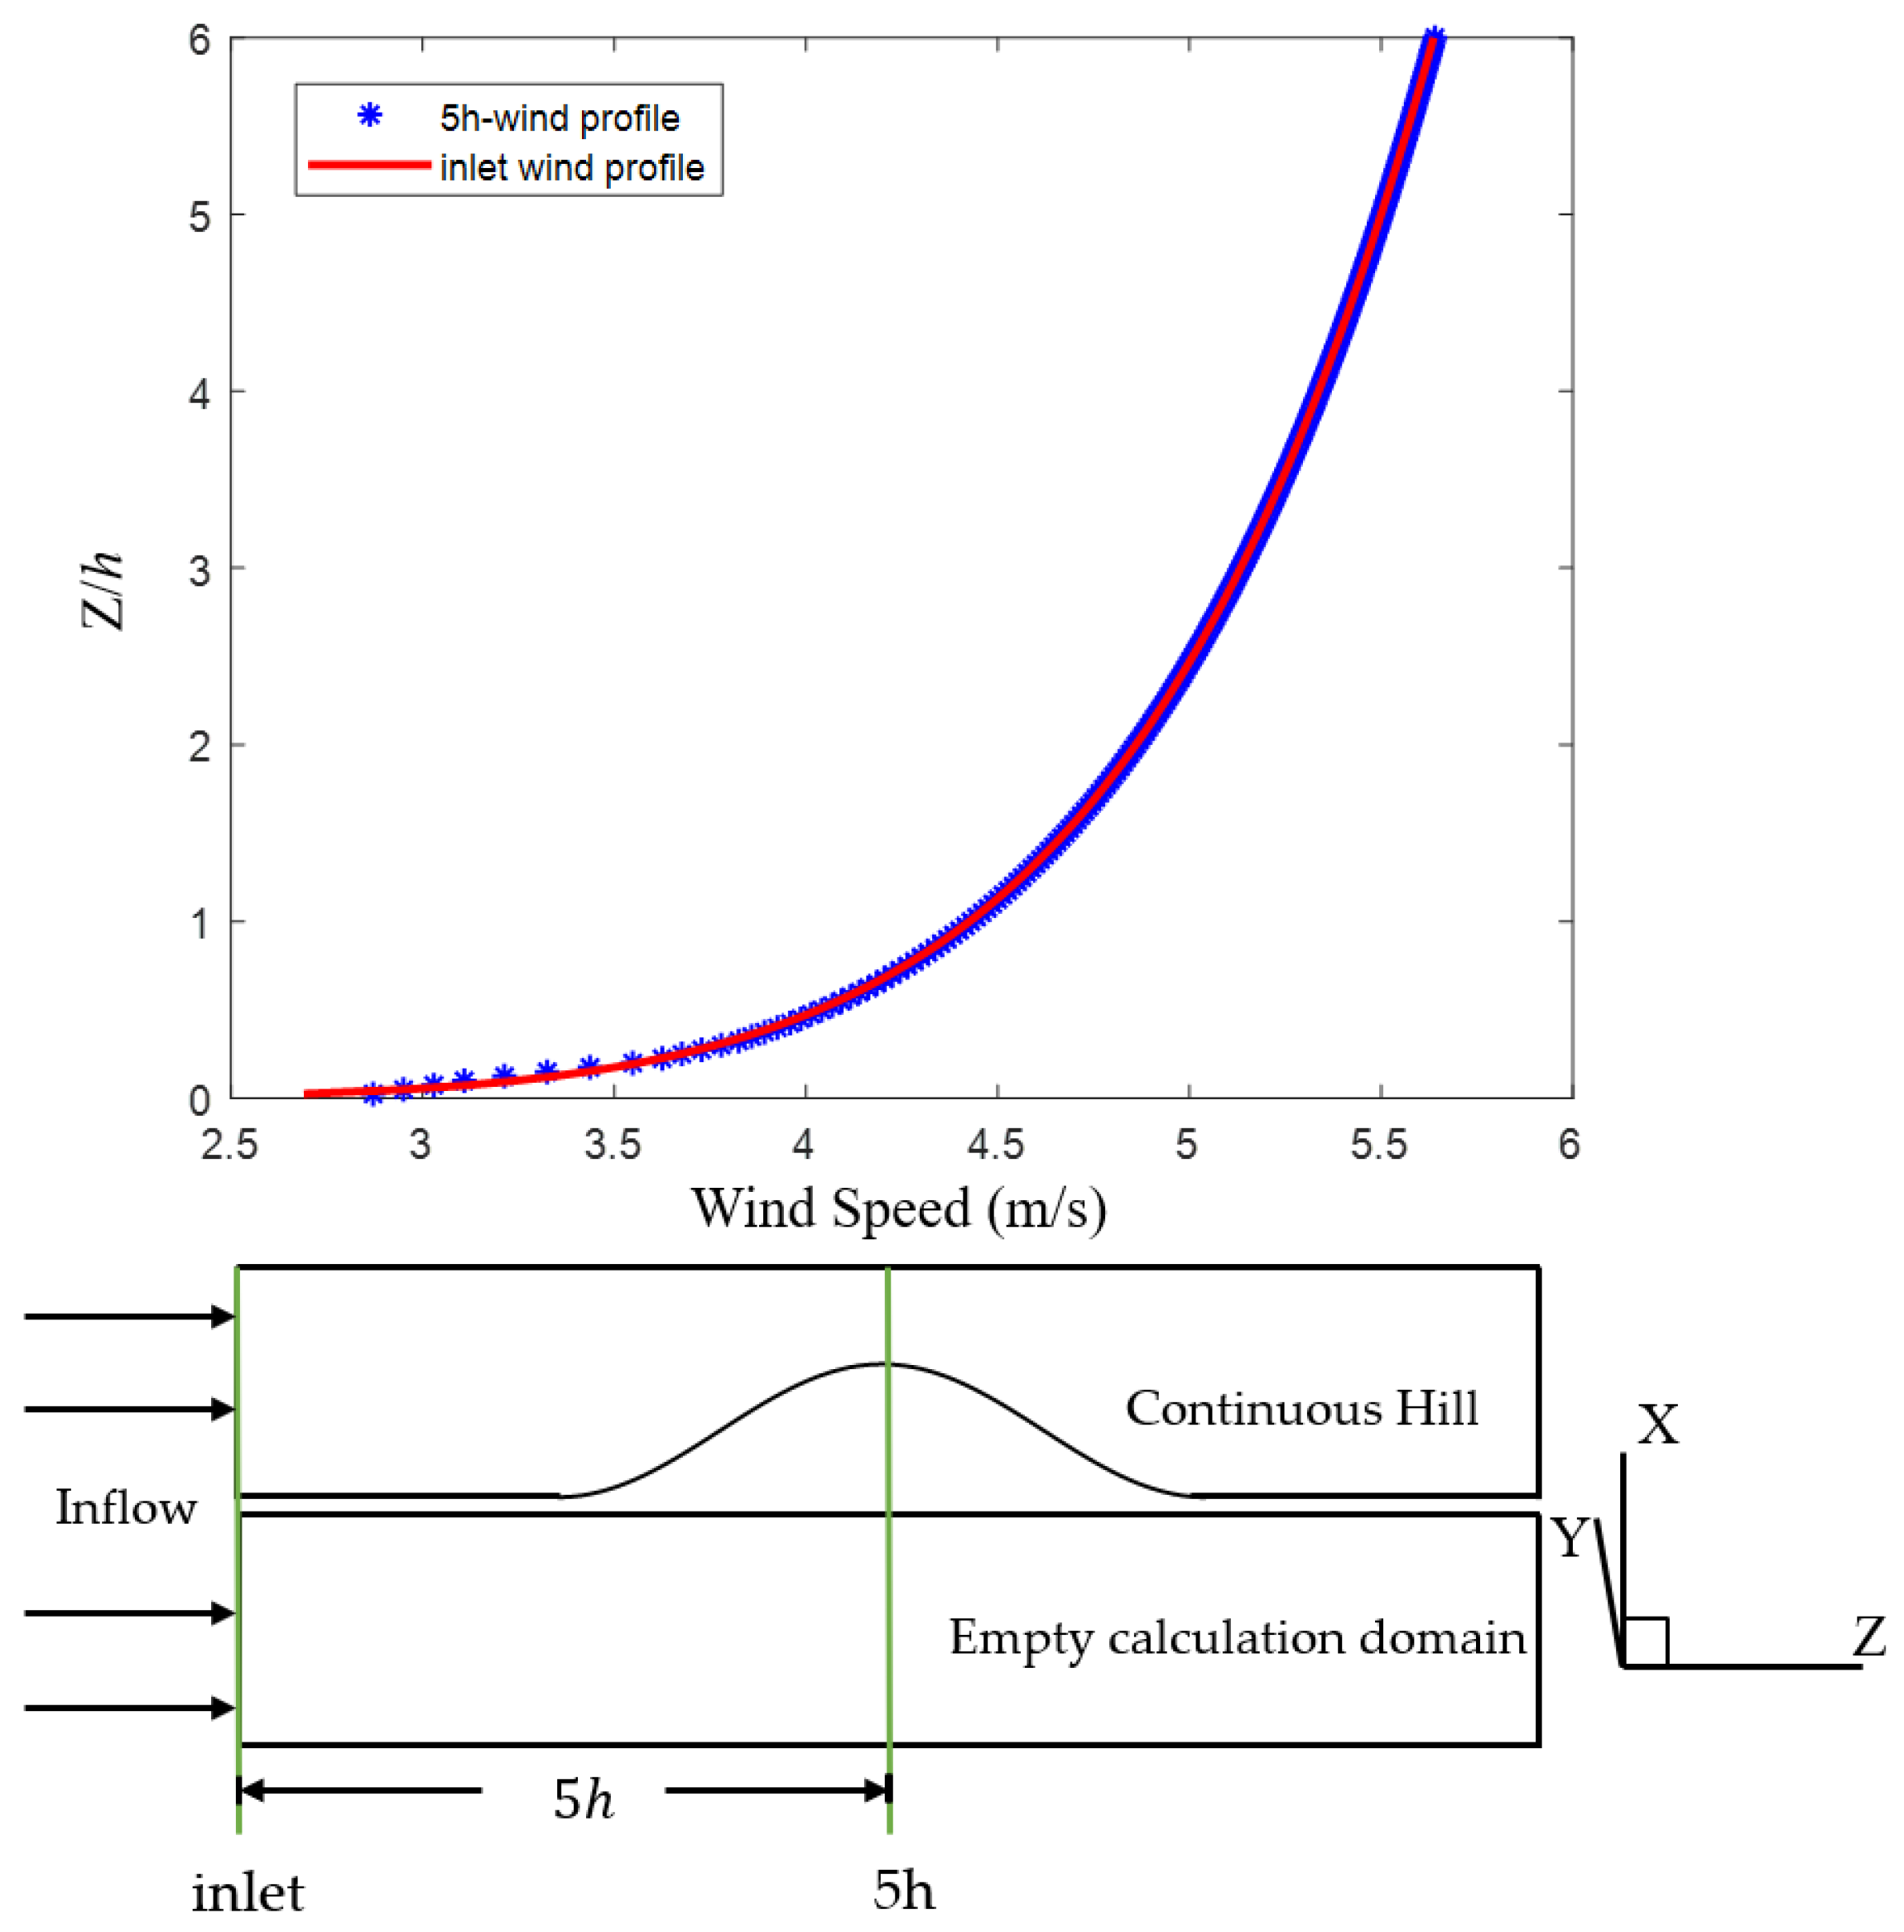
To verify the consistency of the wind profile shape, a numerical simulation was conducted in a computational domain of the same size without mountainous terrain. Figure 3 presents a comparison between the wind profile function curve set at the inlet of the computational domain and the wind profile at a location near the center of the mountain’s vertical profile (5 away from the domain inlet).
Figure 3.
Comparison of the Wind Profile Function at the Inlet and the Wind Profile at a Location 5h from the Inlet.
The upper and lateral boundaries of the computational domain are set as symmetry conditions. A no-slip wall condition is applied at the surface of the terrain. The detailed boundary conditions are summarized in Table 1. The computations were performed using the commercial software ANSYS Fluent 2020.
Table 1.
Boundary Conditions of the Computational Domain.
3. Results
3.1. Overall Distribution Characteristics of Orographic Updrafts
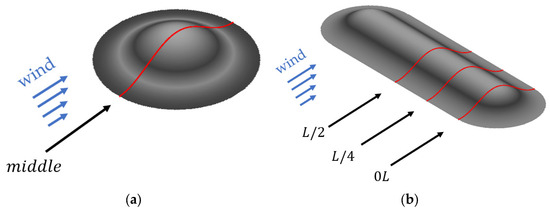
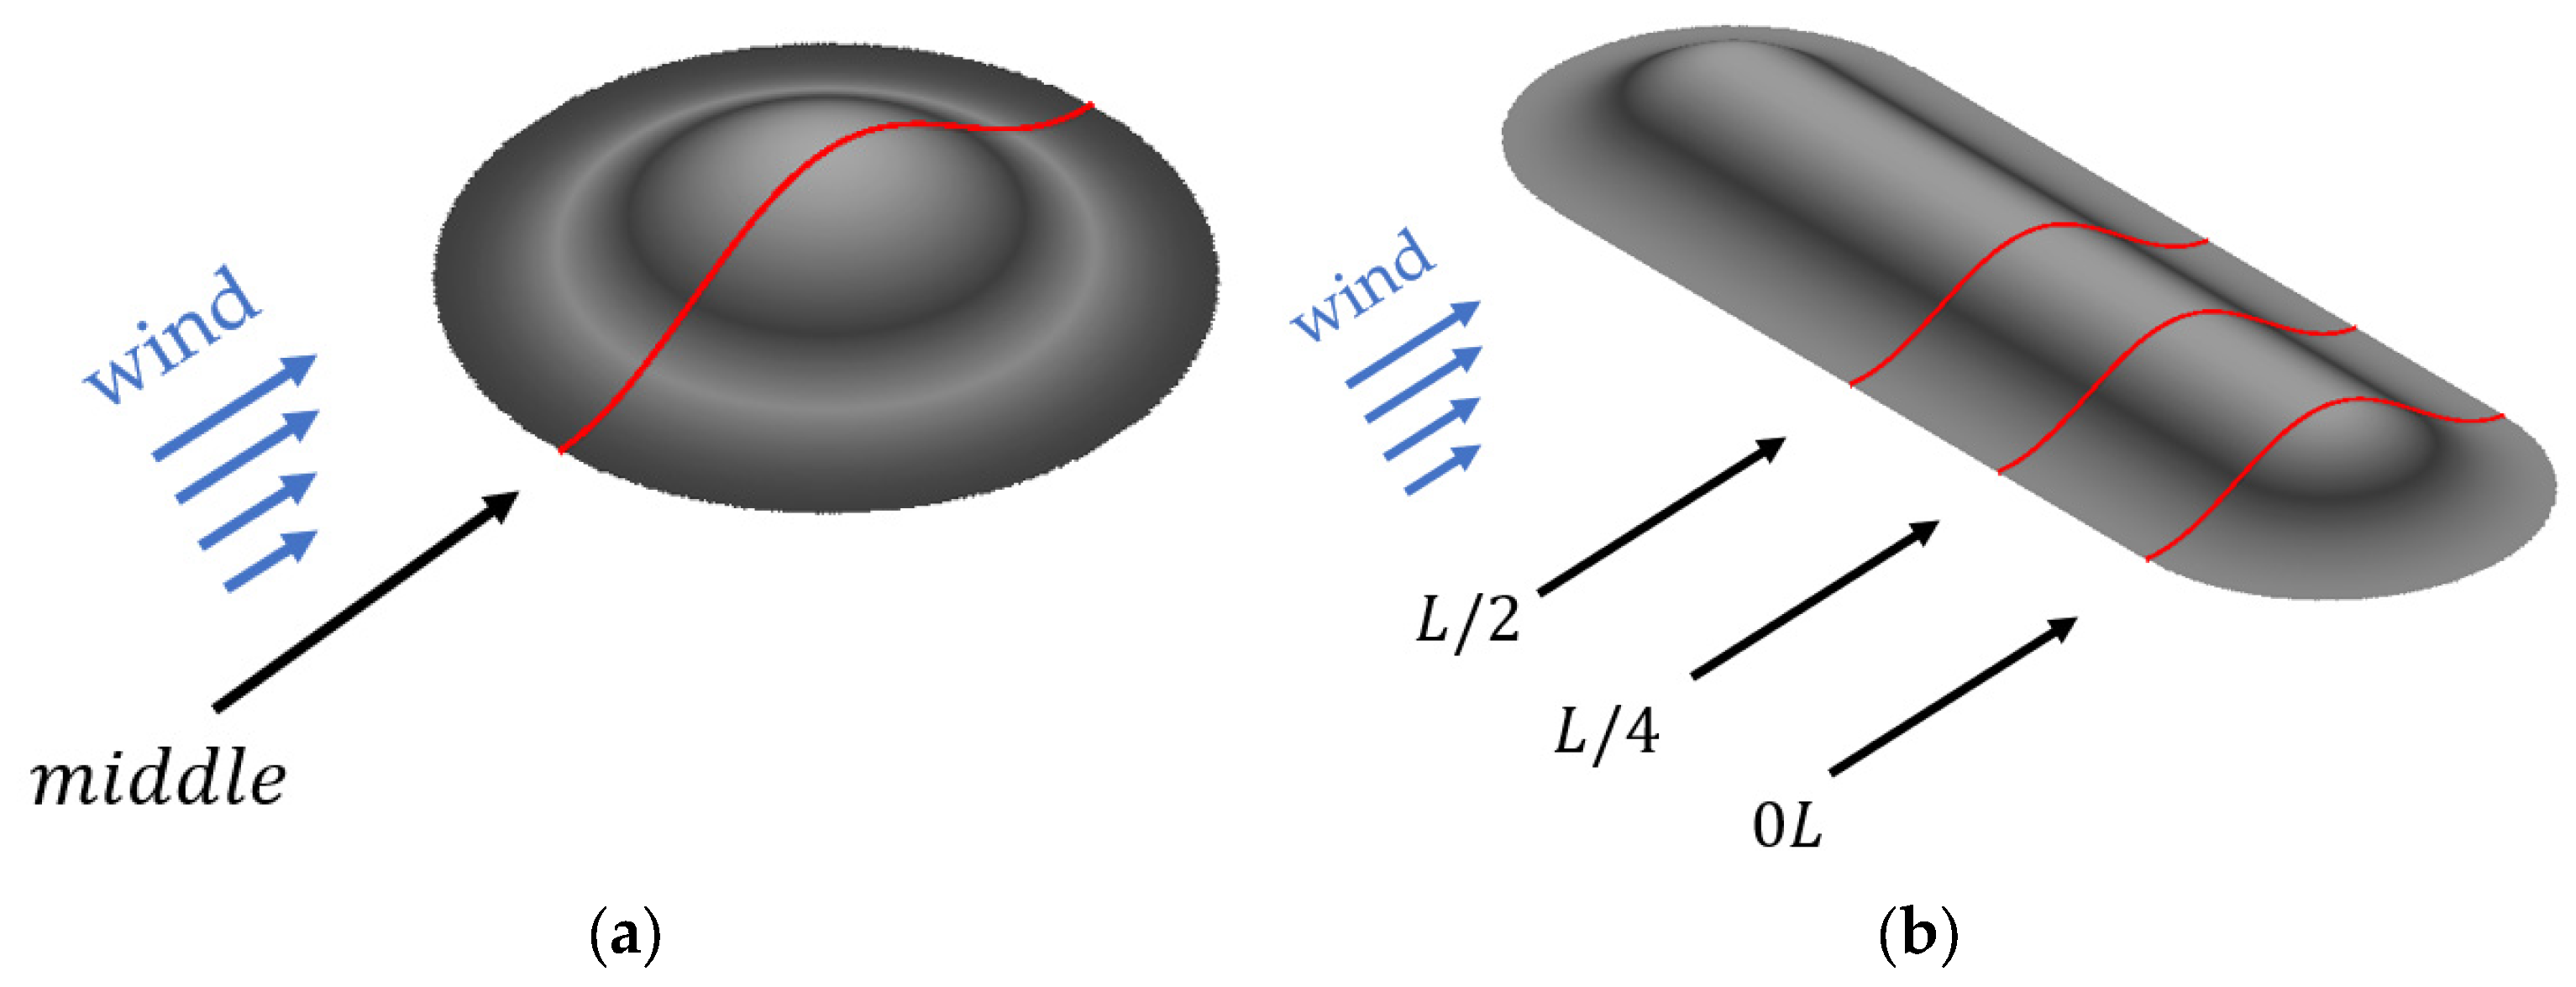
This paper conducts a comparative analysis of the distribution characteristics of orographic updrafts at different horizontal heights along multiple windward cross-sections of both isolated hills and mountain ridges. For the isolated hill, the central axis cross-section was chosen. In contrast, for the continuous range (owing to its symmetric shape) the analysis was performed along the symmetry axis and one of its sides, focusing on three key positions: the starting point of the ridge (), one-quarter of the ridge length (), and the midpoint of the ridge (), as shown in Figure 4.
Figure 4.
Vertical Profile Positions of Two Typical Mountain Terrains. (a) Isolated hill; (b) Continuous range.
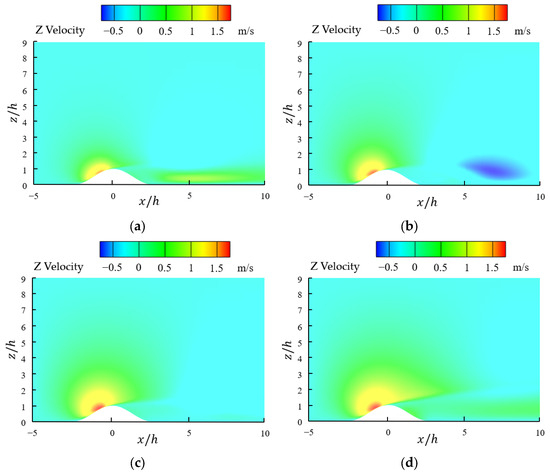
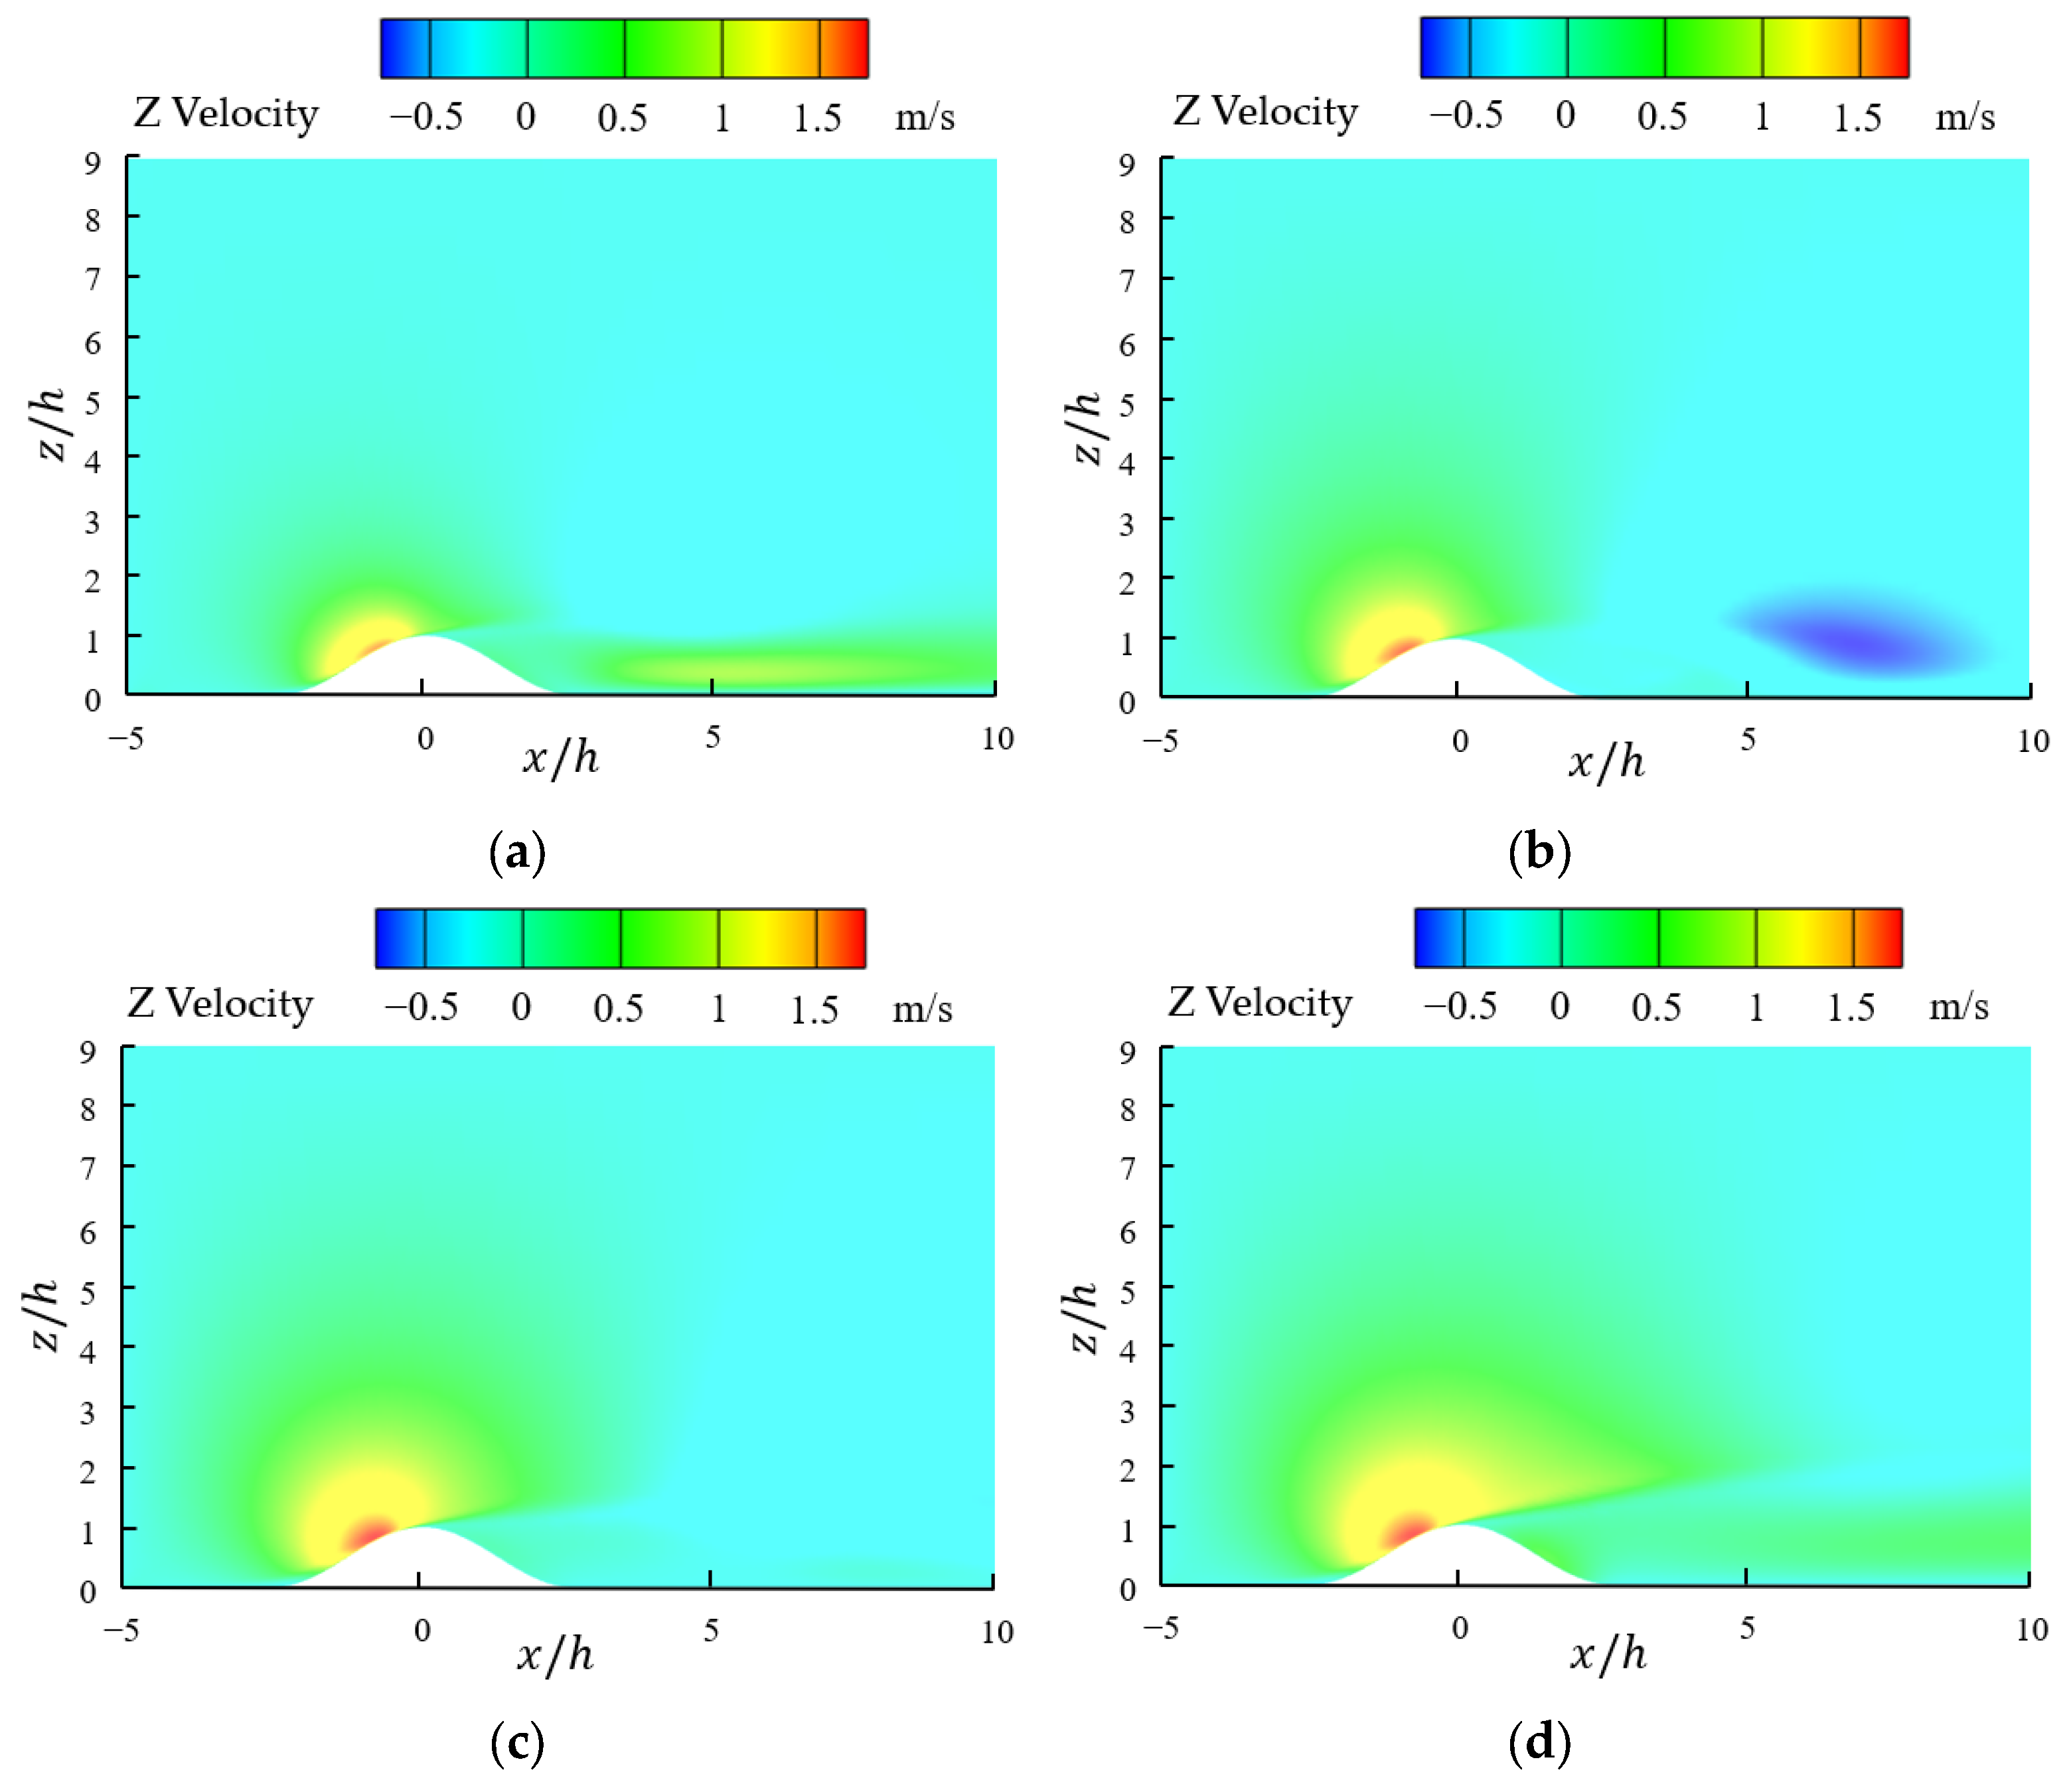
Figure 5 displays the vertical (z-direction) wind speed distributions at four cross-sectional positions for both types of mountain terrains. As seen from Figure 5, the shapes of the vertical wind speed distributions at the four cross-sectional positions are generally similar for both mountain types. The orographic updrafts are predominantly distributed in the frontal and upper regions of the windward side of the mountain, exhibiting a fan-shaped diffusion in an upward diagonal direction. The two mountain terrains can be divided by the ridge height into two distinct regions with different updraft distribution characteristics:
Figure 5.
Vertical Wind Speed Distribution Across Cross-Sections of Isolated Hill and Continuous Ridge (h = 40 mm). (a) Isolated hill; figures b through d display different cross-sections of the continuous ridge from (b) ; (c) ; (d) .
- Below the Ridge Line: The orographic updrafts appear at the frontal part of the windward side, with the horizontal intensity distribution mirroring that of the windward surface. The maximum value occurs near the mountain surface and gradually diminishes in the direction of the approaching flow.
- Above the Ridge Line: The updraft distribution is no longer confined by the mountain. Although updrafts also exist on the upper part of the lee side, the horizontal intensity center is located above the windward side.
A comparison between the vertical wind speed contour maps and numerical values for the isolated hills and continuous ridge reveals that:
- The maximum orographic updraft value for the isolated hill (1.749 m/s) is lower than those for the three cross-sections of the continuous ridge, which are 1.890 m/s, 1.986 m/s, and 1.999 m/s at positions 0L, L/4, and L/2, respectively.
- The area with higher updraft intensity (greater than 0.5 m/s) on the windward side of the continuous ridge is larger than that of the isolated hill. Moreover, as the cross-sectional position approaches the central part of the continuous ridge, the region of higher updraft intensity further expands. This expanded region can provide sufficient updraft strength for small fixed-wing UAVs to perform unpowered static soaring.
3.2. Distribution Characteristics of Orographic Updrafts Below Ridge Height
Figure 6 illustrates the vertical wind speed distribution at the horizontal plane of height for both isolated hills and mountain ridges. The white regions in Figure 6 represent the mountainous terrain at this elevation. Orographic updrafts predominantly occur on the windward side of both mountain types, with their horizontal distribution shapes aligning closely with the windward contour of the terrain. The isolated hill exhibits a semi-circular diffusion pattern, while the continuous range displays a band-like distribution, where the contours of average wind speed are approximately parallel to the windward slope of the terrain. Within this altitude range, the study primarily focuses on the airflow distribution over the windward slope, where the flow remains relatively stable, with the exception of nearly vertical slopes that may generate turbulent vortices in the immediate vicinity of the ridgeline. In contrast, most hills tend to produce highly complex turbulent vortices on the leeward side; such conditions would be catastrophic for UAV flight, and operations in this region should be avoided to the greatest extent possible.
Figure 6.
Vertical wind speed distribution at the horizontal plane for two typical terrains (h = 40 mm). (a) Isolated hill; (b) Continuous ridge.
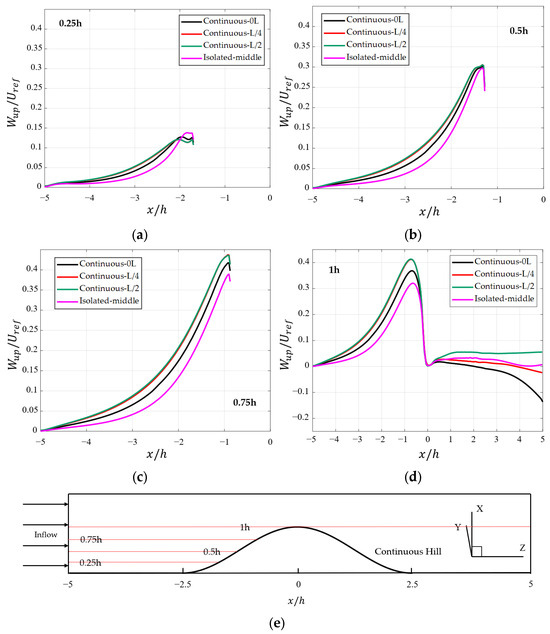
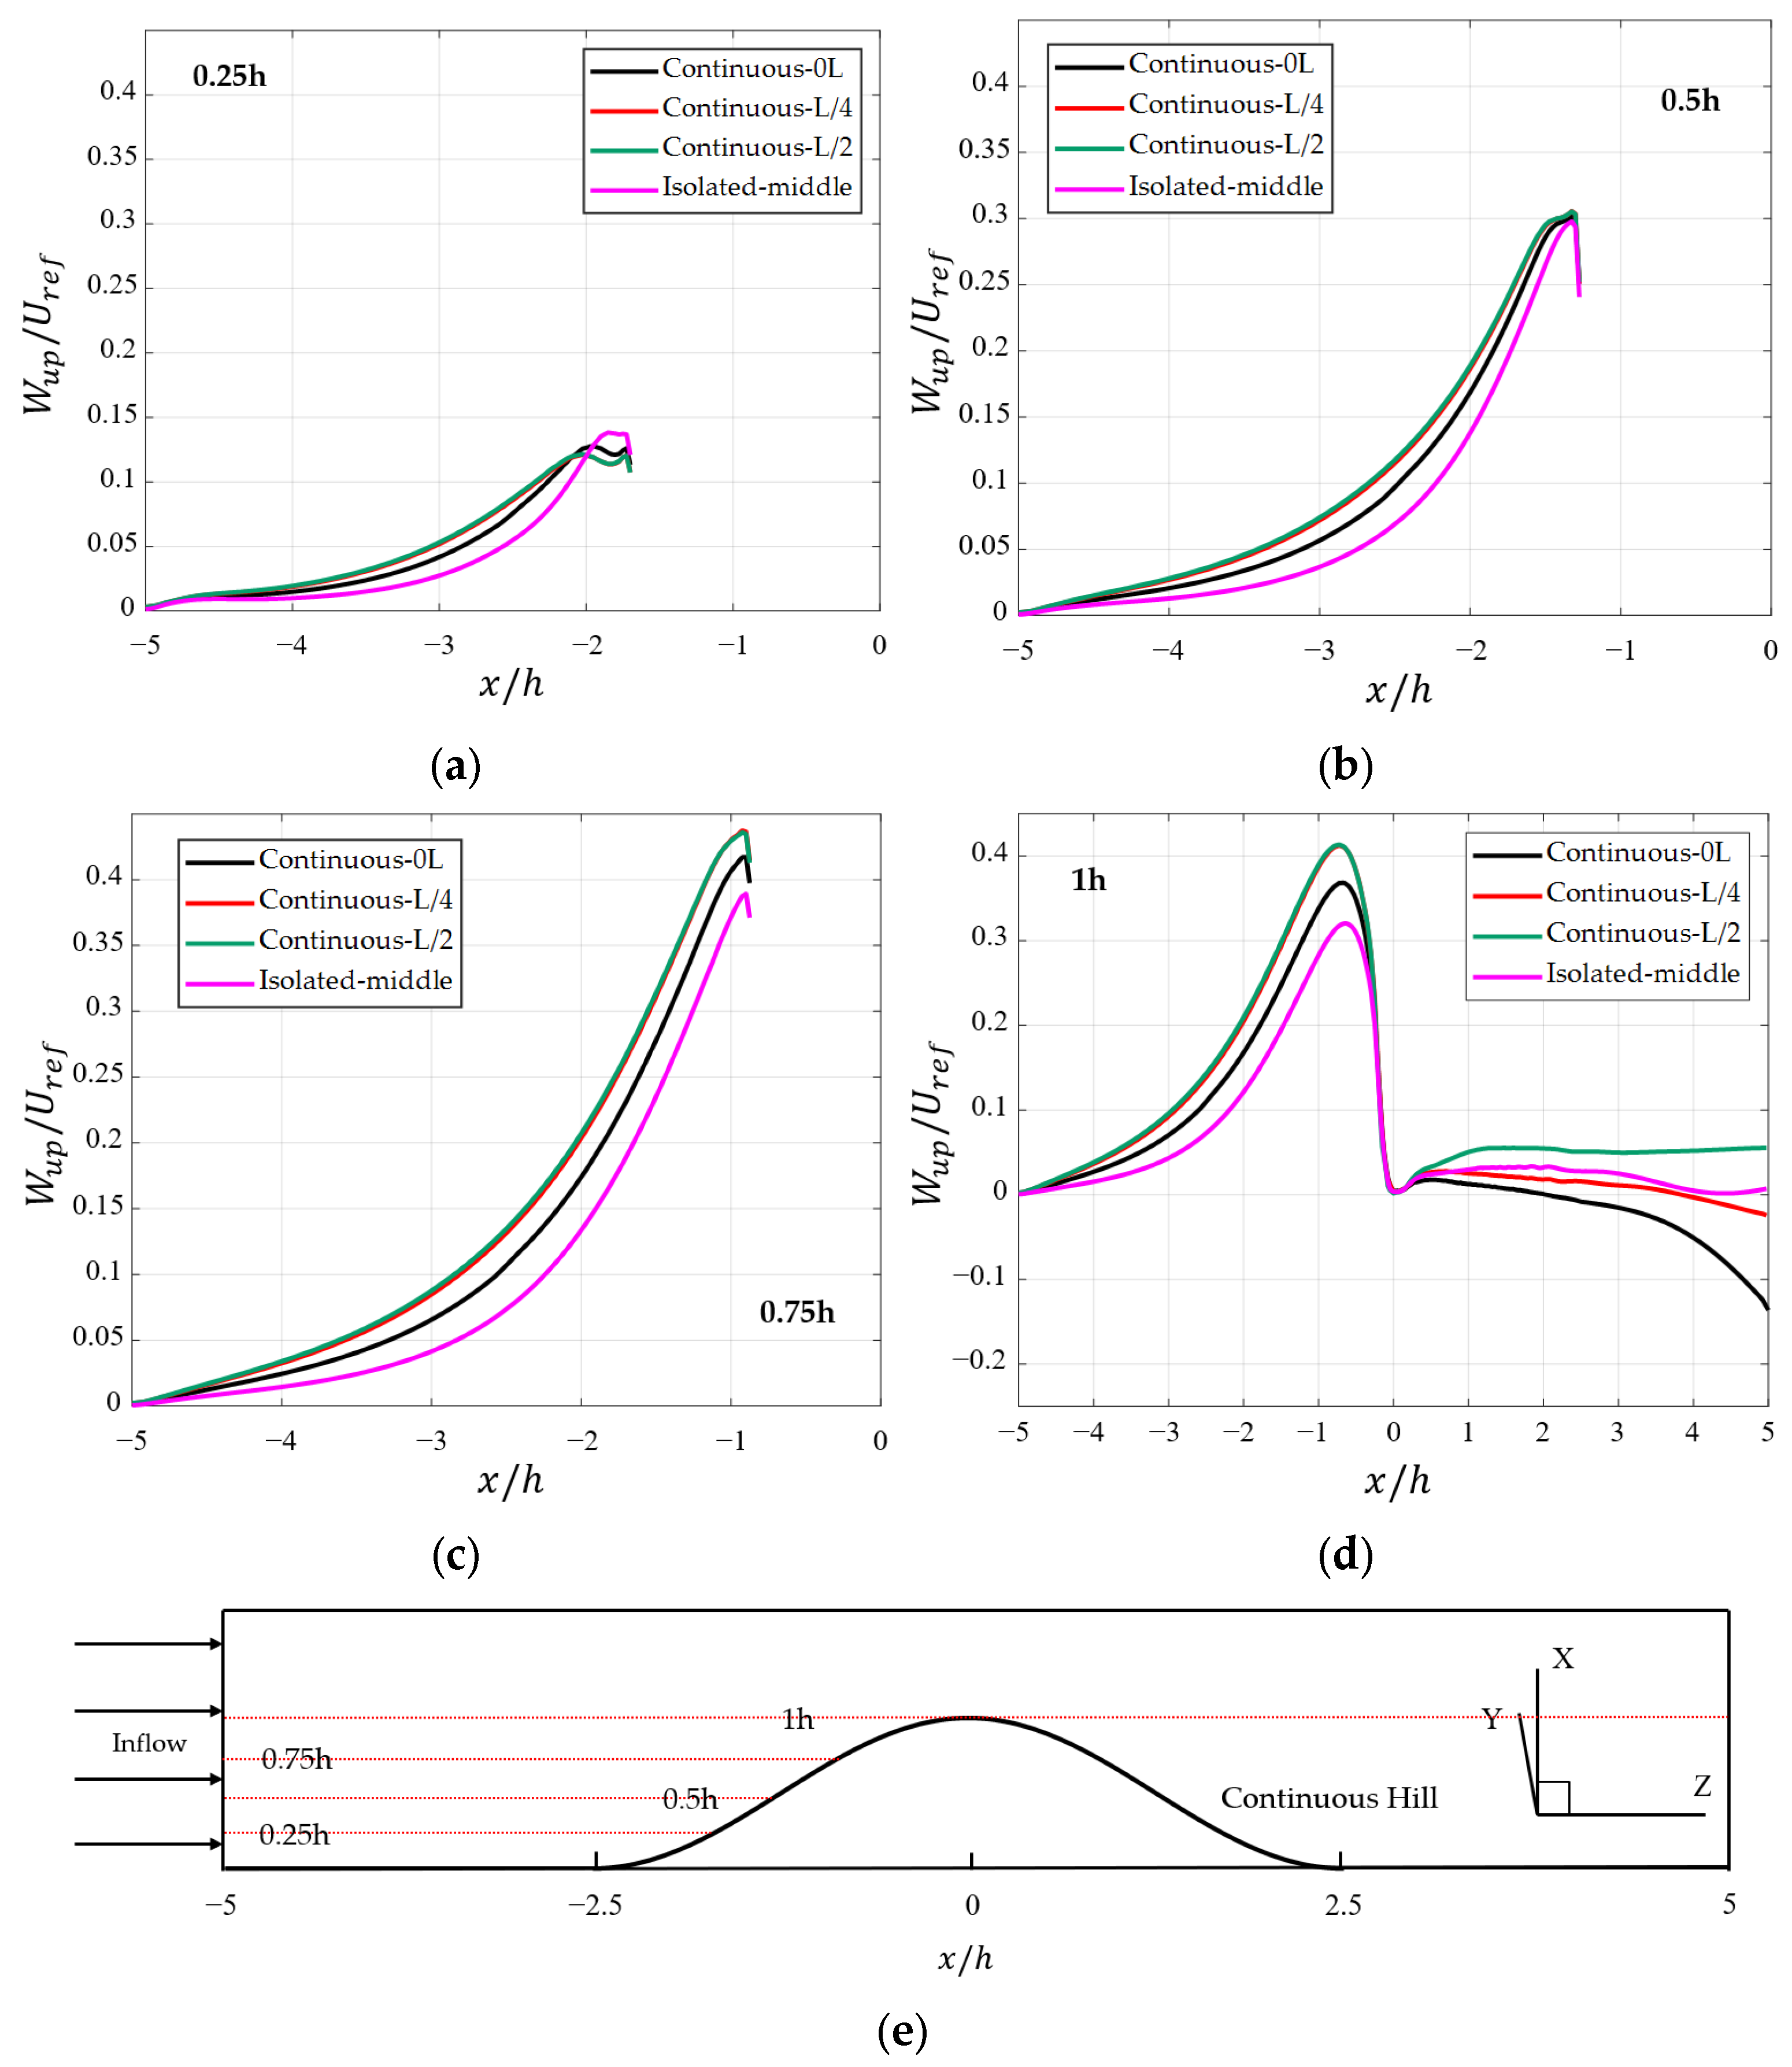
As shown in Figure 7, the horizontal distribution of vertical wind speed below the ridgeline at multiple cross-sections for the isolated hill and continuous ridge at different horizontal heights is presented. The x-coordinate represents the distance from the ridgeline center, with the starting positions of the windward and leeward sides located at equal to −2.5 and 2.5, respectively. In this study, the vertical wind speed is normalized, expressed as:
where represents the vertical wind speed in the presence of the terrain, and denotes the horizontal inflow wind speed at the height of the hill center point () in the absence of terrain.
Figure 7.
Horizontal distribution curves of vertical wind speed at different heights and sections below ridge height (≤1) (). (a) ; (b) ; (c) ; (d) ; (e) selection of locations for horizontal distribution at different altitudes.
Due to the obstruction posed by the mountain body within this altitude range, the coverage area of the wind field varies across different horizontal altitudes. The horizontal distribution of the updraft wind below the ridge line at the same height for different sections of the isolated hill and continuous ridge exhibits consistent patterns:
- As the distance approaches the windward contour of the terrain, the intensity of the updraft wind gradually increases but drops suddenly near the terrain surface, particularly at the hilltop.
- At the same distance from the ridge center, the updraft wind intensity below the ridge line of the isolated hill is generally weaker than that of the continuous ridge at all sections, except near the terrain surface at heights below 0.5h, where the isolated hill slightly exceeds the continuous ridge.
- For different sections of the continuous ridge, the updraft wind intensity is slightly lower near the semi-circular edges of the ridge (0L) compared to the central ridge region.
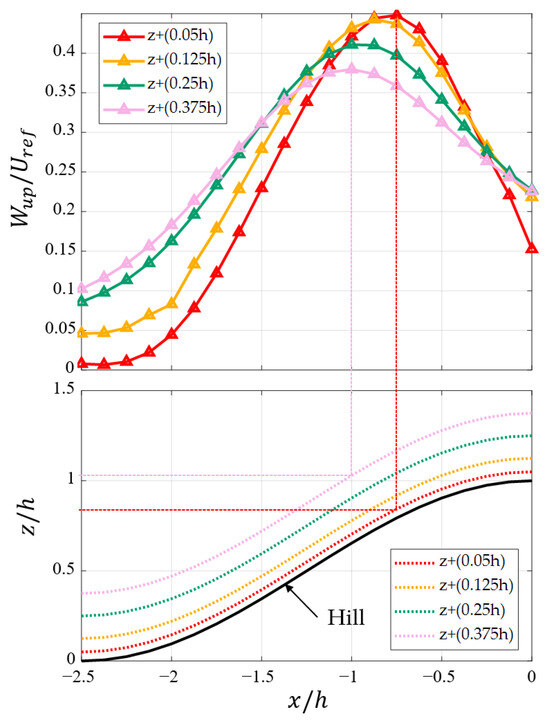
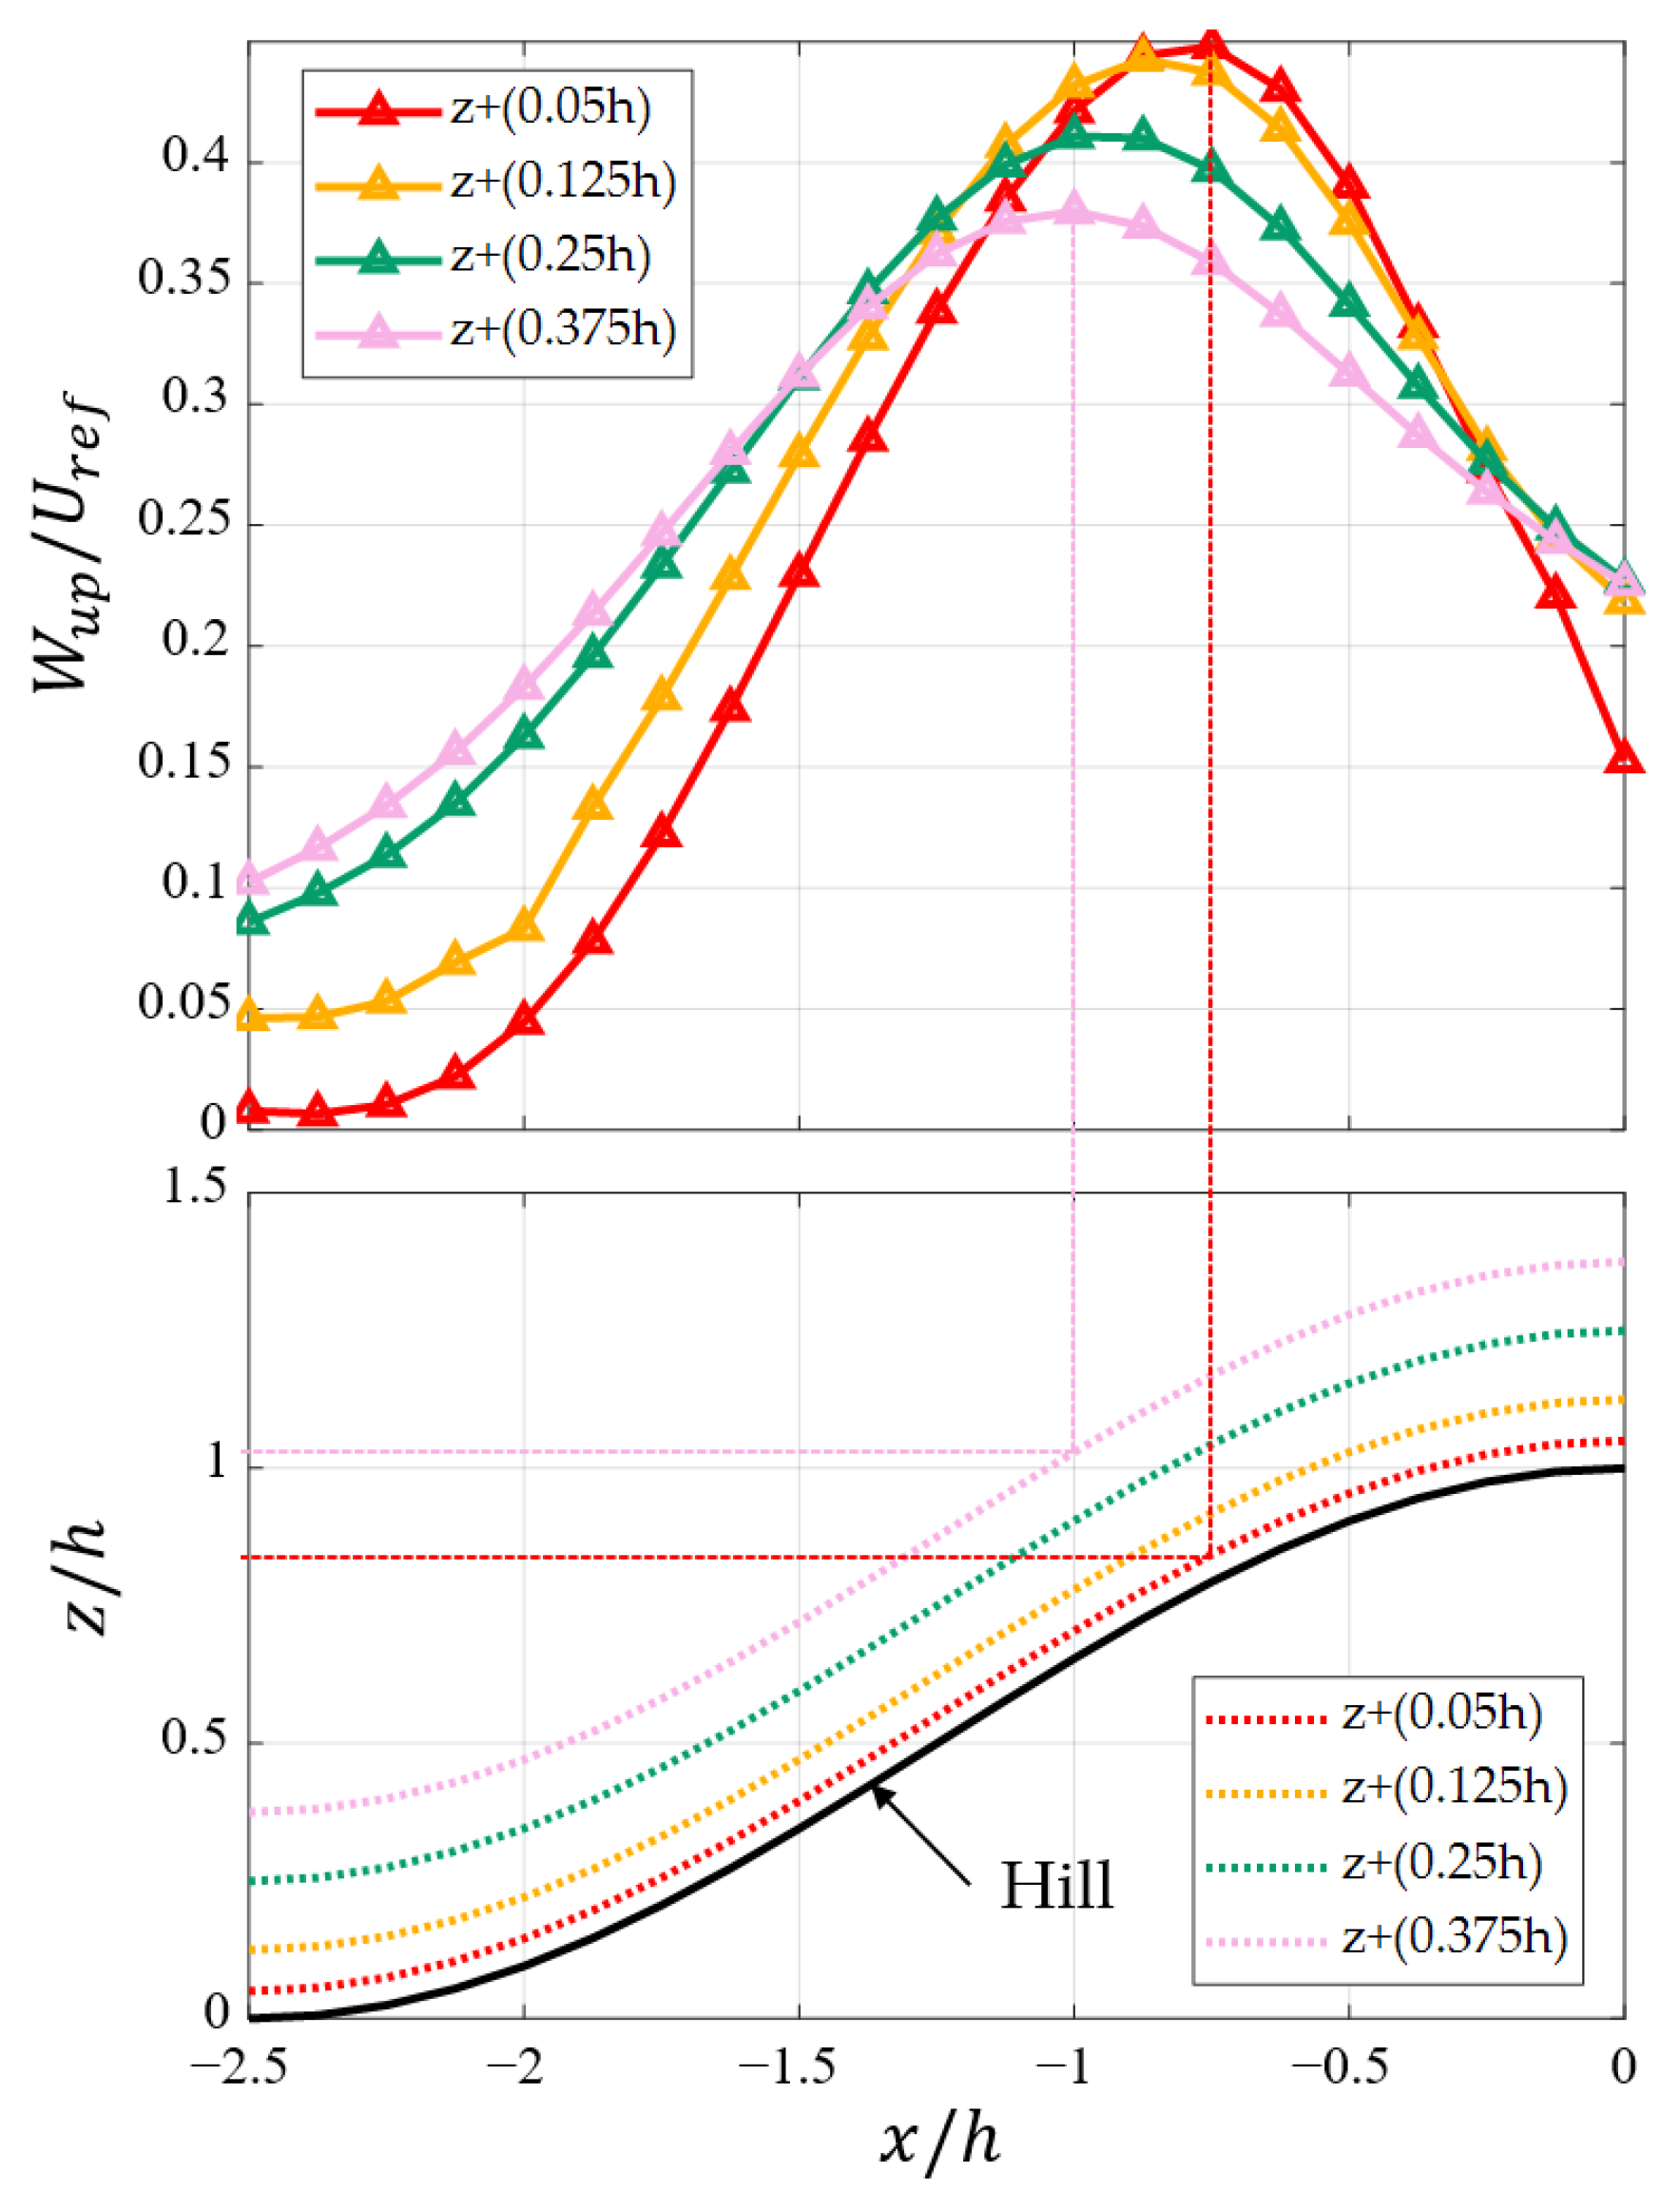
Figure 8 illustrates four elevation curves aligned with the terrain contour, vertically selected along the windward slope of the continuous ridge at the L/4 cross-section (one-quarter of the ridge length). These curves correspond to heights of 0.05h, 0.125h, 0.25h, and 0.375h above the mountain surface, designed to study the variation in orographic updraft intensity across different safe flight altitudes while maintaining a ground clearance margin to avoid collisions.
Figure 8.
Distribution of updraft strength at different clearance heights above the section of the continuous ridge ().
Figure 8 demonstrates the horizontal positions of maximum orographic updraft intensity at different safe ground clearance heights (indicated by dashed lines). The maximum attainable updraft intensity gradually decreases with increasing safe flight altitude. At the altitude of the (z + 0.375h) curve, the maximum intensity of the orographic updraft is 84.77% of that observed at (z + 0.05h). The horizontal position of this maximum intensity is shifting from the vicinity of the peak toward the windward foot of the hill as the safety altitude increases. Specifically, the maximum updraft intensity at an altitude of (z + 0.05h) occurs at a hill height of 0.84h, whereas at (z + 0.375h), it occurs at 1.03h. Although the peak intensity of the updraft diminishes as the distance from the hill surface increases, the overall updraft intensity—excluding the peak region—demonstrates a growing trend. Therefore, an appropriate clearance altitude not only ensures the flight safety of the UAV but also guarantees access to an updraft of sufficient intensity.
3.3. Distribution Characteristics of Orographic Updrafts Above Ridge Height
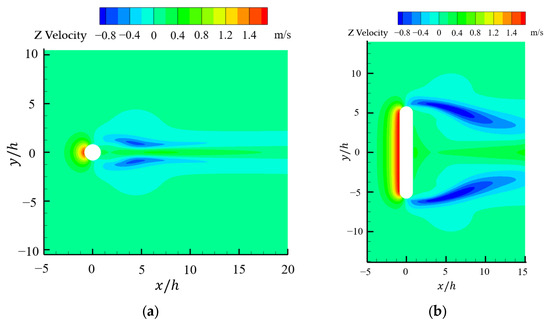
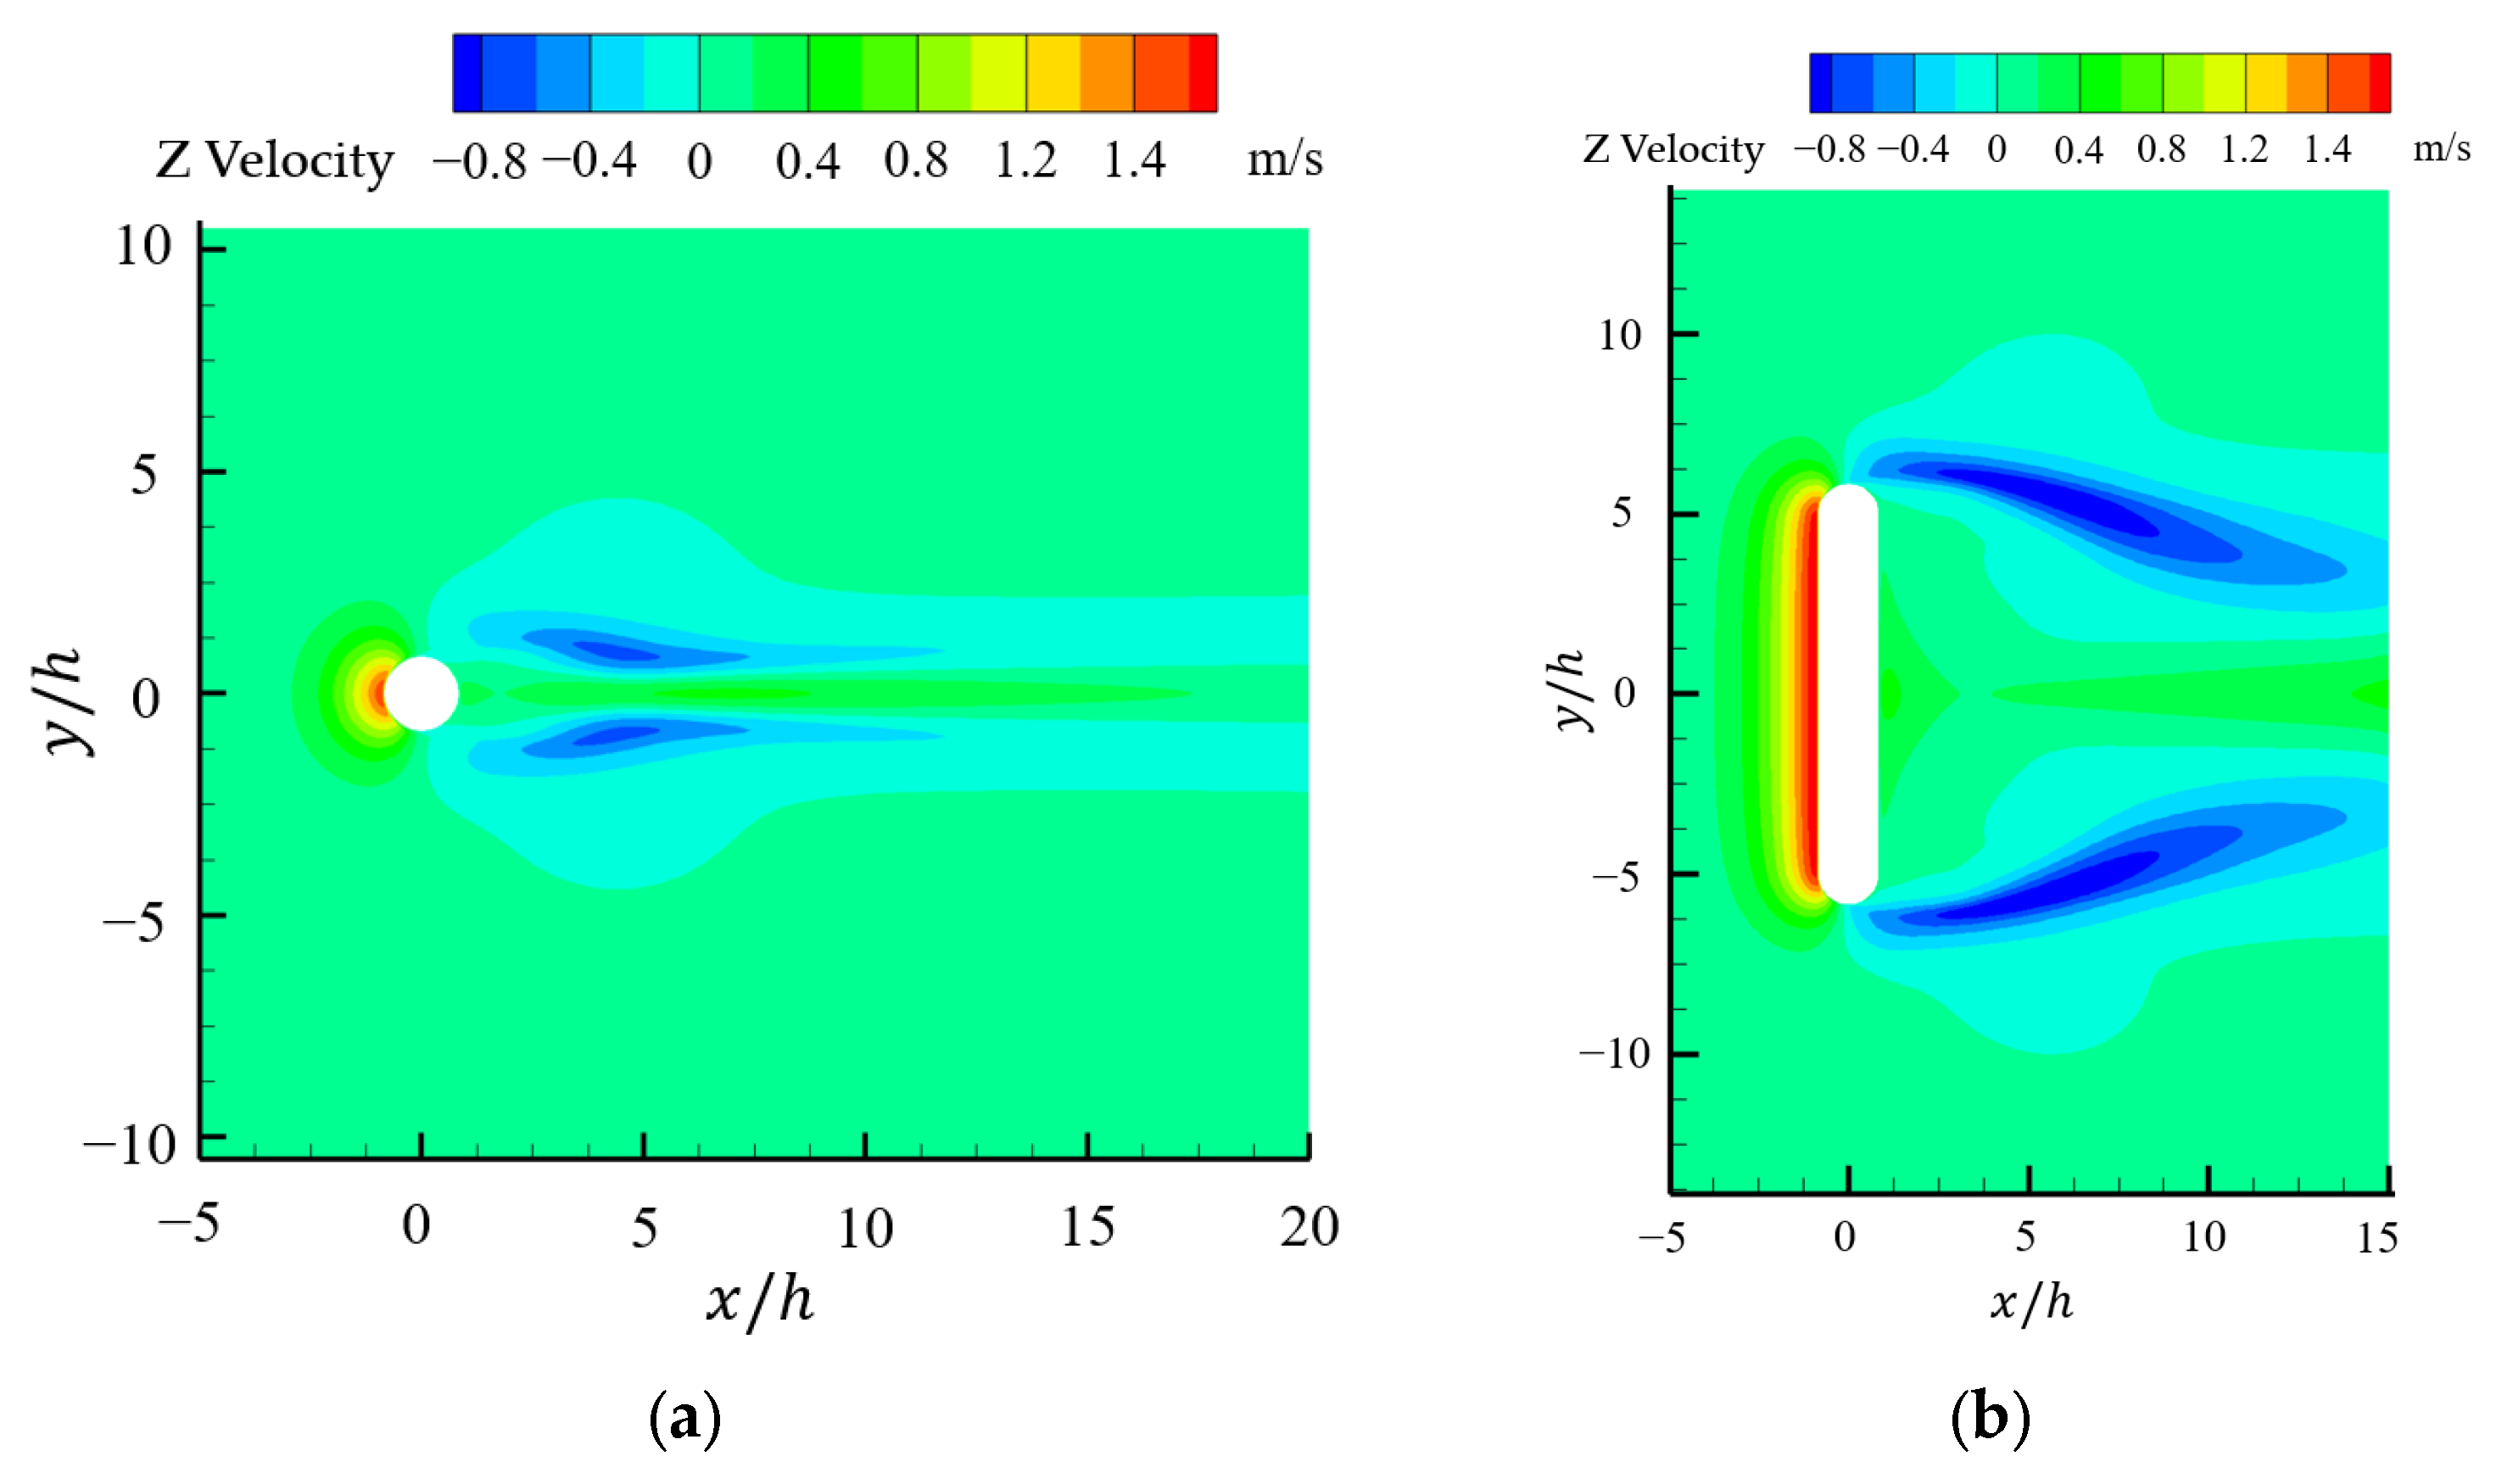
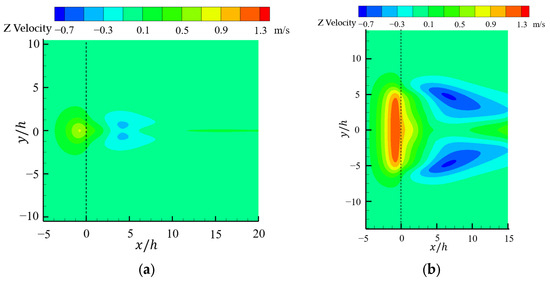
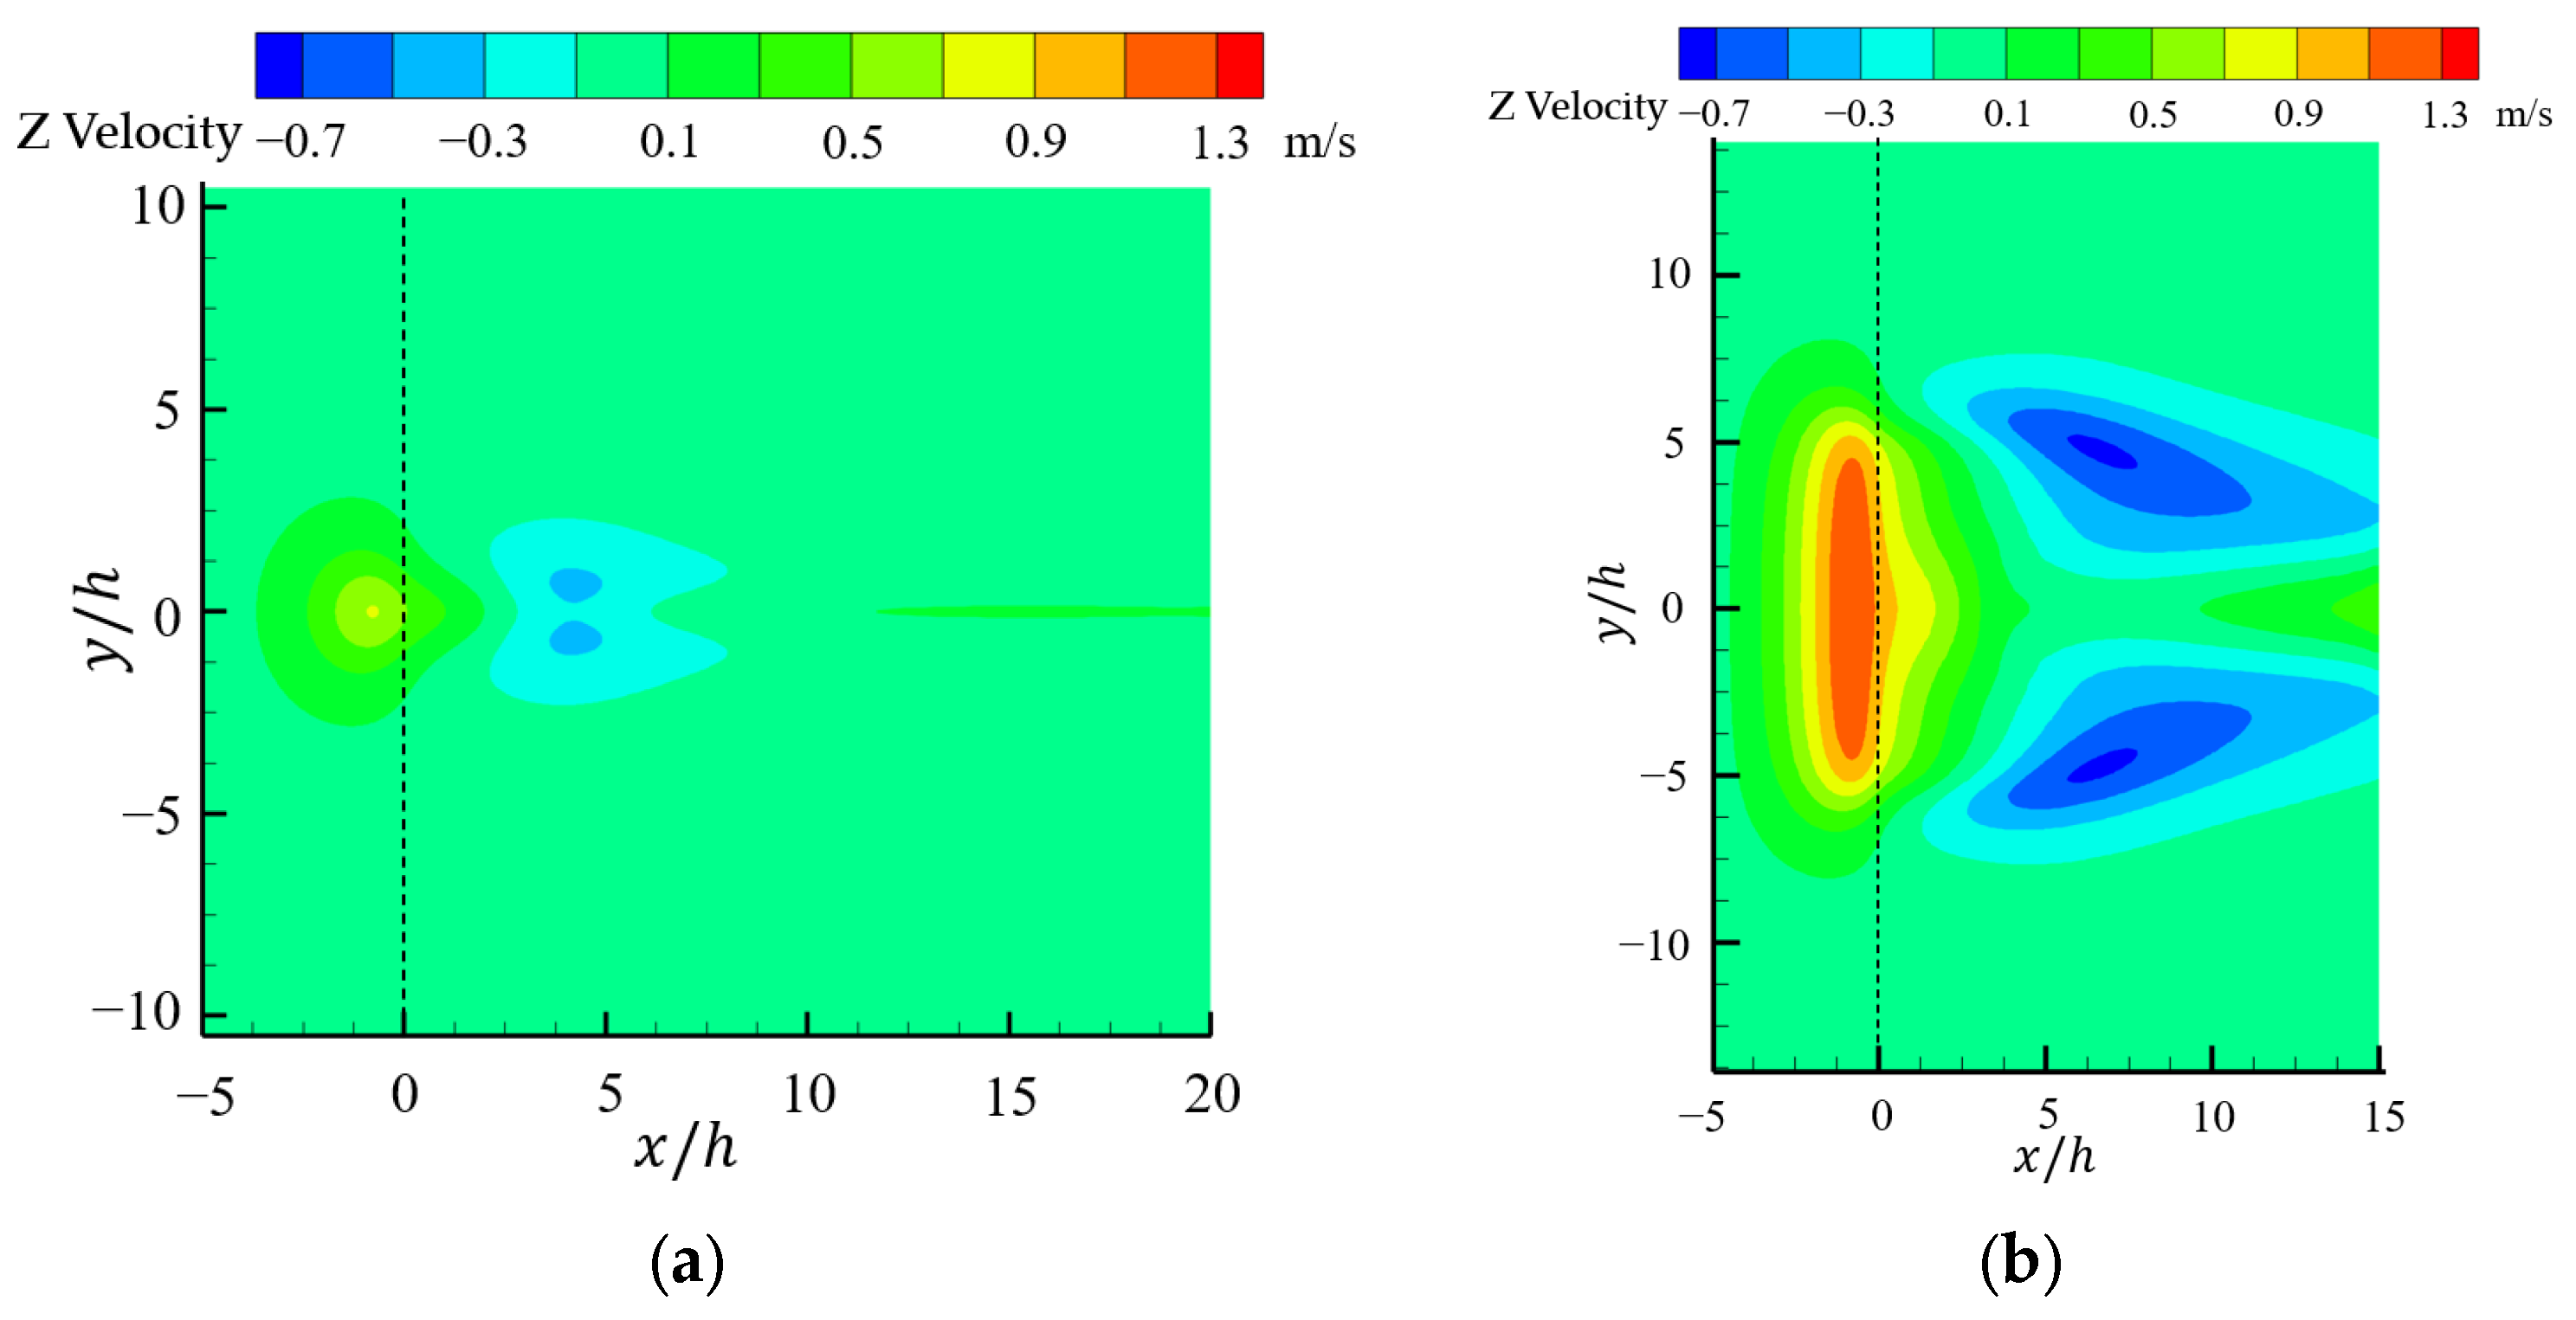
Figure 9 shows the vertical wind speed distribution at the horizontal plane for isolated hills and mountain ridges, with the dashed line indicating the ridge line position (). Above the ridge line, orographic updrafts exist on both the windward and leeward sides. For the isolated hill, the updrafts exhibit a nearly circular distribution, similar to thermal updrafts with a central intensity core. For the continuous ridge, the updrafts display an elongated band-like distribution parallel to the ridge line.
Figure 9.
Vertical wind speed distribution at a horizontal plane 1.5h above the ground for the isolated hill and continuous ridge (dashed line indicates the symmetry axis between the windward and leeward sides, which corresponds to the ridge line of the continuous ridge, y = 0) (), (a) Isolated Hill; (b) Continuous range.
Unconstrained by terrain blocking, the updrafts above the ridge line propagate symmetrically along an axis parallel to the ridge line (), with the symmetry axis shifted toward the incoming flow direction. Compared to elevations below the ridge line, the updraft coverage area above the ridge line is significantly larger.
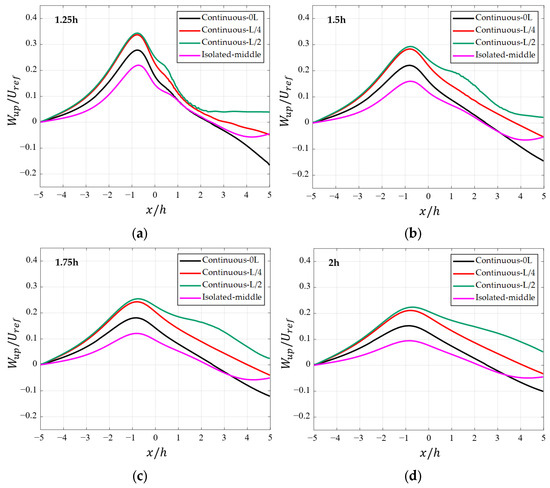
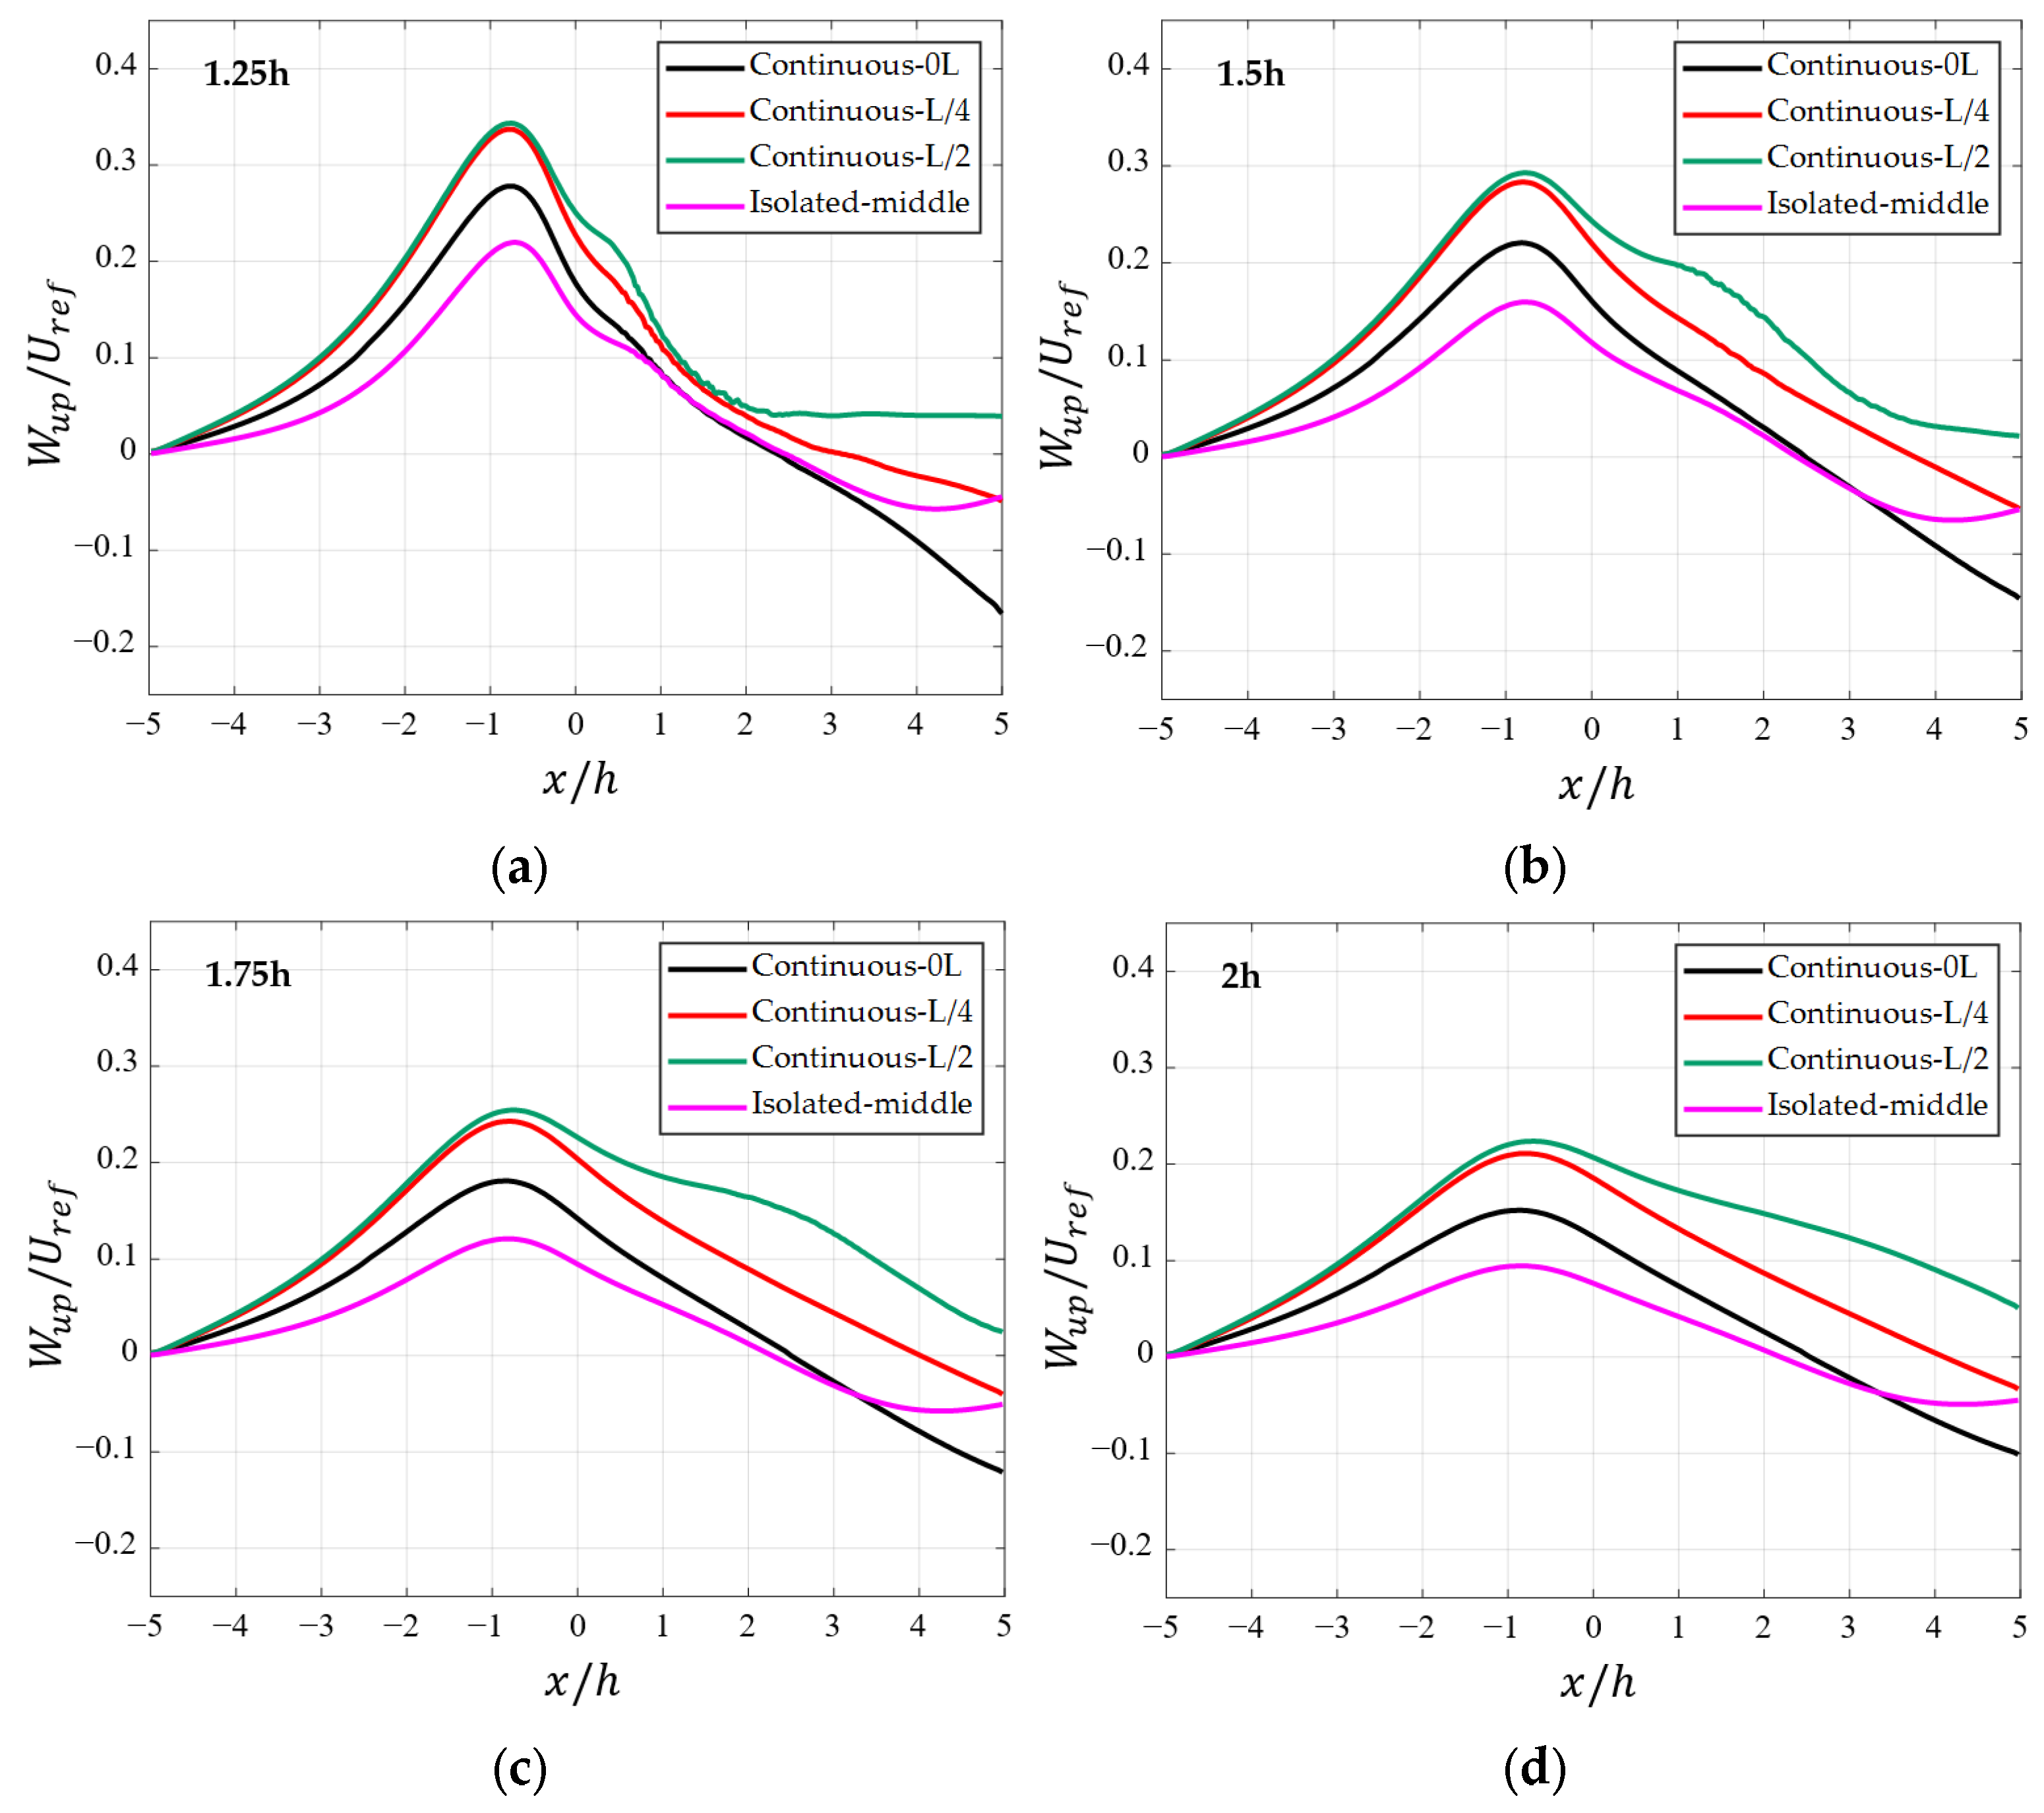
As shown in Figure 10, the intensity of orographic updrafts above the ridge line gradually decreases with increasing altitude across different mountain cross-sections, with maximum values consistently observed above the windward slope. The overall updraft intensity for isolated hills is lower than that for mountain ranges.
Figure 10.
Horizontal distribution curves of vertical wind speed at different heights and sections above ridge height (1h) (). (a) ; (b) ; (c) ; (d) .
For the wind fields at various cross-sections of the continuous ridge, the distribution patterns differ on either side of the peak updraft intensity. On the windward side, excluding regions near the semi-circular edges of the ridge, the intensity distribution curves exhibit high consistency and steeper slopes compared to the leeward side. On the leeward side, as the cross-sectional position approaches the central ridge, the slope of the updraft distribution curve progressively decreases, and the spatial extent of the updrafts expands.
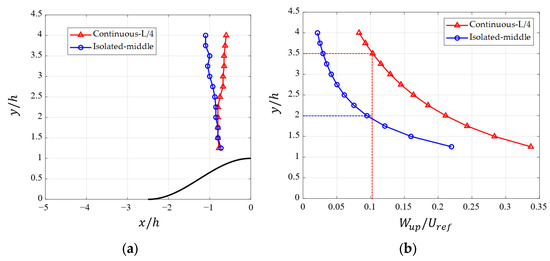
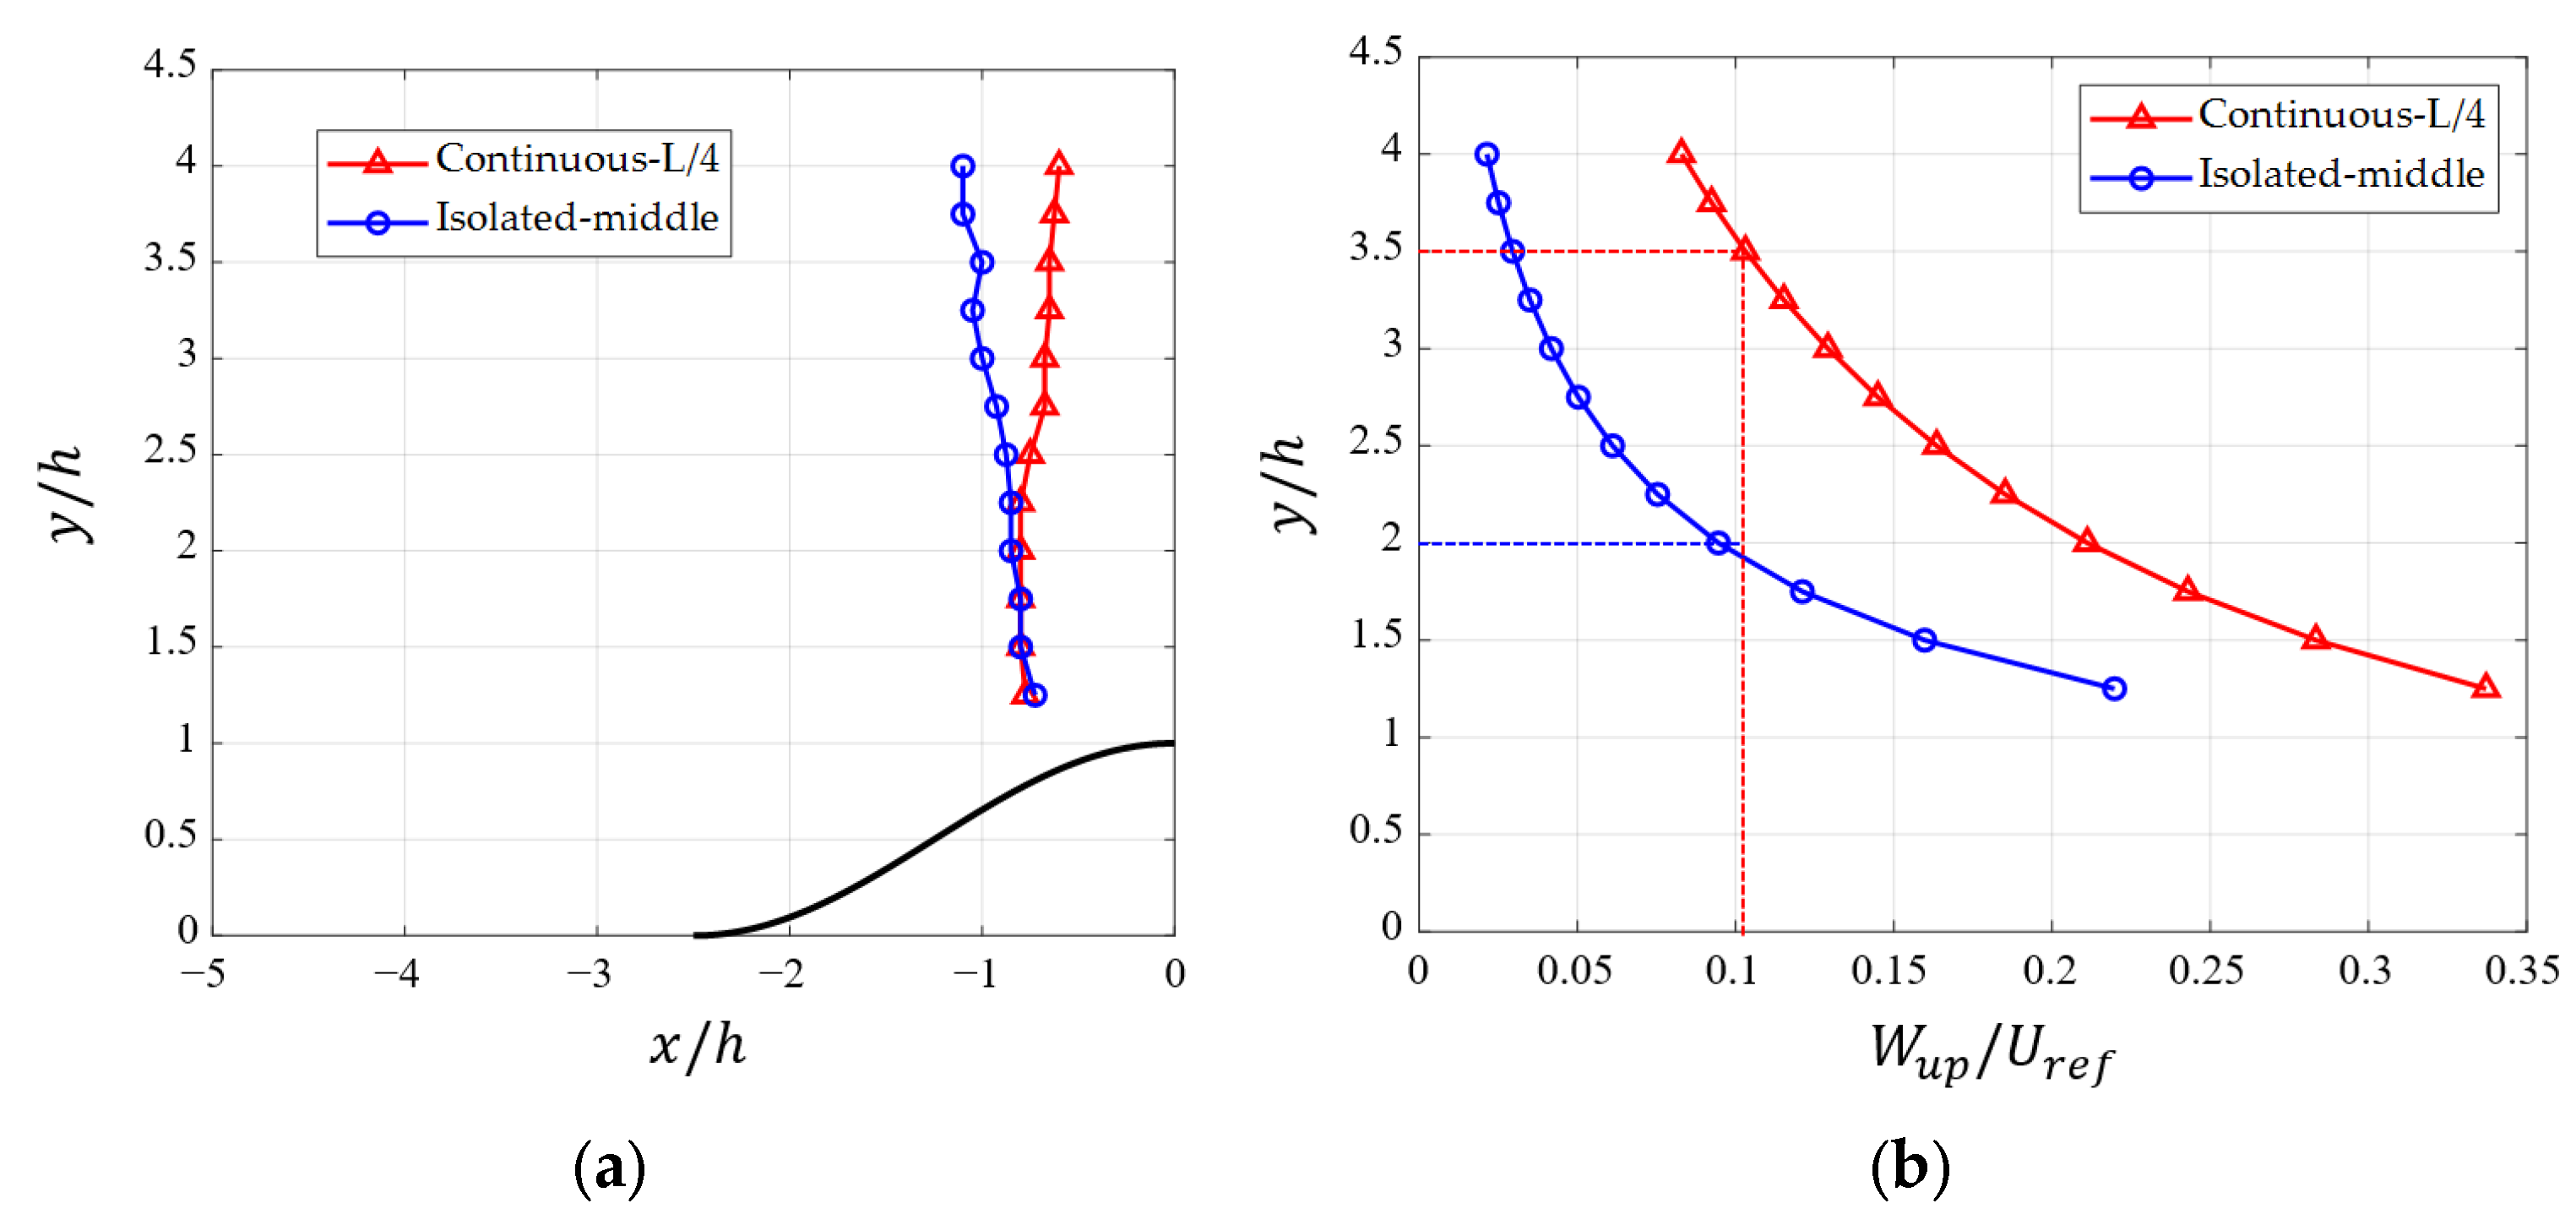
Figure 11 illustrates the variations in the maximum orographic updraft intensity and its horizontal position with altitude above the ridge line for the central axis cross-section of an isolated hill and the cross-section of a continuous range. From Figure 11a, it can be observed that the maximum point of the orographic updraft intensity above the ridge line in both the isolated hill and the continuous range lies above the windward side. Moreover, this maximum point shifts slightly with increasing height. The maximum orographic updraft point on the isolated hill moves in the direction of the incoming flow, while the point for the continuous range shifts in the opposite direction.
Figure 11.
The variations in the maximum orographic updraft intensity and its horizontal position with altitude above the ridge line at the L/4 cross-section of the mountain ridges (). (a) Maximum orographic horizontal position; (b) Maximum orographic updraft intensity.
From Figure 11b, it is evident that as height increases, the maximum intensity of the orographic updraft gradually decreases, and the rate of decay also gradually slows down. Comparing the isolated hill with the continuous range, the orographic updraft intensity above the ridge line of the isolated hill is significantly smaller than that of the continuous range. In the current simulation environment, a region of updraft suitable for unmanned aerial vehicle (UAV) gliding without power exists at a height of 3.5 times the ridge height above the ground for the continuous range, while for the isolated hill, it is only at 2 times the ridge height. In conclusion, compared to the isolated hill, the continuous range provides a greater orographic updraft intensity, higher occurrence heights, and more favorable conditions for UAVs to gain significant gravitational potential energy, thereby extending mission flight distances.
The orographic updraft fields exhibit distinct features above and below the ridge line:
- The orographic updraft fields below the ridge line exhibit greater overall intensity, but regions of maximum updraft strength are confined to the immediate proximity of the terrain surface and restricted to the frontal windward slope. When operating at higher ground clearance margins to ensure collision safety, UAVs cannot access these high-intensity updrafts due to their localized distribution near the terrain.
- Below the ridge line, updrafts demonstrate higher overall intensity but are confined to the immediate vicinity of the terrain surface, primarily distributed along the frontal windward slope. When UAVs operate with elevated ground clearance margins to ensure collision safety, they cannot access these high-intensity updrafts due to their localized nature. In contrast, updrafts above the ridge line exhibit relatively weaker intensities that gradually diminish with altitude. However, they span approximately twice the horizontal coverage area compared to sub-ridge updrafts and remain unobstructed by terrain features, providing UAVs with expanded maneuvering space, enhanced control margin redundancy, and positioning accuracy tolerance. Furthermore, the extended vertical range of supra-ridge updrafts enables altitude gain through gravitational potential energy accumulation, supporting prolonged soaring operations. The updraft intensity produced by a continuous ridge is significantly more robust, ranging from 1.55 to 2.37 times that of an isolated hill at the same altitude.
- For typical small fixed-wing UAVs, the sink rate generally ranges from 0.5 to 1.5 m/s (with gliders exhibiting even lower rates). When the horizontal monsoon speed at the hill height reaches 5–10 m/s, a continuous range still generates an updraft of 0.6–1.4 m/s at an altitude of three times the hill height (derived from the non-dimensionalized numerical simulation results in this study). Consequently, most UAVs can achieve unpowered climb—where the sink rate is less than or equal to the updraft velocity—up to nearly 3h (three times the hill height). During periods of sustained wind, the updraft field at a continuous range is sufficient to support continuous unpowered loitering. In contrast, for isolated hills, UAVs can only maintain unpowered flight within a range of 2h.
4. Orographic Updraft Model
4.1. Orographic Updraft Model of the Isolated Hill
Based on the investigation of horizontal distribution patterns for orographic updrafts over isolated hill terrains in Section 3, it is evident that their horizontal distribution geometry closely resembles that of thermal updrafts, both approximating a circular shape. Therefore, the thermal updraft model proposed by Wharington [23] can be employed to describe the horizontal distribution of orographic updrafts above the ridge line for isolated hills. The model expression is given as:
In the equation; represents the maximum intensity of the orographic updraft; denotes the point of maximum updraft intensity; and indicates the decay rate of the updraft. Unlike thermal updrafts; the intensity of orographic updrafts over isolated hill terrains exhibits significant attenuation with increasing altitude. Thus; practical prediction models may require additional modifications to account for altitude-dependent variations in updraft intensity
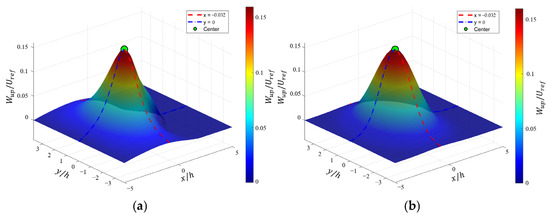
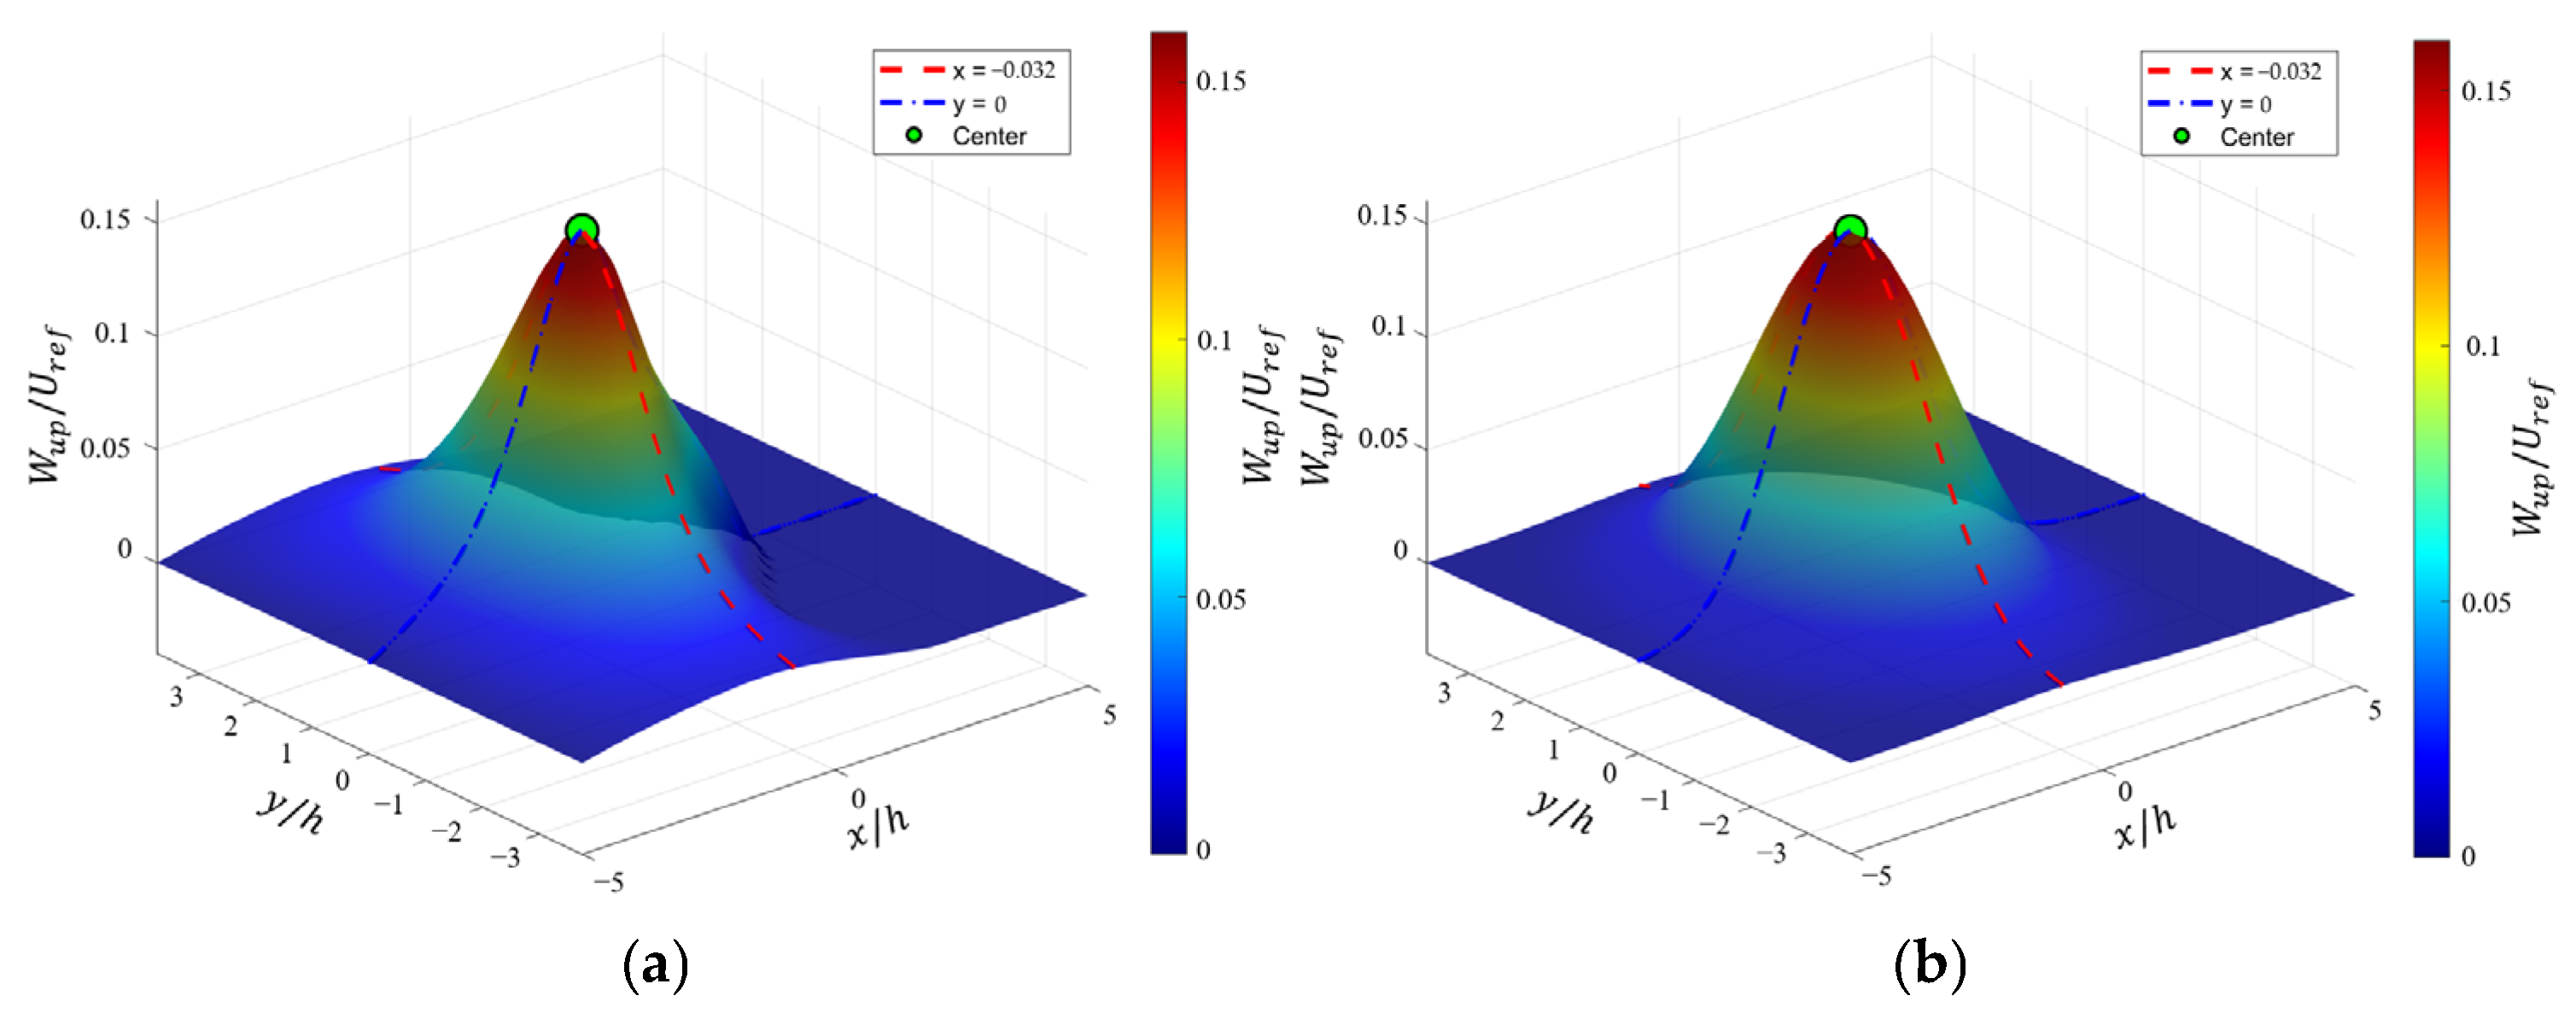
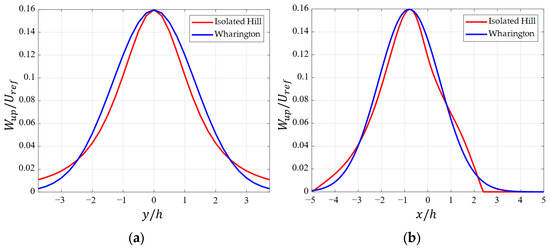
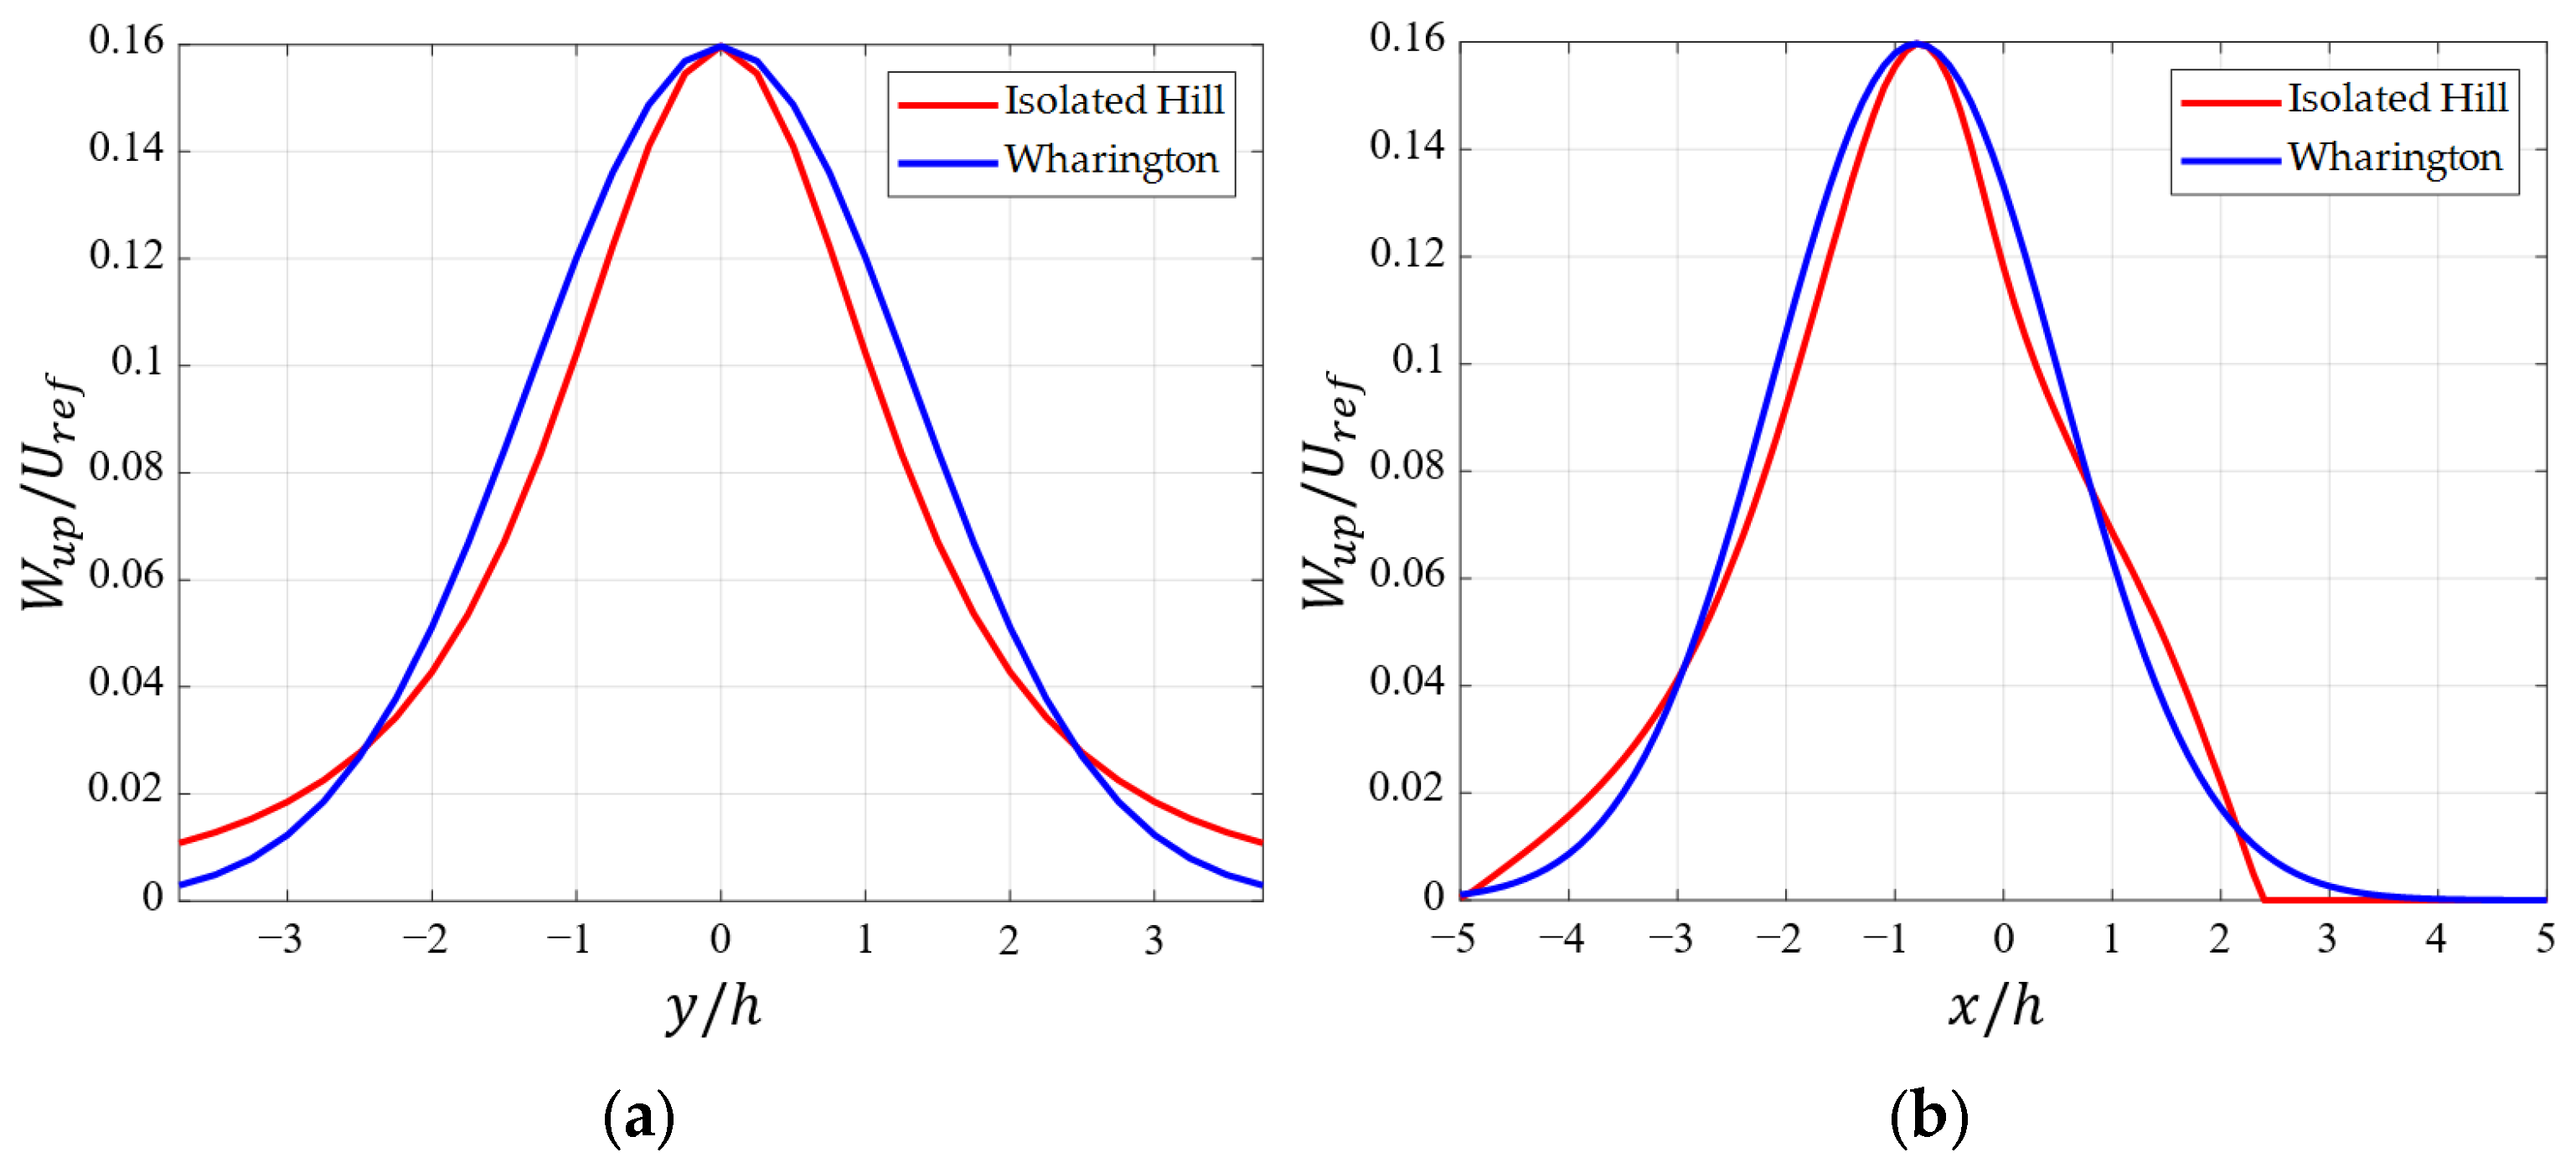
Figure 12 compares the vertical wind speed distribution at 1.5h height over the isolated hill (Section 3.3) with the Wharington thermal updraft model, whose parameters are listed in the Table 2. “Center” in the figure denotes the point of maximum updraft intensity. Consistent with the Wharington model, the downward vertical flow component is neglected in the isolated hill’s updraft representation. This is because UAVs in autonomous soaring primarily focus on upward vertical airflow to maximize endurance. Figure 13 compares the horizontal distributions of both updraft types along lines parallel to the - and -axes passing through the “Center” point (−0.8, 0) (dashed lines in Figure 12). The results show nearly identical distribution characteristics. With appropriate parameters, the decay rates of both updrafts align closely. However, near the terrain surface, the decay rate of the isolated hill’s updraft increases significantly. Notably, thermal updrafts in natural environments rarely exhibit perfectly uniform circular distributions [37]. The Wharington model remains applicable for characterizing orographic updrafts over isolated hills.
Figure 12.
The vertical wind speed distribution at 1.5h height over the isolated hill and the Wharington (), (a) Isolated hill updraft; (b) Wharington thermal updraft model.
Table 2.
Wharington model parameters.
Figure 13.
The horizontal distributions for both updraft types along lines parallel to the x- and y-axes passing through the “Center” point (−0.8, 0) (), (a) ; (b) .
4.2. OUHDM
To provide a comprehensive predictive model for autonomous UAV soaring that accurately characterizes the horizontal distribution features of orographic updrafts over mountain ridges, this study proposes a novel orographic updraft model. The model explicitly describes the horizontal distribution patterns of updrafts along mountain ridges, focusing on three critical parameters: the horizontal position of maximum updraft intensity, the spatial decay characteristics of the updraft field, and the altitude-dependent attenuation rate. These metrics, validated in prior autonomous flight strategies for thermal updraft exploitation, directly guide UAV path planning and energy optimization. The proposed model is formulated as:
In the equation, represents the variation curve of the maximum orographic updraft intensity with altitude , describes the distance from a given point within the updraft field to the location of maximum intensity as a function of altitude, and quantifies the spatial extent of the updraft region where the intensity exceeds of the maximum value, which can also be interpreted as the altitude-dependent decay rate of the updraft. These functions collectively characterize the three-dimensional distribution and attenuation dynamics of orographic updrafts, enabling precise prediction of updraft intensity gradients and spatial coverage for UAV navigation in mountainous terrains.
Given that the windward slope length of mountain ranges is typically much greater than the short-term flight distance of UAVs, and the curvature of the windward slope varies gradually, the windward slope can be approximated as a straight line within a localized region. As demonstrated by the orographic updraft distribution characteristics in Section 3, the wind field profiles across the central segments of the continuous ridge exhibit consistent distribution patterns, excluding regions near the lateral edges of the windward slope. Based on these assumptions, the distance from a point within the orographic updraft field to the location of maximum intensity at a given altitude is expressed as:
The positional function defining the central axis (i.e., the location of maximum orographic updraft intensity) is formulated as:
Therefore, the expression for the orographic updraft model within a localized horizontal altitude range at a given height can be formulated as:
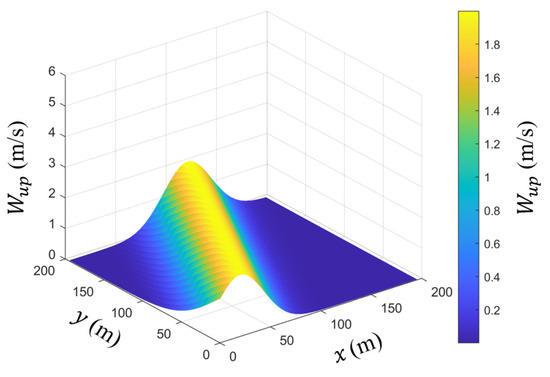
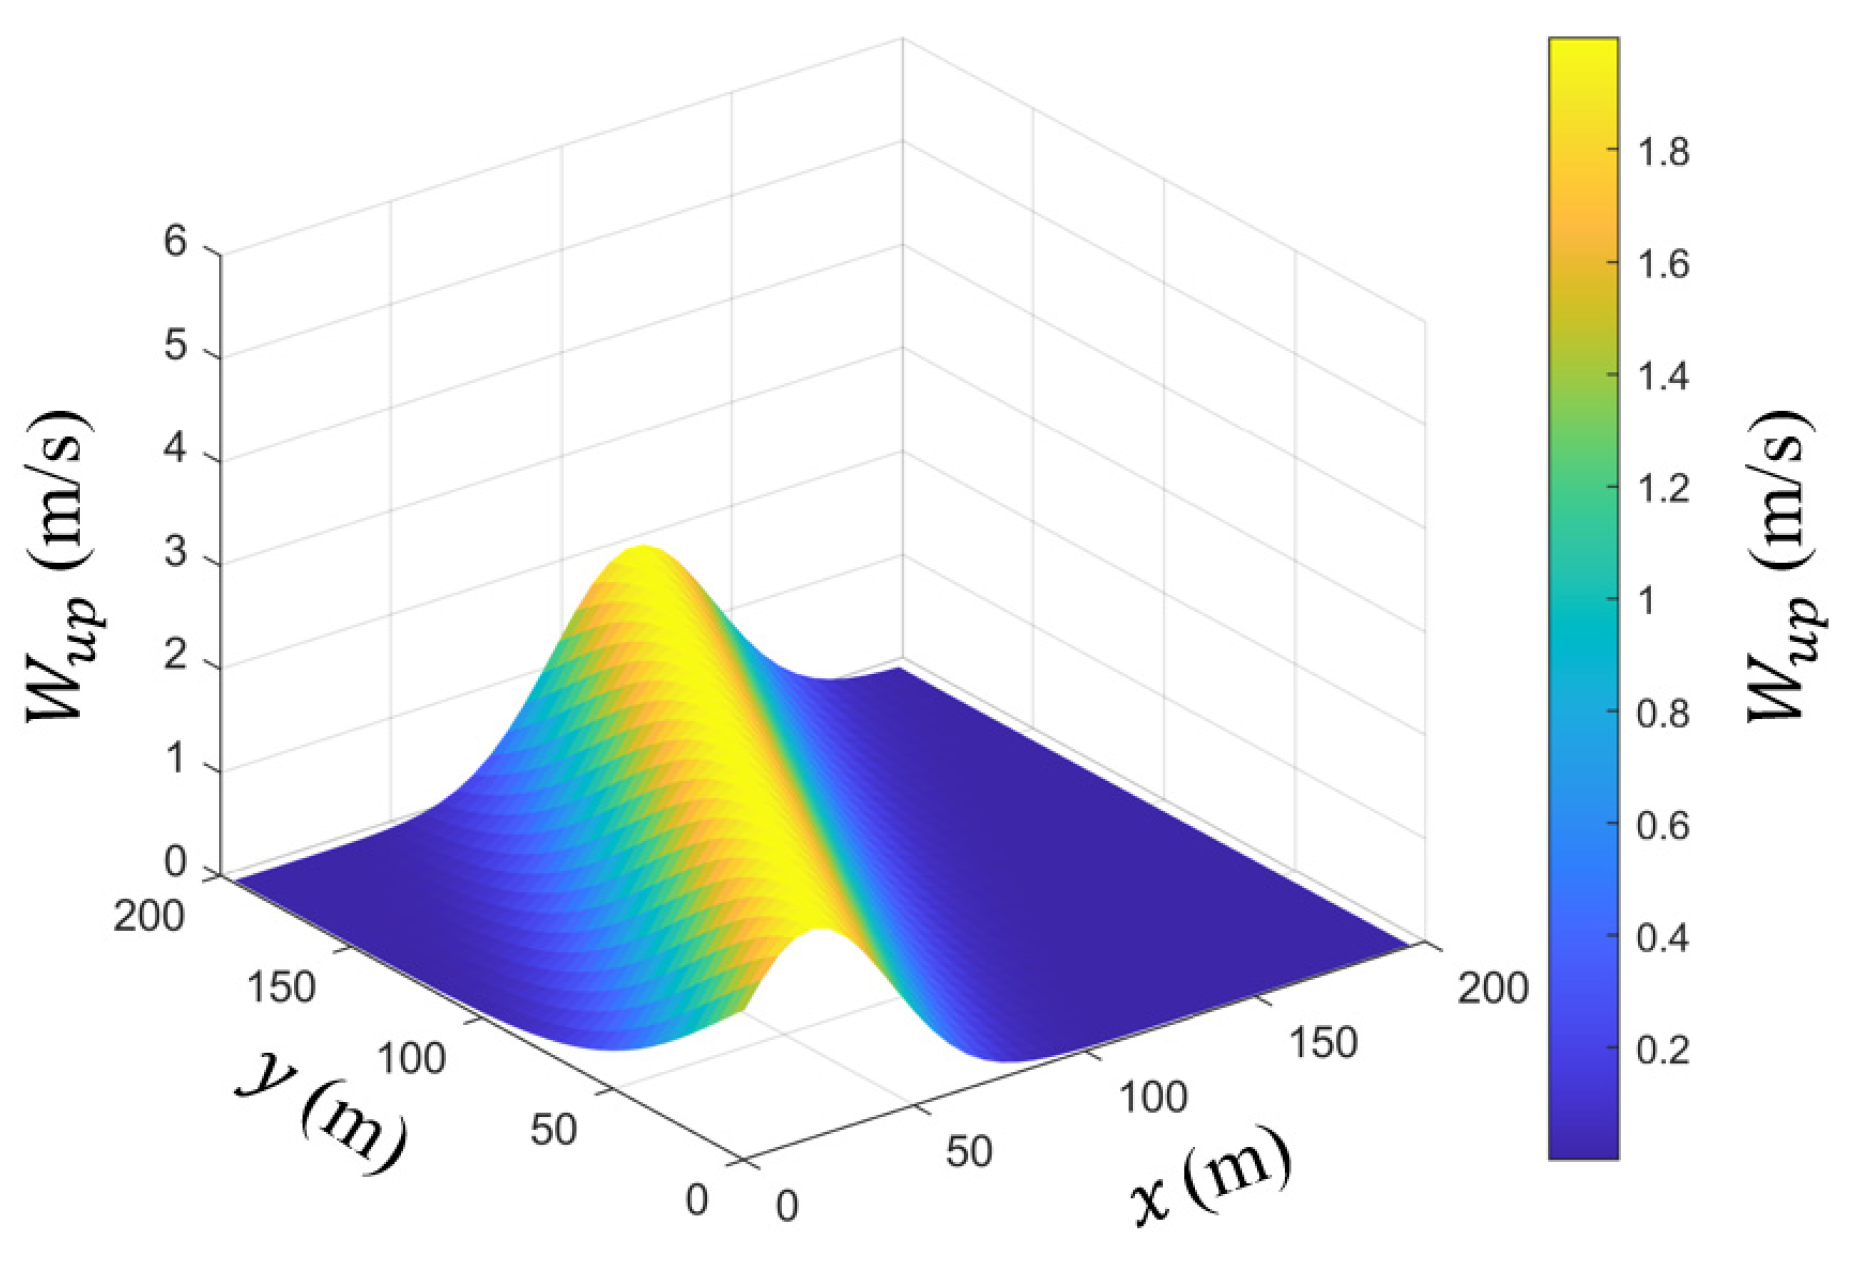
When , , and the central axis function defining the location of maximum orographic updraft intensity is , the simulated updraft intensity distribution at this altitude is illustrated in Figure 14. The results align with the updraft distribution patterns observed in Figure 9 for mountain ridges, validating the consistency and accuracy of the proposed model in capturing orographic updraft. The model primarily characterizes the features of updrafts in the central section of continuous range, though it does not account for the airflow distribution at the range boundaries. However, since the ridges that generate orographic updrafts typically extend for several kilometers, this model is capable of covering the vast majority of the relevant area.
Figure 14.
Strength Distribution of OUHDM.
For mountain ridges, Langelaan proposed an orographic updraft distribution model based on the idealized assumption of an infinitely long semi-cylindrical mountain ridge [25]. Derived from potential flow theory, the vertical velocity component of orographic updrafts over the semi-cylindrical ridge can be expressed as:
In the equation, represents the freestream horizontal wind velocity at infinity, assigned the reference value ; denotes the radius of the idealized semi-infinite semi-cylindrical ridge, set to 40 mm to align with the height of the cosine-shaped terrain profile used in numerical simulations; defines the distance from a point on the windward slope to the center of the semi-cylindrical ridge; and represents the angle between the line connecting that point to the ridge center and the horizontal plane of the incoming flow direction. This formulation, derived from potential flow theory, assumes an infinitely extended ridge geometry and a smooth cosine-type terrain profile to ensure consistency with simulated flow patterns, providing an analytical foundation for characterizing orographic updraft behavior under idealized conditions.
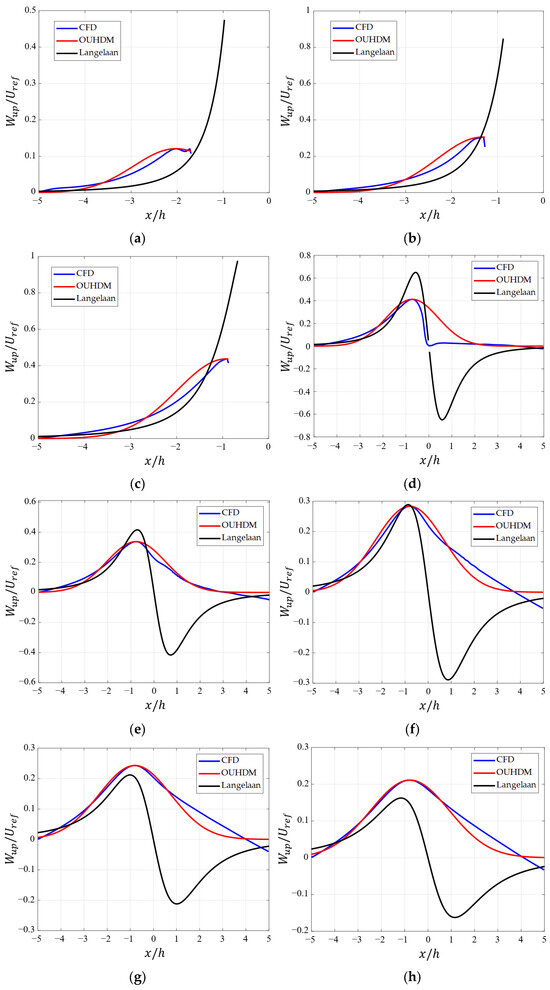
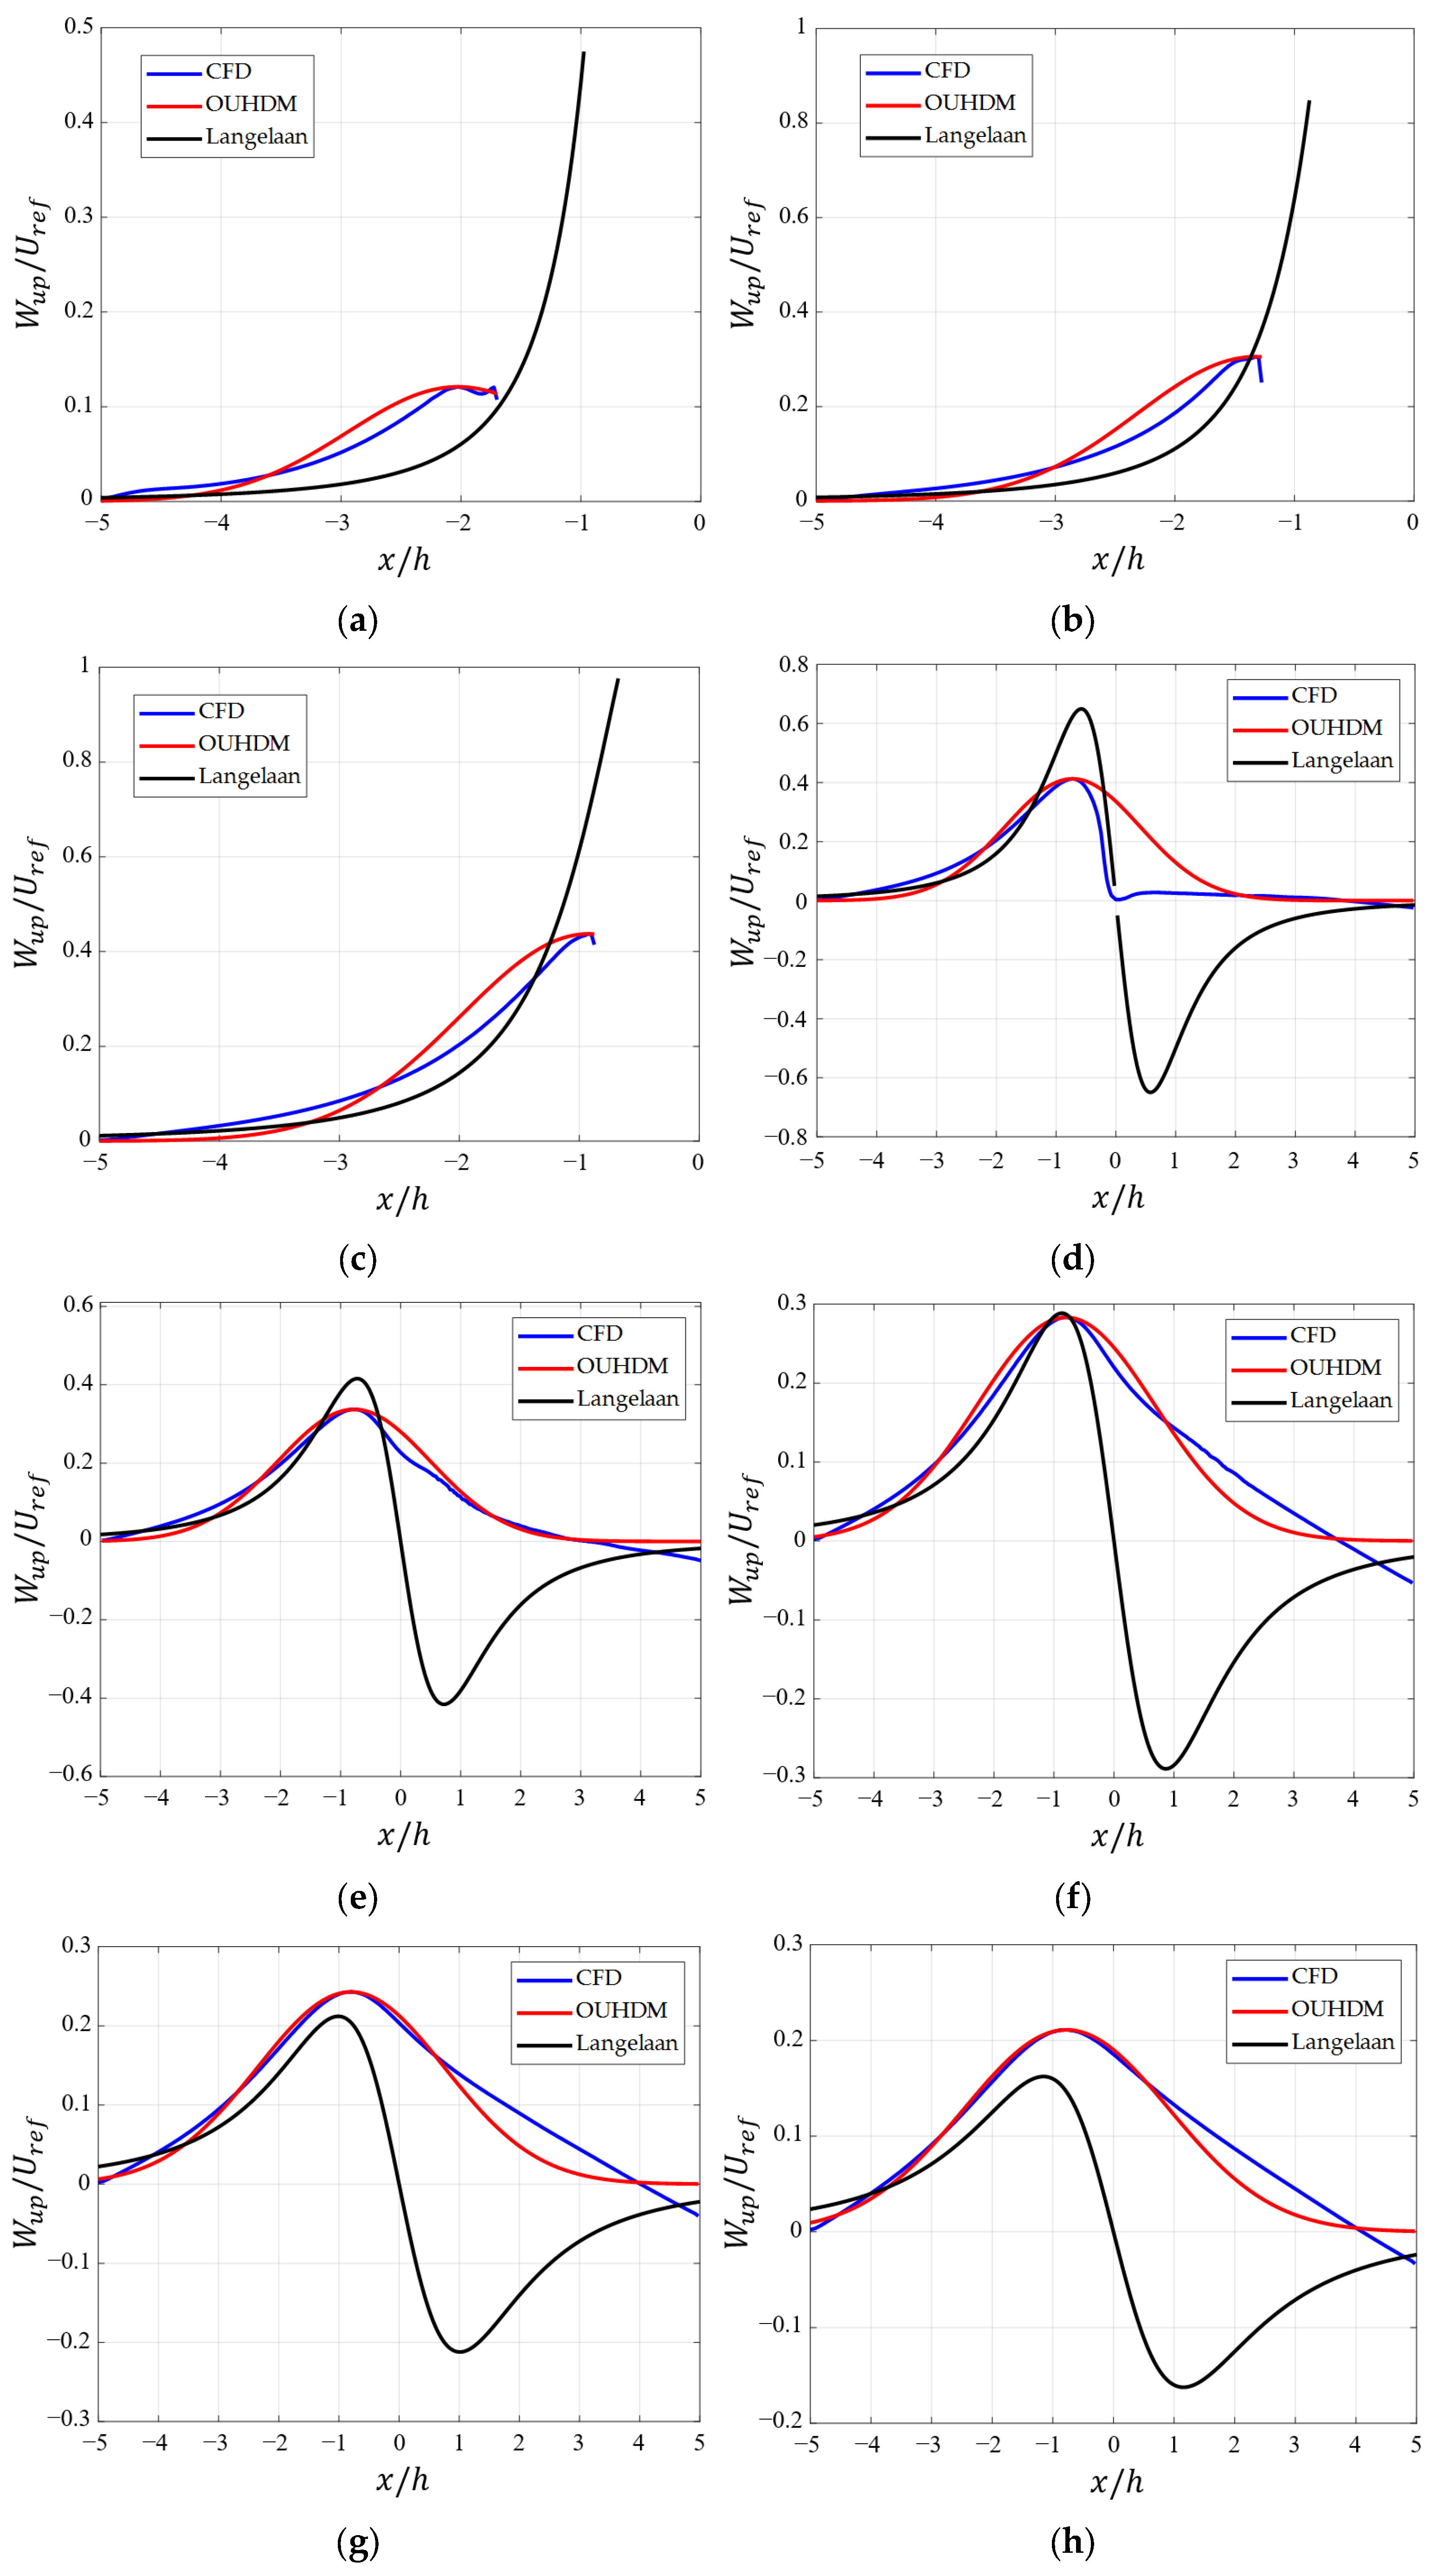
As shown in Figure 15, the horizontal wind field distribution at the cross-section (one-quarter of the ridge length) of the continuous range is compared with Langelaan’s wind field model. Langelaan’s model, based on the semi-cylindrical ridge assumption, assumes a terrain height equivalent to its horizontal footprint. While this model approximates the sub-ridge wind field distribution patterns below the ridge line, discrepancies emerge between its predicted updraft coverage and the actual cosine-shaped ridge wind field. Nevertheless, the model broadly captures the trend of increasing updraft intensity closer to the terrain surface. Above the ridge line, Langelaan’s model aligns well with the updraft distribution patterns over the windward slope. However, it predicts an abrupt transition to negative vertical velocities immediately beyond the ridge vertex, implying no updrafts exist over the leeward slope—a result inconsistent with CFD simulations, which demonstrate residual updrafts in this region due to flow separation and turbulence effects.
Figure 15.
The horizontal distribution of OUHDM, CFD and Langelaan’s model at different heights (h = 40 mm). (a) ; (b) ; (c) ; (d) ; (e) ; (f) ; (g) ; (h) .
It is noteworthy that in the region above the ridgeline, the OUHDM underestimates the rate of decay in updraft intensity; specifically, deviations between the model and CFD results begin to emerge when the intensity drops to approximately half of its maximum value. However, this discrepancy has a minimal impact on the UAV’s perceived wind field, as the aircraft is typically expected to operate within regions of higher updraft intensity to maximize its climb rate.
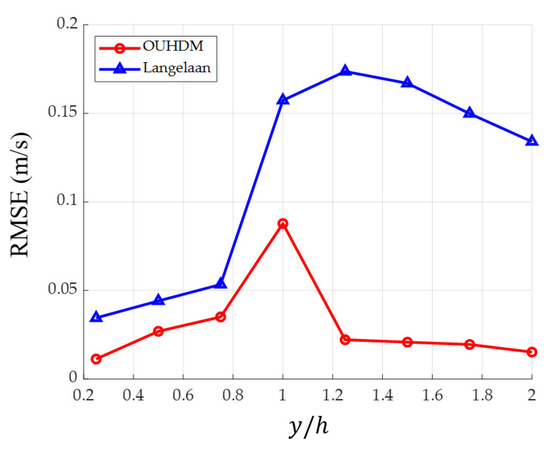
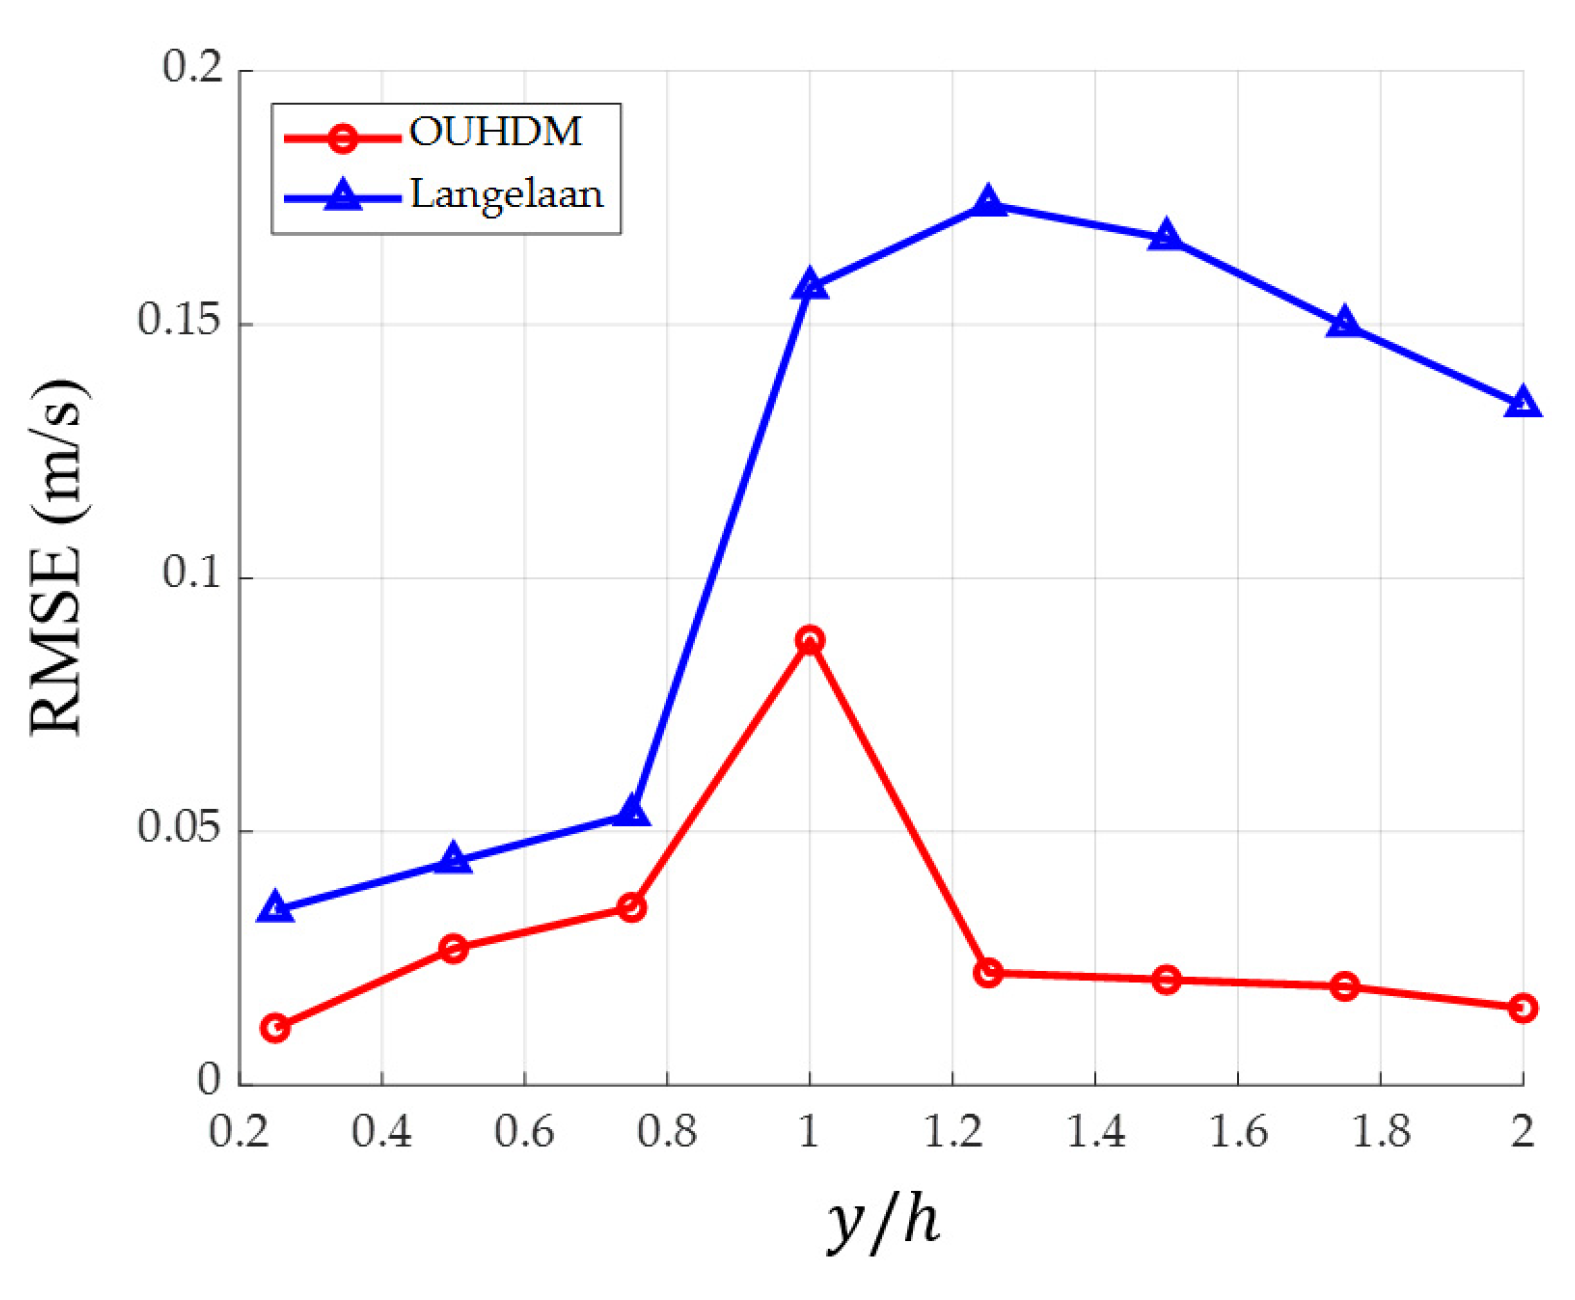
Figure 16 compares the Root Mean Square Errors (RMSE) of the two models against the CFD calculation results at different altitudes. The proposed model in this study achieves a lower RMSE across all altitudes compared to the Langelaan model, particularly in the regions above the hill height. The maximum RMSE of the proposed model is 0.088 m/s, occurring at the plane of the hill height h; this is attributed to the ridge wind shear that typically occurs on the leeward side of the ridgeline. In all other altitude ranges, the RMSE remains below 0.05 m/s.
Figure 16.
Comparison of Root Mean Square Error (RMSE) between OUHDM, Langelaan model, and CFD results at different altitudes.
5. Conclusions
In this study, CFD simulations were employed to investigate the distribution characteristics of orographic updrafts wind fields over two representative three-dimensional mountain types—isolated and continuous mountains. Based on an analysis of the updraft distributions at different heights, a two-dimensional horizontal distribution model for orographic updrafts is proposed. The main contributions of this research are summarized as follows:
- The horizontal distribution of updrafts over isolated hills is analogous to that of thermal updrafts, allowing the direct application of existing thermal updraft models.
- Compared with existing orographic updraft models for continuous ridges, the OUHDM proposed in this study demonstrates a significant improvement in describing the consistency of horizontal distribution patterns, while providing a more reasonable characterization of the updraft distribution in regions above the ridgeline. When compared to numerical simulation results, the maximum RMSE across different altitudes is only 0.088 m/s, making it highly suitable for the real-time and efficient prediction of terrain-induced updrafts for UAVs.
- For typical small fixed-wing UAVs with sink rates of 0.5–1.5 m/s (gliders exhibit lower values), mountain ranges generate updrafts of 0.6–1.4 m/s at elevations up to three times the mountain height under horizontal monsoon winds of 5–10 m/s. This enables most UAVs to achieve powerless climbs (where sink rate ≤ updraft intensity) approaching triple the mountain height. During sustained wind conditions, orographic updrafts over continuous ridges provide sufficient lift for powerless sustained flight. In contrast, UAVs can only maintain powerless flight within twice the height of isolated hills.
6. Future Work
Deeper investigation into whether OUHDM applies to orographic updrafts in complex terrains presents an urgent challenge. Future work will involve deploying UAVs equipped with ultrasonic anemometers to measure actual updraft distributions in mountainous terrain and collect real wind field data. During flights, OUHDM will be employed for wind field prediction. Actual data will then be compared against predictions to validate and optimize the model for autonomous UAV wind field forecasting.
Another planned research topic focuses on UAV flight under the combined influence of thermal and dynamic updrafts. Considering the complexity of natural wind fields, this work will examine whether UAVs can effectively identify hybrid updrafts when thermal and dynamic updrafts coexist, and how flight strategies should be adapted to accommodate such hybrid wind environments.
Author Contributions
Conceptualization, Y.F. and W.A.; methodology, Y.F.; software, Y.F.; validation, Y.F.; investigation, W.A. and X.S.; resources, W.A., X.S. and B.S.; data curation, Y.F.; writing—original draft preparation, Y.F. and W.A.; writing—review and editing, Y.F., W.A., X.S. and B.S.; visualization, W.A.; supervision, W.A. and B.S.; project administration, W.A. and X.S.; funding acquisition, W.A. All authors have read and agreed to the published version of the manuscript.
Funding
This research received no external funding.
Institutional Review Board Statement
Not applicable.
Informed Consent Statement
Not applicable.
Data Availability Statement
The original contributions presented in this study are included in the article. Further inquiries can be directed to the corresponding author.
Conflicts of Interest
The authors declare no conflicts of interest.
References
- Khosravifard, S.; Venus, V.; Skidmore, A.K.; Bouten, W.; Muñoz, A.R.; Toxopeus, A.G. Identification of Griffon vulture’s flight types using high-resolution tracking data. Int. J. Environ. Res. 2018, 12, 313–325. [Google Scholar] [CrossRef] [Scilit] [PubMed]
- Pennycuick, C.J. Field observations of thermals and thermal streets, and the theory of cross-country soaring flight. J. Avian Biol. 1998, 29, 33–43. [Google Scholar] [CrossRef] [Scilit]
- Liechti, F.; Witvliet, W.; Weber, R.; Bächler, E. First evidence of a 200-day non-stop flight in a bird. Nat. Commun. 2013, 4, 2554. [Google Scholar] [CrossRef] [Scilit] [PubMed]
- Bohrer, G.; Brandes, D.; Mandel, J.T.; Bildstein, K.L.; Miller, T.A.; Lanzone, M.; Katzner, T.; Maisonneuve, C.; Tremblay, J.A. Estimating updraft velocity components over large spatial scales: Contrasting migration strategies of golden eagles and turkey vultures. Ecol. Lett. 2012, 15, 96–103. [Google Scholar] [CrossRef] [Scilit]
- Sapir, N.; Wikelski, M.; McCue, M.D.; Pinshow, B.; Nathan, R. Flight modes in migrating European bee-eaters: Heart rate may indicate low metabolic rate during soaring and gliding. PLoS ONE 2010, 5, e13956. [Google Scholar] [CrossRef] [Scilit]
- Allen, M.J. Guidance and Control for an Autonomous Soaring UAV. U.S. Patent 7,431,243, 7 October 2008. [Google Scholar]
- Reddy, G.; Wong-Ng, J.; Celani, A.; Sejnowski, T.J.; Vergassola, M. Glider soaring via reinforcement learning in the field. Nature 2018, 562, 236–239. [Google Scholar] [CrossRef] [Scilit]
- Wagner, J.S.; Gohm, A.; Rotach, M.W. The impact of horizontal model grid resolution on the boundary layer structure over an idealized valley. Mon. Weather Rev. 2014, 142, 3446–3465. [Google Scholar] [CrossRef] [Scilit]
- Kirshbaum, D.J.; Wang, C.C. Boundary layer updrafts driven by airflow over heated terrain. J. Atmos. Sci. 2014, 71, 1425–1442. [Google Scholar] [CrossRef] [Scilit]
- Mohamed, A.; Taylor, G.K.; Watkins, S.; Windsor, S.P. Opportunistic soaring by birds suggests new opportunities for atmospheric energy harvesting by flying robots. J. R. Soc. Interface 2022, 19, 20220671. [Google Scholar] [CrossRef] [Scilit]
- Carrard, T.; Nourani, E.; Jansing, L.; Zimmermann, T.; Sumasgutner, P.; Tschumi, M.; Jenny, D.; Wikelski, M.; Safi, K.; Sprenger, M.; et al. Golden eagles regularly use gravity waves to soar: New insights from high-resolution weather data. J. R. Soc. Interface 2025, 22, 20240891. [Google Scholar] [CrossRef] [Scilit]
- Allen, M. Autonomous soaring for improved endurance of a small uninhabitated air vehicle. In Proceedings of the 43rd AIAA Aerospace Sciences Meeting and Exhibit, Reno, NV, USA, 10–13 January 2005; p. 1025. [Google Scholar]
- Santos, C.D.; Hanssen, F.; Muñoz, A.-R.; Onrubia, A.; Wikelski, M.; May, R.; Silva, J.P. Match between soaring modes of black kites and the fine-scale distribution of updrafts. Sci. Rep. 2017, 7, 6421. [Google Scholar] [CrossRef] [Scilit] [PubMed]
- Katzner, T.E.; Turk, P.J.; Duerr, A.E.; Miller, T.A.; Lanzone, M.J.; Cooper, J.L.; Brandes, D.; Tremblay, J.A.; Lemaître, J. Use of multiple modes of flight subsidy by a soaring terrestrial bird, the golden eagle Aquila chrysaetos, when on migration. J. R. Soc. Interface 2015, 12, 20150530. [Google Scholar] [CrossRef] [Scilit] [PubMed]
- Duerr, A.E.; Miller, T.A.; Lanzone, M.; Brandes, D.; Cooper, J.; O’Malley, K.; Maisonneuve, C.; Tremblay, J.; Katzner, T. Testing an emerging paradigm in migration ecology shows surprising differences in efficiency between flight modes. PLoS ONE 2012, 7, e35548. [Google Scholar] [CrossRef] [Scilit] [PubMed]
- Kerlinger, P. Flight Strategies of Migrating Hawks; University of Chicago Press: Chicago, IL, USA, 1989. [Google Scholar]
- Mandel, J.T.; Bohrer, G.; Winkler, D.W.; Barber, D.R.; Houston, C.S.; Bildstein, K.L. Migration path annotation: Cross-continental study of migration-flight response to environmental conditions. Ecol. Appl. 2011, 21, 2258–2268. [Google Scholar] [CrossRef] [Scilit]
- Shen, G.; Yao, J.; Lou, W.; Chen, Y.; Guo, Y.; Xing, Y. An experimental investigation of streamwise and vertical wind fields on a typical three-dimensional hill. Appl. Sci. 2020, 10, 1463. [Google Scholar] [CrossRef] [Scilit]
- Jackson, P.S.; Hunt, J.C.R. Turbulent wind flow over a low hill. Q. J. R. Meteorol. Soc. 1975, 101, 929–955. [Google Scholar] [CrossRef]
- Ishihara, T.; Hibi, K.; Oikawa, S. A wind tunnel study of turbulent flow over a three-dimensional steep hill. J. Wind Eng. Ind. Aerodyn. 1999, 83, 95–107. [Google Scholar] [CrossRef] [Scilit]
- Yan, B.W.; Li, Q.S.; He, Y.C.; Chan, P.W. RANS simulation of neutral atmospheric boundary layer flows over complex terrain by proper imposition of boundary conditions and modification on the k-ε model. Environ. Fluid Mech. 2016, 16, 1–23. [Google Scholar] [CrossRef] [Scilit]
- Mohamed, A.; Carrese, R.; Fletcher, D.F.; Watkins, S. Scale-resolving simulation to predict the updraught regions over buildings for MAV orographic lift soaring. J. Wind Eng. Ind. Aerodyn. 2015, 140, 34–48. [Google Scholar] [CrossRef] [Scilit]
- Guerra-Langan, A.; Araujo-Estrada, S.; Windsor, S. Unmanned aerial vehicle control costs mirror bird behaviour when soaring close to buildings. Int. J. Micro Air Veh. 2020, 12, 1756829320941005. [Google Scholar] [CrossRef] [Scilit]
- Bencatel, R.; de Sousa, J.T.; Girard, A. Atmospheric flow field models applicable for aircraft endurance extension. Prog. Aerosp. Sci. 2013, 61, 1–25. [Google Scholar] [CrossRef] [Scilit]
- Langelaan, J. Long distance/duration trajectory optimization for small UAVs. In Proceedings of the AIAA Guidance, Navigation and Control Conference and Exhibit, Hilton Head, SC, USA, 20–23 August 2007; p. 6737. [Google Scholar]
- Cutler, M.; McLain, T.; Beard, R.; Capozzi, B. Energy harvesting and mission effectiveness for small unmanned aircraft. In Proceedings of the AIAA Guidance, Navigation, and Control Conference, Toronto, ON, Canada, 2–5 August 2010; p. 8037. [Google Scholar]
- Allen, M. Updraft model for development of autonomous soaring uninhabited air vehicles. In Proceedings of the 44th AIAA Aerospace Sciences Meeting and Exhibit, Reno, NV, USA, 9–12 January 2006; p. 1510. [Google Scholar]
- Lawrance, N.; Sukkarieh, S. Wind energy based path planning for a small gliding unmanned aerial vehicle. In Proceedings of the AIAA Guidance, Navigation, and Control Conference, Chicago, IL, USA, 10–13 August 2009; p. 6112. [Google Scholar]
- Gedeon, J. Dynamic analysis of dolphin-style thermal cross-country flight: Part ii. Tech. Soar. 1973, 3, 17–34. [Google Scholar]
- Wharington, J. Autonomous Control of Soaring Aircraft by Reinforcement Learning; Royal Melbourne Institute of Technology: Melbourne, Australia, 1998. [Google Scholar]
- Hazard, M. Unscented kalman filter for thermal parameter identification. In Proceedings of the 48th AIAA Aerospace Sciences Meeting Including the New Horizons Forum and Aerospace Exposition, Orlando, FL, USA, 4–7 January 2010; p. 179. [Google Scholar]
- Edwards, D. Implementation details and flight test results of an autonomous soaring controller. In Proceedings of the AIAA Guidance, Navigation and Control Conference and Exhibit, Honolulu, HI, USA, 18–21 August 2008; p. 7244. [Google Scholar]
- Oettershagen, P.; Stastny, T.; Hinzmann, T.; Rudin, K.; Mantel, T.; Melzer, A.; Wawrzacz, B.; Hitz, G.; Siegwart, R. Robotic technologies for solar-powered UAVs: Fully autonomous updraft-aware aerial sensing for multiday search-and-rescue missions. J. Field Robot. 2018, 35, 612–640. [Google Scholar] [CrossRef] [Scilit]
- Richards, P.J.; Hoxey, R.P. Appropriate boundary conditions for computational wind engineering models using the k-ϵ turbulence model. J. Wind Eng. Ind. Aerodyn. 1993, 46, 145–153. [Google Scholar] [CrossRef]
- Tominaga, Y.; Mochida, A.; Yoshie, R.; Kataoka, H.; Nozu, T.; Yoshikawa, M.; Shirasawa, T. AIJ guidelines for practical applications of CFD to pedestrian wind environment around buildings. J. Wind Eng. Ind. Aerodyn. 2008, 96, 1749–1761. [Google Scholar] [CrossRef] [Scilit]
- Gryning, S.-E.; Batchvarova, E.; Brümmer, B.; Jørgensen, H.; Larsen, S. On the extension of the wind profile over homogeneous terrain beyond the surface boundary layer. Bound.-Layer Meteorol. 2007, 124, 251–268. [Google Scholar] [CrossRef] [Scilit]
- Federal Aviation Administration. Glider Flying Handbook; Skyhorse Publishing Inc.: New York, NY, USA, 2007. [Google Scholar]

Disclaimer/Publisher’s Note: The statements, opinions and data contained in all publications are solely those of the individual author(s) and contributor(s) and not of MDPI and/or the editor(s). MDPI and/or the editor(s) disclaim responsibility for any injury to people or property resulting from any ideas, methods, instructions or products referred to in the content. |
© 2026 by the authors. Licensee MDPI, Basel, Switzerland. This article is an open access article distributed under the terms and conditions of the Creative Commons Attribution (CC BY) license.