


Abstract
Underground mining environments pose significant challenges for automated hazard detection due to low illumination, restricted visibility, and the absence of Global Navigation Satellite System (GNSS) coverage. These factors limit situational awareness and delay inspection efforts, particularly after disruptive events when rapid assessment is essential for safety. This study addresses this problem by developing a dual-pipeline framework for 2D–3D detection that uses 360° imaging and LiDAR-based machine learning to identify people, vehicles, and positional changes in underground settings without requiring personnel to re-enter hazardous areas. The objective was to create a system capable of recognizing objects and monitoring spatial changes under real underground mine conditions. The 2D component used a Ricoh Theta Z1 camera to collect panoramic images, and a YOLO (You Only Look Once) v8n model was fine-tuned using datasets representing low light, shadowed underground scenes. The 3D component employed an Ouster OS1-070-64 LiDAR sensor, and point clouds were processed through denoising, ICP alignment, surface reconstruction, manual annotation, and 2D projection. A YOLO-based model was then trained to detect objects and measure displacement between LiDAR scans. Results demonstrated strong performance for both components. The fine-tuned YOLOv8n model reliably detected personnel and vehicles despite challenging lighting and visual clutter, while the 3D pipeline localized objects in the registered LiDAR frame and quantified vehicle displacement between consecutive scans by comparing 3D bounding-box centroids after ICP alignment (displacement vector and magnitude). These findings indicate that the combined 2D–3D system can effectively support automated hazard recognition and environmental monitoring in GNSS-denied underground spaces.
1. Introduction
Underground mining environments present hazardous conditions that pose significant challenges to both operational efficiency and worker safety. These confined and complex spaces are characterized by limited visibility, poor illumination, dust, and blind zones, which collectively hinder navigation and situational awareness [1,2,3,4]. Mining operations are recognized as high-risk settings where accidents may occur due to unstable ground conditions, equipment interactions, or inadequate ventilation [5,6,7]. Furthermore, the absence of Global Navigation Satellite System (GNSS) coverage in underground settings complicates tracking and monitoring processes [8,9,10,11], increasing the likelihood of human–machine and machine–machine interactions that can result in accidents or fatalities. As the industry increasingly adopts automation and digital technologies, there is a growing focus on developing systems capable of perceiving, interpreting, and responding to underground conditions in real time to create safer and more efficient work environments [12,13,14]. Conventional monitoring and inspection methods often necessitate direct worker exposure to hazardous conditions, elevating safety risks. To address these limitations, recent studies emphasize the integration of remote sensing and computer-vision-based systems, including cameras and LiDAR technologies, as essential tools for improving detection, perception, and overall safety in underground mining operations [15,16,17].
Recent advances in sensing and imaging technologies offer promising alternatives. LiDAR provides accurate 3D spatial mapping in GNSS-denied environments [18,19,20], while 360° panoramic imaging enables rapid and comprehensive documentation of underground environments, allowing full-scene data capture suitable for photogrammetric reconstruction and analysis of confined tunnel spaces [21]. Although individual sensing technologies face limitations, research increasingly demonstrates that their integration through multimodal fusion and machine learning enables more reliable hazard detection, supports prediction and localization, and improves situational awareness for safer, data-driven decision-making [22,23,24]. The success of these systems depends not only on their technical capabilities, but also on the effectiveness of human–robot interaction in high-risk, time-sensitive environments [25]. As a result, command centers must make critical decisions based on intermittent verbal reports, partial maps, and limited environmental data, which makes it difficult to maintain situational awareness beyond the team’s immediate surroundings and to project how conditions may evolve over time. Robotic systems could collect more data by extending sensing and communication deeper into the mine, scouting inaccessible or high-risk areas prior to human entry, and providing safer channels for video, mapping, and gas data transmission [26]. Such integration allows rapid post-event assessment, identification of obstructions, evaluation of structural conditions, and determination of accessible pathways. Additionally, this information supports predictive maintenance and operational optimization, improving both safety and efficiency in underground mines [17,23,27,28].
Beyond static mapping, multi-epoch LiDAR point clouds enable object localization and change quantification by registering successive scans into a common coordinate frame. In GNSS-denied underground mines, this supports post-event assessment by allowing operators to quantify whether critical assets (vehicles) have moved and how the scene configuration has changed without requiring personnel re-entry into hazardous areas.
Machine learning (ML) continues to advance safety management in underground mining contexts. By analyzing sensor and image data, ML algorithms can detect hazardous situations, identify unsafe behaviors, and predict potential incidents before they occur. Deep-learning models have been applied to detect equipment malfunction, monitor air-quality parameters, and assess structural stability, enabling timely interventions that reduce accidents [29,30,31,32,33]. These intelligent systems strengthen situational awareness, reduce reliance on manual inspections, and support the transition toward safer, more autonomous mine operations [34,35,36,37]. In this context, applying image-processing and machine-learning techniques to LiDAR and 360° camera data can significantly improve underground environmental understanding, automate object recognition, and establish the foundation for real-time hazard detection and scene reconstruction. Such capabilities are essential for remote operation, post-disaster assessment, and the advancement of data-driven safety practices in underground mining.
Existing research on underground perception can be broadly categorized into vision-based monitoring approaches and geometry-driven LiDAR reconstruction methods, each addressing different aspects of situational awareness in confined environments. Several works further demonstrate the potential of LiDAR and panoramic imaging for underground applications. Ding et al. introduced a mobile laser-scanning approach for reconstructing multi-shaped tunnels without restrictive geometric priors, improving mesh accuracy and supporting digital-twin development, clearance evaluation, and stability assessment after disruptive events [38]. Ji et al. advanced deformation detection in mining roadways by combining mobile laser scanning with YOLO-based target recognition, producing accurate multi-epoch comparisons without labor-intensive control-point setups [39]. In parallel, Janiszewski et al. showed that 360° photogrammetry can reconstruct tunnels roughly three times faster than Digital Single-Lens Reflex (DSLR) workflows while achieving millimeter-scale accuracy, enabling rapid mapping and fracture-orientation analysis [21]. Duan et al. demonstrated the value of omnidirectional imaging for automated inspection, integrating panoramic images with improved YOLO models to detect equipment under challenging lighting conditions, thereby reducing blind spots in tunnel environments [40].
A second major line of research focuses on deep-learning-based object detection frameworks, particularly convolutional and transformer-based architectures, applied to underground safety monitoring. Wang et al. models based on the Single Shot MultiBox Detector (SSD) framework have been applied to identify potential hazards such as belt damage and foreign objects [41]. Guo et al. explored a 19 conveyor-belt damage detection approach based on an anchor-free CenterNet framework, enhanced through knowledge-distillation and attention techniques to improve detection efficiency and accuracy for practical use [42]. Additional work in underground coal mines has been done when Tian et al., proposed improved Real-Time Detection Transformer (RT-DETR) architectures with partial convolutions, deformable attention, and small-object detection layers to capture helmets and self-rescuers in complex environments, outperforming YOLOv5s, YOLOv7-Tiny, and YOLOv8n [43]. YOLO variants have shown strong adaptability to underground conditions, including low light, dust, clutter, and small-object visibility challenges, especially when enhanced with multi-scale localization, attention mechanisms, or lightweight architectures [44,45,46]. Conveyor-specific works further highlight the relevance of YOLO adaptations using dehazing preprocessing, lightweight model modifications, foreign-object detection, and idler-fault recognition, demonstrating the feasibility of automated, real-time monitoring under visually degraded conditions [47,48,49,50].
In personnel detection, Addy et al. retrained YOLO models on thermal and underground-specific imagery has proven to drastically improve human-detection reliability during emergency scenarios [51]. Fu et al. introduced YOLOv8n-FADS, specifically enhancing helmet detection in visually degraded underground scenes through feature-attention modules [52], while Li et al. introduced an enhanced YOLO11 framework for underground coal mines, integrating Efficient Channel Attention (ECA) and adaptive loss functions to better handle occlusion, dust, and poor lighting conditions in miner detection [53]. For vehicle and equipment safety, Hanif et al., [54] proposed SOD–YOLOv5s–4L, an adaptation of the YOLOv5s framework designed for autonomous electric locomotives operating in underground coal mines, achieving reliable detection of small objects under visually degraded underground conditions. Similarly, Li et al. proposed an improved YOLOv8 framework for underground drill pipe detection [55]. Jin et al. introduced KD-YOLO, an enhanced YOLOv8 variant that integrates dynamic convolution, lightweight modules, and improved up-sampling to detect personnel in dim, dusty, and cluttered mine settings [56].
A third research direction centers on projection-based representations of LiDAR point clouds, which transform irregular 3D geometry into structured 2D grids to leverage mature convolutional architectures. Instead of operating directly on irregular point sets, projection-based methods encode the point cloud into structured 2D grids (e.g., spherical “range images,” cylindrical/front-view images, or bird’s-eye/polar grids), enabling efficient use of 2D convolutions while retaining geometric cues. A recent review synthesizes projection-based semantic segmentation approaches for 3D LiDAR, highlighting how these representations reduce computational cost compared with point-wise or voxel-based processing and providing a clearer view of the current state-of-the-art in projection-driven LiDAR understanding [57].
Representative examples include RangeNet++, which performs real-time semantic segmentation by operating on a multi-channel spherical projection (range image) and then transferring predictions back to the full 3D scan using efficient post-processing, and SalsaNext, which further improves real-time performance and incorporates uncertainty estimation for LiDAR point-wise predictions [58]. Other projection designs, such as PolarNet, show how alternative grid parameterizations (e.g., polar BEV partitioning) can mitigate discretization effects while supporting online inference [59]. In addition to segmentation, projection can support object-level perception and fusion under degraded visibility: for example, camera-based detection outputs can be associated with projected LiDAR geometry to improve object parameter estimation and localization when vision-only measurements are unreliable [60]. Collectively, these works motivate adapting projection-based LiDAR processing to underground settings, where sensing geometry and visibility constraints differ from typical above-ground assumptions.
Although prior research has explored image-based monitoring, deep-learning detection frameworks, and projection-driven LiDAR processing, several critical gaps remain for deployment in real underground mine environments. First, most studies treat 2D imagery and 3D geometry as isolated sensing modalities rather than complementary sources of information. Second, LiDAR research in underground settings has predominantly focused on mapping and reconstruction rather than object-level detection and multi-epoch change assessment. Third, many existing approaches assume sensor geometries, dense coverage, or computational resources that are not compatible with horizontally mounted LiDAR and visibility degradation caused by dust, shadowing, and occlusion. These limitations highlight the need for a practical framework that links visual detection and geometric analysis under true underground operating conditions.
The contributions of this paper are:
- Dual-pipeline framework for 2D–3D detection: We develop a practical pipeline that combines 360° panoramic imaging and LiDAR point clouds to detect people and vehicles in GPS/GNSS-denied underground environments.
- LiDAR-to-2D projection for horizontal underground scans: We propose a projection strategy tailored to horizontally acquired LiDAR data to generate consistent 2D representations, enabling fast YOLO-based object detection without relying on bird’s-eye-view assumptions or computationally heavy 3D detectors.
- Quantitative evaluation under real underground visibility constraints: We systematically compare pretrained and fine-tuned YOLO models under true underground illumination and clutter to quantify the impact of domain adaptation on detection performance.
- Change quantification from registered LiDAR scans: We experimentally demonstrate displacement estimation (vehicle movement) by aligning consecutive LiDAR scans in a common frame, enabling post-event change assessment when human access may be unsafe.
Paper Organization
The remainder of this paper is organized as follows. The Section 2 introduces the dual-pipeline framework for 2D–3D detection and summarizes the data acquisition for the 360° imagery and LiDAR scans. The Section 3 details the end-to-end processing pipeline, including dataset preparation, annotation, model training, and the LiDAR projection workflow used for object localization and displacement estimation. The Section 4 presents quantitative and qualitative performance for both the 2D panoramic image-based detector and the LiDAR-based 2D projection detector. The Section 5 interprets the findings and synthesizes dominant failure modes under underground conditions. Finally, the Conclusions summarize the main contributions, followed by Limitations and Future Work, which outline current constraints and practical next steps.
2. System Overview (2D–3D Framework and Data Acquisition)
This study develops a two-part detection framework that integrates 360° image-based object detection and LiDAR-based 3D analysis for underground mining environments. The 2D component focuses on identifying people and vehicles under low-light, shadowed underground conditions using fine-tuned YOLO models applied to panoramic images. The 3D component processes LiDAR point clouds to detect objects, reconstruct local geometry, and quantify positional changes across multiple underground scans. Together, these methods provide complementary visual and spatial information essential for automated hazard recognition and remote scene assessment.
2.1. 2D Image-Based Object Detection
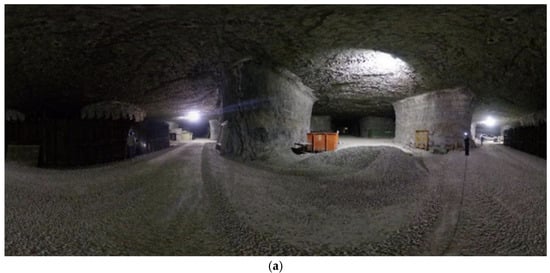
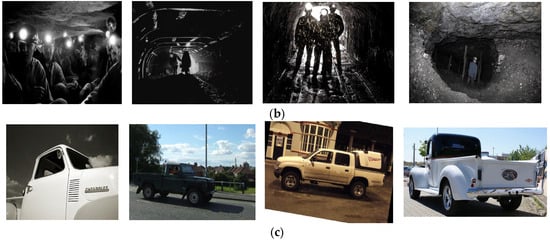
The 2D training dataset was generated using a Ricoh Theta Z1 360° camera (Ricoh Company, Ltd., Tokyo, Japan). A total of 40 images were captured at the University of Kentucky Explosives Research Team (UKERT) facilities in Georgetown, KY, including personnel and equipment under natural underground lighting. As shown in Figure 1a, these scenes included low illumination, headlamp glare, and shadows to represent operational conditions, and were saved for testing the fine-tuned model. To fine-tune YOLOv8n for underground mine conditions, the dataset was expanded with low-light and shadow-based human images from Roboflow DeepV2 (14,644 images) [61], Roboflow Shadow YOLOv5 (577 images) [62], and 4407 manually collected dark-environment images as shown in Figure 1b. For vehicle detection, the training set included the Roboflow Mobil Pikap dataset (937 pickup-truck images) [63] and 452 additional truck images collected and formatted in YOLO style as shown in Figure 1c. These combined datasets ensured sufficient variability and alignment with underground visual conditions.
Figure 1.
Images used for development of 2D object detection fine-tuned model: (a) 360° panoramic underground scene captured at the UKERT facility; (b) sample training images for the person class under low-light and shadowed conditions; (c) sample training images for the car class, including pickup trucks commonly encountered in underground operations.
2.2. 3D LiDAR-Based Object Detection
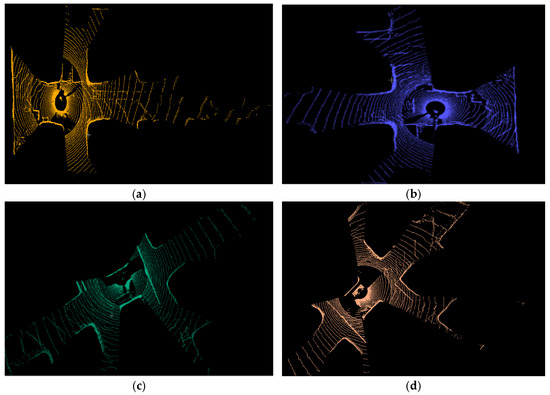
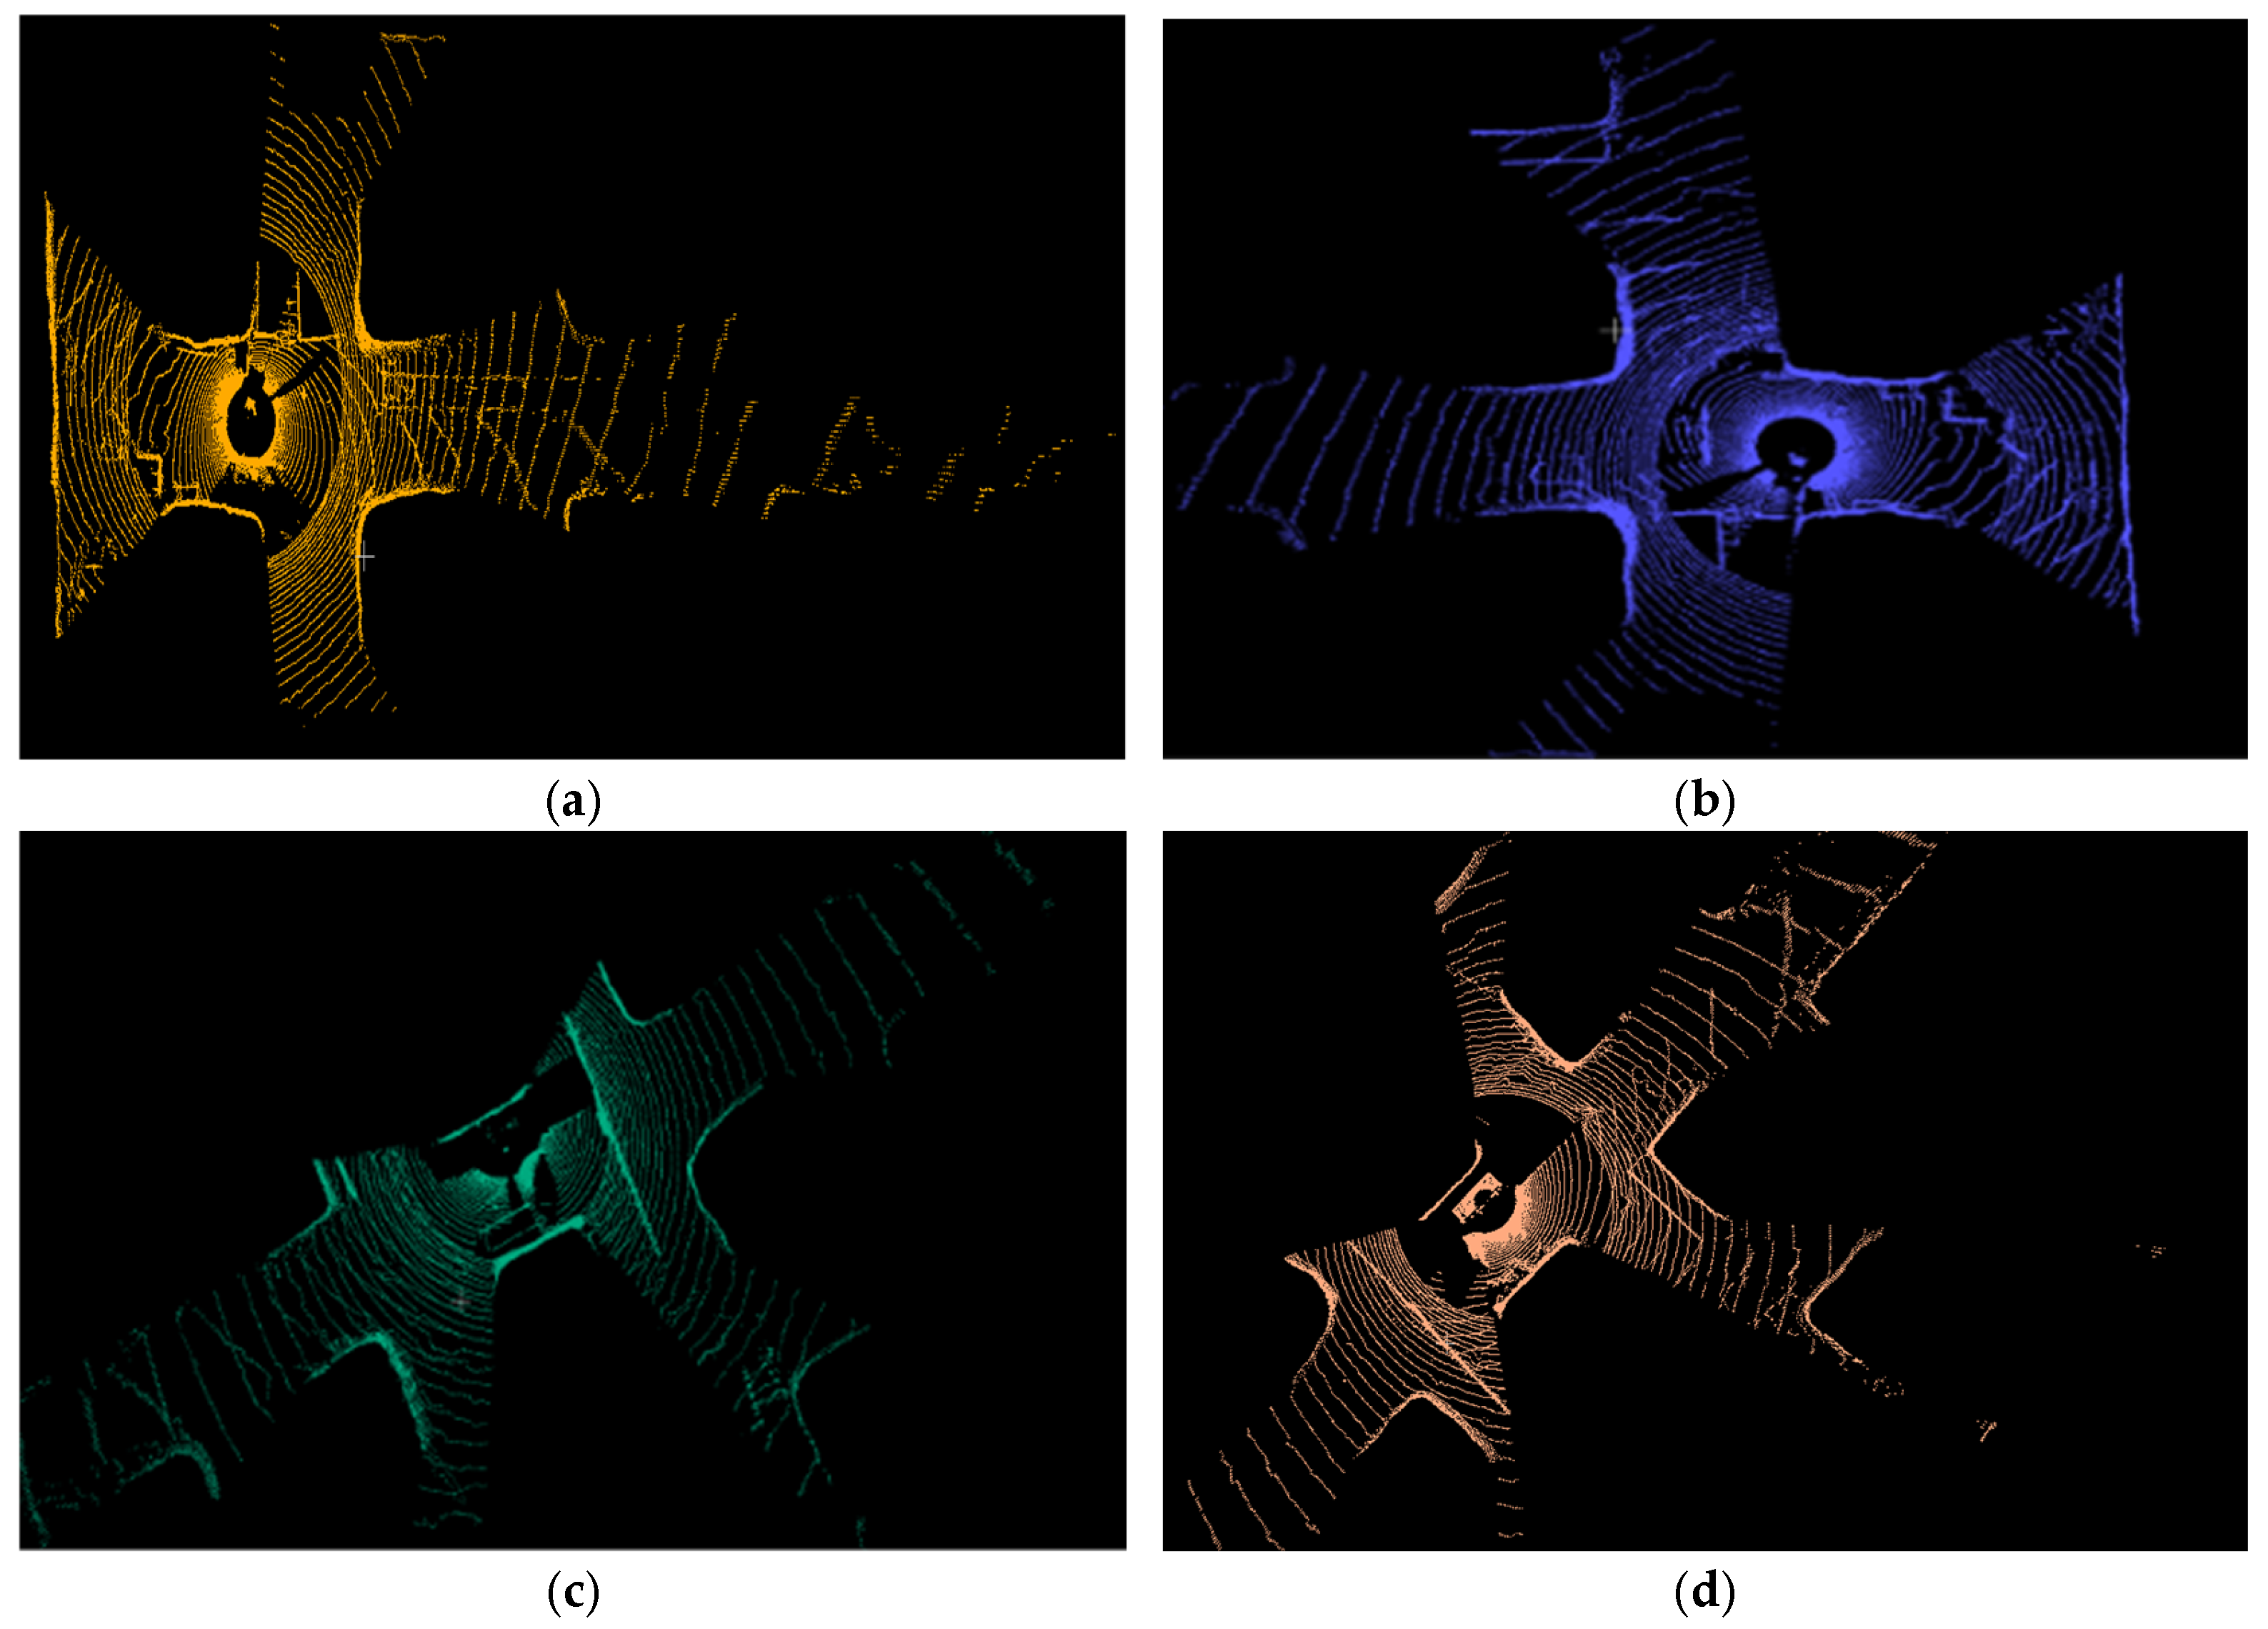
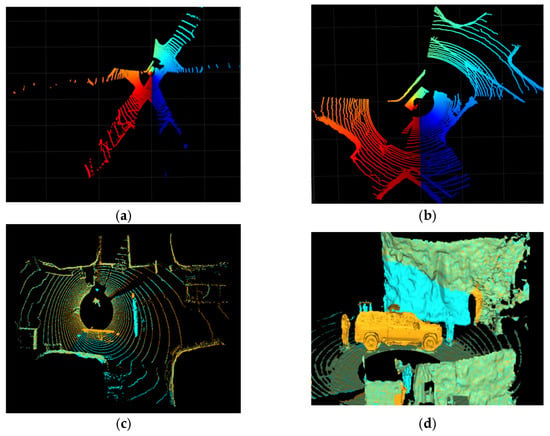
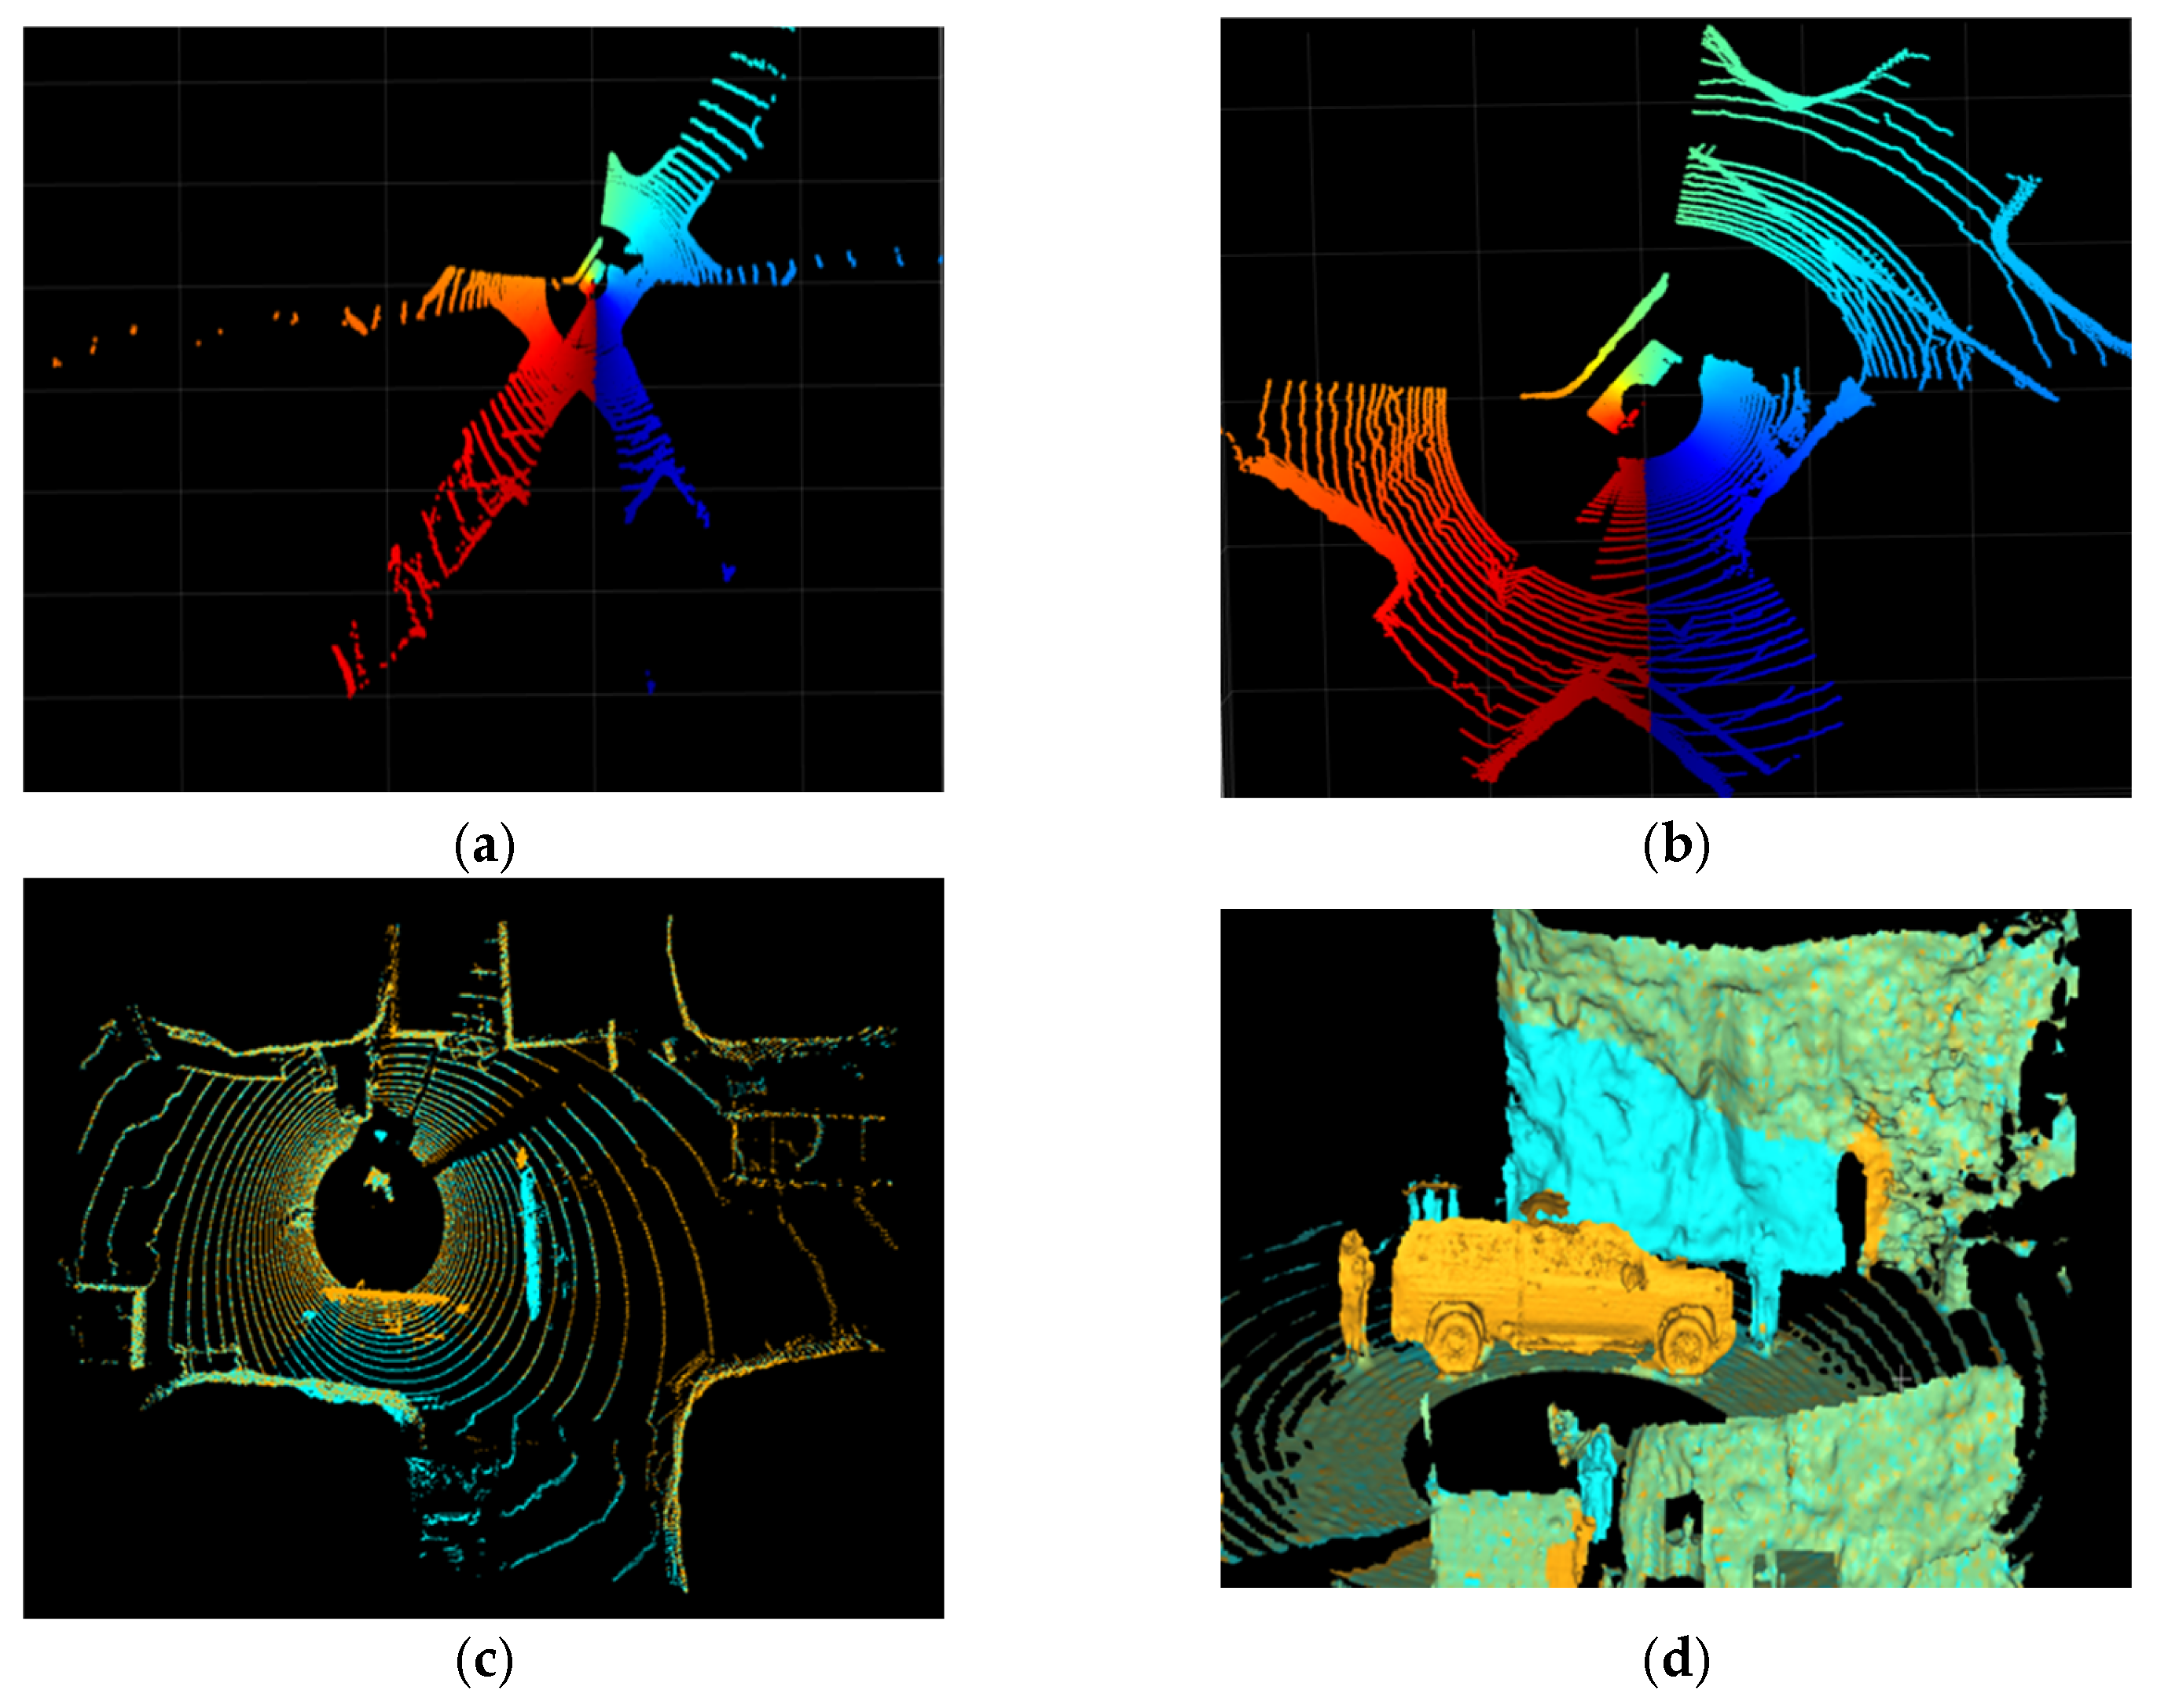
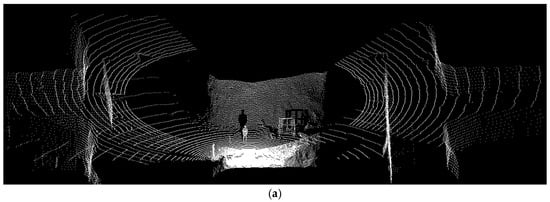
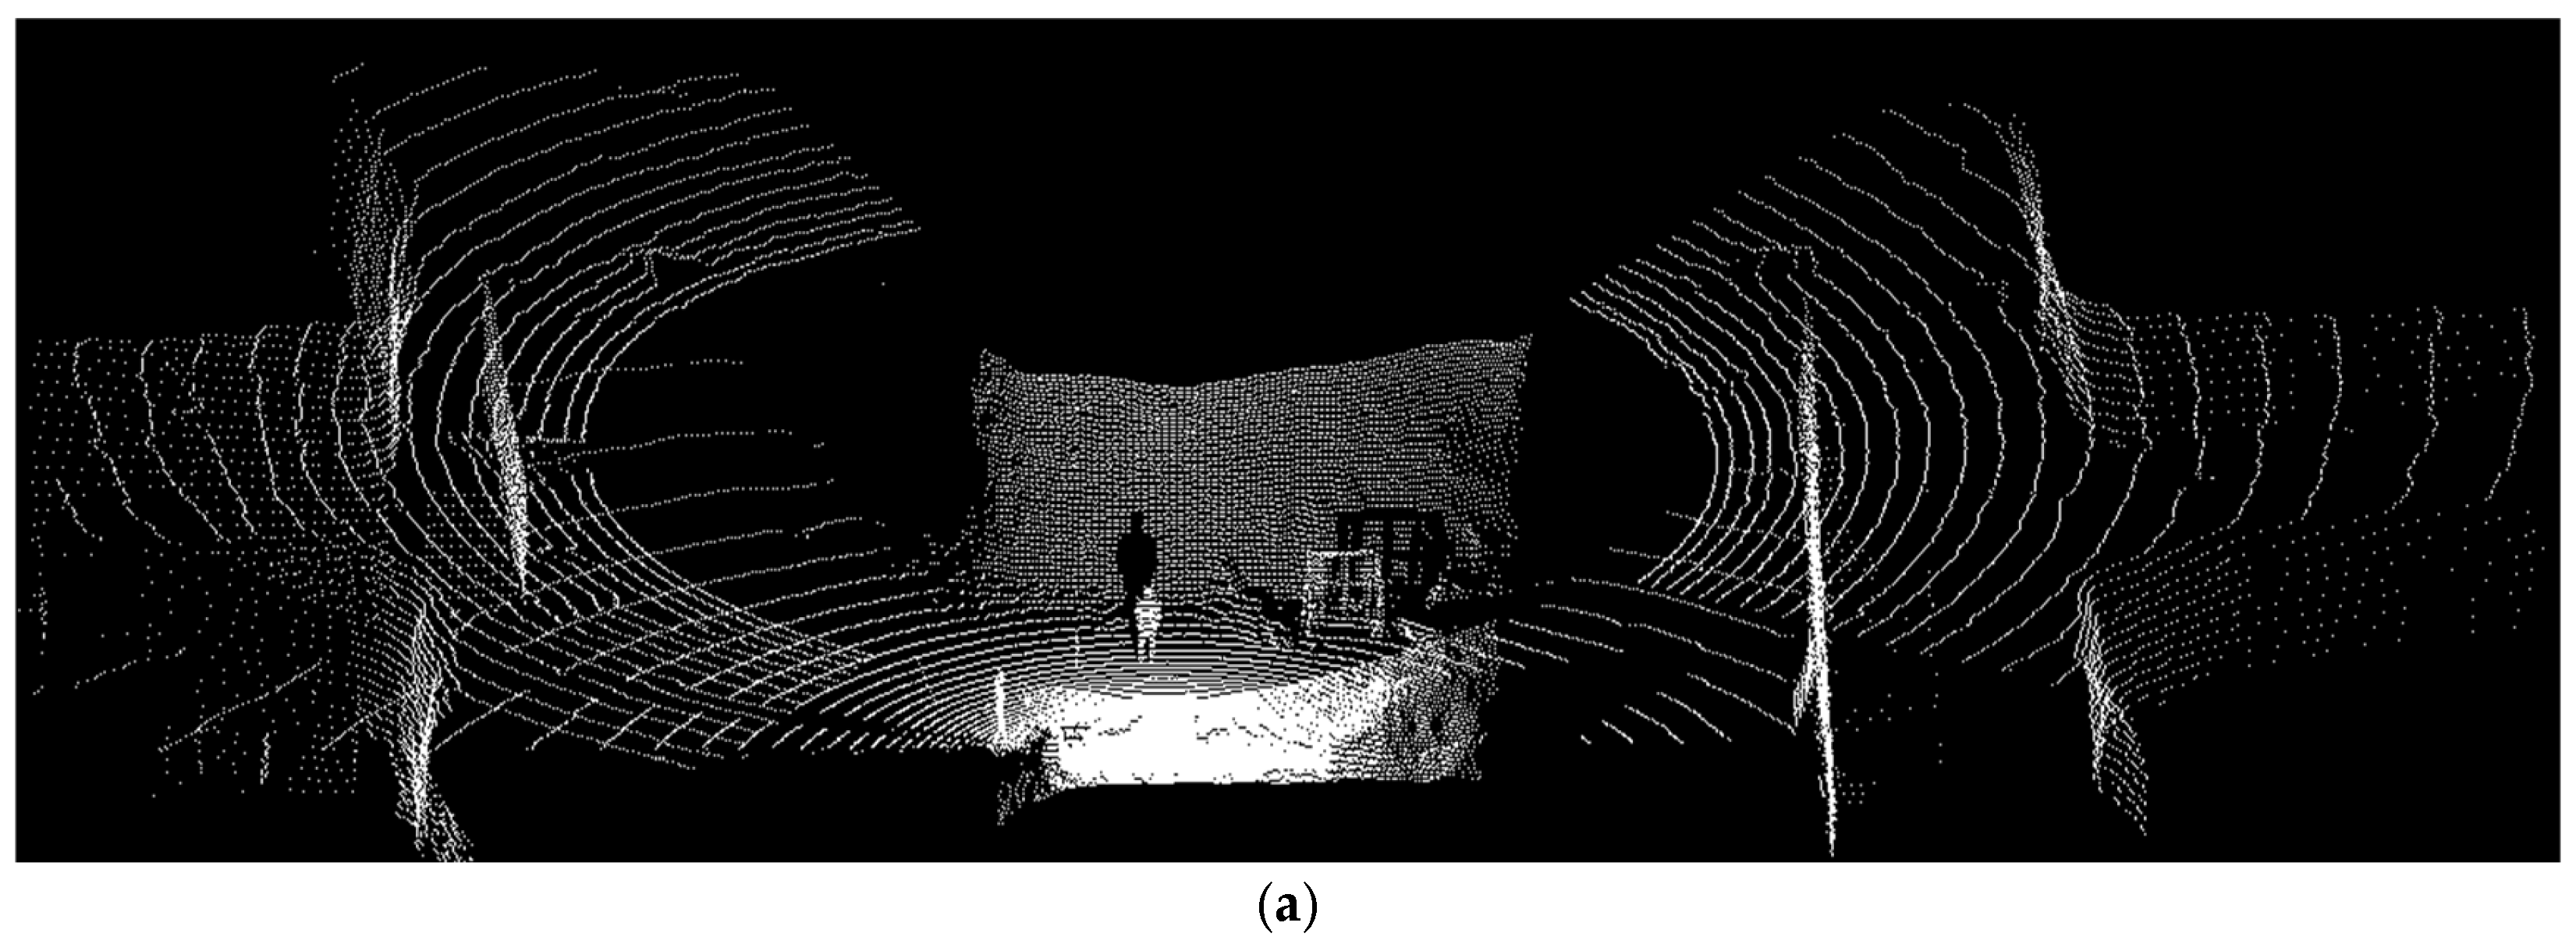
3D data was captured using an Ouster OS1-070-64 LiDAR (Ouster, Inc., San Francisco, CA, USA) across multiple underground positions, including 121 frames collected at the UKERT facility. The scans were organized into four subsets, two containing the person class and two containing the car class, to capture realistic variability in underground conditions. Representative examples are shown in Figure 2.
Figure 2.
Sample LiDAR scans from the same environment at UKERT facility taken from different acquisition angles (a) first scene, (b) second scene, (c) third scene, and (d) fourth scene.
The sensing devices used in this study were deployed for experimental data acquisition under controlled research conditions at the UKERT facility. The Ricoh Theta Z1 panoramic camera (Ricoh Company, Ltd., Tokyo, Japan) and the Ouster OS1-070-64 LiDAR (Ouster, Inc., San Francisco, CA, USA) provide high-resolution visual and spatial data suitable for perception research; however, the specific units employed were not intrinsically safe or explosion-proof certified for operation in explosive underground atmospheres. In active underground mining environments, sensing systems must comply with applicable safety standards or be installed within certified protective enclosures. The proposed detection framework is sensor-agnostic and can be implemented using appropriately certified hardware for operational deployment without modification of the algorithmic pipeline.
3. Methods (Processing, Training, and Evaluation)
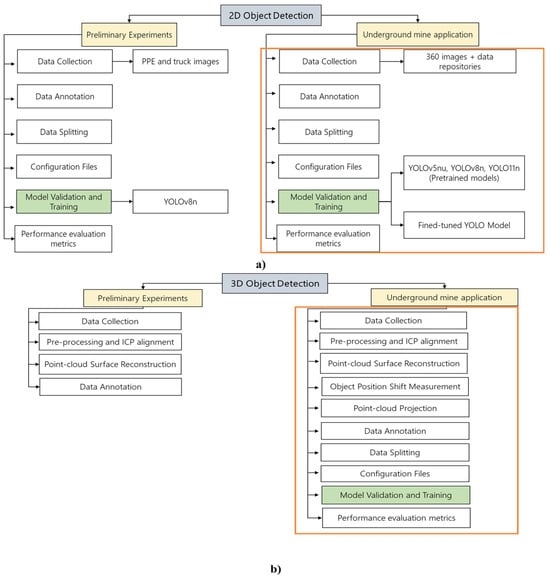
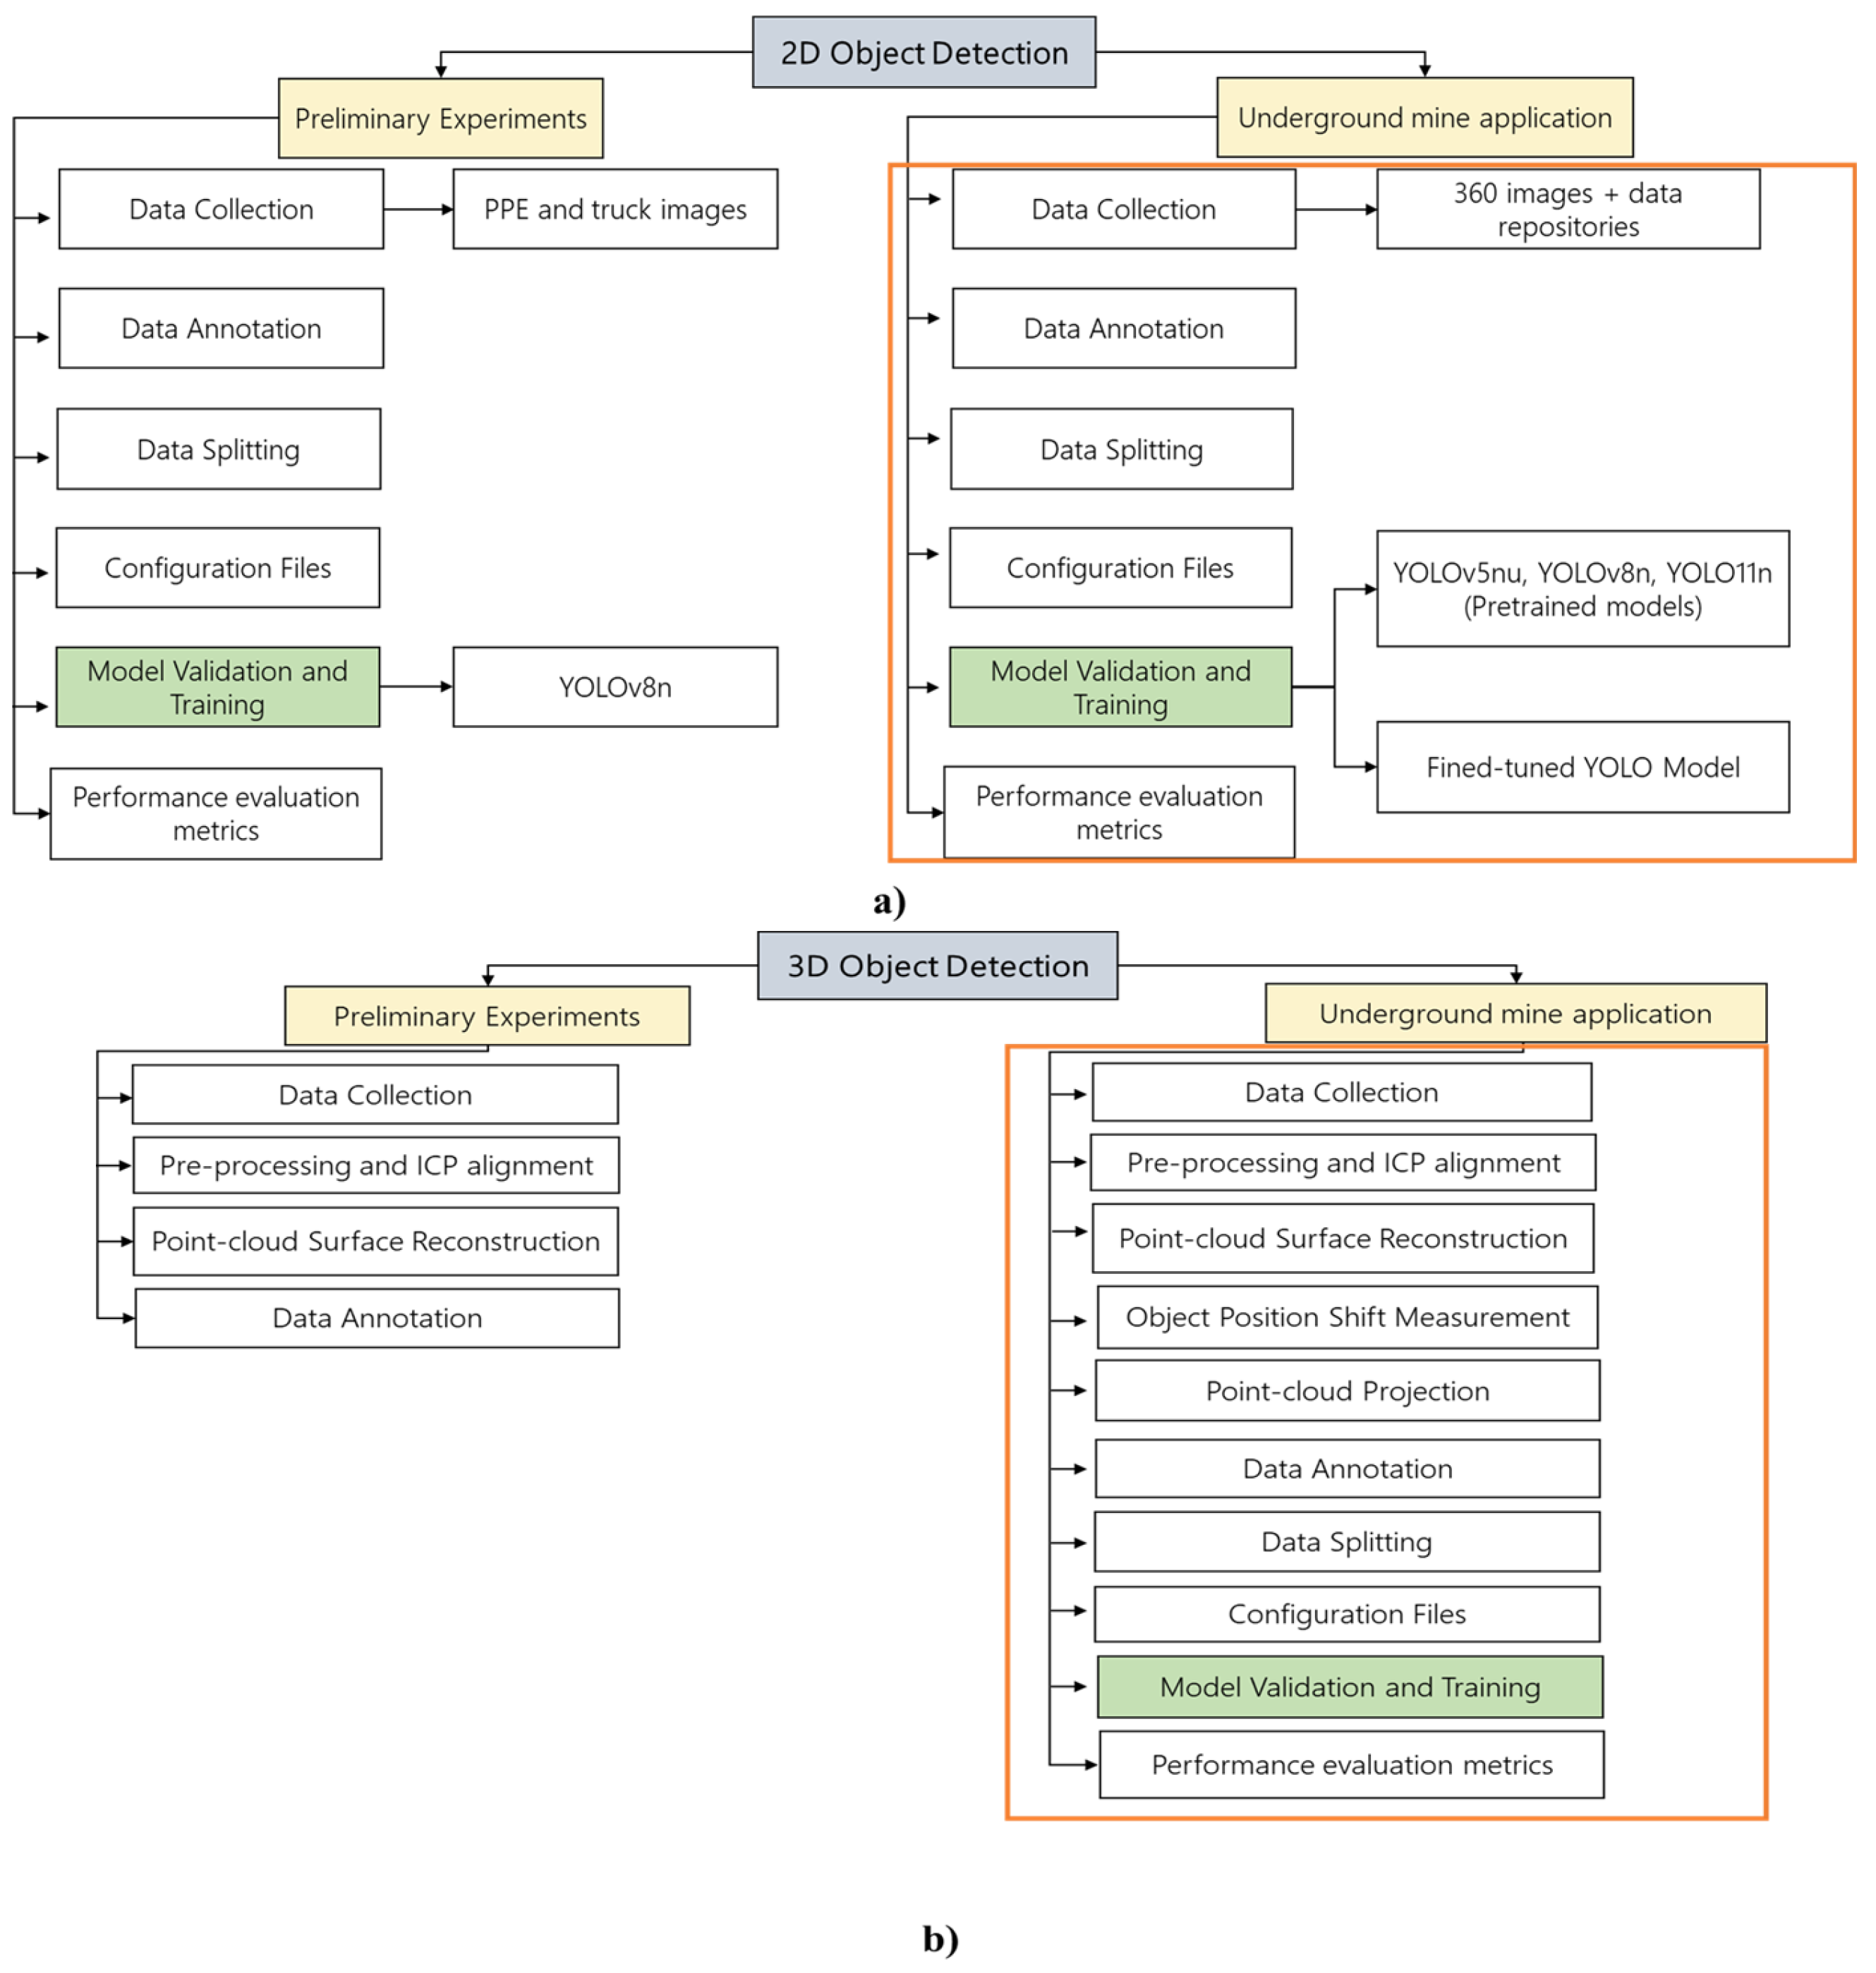
This section presents the overall methodology used to develop the 2D and 3D object-detection components of the framework. It includes the preparation of image and LiDAR datasets, the design of the detection models, and the procedures used to process, train, and evaluate both modalities. Figure 3 provides an overview of the complete processing pipeline of the proposed framework, highlighting key inputs, processing stages, model validation/training, and outputs for the 2D panoramic image-based and 3D LiDAR-based object detection components.
Figure 3.
End-to-end processing pipeline of the proposed framework, highlighting inputs, processing stages, model validation/training, and outputs for (a) 2D image-based object detection and (b) 3D LiDAR-based object detection in underground mine applications.
3.1. 2D Object Detection
3.1.1. Database Collection
The image datasets used for developing the fine-tuned YOLOv8n model were collected as described in the Section 2. YOLOv8n, implemented through the Ultralytics framework, was selected because it is a single-stage detector, allowing localization and classification to occur in a single pass, which provides faster inference than two-stage models [64]. Since underground safety and post-disaster assessment are time-critical applications, a lightweight and high-speed model was required. The nano variant further supports efficient deployment on limited hardware. All training and testing procedures were performed in an Ubuntu WSL environment using Python 3.10, ensuring compatibility with the required deep-learning libraries.
3.1.2. Image Annotation
Image annotation included all collected images labeled in CVAT (Computer Vision Annotation Tool) using bounding boxes for the two target classes (person and car). CVAT was selected due to its flexibility and support for YOLO-format annotations [65]. Each bounding box was drawn manually, and the annotations were exported in standard YOLO format, where each entry is stored as class_id x_center y_center width height with all values normalized to the image dimensions.
3.1.3. Data Splitting
The collected dataset was split into training, validation, and test sets using a 70/15/15 ratio, a common practice in computer vision to ensure effective learning and unbiased evaluation [66,67].
3.1.4. Configuration File Setup
A YAML configuration file (config.yaml) was created to define the paths for the training, validation, and test sets and to specify the two class labels used in this stage (0: person, 1: car).
3.1.5. Model Training
Three pretrained YOLO models (YOLOv5nu, YOLOv8n, and YOLO11n), originally trained on the COCO dataset [68], were first tested on the 40 panoramic underground images to establish a baseline under low-light and shadowed conditions. The manually curated underground dataset was then used to fine-tune the YOLOv8n model for improved detection. Training was performed on an NVIDIA RTX 4080 GPU (NVIDIA Corporation, Santa Clara, CA, USA) using 150 epochs, a batch size of 16, and 640 × 640 image resolution. The best-performing weights (best.pt) were selected for evaluation.
3.1.6. Evaluation Metrics
Model performance was evaluated using standard object detection metrics derived from the confusion matrix. Let TP, FP, FN, and TN denote true positives, false positives, false negatives, and true negatives, respectively. Precision and recall are defined as:
The F1-score, which balances precision and recall, is given by [69]:
Detection performance was additionally summarized using mean Average Precision (mAP), computed as the mean of the Average Precision (AP) values across object classes, where AP corresponds to the area under the precision–recall curve for each class [70].
These principles were also used as part of the Section 3.2.
3.2. 3D Object Detection
3.2.1. Point-Cloud Acquisition and Preprocessing
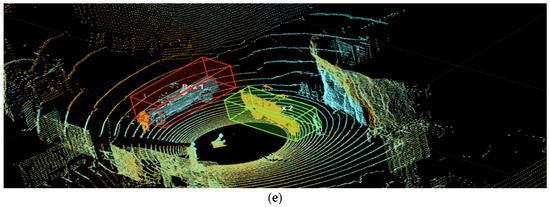
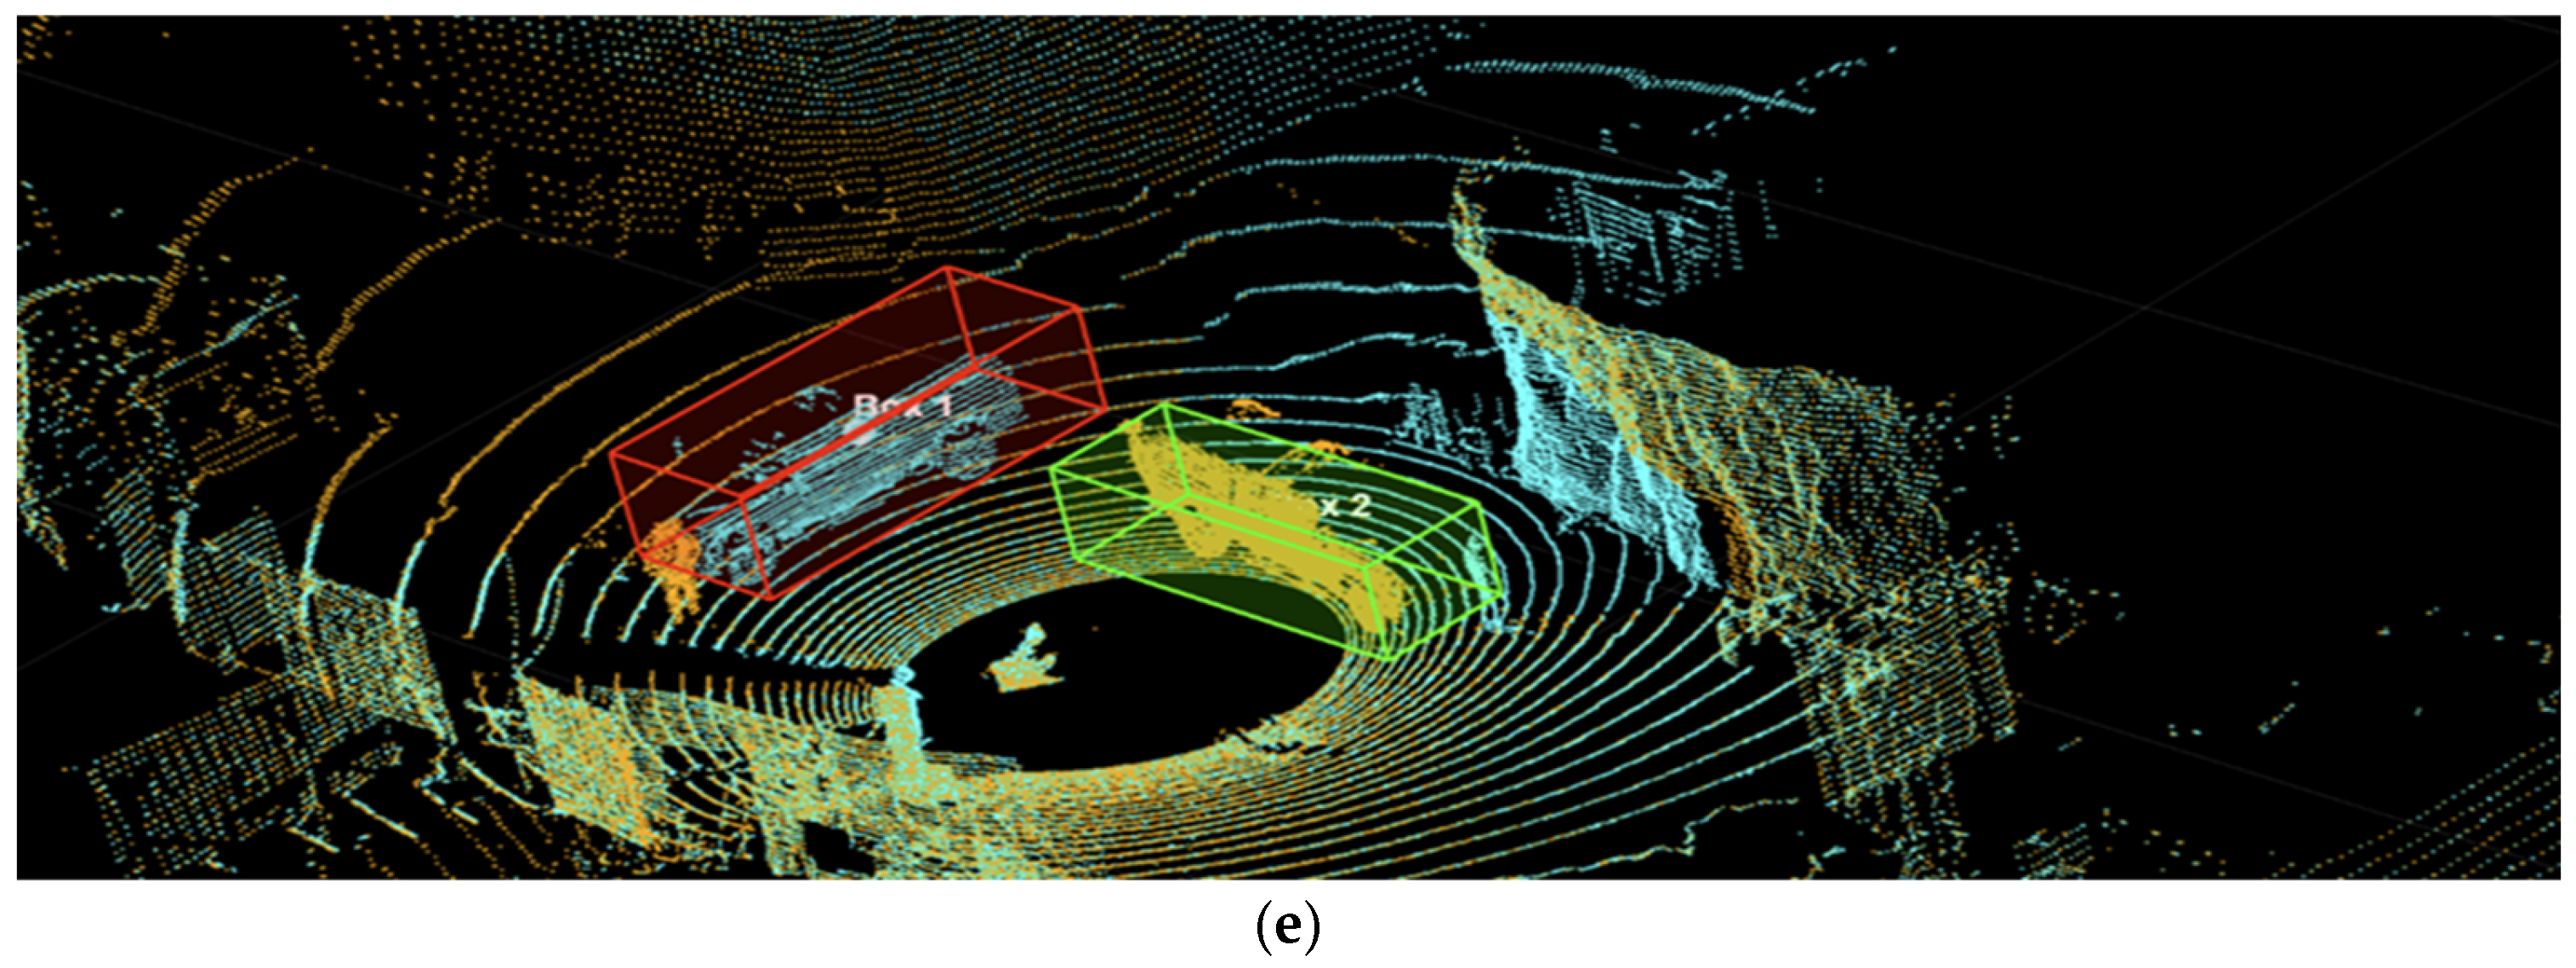
The point cloud datasets used for developing the fine-tuned YOLOv8n model were collected as described in the Section 2, where the initial stages of data acquisition were outlined. Noise and isolated regions were removed in MATLAB R2025b prior to analysis. The pcdenoise function (NumNeighbors = 20, Threshold = 0.005) eliminated sparse points, and pcsegdist removed small, disconnected clusters by segmenting the cloud with a 0.5 m distance threshold and discarding clusters with fewer than 500 points (Figure 4a,b).
Figure 4.
Point cloud processing, alignment, and object displacement After ICP: (a) Raw point cloud with noise; (b) denoised and processed point cloud; (c) two LiDAR scans aligned using ICP, shown in orange and blue; (d) Poisson surface reconstruction of an aligned set of point clouds; (e) change in vehicle position illustrated by bounding boxes drawn on the aligned scans.
3.2.2. Registration, Reconstruction, and Displacement Measurement
ICP was used to register point clouds collected from different viewpoints at the UKERT site, ensuring spatial consistency across scans. After each of the four UKERT subsets was internally aligned, cross-set registration was performed by pairing Sets 1–2 (person class) and Sets 3–4 (car class) (Figure 4c). Poisson surface reconstruction was performed using the PUMA framework [71]. A depth value of 12 was used to capture fine detail, and a minimum density of 0.5 was applied to suppress sparse regions (Figure 4d).
Following ICP alignment, one vehicle showed a detectable positional shift. Bounding boxes were manually drawn in MATLAB using drawcuboid to isolate each vehicle and extract spatial properties. Box centers were computed and compared, and displacement was calculated using both the Euclidean distance and the center-coordinate difference vector, providing magnitude and direction of movement (Figure 4e). While manual drawcuboid annotation was accurate, it was time-consuming; therefore, the subsequent steps were designed to automate object localization through detection directly from point-cloud-derived images.
3.2.3. Point-Cloud Projection, Augmentation, and Annotation
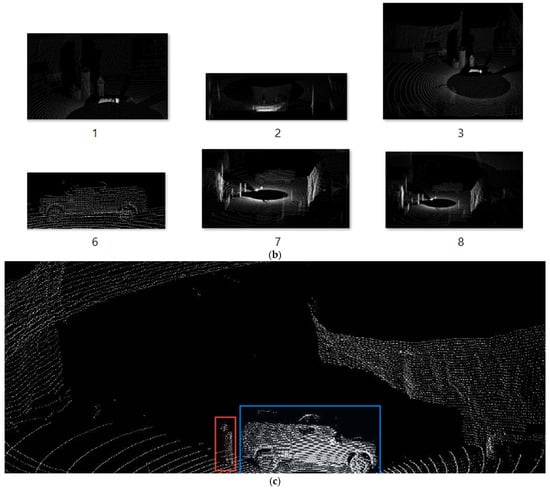
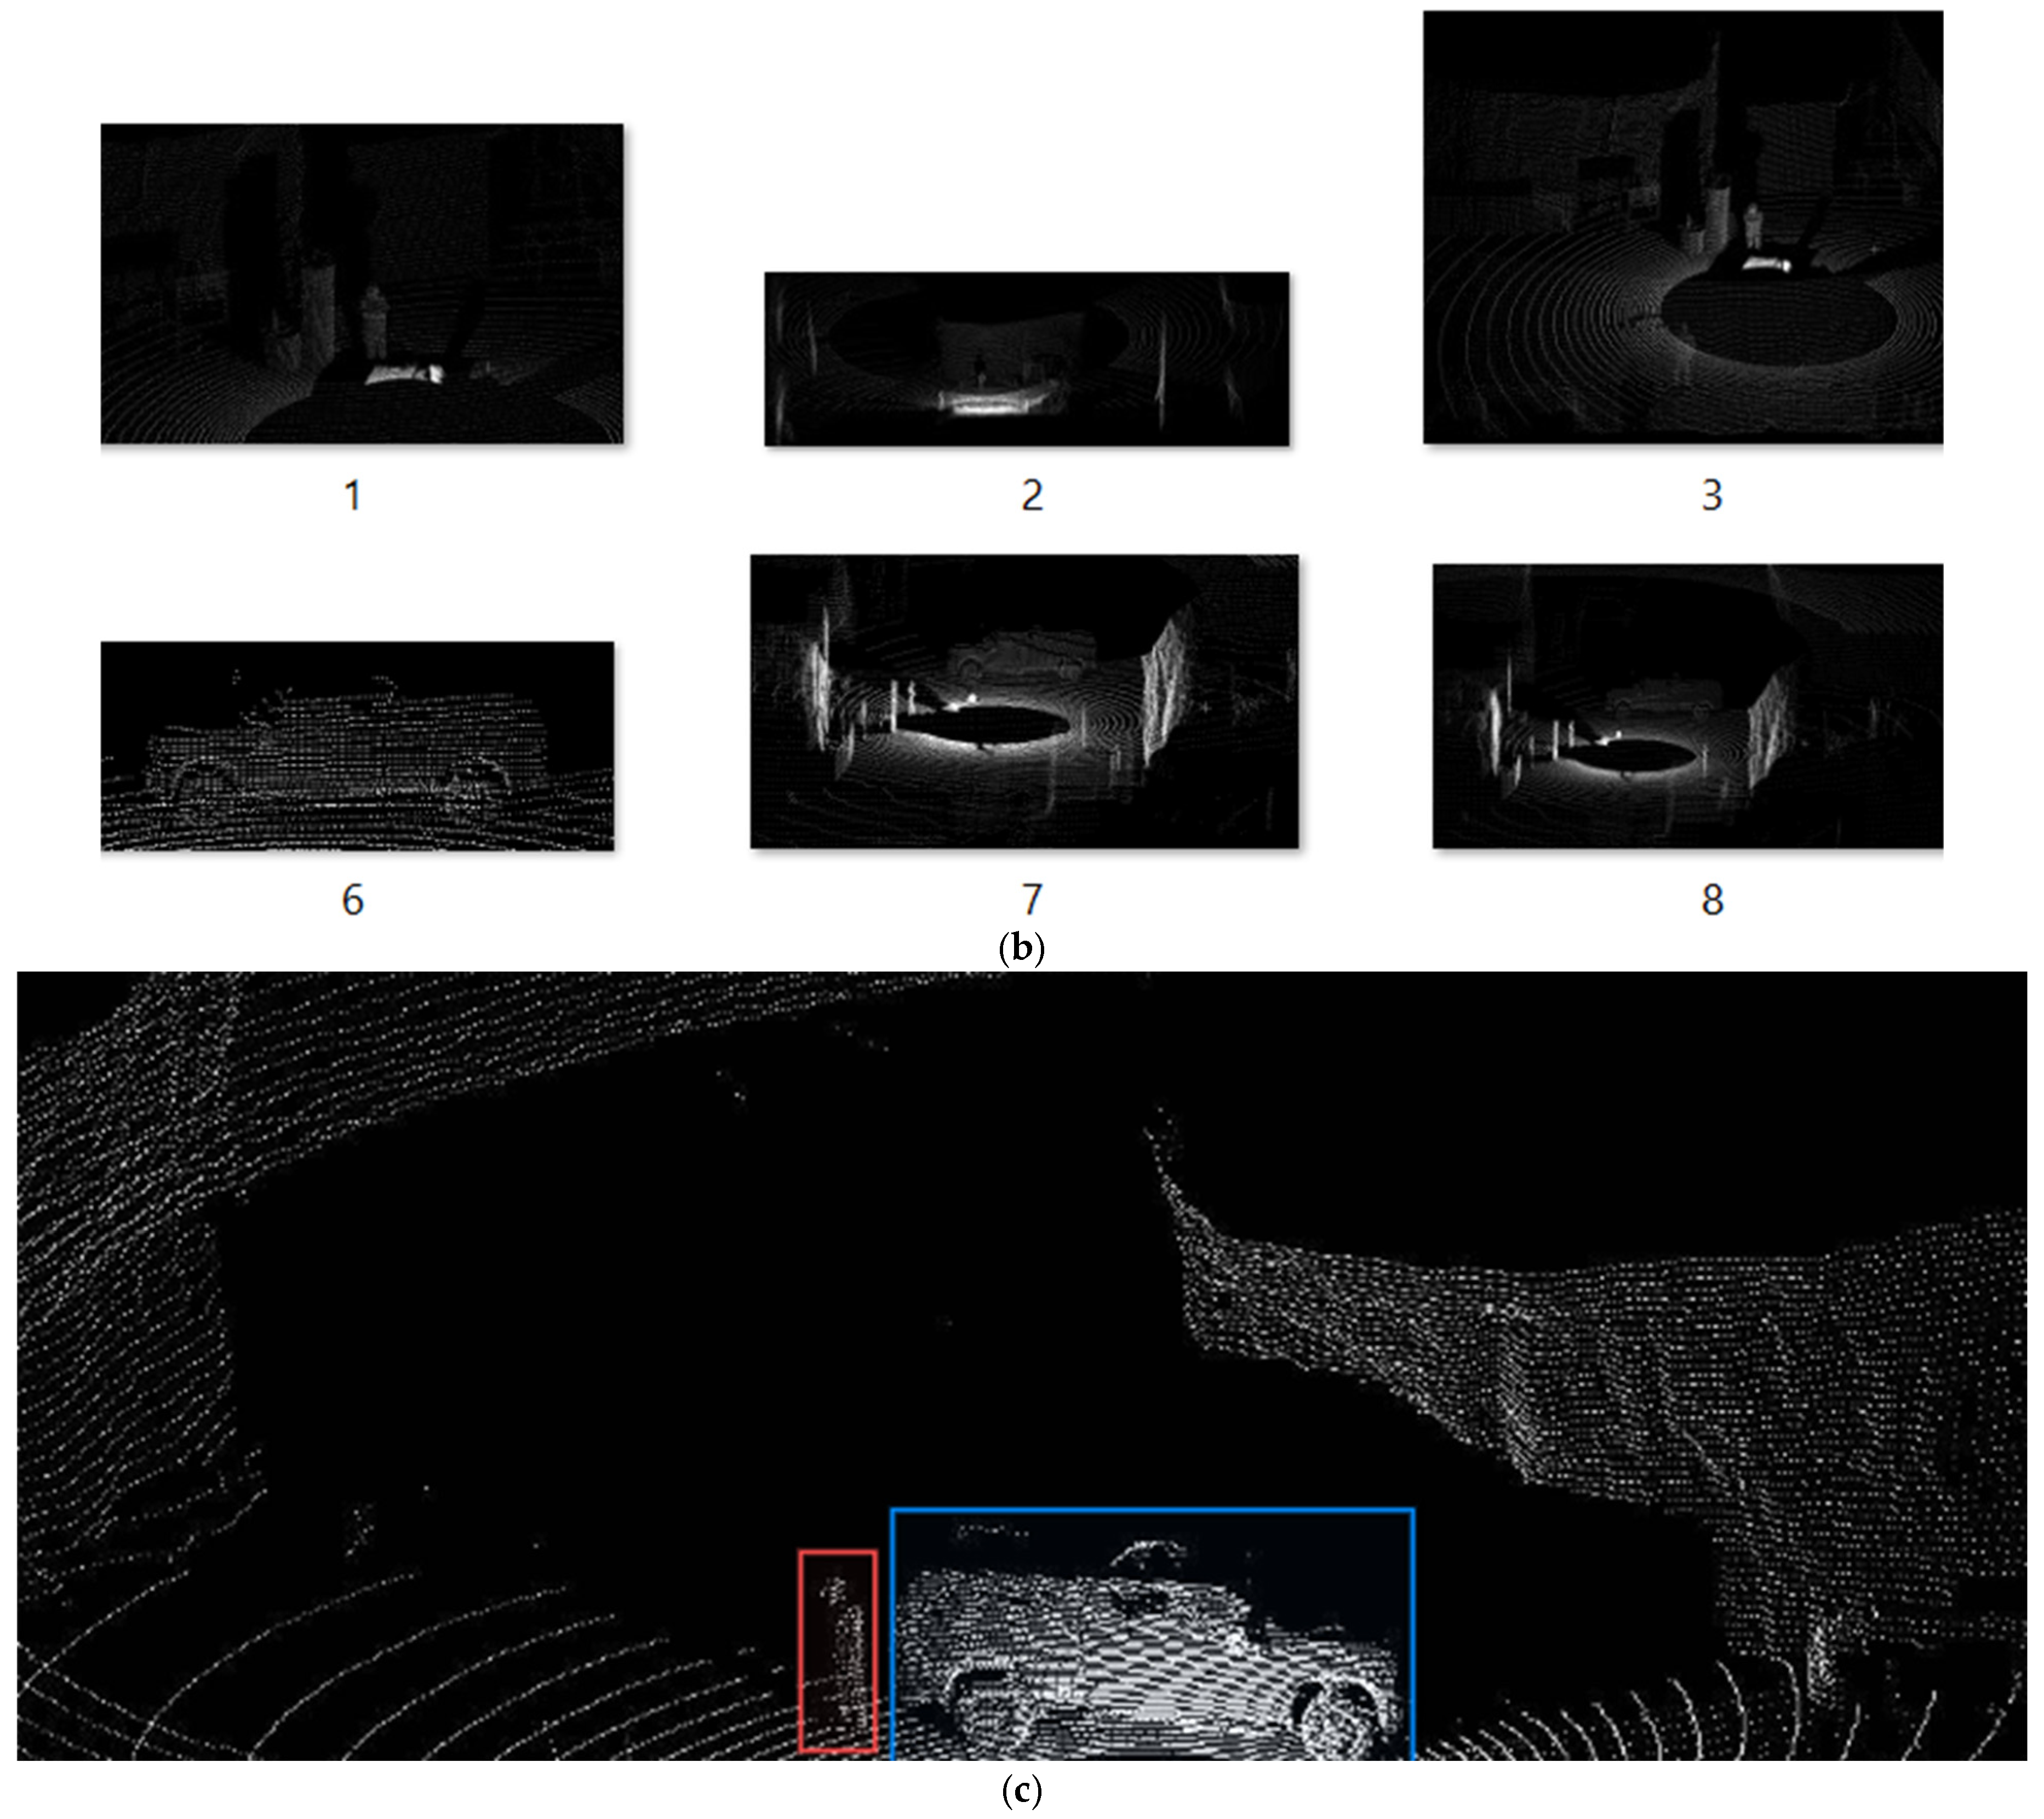
To enable YOLO-based detection, processed point clouds were converted into images through a custom projection method (Figure 5a). Bird’s-eye-view mapping was not used because the LiDAR scans were captured from horizontal viewpoints, making top-down frameworks such as PointPillars unsuitable [72]. Instead, point clouds were rotated via sequential transformations around the Y, Z, and X axes to create an optimized virtual viewpoint. The rotated points were projected onto the Y–Z plane, discretized into bins using histcounts, and converted into binary images saved as JPEGs.
Figure 5.
Point cloud projection, augmentation, and annotation: (a) 2D projection generated from a 3D LiDAR point cloud; (b) Example of augmented images created from the projected data; (c) Manual annotation of the two classes, showing a person (red box) and a car (blue box).
Let denote a 3D LiDAR point expressed in the sensor coordinate frame. To generate a virtual viewpoint suitable for horizontal underground scans, a sequence of rigid rotations was applied to each point. Specifically, a rotation about the -axis (tilt), followed by a rotation about the -axis (yaw), and finally a rotation about the -axis (roll) were performed. The transformed point is defined as:
where , , and denote the tilt, yaw, and roll angles, respectively. These rotations were selected to align the tunnel axis and frontal objects with the image plane and to level the floor surface.
After rotation, the point cloud was projected onto the plane by discarding the depth coordinate, yielding 2D projected coordinates [73].
The projected coordinates were discretized into a fixed-resolution grid with bin size (m/pixel). Uniform bin edges were defined over the ranges of the projected and coordinates, and each point was assigned to a corresponding bin. A binary occupancy image was constructed by setting a pixel value to 1 if at least one point fell within the corresponding bin and 0 otherwise. Finally, the resulting image was vertically flipped to match standard image coordinate conventions before being exported for 2D object detection.
Data augmentation was performed by cropping projected images at different scales and re-projecting selected point clouds from additional viewing angles, expanding the dataset without collecting new scans and improving generalization under varying perspectives and object sizes (Figure 5b). The projected images were manually labeled in CVAT with person and car bounding boxes and exported in YOLO format (Figure 5c).
3.2.4. Training Setup (Split, Configuration, and Model Training)
The person and car datasets were divided into training, validation, and test sets using a 70/15/15 split to ensure balanced model training and evaluation. A YAML configuration file (config.yaml) specified training/validation/test paths and defined the class labels (0: person, 1: car). The YOLOv8n model was trained on an NVIDIA RTX 4080 GPU for 150 epochs with a batch size of 16 and an image size of 640 × 640.
In this study, the 2D panoramic image-based detection pipeline and the LiDAR-based 3D analysis pipeline are developed and evaluated independently, but they are intentionally aligned in terms of target object classes, deployment environment, and safety objectives. Integration is achieved at the framework and decision level, where semantic detections from imagery and metric spatial information from LiDAR jointly support underground situational awareness and post-event assessment in GNSS-denied conditions.
4. Results
4.1. 2D Object Detection
The application began by evaluating three pretrained models: YOLOv5nu, YOLOv8n, and YOlO11n using the testing images captured at the UKERT facility. The performance metrics evaluation was calculated for each model using the validation set. These models were applied directly without fine-tuning to establish baseline performance. As shown in Table 1, for the person class, YOLO11n achieved the highest precision (0.818) but lower recall (0.561), while YOLOv8n offered the best overall balance with higher recall (0.646) and the top mAP@0.5:0.95 (0.31). As shown in Table 2, car detection was consistently stronger across all models, with precision > 0.79 and recall > 0.71. YOLO11n recorded the highest recall (0.758) and best mAP@0.5 (0.830), while YOLOv8n and YOLO11n tied for the highest mAP@0.5:0.95 (0.42). Overall, the pretrained models detected vehicles more reliably than people in real underground mine conditions.
Table 1.
Summary of performance metrics for pretrained 2D object detection models on the person class.
Table 2.
Summary of performance metrics for pretrained 2D object detection models on the car class.
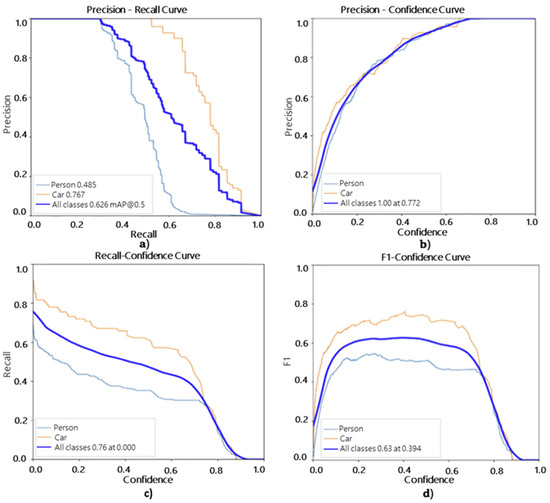
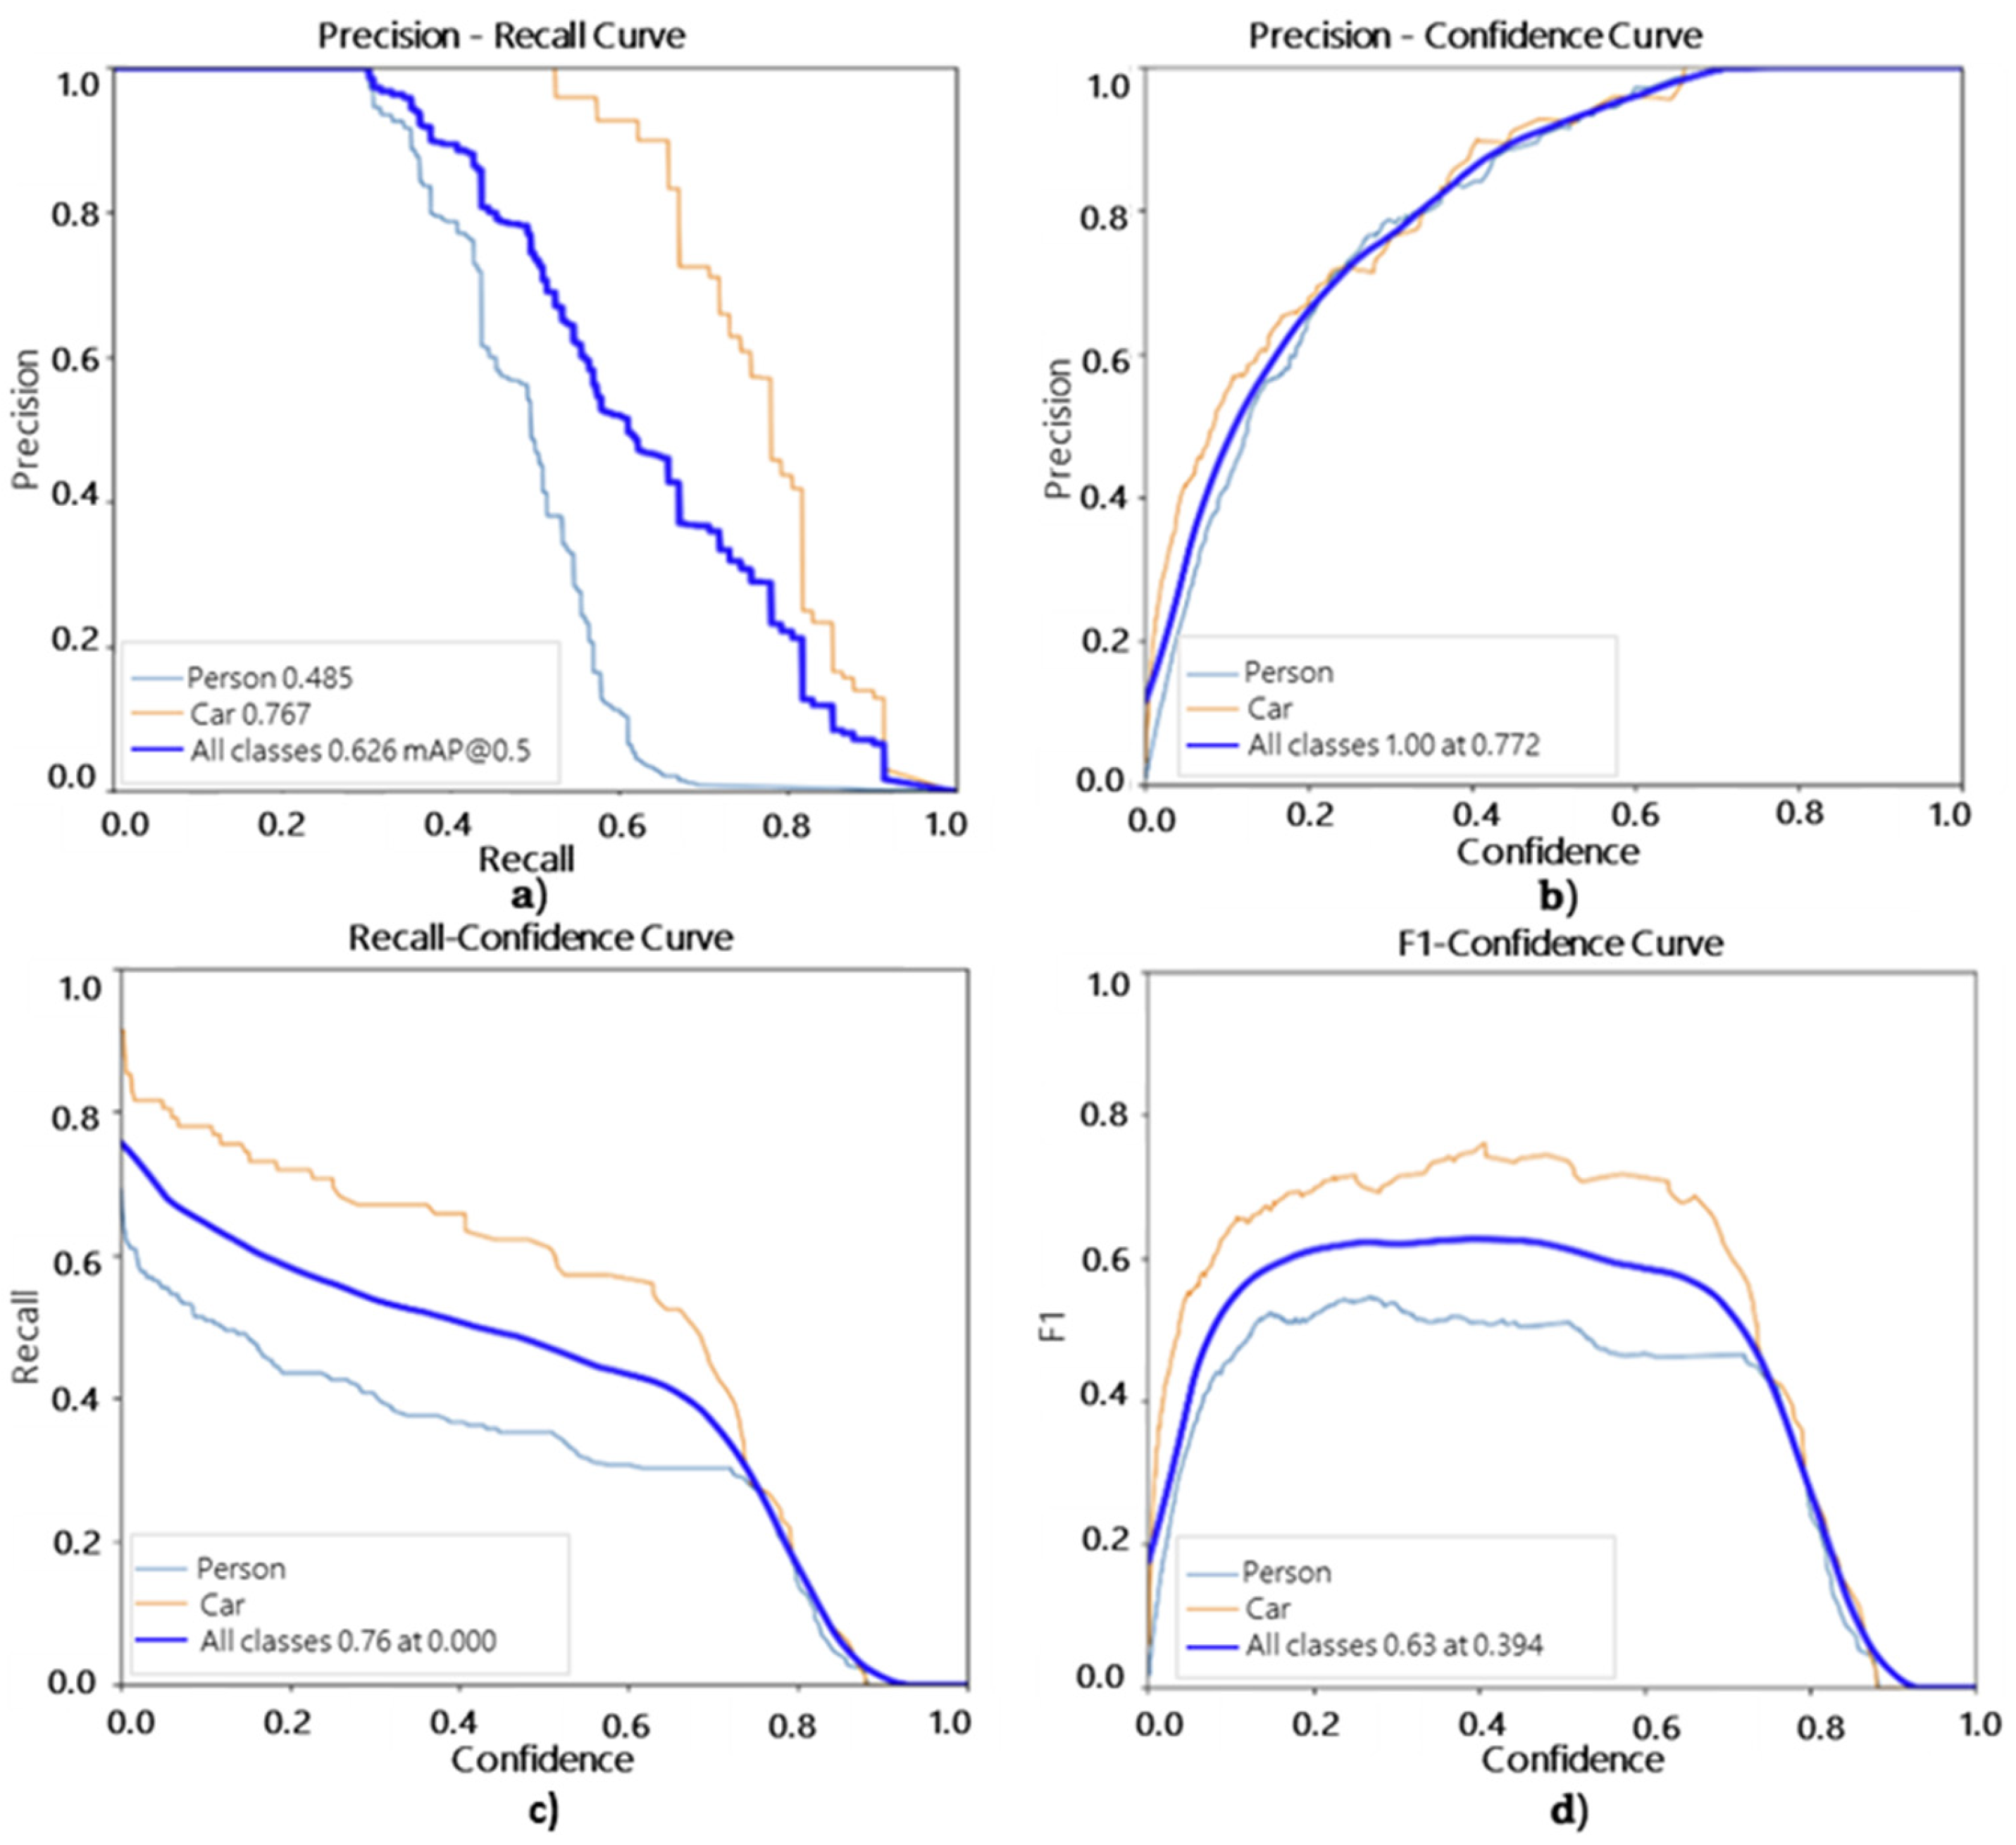
As shown in Table 3, the fine-tuned YOLOv8n model achieved better results than the pretrained models, particularly for the car class, which consistently outperformed the person class with higher recall and mAP values. This improvement reflects the advantage of training on datasets tailored to underground mine conditions. The evaluation curves in Figure 6 further highlight these gains. In the Precision–Recall curve, as shown in Figure 6a, the car class shows much greater stability, reaching an mAP@0.5 of 0.767, while the person curve declines more rapidly to 0.485, indicating that fine-tuning significantly reduced missed detections for vehicles but that human detection remains more challenging under low-light and occlusion. The Precision–Confidence curve, as shown in Figure 6b, also demonstrates this improvement: car detections approach near-perfect precision at higher confidence thresholds, whereas the person curve plateaus earlier, showing more sensitivity to false positives.
Table 3.
Fine-tuned YOLOv8n 2D object-detection model metrics performance results for person and car class.
Figure 6.
Fine-tuned YOLOv8n 2D object-detection model performance for the person and car classes: (a) Precision–Recall Curve; (b) Precision–Confidence Curve; (c) Recall–Confidence Curve; (d) F1–Confidence Curve.
These trends continue in the Recall–Confidence curve, as shown in Figure 6c, where cars maintain higher recall across most of the confidence range, while person recall decreases earlier, confirming that recall is the model’s main limitation for human detection. Finally, the F1–Confidence curve, as shown in Figure 6d, shows that the car class achieves a stronger overall balance between precision and recall, whereas the person curve reaches a lower peak. Overall, the curves show clear improvements compared to the pretrained models and demonstrate that fine-tuning greatly enhanced the model’s performance, particularly for vehicle detection in underground mine environments.
After using the validation data, testing data, which included all 40 underground mine images from the UKERT facility, was tested, see Table 4. The person class achieved a mean confidence of 0.79 ± 0.21, indicating generally reliable and stable detections with moderate variation across scenes. In contrast, the car class showed a lower mean confidence of 0.50 ± 0.37, with values ranging from highly confident detections to complete misses, reflecting much greater variability. Overall, the model generalized more effectively to people than to vehicles in the underground test set, despite the validation phase previously showing stronger performance for the car class. These differences and their implications are examined further.
Table 4.
Mean and standard deviation of person and car confidence scores in the 2D testing results of the fine-tuned YOLOv8n model.
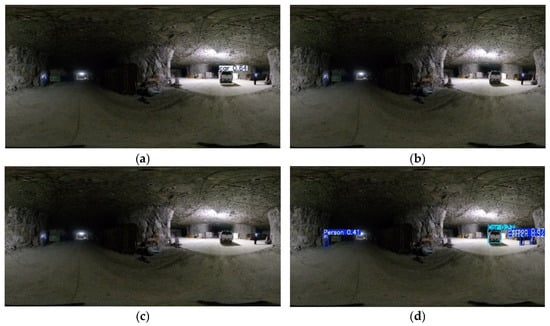
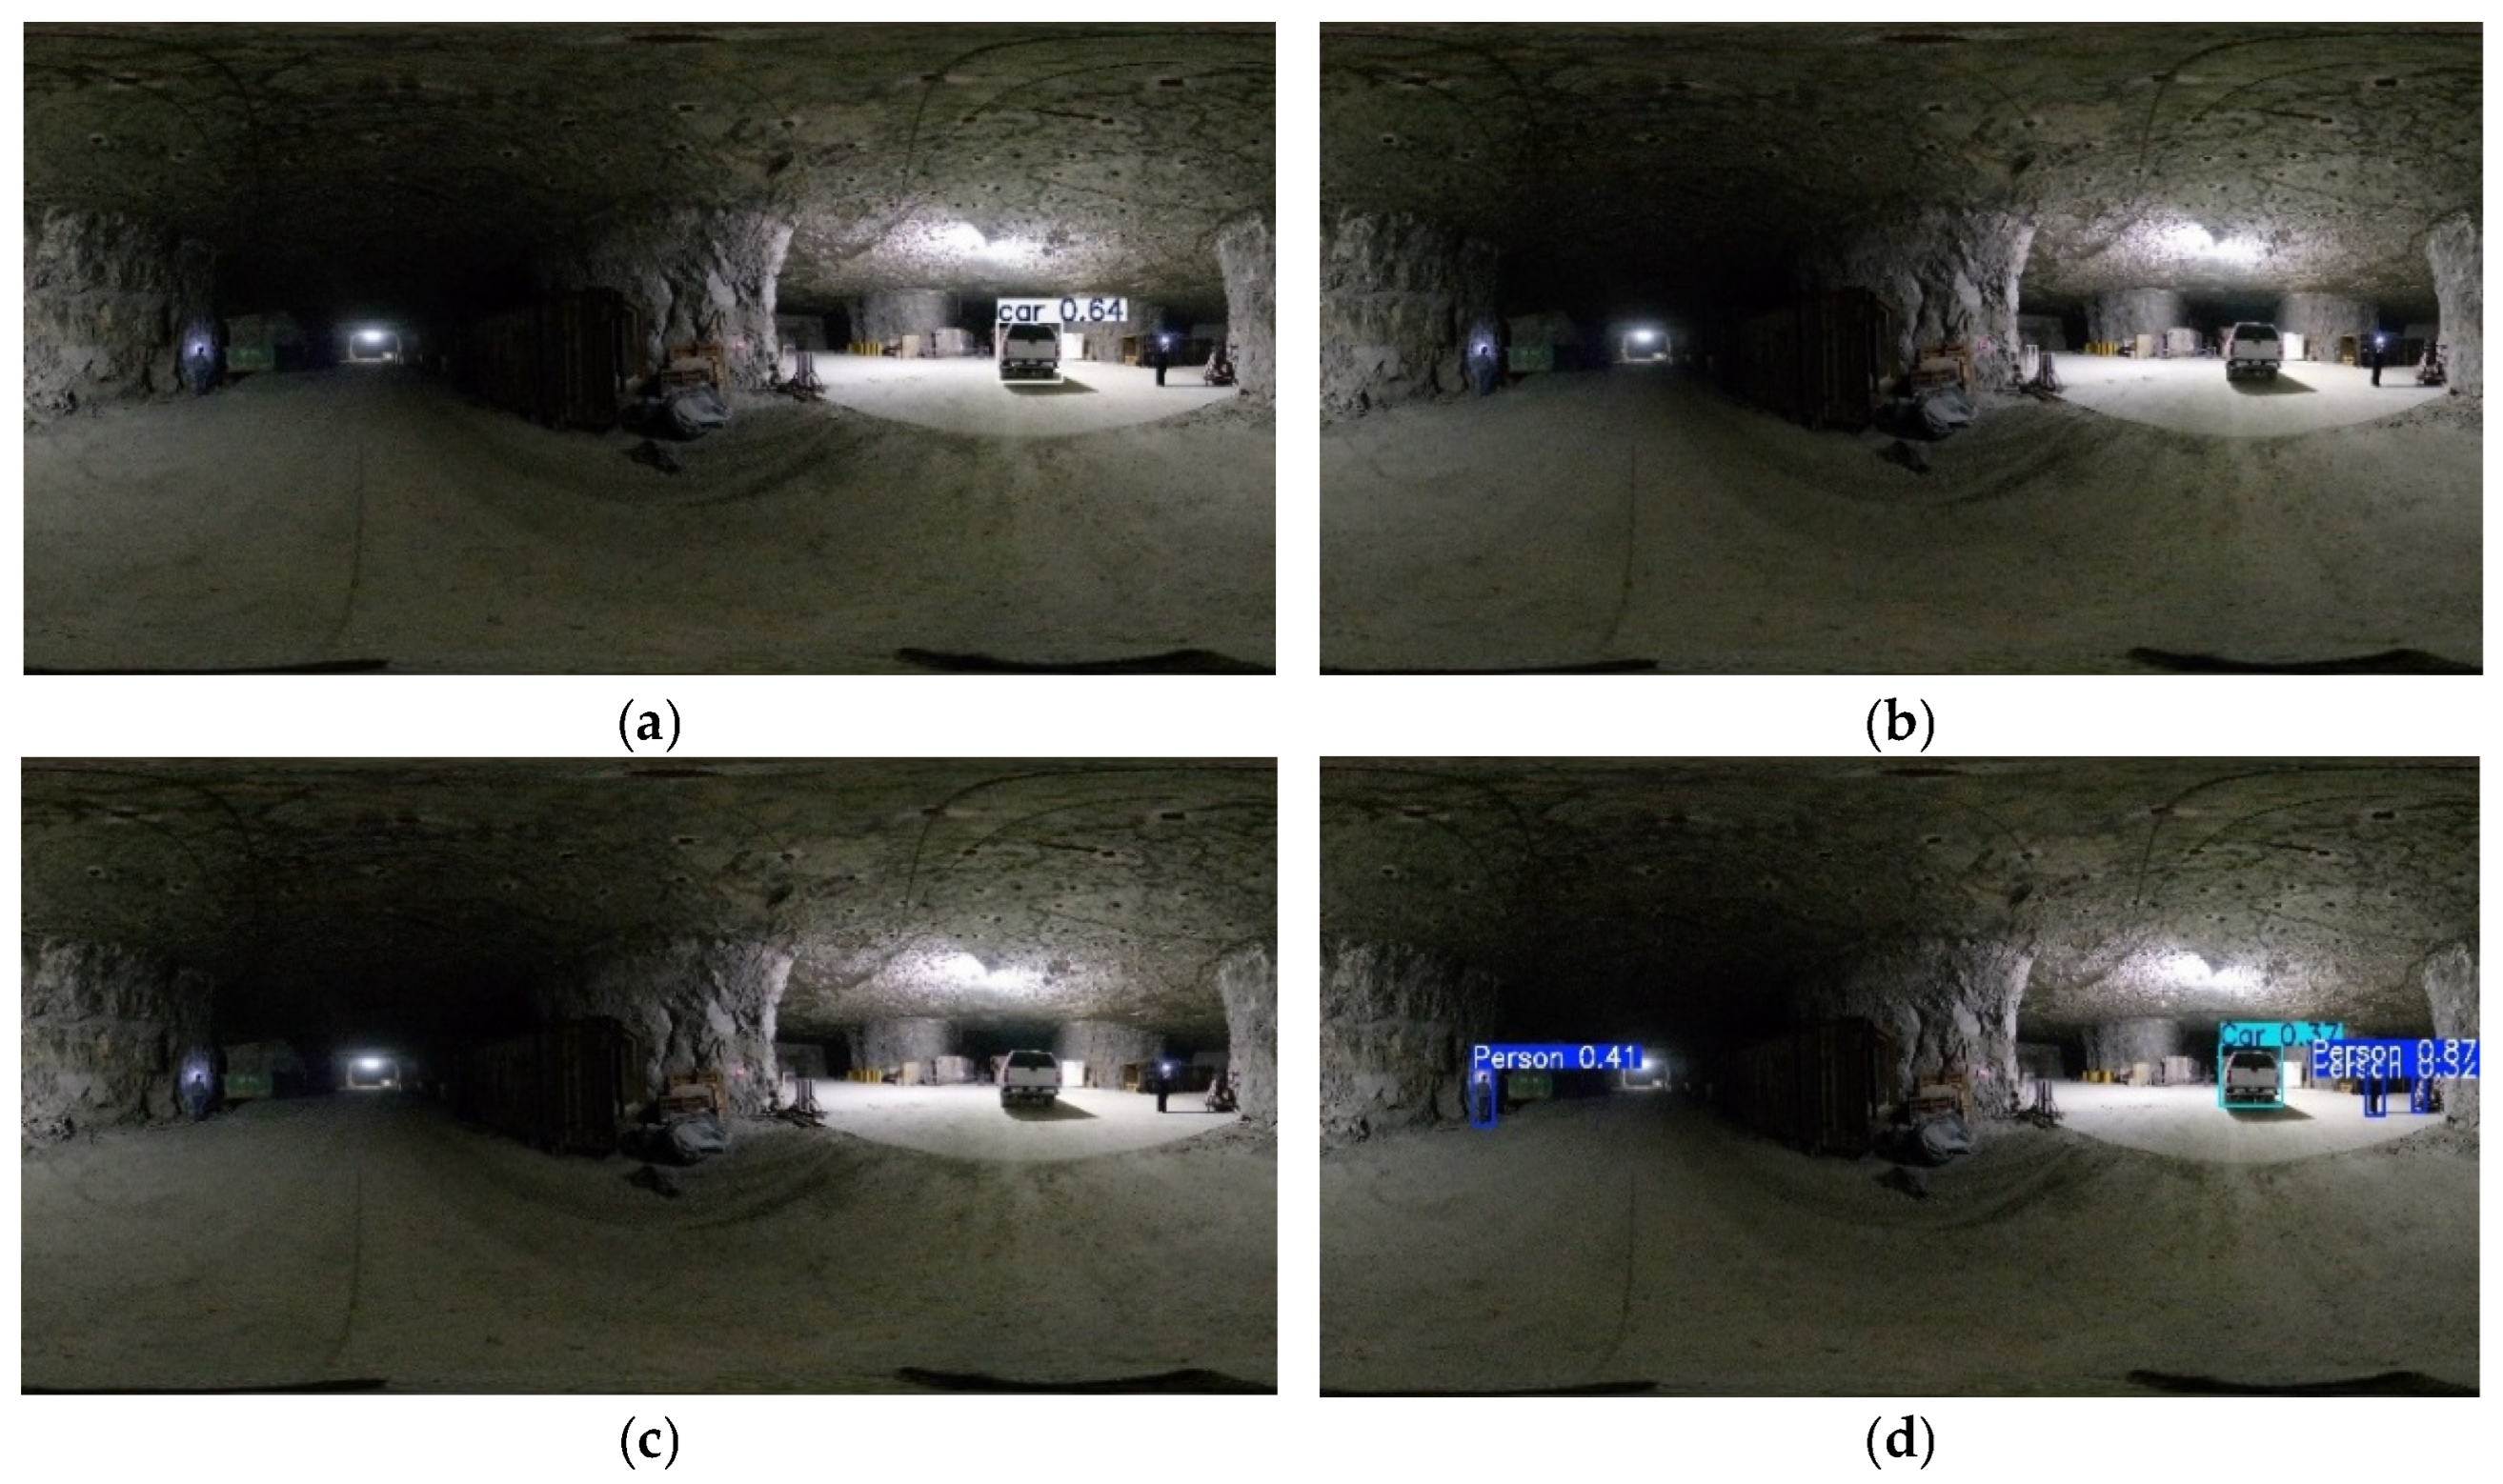
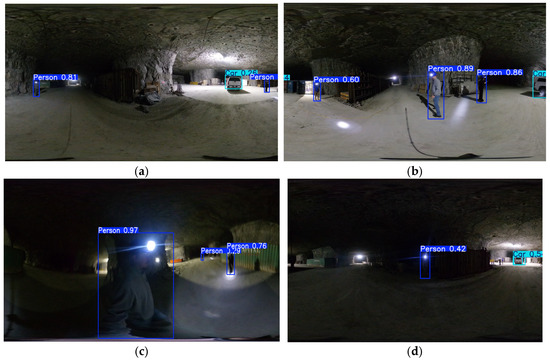
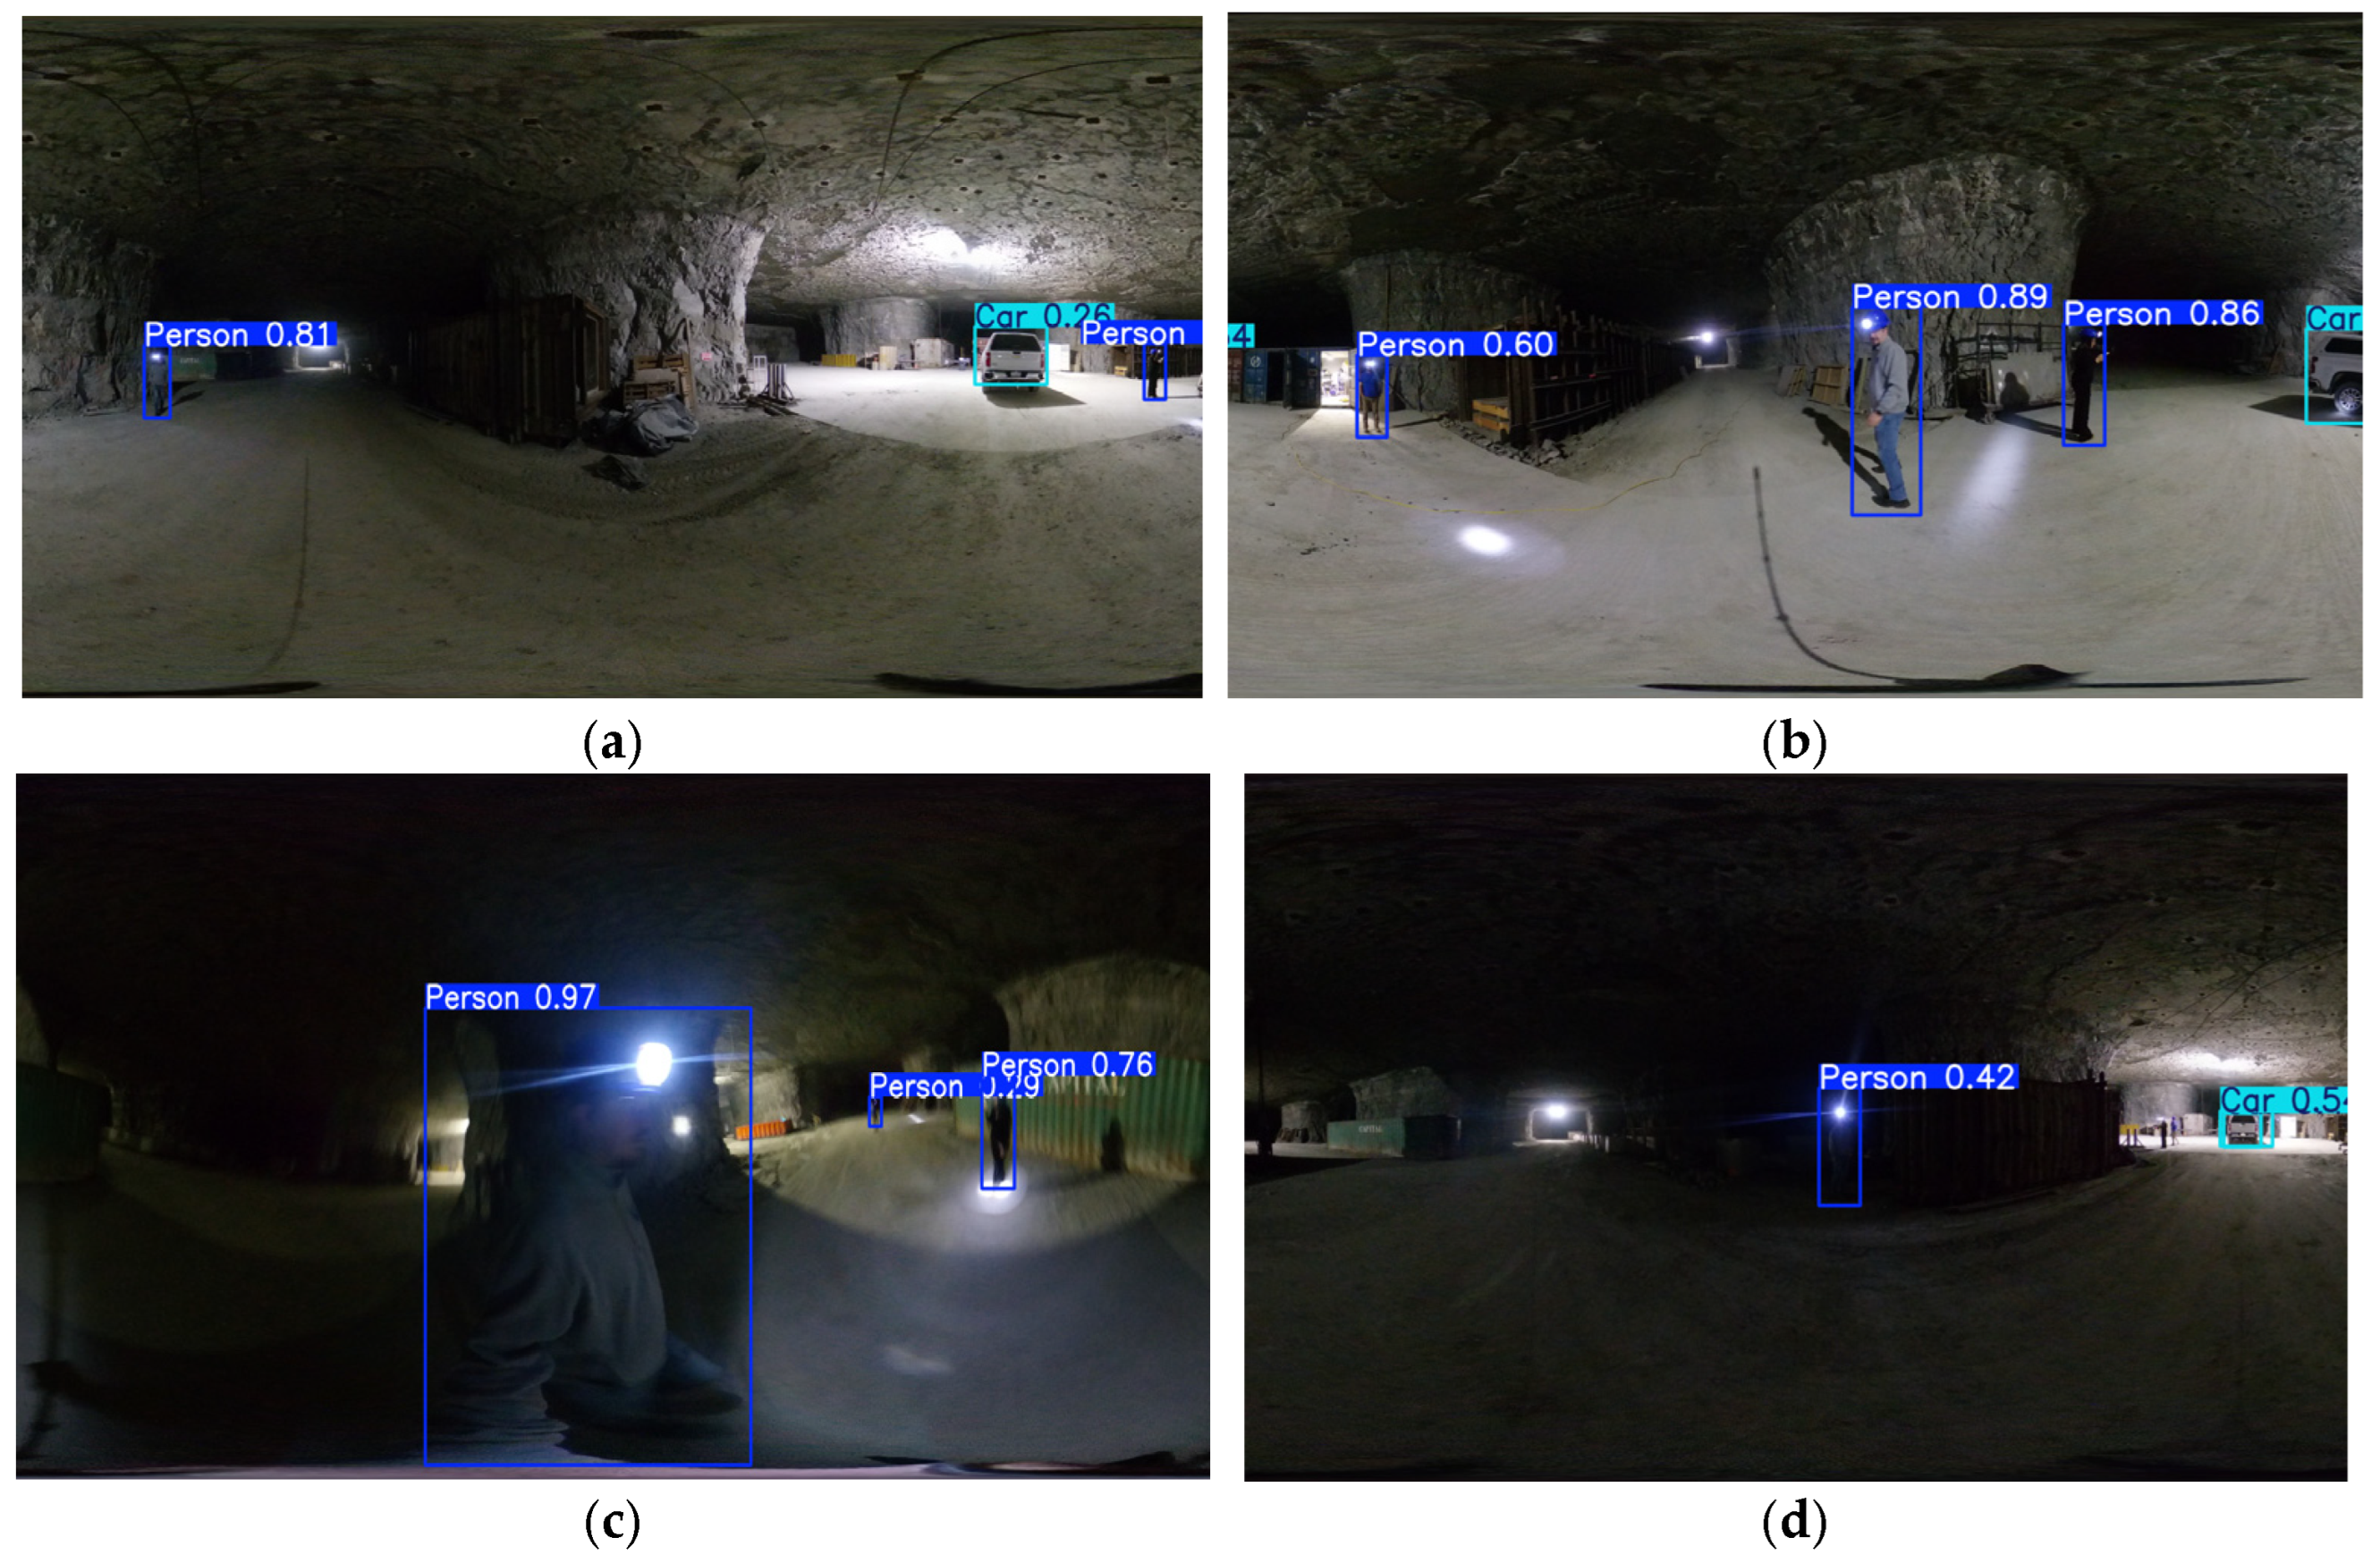
Figure 7 compares the detections produced by YOLOv5nu, YOLOv8n, YOLO11n, and the fine-tuned YOLO model on the same underground scene. The pretrained models frequently missed one of the objects or produced low-confidence predictions, especially under low illumination or partial occlusion. In contrast, the fine-tuned model consistently detected both the person and car with higher and more stable confidence scores. These qualitative results demonstrate the clear improvement gained through fine-tuning and confirm that the fine-tuned YOLO model was the most robust and effective architecture for underground mine imagery. Figure 8 shows more examples of the performance of the fine-tuned YOLO model in different underground scenes.
Figure 7.
2D detection performance comparison of (a) YOLOv5nu, (b) YOLOv8n, (c) YOLO11n, and (d) the Fine-tuned YOLO model on the testing data for Underground Scene 1.
Figure 8.
2D detection performance comparison of different scenarios using Fine-tuned YOLO model. (a) First scene, (b) Second scene, (c) Third scene, and (d) Fourth scene using testing data.
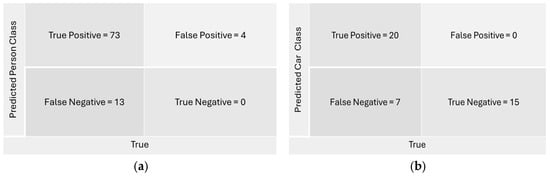
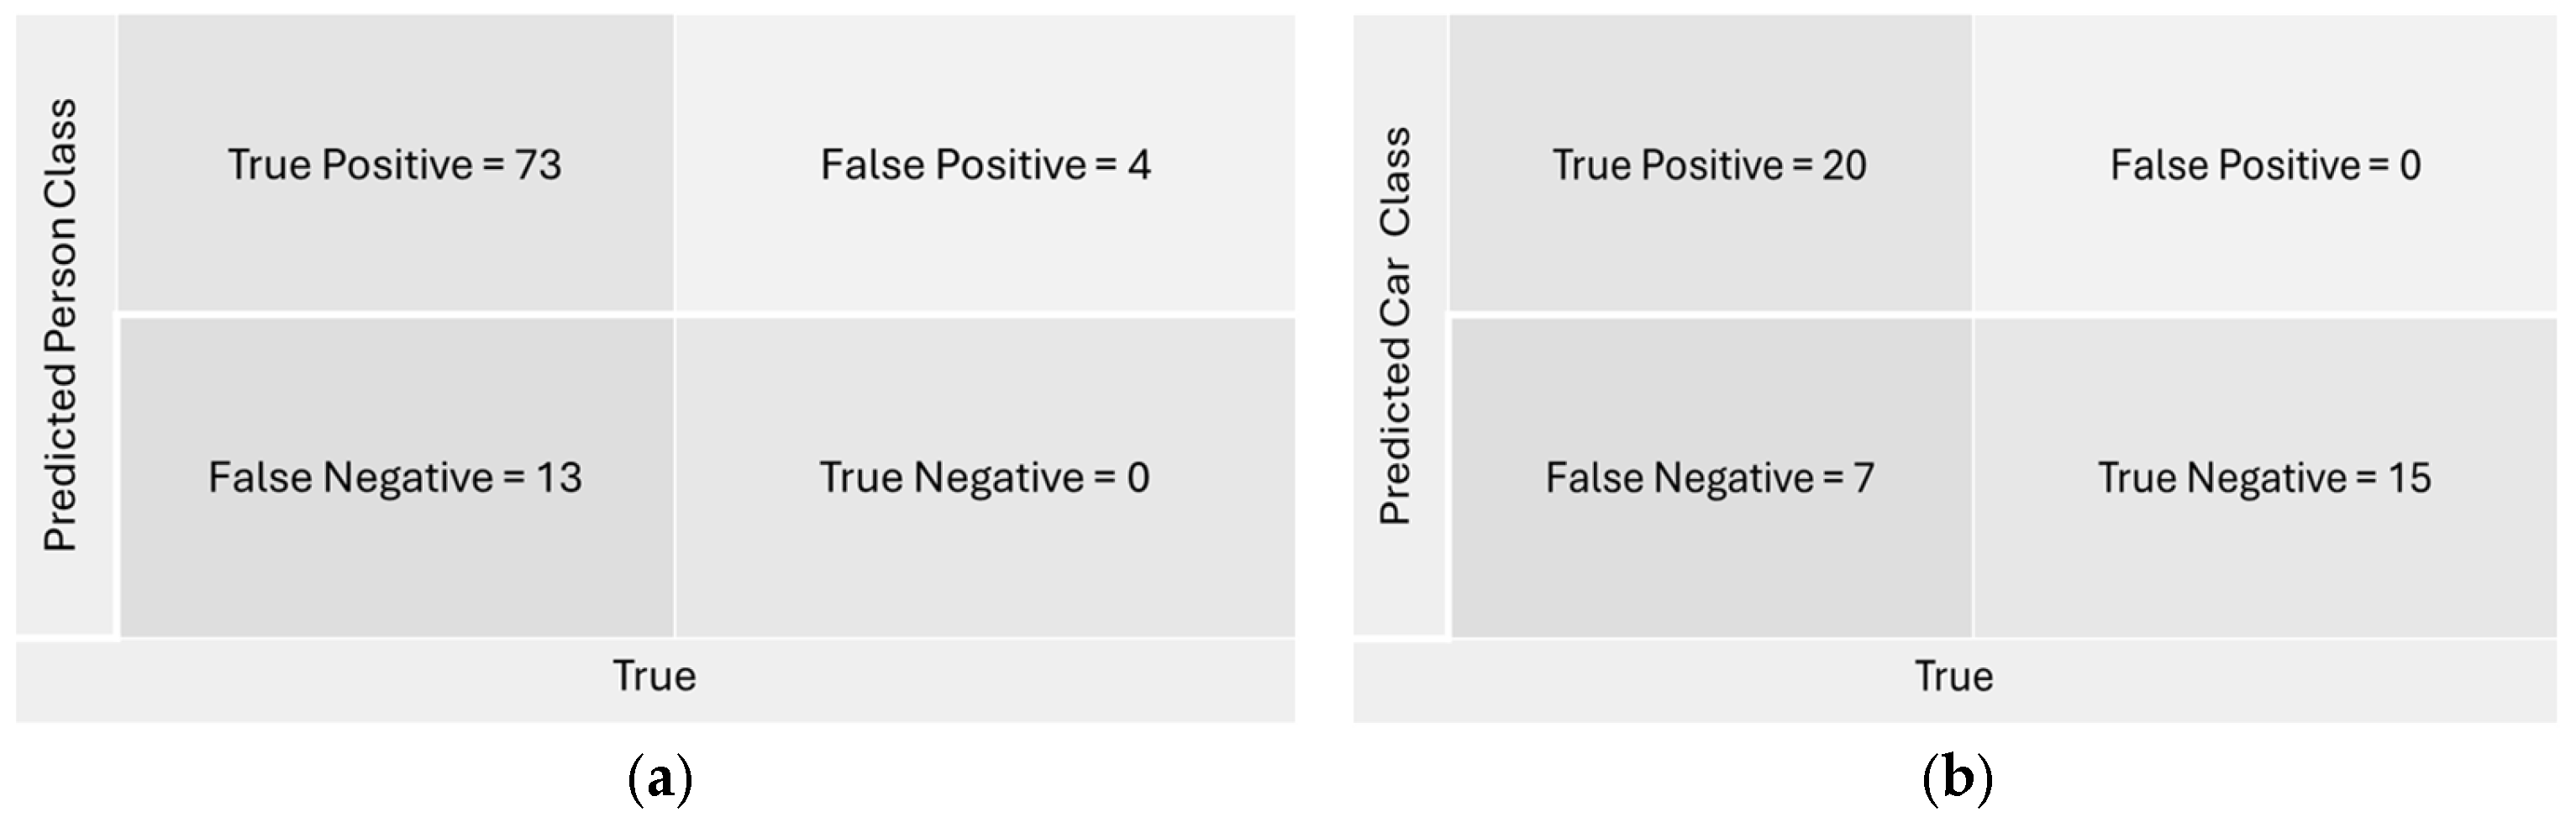
The fine-tuned YOLOv8n model demonstrated strong performance on both classes. For the person class, as shown in Figure 9a, it produced 73 true positives, 13 false negatives, and 4 false positives, indicating generally high accuracy with occasional missed detections in shadowed or partially occluded regions. For the car class, as shown in Figure 9b, the model achieved 20 true positives and 7 false negatives, along with 15 true negatives and no false positives, confirming reliable detection and a low tendency to misidentify non-vehicle scenes.
Figure 9.
Confusion Matrix of (a) Person class and (b) Car class in Fine-tuned YOLOv8n 2D object-detection.
4.2. 3D Object Detection
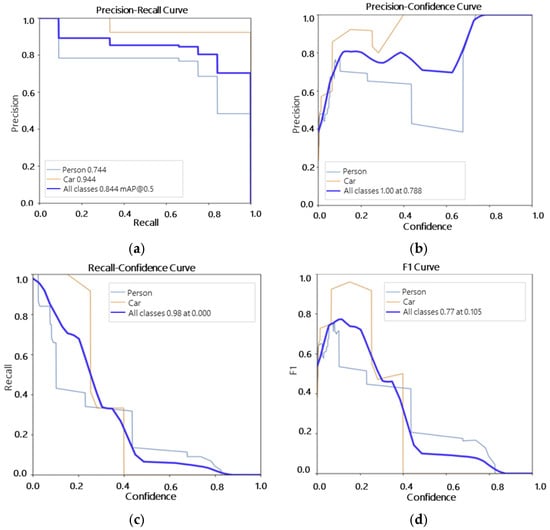
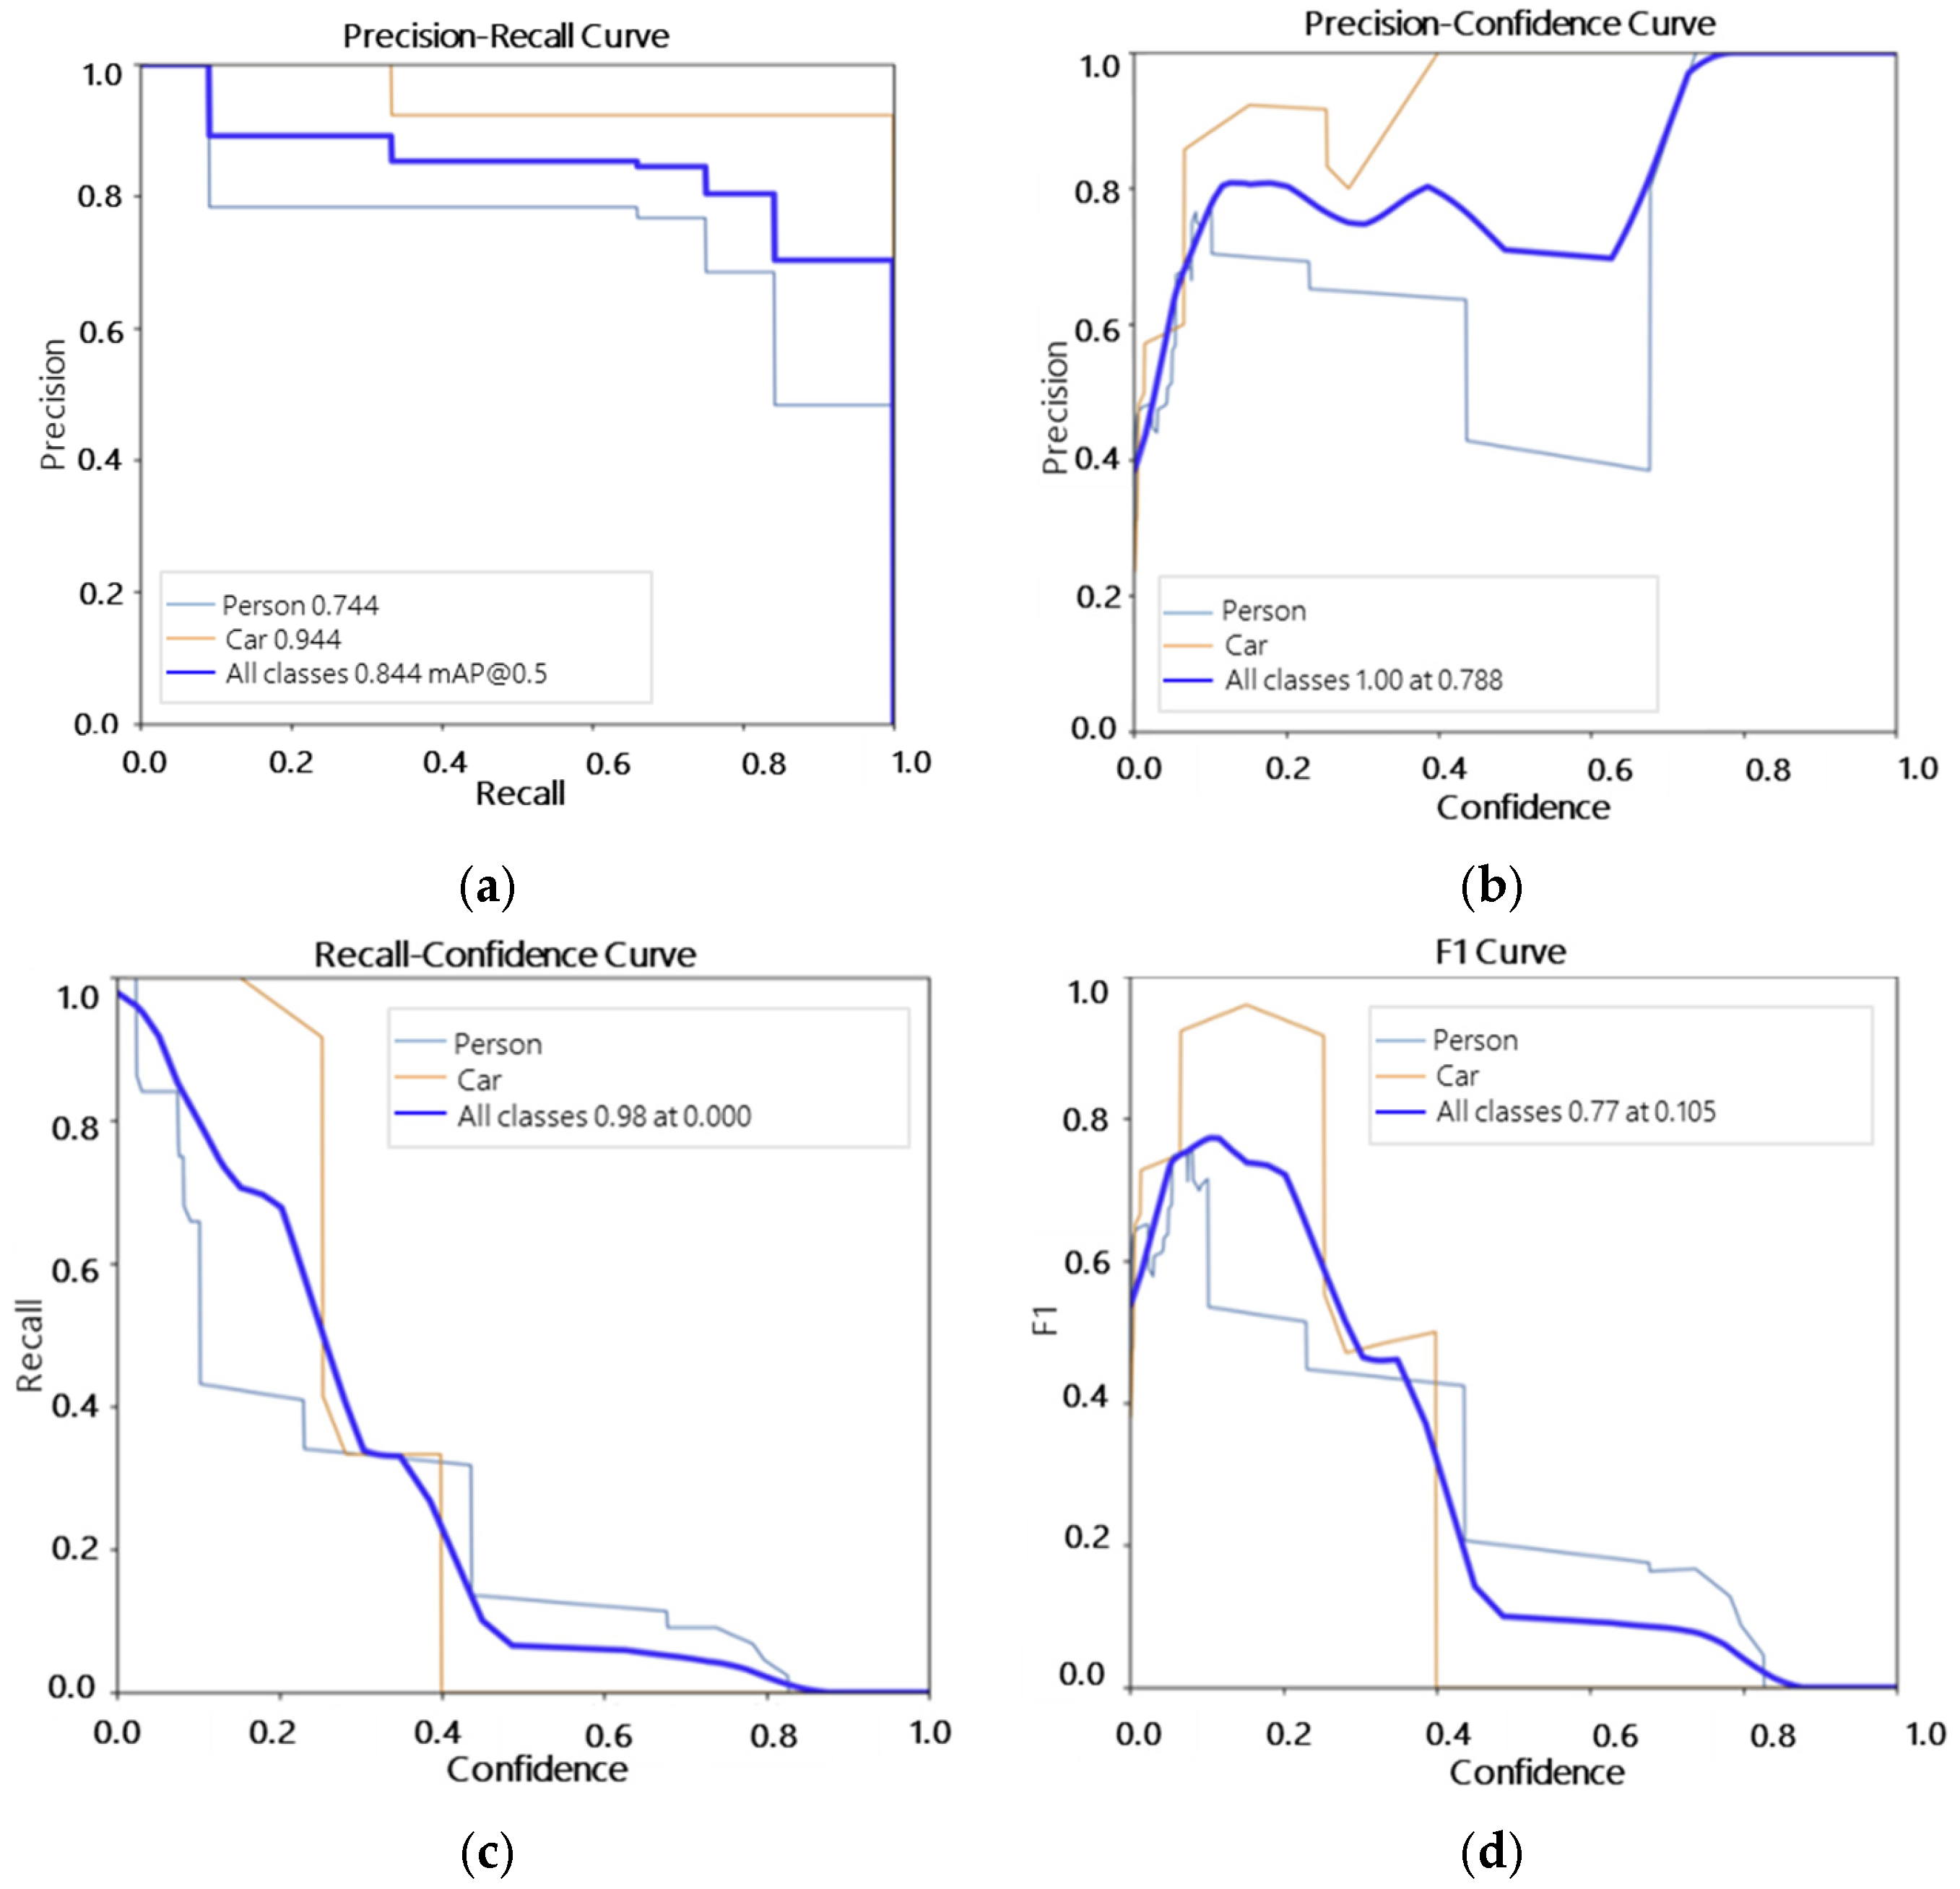
Table 5 shows that the model achieved strong overall performance, with a precision of 0.795, recall of 0.716, and mAP@0.5 of 0.844, remaining stable under the stricter mAP@0.5:0.95 metric (0.469). The person class reached a precision of 0.703 and recall of 0.431, reflecting accurate detections when present but limited recall due to sparse LiDAR projections and partial visibility. In contrast, the car class performed best, achieving precision = 0.888, recall = 1.000, and mAP@0.5 = 0.944, supported by clearer geometric features in the projected images. These differences are evident in Figure 10, where the car curves remain consistently higher across the plots, while the person curves drop earlier, confirming that vehicles were detected more reliably than people in the 2D projections.
Table 5.
Fine-tuned YOLOv8n 3D object-detection model metrics performance results for person and car classes.
Figure 10.
Fine-tuned YOLOv8n 3D object-detection model performance for the person and car classes: (a) Precision–Recall Curve; (b) Precision–Confidence Curve; (c) Recall–Confidence Curve; (d) F1–Confidence Curve.
The evaluation curves in Figure 10 illustrate the performance differences between the two classes. In the Precision–Recall curve, as shown in Figure 10a, the car class remains high and stable, reaching an mAP@0.5 of 0.944, while the person curve declines more quickly to 0.744 due to false negatives caused by limited visibility and occlusion. The Precision–Confidence curve, as shown in Figure 10b, shows a similar pattern: car detections approach near-perfect precision at higher confidence thresholds, whereas person precision levels off earlier, indicating greater sensitivity to false positives. In the Recall–Confidence curve, as shown in Figure 10c, the car class maintains high recall across most thresholds, while person recall drops sharply even at lower confidence values. Finally, the F1–Confidence curve, as shown in Figure 10d, shows that cars achieve their best balance between precision and recall at around 0.7 confidence, while the person class peaks lower, reflecting its weaker overall detection reliability.
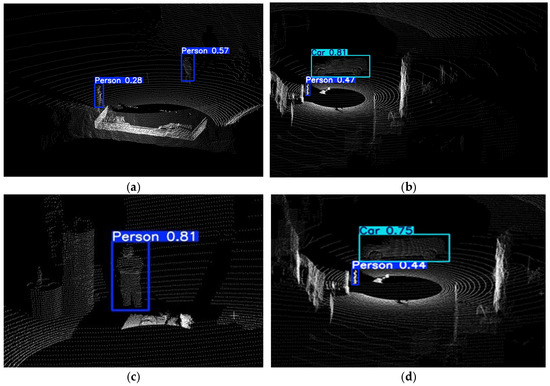
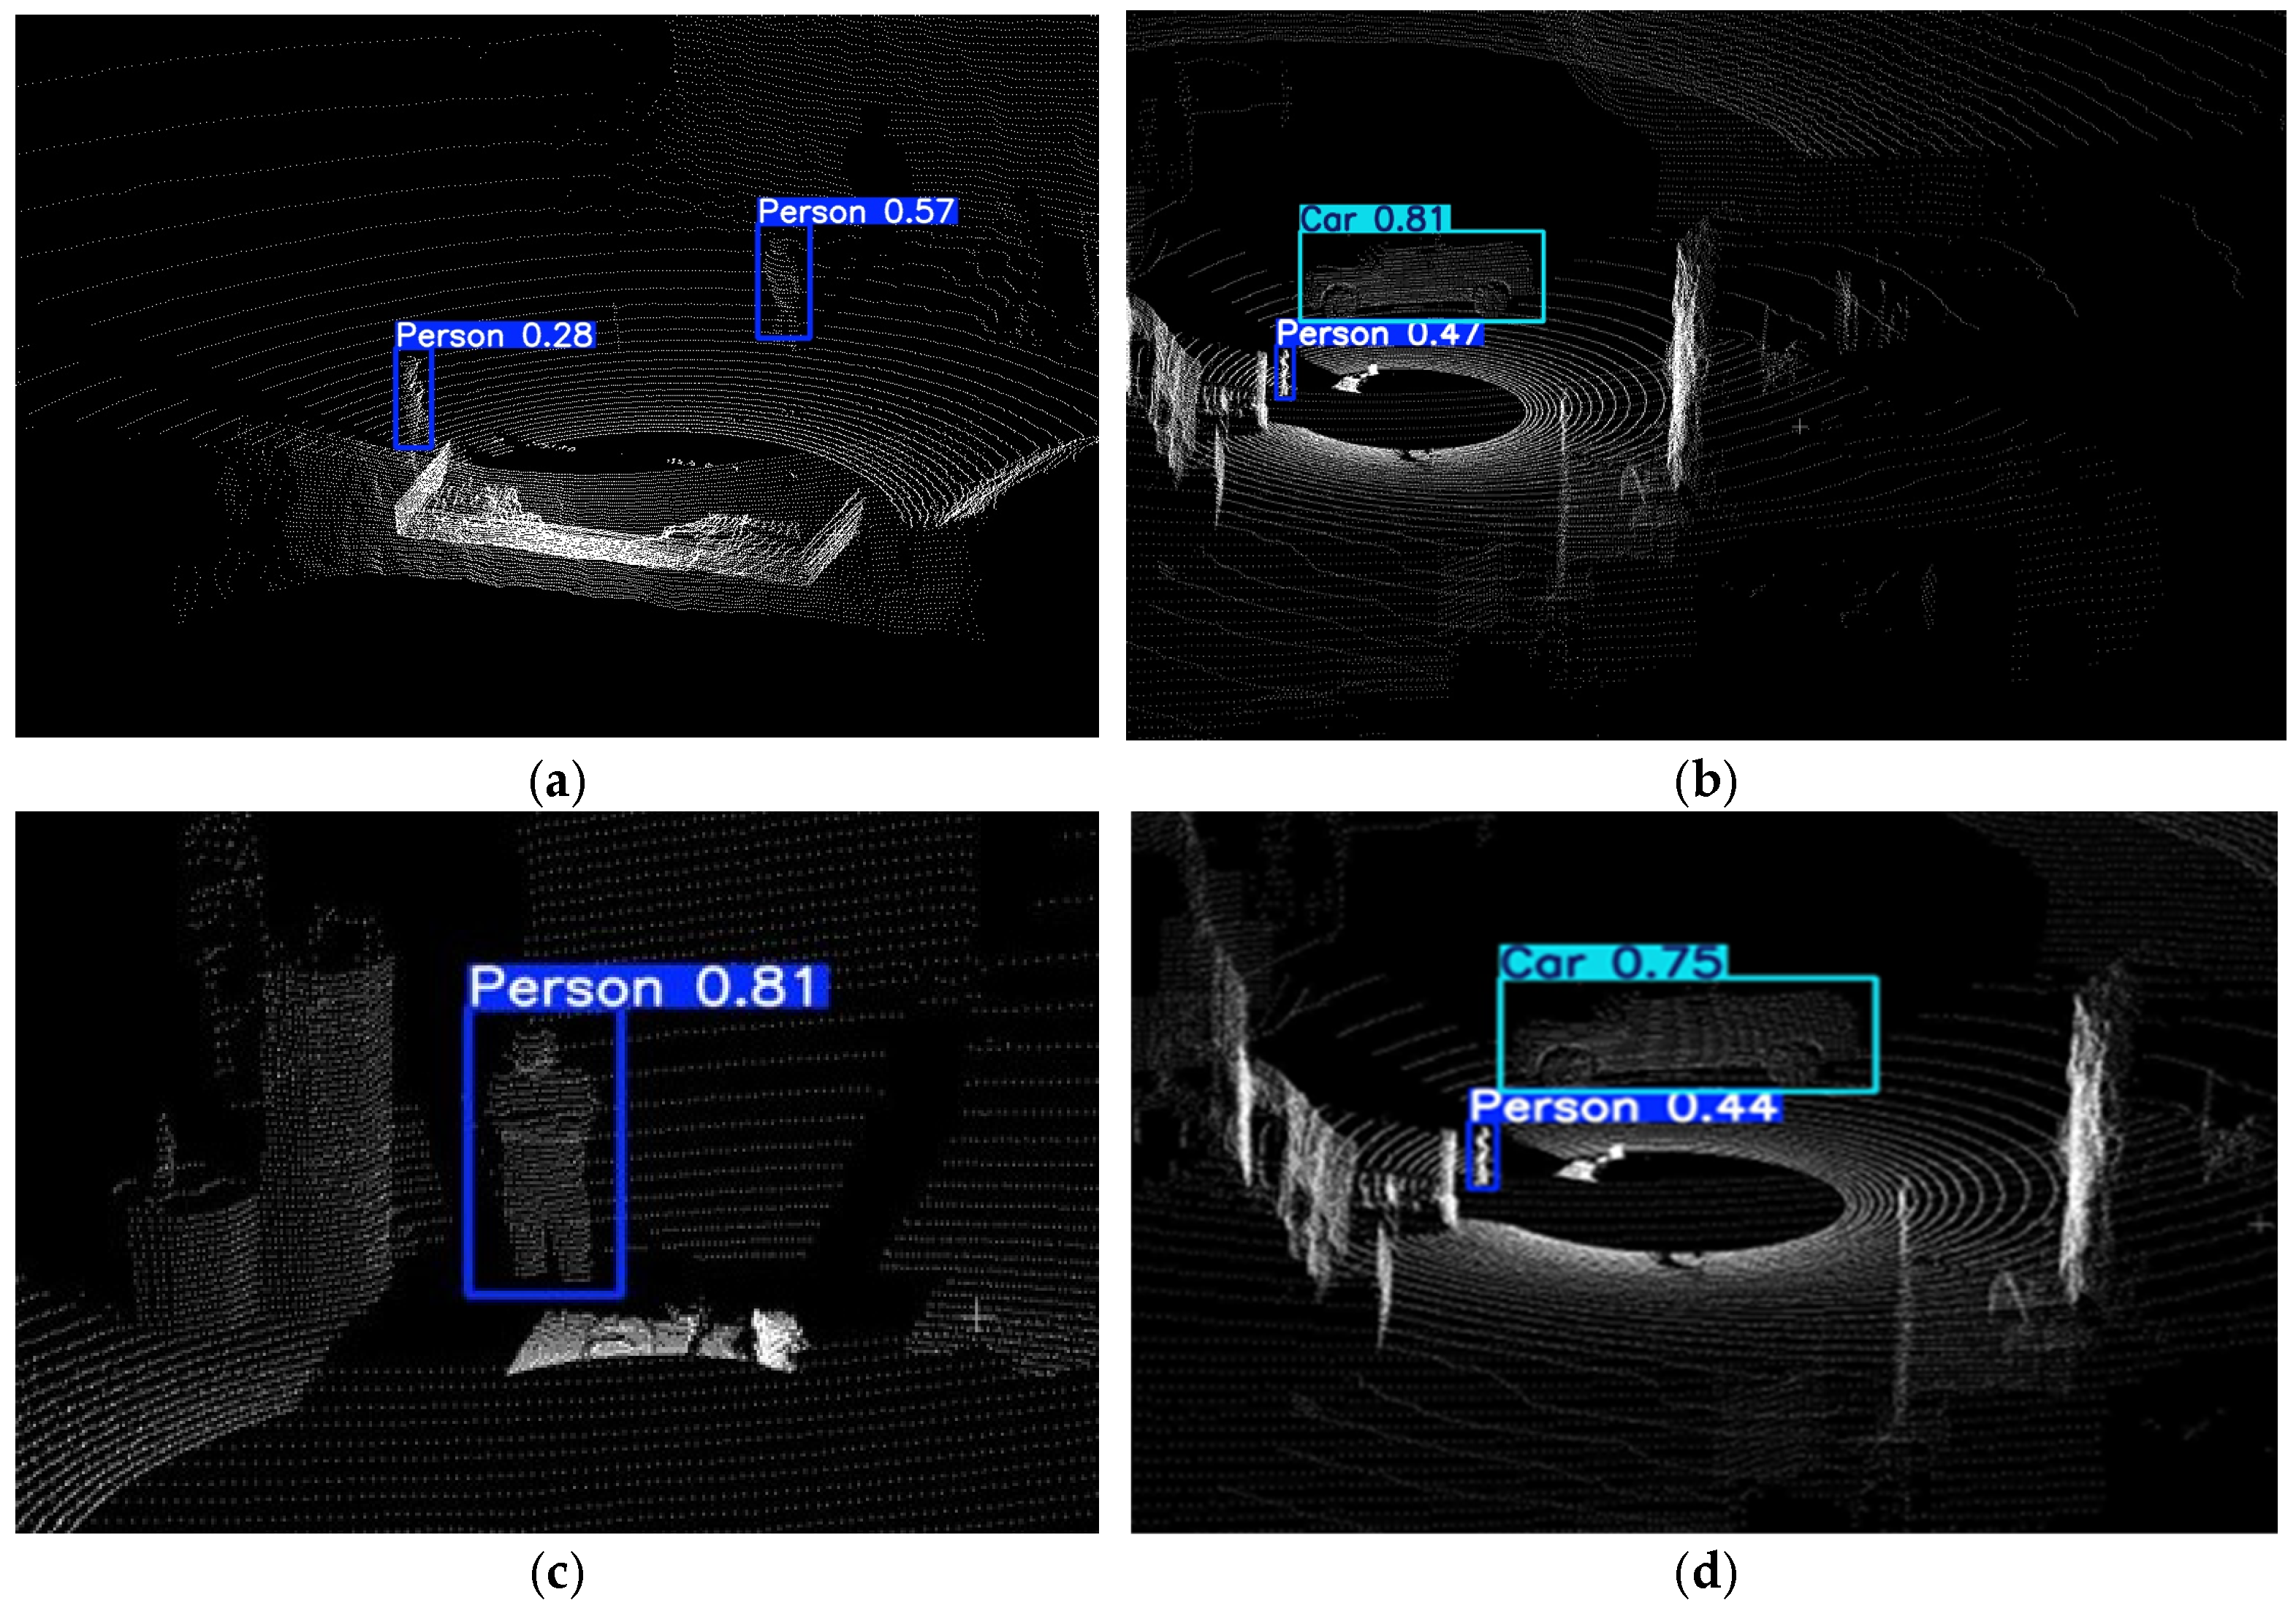
Table 6 summarizes the confidence scores obtained from the fine-tuned YOLOv8n model after evaluating the test dataset. The person class reached a mean confidence of 0.68 ± 0.12, while the car class achieved a higher and more stable mean confidence of 0.77 ± 0.12. These results show that the model was generally more certain and consistent when detecting vehicles than people in the underground test images. And Figure 11 shows some representative examples of object detection in 2D projected data.
Table 6.
Mean and standard deviation of person and car confidence scores in the 3D testing results obtained with the fine-tuned YOLOv8n mode.
Figure 11.
3D detection performance in different 2D projection scenes: (a) First scene, (b) Second scene, (c) Third scene, and (d) Fourth scene using testing data.
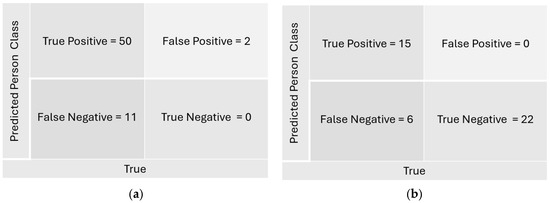
The model demonstrated strong performance on both classes. For the person class, as shown in Figure 12a, it produced 50 true positives, 11 false negatives, and 2 false positives, indicating generally high accuracy with occasional missed detections. For the car class, as shown in Figure 12b, the model achieved 15 true positives and 6 false negatives, along with 22 true negatives and no false positives, confirming reliable detection and a low tendency to misidentify non-vehicle scenes.
Figure 12.
Confusion Matrix of (a) Person class and (b) Car class in Fine-tuned YOLOv8n 3D object-detection.
5. Discussion
5.1. 2D Object Detection
The comparison among YOLOv5nu, YOLOv8n, and YOLO11n shows that all pretrained models detected vehicles more accurately than people when applied directly to the underground dataset. This difference is not only a model-bias issue but reflects deeper geometric constraints of underground scenes. Vehicles are large, rigid, and have stable geometric features such as flat surfaces, edges, and consistent silhouettes which remain identifiable even under low illumination. In contrast, underground personnel appear as small, irregular, and often partially occluded shapes whose outlines change with pose and shadow. Their smaller pixel footprint and weaker contrast make them harder to localize, revealing why human detection in mines is fundamentally more fragile and cannot rely on COCO-trained models without domain-specific adaptation.
After fine-tuning, the YOLOv8n model showed clear improvements across both classes, confirming that the model successfully learned underground-relevant features such as headlamps and characteristic shapes of miners and equipment. However, performance differences between classes persisted, and the evaluation on 360° images further highlighted unique challenges. Panoramic imagery introduces cylindrical distortion, stretching objects near the edges and compressing them near the center. This distortion changes the apparent geometry of vehicles and people, affecting confidence differently across viewpoints. Vehicles, whose overall shape is preserved across distortions, displayed fluctuating confidence due to reflections and uneven lighting rather than misidentification. People, despite appearing smaller, benefited from fine-tuning: confidence became more consistent, showing that underground-specific features generalized well even under 360° distortion. These findings suggest that panoramic imaging is viable for underground detection, but models must be trained or at least adapted with representative examples to handle distortions and lighting non-uniformity.
5.2. 3D Object Detection
The validation results confirmed that the fine-tuned model performed reliably on LiDAR-based 2D projections, but the gap between detecting vehicles and people reveals how LiDAR geometry fundamentally shapes object visibility. Vehicles occupy a larger volumetric space and return denser point distributions, making their contours more complete and easier to map into structured 2D bins. Human bodies, in contrast, are represented by sparse and incomplete point clusters, especially when standing sideways or partially occluded. Their small footprint in the scan leads to inconsistent silhouettes when projected, which explains the weaker performance in both validation and testing.
The choice of LiDAR projection strategy influenced both detection behavior and overall workflow practicality. In this study, scans were collected from stationary, horizontally oriented viewpoints typical of underground inspection rather than from elevated positions. Consequently, conventional bird’s-eye-view (BEV) representations, commonly used by native 3D detectors such as PointPillars, were not well aligned with the acquisition geometry. BEV-based methods are typically designed for vehicle-mounted LiDAR systems that observe objects from above, producing relatively complete object footprints. In contrast, the underground scans acquired here resulted in partial, anisotropic object geometries and fragmented human point returns, particularly under occlusion and limited coverage.
To address these constraints, a custom virtual viewpoint was defined through sequential rotations of the point cloud, followed by projection onto a vertical plane. This strategy preserves the apparent height and lateral extent of targets while generating structured 2D representations compatible with lightweight YOLO-based detectors. Given the limited size of the annotated underground dataset and the objective of developing a practical framework for rapid post-event assessment in resource-constrained environments, the projection-based approach was selected as an appropriate baseline. Nevertheless, the results demonstrate the feasibility of LiDAR-based object detection in underground settings and motivate future investigation of native 3D detectors when multi-view coverage and larger annotated datasets become available.
Beyond detection performance, the LiDAR point-cloud pipeline also enables quantitative change assessment because it preserves metric geometry. Once scans are registered, object locations can be expressed in a consistent frame and compared across time to estimate displacement. This directly supports post-event underground decision-making in GNSS-denied environments by helping operators determine whether equipment has shifted, whether obstructions may have appeared, and how the scene has changed without requiring immediate human re-entry. While this study demonstrates centroid-based vehicle displacement, the same approach can be generalized to other assets, provided registration uncertainty and partial occlusion are controlled.
Across underground tests, missed detections were dominated by recurring operating conditions rather than random errors. (i) Distance/scale: at longer standoff distances, personnel occupy a small pixel footprint in the 360° panorama and become harder to separate from textured tunnel backgrounds, reducing detector confidence. (ii) Pose/viewing angle: non-frontal or unusual body poses (bending, crouching, side-view) and panoramic distortion near the image periphery alter the apparent human geometry and can suppress detections. (iii) Occlusion: partial visibility behind equipment, rib/mesh, or uneven tunnel geometry frequently removes key body cues needed for person detection. (iv) Illumination/contrast: deep shadows, non-uniform lighting, and glare from headlamps or reflective surfaces reduce contrast and wash out features, producing false negatives even when no false positives are introduced. For the LiDAR projection pipeline, these effects are compounded by sparse or fragmented human point returns, especially under range and self-occlusion, which can yield incomplete silhouettes after projection. These failure modes explain why recall—particularly for the person class—remained the primary limitation, and they motivate future improvements via targeted underground data collection, distortion/lighting-aware augmentation, and temporal tracking to recover intermittent misses. Although the experiments in this study were conducted within a specific underground mine layout, the proposed 2D–3D detection framework is not mine-specific. It is designed for GNSS-denied, confined, and visually degraded operational spaces where rapid remote situational assessment is required. The framework generalizes by preserving the overall sensing and processing structure while adapting geometry- and site-dependent parameters rather than requiring structural redesign.
The core stages of the pipeline—(i) wide-field imaging for global scene context, (ii) LiDAR-based metric scene capture, (iii) scan registration to a consistent coordinate frame, (iv) conversion of 3D geometry into structured 2D representations compatible with efficient detectors, and (v) object localization and multi-epoch change quantification—remain unchanged across environments. Differences in tunnel width, height, curvature, sensor mounting configuration, and corridor layout primarily influence point density, viewing angles, and object visibility but do not alter the acquisition strategy.
Generalization is achieved through parameter adaptation and data-driven refinement. At the representation level, rotation angles, projection-plane orientation, and discretization resolution can be retuned to align dominant structural axes and object-facing surfaces with the image plane. At the detection level, environment-specific fine-tuning and augmentation account for changes in scale, perspective, illumination, occlusion patterns, and clutter.
Consequently, the framework can be extended to other underground and industrial settings such as transportation tunnels (rail/metro), underground construction and utility corridors, storage galleries, and industrial facilities (e.g., warehouses or processing plants) where illumination is non-uniform and access may be restricted during abnormal events. While such environments may introduce additional challenges—including reflective surfaces, steam, smoke, or denser dynamic traffic—these factors can be addressed through targeted augmentation strategies and temporal filtering.
6. Conclusions
This study demonstrated that LiDAR and 360° imaging, when combined with machine learning, can form an effective foundation for automated hazard detection in underground mines. By integrating 2D vision methods and 3D spatial analysis within a unified YOLO-based framework, the system provided reliable detection under low illumination and complex underground geometry, supporting the development of remote monitoring tools for post-disaster conditions.
The 360° imaging component produced a fine-tuned YOLOv8n model capable of detecting people and vehicles in challenging underground scenes, confirming the importance of domain-specific training. The LiDAR component extended this capability by projecting point clouds into 2D space, allowing the model to recognize objects with stable precision and interpret spatial cues necessary for tracking and localization. Machine learning served as the central mechanism that linked both sensing modalities, enabling autonomous classification and demonstrating strong generalization to real mine imagery. In addition, ICP-registered multi-epoch LiDAR scans enabled a centroid-based vehicle displacement estimate, demonstrating that the framework can quantify object-level movement for post-event assessment in GNSS-denied underground environments.
Together, the combined 2D and 3D detection systems offer complementary strengths for remote safety assessment. The panoramic camera provided broad situational context, while LiDAR supplied detailed spatial information, forming a proof-of-concept multi-sensor framework capable of supporting rapid hazard identification in post-disaster underground environments. Although still experimental, these results represent an important step toward automated remote inspection systems that enhance safety and decision-making in hazardous mining conditions.
7. Limitations
The 2D detection framework was limited by low illumination, heavy shadowing, and a small number of real underground images, which reduced visibility and contributed to missed detections. Public datasets helped expand training but did not fully match underground lighting or geometry, and 360° images introduced edge distortion that affected bounding-box accuracy. Manual annotation was time-consuming, and performance was evaluated only on still images, leaving real-time behavior untested.
The 3D detection framework was constrained by the LiDAR setup and underground conditions. The stationary OS1-070-64 provided incomplete coverage, producing partial reconstructions and uneven point densities due to occlusions and irregular surfaces. Small alignment errors accumulated during registration, and Poisson reconstruction remained sensitive to parameter choices, especially in sparse regions where limited point data reduced surface accuracy.
8. Future Work
Future work should expand the 2D detection framework by collecting more real underground images with diverse lighting, dust, and activity levels to improve model robustness. For 3D detection, acquiring multi-view or full-coverage LiDAR scans would reduce geometric limitations and enable more complete reconstructions of underground spaces. Native 3D object detection architectures, such as Point Pillars and BEV-based representations, could further enhance detection accuracy and computational efficiency. Combining LiDAR depth with 360° visual information is another promising direction, as multimodal fusion could improve object recognition under partial visibility or poor lighting. Finally, real-time field deployment, either portable or vehicle-mounted, will be essential to evaluate system latency, reliability, and practical integration into mine safety operations. Finally, future work will evaluate cross-domain transfer of the framework to other GNSS-denied underground and industrial environments (e.g., transportation tunnels, underground construction/utility corridors, and indoor industrial facilities) by quantifying how much additional site-specific data and fine-tuning are required to maintain detection and change-quantification reliability.
Author Contributions
Conceptualization, A.F.P.T.P. and R.B.; methodology, A.F.P.T.P., R.B. and S.S.; software, A.F.P.T.P.; validation, A.F.P.T.P., R.B. and S.S.; formal analysis, A.F.P.T.P. and R.B.; investigation, A.F.P.T.P.; resources, A.F.P.T.P.; data curation, A.F.P.T.P., R.B. and S.S.; writing—original draft preparation, A.F.P.T.P.; writing—review and editing, R.B., S.S. and P.R.; visualization, A.F.P.T.P. and R.B.; supervision, P.R.; project administration, P.R.; funding acquisition, P.R. All authors have read and agreed to the published version of the manuscript.
Funding
This study was funded by the National Institute for Occupational Safety and Health (NIOSH) under the award #U60OH012685.
Institutional Review Board Statement
Not applicable.
Informed Consent Statement
Not applicable.
Data Availability Statement
The data collected at UKERT cannot be publicly shared, as the facility is private property of the University of Kentucky. Publicly available datasets used in this study are listed in the References section. Access to UKERT data may be provided upon request and subject to institutional approval.
Acknowledgments
The views, opinions, and recommendations expressed herein are solely those of the authors and do not necessarily reflect the views of NIOSH. Mentions of trade names, commercial products, or organizations do not imply endorsement by the authors nor the funding organization.
Conflicts of Interest
The authors declare no conflict of interest.
References
- Roberts, A. Lighting and Visibility in Mines. Trans. Illum. Eng. Soc. 1955, 20, 15–36. [Google Scholar] [CrossRef] [Scilit]
- Ranjan, A.; Zhao, Y.; Sahu, H.B.; Misra, P. Opportunities and Challenges in Health Sensing for Extreme Industrial Environment: Perspectives from Underground Mines. IEEE Access 2019, 7, 139181–139195. [Google Scholar] [CrossRef] [Scilit]
- Essien, E.; Frimpong, S. Enhancing Autonomous Truck Navigation in Underground Mines: A Review of 3D Object Detection Systems, Challenges, and Future Trends. Drones 2025, 9, 433. [Google Scholar] [CrossRef] [Scilit]
- Siahidouzazar, S.; Sharmba, T.; Rezaee, M.; Rubasinghege, G.; Arnold, B.J.; Roghanchi, P. A review of respirable crystalline silica dust concentration, characteristics, toxicity, and regulation in US metal and nonmetal mines. J. Hazard. Mater. 2025, 497, 139733. [Google Scholar] [CrossRef] [Scilit]
- Cruz-Ausejo, L.; Cama-Ttito, N.A.; Solano, P.F.; Copez-Lonzoy, A.; Vera-Ponce, V.J. Occupational accidents in mining workers: Scoping review of studies published in the last 13 years. BMJ Open 2024, 14, e080572. [Google Scholar] [CrossRef] [Scilit]
- Baghaei Naeini, S.A.; Badri, A. Identification and categorization of hazards in the mining industry: A systematic review of the literature. Int. Rev. Appl. Sci. Eng. 2024, 15, 1–19. [Google Scholar] [CrossRef] [Scilit]
- Groves, W.A.; Kecojevic, V.J.; Komljenovic, D. Analysis of fatalities and injuries involving mining equipment. J. Saf. Res. 2007, 38, 461–470. [Google Scholar] [CrossRef] [Scilit]
- Liu, H.; Zhang, Z.; Dong, J.; Benndorf, J.; Jia, X.; Wang, X.; Wu, X.; Chen, G. A review of positioning technologies for personnel and equipment in underground mines. Int. J. Digit. Earth 2025, 18, 2506493. [Google Scholar] [CrossRef] [Scilit]
- Seguel, F.; Palacios-Jativa, P.; Azurdia-Meza, C.A.; Krommenacker, N.; Charpentier, P.; Soto, I. Underground Mine Positioning: A Review. IEEE Sens. J. 2022, 22, 4755–4771. [Google Scholar] [CrossRef] [Scilit]
- Papachristos, C.; Khattak, S.; Mascarich, F.; Alexis, K. Autonomous Navigation and Mapping in Underground Mines Using Aerial Robots. In Proceedings of the 2019 IEEE Aerospace Conference, Big Sky, MT, USA, 2–9 March 2019. [Google Scholar]
- Shahmoradi, J.; Mirzaeinia, A.; Roghanchi, P.; Hassanalian, M. Monitoring of Inaccessible Areas in GPS-Denied Underground Mines using a Fully Autonomous Encased Safety Inspection Drone. In Proceedings of the AIAA Scitech 2020 Forum, Orlando, FL, USA, 6–10 January 2020. [Google Scholar]
- Cavur, M.; Demir, E. RSSI-based hybrid algorithm for real-time tracking in underground mining by using RFID technology. Phys. Commun. 2022, 55, 101863. [Google Scholar] [CrossRef] [Scilit]
- Jiang, Y.; Chen, W.; Zhang, X.; Zhang, X.; Yang, G. Real-Time Monitoring of Underground Miners’ Status Based on Mine IoT System. Sensors 2024, 24, 739. [Google Scholar] [CrossRef] [Scilit] [PubMed]
- Jha, A.; Verburg, A.; Tukkaraja, P. Internet of Things–Based Command Center to Improve Emergency Response in Underground Mines. Saf. Health Work 2022, 13, 40–50. [Google Scholar] [CrossRef] [Scilit] [PubMed]
- Imam, M.; Baïna, K.; Tabii, Y.; Ressami, E.M.; Adlaoui, Y.; Benzakour, I.; Abdelwahed, E.H. The Future of Mine Safety: A Comprehensive Review of Anti-Collision Systems Based on Computer Vision in Underground Mines. Sensors 2023, 23, 4294. [Google Scholar] [CrossRef] [Scilit]
- Qian, M.; Zhao, K.; Li, B.; Gong, H.; Seneviratne, A. Survey of Collision Avoidance Systems for Underground Mines: Sensing Protocols. Sensors 2022, 22, 7400. [Google Scholar] [CrossRef] [Scilit]
- Yang, X.; Lin, X.; Yao, W.; Ma, H.; Zheng, J.; Ma, B. A Robust LiDAR SLAM Method for Underground Coal Mine Robot with Degenerated Scene Compensation. Remote Sens. 2023, 15, 186. [Google Scholar] [CrossRef] [Scilit]
- Baek, J.; Park, J.; Cho, S.; Lee, C. 3D Global Localization in the Underground Mine Environment Using Mobile LiDAR Mapping and Point Cloud Registration. Sensors 2022, 22, 2873. [Google Scholar] [CrossRef] [Scilit]
- Ren, Z.; Wang, L.; Bi, L. Robust GICP-Based 3D LiDAR SLAM for Underground Mining Environment. Sensors 2019, 19, 2915. [Google Scholar] [CrossRef] [Scilit]
- Wang, Q.; Cheng, T.; Lu, Y.; Liu, H.; Zhang, R.; Huang, J. Underground Mine Safety and Health: A Hybrid MEREC–CoCoSo System for the Selection of Best Sensor. Sensors 2024, 24, 1285. [Google Scholar] [CrossRef] [Scilit]
- Janiszewski, M.; Torkan, M.; Uotinen, L.; Rinne, M. Rapid Photogrammetry with a 360-Degree Camera for Tunnel Mapping. Remote Sens. 2022, 14, 5494. [Google Scholar] [CrossRef] [Scilit]
- Schichler, L.; Festl, K.; Solmaz, S. Robust Multi-Sensor Fusion for Localization in Hazardous Environments Using Thermal, LiDAR, and GNSS Data. Sensors 2025, 25, 2032. [Google Scholar] [CrossRef] [Scilit]
- Liang, R.; Zhang, C.; Huang, C.; Li, B.; Saydam, S.; Canbulat, I.; Munsamy, L. Multimodal data fusion for geo-hazard prediction in underground mining operation. Comput. Ind. Eng. 2024, 193, 110268. [Google Scholar] [CrossRef] [Scilit]
- Kern, J.; Quintero Bernal, D.F.; Urrea, C. Multimodal Data Fusion System for Accurate Identification of Impact Points on Rocks in Mining Comminution Tasks. Processes 2025, 13, 87. [Google Scholar] [CrossRef] [Scilit]
- Bakzadeh, R.; Joao, K.M.; Androulakis, V.; Khaniani, H.; Shao, S.; Hassanalian, M.; Roghanchi, P. Enhancing Emergency Response: The Critical Role of Interface Design in Mining Emergency Robots. Robotics 2025, 14, 148. [Google Scholar] [CrossRef] [Scilit]
- Bakzadeh, R.; Alhaj-Bedar, R.; Wilson, S.; Androulakis, V.; Khaniani, H.; Shao, S.; Hassanalian, M.; Roghanchi, P. Underground Mine Rescue Robotic Systems: Insights into Human-Robot Information Exchange. Front. Robot. AI 2026, 13, 1698570. [Google Scholar] [CrossRef] [Scilit]
- Wang, T.; Lu, F.; Qin, J.; Huang, T.; Kong, H.; Shen, P. AscDAMs: Advanced SLAM-based channel detection and mapping system. Nat. Hazards Earth Syst. Sci. 2024, 24, 3075–3094. [Google Scholar] [CrossRef] [Scilit]
- Kumar Singh, S.; Pratap Banerjee, B.; Raval, S. A review of laser scanning for geological and geotechnical applications in underground mining. Int. J. Min. Sci. Technol. 2023, 33, 133–154. [Google Scholar] [CrossRef] [Scilit]
- Wang, C.; Sun, Y.; Wang, X. Image deep learning in fault diagnosis of mechanical equipment. J. Intell. Manuf. 2024, 35, 2475–2515. [Google Scholar] [CrossRef] [Scilit]
- Liu, N.; Liu, X.; Jayaratne, R.; Morawska, L. A study on extending the use of air quality monitor data via deep learning techniques. J. Clean. Prod. 2020, 274, 122956. [Google Scholar] [CrossRef] [Scilit]
- Jo, B.; Khan, R.M.A. An Internet of Things System for Underground Mine Air Quality Pollutant Prediction Based on Azure Machine Learning. Sensors 2018, 18, 930. [Google Scholar] [CrossRef] [Scilit]
- Zhang, Z.; Wang, Z.Z.; Goh, S.H.; Ji, J. Deep Learning–Based Prediction of Tunnel Face Stability in Layered Soils Using Images of Random Fields. J. Geotech. Geoenviron. Eng. 2024, 150, 04024065. [Google Scholar] [CrossRef] [Scilit]
- Zhang, X.; Nguyen, H.; Bui, X.-N.; Le, H.A.; Nguyen-Thoi, T.; Moayedi, H.; Mahesh, V. Evaluating and Predicting the Stability of Roadways in Tunnelling and Underground Space Using Artificial Neural Network-Based Particle Swarm Optimization. Tunn. Undergr. Space Technol. 2020, 103, 103517. [Google Scholar] [CrossRef] [Scilit]
- Li, N.; Nguyen, H.; Rostami, J.; Zhang, W.; Bui, X.-N.; Pradhan, B. Predicting rock displacement in underground mines using improved machine learning-based models. Measurement 2022, 188, 110552. [Google Scholar] [CrossRef] [Scilit]
- Wojtecki, Ł.; Iwaszenko, S.; Apel, D.B.; Bukowska, M.; Makówka, J. Use of machine learning algorithms to assess the state of rockburst hazard in underground coal mine openings. J. Rock Mech. Geotech. Eng. 2022, 14, 703–713. [Google Scholar] [CrossRef] [Scilit]
- Fernández, A.; Sanchidrián, J.A.; Segarra, P.; Gómez, S.; Li, E.; Navarro, R. Rock mass structural recognition from drill monitoring technology in underground mining using discontinuity index and machine learning techniques. Int. J. Min. Sci. Technol. 2023, 33, 555–571. [Google Scholar] [CrossRef] [Scilit]
- Isleyen, E.; Duzgun, S.; McKell Carter, R. Interpretable deep learning for roof fall hazard detection in underground mines. J. Rock Mech. Geotech. Eng. 2021, 13, 1246–1255. [Google Scholar] [CrossRef] [Scilit]
- Ding, X.; Chen, S.; Duan, M.; Shan, J.; Liu, C.; Hu, C. Towards 3D Reconstruction of Multi-Shaped Tunnels Utilizing Mobile Laser Scanning Data. Remote Sens. 2024, 16, 4329. [Google Scholar] [CrossRef] [Scilit]
- Ji, C.; Sun, H.; Zhong, R.; Sun, M.; Li, J.; Lu, Y. Deformation Detection of Mining Tunnel Based on Automatic Target Recognition. Remote Sens. 2023, 15, 307. [Google Scholar] [CrossRef] [Scilit]
- Duan, Y.; Qiu, S.; Jin, W.; Lu, T.; Li, X. High-Speed Rail Tunnel Panoramic Inspection Image Recognition Technology Based on Improved YOLOv5. Sensors 2023, 23, 5986. [Google Scholar] [CrossRef] [Scilit]
- Wang, Y.; Miao, C.; Miao, D.; Yang, D.; Zheng, Y. Hazard source detection of longitudinal tearing of conveyor belt based on deep learning. PLoS ONE 2023, 18, e0283878. [Google Scholar] [CrossRef] [Scilit]
- Guo, X.; Liu, X.; Gardoni, P.; Glowacz, A.; Królczyk, G.; Incecik, A.; Li, Z. Machine vision based damage detection for conveyor belt safety using Fusion knowledge distillation. Alex. Eng. J. 2023, 71, 161–172. [Google Scholar] [CrossRef] [Scilit]
- Tian, F.; Song, C.; Liu, X. Small target detection in coal mine underground based on improved RTDETR algorithm. Sci. Rep. 2025, 15, 12006. [Google Scholar] [CrossRef] [Scilit] [PubMed]
- Luo, B.; Kou, Z.; Han, C.; Wu, J. A “Hardware-Friendly” Foreign Object Identification Method for Belt Conveyors Based on Improved YOLOv8. Appl. Sci. 2023, 13, 11464. [Google Scholar] [CrossRef] [Scilit]
- Ni, Y.; Cheng, H.; Hou, Y.; Guo, P. Study of conveyor belt deviation detection based on improved YOLOv8 algorithm. Sci. Rep. 2024, 14, 26876. [Google Scholar] [CrossRef] [Scilit] [PubMed]
- Wang, J.; Sang, B.; Zhang, B.; Liu, W. A Safety Helmet Detection Model Based on YOLOv8-ADSC in Complex Working Environments. Electronics 2024, 13, 4589. [Google Scholar] [CrossRef] [Scilit]
- Luo, B.; Kou, Z.; Han, C.; Wu, J.; Liu, S. A Faster and Lighter Detection Method for Foreign Objects in Coal Mine Belt Conveyors. Sensors 2023, 23, 6276. [Google Scholar] [CrossRef] [Scilit]
- Ling, J.; Fu, Z.; Yuan, X. Lightweight coal mine conveyor belt foreign object detection based on improved Yolov8n. Sci. Rep. 2025, 15, 10361. [Google Scholar] [CrossRef] [Scilit]
- Pan, C.; Tao, Q.; Pei, H.; Wang, B.; Liu, W. Belt conveyor idler fault detection algorithm based on improved YOLOv5. Sci. Rep. 2025, 15, 1926. [Google Scholar] [CrossRef] [Scilit]
- Liu, W.; Tao, Q.; Wang, N.; Xiao, W.; Pan, C. YOLO-STOD: An industrial conveyor belt tear detection model based on Yolov5 algorithm. Sci. Rep. 2025, 15, 1659. [Google Scholar] [CrossRef] [Scilit]
- Addy, C.; Nadendla, V.S.S.; Awuah-Offei, K. YOLO-Based Miner Detection Using Thermal Images in Underground Mines. Mining. Metall. Explor. 2025, 42, 1369–1386. [Google Scholar]
- Fu, Z.; Ling, J.; Yuan, X.; Li, H.; Li, H.; Li, Y. Yolov8n-FADS: A Study for Enhancing Miners’ Helmet Detection Accuracy in Complex Underground Environments. Sensors 2024, 24, 3767. [Google Scholar] [CrossRef] [Scilit]
- Li, Y.; Yan, H.; Li, D.; Wang, H. Robust Miner Detection in Challenging Underground Environments: An Improved YOLOv11 Approach. Appl. Sci. 2024, 14, 11700. [Google Scholar] [CrossRef] [Scilit]
- Hanif, M.W.; Yu, Z.; Bashir, R.; Li, Z.; Farooq, S.A.; Sana, M.U. A new network model for multiple object detection for autonomous vehicle detection in mining environment. IET Image Process. 2024, 18, 3277–3287. [Google Scholar] [CrossRef] [Scilit]
- Li, X.; Li, M.; Zhao, M. Object detection algorithm based on improved YOLOv8 for drill pipe on coal mines. Sci. Rep. 2025, 15, 5942. [Google Scholar] [CrossRef] [Scilit]
- Jin, H.; Ren, S.; Li, S.; Liu, W. Research on mine personnel target detection method based on improved YOLOv8. Measurement 2025, 245, 116624. [Google Scholar] [CrossRef] [Scilit]
- Jhaldiyal, A.; Chaudhary, N. Semantic segmentation of 3D LiDAR data using deep learning: A review of projection-based methods. Appl. Intell. 2022, 53, 6844–6855. [Google Scholar] [CrossRef] [Scilit]
- Milioto, A.; Vizzo, I.; Behley, J.; Stachniss, C. RangeNet ++: Fast and Accurate LiDAR Semantic Segmentation. In 2019 IEEE/RSJ International Conference on Intelligent Robots and Systems (IROS); IEEE: New York, NY, USA, 2019; pp. 4213–4220. [Google Scholar]
- Zhang, Y.; Zhou, Z.; David, P.; Yue, X.; Xi, Z.; Gong, B.; Foroosh, H. PolarNet: An Improved Grid Representation for Online LiDAR Point Clouds Semantic Segmentation. In 2020 IEEE/CVF Conference on Computer Vision and Pattern Recognition (CVPR); IEEE: New York, NY, USA, 2020; pp. 9598–9607. [Google Scholar]
- Nowakowski, M.; Kurylo, J.; Dang, P.H. Camera Based AI Models Used with LiDAR Data for Improvement of Detected Object Parameters. In Modelling and Simulation for Autonomous Systems; Springer Nature: Cham, Switzerland, 2025. [Google Scholar]
- Roboflow. Deepv2 Computer Vision Dataset. 2025. Available online: https://universe.roboflow.com/gray-upper-body/deepv2 (accessed on 15 May 2025).
- Akel, A.K. Project Shadow-Yolov5 Computer Vision Dataset. 2021. Available online: https://universe.roboflow.com/ahmet-kursad-akel/project-shadow-yolov5 (accessed on 15 May 2025).
- Roboflow. Mobil-Pikap Computer Vision Dataset. 2023. Available online: https://universe.roboflow.com/vod11-yosi/mobil-pikap (accessed on 15 May 2025).
- Diwan, T.; Anirudh, G.; Tembhurne, J.V. Object detection using YOLO: Challenges, architectural successors, datasets and applications. Multimed. Tools Appl. 2023, 82, 9243–9275. [Google Scholar] [CrossRef] [Scilit]
- CVAT. Leading Data Annotation Platform. 2025. Available online: https://www.cvat.ai/ (accessed on 15 May 2025).
- Cloudfactory. Dataset Split in Machine Learning. 2025. Available online: https://wiki.cloudfactory.com/docs/mp-wiki/splits/data-splitting-in-machine-learning (accessed on 10 September 2025).
- Segura, T. “Train, Validation, Test Split” Explained in 200 Words. 2021. Available online: https://thaddeus-segura.com/train-test-split/ (accessed on 10 September 2025).
- Ultralytics. COCO Dataset. 2024. Available online: https://docs.ultralytics.com/datasets/detect/coco/ (accessed on 10 September 2025).
- Chicco, D.; Jurman, G. The advantages of the Matthews correlation coefficient (MCC) over F1 score and accuracy in binary classification evaluation. BMC Genom. 2020, 21, 6. [Google Scholar] [CrossRef] [Scilit]
- Padilla, R.; Passos, W.L.; Dias, T.L.B.; Netto, S.L.; da Silva, E.A.B. A Comparative Analysis of Object Detection Metrics with a Companion Open-Source Toolkit. Electronics 2021, 10, 279. [Google Scholar] [CrossRef] [Scilit]
- Vizzo, I.; Chen, X.; Chebrolu, N.; Behley, J.; Stachniss, C. Poisson Surface Reconstruction for LiDAR Odometry and Mapping. In Proceedings of the IEEE International Conference on Robotics and Automation (ICRA), Xi’an, China, 30 May–5 June 2021. [Google Scholar]
- MATLAB. Lidar 3-D Object Detection Using PointPillars Deep Learning. Available online: https://www.mathworks.com/help/lidar/ug/object-detection-using-pointpillars-network.html#Lidar3DObjectDetectionUsingPointPillarsExample-7 (accessed on 5 October 2025).
- Yang, G.; Mentasti, S.; Bersani, M.; Wang, Y.; Braghin, F.; Cheli, F. LiDAR point-cloud processing based on projection methods: A comparison. In 2020 AEIT International Conference of Electrical and Electronic Technologies for Automotive (AEIT AUTOMOTIVE); IEEE: New York, NY, USA, 2020; pp. 1–6. [Google Scholar]

Disclaimer/Publisher’s Note: The statements, opinions and data contained in all publications are solely those of the individual author(s) and contributor(s) and not of MDPI and/or the editor(s). MDPI and/or the editor(s) disclaim responsibility for any injury to people or property resulting from any ideas, methods, instructions or products referred to in the content. |
© 2026 by the authors. Licensee MDPI, Basel, Switzerland. This article is an open access article distributed under the terms and conditions of the Creative Commons Attribution (CC BY) license.