


Abstract
Deep learning models have received widespread attention in pathological image classification and recognition tasks. However, their performance relies on large amounts of annotated data, which are difficult to obtain for pathological images, severely limiting model generalization. Moreover, whole-slide images (WSIs) are extremely large and must be divided into patches for processing, which often leads to the loss of global information and degrades recognition performance. To address these issues, this paper proposes a cross-domain WSI classification and recognition method based on deep feature fusion and conditional domain alignment (CTCA). The method targets unsupervised domain adaptation scenarios. It constructs a parallel architecture of transfer-pretrained networks, BreNet and Swin Transformer, to jointly extract local detail and global contextual features, achieving multi-scale and multi-perspective deep feature fusion. Subsequently, labels are introduced as conditional variables in the latent space to perform conditional domain alignment, preserving category correlations while reducing distribution discrepancies between domains. Finally, lesion regions in WSIs are visually annotated using predicted probability heatmaps. Experiments show that, under an unsupervised setting, the method effectively leverages small-scale labeled data to guide lesion recognition in unlabeled WSIs, outperforming existing unsupervised domain adaptation methods in accuracy and stability and enabling visualization of regions of interest to support clinical diagnosis.
1. Introduction
According to global cancer statistics, cancer is one of the most serious health threats worldwide [1,2]. Pathological examination is a commonly used clinical diagnostic method and serves as the “gold standard” among all diagnostic tools. With advances in digital technology, digital pathological images have become an essential part of pathology research [3]. Digital pathological image processing enables various cellular image analysis tasks, such as nucleus and gland segmentation [4,5,6], lesion detection for lymph node metastasis [7,8,9], and mitosis counting [10]. The rich phenotypic information contained in pathological images is crucial for early clinical diagnosis, intervention, and patient survival prediction. With the wide use of WSI scanners in clinical practice, computer-aided pathological diagnosis (CAPD) has become an effective way to assist pathologists in reducing diagnostic errors and saving time [11,12].
With the application of deep learning (DL), significant progress has been made in medical image processing [13]. Among many classical deep learning models, convolutional neural networks (CNNs) can capture local structural features of images and automatically learn feature representations [14,15]. A two-stage framework combining deep learning and machine learning is proposed for multi-classification of breast digital pathology images [16]. In addition, self-attention mechanisms can capture global dependencies in large-scale image data. Particularly, Vision Transformers (ViTs) can learn more unified semantic information from images, which is critical for accurate cancer classification and segmentation [17,18,19]. A Swin Transformer-based multiple instance learning network (MIST) is applied to achieve an accurate classification of colorectal tumor WSIs using only WSI-level labels.
Vision Transformers are good at extracting cross-slide semantic information, while CNNs mainly focus on local edge features formed by neighboring pixels. Hybrid architectures combining CNNs and Transformers can leverage the strengths of both sides. It enables further feature exploration and multi-scale feature fusion for rich cellular edge and inter-tissue semantic information in histopathological images. This naturally becomes a key research direction for further optimization in CAPD applications.
Due to data privacy concerns, public pathological image and WSI datasets are rare. Moreover, small-sized pathological images are relatively easy to annotate precisely, while detailed annotation of WSIs is difficult. Limited annotated WSI datasets cannot meet the data demands of deep neural networks, leading to overfitting and poor generalization when trained directly.
To address these issues, transfer learning (TL) has gained increasing attention in pathological image analysis [20]. Unsupervised domain adaptation (UDA), a branch of transfer learning, aims to discover domain-invariant and task-specific representations from labeled source domain samples and unlabeled target domain samples [21,22,23]. It has been applied in pathology to reduce the annotation burden and support various downstream medical tasks. Multiple domain-specific feature extractors with MMD loss have been constructed for cross-domain pathological image classification [24]. An ensemble autoencoder composed of a marginal autoencoder and a convolutional autoencoder is designed to learn diverse cross-domain feature representations in an unsupervised manner [25]. However, data differences and domain shifts between source and target pathological images may limit the classification performance of the models if UDA is applied directly.
To address these challenges, this paper proposes an unsupervised cross-domain pathological image classification method based on deep feature fusion and conditional domain alignment. Considering the specificity of pathological images, the method first pretrains an improved deep convolutional network, BreNet [26], on ImageNet and then uses it in parallel with a Swin Transformer (CNN-SwinT) module to extract and fuse local edge and global semantic features. Subsequently, label information is used as a conditional variable, and a conditional covariance operator is introduced to measure cross-domain feature distribution differences, achieving domain alignment. This enables the transfer of useful information from small-sized labeled pathological images to unlabeled WSIs, facilitating the identification of cancerous regions in WSIs.
The main contributions of this paper are as follows:
(1) A parallel architecture combining BreNet and Swin Transformer is designed to extract and fuse global and local features, representing fine-grained edge and coarse-grained semantic information in pathological images.
(2) By minimizing both the conditional covariance discrepancy and maximum mean discrepancy (MMD) under conditional constraints between source and target domains, the method further discovers cancer-specific, domain-invariant representations to guide lesion identification in unlabeled target-domain WSIs.
(3) Cross-species and cross-domain experiments are conducted on WSI datasets. Results demonstrate that the proposed method is effective and superior compared to other state-of-the-art approaches.
2. Notations
This paper uses certain symbols to represent the cross-domain pathological image classification process. For an unsupervised image classification task with c classes, denotes the sample set from the source domain and its labels, and denotes the unlabeled sample set from the target domain. These data are sampled from the source and target domains, respectively, where and represent the input samples and their slide-level labels from the source domain dataset; represents unlabeled samples from the target domain dataset. denotes the data dimension, and and denote the number of labeled source domain samples and unlabeled target domain samples, respectively. Given an unlabeled target domain sample , its output probability after the classification layer is defined as the generated pseudo-label . Then, each target domain sample is paired one-to-one with its corresponding pseudo-label to form .
3. Method
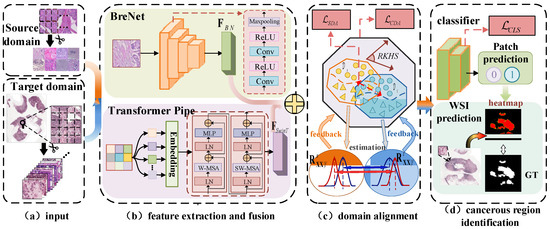
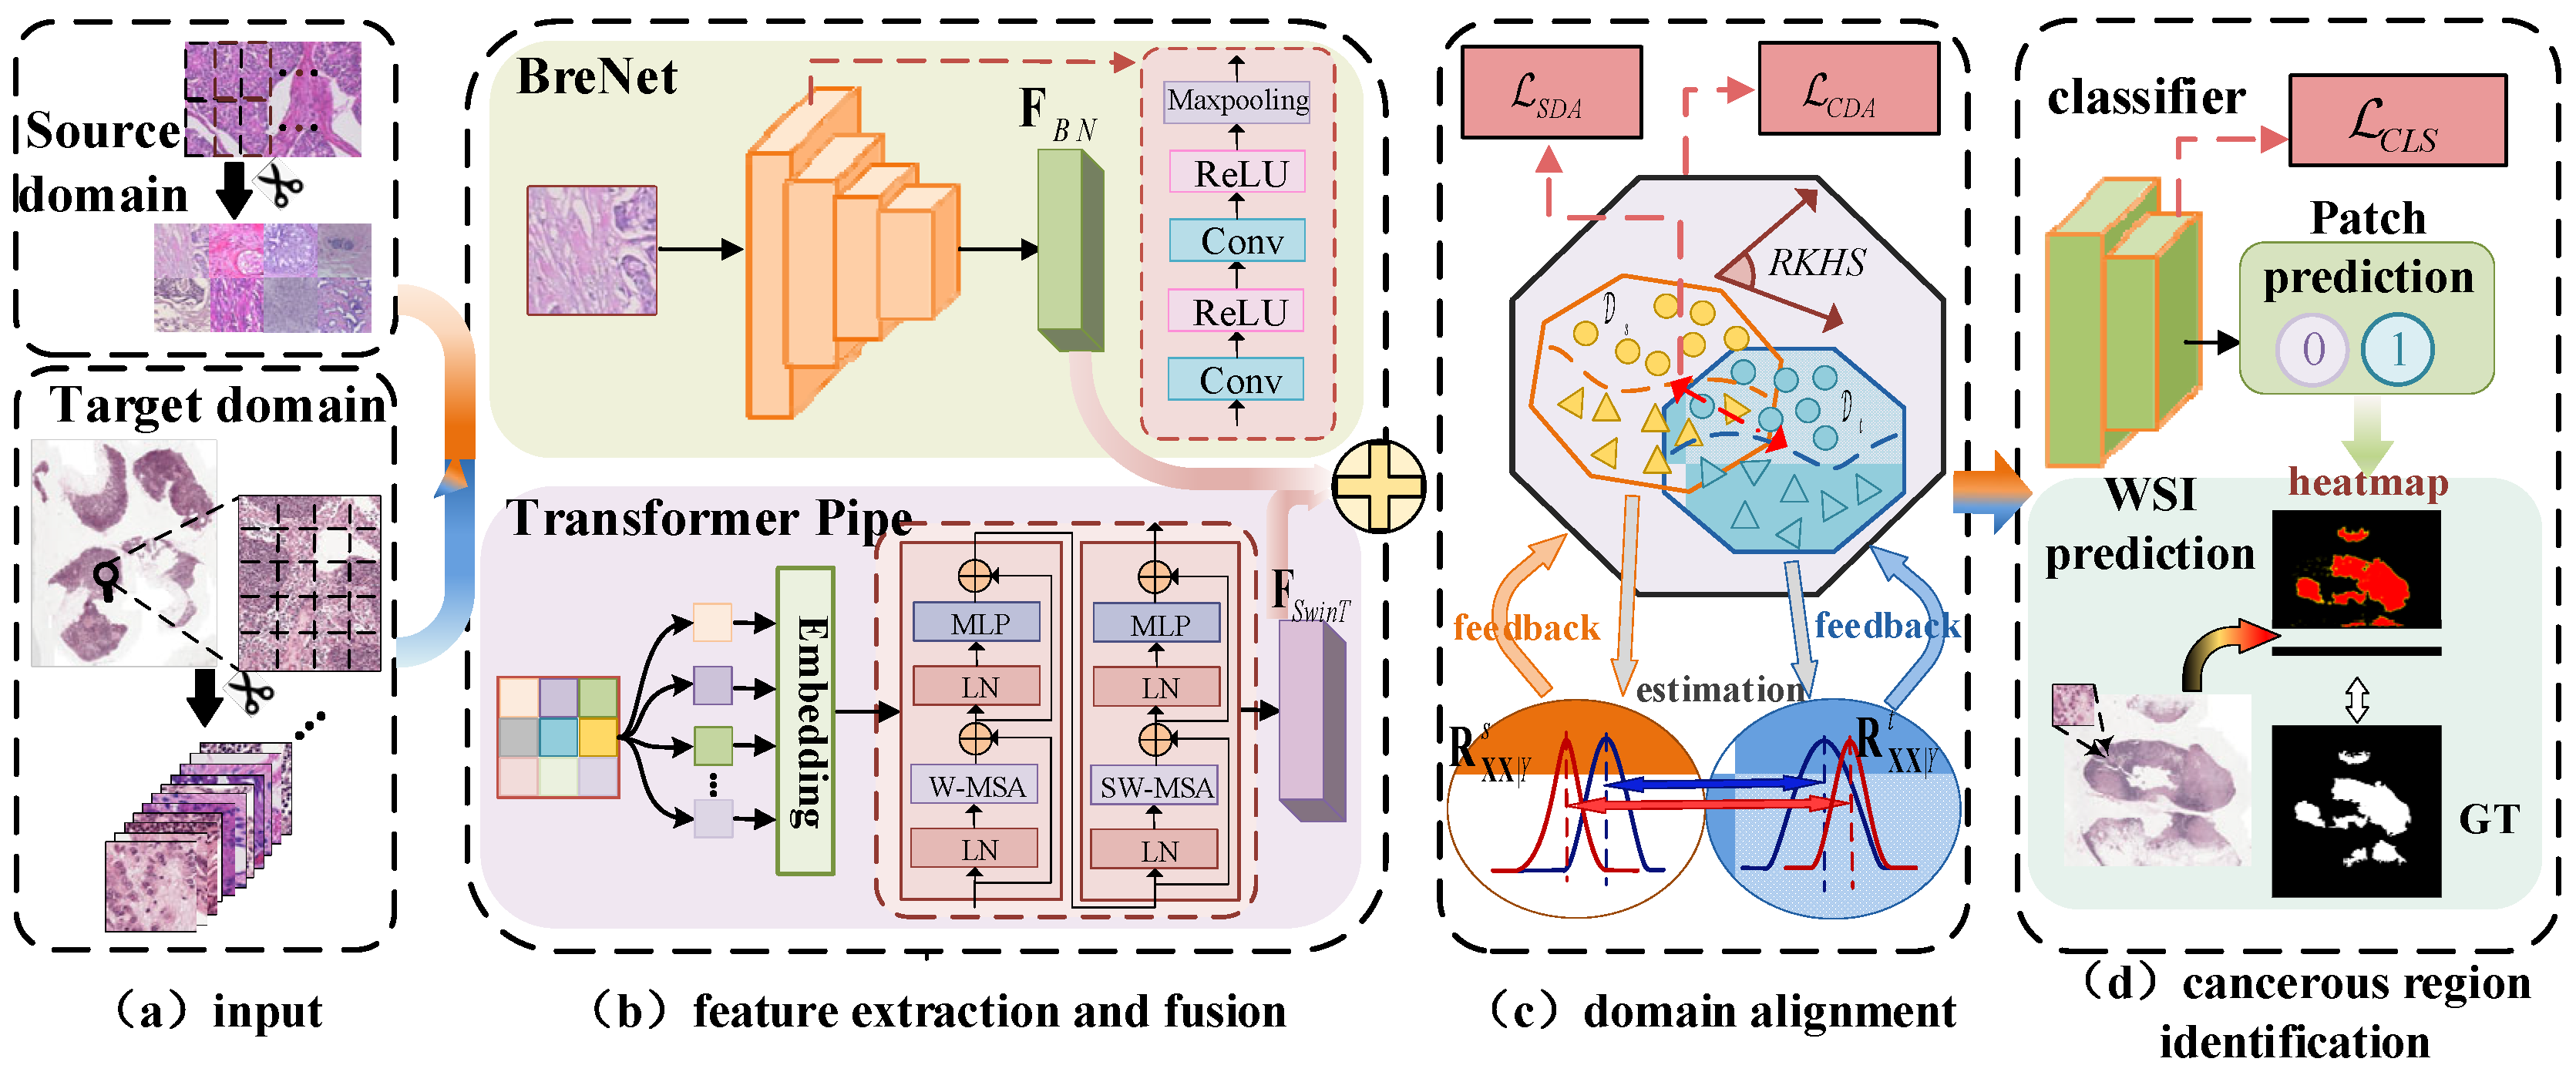
As shown in Figure 1, the model consists of four submodules: (a) Input: Pathological images from the source domain are cropped into 224 × 224 patches; WSIs from the target domain are segmented and randomly sampled into 224 × 224 patches containing only valid pathological tissue and cells. (b) CNN and Swin Transformer Feature Extraction and Fusion (CTFF) module: Images from the source and target domains are fed into a deep convolutional network, BreNet, and a Swin Transformer network, respectively, to extract features that capture classification-relevant information from different dimensions and perspectives. The features extracted by the two models are then fused with learned weights. (c) Conditional-Sample Domain Alignment (CSDA) module: Domain alignment is achieved in the reproducing kernel Hilbert space (RKHS) by aligning conditional covariance operators and distributions of features from the two domains, enabling alignment of high-dimensional complex features between source and target samples. (d) Cancerous Region Identification: The patch-level classification probabilities obtained by the classifier are mapped back to their original positions on the WSI, generating a final heatmap for lesion identification across the entire WSI.
Figure 1.
Framework diagram of the unsupervised domain adaptation network with CNN-SwinT feature fusion and conditional domain alignment for cancer detection in pathological images.
3.1. CNN–SwinT Feature Extraction and Fusion
Pathological images are characterized by extremely high resolution and large size. Therefore, a complete pathological image (WSI) contains abundant intracellular and inter-tissue information from lesion regions. Due to limitations on input dimensions in deep learning models, pathological images must be preprocessed and split into smaller patches before being fed into the model. However, conventional feature extraction networks have limited receptive fields and focus more on local details, inevitably leading to the loss of some inter-tissue information during feature extraction.
To fully extract cancer-specific features from images and capture both fine-grained cellular information and coarse-grained inter-tissue information, the model uses not only the convolutional network BreNet for fine-grained feature extraction but also the Swin Transformer in parallel to capture coarse-grained features.
The BreNet is pre-trained on the ImageNet public dataset as the training set. An input sample with dimension 3 × 224 × 224 is processed through multiple convolutional layers to extract a high-dimensional feature of size 512 × 7 × 7. Then, to match the feature dimension from Swin Transformer, , global average pooling (GAP) is applied to this high-dimensional feature to obtain the final extracted feature . Thus, the process of extracting feature from sample using the deep convolutional neural network can be described as follows:
where denotes the operation of BreNet extracting features from sample , and denotes the global average pooling operation.
To capture more global and multi-scale features from the input sample, a Swin Transformer is introduced to process the input in parallel with the convolutional network. The network first divides the input sample into 4 × 4 patches and then maps them into corresponding feature sequence tokens, which are fed into the basic Swin Transformer block to finally extract the feature .
The output of Swin Transformer is processed with global average pooling (GAP), resulting in a final output feature with the same channel dimension as , expressed as
Features and are extracted by the deep convolutional neural network BreNet and the Swin Transformer, respectively. Through weighted feature fusion, the final feature map extracted from the original patch by this module is obtained:
where and are the weight parameters for features and , respectively, which can be optimized during training via grid search.
3.2. Conditional-Sample Domain Alignment
Unsupervised domain adaptation methods assume that the labeled source domain and unlabeled target domain share the same feature space but have different feature distributions. Most UDA methods mainly align the two domains by minimizing the marginal distribution discrepancy between domain features or mitigating domain shift. Yet, they often ignore the potential loss of label information during alignment. Therefore, to preserve the distribution differences among samples of different classes within each domain, this module introduces the conditional covariance operator to measure how the relationships between samples change across domains under given conditions.
In the RKHS space, the conditional covariance operator can be viewed as a linear operator. By using a kernel function, the label is embedded as a conditional variable into the high-dimensional RKHS space, allowing the model to capture complex nonlinear dependencies among samples while preserving label information. The Gaussian kernel function is used as the explicit kernel function, with the following expression:
The features extracted from the source and target domain samples, along with the pseudo labels of the source and target domain datasets, are mapped into the RKHS. The corresponding implicit mapping matrices are defined as and . Then, their covariance operator can be written as follows:
where is the centering matrix of , which centers the and matrices to zero mean, eliminating the influence of mean values; and denote the number of labeled source domain features and unlabeled target domain features, respectively.
The conditional covariance operator based on the conditional variable is calculated according to the following equation:
where is a regularization parameter to prevent from being singular. The conditional covariance operators corresponding to the feature mappings of the source and target domains are computed as and , respectively.
To measure the discrepancy in conditional covariance between the two domains in the high-dimensional RKHS space, the Wasserstein Distance [27,28] between the two conditional covariance operators, and , is used as the loss . The second-order Wasserstein distance is suitable for measuring similarities in “shape” and “location” between two probability distributions. In RKHS, the geometric sensitivity of the Wasserstein distance is enhanced, enabling a more accurate reflection of the local geometric structure of the distributions. When two probability distributions are identical, their second-order Wasserstein distance is zero. Therefore, by minimizing the conditional domain alignment (CDA) loss function , feature alignment between the two domains can be achieved. The calculation is expressed as follows:
where denotes the second-order Wasserstein distance between two variables, .
To further reduce the distribution discrepancy between source and target domain features in the RKHS space, the maximum mean discrepancy (MMD)-based loss function is used to align feature distributions across domains. The corresponding sample domain alignment (SDA) loss is calculated as follows:
Finally, the classifier output is normalized by a sigmoid function to obtain the binary classification prediction score for the input patch sample . For the source domain sample , given the true label and the corresponding predicted score , the cross-entropy loss is used as the classifier loss, which can be expressed as follows:
For the target domain sample , the maximum prediction score is taken as the predicted probability , and the predicted label is the model’s classification label of the image patch, expressed as
In summary, the overall loss function of the CTCA algorithm can be defined as follows:
where and are the weighting parameters for Equation (7) and Equation (8), respectively.
The pseudocode of the CTCA algorithm is shown in Algorithm 1:
| Algorithm 1: CTCA Algorithm |
| Input: Labeled source domain samples , Unlabeled target domain samples |
| Output: F1-Score, Accuracy, AUC, Sensitivity, Specificity |
| Divide the source domain samples and target domain samples into training sets and testing datasets respectively |
| 1. For training epochs do: |
| 2. Extract features using BreNet network and perform max mean pooling to ob-tain features |
| 3. Extract features using Swin Transformer network and perform max mean pooling to obtain features |
| 4. Calculate the fused features according to Equation (3) |
| 5. Map the source domain and target domain features to the RKHS space according to kernel function (4) |
| 6. Calculate the covariance operators of the source and target domain feature mappings according to Equation (6) |
| 7. Calculate the second-order Wasserstein distance between and according to Equation (7), obtaining |
| 8. Calculate the maximum mean discrepancy of cross-domain feature distribu-tions according to Equation (8), obtaining |
| 9. Calculate according to Equation (9) |
| 10. Calculate the total model loss based on the weight and of each module’s loss function |
| 11. Backpropagate and update model parameters |
| 12. Calculate the slice prediction probability of target samples according to Equation (10) |
| 13. End for |
4. Experiments
4.1. Datasets and Evaluation Metrics
In this study, experiments were conducted using the small-sized breast cancer pathological image dataset BreaKHis_100× and the public breast cancer WSI dataset CAMELYON16. Additionally, a private small-sized mouse colon cancer pathological image dataset (denoted as Mice) and the public human colon cancer WSI dataset PAIP2020 were used as source and target domains, respectively, to evaluate the proposed model’s performance in identifying cancerous regions in WSI. Experiments on both cancer types were also carried out to validate the model’s generalization ability in the field of pathological diagnosis.
The BreaKHis dataset [29] is a public breast cancer pathological dataset. It contains 7909 breast pathological images, all stained with hematoxylin and eosin (H&E). In the experiments, images with 100× magnification (abbreviated as BreaKHis_100×) were selected to match the scale of the other datasets. The BreaKHis_100× subset contains 644 normal and 1437 cancerous images.
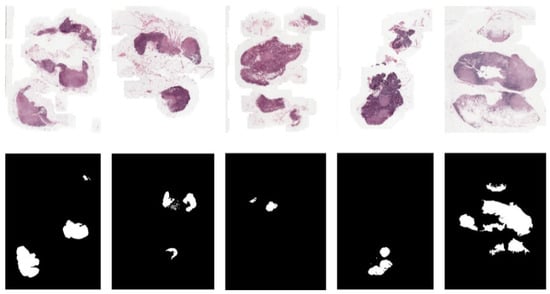
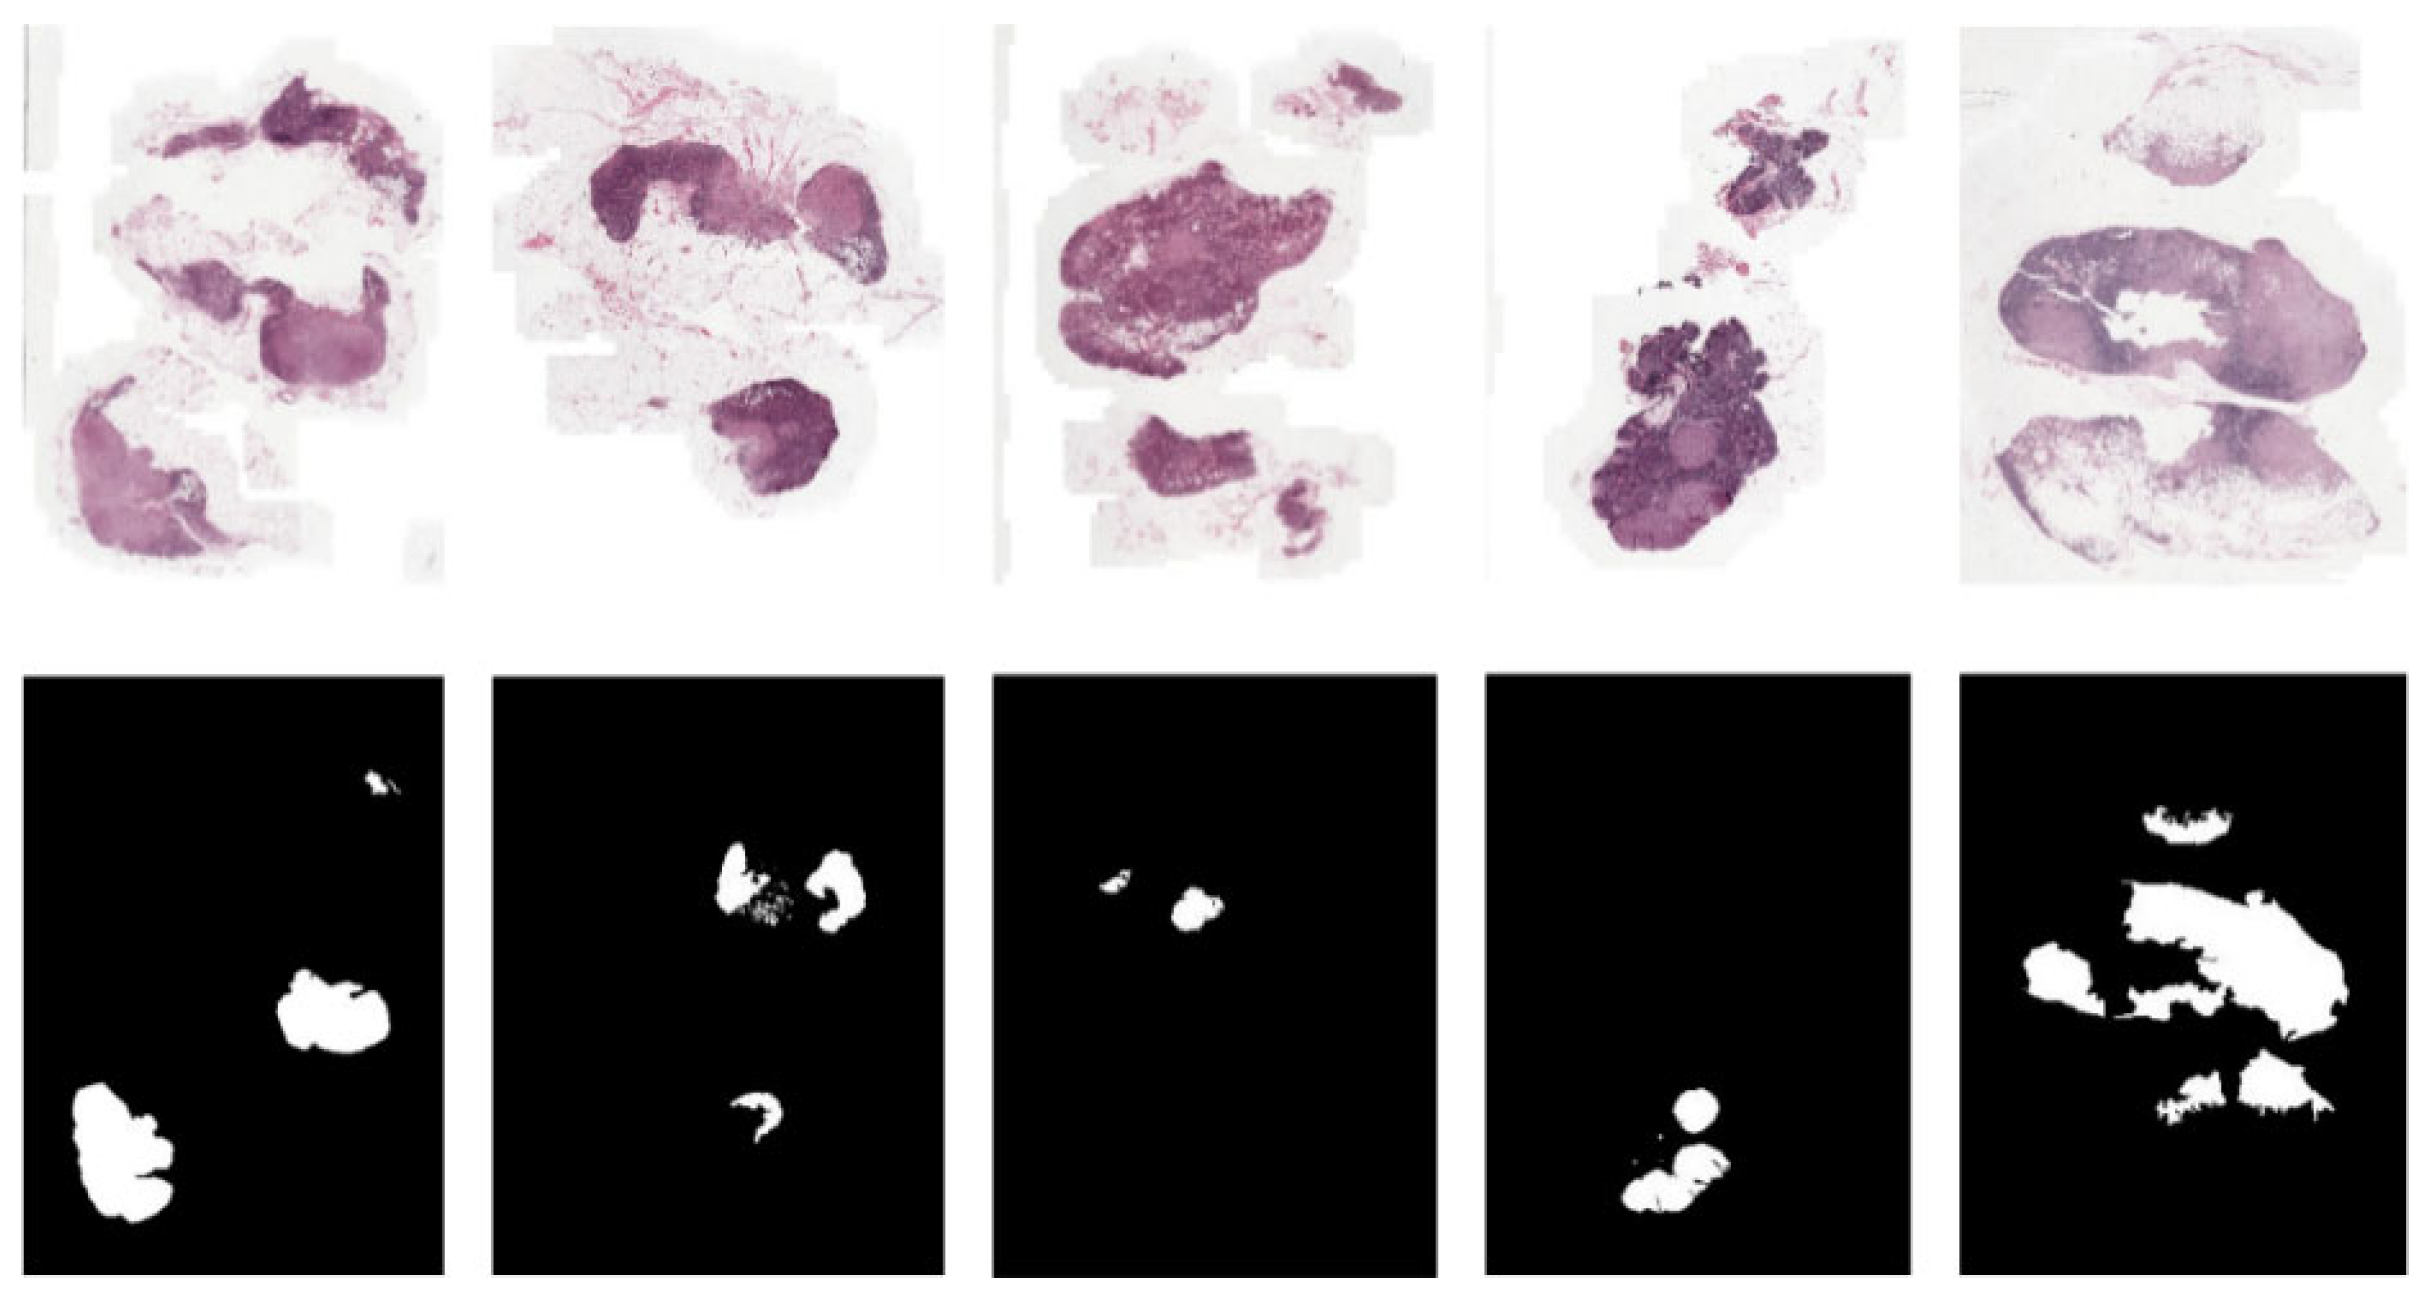
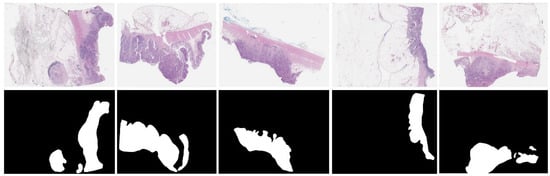
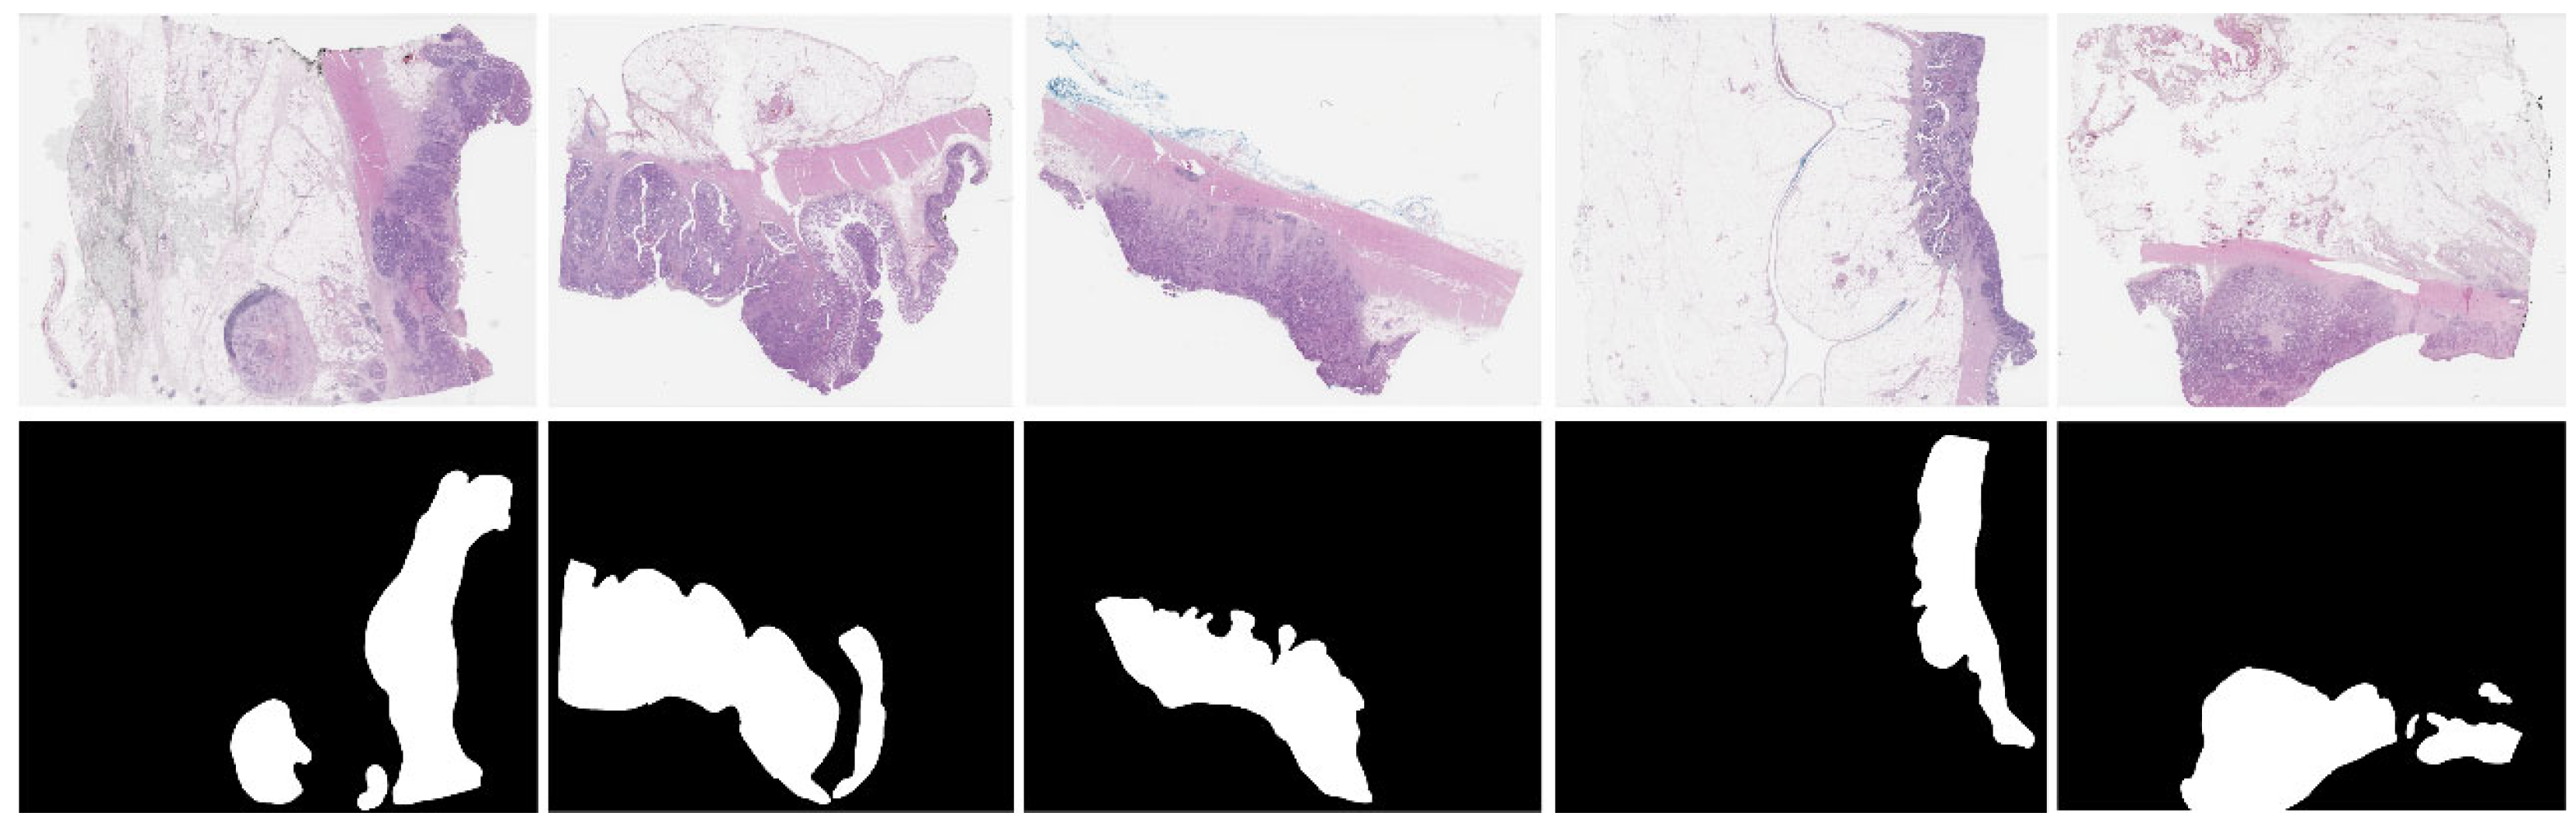
The CAMELYON16 dataset is a breast cancer pathological whole-slide image (WSI) dataset from the “Grand Challenge CAMELYON16” [30]. It contains H&E-stained slides, including 170 breast lymph node WSIs as the training set and 100 WSIs as the test set, used for breast cancer detection and classification. The dataset provides detailed manual annotations of cancerous regions in each WSI made by pathologists at the pixel level, serving as the ground truth (GT) or “gold standard” for breast cancer detection. To visually show the location of cancerous regions in WSIs, binary mask images are used in this study to visualize the GT. Figure 2 displays sample WSI thumbnails and their corresponding binary mask GT images. In the masks, white regions indicate cancerous areas in the original WSI, while black regions represent blank background and normal tissue areas.
Figure 2.
Some breast cancer WSIs from the Camelyon16 dataset (top: WSI thumbnails; bottom: ground truth).
The mice were provided by Southwest Hospital. It contains a total of 9042 pathological images, all H&E-stained, with a resolution of 1024 × 768 and a magnification of 400×.
The public colon cancer pathological WSI dataset PAIP2020 comes from the “Grand Challenge PAIP2020” [31]. All images are randomly assigned to training, validation, and test sets. All WSIs are H&E-stained with a scanning magnification of 40×. The dataset includes 118 WSIs. Binary mask images are generated based on the GT from this dataset to visualize cancerous region detection. As shown in Figure 3, the top row displays sample WSI thumbnails from the PAIP2020 dataset, and the bottom row shows their corresponding GT binary mask images.
Figure 3.
Some colorectal cancer WSIs from the PAIP2020 dataset (top: WSI thumbnails; bottom: ground truth).
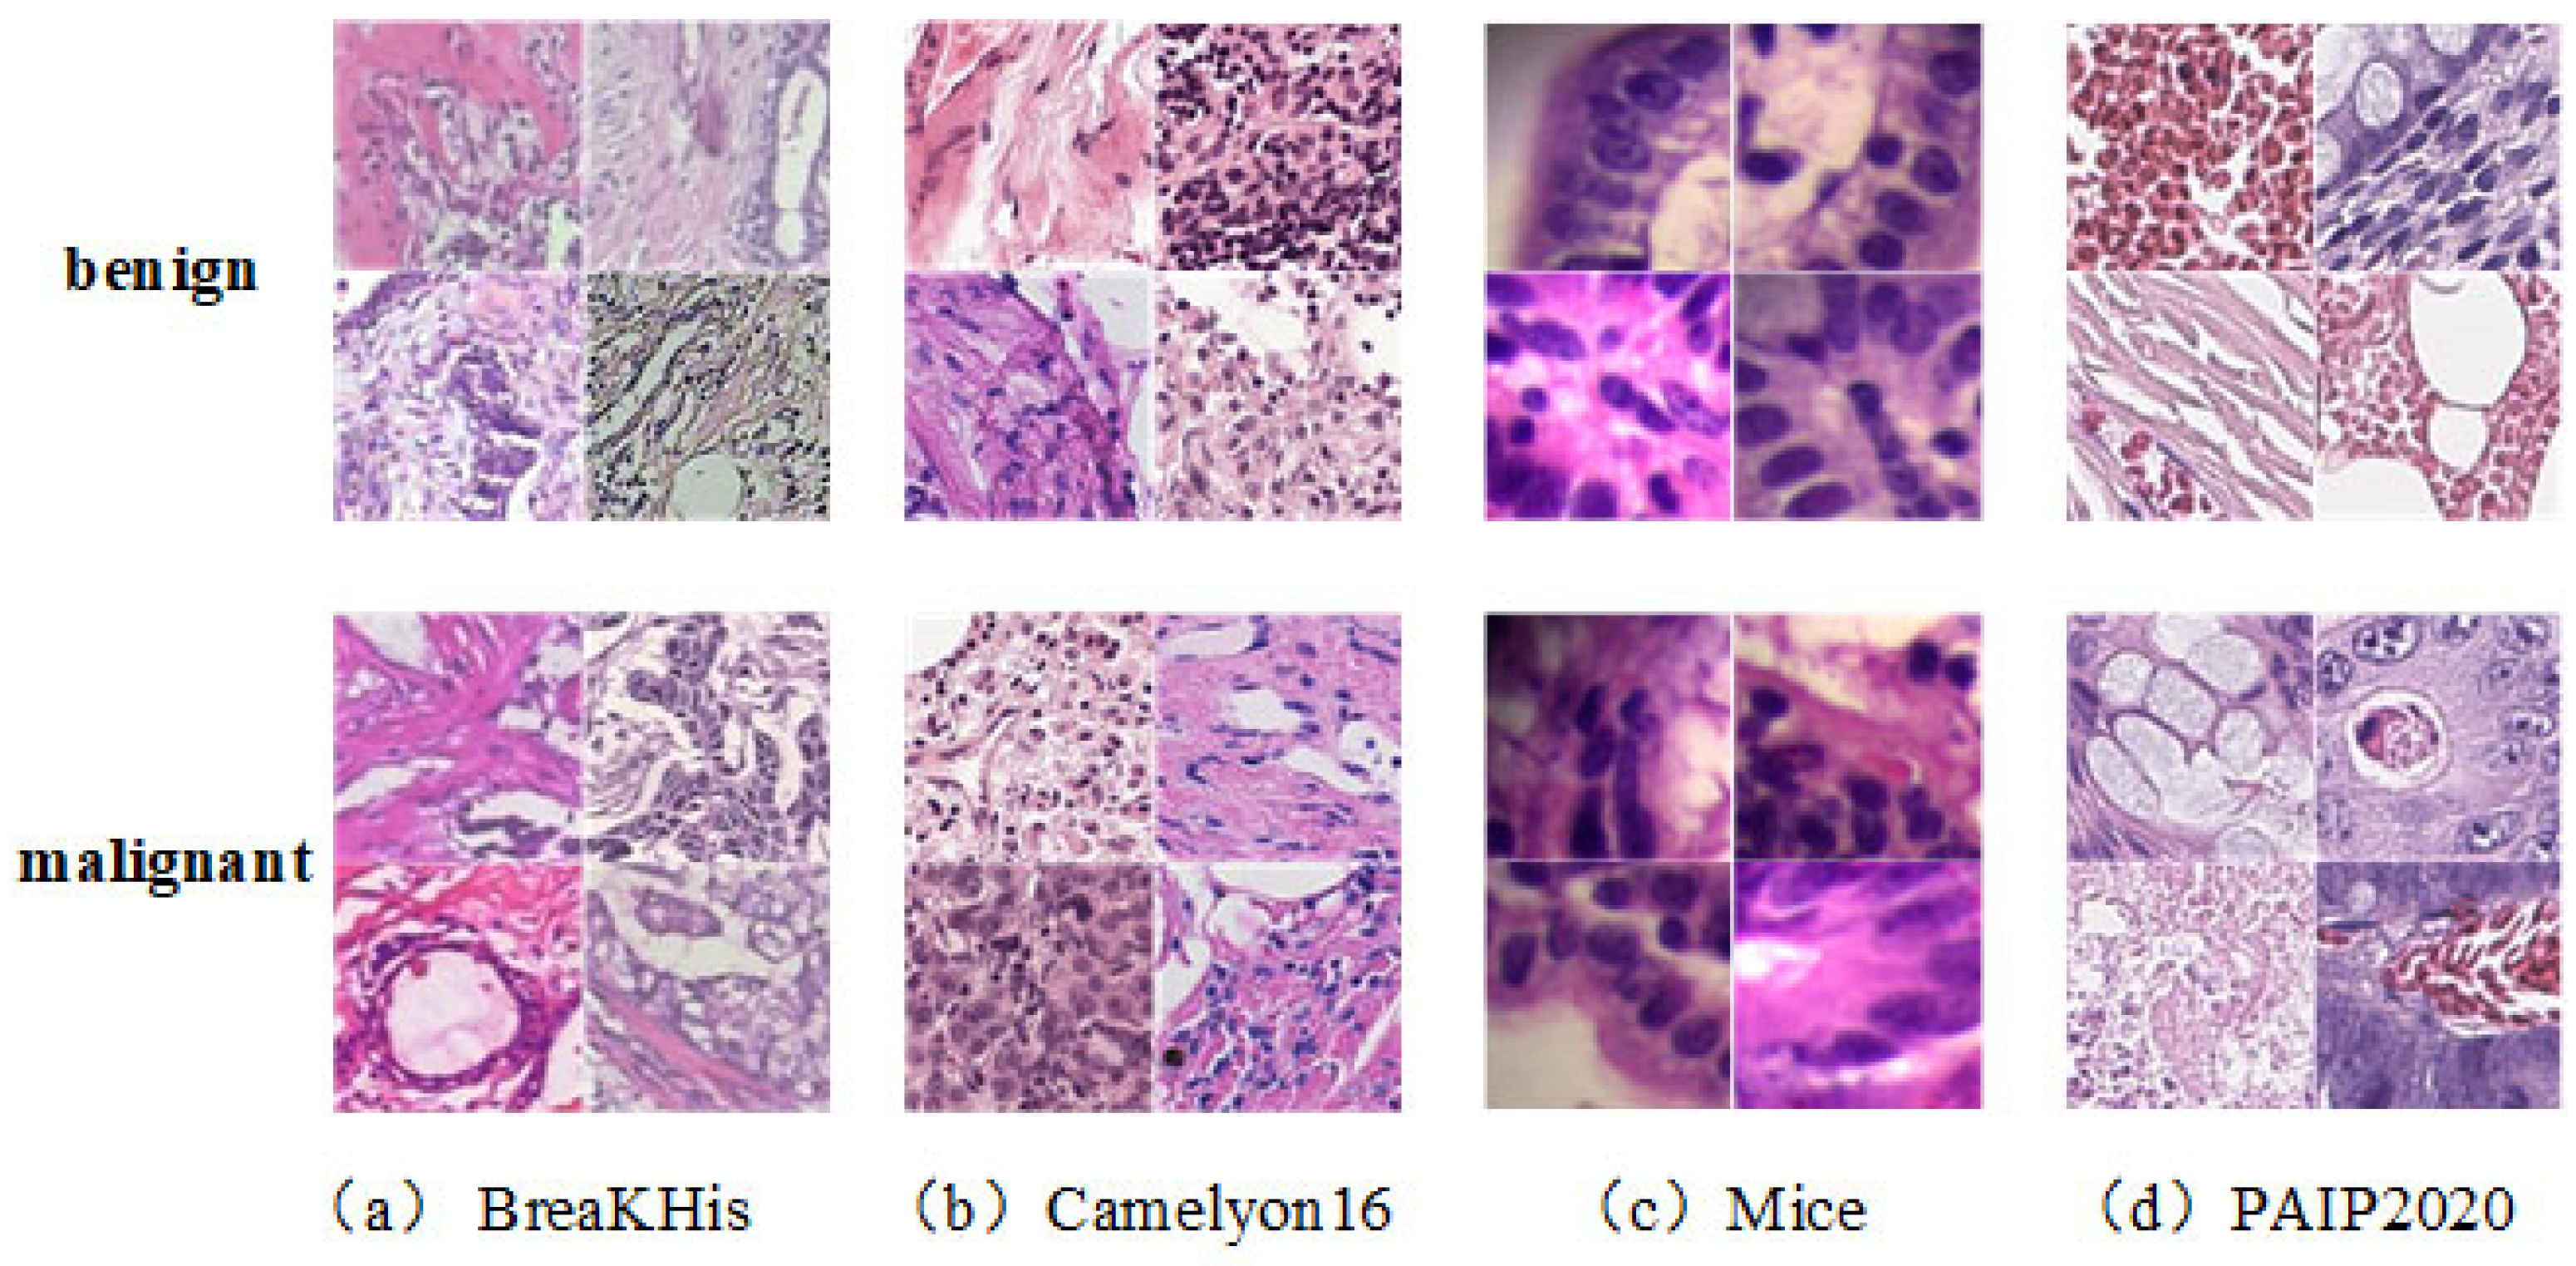
Figure 4 shows several pathological slices from the above datasets after preprocessing.
Figure 4.
Representative pathological patches in the datasets.
The links to the public datasets used in this paper are as follows:
BreaKHis: https://web.inf.ufpr.br/vri/databases/breast-cancer-histopathological-database-breakhis/ (accessed on 6 June 2022);
CAMELYON16: https://camelyon16.grand-challenge.org/ (accessed on 10 May 2023);
PAIP2020: https://paip2020.grand-challenge.org/ (accessed on 5 June 2022);
In quantitative evaluation, this study adopts widely used metrics, including accuracy (ACC), F1 score, sensitivity, specificity, and area under the receiver operating characteristic (ROC) curve (AUC), to evaluate model performance. These metrics are defined as follows:
where , , , and are the numbers of samples predicted as true positive, false positive, true negative, and false negative, respectively.
4.2. Experimental Design and Implementation
We designed two sets of experiments to evaluate the performance of the proposed model and its component modules.
In the two experiments, we conducted domain adaptation from small-sized pathological images to WSI images on breast and colon cancer datasets. For breast cancer WSI detection, the BreaKHis dataset was used as the source domain, and the CAMELYON16 dataset was used as the target domain for cross-domain experiments. For colon cancer prediction, the Mice dataset and the PAIP2020 dataset were used as source and target domains, respectively, for cross-species experiments.
WSIs need to be cropped into patches before training. The image patch extraction process is as follows:
(1) Tissue region detection is performed using the HSV color space threshold method combined with Otsu’s automatic threshold segmentation, and only regions with saturation >0.1 and brightness <0.9 are retained as valid tissue.
(2) The filtering criterion is as follows: the proportion of tissue regions in a single 224 × 224 image patch must be ≥60%; otherwise, the patch is excluded.
(3) Full-coverage, non-overlapping sampling (step size = 224) is applied to small-sized source domain images. For target domain WSIs, 3000 valid patches are randomly sampled per WSI during training to balance computational efficiency and tissue coverage. During inference, sliding-window sampling with a step size of 224 is applied to all valid tissue regions in each WSI, ensuring complete spatial coverage for whole-slide heatmap generation.
(4) To enhance the generalization ability of the model, target domain WSIs are resampled in each training epoch. A fixed sampling sequence is used for the same WSI in the inference phase to ensure result consistency.
The proposed algorithm is compared with several state-of-the-art unsupervised domain adaptation (UDA) methods to evaluate its ability to predict cancerous regions in WSI patches. The compared methods include the following:
(1) CDICL [32]: constructs an information-aware space via instance contrastive learning for unsupervised domain adaptation;
(2) BACG [33]: uses a dual-discriminator adversarial network with category gradient alignment for unsupervised domain adaptation;
(3) RSDA [34]: proposes a reweighted adversarial training strategy to effectively reduce intra-domain discrepancies in the target domain, improving unsupervised domain adaptation;
(4) RCE [35]: introduces a novel risk-consistent training method for unsupervised domain adaptation.
This experiment quantitatively evaluates the patch-level classification performance of each method using evaluation metrics. Additionally, the predicted probability scores for each WSI patch are mapped back to their corresponding locations on the WSI to generate probability heatmaps for cancerous region prediction. Then, they are compared with those produced by the state-of-the-art methods.
The second experiment evaluates the effectiveness of the model’s component modules through ablation studies. The model is decomposed to separately validate the impact of the CNN-SwinT feature extraction and fusion module and the conditional-sample domain alignment module on model performance.
During training, the Adam optimizer was used. Hyperparameters were automatically optimized using the grid search method. The maximum number of training epochs and batch size were set to 50 and 24, respectively. The initial learning rate was 0.001 and was adaptively adjusted during training.
The CTCA algorithm and all comparison methods were implemented in Python 3.8 with PyTorch 2.0.1 on a system equipped with an Intel® Xeon(R) CPU E5-2620 v4 @ 2.10 GHz×32 and a GeForce GTX 2080Ti GPU. The random seeds of Python, NumPy, and PyTorch were fixed in the experiments. Data shuffling, network weight initialization, and pseudo-label generation were all controlled by this unified random seed.
Hyperparameter Search Space:
Feature fusion weights , : grid search over [0, 1] (subject to );
Loss weighting coefficients: (classification loss) ∈ [0.1, 1.5], (domain alignment loss) ∈ [0.1, 1.5];
Kernel bandwidth parameter ∈ {0.1, 0.5, 1.0, 2.0};
Regularization coefficient ∈ {1 × 10⁻⁴, 5 × 10⁻⁴, 1 × 10⁻³}.
All hyperparameters were tuned only on the source domain validation set, without using any target domain label information. Independent tuning was performed for different dataset pairs to adapt to cross-domain differences.
4.3. Experiment Results and Analysis
To compare the proposed method with recent state-of-the-art UDA methods in predicting cancerous regions in breast cancer pathological images, all methods were evaluated under the same dataset configuration over five independent runs. The mean and standard deviation of each evaluation metric across the five runs are recorded in Table 1 and Table 2.
Table 1.
Detailed results of different compared methods for classification (BreaKHis100×-Camelyon16) (unit: %).
Table 2.
Detailed results of different compared methods for classification (Mice-PAIP2020) (unit: %).
As shown in the tables, the proposed method significantly outperforms all other compared methods in cancer prediction on both breast cancer (BreaKHis100×-CAMELYON16) and colon cancer (Mice-PAIP2020) WSI. For the breast cancer detection experiment, Table 1 shows that the proposed method improves F1 score and accuracy by approximately 13% and AUC by approximately 20% compared to the second-best method, RCE. This demonstrates its superior overall performance. In addition, the specificity values of other methods are relatively low, indicating a weaker ability to identify normal samples, which would lead to higher false-positive rates in clinical applications.
For the colon cancer detection experiment, Table 2 shows that the proposed method outperforms all other methods, especially in F1 score, accuracy, and AUC, indicating stronger overall performance. The low sensitivity values of the other methods suggest weaker detection capability for cancerous samples, increasing the risk of missed detection of cancerous regions in clinical practice.
Overall, compared to other UDA methods, the proposed CTCA algorithm demonstrates stable performance across two different types of cancer detection tasks, showing stronger generalization ability and proving its potential for practical clinical applications. This indicates that the CTCA algorithm is not only suitable for detecting specific cancer types but can also be widely applied to the analysis of various pathological images, providing clinicians with more reliable diagnostic assistance.
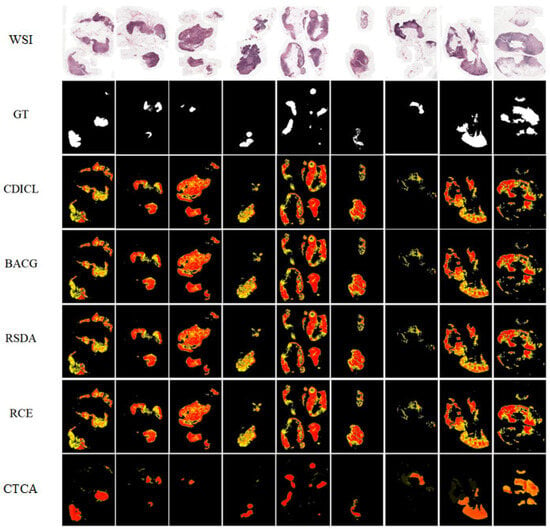
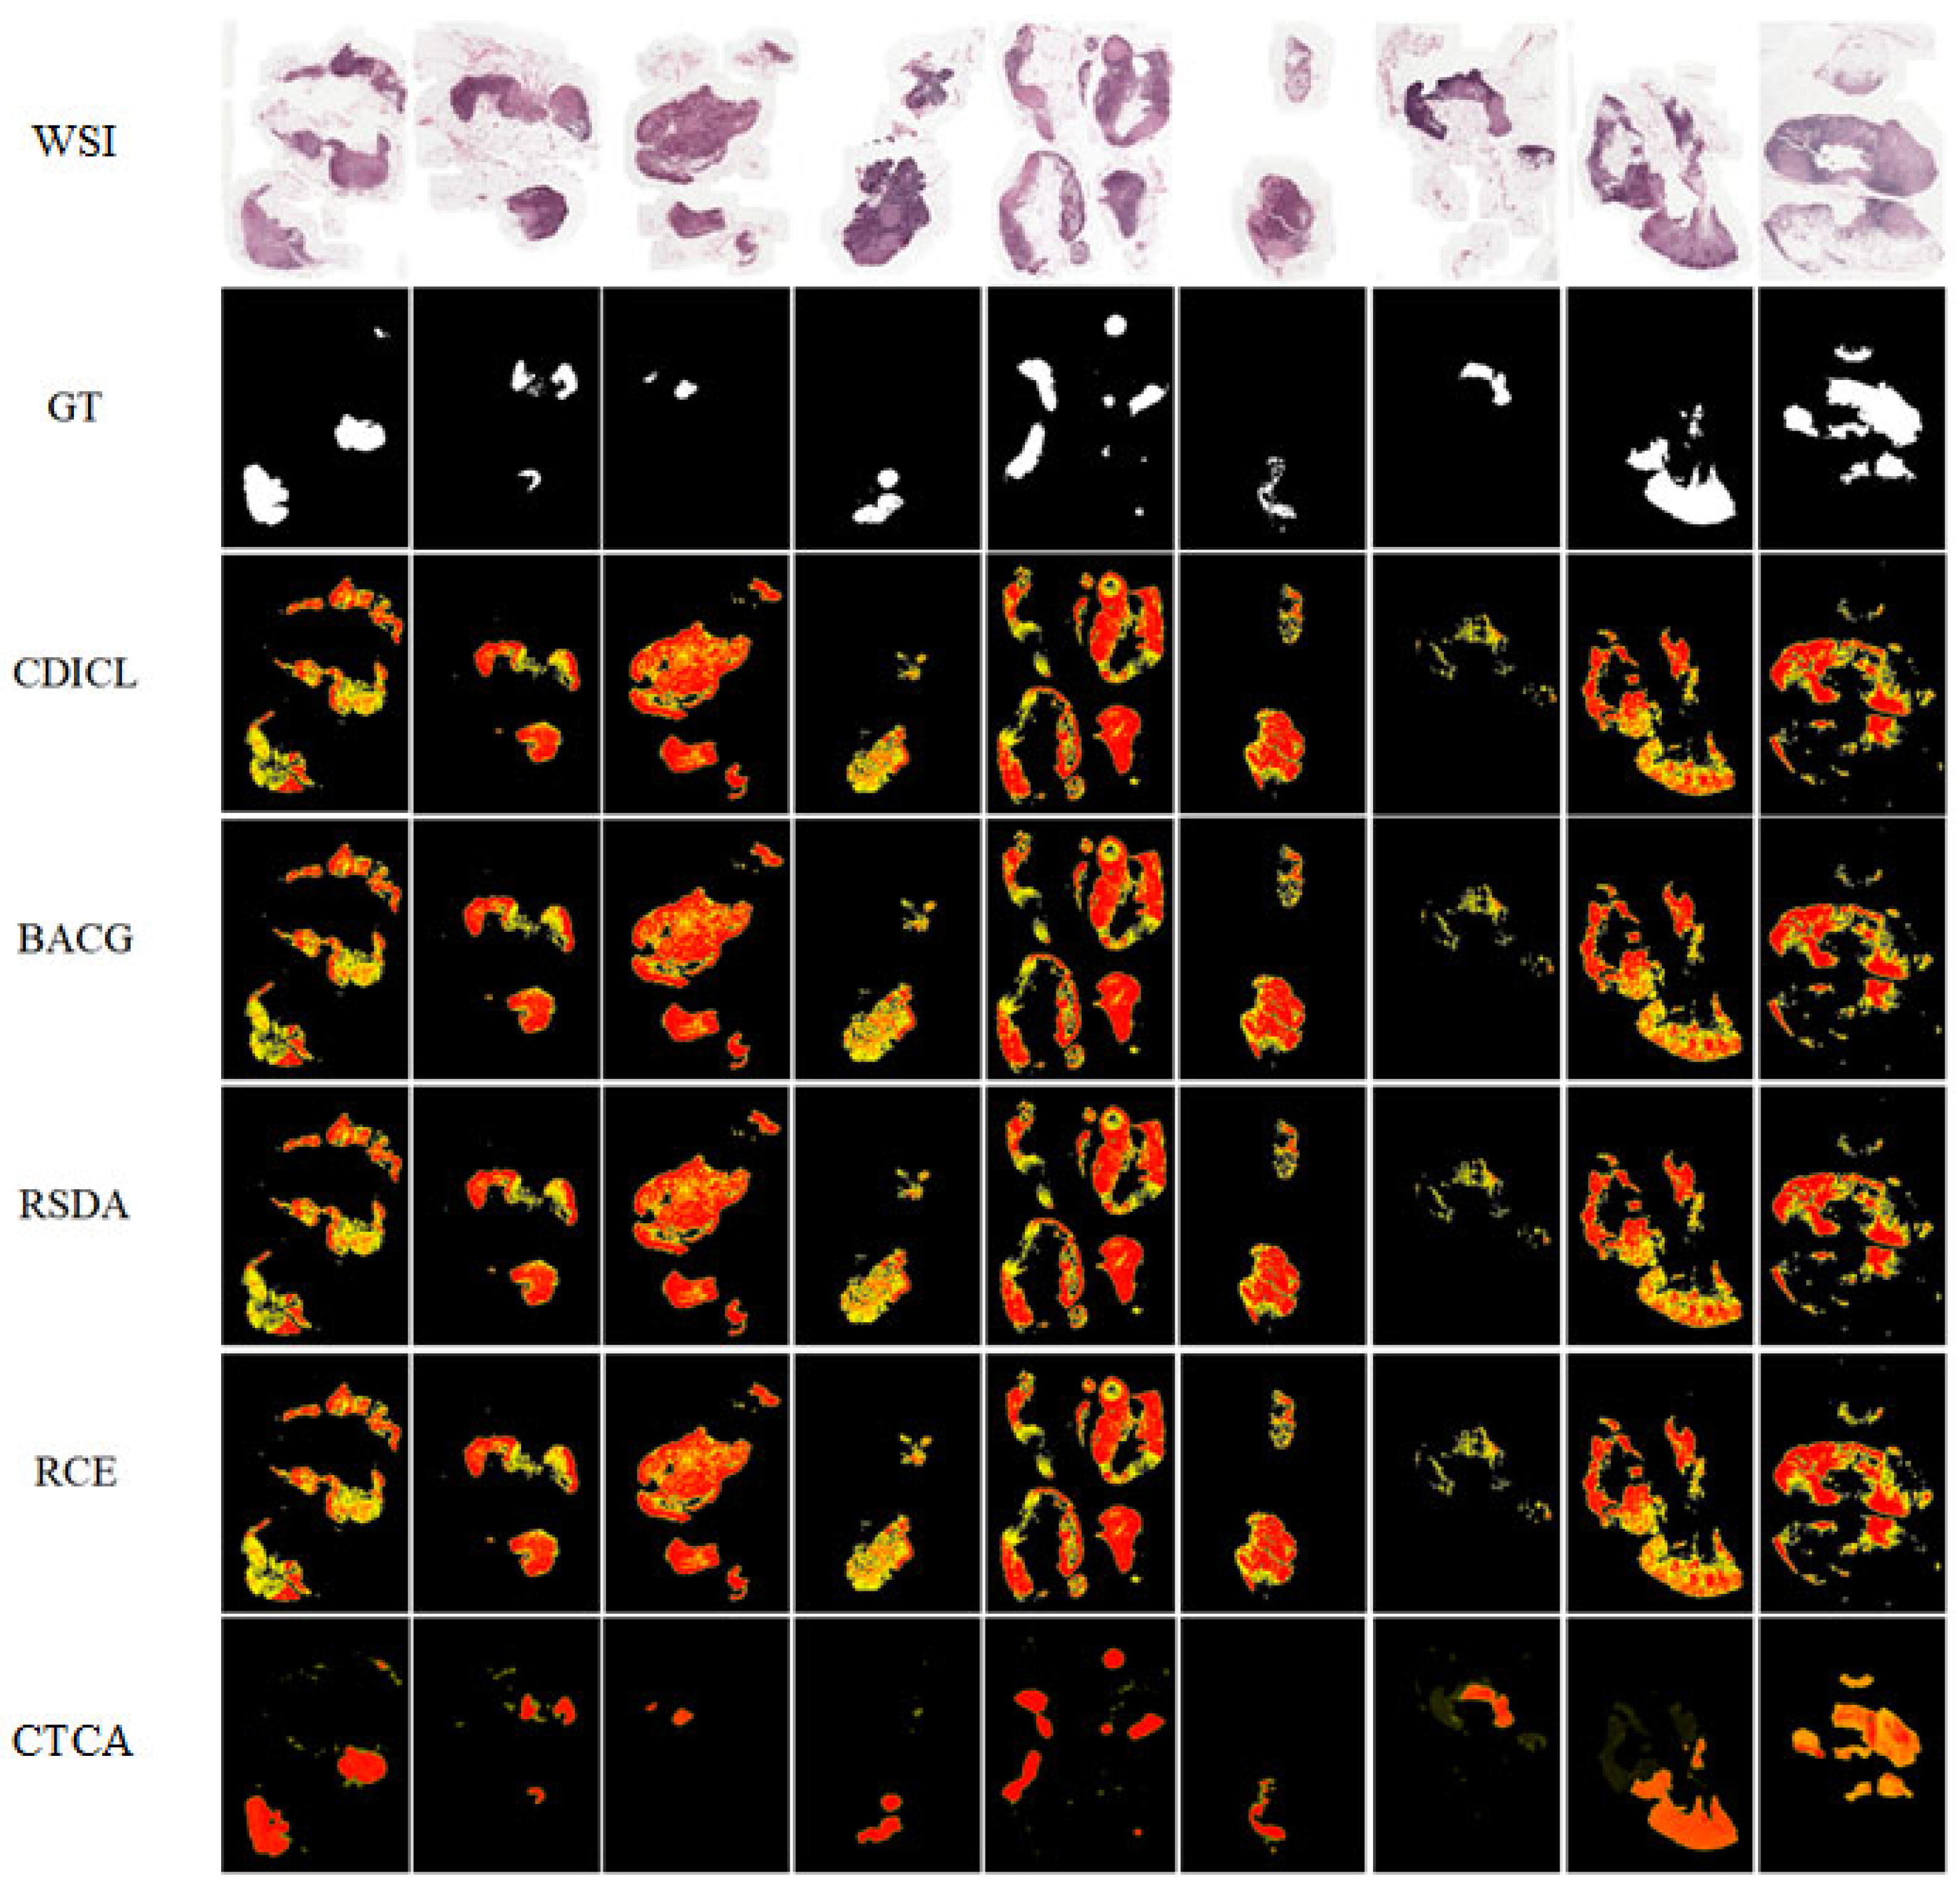
Comparing the probability heatmaps with the GT binary mask images allows for a qualitative assessment of the model’s ability to identify cancerous regions in WSIs. As shown in Figure 5, for the task of identifying cancerous regions in CAMELYON16 WSIs, the proposed method detects lesion regions that are closest in shape and size to the GT with more accurate and detailed boundaries compared to other methods. This suggests that the method can assist clinicians in precisely identifying diseased areas and providing targeted diagnostic support, effectively improving diagnostic efficiency. In contrast, other methods tend to classify all tissue regions as cancerous, indicating that they fail to learn discriminative features for cancer classification during training and are therefore unsuitable for assisting diagnosis.
Figure 5.
The comparison between the thumbnail, ground-truth binary maps, and probability heatmaps of different compared methods for representative WSIs from the Camelyon16 dataset.
It should be noted that the probability heatmaps presented here are generated by mapping patch-level (224 × 224) classification probabilities back to their original WSI coordinates. Although pixel-level ground-truth masks are available in the datasets, the heatmaps represent aggregated decisions at the patch level, rather than pixel-accurate segmentation. Consequently, the visual comparison with ground-truth masks serves primarily as qualitative evidence of spatial reasoning for image-level classification, rather than as a validated segmentation output. This design aligns with the core objective of our study—WSI-level diagnostic classification—with heatmaps functioning as interpretability aids to assist pathologists in understanding model decisions.
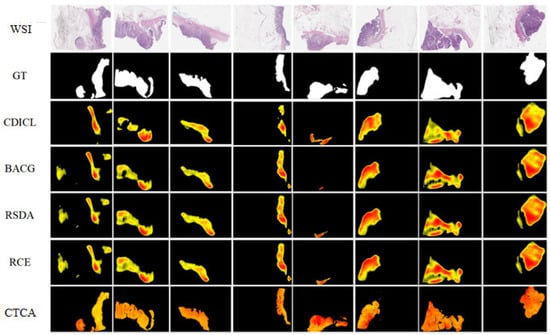
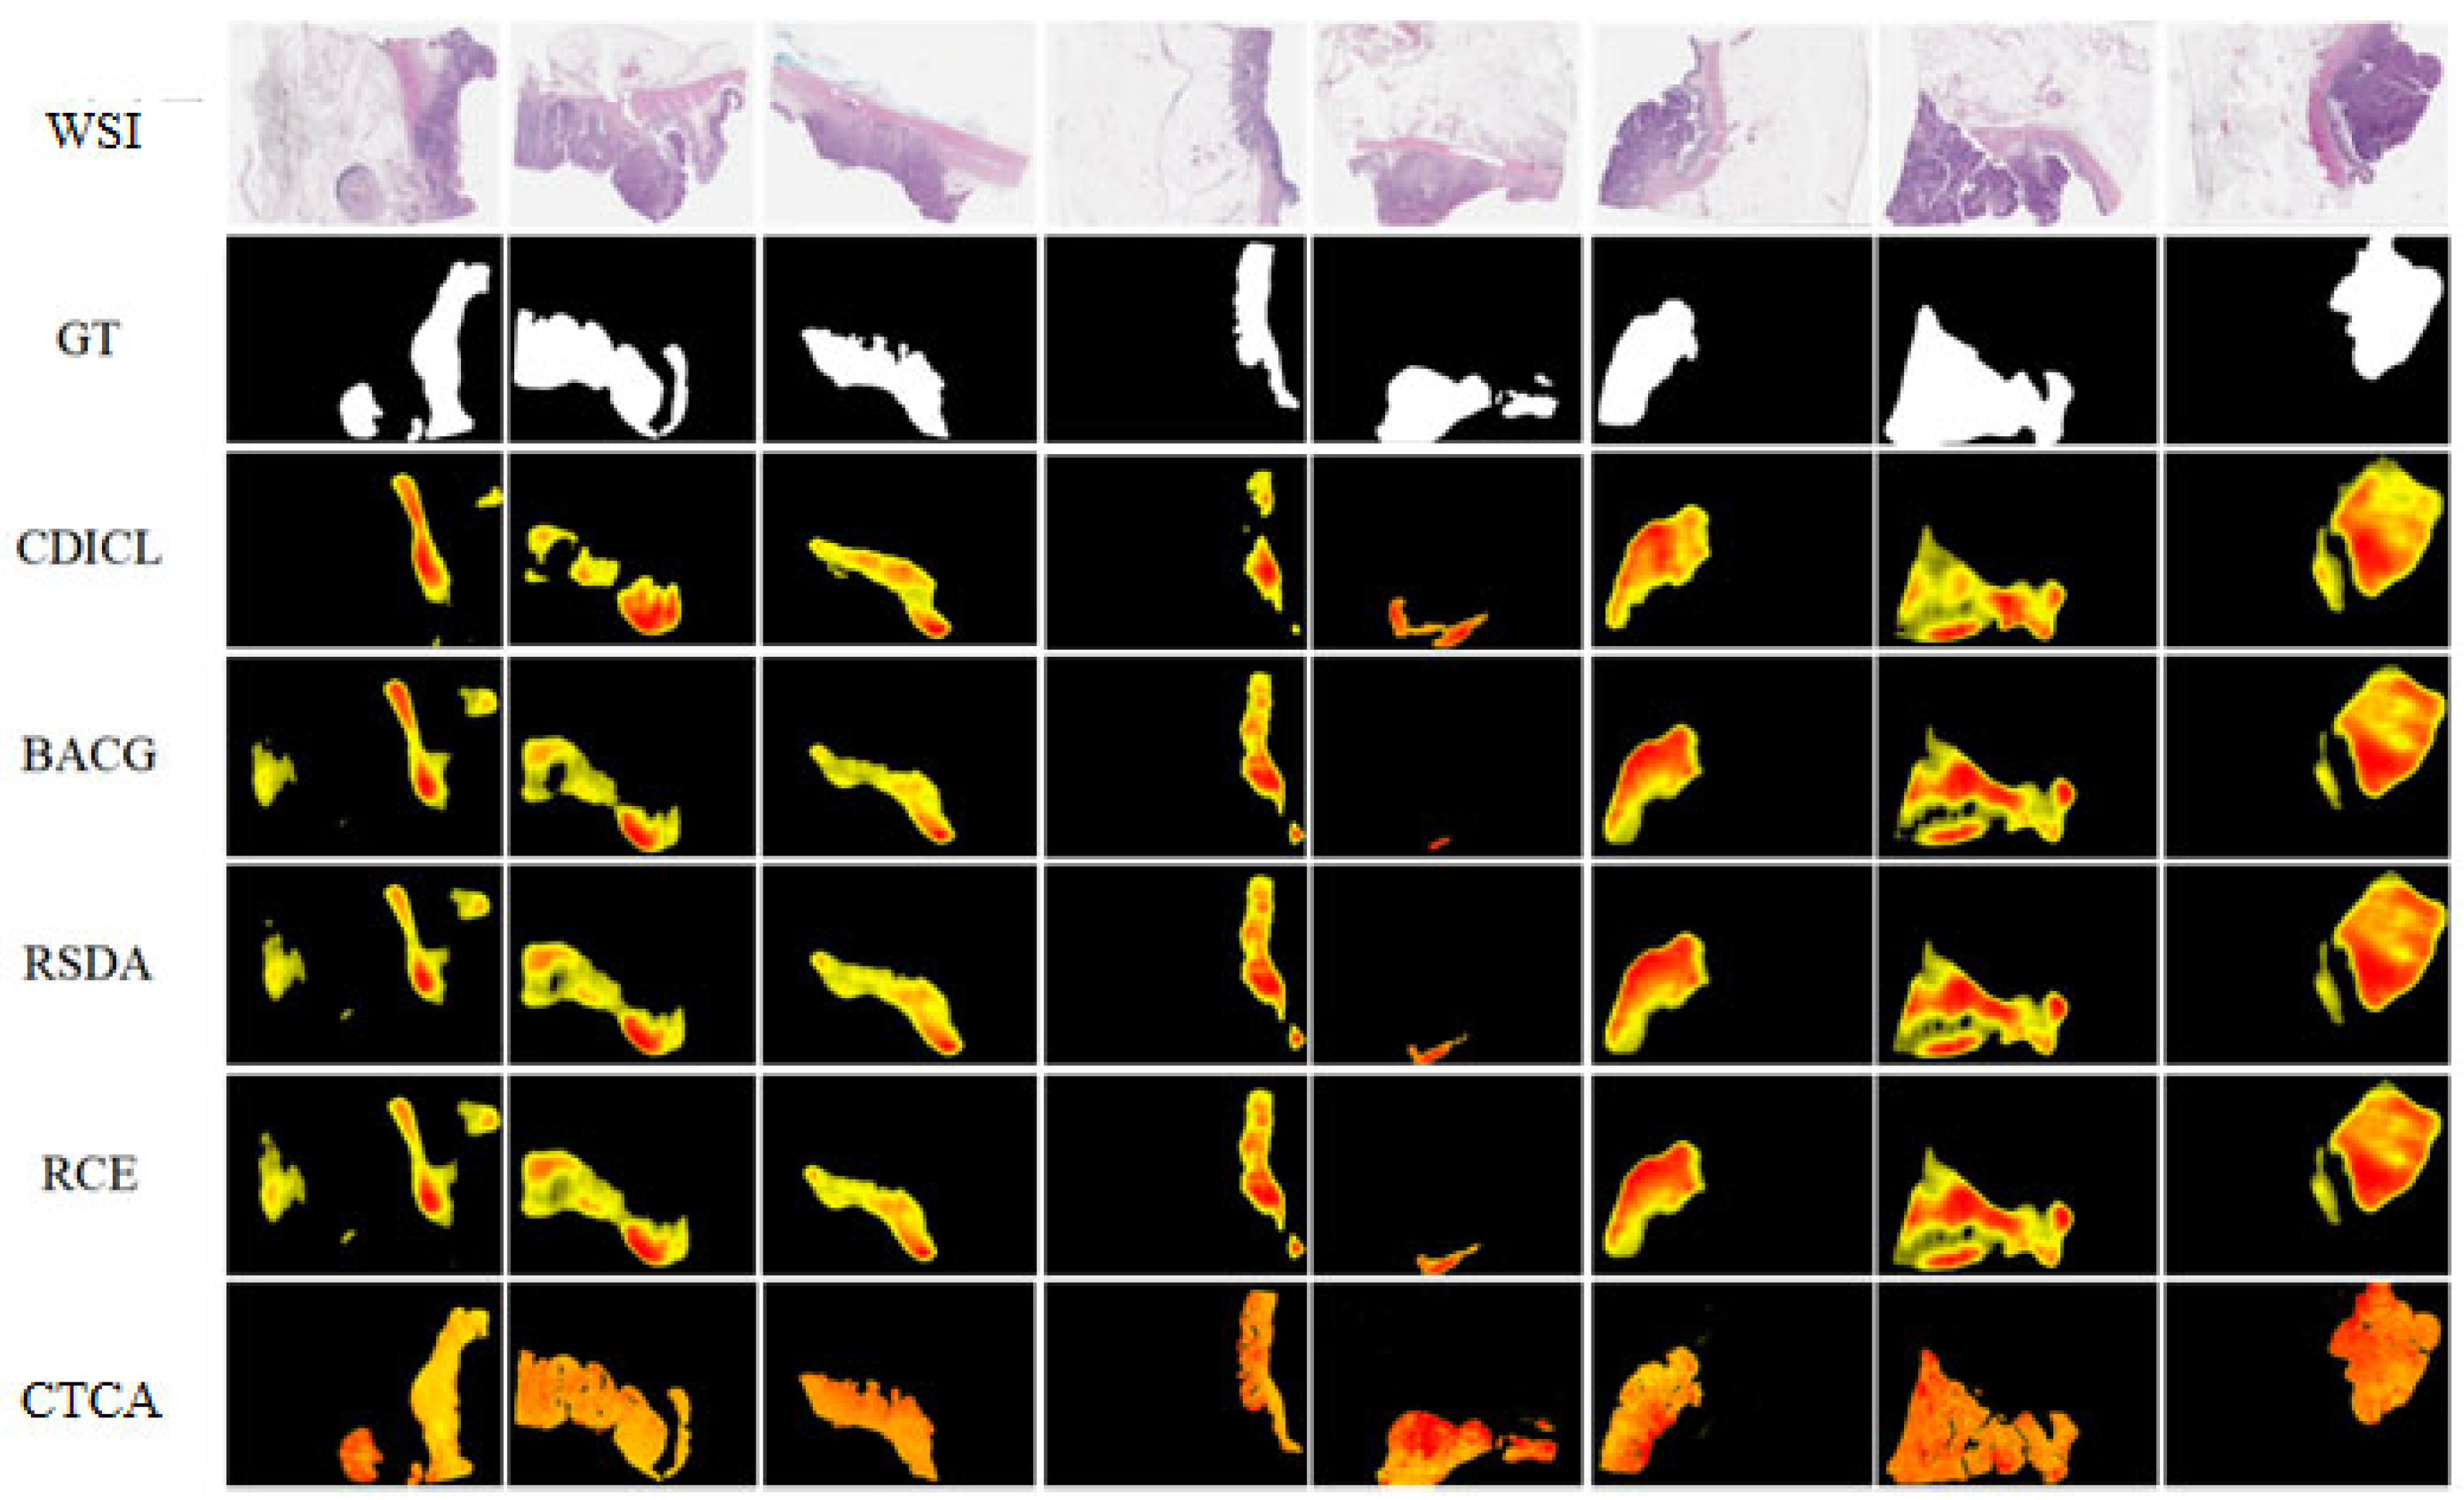
The cancer identification results for the colon cancer dataset PAIP2020 are shown in Figure 6. The probability heatmap generated by the proposed CTCA algorithm matches the cancerous regions in the GT most closely. For the first and fifth WSIs, where other methods show large prediction errors, CTCA successfully identifies the cancerous regions. In addition, the boundary of the labeled regions in the probability heatmap obtained by the proposed method aligns more closely with the GT mask boundary, and the method detects more accurate cancerous regions, indicating higher recognition accuracy and better compliance with the complex and high-standard requirements of clinical application.
Figure 6.
The comparison between thumbnail, ground-truth binary maps, and probability heatmaps of different compared methods for representative WSIs from the PAIP2020 dataset.
4.4. Ablation Experiment Results and Analysis
This section evaluates the effectiveness of the model’s feature extraction and unsupervised domain adaptation components through ablation studies.
The ablation experiments aim to assess the contributions of the CNN-SwinT feature extraction and fusion module and the conditional-sample domain alignment module. The proposed CTCA framework is compared with the following variants:
(1) CTCA-Varient1: This variant removes the BreNet convolutional network in feature extraction and uses only the Swin Transformer to extract image features;
(2) CTCA-Varient2: This variant retains BreNet for feature extraction but removes the Swin Transformer component;
(3) CTCA-Varient3: This variant removes the conditional domain alignment operation but keeps the sample-level domain alignment;
(4) CTCA-Varient4: This variant retains the conditional domain alignment operation but removes the sample-level domain alignment.
Table 3 presents the submodule differences between the CTCA algorithm and the ablated variants. The classification results of the ablation study are shown in Table 4 and Table 5.
Table 3.
Ablation algorithm settings for the estimation of each module.
Table 4.
Ablation variant performance analysis (BreaKHis100×-Camelyon16) (unit: %).
Table 5.
Ablation variant performance analysis (Mice-PAIP2020) (unit: %).
4.4.1. Analysis of Contributions of the Feature Extraction Module
Ablation of the feature extraction module focuses on the complementarity of BreNet and Swin Transformer. As shown in Table 4 and Table 5, Variant 1 (Swin Transformer only) achieves an F1 score of merely 66.64% in the breast cancer transfer task and performs significantly worse than other configurations in the colon cancer task. The model also tends to classify almost all samples as positive. This indicates that relying solely on the global attention mechanism makes it difficult to capture key local texture and cellular morphological features in pathological images. In contrast, Variant 2 (BreNet only) demonstrates robust performance in both tasks, with an F1 score of 83.11% for breast cancer and high accuracy maintained for colon cancer. It performs particularly well in terms of specificity, verifying the advantage of convolutional networks in extracting local fine-grained features. However, Variant 2 has relatively low sensitivity, suggesting limitations in its ability to identify complex tumor regions.
By performing weighted fusion of the features of BreNet and Swin Transformer, the complete CTCA framework further increases the F1 score of the breast cancer task to 92.41% (+9.30%) on the basis of Variant 2 and significantly improves the sensitivity–specificity balance (92.30% vs. 84.40%). This gain stems from the complementarity of the two networks: BreNet excels at capturing cell-level local abnormalities, while Swin Transformer models the tissue structure context of a larger receptive field through the hierarchical window attention mechanism. The fusion of the two effectively enhances the model’s ability to represent multi-scale pathological features.
4.4.2. Analysis of Contributions of the Domain Alignment Module
Ablation of the domain alignment module aims to verify the synergy of conditional alignment and sample alignment. Variant 3 (sample-level alignment only) achieves an F1 score of 89.48% in the breast cancer task. Though superior to the single feature extractor configurations, it has significantly higher sensitivity (90.87%) than specificity (75.50%). This indicates that aligning only the marginal distribution is prone to causing a shift in decision boundaries, and a similar imbalance is observed in cross-species transfer (Table 5). Variant 4 (conditional alignment only) shows the opposite trend: excessively high sensitivity with severely insufficient specificity (62.70%). This reflects that conditional distribution alignment, without global sample-level constraints, is likely to misclassify normal tissues as lesions and increase the risk of clinical misdiagnosis.
The complete CTCA integrates both conditional alignment and sample alignment, achieving optimal and balanced performance in both tasks (F1 = 92.41% for breast cancer, sensitivity = 92.30%/specificity = 84.40%). This result demonstrates that sample-level alignment provides a stable foundation for domain-invariant representations for the model by matching the overall feature distributions of the source and target domains; conditional alignment further refines the distribution alignment of samples from the same class and alleviates class conditional shift. The two form complementary constraints, jointly improving the robustness and clinical applicability of cross-domain classification.
4.4.3. Summary of Component Contributions
The comprehensive ablation results can be summarized as follows: (1) BreNet, as the base feature extractor, exerts a decisive effect on model performance, and its absence will lead to model failure. (2) The introduction of Swin Transformer leads to an F1 gain of approximately 9.3% through multi-scale feature complementarity. (3) Sample-level and conditional-level domain alignment have orthogonal contributions. Using either strategy alone will cause an imbalance between sensitivity and specificity, while their synergy can further boost the F1 score by about 2.9% and optimize the balance of clinical metrics. The above analysis shows that each component in the CTCA framework not only has independent value but also realizes cumulative performance improvement through synergy.
5. Discussion
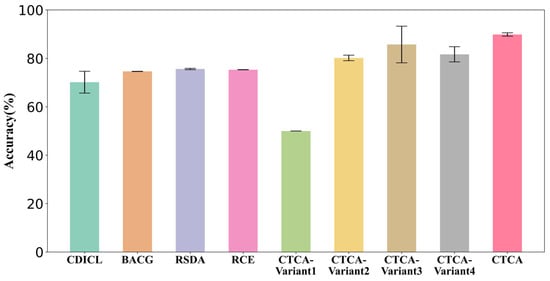
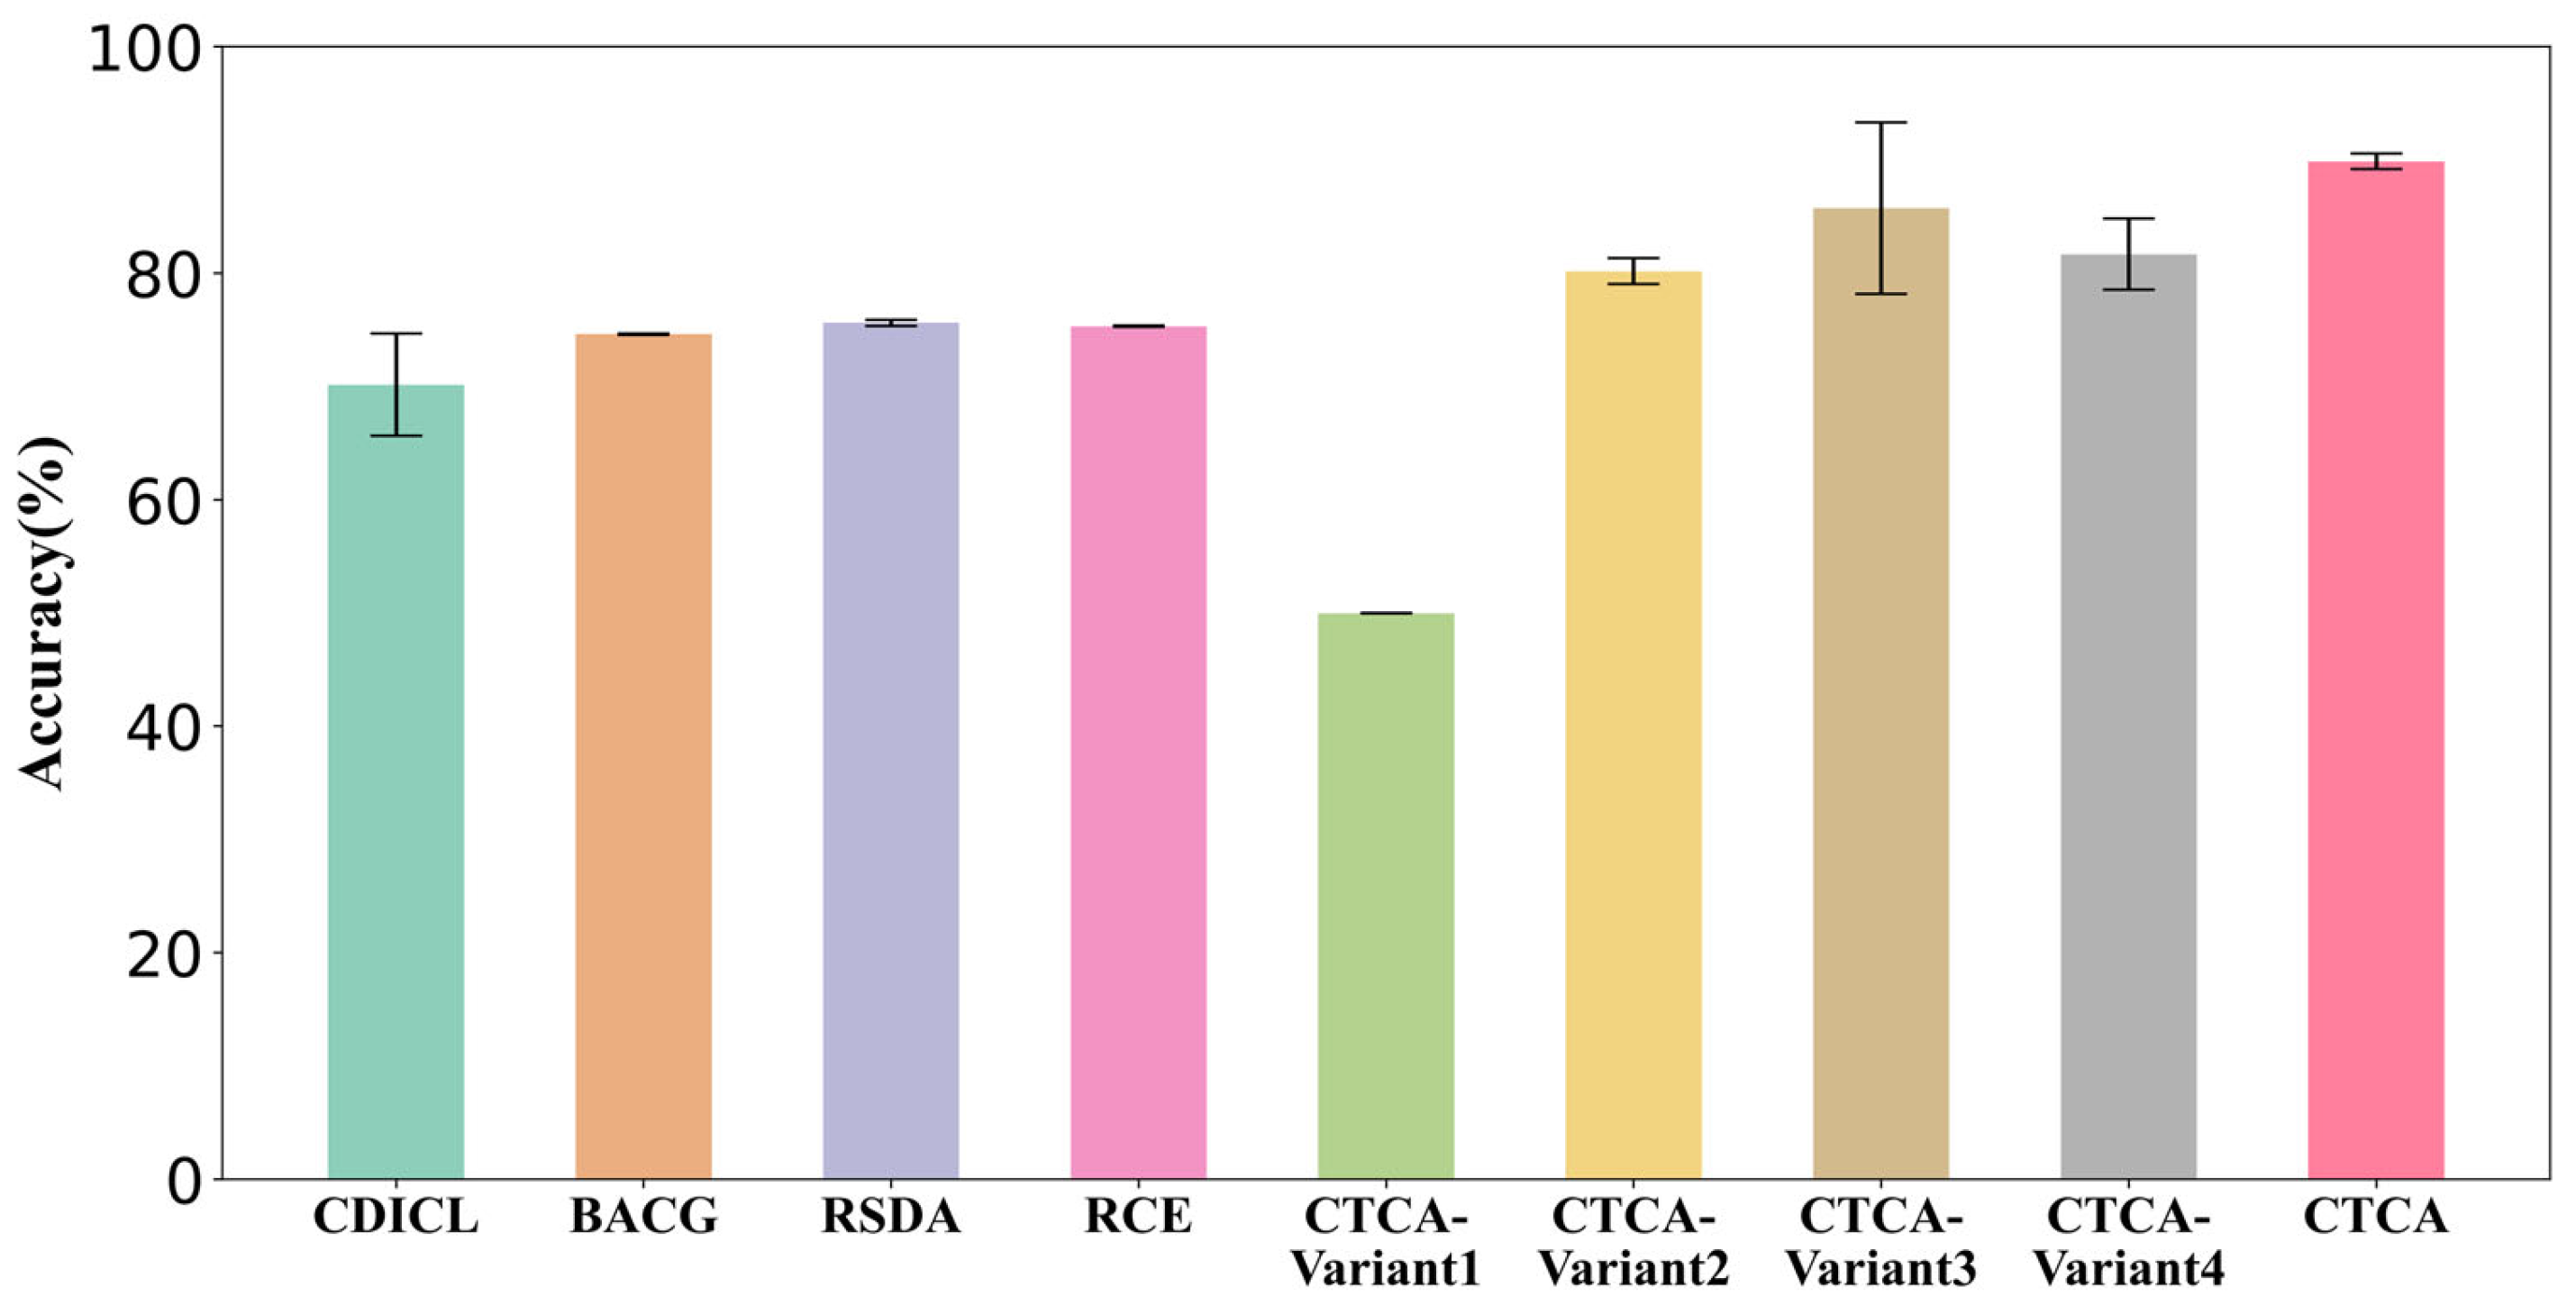
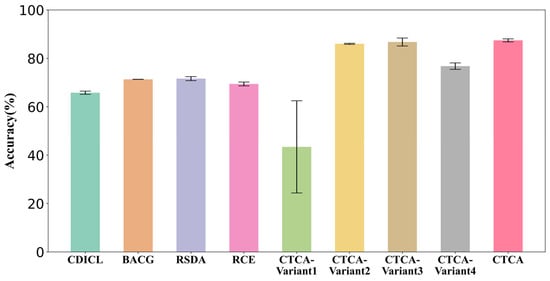
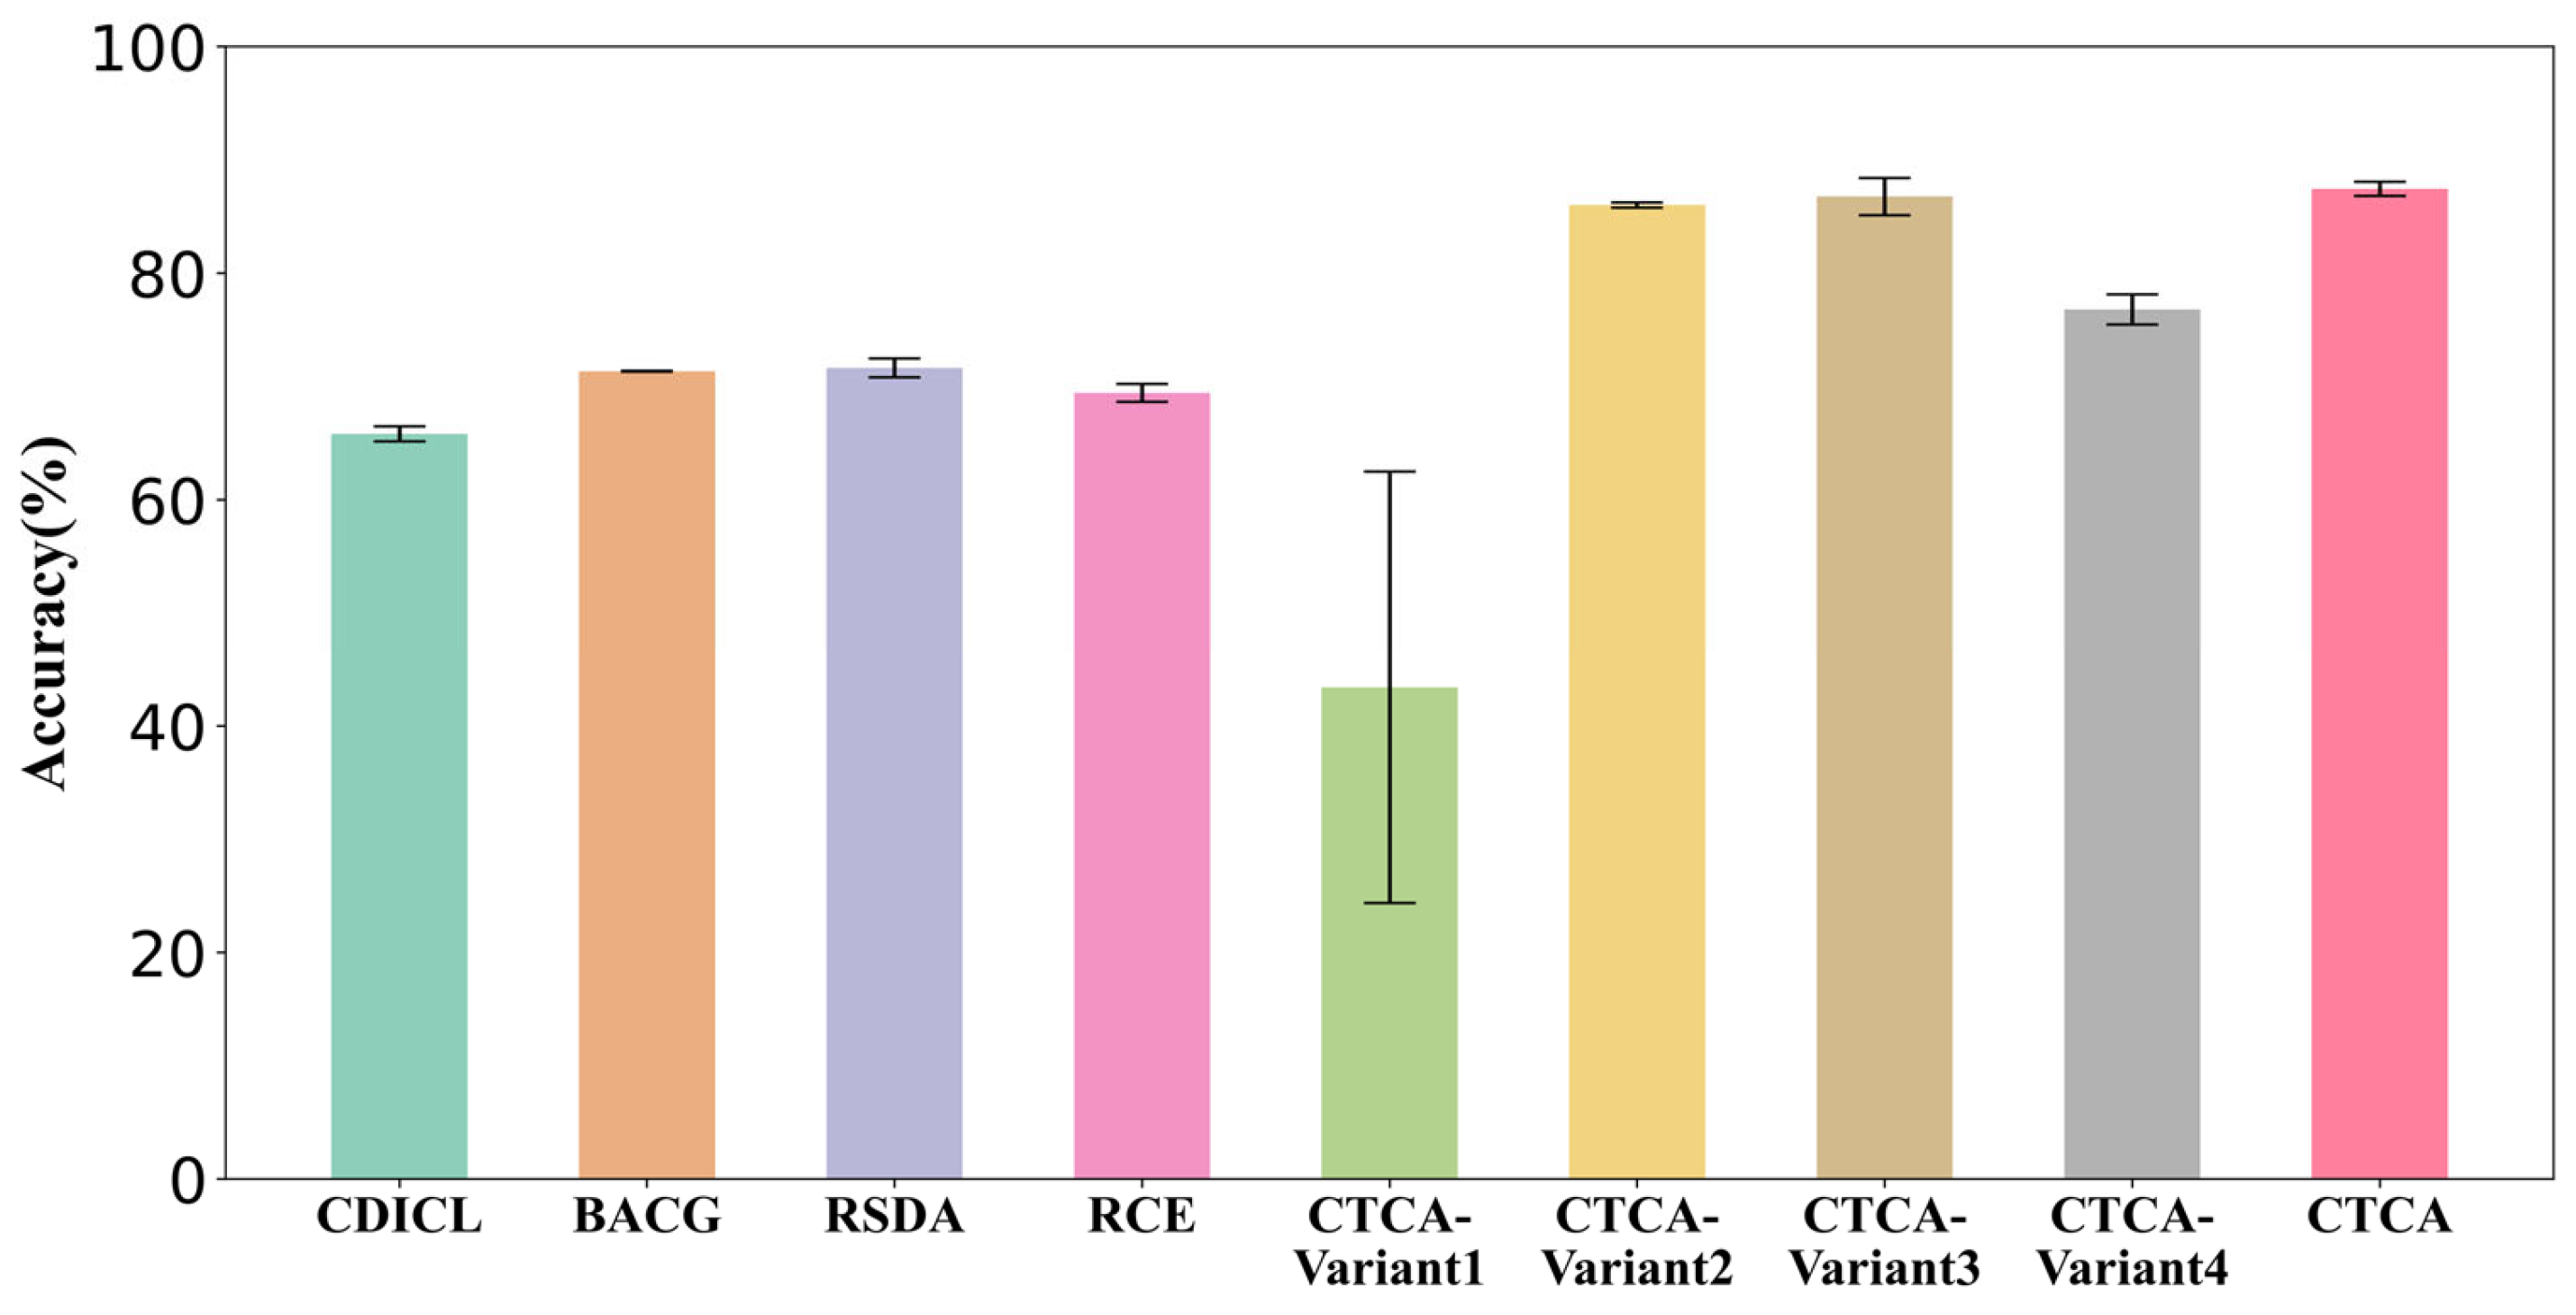
In domain adaptation experiments from small-sized pathological images to WSI of breast and colon cancer, the proposed algorithm achieves classification accuracies of 89.87% and 87.45%, respectively. It significantly outperforms other unsupervised domain adaptation and ablation methods. The experimental results of all methods are shown in Figure 7 and Figure 8, demonstrating the algorithm’s strong performance and good generalization ability. In ablation studies, the CTCA algorithm performs better than other ablated variants in breast and colon cancer lesion prediction. This indicates that combining the BreNet and Swin Transformer effectively captures cancer-specific features at both local and global scales, enhancing the classifier’s ability to identify and classify image patches. The combination of conditional domain alignment and sample-level domain alignment effectively reduces domain shift and feature distribution differences between source and target domains, enabling the model to perform accurate unsupervised classification on target domain images. By mapping the predicted probabilities of the patches back to the original WSI, visual probability heatmaps are generated, showing the model’s ability to predict cancerous regions in WSIs and highlighting the potential of this proposed method for clinical application.
Figure 7.
Accuracy comparison across algorithms (BreaKHis_100 × Camelyon16).
Figure 8.
Accuracy comparison across algorithms (Mice-PAIP2020).
The p-value comparisons between CTCA and the benchmark and ablation methods, based on classification accuracy, are shown in Table 6 (BreaKHis100×-Camelyon16) and Table 7 (Mice-PAIP2020). These results show that CTCA achieves statistically significant performance improvements over the compared methods (p < 0.05), confirming its effectiveness in pathological image classification tasks.
Table 6.
Statistical analysis of p-values (BreaKHis_100×Camelyon16).
Table 7.
Statistical analysis of p-values (Mice-PAIP2020).
6. Conclusions
This paper proposes an unsupervised domain adaptation method for cancerous region identification in WSIs, named the CTCA algorithm. The CTCA algorithm uses small-sized pathological images as the source domain to extract cancer-specific information, which guides the model in performing unsupervised cancer prediction on target WSI patches. First, the model employs a parallel feature extraction and fusion module combining BreNet and Swin Transformer to extract sample features. This design integrates the CNN’s high sensitivity for fine details and the Transformer’s effective capture of global semantic information, enabling multi-scale and multi-perspective extraction of high-dimensional features followed by weighted fusion. Then, a conditional-sample domain alignment module maps the fused features into the RKHS space. By using label information as a conditioning variable, the method minimizes the second-order Wasserstein distance between conditional covariance operators across domains while also considering the maximum mean discrepancy between cross-domain features. This aligns the marginal distributions of the source and target domains while preserving intra-domain class distribution differences. The model then performs unsupervised cancer classification on both breast and colon cancer pathological images across domains or species. Compared with other UDA and ablation methods, CTCA achieves the best performance in detecting cancerous regions in WSI images, demonstrating its ability to effectively extract pathological features and transfer cancer-specific information from the source domain to enable cancer detection on the target domain WSI. Visualization of the predictions can assist pathologists in detecting cancerous regions, significantly improving diagnostic efficiency. Moreover, the model performs well in both breast and colon cancer prediction tasks across domains or species, further demonstrating its generalization ability and clinical application potential.
In an upcoming study, we aim to investigate a wider range of network architectures for feature extraction and integration. We also intend to apply our approach to additional datasets and evaluate its performance across diverse medical imaging modalities.
Author Contributions
Conceptualization, P.W.; methodology, J.Z. and T.L.; supervision, P.W. and Y.L.; software, formal analysis, writing—original draft preparation, J.Z.; writing—reviewing and editing, P.L. All authors have read and agreed to the published version of the manuscript.
Funding
We are grateful for the support of the National Natural Science Foundation of China (NSFC) (No. U21A20448 and 72001032); the Chongqing Traditional Chinese Medicine innovation team construction project (2023110002); and the research fund of Chongqing (CSTB2021TIAD-KPX0069 and CSTB2023TIAD-ZXX0049).
Institutional Review Board Statement
Not applicable.
Informed Consent Statement
Not applicable.
Data Availability Statement
The data presented in this study are available (BreaKHis: https://web.inf.ufpr.br/vri/databases/breast-cancer-histopathological-database-breakhis/ (accessed on 6 June 2022), CAMELYON16: https://camelyon16.grand-challenge.org/ (accessed on 10 May 2023), PAIP2020: https://paip2020.grand-challenge.org/ (accessed on 5 June 2022)).
Conflicts of Interest
The authors declare no conflicts of interest.
References
- Bray, F.; Laversanne, M.; Sung, H.; Ferlay, J.; Siegel, R.L.; Soerjomataram, I.; Jemal, A. Global Cancer Statistics 2022: GLOBOCAN Estimates of Incidence and Mortality Worldwide for 36 Cancers in 185 Countries. CA A Cancer J. Clin. 2024, 74, 229–263. [Google Scholar] [CrossRef] [Scilit]
- Han, B.; Zheng, R.; Zeng, H.; Wang, S.; Sun, K.; Chen, R.; Li, L.; Wei, W.; He, J. Cancer Incidence and Mortality in China, 2022. J. Natl. Cancer Cent. 2024, 4, 47–53. [Google Scholar] [CrossRef] [Scilit]
- Hölscher, D.L.; Bülow, R.D. Decoding pathology: The Role of Computational Pathology in Research and Diagnostics. Pflügers Arch.-Eur. J. Physiol. 2024, 477, 555–570. [Google Scholar] [CrossRef] [Scilit] [PubMed]
- Nasir, E.S.; Parvaiz, A.; Fraz, M.M. Nuclei and Glands Instance Segmentation in Histology Images: A Narrative Review. Artif. Intell. Rev. 2023, 56, 7909–7964. [Google Scholar] [CrossRef] [Scilit]
- Li, S.; Shi, S.; Fan, Z.; He, X.; Zhang, N. Deep Information-Guided Feature Refinement Network for Colorectal Gland Segmentation. Int. J. Comput. Assist. Radiol. Surg. 2023, 18, 2319–2328. [Google Scholar] [CrossRef] [Scilit] [PubMed]
- Rezazadeh, I.; Duygulu, P. Multi-Task Learning for Gland Segmentation. Signal Image Video Process. 2023, 17, 1–9. [Google Scholar] [CrossRef] [Scilit]
- Kang, H.; Xu, Q.; Chen, D.; Ren, S.; Xie, H.; Wang, L.; Gao, Y.; Gong, M.; Chen, X. Assessing the Performance of Fully Supervised and Weakly Supervised Learning in Breast Cancer Histopathology. Expert Syst. Appl. 2024, 237, 121575. [Google Scholar] [CrossRef] [Scilit]
- Yan, R.; Ren, F.; Wang, Z.; Wang, L.; Zhang, T.; Liu, Y.; Rao, X.; Zheng, C.; Zhang, F. Breast Cancer Histopathological Image Classification Using a Hybrid Deep Neural Network. Methods 2020, 173, 52–60. [Google Scholar] [CrossRef] [Scilit]
- Gupta, M.; Verma, N.; Sharma, N.; Singh, S.N.; Singh, R.K.B.; Sharma, S.K. Deep Transfer Learning Hybrid Techniques for Precision in Breast Cancer Tumor Histopathology Classification. Health Inf. Sci. Syst. 2025, 13, 20. [Google Scholar] [CrossRef] [Scilit]
- Alshardan, A.; Ahmad, N.; Ben Miled, A.; Alshuhail, A.; Alzahrani, Y.; Mahmud, A. Transferable Deep Learning with Coati Optimization Algorithm Based Mitotic Nuclei Segmentation and Classification Model. Sci. Rep. 2024, 14, 30557. [Google Scholar] [CrossRef] [Scilit]
- Houssein, E.H.; Emam, M.M.; Ali, A.A.; Suganthan, P.N. Deep and Machine Learning Techniques for Medical Imaging-Based Breast Cancer: A Comprehensive Review. Expert Syst. Appl. 2021, 167, 114161. [Google Scholar] [CrossRef] [Scilit]
- Al-Thelaya, K.; Gilal, N.U.; Alzubaidi, M.; Majeed, F.; Agus, M.; Schneider, J.; Househ, M. Applications of Discriminative and Deep Learning Feature Extraction Methods for Whole Slide Image Analysis: A Survey. J. Pathol. Inform. 2023, 14, 100335. [Google Scholar] [CrossRef] [Scilit] [PubMed]
- Salvi, M.; Acharya, U.R.; Molinari, F.; Meiburger, K.M. The Impact of Pre- and Post- Image Processing Techniques on Deep Learning Frameworks: A Comprehensive Review for Digital Pathology Image Analysis. Comput. Biol. Med. 2021, 128, 104129. [Google Scholar] [CrossRef] [Scilit] [PubMed]
- Dabeer, S.; Khan, M.M.; Islam, S. Cancer Diagnosis in Histopathological Image: CNN Based Approach. Inform. Med. Unlocked 2019, 16, 100231. [Google Scholar] [CrossRef] [Scilit]
- Springenberg, M.; Frommholz, A.; Wenzel, M.; Weicken, E.; Ma, J.; Strodthoff, N. From Modern CNNs to Vision Transformers: Assessing the Performance, Robustness, and Classification Strategies of Deep Learning Models in Histopathology. Med. Image Anal. 2023, 87, 102809. [Google Scholar] [CrossRef] [Scilit]
- Mi, W.; Li, J.; Guo, Y.; Ren, X.; Liang, Z.; Zhang, T.; Zou, H. Deep Learning-Based Multi-Class Classification of Breast Digital Pathology Images. Cancer Manag. Res. 2021, 13, 4605–4617. [Google Scholar] [CrossRef] [Scilit]
- Jiang, X.; Wang, S.; Zhang, Y. Vision Transformer Promotes Cancer Diagnosis: A Comprehensive Review. Expert Syst. Appl. 2024, 252, 124113. [Google Scholar] [CrossRef] [Scilit]
- Atabansi, C.C.; Nie, J.; Liu, H.; Song, Q.; Yan, L.; Zhou, X. A Survey of Transformer Applications for Histopathological Image Analysis: New Developments and Future Directions. Biomed. Eng. Online 2023, 22, 96. [Google Scholar] [CrossRef] [Scilit]
- Xu, H.; Xu, Q.; Cong, F.; Kang, J.; Han, C.; Liu, Z.; Madabhushi, A.; Lu, C. Vision Transformers for Computational Histopathology. IEEE Rev. Biomed. Eng. 2023, 17, 63–79. [Google Scholar] [CrossRef] [Scilit]
- Cai, H.; Feng, X.; Yin, R.; Zhao, Y.; Guo, L.; Fan, X.; Liao, J. MIST: Multiple Instance Learning Network Based on Swin Transformer for Whole Slide Image Classification of Colorectal Adenomas. J. Pathol. 2023, 259, 125–135. [Google Scholar] [CrossRef] [Scilit]
- Zhang, Y.; Wei, Y.; Wu, Q.; Zhao, P.; Niu, S.; Huang, J.; Tan, M. Collaborative Unsupervised Domain Adaptation for Medical Image Diagnosis. IEEE Trans. Image Process. 2020, 29, 7834–7844. [Google Scholar] [CrossRef] [Scilit]
- Kumari, S.; Singh, P. Deep Learning for Unsupervised Domain Adaptation in Medical Imaging: Recent Advancements and Future Perspectives. Comput. Biol. Med. 2024, 170, 107912. [Google Scholar] [CrossRef] [Scilit] [PubMed]
- Nasser, M.; Yusof, U.K. Deep Learning Based Methods for Breast Cancer Diagnosis: A Systematic Review and Future Direction. Diagnostics 2023, 13, 161. [Google Scholar] [CrossRef] [Scilit] [PubMed]
- Guan, H.; Liu, M. Domain Adaptation for Medical Image Analysis: A Survey. IEEE Trans. Biomed. Eng. 2021, 69, 1173–1185. [Google Scholar] [CrossRef] [Scilit]
- Li, X.; Pan, C.; He, L.; Li, X. Unsupervised Domain Adaptation for Cross-Domain Histopathology Image Classification. Multimed. Tools Appl. 2024, 83, 23311–23331. [Google Scholar] [CrossRef] [Scilit]
- Li, Y.; Xu, J.; Wang, P.; Li, P.; Yang, G.; Chen, R. Manifold reconstructed semi-supervised domain adaptation for histopathology images classification. Biomed. Signal Process. Control 2023, 81, 104495. [Google Scholar] [CrossRef] [Scilit]
- Zhu, Y.; Wu, X.; Qiang, J.; Yuan, Y.; Li, Y. Representation Learning via an Integrated Autoencoder for Unsupervised Domain Adaptation. Front. Comput. Sci. 2023, 17, 175334. [Google Scholar] [CrossRef] [Scilit]
- Villani, C. The Wasserstein Distances. In Optimal Transport: Old and New; Springer: Heidelberg, Germany, 2009; pp. 93–111. [Google Scholar]
- Spanhol, F.A.; Oliveira, L.S.; Petitjean, C.; Heutte, L. A dataset for breast cancer histopathological image classification. IEEE Trans. Biomed. Eng. 2015, 63, 1455–1462. [Google Scholar] [CrossRef] [Scilit]
- Ehteshami Bejnordi, B.; Veta, M.; Johannes van Diest, P.; van Ginneken, B.; Karssemeijer, N.; Litjens, G.; van der Laak, J.A.W.M.; the CAMELYON16 Consortium; Hermsen, M.; Manson, Q.F.; et al. Diagnostic Assessment of Deep Learning Algorithms for Detection of Lymph Node Metastases in Women with Breast Cancer. JAMA 2017, 318, 2199–2210. [Google Scholar] [CrossRef] [Scilit]
- Kim, K.; Lee, K.; Cho, S.; Kang, D.U.; Park, S.; Kang, Y.; Kim, H.; Choe, G.; Moon, K.C.; Lee, K.S.; et al. PAIP 2020: Microsatellite Instability Prediction in Colorectal Cancer. Med. Image Anal. 2023, 89, 102886. [Google Scholar] [CrossRef] [Scilit]
- Tian, Q.; Wu, W. Confidence-Diffusion Instance Contrastive Learning for Unsupervised Domain Adaptation. Knowl. Based Syst. 2024, 293, 111717. [Google Scholar] [CrossRef] [Scilit]
- Zhao, C.; Zhao, H.; Zhu, H.; Huang, Z.; Feng, N.; Chen, E.; Xiong, H. Bi-Discriminator Domain Adversarial Neural Networks with Class-Level Gradient Alignment. IEEE Trans. Syst. Man Cybern. Syst. 2024, 54, 5283–5295. [Google Scholar] [CrossRef] [Scilit]
- Gu, X.; Sun, J.; Xu, Z. Unsupervised and Semi-Supervised Robust Spherical Space Domain Adaptation. IEEE Trans. Pattern Anal. Mach. Intell. 2022, 46, 1757–1774. [Google Scholar] [CrossRef] [Scilit]
- Ding, F.; Li, J.; Tian, W.; Zhang, S.; Yuan, W. Unsupervised Domain Adaptation via Risk-Consistent Estimators. IEEE Trans. Multimed. 2023, 26, 1179–1187. [Google Scholar] [CrossRef] [Scilit]

Disclaimer/Publisher’s Note: The statements, opinions and data contained in all publications are solely those of the individual author(s) and contributor(s) and not of MDPI and/or the editor(s). MDPI and/or the editor(s) disclaim responsibility for any injury to people or property resulting from any ideas, methods, instructions or products referred to in the content. |
© 2026 by the authors. Licensee MDPI, Basel, Switzerland. This article is an open access article distributed under the terms and conditions of the Creative Commons Attribution (CC BY) license.