


Abstract
Urban environments face heightened seismic risks due to dense infrastructure and population concentration. Traditional seismic methods often face significant practical limitations in cities due to space constraints, traffic disruption, and acoustic noise, necessitating reliable alternative geophysical approaches for fault screening. This study evaluates the efficacy and practical utility of the opposing-coils transient electromagnetic method (OCTEM) as an effective alternative to conventional seismic techniques for detecting shallow-fault-like resistivity signatures under complex urban electromagnetic noise. By employing dual coaxial coils with opposing currents, the OCTEM suppresses primary-field interference, enabling high-resolution imaging of subsurface structures at depths of 0–200 m. A case study in Tiancheng Chengyuan, Cangzhou City, China, demonstrates the OCTEM’s capability to reliably delineate stratigraphic interfaces and resistivity anomalies under challenging electromagnetic background conditions. Field data exhibited a mean square relative error of 4.01%, validating its data quality and measurement stability. The survey successfully identified stratigraphic continuity and localized heterogeneity features within the investigation zone. These results establish the OCTEM as a robust and efficient tool for urban fault screening, particularly in environments where traditional high-resolution seismic methods are impractical or economically unfeasible.
1. Introduction
Urban seismic safety assessments require reliable identification of potentially active- or concealed-fault-related structures beneath densely built environments, where population and infrastructure exposure is high [1,2]. In practice, subsurface fault screening in cities is constrained by limited working space, traffic restrictions, and strong anthropogenic electromagnetic (EM) noise from power lines and metallic infrastructure. Conventional high-resolution seismic approaches are capable of providing detailed imaging but are often costly, time-consuming, and logistically challenging to implement in urban communities, particularly in densely developed areas where surface access and equipment deployment are restricted [3,4,5]. In such contexts, electromagnetic-based methods offer significant operational advantages: minimal surface footprint, non-explosive operation, and rapid deployment under urban constraints.
Transient electromagnetic methods (TEMs) can map subsurface resistivity contrasts that may be associated with lithologic boundaries, water-bearing zones, and fault-related fracture/damage zones [1,6]. However, conventional small-loop TEM surveys commonly suffer from shallow “blind zones” and early-time distortion caused by transmitter–receiver coupling and turn-off effects, which limits their reliability for near-surface targets in the first tens of meters [7]. To address these limitations and improve urban detectability, the opposing-coils transient electromagnetic method (OCTEM) was developed to suppress primary-field effects using two identical transmitting coils connected in series with opposing current directions, enabling measurement near a primary-field “null” plane and improving shallow detectability under certain conditions [8,9,10,11]. Theoretical and published field studies demonstrate that the OCTEM can effectively enhance the signal-to-noise ratio in urban environments, making it more suitable for shallow-fault screening than conventional TEMs.
Despite these advantages, OCTEM data acquired in cities can still be biased by nearby metallic objects (e.g., towers, fences, buried utilities), and published urban case studies show that such interference may predominantly affect early-time observations and should be addressed through survey design and interpretation strategies [9,11]. Moreover, urban fault investigations typically benefit from integrating multiple datasets (e.g., gravity, resistivity, magnetotellurics, and seismic reflection) because single-method or single-line results may be non-unique and insufficient to confirm fault continuity. Therefore, OCTEM-based fault-screening studies should be reported with (i) a reproducible tectonic context, (ii) transparent acquisition and processing details, and (iii) appropriately bounded conclusions that distinguish “no observed fault signature along a profile” from “fault absence in the entire site” [1,2].
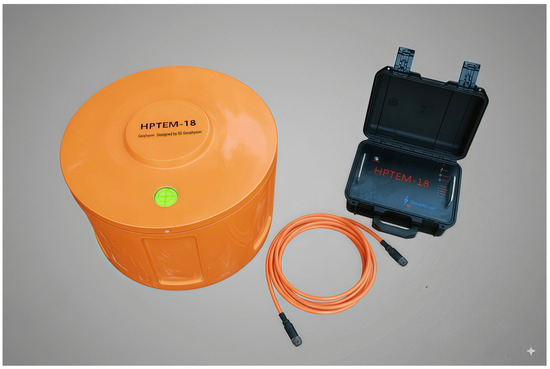
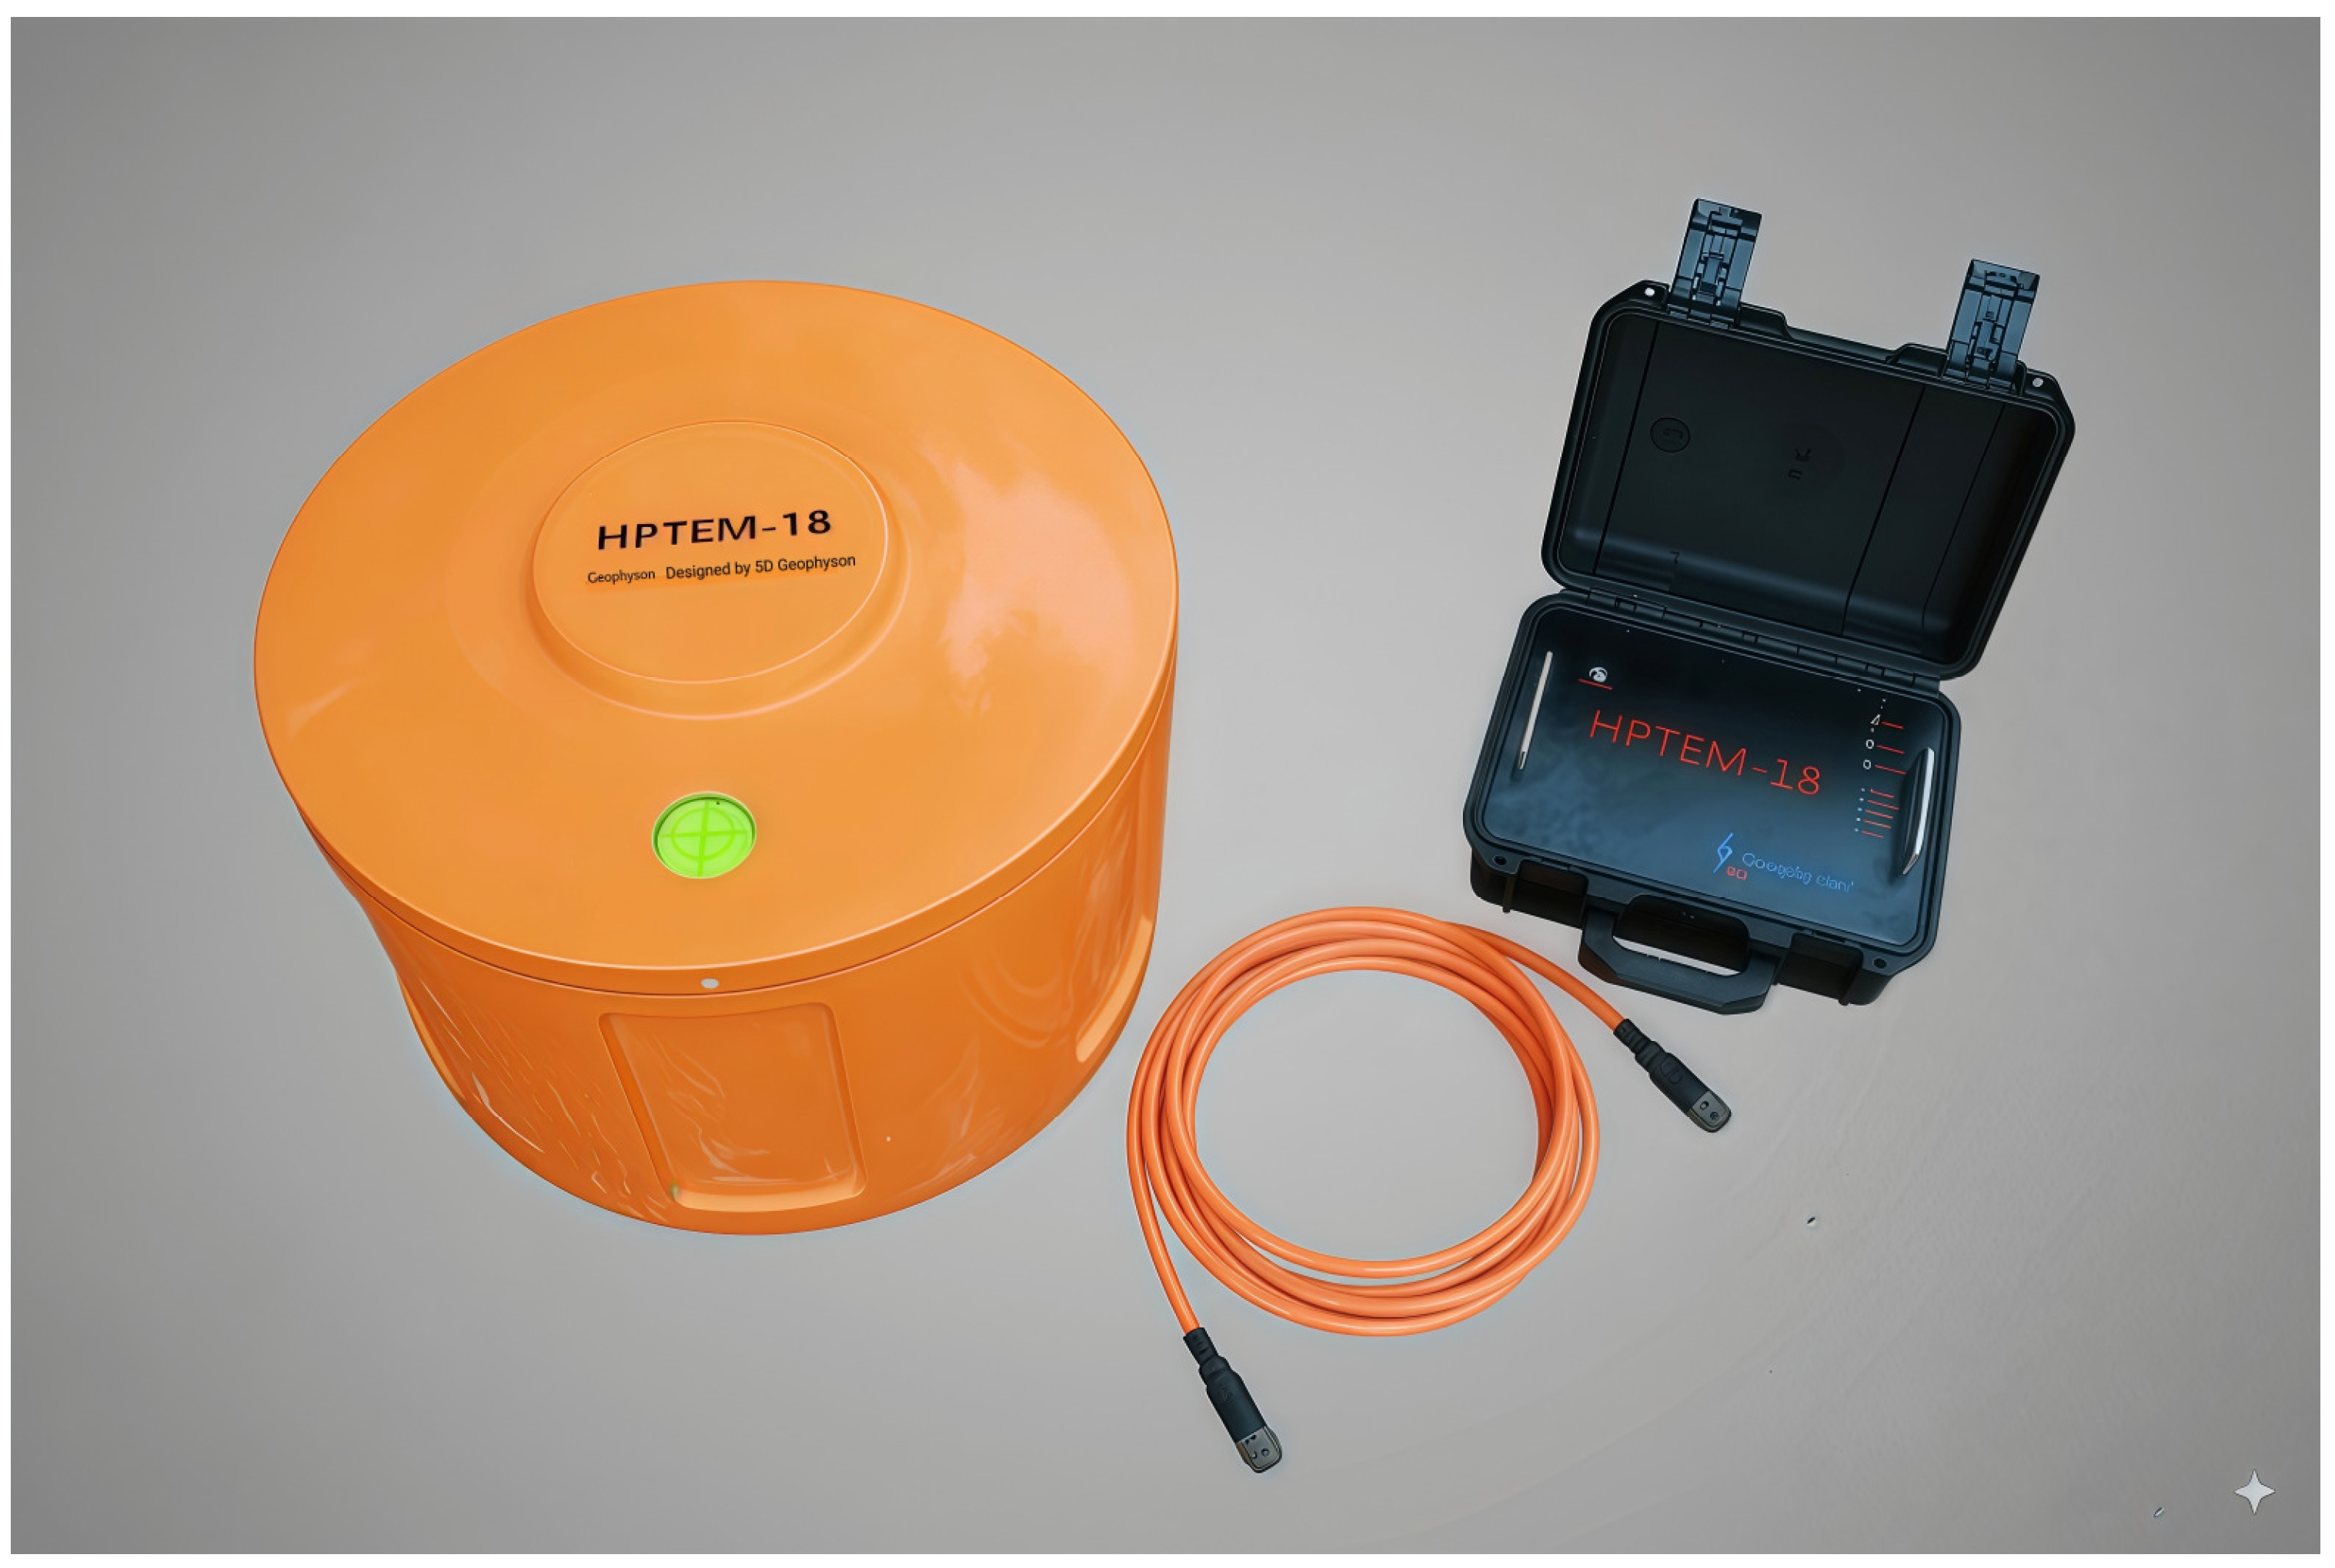
In this study, the OCTEM is applied to the Tiancheng Chengyuan site in Cangzhou City (Hebei Province, China) to demonstrate the practical application and effectiveness of the OCTEM for shallow-fault detection in a representative urban complex-noise environment. A single west–east profile is interpreted using resistivity inversion and constrained by two nearby boreholes, and data quality is rigorously quantified using repeat-station inspection measurements to validate acquisition stability. The OCTEM data in this study were acquired using the HPTEM-18 OCTEM system (Figure 1). The case demonstrates that the OCTEM can overcome urban electromagnetic noise challenges and provide interpretable subsurface images suitable for engineering fault screening.
Figure 1.
HPTEM-18 OCTEM system.
2. Materials and Methods
2.1. Study Area and Geological Background
The case study was conducted at the Tiancheng Chengyuan site in Cangzhou City, China, with the OCTEM profile centered at approximately 38°16′43.80″ N, 116°53′49.62″ E along Xingye Road. The investigated line length is about 0.4 km, implemented as a 385 m profile in the field. The site is located on a flat plain with thick Quaternary unconsolidated deposits, and the local stratigraphy is dominated by silt and silty clay layers of Holocene to Pleistocene age [12,13].
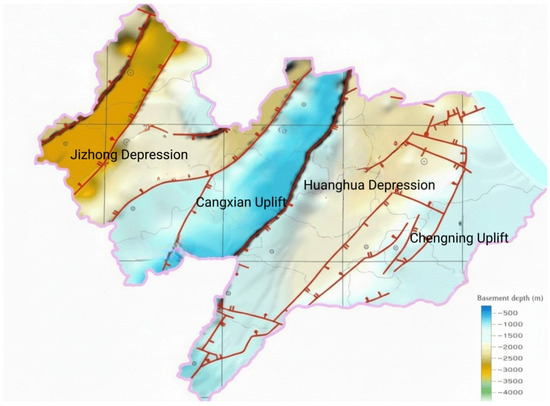
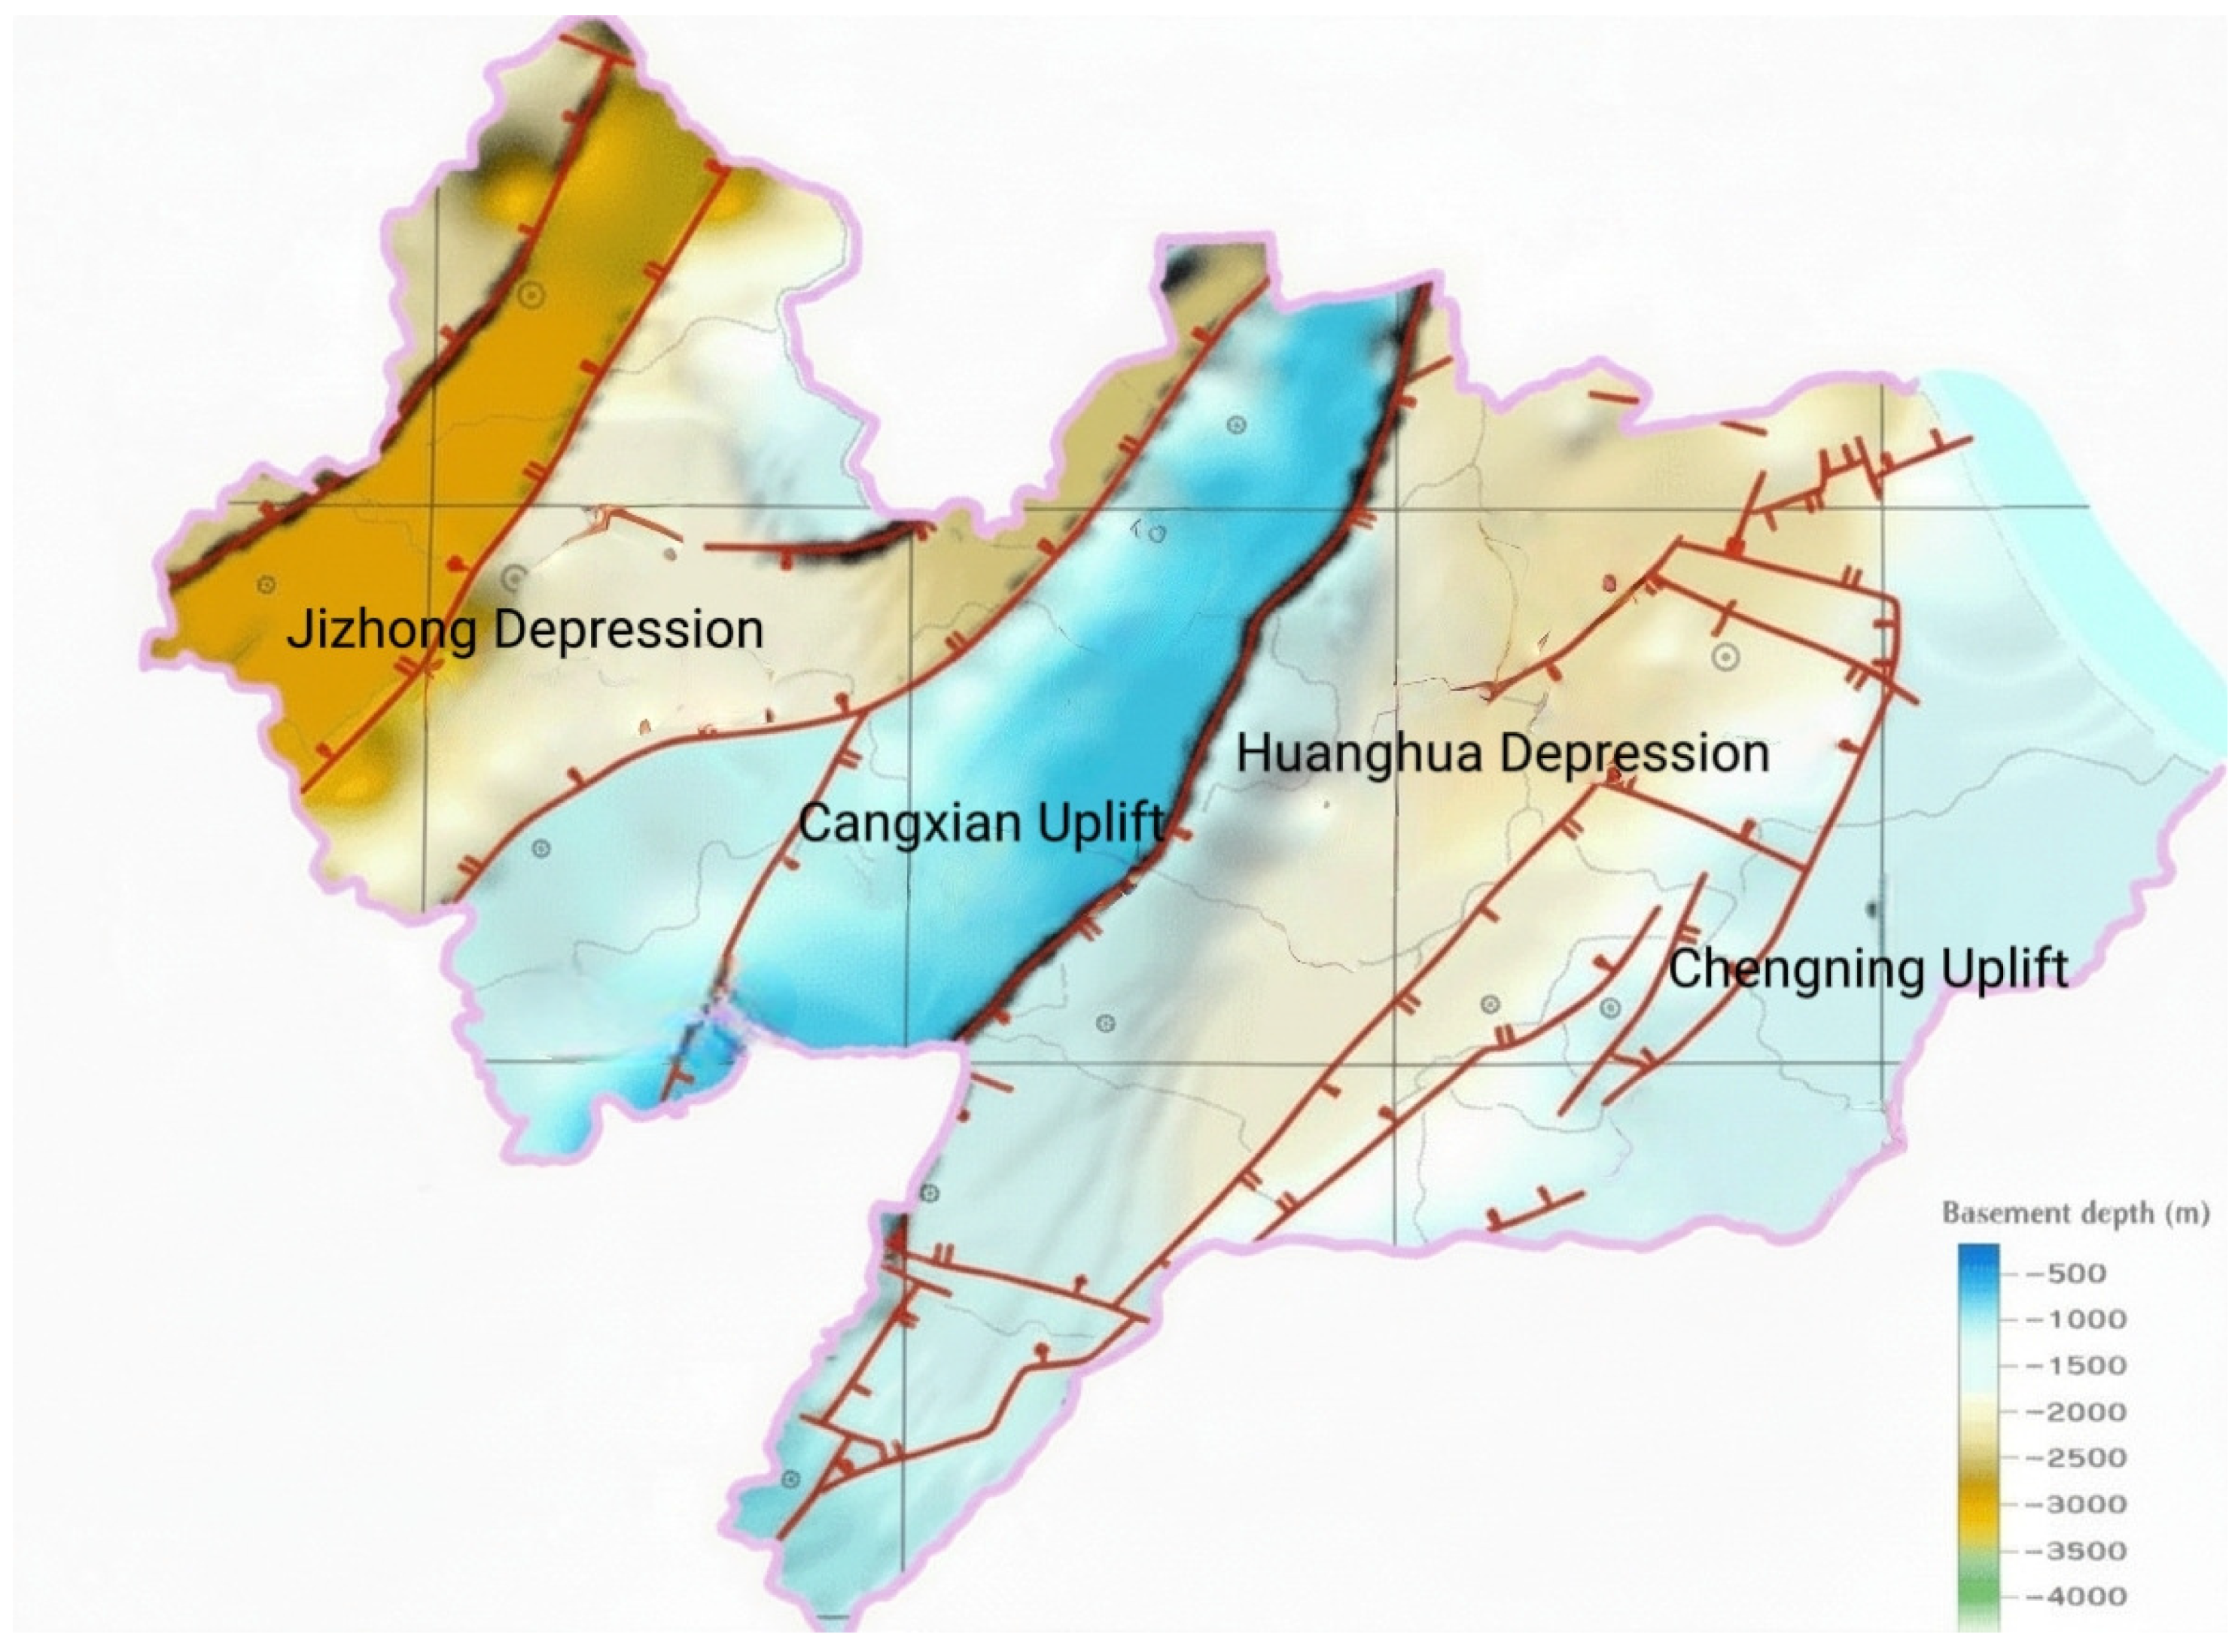
The study area is situated within the North China Plain, a thick sedimentary basin characterized by Quaternary unconsolidated deposits exceeding several hundred meters in thickness. Tectonically, the site lies within the Cangxian Uplift, a relatively stable structural unit bounded by the Jizhong Depression to the northwest and the Huanghua Depression to the southeast (Figure 2). The Cangxian Uplift has experienced minimal tectonic activity since the Quaternary period and is classified as a tectonically stable block in regional seismic hazard assessments [14,15,16].
Figure 2.
Regional tectonic framework and basement depth map of the Cangzhou area.
The nearest major fault structure is the Cangdong Fault, located approximately 10–15 km west of the study site. The Cangdong Fault is a NE-trending normal fault with Cenozoic activity history; however, geological and paleoseismic investigations indicate no evidence of Quaternary slip along this structure in the vicinity of Cangzhou City [14,16]. This regional tectonic stability provides the geological context for interpreting the OCTEM survey results: the primary investigation goal is to screen for any unrecognized shallow-fault-related discontinuities that might pose localized seismic risk, rather than to characterize a known active-fault zone.
The local stratigraphic framework consists of thick Quaternary alluvial and lacustrine deposits of the Heilonggang Basin, formed by inland rivers including the Yongding River, Daqing River, Ziya River, South Canal, and Xuanhui River [12,13]. The Quaternary succession can be divided into:
Holocene (Q4): At 0–15 m depth, it is composed of interbedded silt and silty clay with a high moisture content, characterized by low resistivity (typically 10–50 Ω·m).
Upper Pleistocene (Q3): At 15–80 m depth, it is dominated by silty clay and clay layers with moderate resistivity (50–150 Ω·m) due to reduced porosity relative to Holocene deposits.
Middle Pleistocene (Q2): At 80–200 m depth, it consists of dense silt layers with occasional cemented zones, exhibiting higher resistivity (150–400 Ω·m).
Lower Pleistocene and Neogene basement: At >200 m depth, it is not resolved by the present OCTEM survey.
This stratigraphic layering is critical for OCTEM interpretation because resistivity contrasts are primarily controlled by lithology, porosity, and water content rather than by fault-related fracture zones. In the absence of aquifer-filled fault zones or significant displacement, faults within thick unconsolidated Quaternary sediments may not produce distinct resistivity anomalies. Therefore, fault detection relies on identifying subtle interface disruptions, lateral resistivity gradients, or throughgoing structural discontinuities rather than simple low-resistivity anomalies.
Figure 2 shows the regional tectonic framework of the Cangzhou area, including the distribution of major fault systems and basement depth variations (color-coded depth to pre-Quaternary basement). The study site is located within the Cangxian Uplift, approximately 10–15 km east of the Cangdong Fault trace. The regional structural setting indicates that the site lies within a tectonically stable zone with minimal Quaternary fault activity.
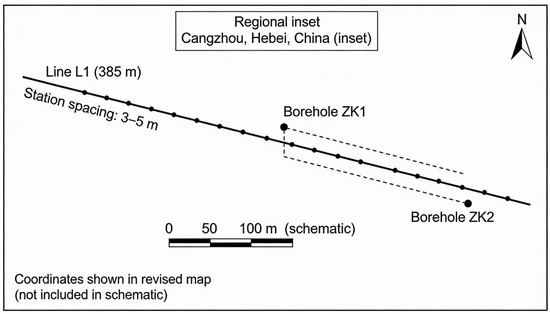
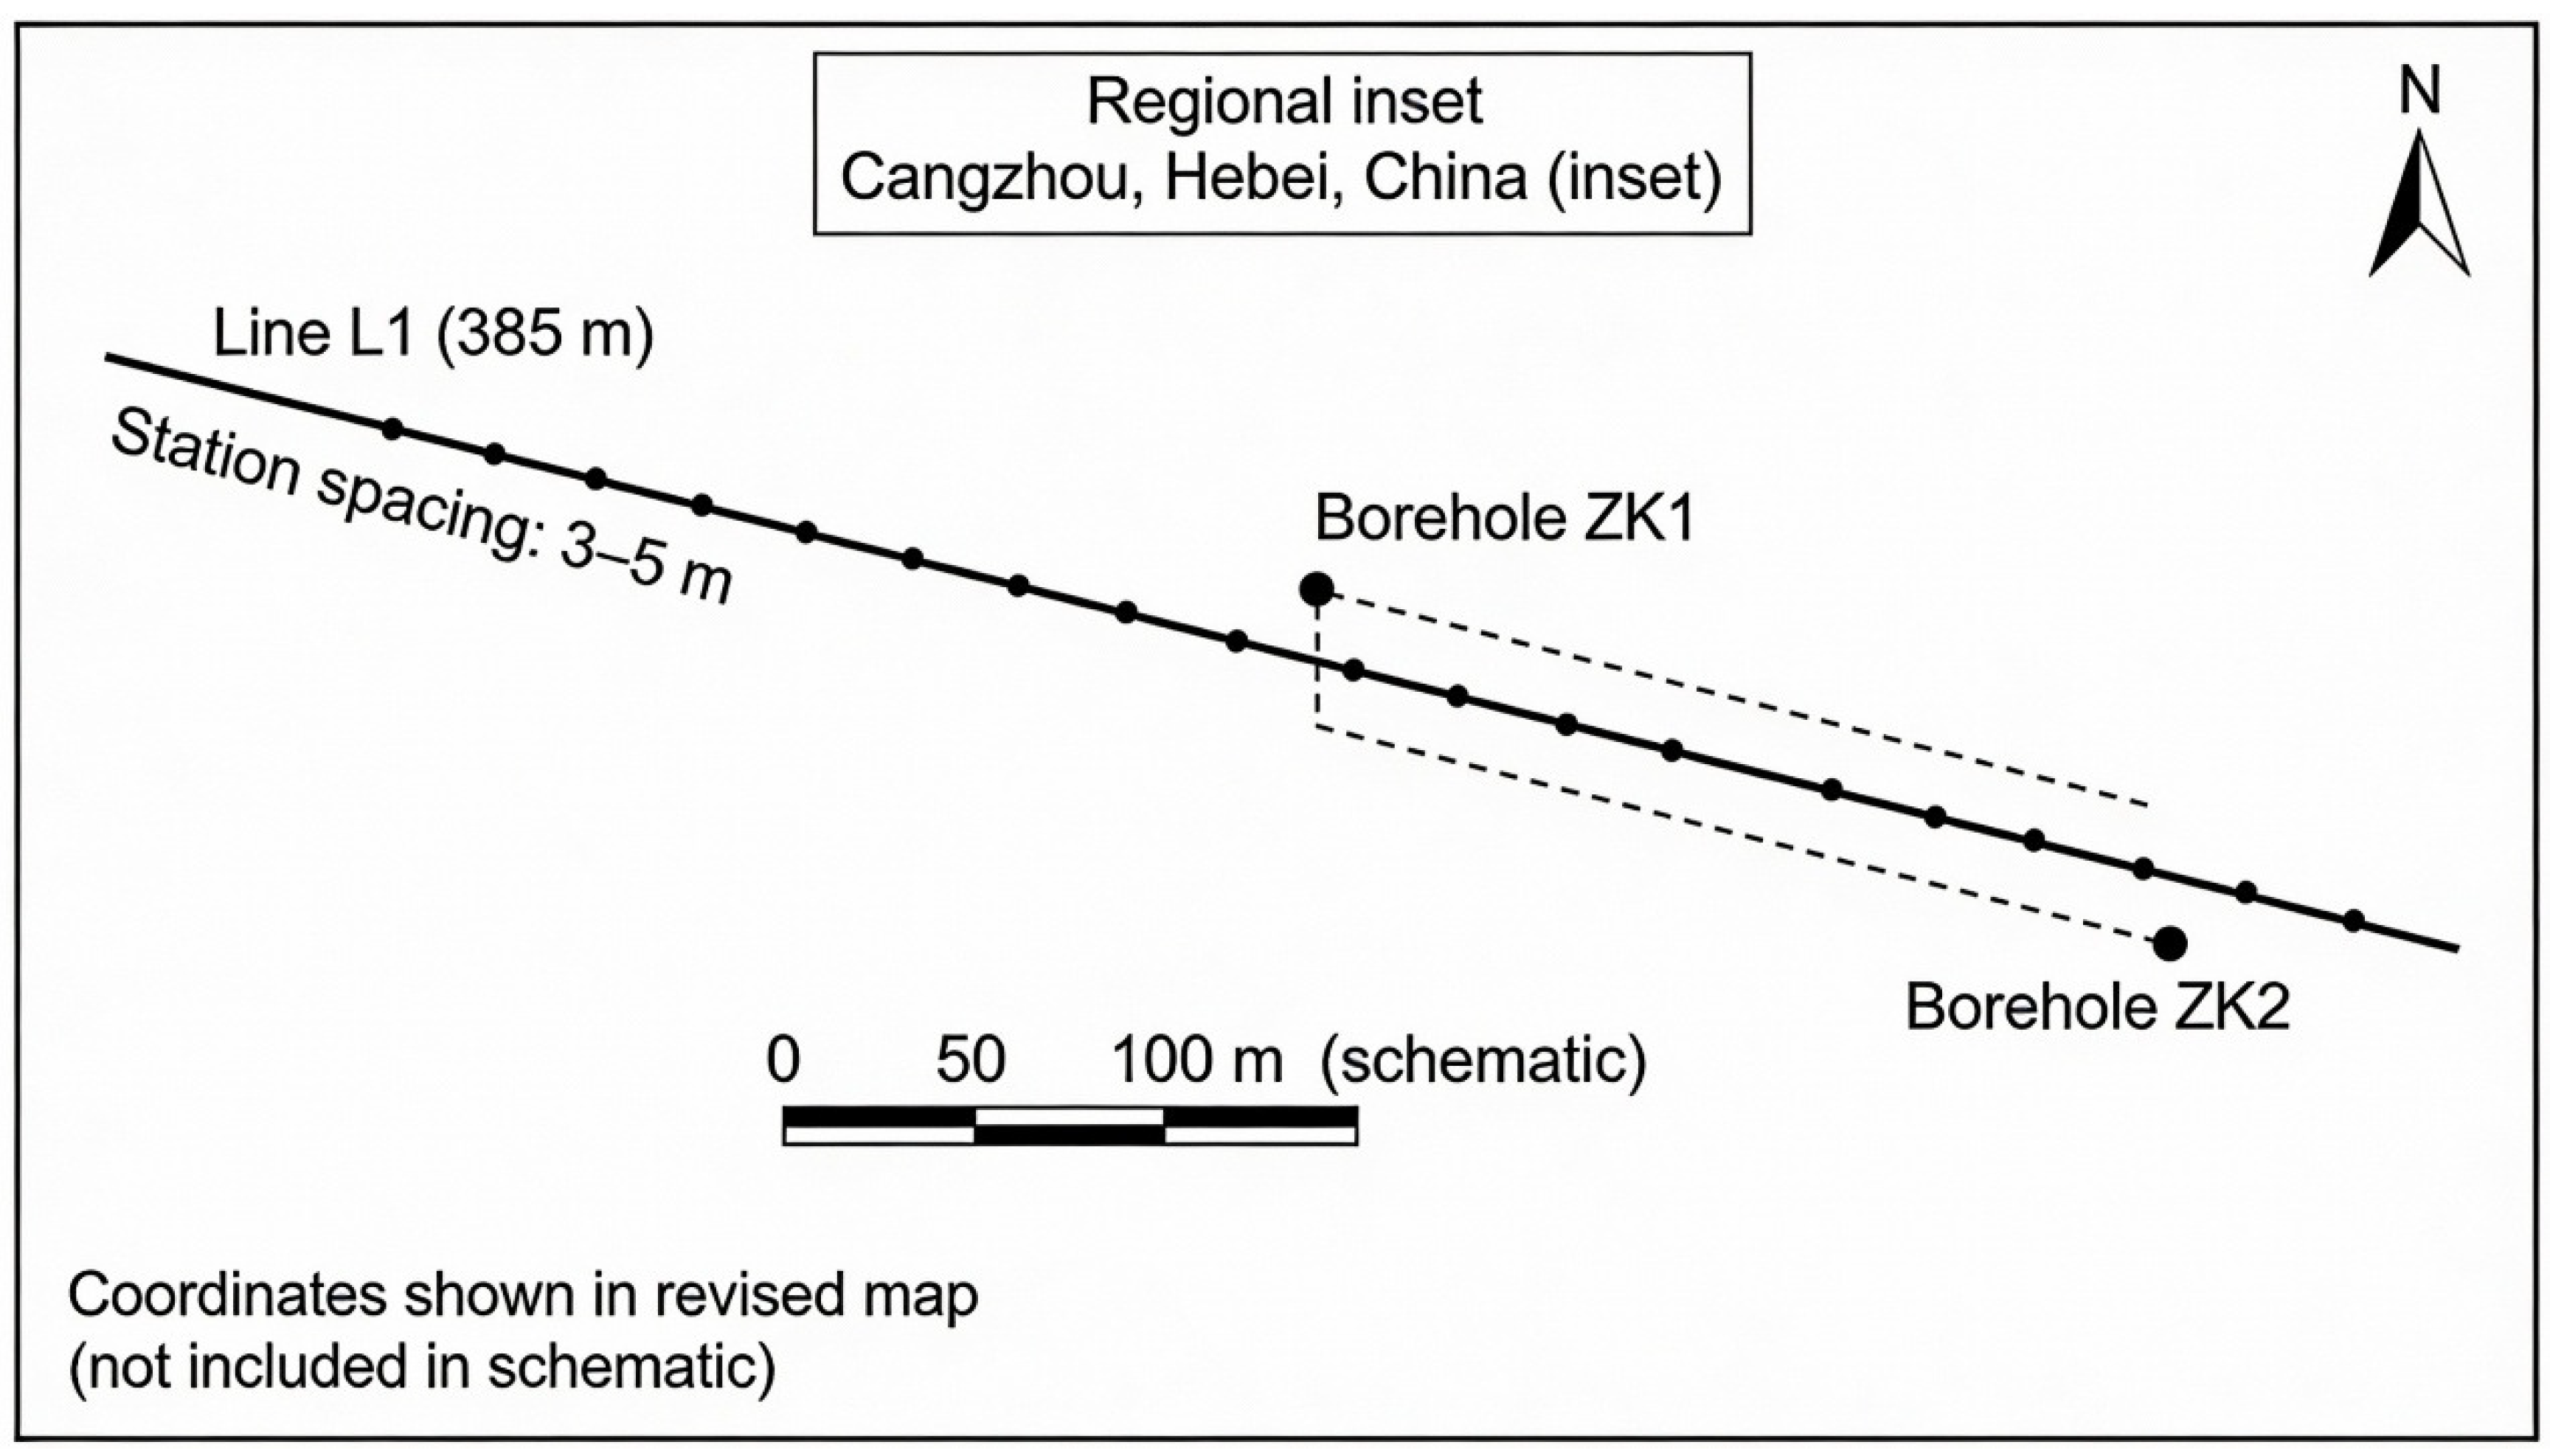
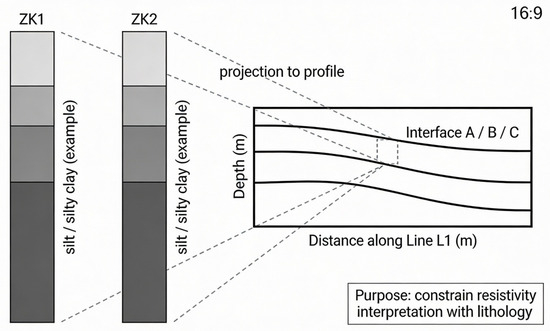
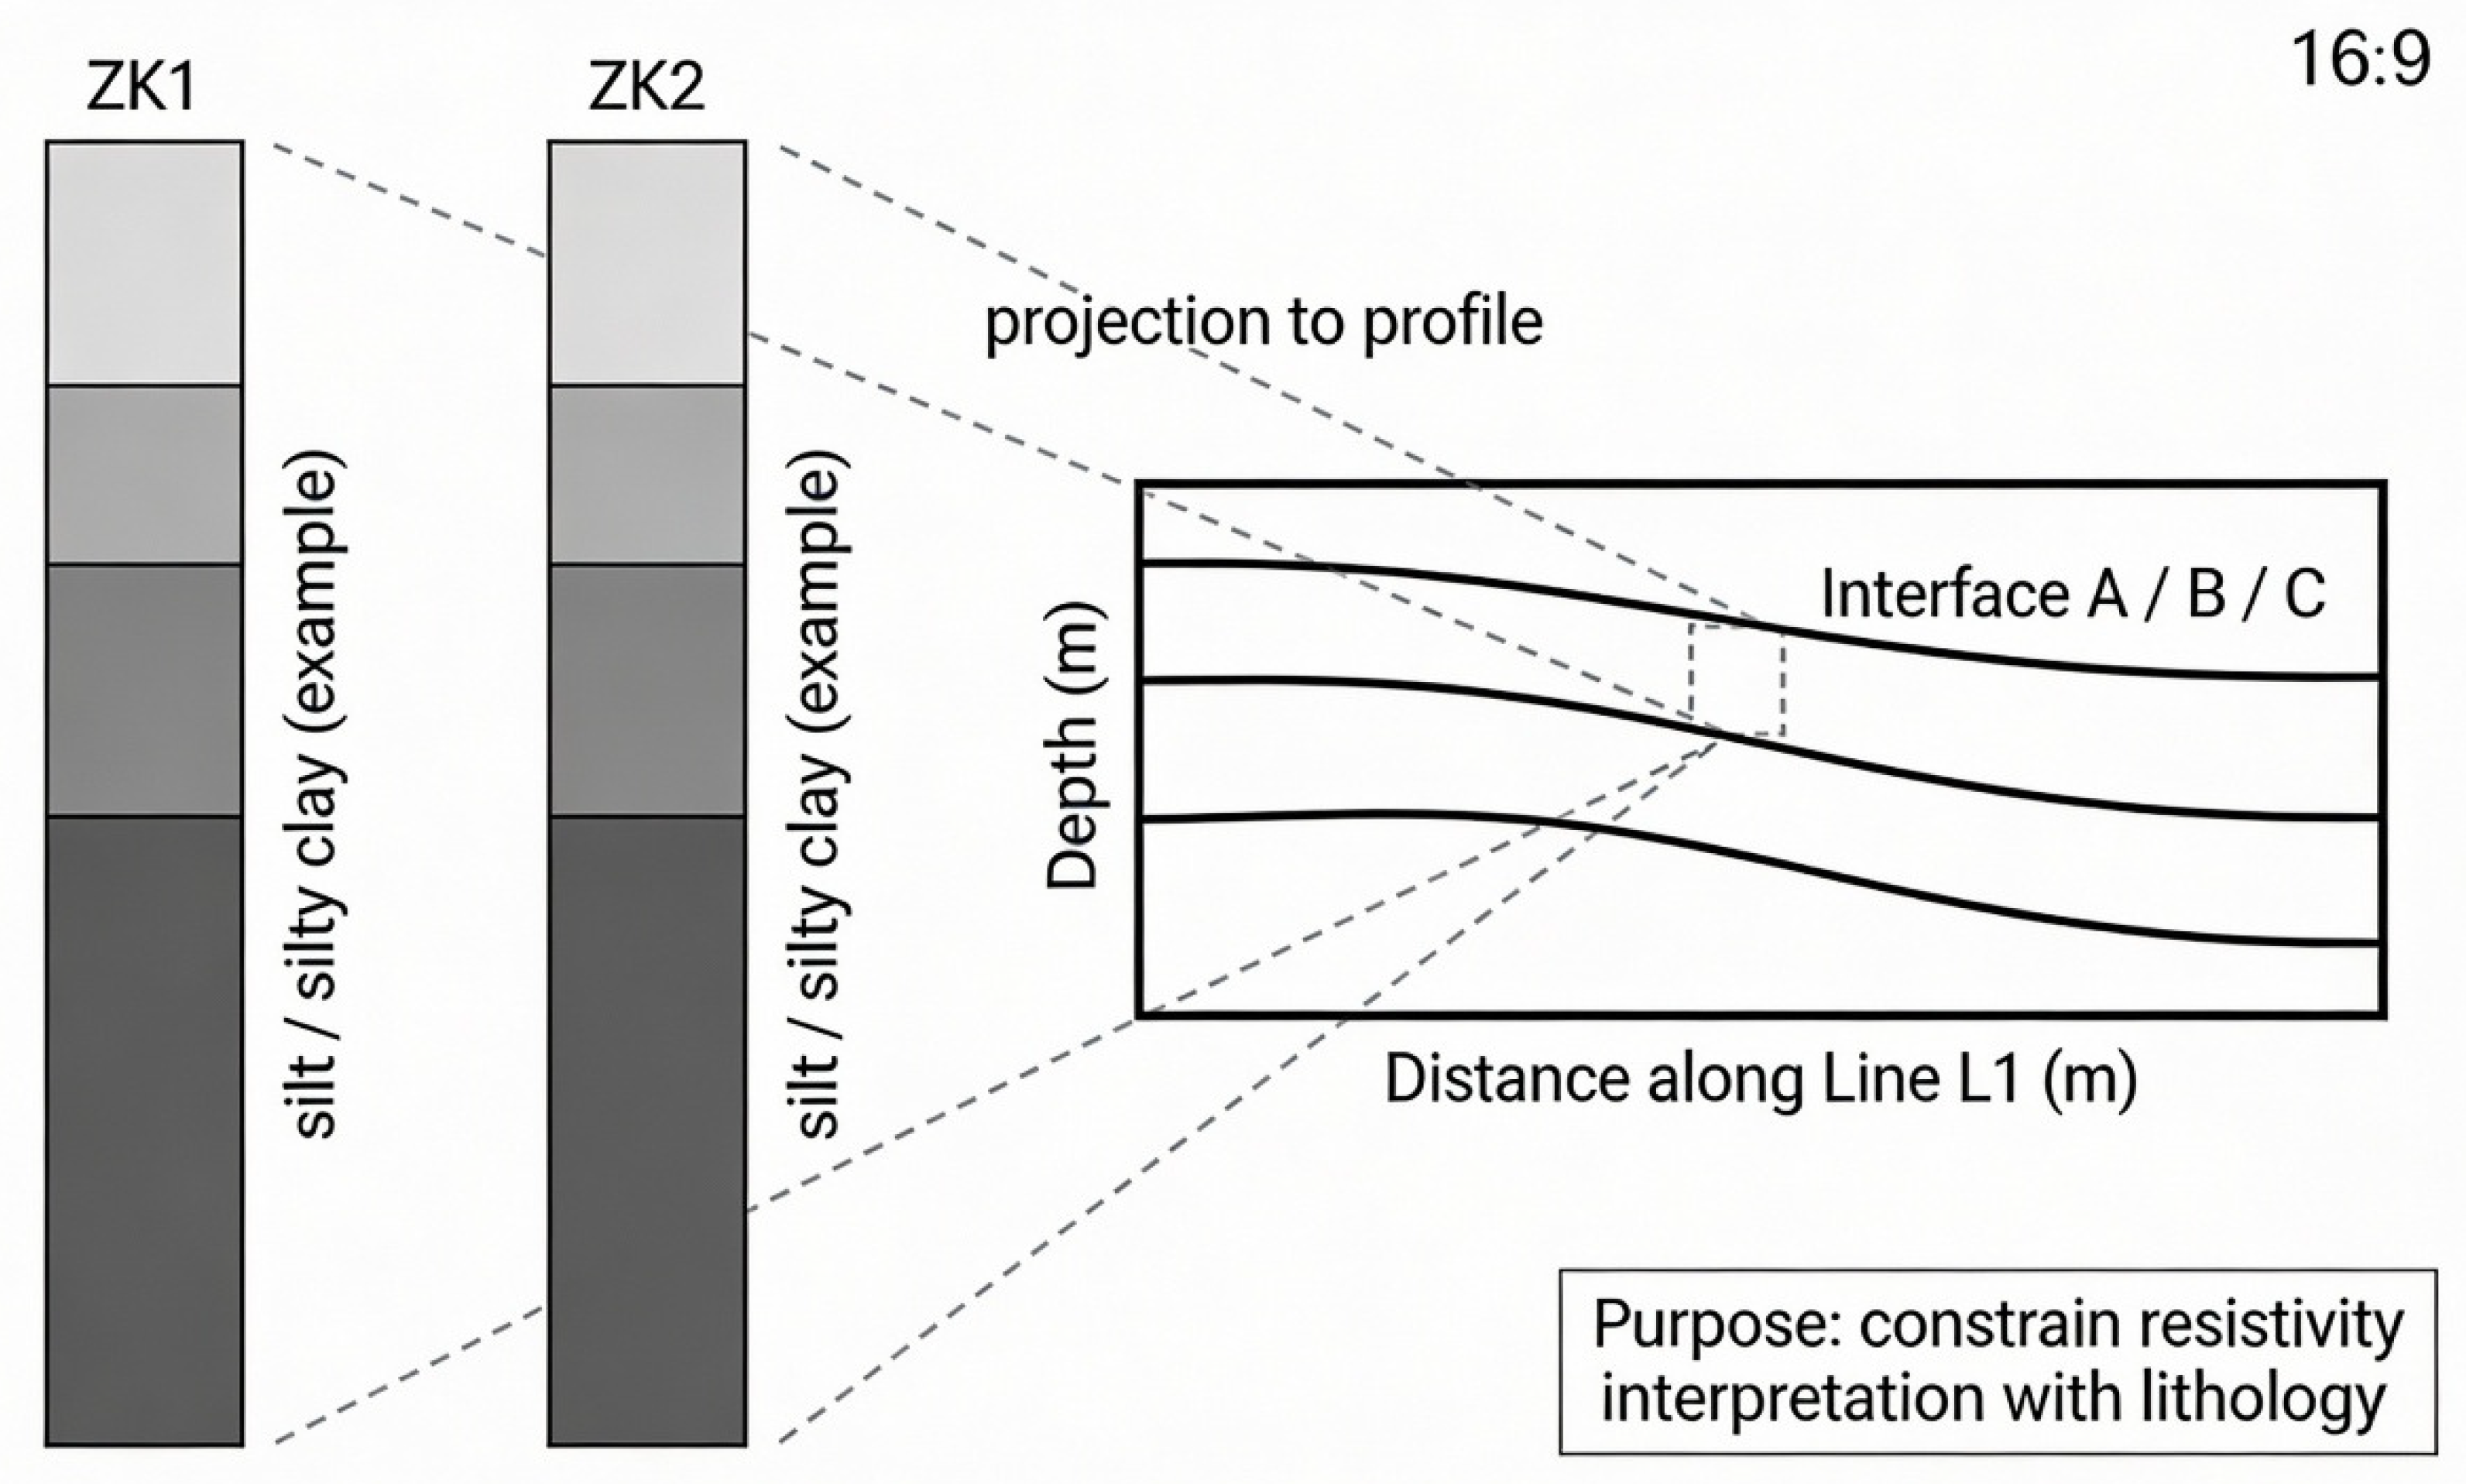
Figure 3 shows the relative position of survey Line L1 within the local cross-sectional geological framework, constrained by nearby boreholes ZK1 and ZK2. The profile orientation (west–east) was determined by practical urban constraints including road access, building locations, and utility corridors, rather than by an intent to geometrically intersect known regional fault traces.
Figure 3.
Schematic diagram of the cross-sectional location of the exploration line of Tiancheng Chengyuan.
It is important to clarify the survey design rationale in the context of the editor’s comment. This study is not a controlled “benchmark test” designed to cross a known active fault and validate OCTEM fault-detection capability under ideal conditions. Instead, it represents a realistic urban fault-screening application, where the geophysical survey must work within severe logistical constraints:
- No confirmed shallow-fault trace exists at this site (regional geology indicates tectonic stability).
- Urban infrastructure (roads, buildings, utilities) restricts profile placement to available corridors.
- The engineering question is not “can we image a known fault?” but rather “does this corridor contain any resolvable fault-like discontinuities that might pose seismic risk?”
Therefore, the study demonstrates the OCTEM’s practical utility for rapid, low-cost, minimally disruptive fault screening along urban infrastructure corridors—a common real-world application where site access is limited and the goal is to rule out (or identify for further investigation) unrecognized shallow faults. The single-profile design reflects typical urban screening practice, where comprehensive 3D fault characterization is reserved for sites where initial screening identifies potential concern.
This approach is consistent with tiered geophysical investigation strategies: Stage 1 uses rapid, cost-effective methods to screen accessible corridors; Stage 2 deploys higher-resolution or multi-method surveys to characterize identified anomalies. The results demonstrate that the OCTEM successfully provided interpretable subsurface imagery under challenging urban noise conditions, supporting its role as an effective Stage 1 screening tool even when survey geometry cannot be optimized for fault intersection.
2.2. OCTEM Instrumentation
Data acquisition used the HPTEM-18 high-precision transient electromagnetic system(designed by 5D Geophyson Co., Ltd., Changsha, China), described in the manuscript as employing an integrated transceiver anti-flux antenna design intended to reduce transmitter–receiver coupling effects [17,18,19,20]. The system configuration reported includes a bipolar square-wave waveform (50% duty cycle), transmission voltage of 12 V and current of 10 A, and selectable transmission frequency from 0.1 to 250 Hz. The receiver specifications reported include a receiving bandwidth of 300 kHz, a sampling rate of 625 kHz, and up to 1250 time channels, with a turn-off time of 0.5 μs under resistive load. This configuration enables measurement of early-time transient responses with minimal coupling distortion, a key advantage for near-surface fault detection in complex urban settings.
2.3. Layout and Positioning of Survey Line and Measurement Points
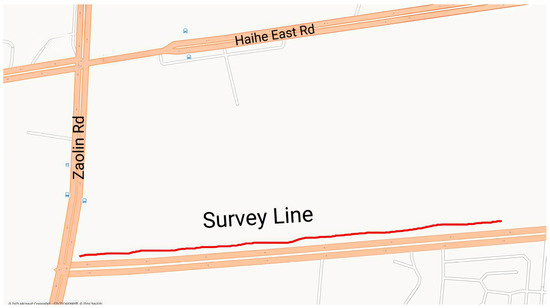
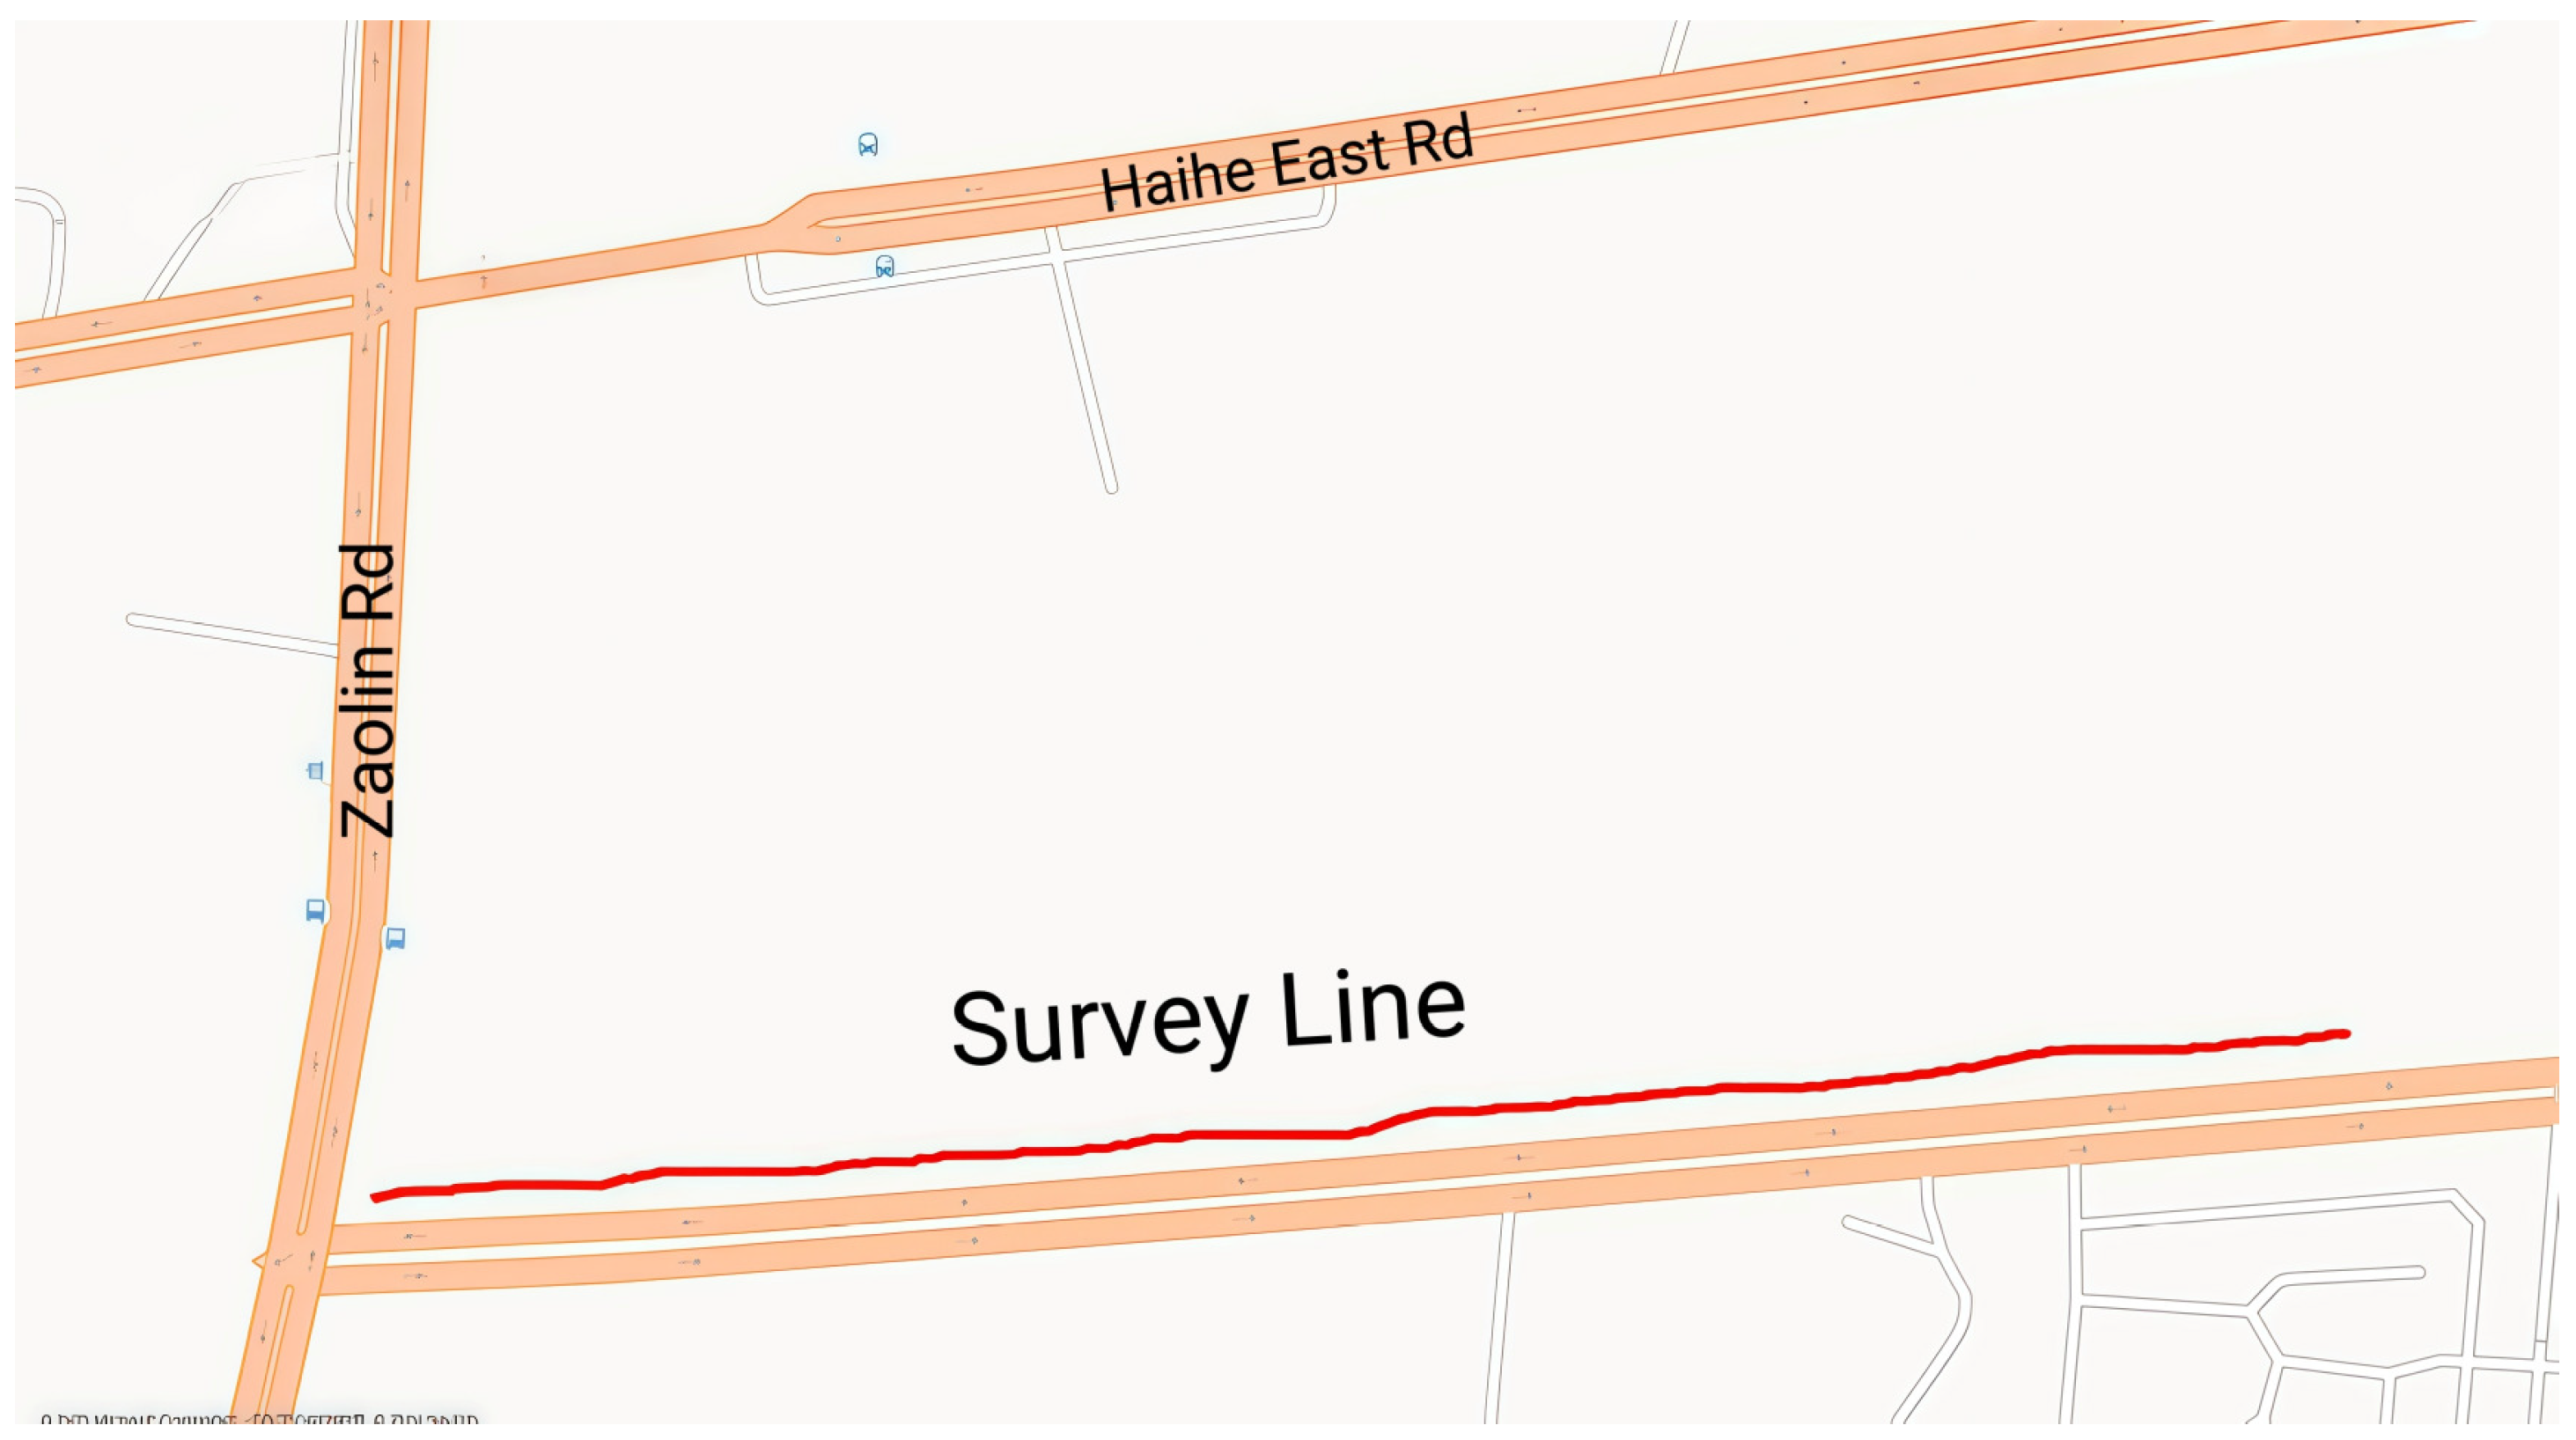
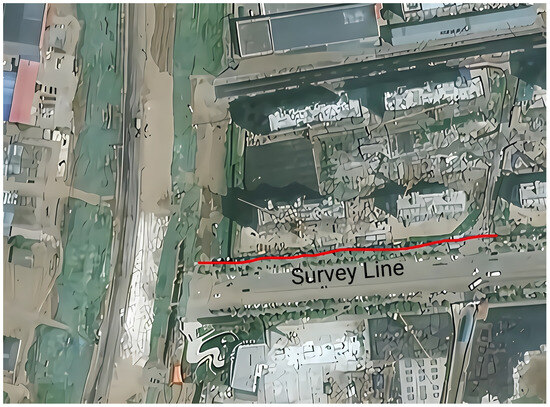
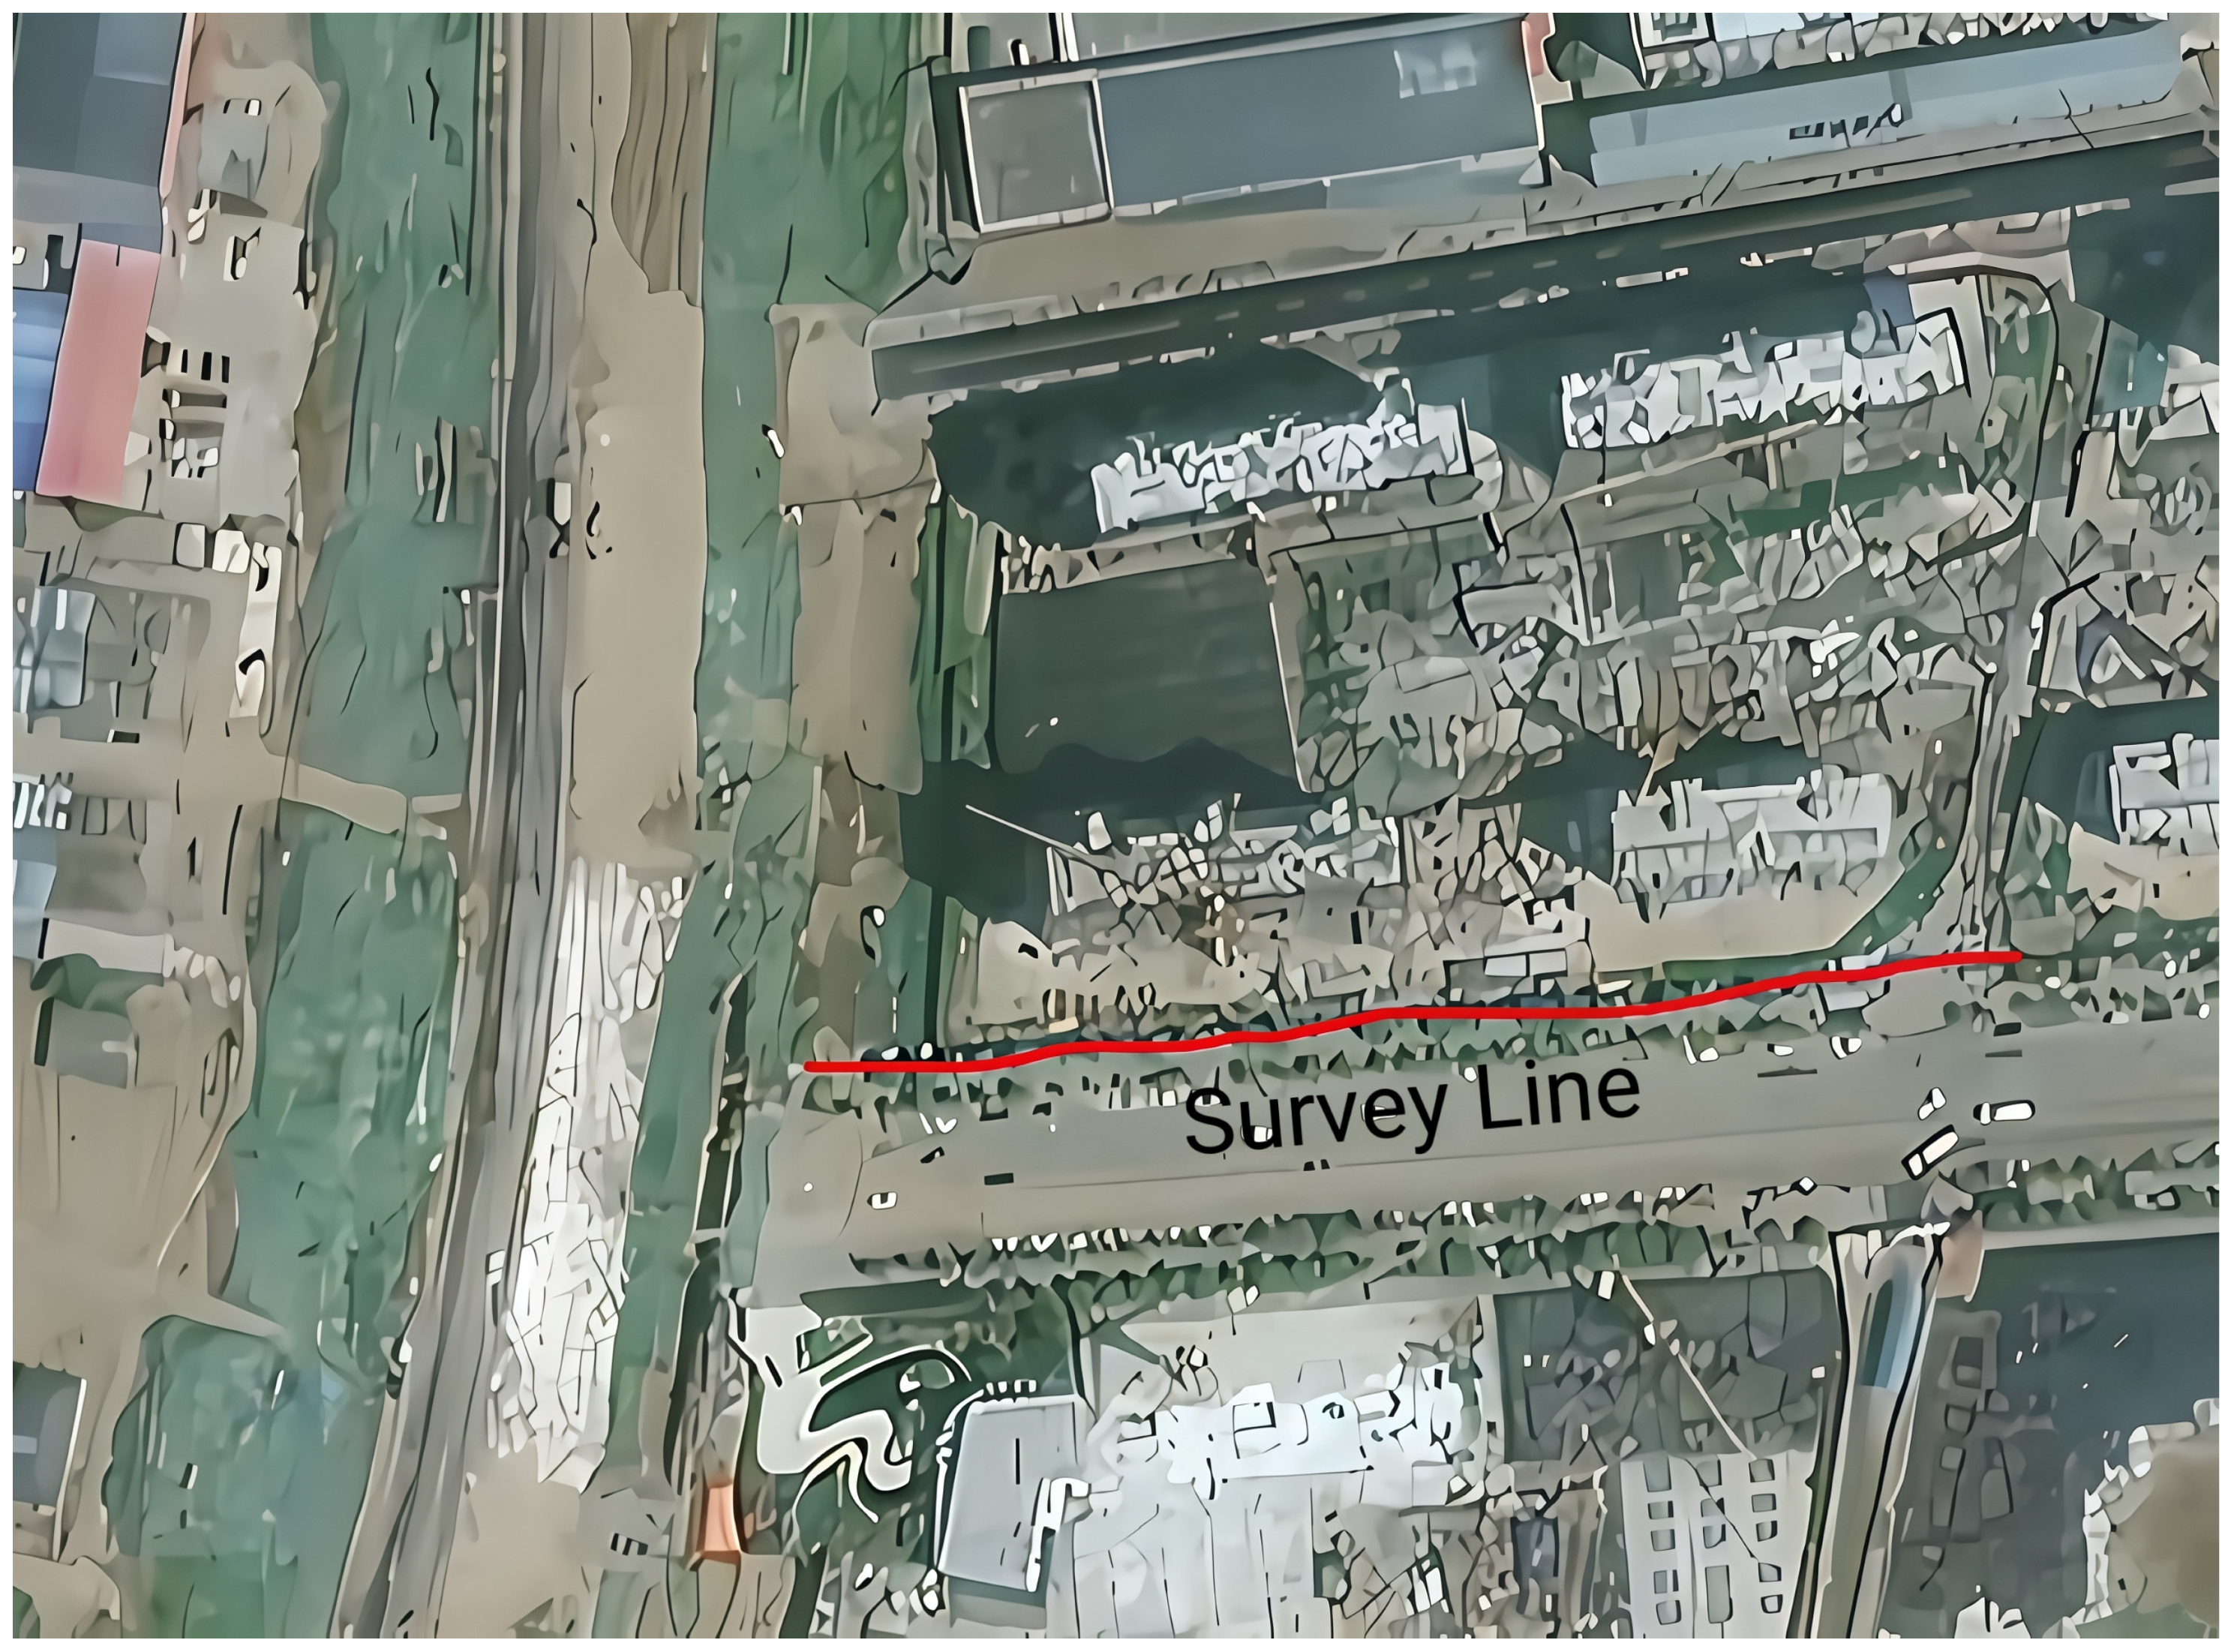
The layout of the survey line was determined according to comprehensive factors such as the detection task and the fault structure trend of the survey area, as well as the survey area, topography, and human environment. The principle guiding the layout of the survey line is to combine long and short lines, increase control lines as much as possible, control hidden structures that may exist underground in the survey area, and ensure convenience in the construction of the survey line and post-processing and interpretation. In this exploration, survey line 1 was arranged from west to east on the south side of the site. The length of the survey line was 385 m. Data from 2 known boreholes were collected, with the nearest borehole located about 200 m west of the survey line. The specific locations of the survey line and boreholes are shown in Figure 4 and Figure 5.
Figure 4.
Schematic diagram of the layout of the OCTEM exploration line in the exploration line section of Tiancheng Chengyuan.
Figure 5.
Monitoring point distribution map.
The profile orientation was selected to balance the expected structural trend and site accessibility, and the resulting interpretation is confined to the corridor sampled by Line L1. The 3–5 m station spacing provides sufficient lateral resolution to detect fault-related discontinuities at the expected depth scale.
The field geodetic work was based on a topographic map of the project and was completed by combining a high-precision GPS instrument and rope survey. In the actual measurement process, the end point of the measuring line was determined by GPS, the distance was measured with a rope, fixed-point inspection was performed, and distance stations were marked every 3–5 m.
2.4. Instrument Test Before Construction
In order to ensure the reliability of the quality of the collected data, the performance of the instrument was tested before the start of construction to ensure that the instrument was in good working condition [21,22].
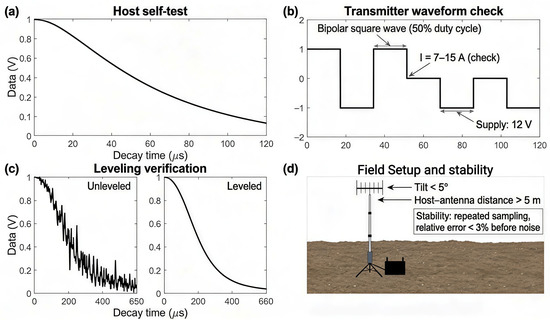
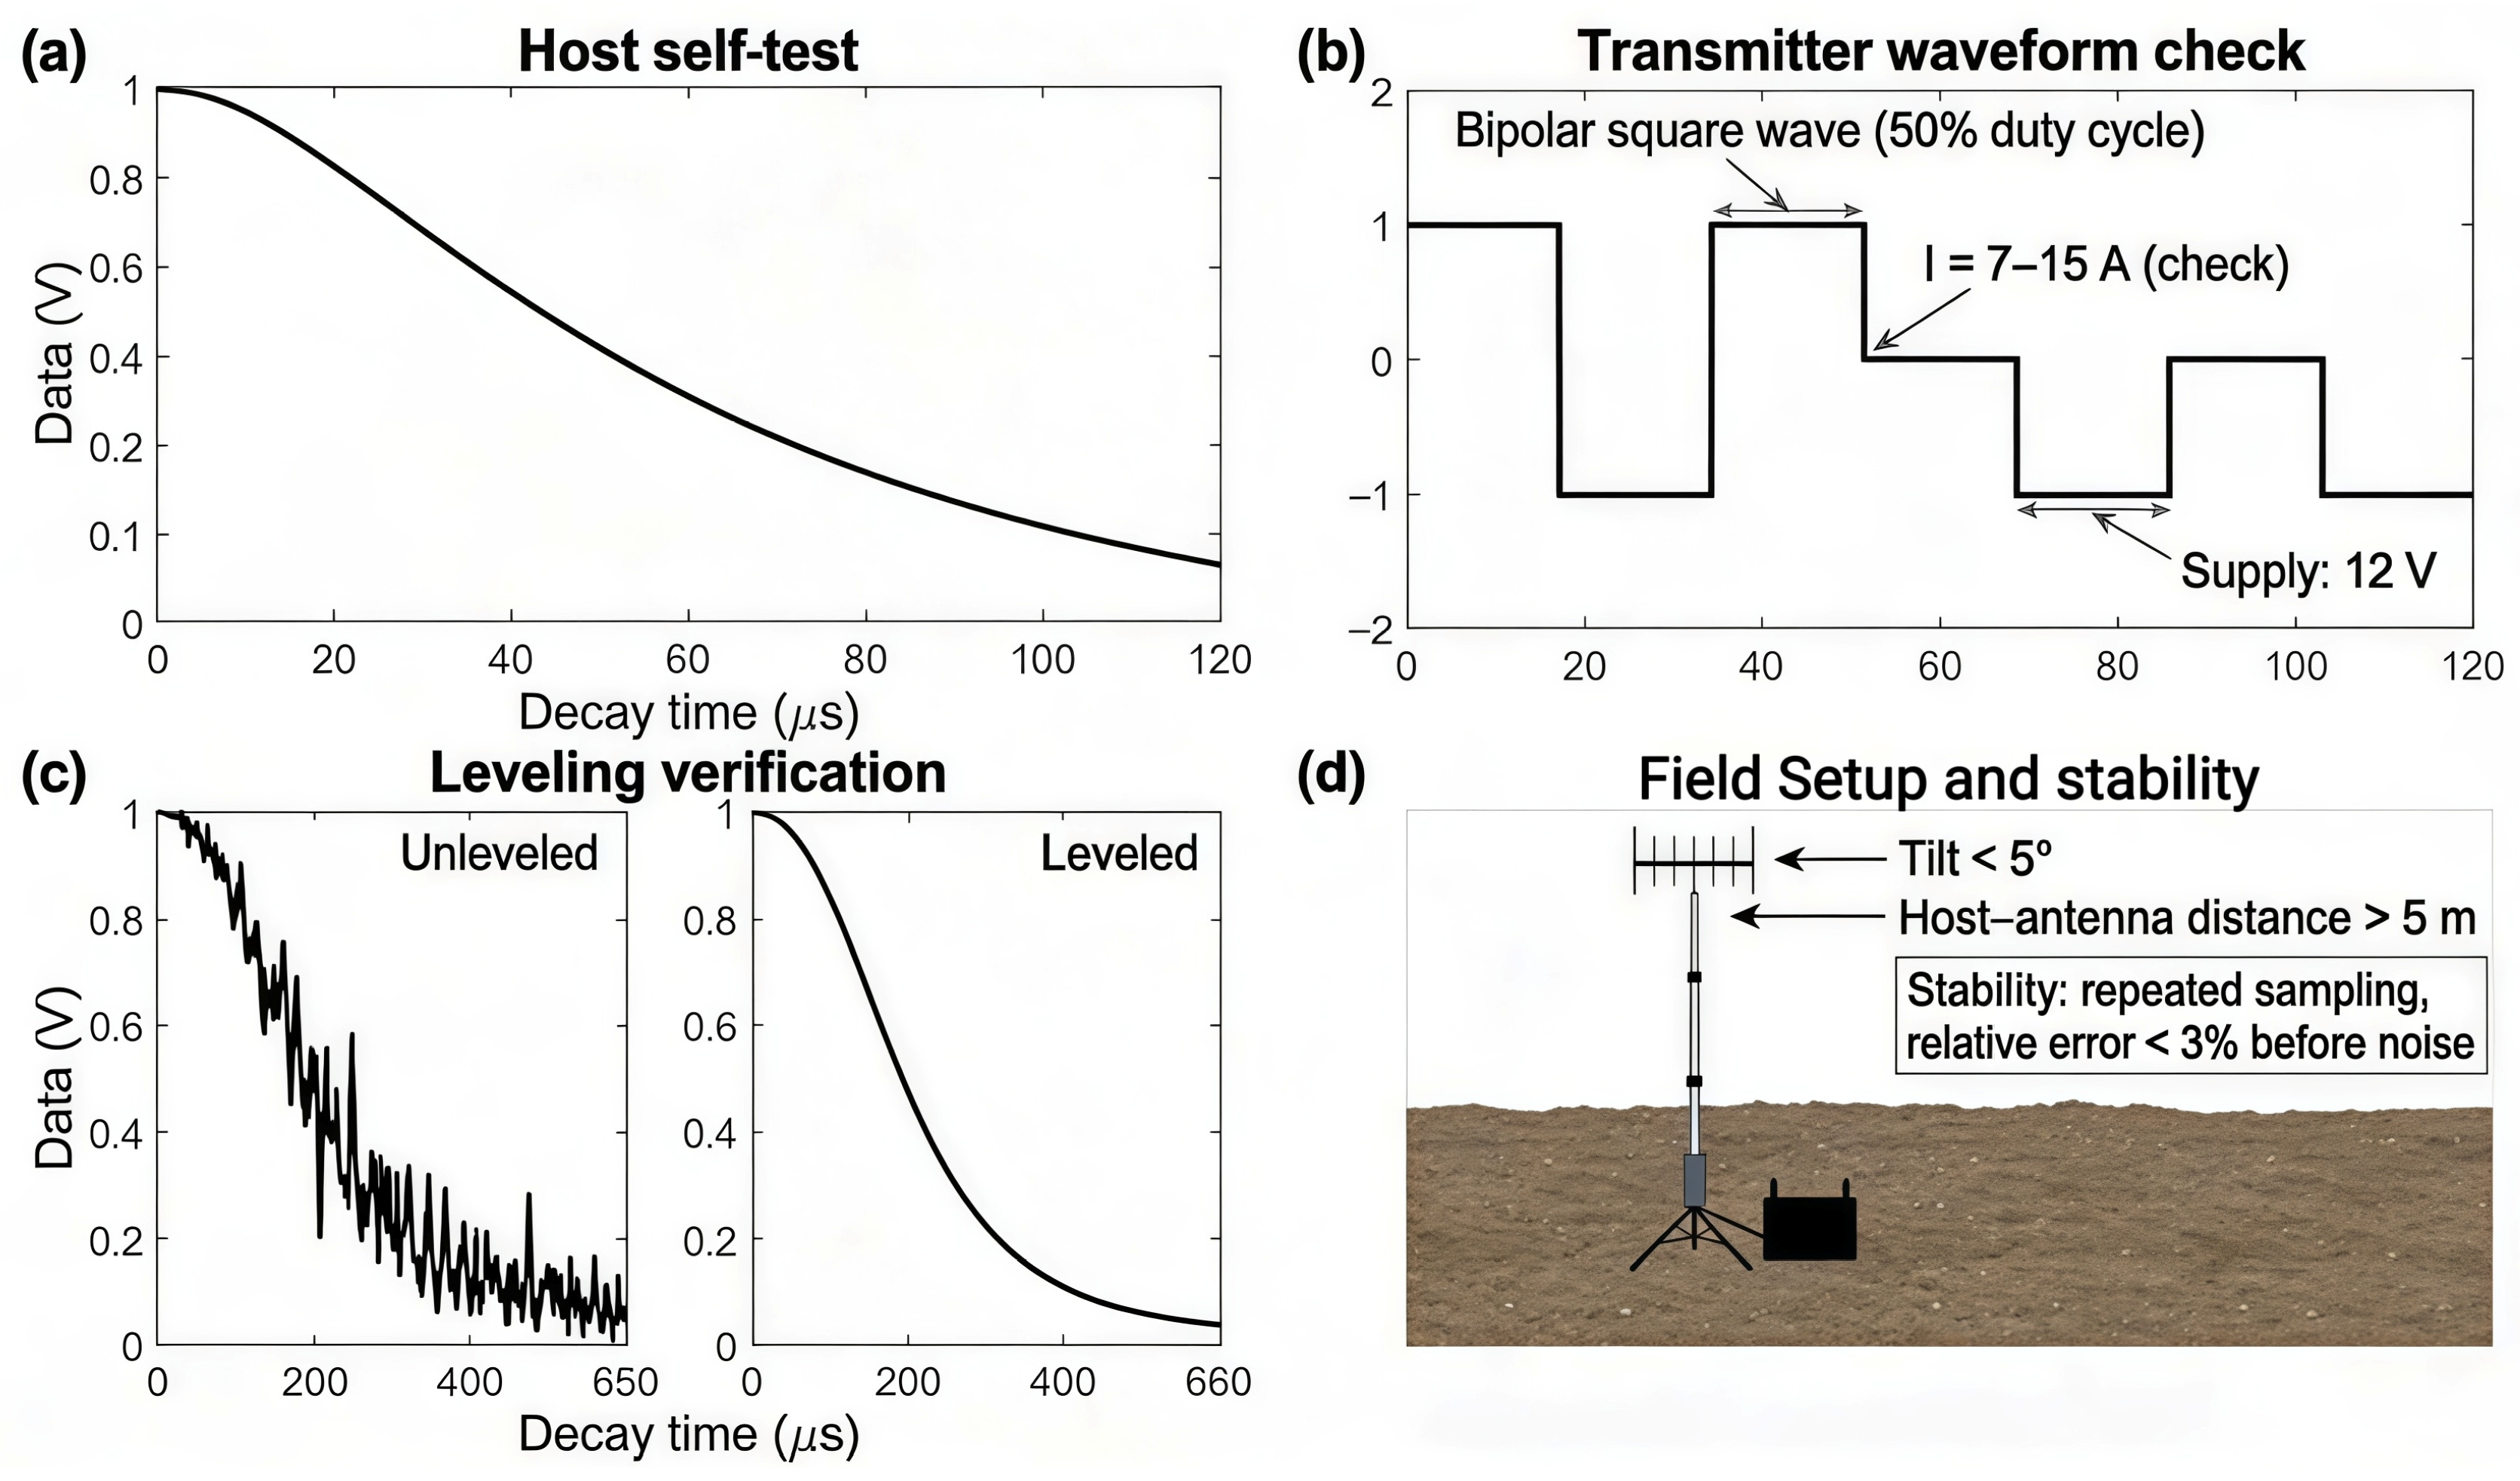
Before carrying out field work, the instrument should be self-tested to ensure that it is in a normal state. Instrument self-test means that the instrument sends a signal internally, and then it collects the signal and detects whether it is functioning normally by comparing the collected signal with the sent signal. If you select “Self-Test Mode” in the acquisition software, as shown in Figure 6a, when the collected signal curve is approximately oblique with linear attenuation in the linear coordinates, the receiving part of the instrument host is working normally.
Figure 6.
(a) Host self-test: Internal self-test decay response confirming the receiver channel is functioning properly; (b) Transmitter waveform check: Bipolar square-wave current waveform and amplitude check to confirm normal transmission; (c) Leveling verification: Comparison of unlevelled vs levelled decay curves to verify proper coil leveling; (d) Field setup and stability: Recommended setup geometry and repeatability criterion to ensure stable field measurements.
Observe whether the transmitted waveform is a distinct bipolar square wave. The transmitter of the HPTEM-18 system sends a bipolar square wave, and the transmission current is between 7A and 15A. Before carrying out field data acquisition, the test points should be collected to observe whether the instrument is transmitting normally. If the transmitted waveform is bipolar square, as shown in Figure 6b, and the current is between 7A and 15A, the transmitter is working normally [23].
Before carrying out the work, carry out self-inspection and leveling verification. Place the transmitting and receiving wireframes horizontally, adjust the relative position of the transmitting wireframe and the receiving wireframe, and observe the attenuation curve, as shown in Figure 6c.
The stability check of the instrument involves carrying out multiple sampling observations at the same measurement point position and comparing the relative error of the multiple samples; when the relative error is less than 3%, the instrument is considered stable. The signal error is less than 1% before the noise level is reached.
As shown in Figure 7, the device layout diagram requires the antenna to be placed horizontally, the tilt angle is less than 5°, and the distance between the host and the antenna is greater than 5 m.
Figure 7.
Schematic diagram of the device layout.
In summary, the test results show that the instrument has good performance and can be used for exploration. These QC protocols, when strictly followed, ensure that OCTEM data quality is maintained even in challenging electromagnetic environments.
2.5. Data Processing, Inversion, and Interpretation Criteria
The OCTEM is capable of detecting fault-related discontinuities through resistivity anomalies associated with fracture zones, fluid pathways, or localized stratigraphic offset. In thick urban overburden such as the Quaternary deposits at Cangzhou, fault identification criteria must be adapted from standard open-area approaches because [24,25,26]:
- (i)
- The enclosing sediments (silt, silty clay) already exhibit low resistivity (20–150 Ω·m) due to high porosity and water content, reducing contrast with potential fault-zone fill.
- (ii)
- Fault displacement within unconsolidated sediments may not create throughgoing fracture zones with distinct hydrogeological properties unless the offset is large (>10 m) or cuts a confined aquifer.
- (iii)
- Urban electromagnetic noise can mask or mimic small-scale resistivity anomalies, requiring integration of multiple interpretation criteria (interface geometry, lateral continuity, gradient analysis, borehole calibration).
Therefore, OCTEM-based urban fault screening focuses on [27]:
- (i)
- Sudden vertical offset or lateral discontinuity of resistivity interfaces (e.g., Q3/Q4 boundary).
- (ii)
- Local high-gradient zones indicating abrupt lithologic or structural change.
- (iii)
- Strip-like or wedge-shaped low-resistivity zones aligned with regional fault trends.
- (iv)
- Throughgoing structural discontinuities extending across multiple depth intervals.
These adapted criteria reflect the reality that faults in thick Quaternary cover may produce subtle resistivity signatures that differ from the classic “low-resistivity fault zone” model applicable in crystalline rock or well-defined aquifer systems.
2.5.1. Forward Response and Data Vector
In time-domain electromagnetic measurements, the recorded response can be expressed as an induced voltage that is proportional to the time derivative of the secondary magnetic field.
where Nr and Ar are the number of turns and area of the receiver coil.
For the OCTEM, the receiver is placed near the geometric plane where the primary magnetic flux is (ideally) zero, so the early-time signal is less contaminated by mutual induction, and the measured voltage is dominated by the secondary response.
The inversion is conducted on a data vector d consisting of selected time gates tk after current turn-off (with saturated or heavily distorted early-time gates removed or down-weighted when necessary).
2.5.2. Regularized Inversion Formulation
The 1D inversion can be written as a regularized optimization problem in which a misfit term is balanced against a model-roughness (or deviation-from-reference) penalty:
where F(m) is the forward operator for a layered-earth TEM response, m is the model parameter vector (e.g., log-resistivity of vertically discretized layers), Wd is the data-weighting matrix (typically using estimated standard deviations per time gate), Wm is a roughness operator (e.g., first or second derivative in depth), and λ is the regularization (constraint) coefficient controlling the trade-off between data fit and model smoothness.
In practice, λ is tested over a range and selected to achieve stable geologically plausible layering while remaining consistent with borehole calibration, which is consistent with the “constraint coefficient” strategy described above.
2.5.3. Iterative Update and Stopping Criteria
Using Gauss–Newton linearization (F 3), the model update can be obtained by solving:
The inversion is iterated until (i) the normalized RMS misfit approaches the expected noise level, (ii) the relative change in φ(m) becomes sufficiently small, or (iii) a predefined maximum number of iterations is reached.
In particular, the OCTEM inversion benefits from known-borehole calibration, which constrains the resistivity–depth relationship and improves the reliability of fault feature identification even in environments with high electromagnetic noise.
3. Results
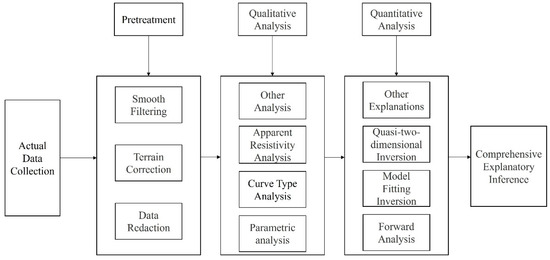
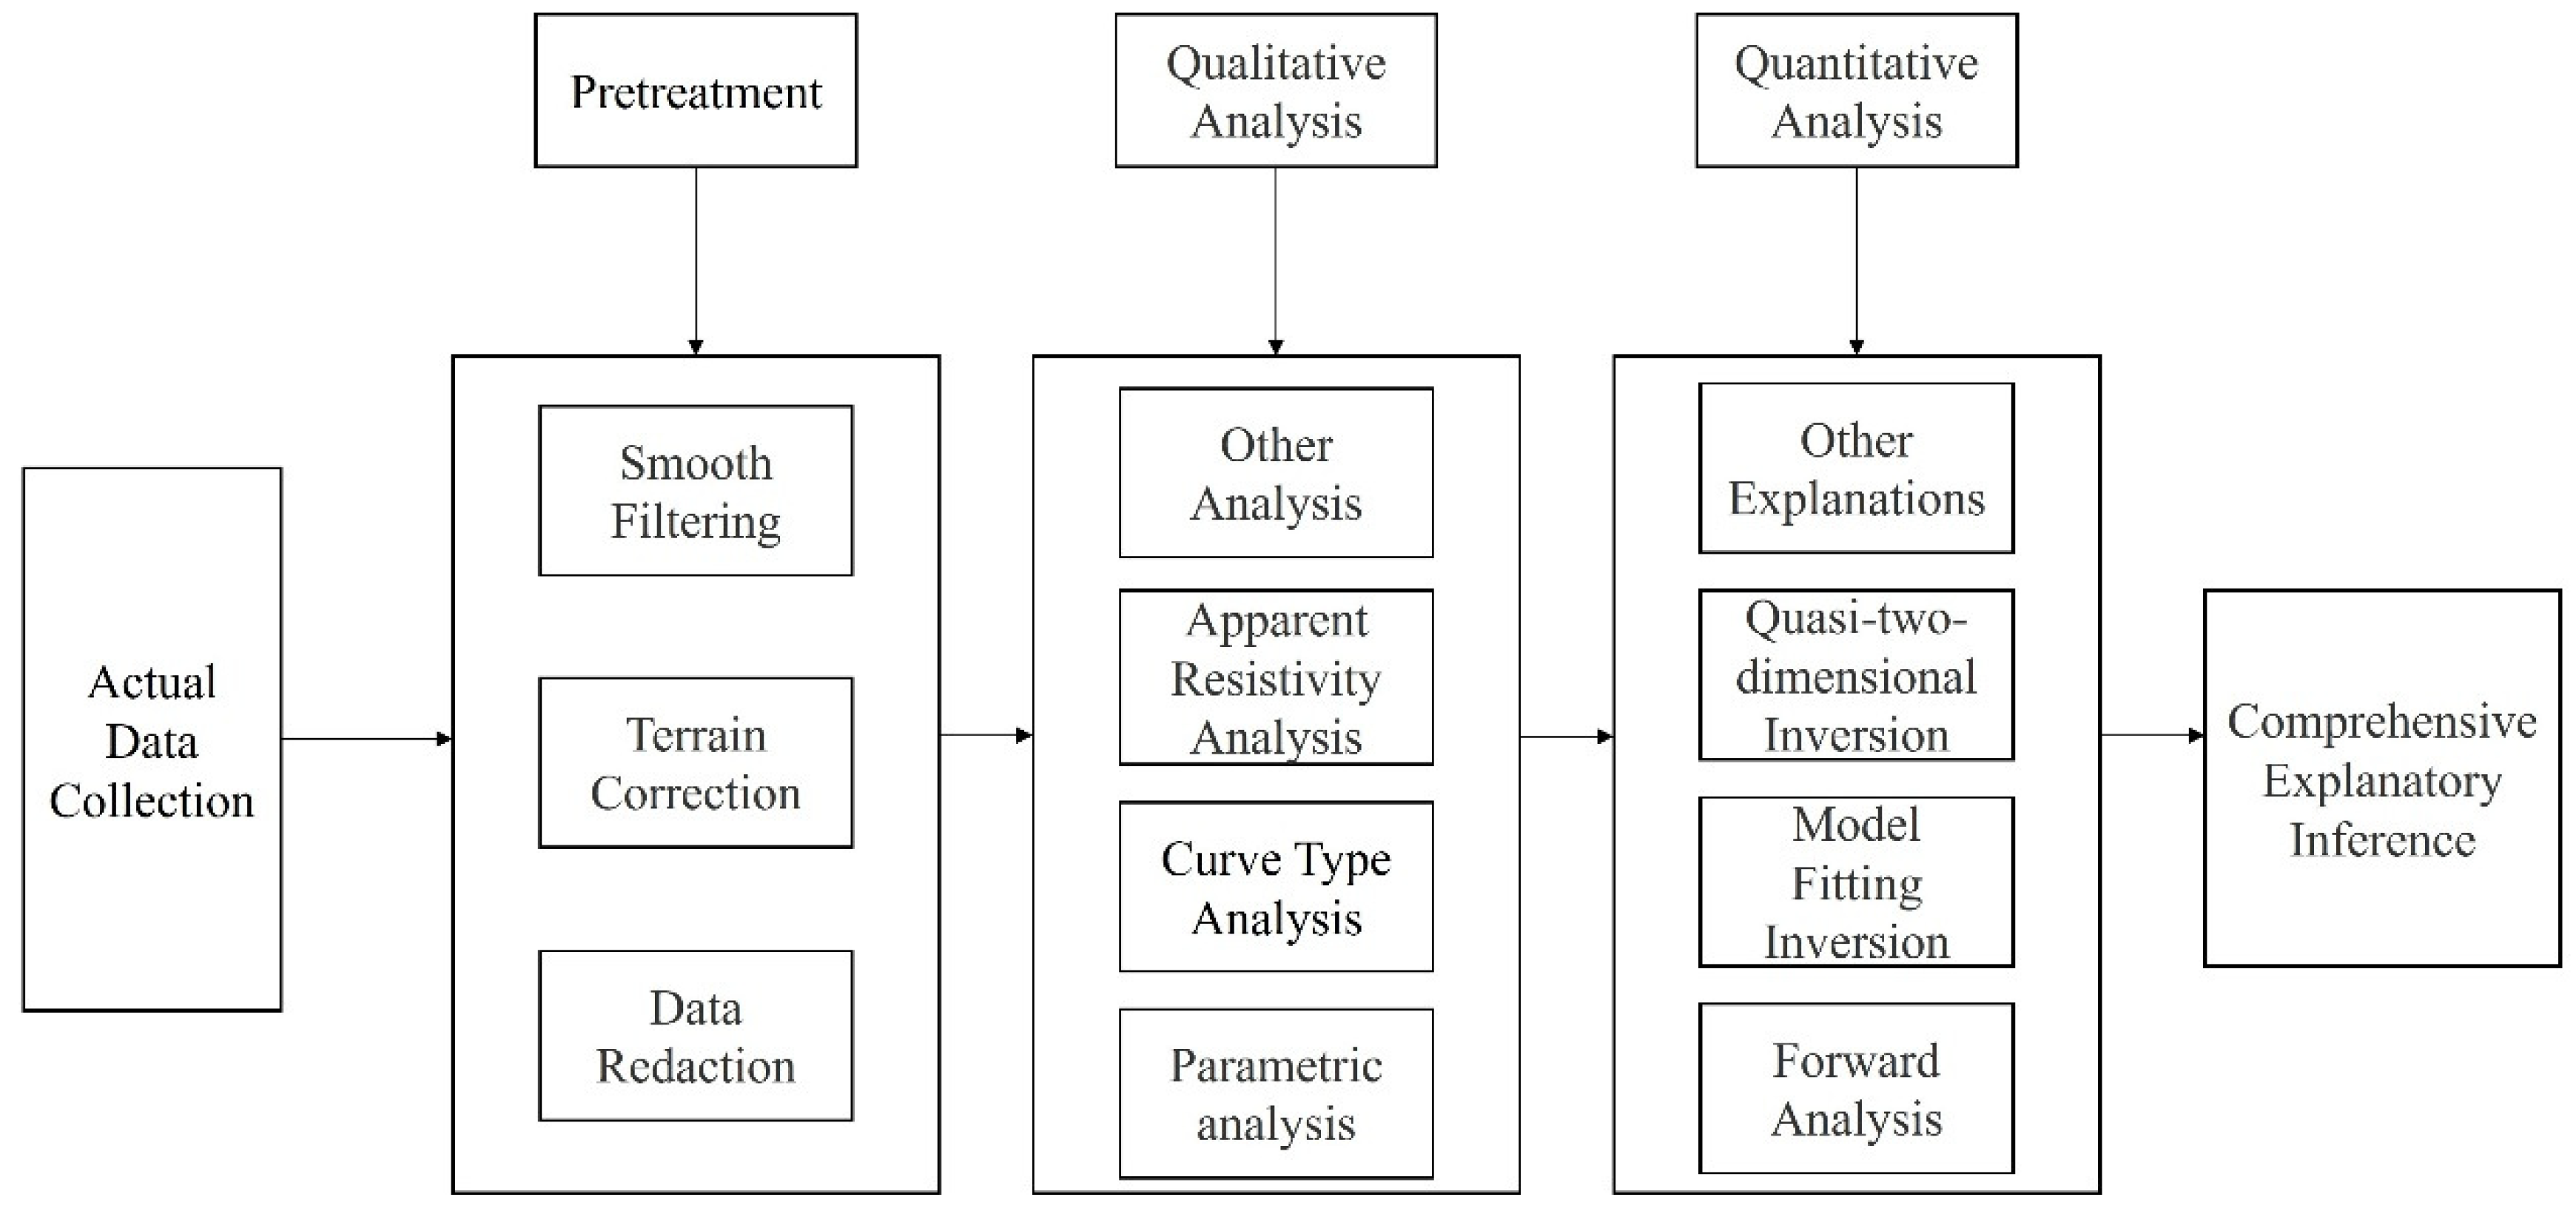
This section reports the acquisition quality assessment, subsurface resistivity structure, and localized anomalies identified along Line L1. The quality metrics demonstrate that the OCTEM achieved stable, high-fidelity data acquisition under urban noise conditions, validating the reliability of subsequent interpretation. The complete data processing flow is shown in Figure 8.
Figure 8.
Process flow chart of OCTEM data.
3.1. Quality Evaluation
In order to measure the accuracy of the entire original observation, a quality check was carried out on the sections that were critical for interpretation and inference, inspection, and verification [28]. According to the requirements of the specification, the inspection workload should account for 3–5% of the total workload. The total amount of work was 597 points, 31 inspection points, and the inspection workload reached 5.19%, which meets the requirements of the specification.
- (1)
- Equation for the relative error of the mean square:
- (a)
- The total mean square relative error of each observation track at a measurement point. The equation is as follows:where Vj(ti) is the original observation data of the line I track at point j; V’j(ti) is point j on the line I track survey system, where the observation data are checked; (ti) is the average of Vj(ti) and V’j(ti); and n is the number of tracks participating in the statistical calculation.
- (b)
- The total mean square relative error of each checkpoint in the whole region:where m is the number of checkpoints.
- (2)
- Equation for the absolute error of the mean square:
- (a)
- The total mean square absolute error of each observation track at a measurement point:
- (b)
- The total mean absolute error of each checkpoint in the whole region:
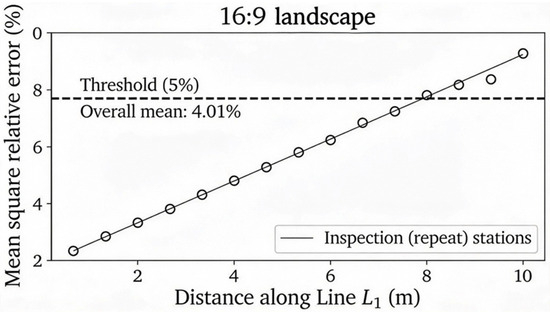
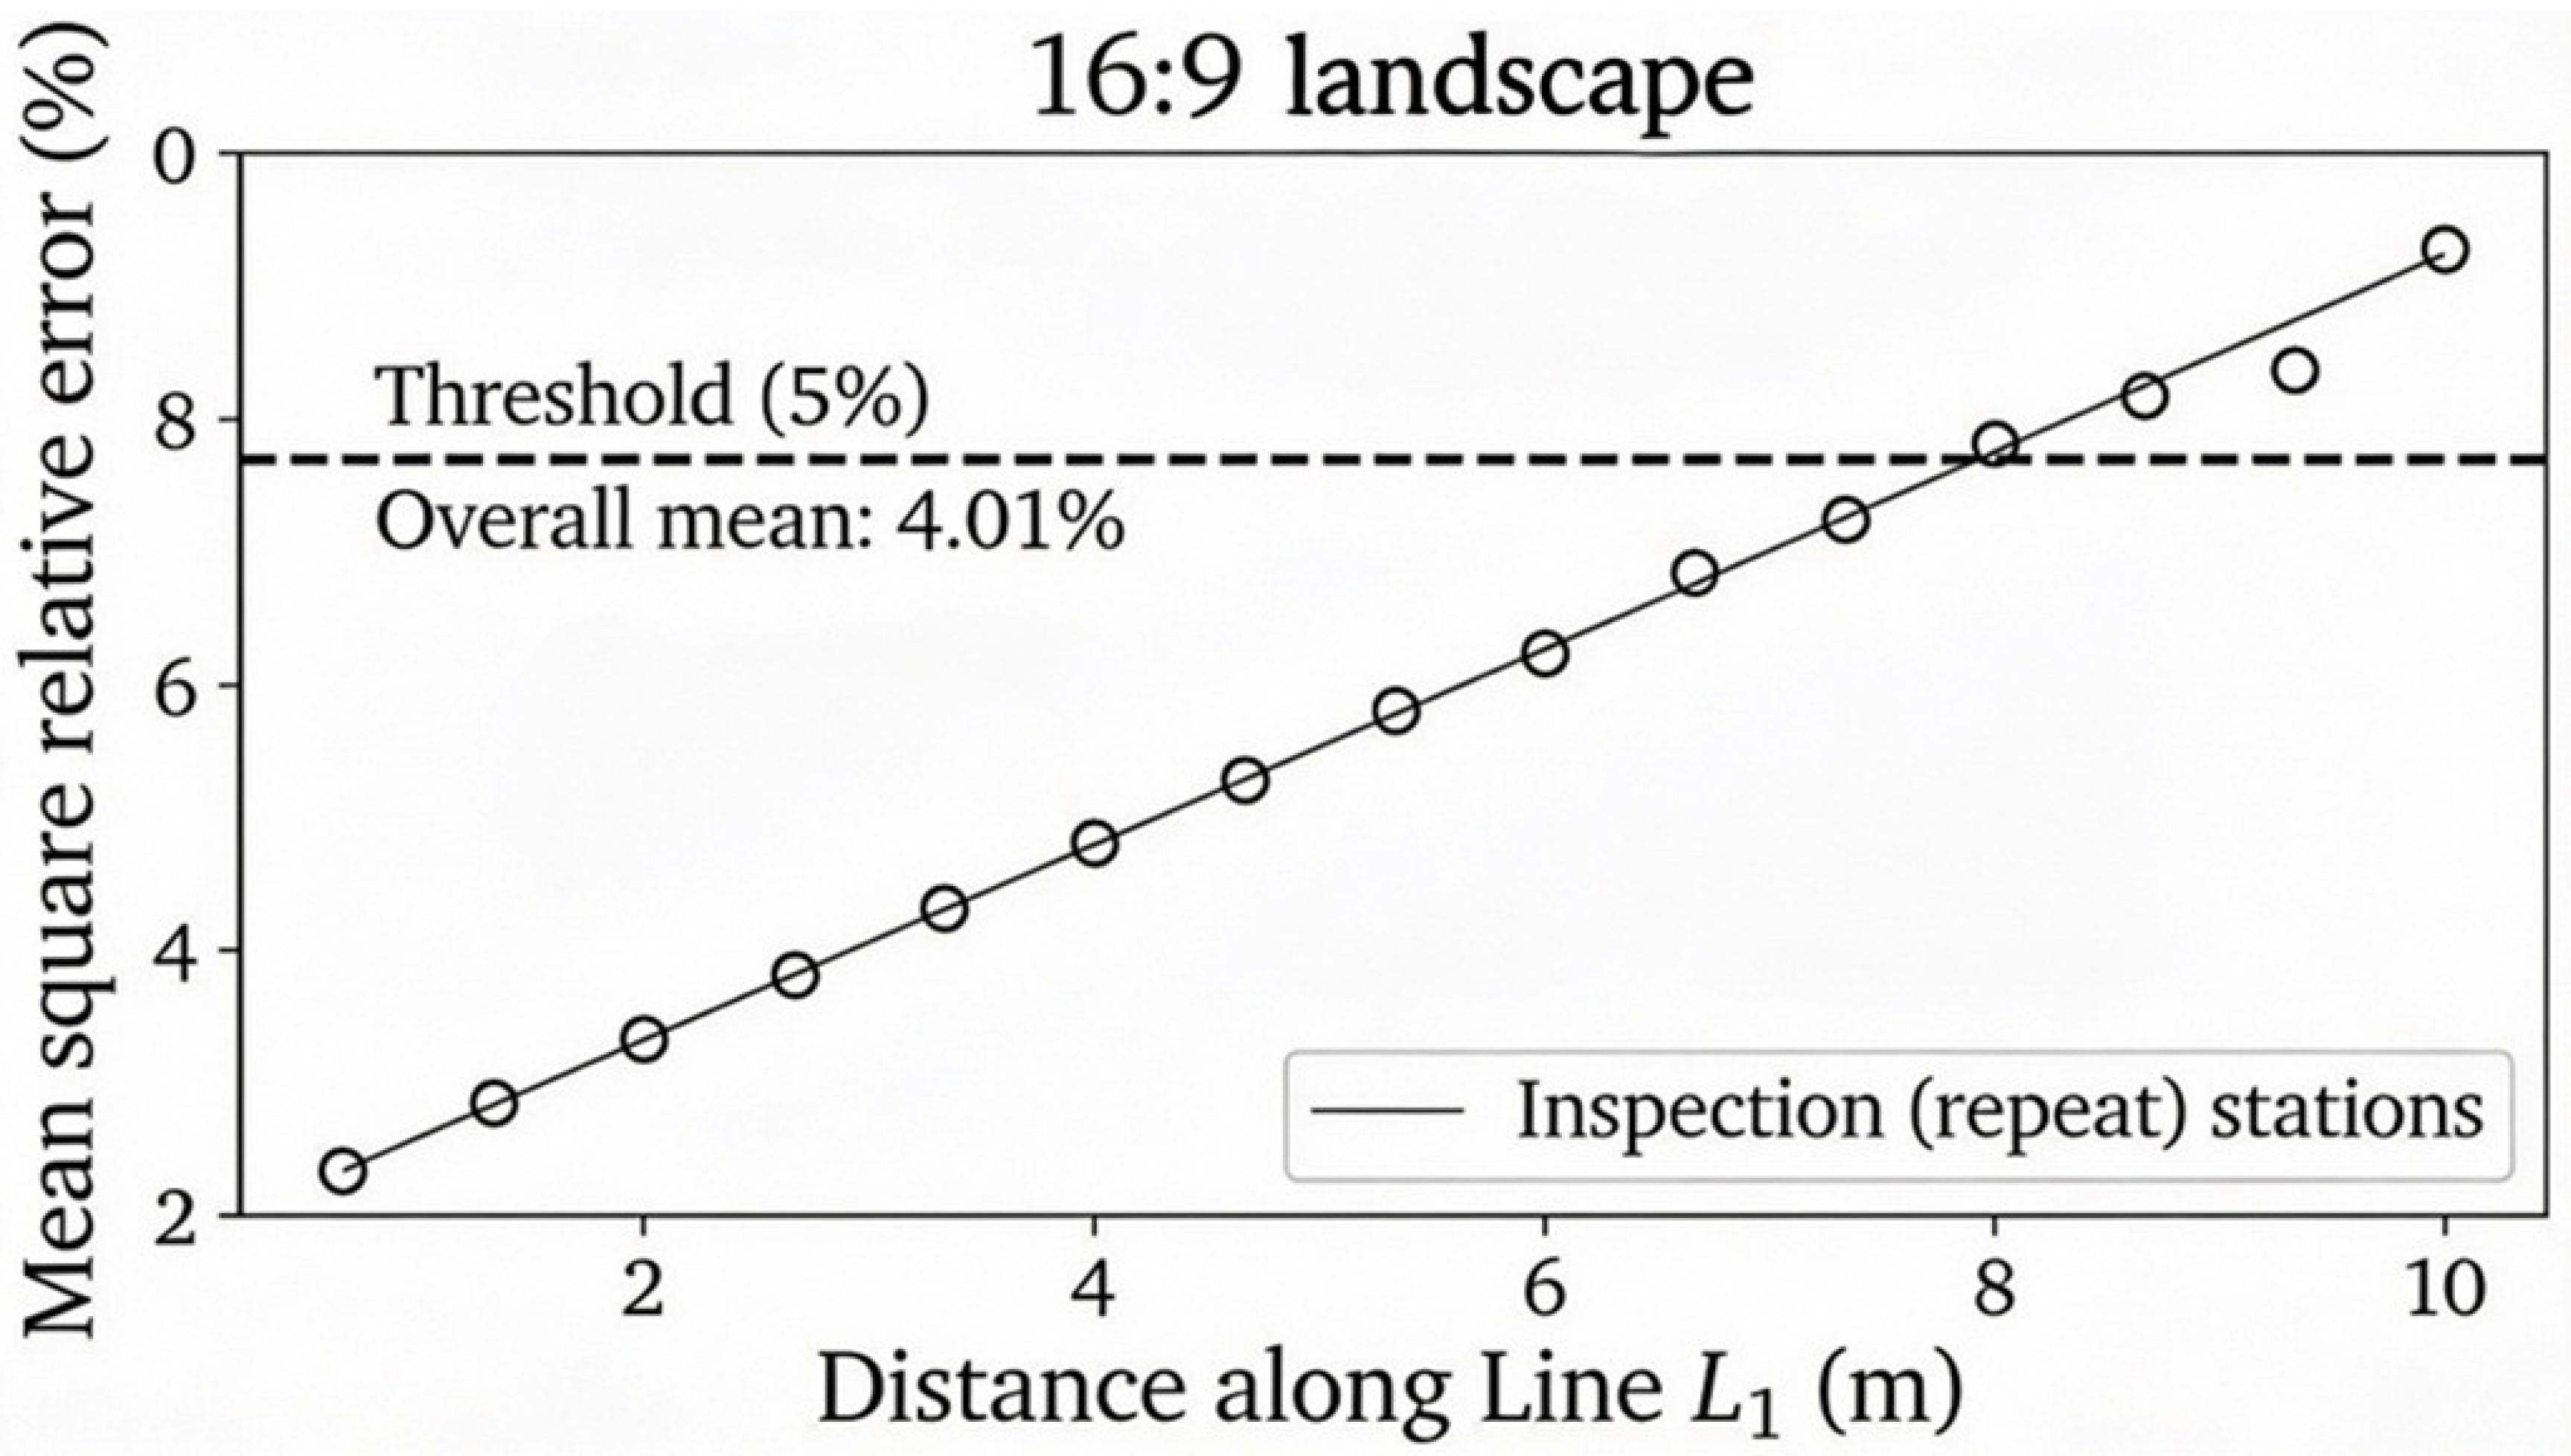
According to the above equations, the average mean square relative error of each checkpoint is less than 5%, and the total average mean square relative error across all checkpoints is 4.01%, which meets the requirements of the specification. This result confirms that the OCTEM system maintained stable measurement performance throughout the survey, with a repeatability error well below the acceptance threshold, even under challenging urban electromagnetic conditions.
As shown in Figure 9, the mean square relative error of the inspection stations is generally within the 5% acceptance threshold, and the overall mean error is 4.01%, indicating stable acquisition quality for corridor-scale interpretation. This QC outcome is consistent with the survey’s inspection design (31 repeat stations out of 597 total stations, i.e., 5.19% workload) and demonstrates that the OCTEM can achieve repeatable, high-fidelity measurements in urban noise backgrounds, supporting the use of the dataset for resistivity inversion and subsequent anomaly screening.
Figure 9.
Mean square relative error of inspection stations along Line L1.
3.2. Resistivity Inversion Results
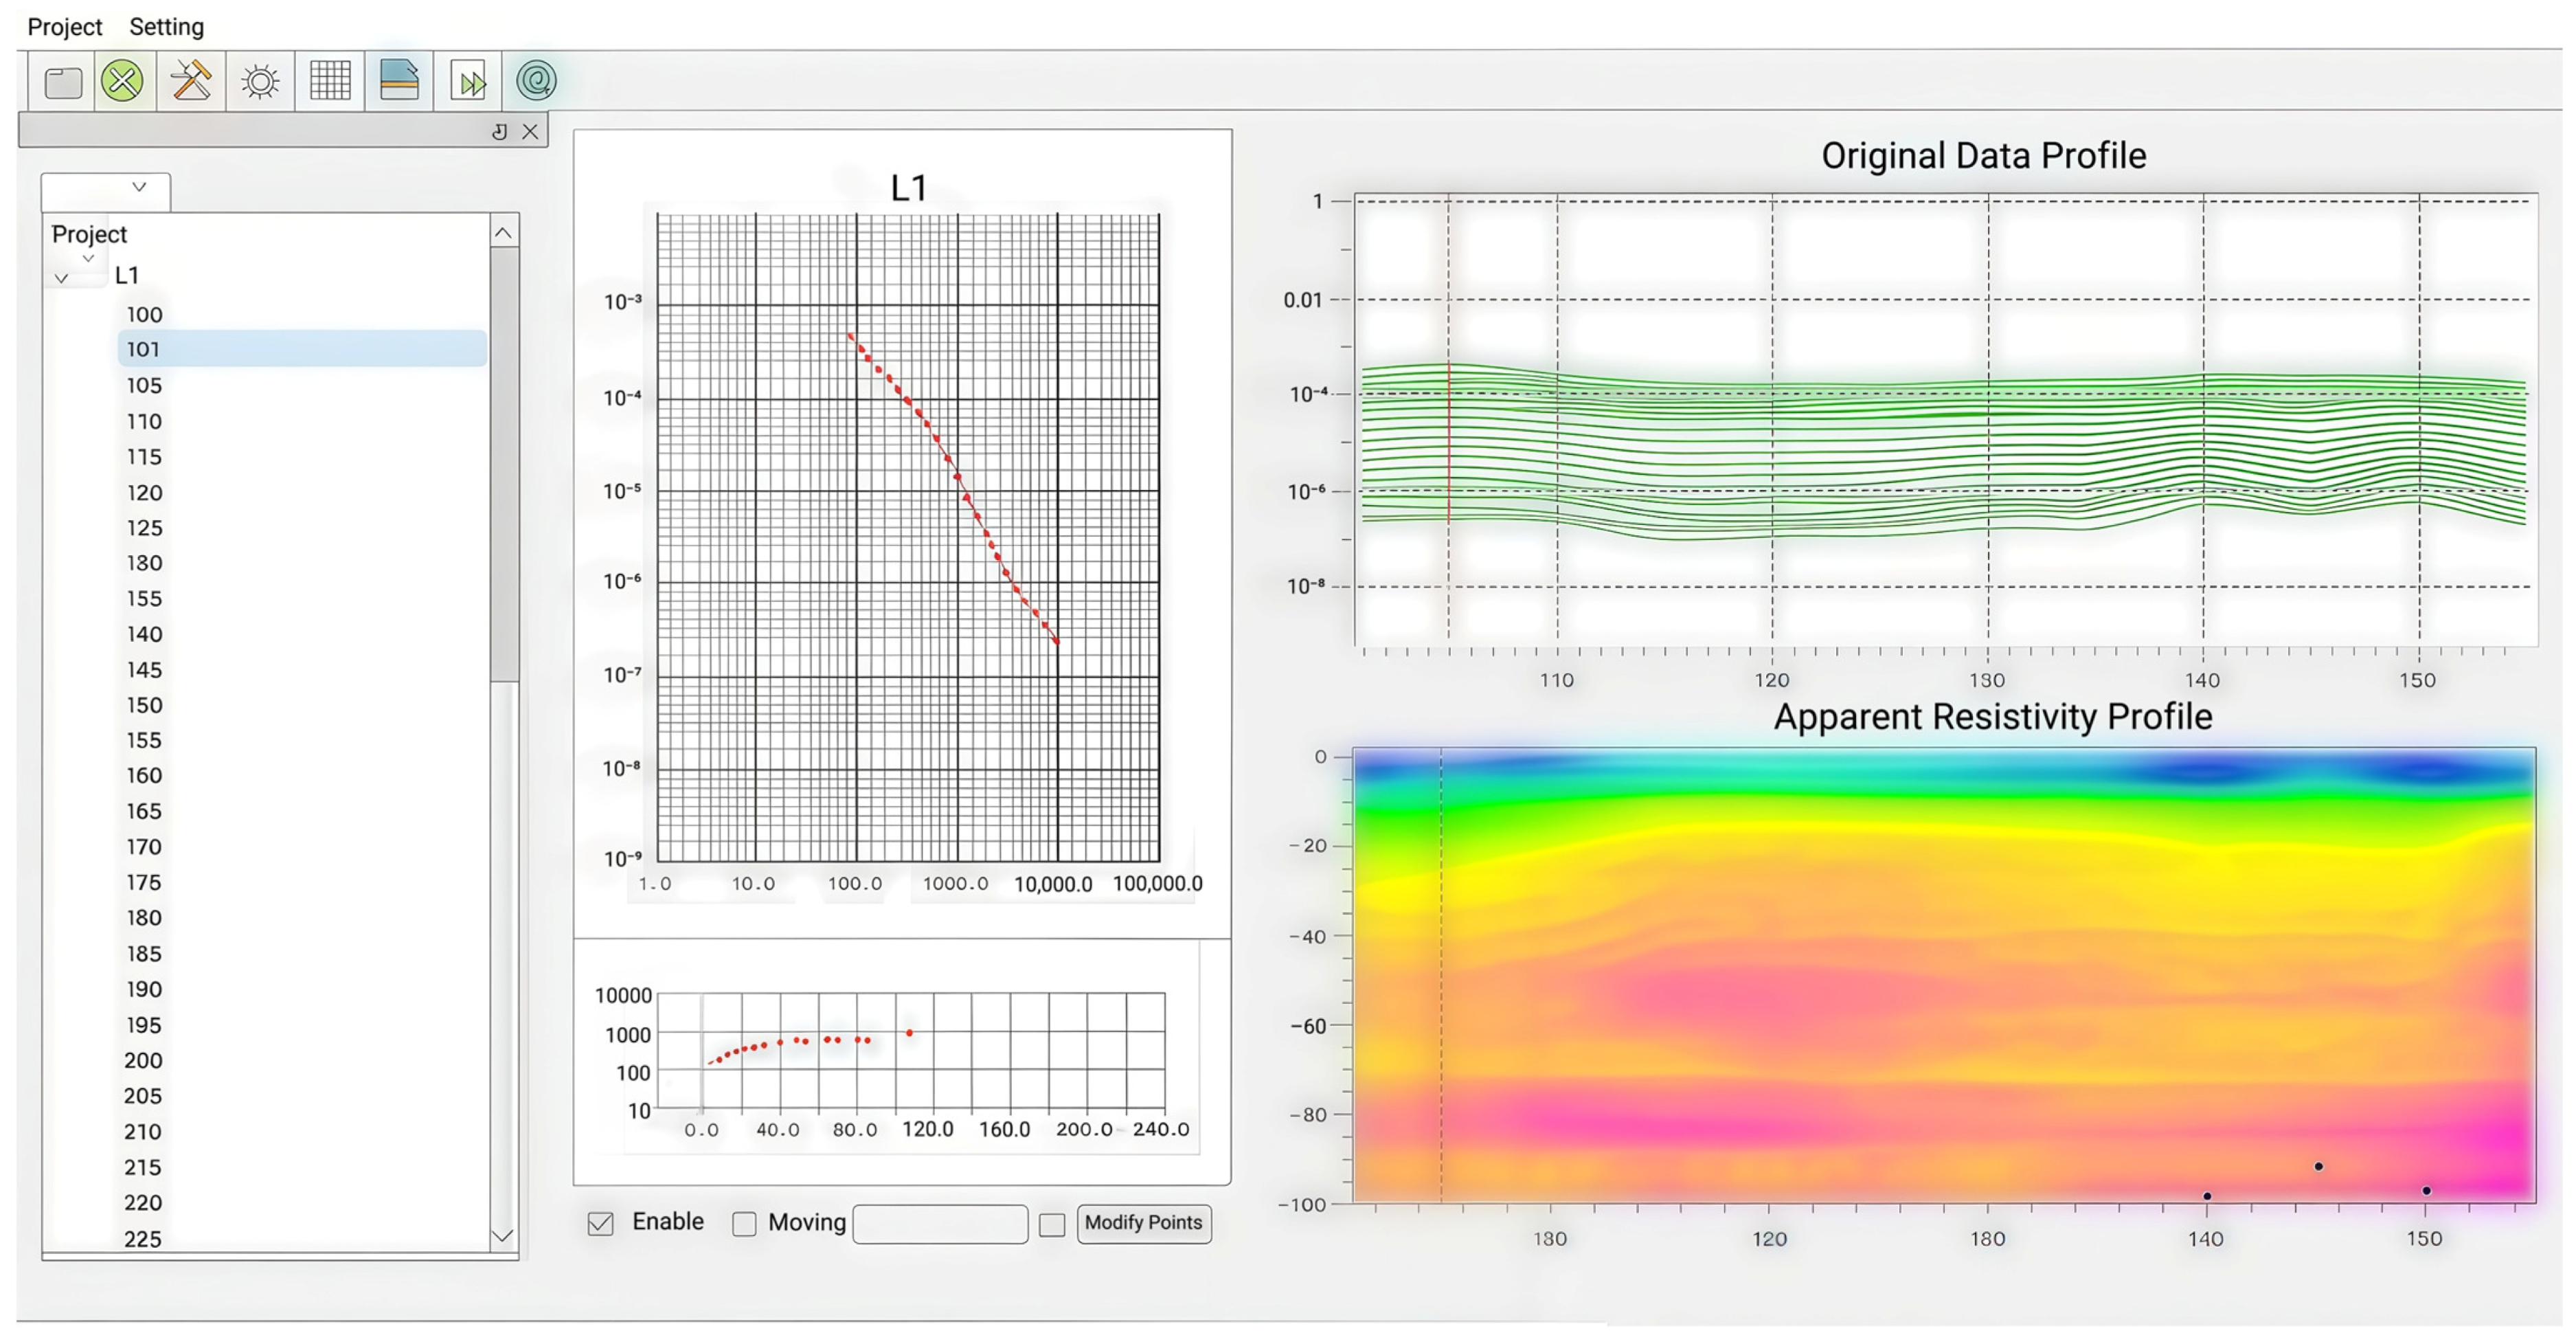
Inversion parameterization was used for Figure 10. The resistivity section in Figure 10 was generated using the HPTEM Data Processing Software Version 2.6.1 (Hunan 5D Geophyson Co., Ltd., Changsha, China) with parameter settings following the software’s “Quick Use” workflow. Figure 11 shows the interface of the data processing software.
Figure 10.
OCTEM resistivity inversion section for Line L1.
Figure 11.
Inversion software interface diagram.
Specifically, the inversion used a constraint coefficient of 1.0 (allowable range 0.2–5) and an inversion coefficient of 0.3 (allowable range 0.05–2.0).
The baseline resistivity was set to 100 Ω·m, which is the software’s recommended near-surface reference value used as a line-level baseline.
The target (maximum) depth was set to 220 m to ensure full coverage of the 0–200 m investigation interval reported in this study and to follow the software guidance that, for target depths greater than 60 m, the maximum depth is preferably set to “target depth + 20 m”.
The start time was set to 80 μs, and the end time was set to 100,000 μs, consistent with the software guidance that the start time is fixed at 80 μs, while the end time is selected based on transmission frequency or set sufficiently large to include late-time decay.
The inversion method was set to “transient relaxation inversion”, which is derived from the equivalent inverse-flux (anti-flux) theory and yields a relative resistivity image that is used for anomaly discrimination and interface continuity assessment.
For the quasi-2D section display, the grid setting followed the default fixed-grid configuration (grid spacing factor = 5.00) with a recursive grid length of 1.00.
Leveling correction was enabled using the built-in Skima regression procedure, as provided by the software for profile processing.
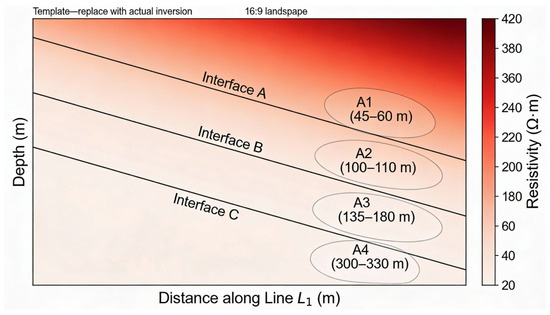
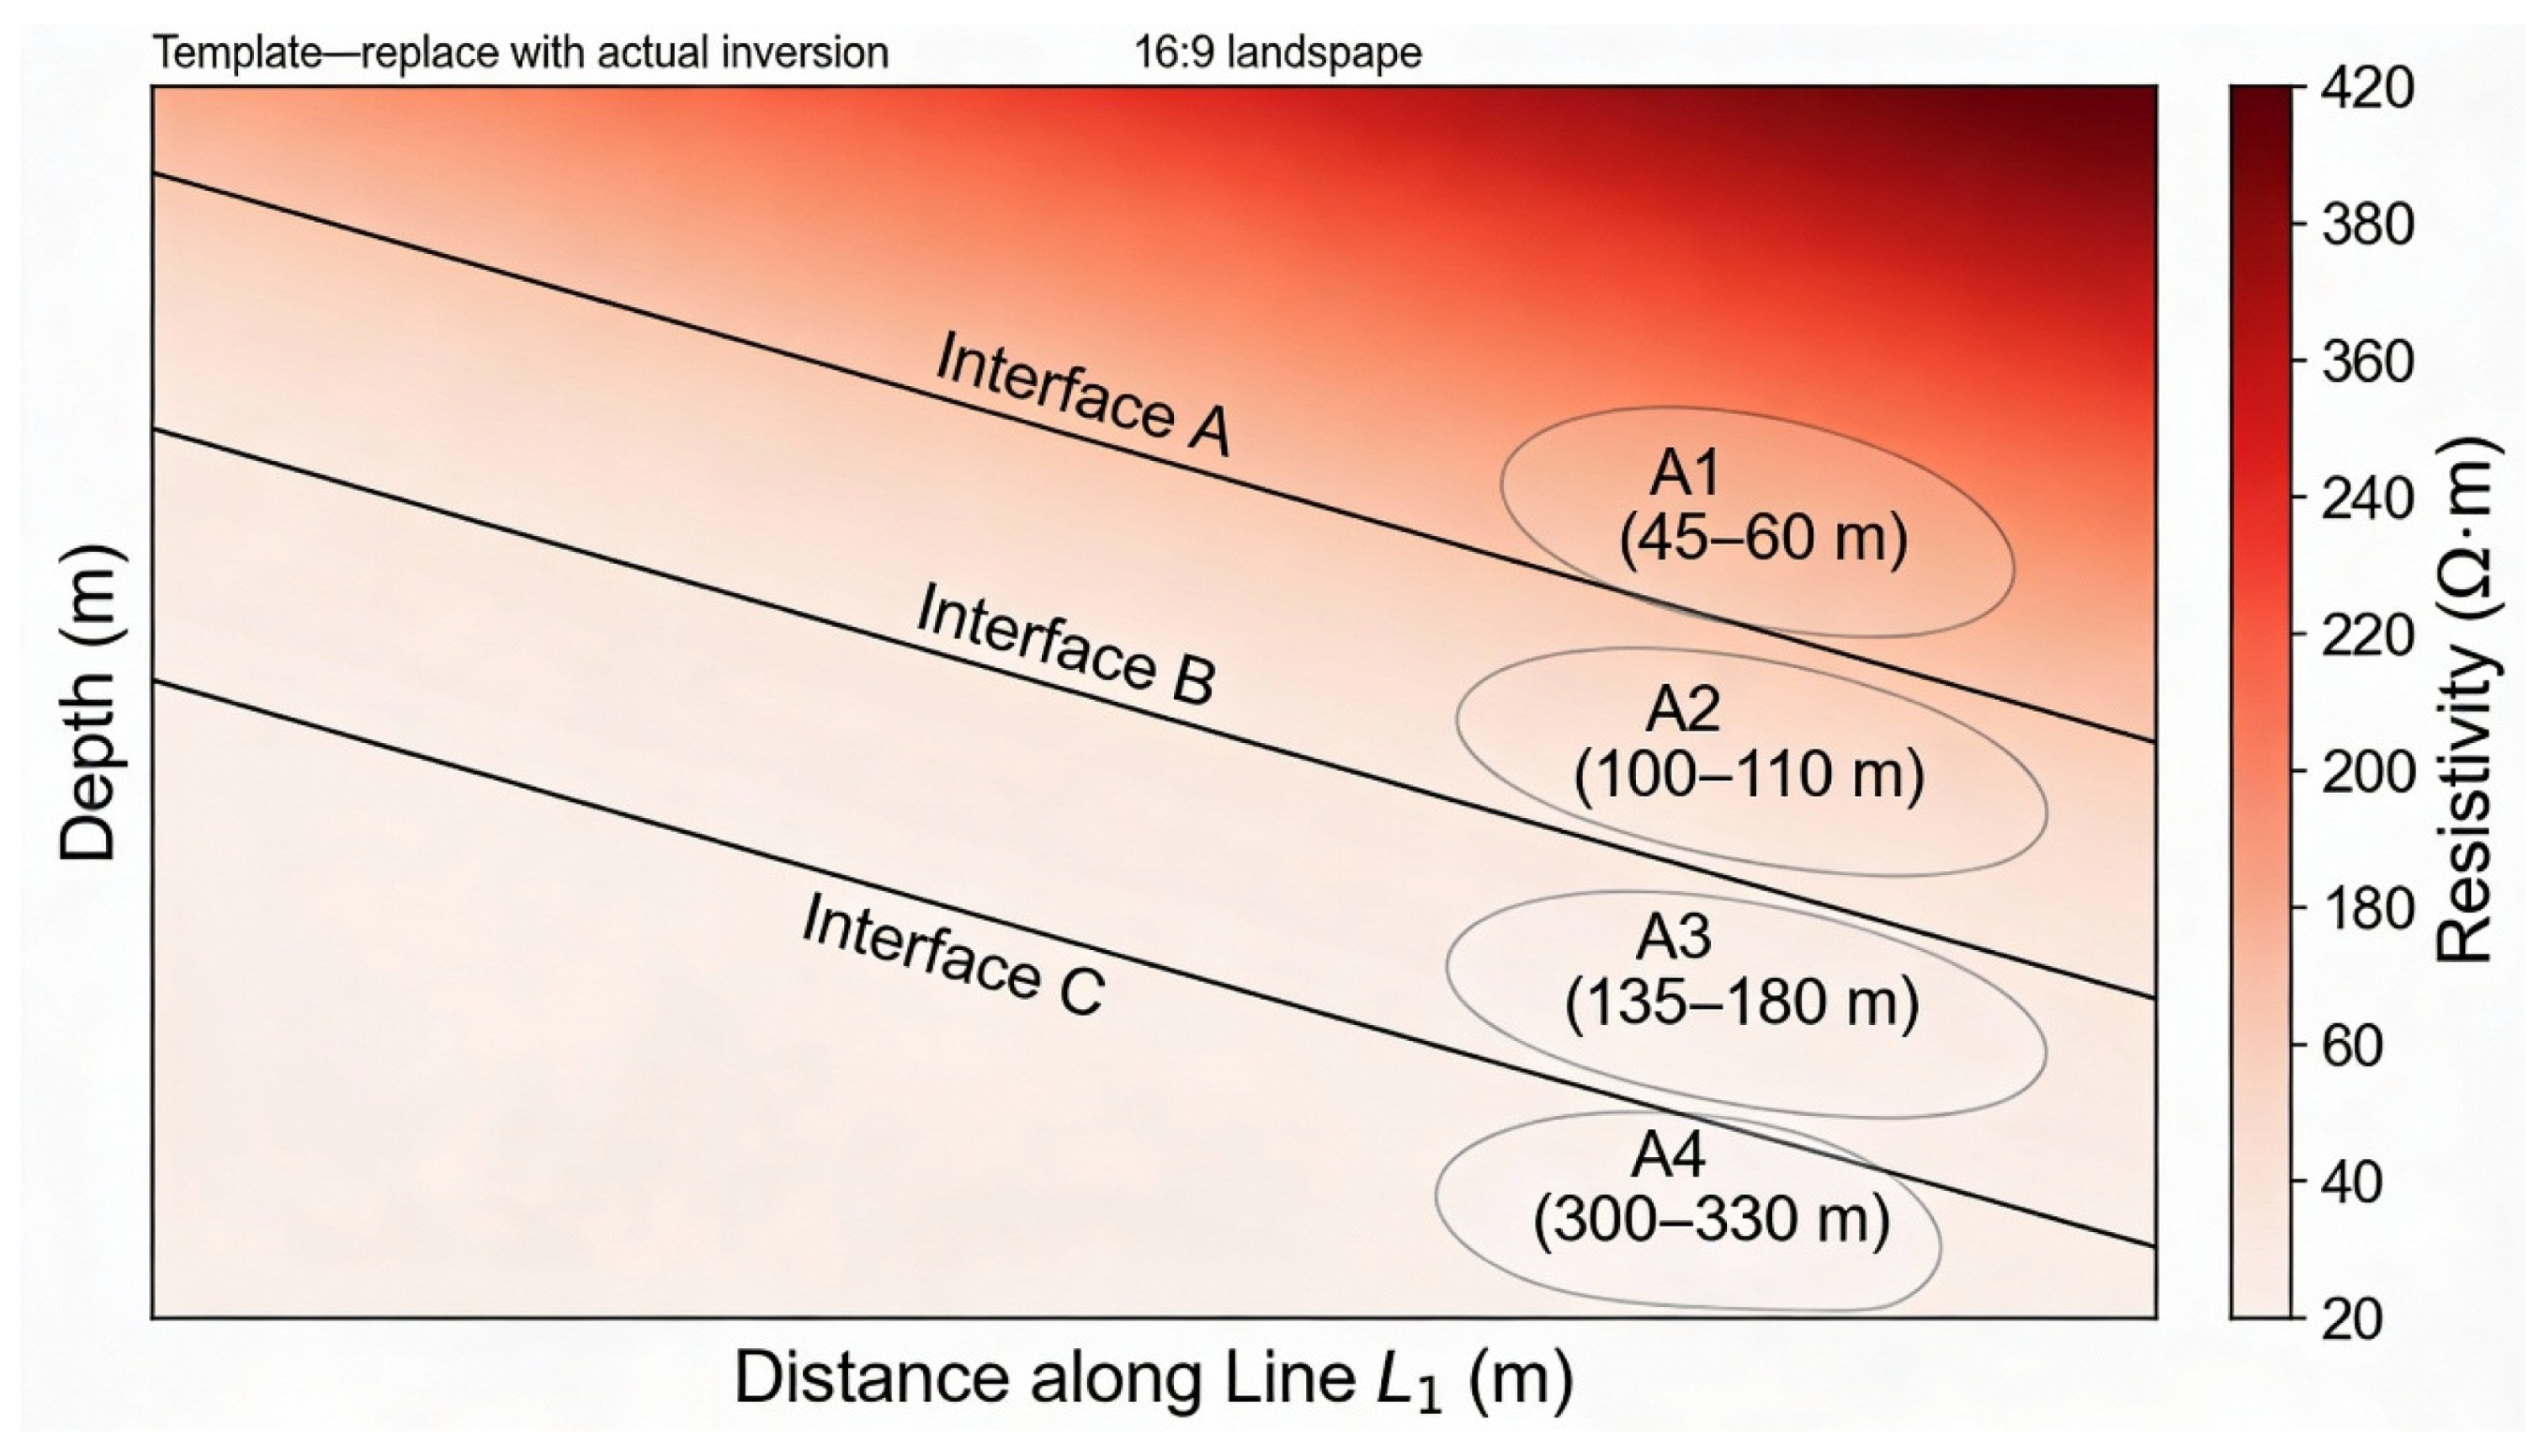
The inverted resistivity section in Figure 10 shows a dominantly layered structure with resistivity values ranging from approximately 20 to 420 Ω·m and a general increase with depth, consistent with the stratified Quaternary sedimentary setting described for the site. The three annotated interfaces (A–C) provide a practical framework for describing electrical layering and for locating departures from lateral continuity that may indicate localized heterogeneity.
For presentation in Applied Sciences, the revised figure corresponding to the inversion result includes a labeled color bar (resistivity in Ω·m), a depth axis (m), a distance axis (mileage, m), station markers, and interpretative overlays (key interfaces and anomaly boundaries) to make the figure self-contained and technically reproducible. The clarity and detail of the inversion section demonstrate the effective suppression of urban electromagnetic noise by the OCTEM configuration, resulting in interpretable subsurface imagery comparable to conventional electromagnetic surveys in open settings.
3.3. Geophysical Interpretation Signs of Urban Active Faults
Figure detection in urban environments using the OCTEM requires adaptation of standard fault identification criteria because thick unconsolidated cover and anthropogenic noise can weaken or obscure traditional fault signatures [1,29]. In open-area fault investigations, a clear low-resistivity anomaly associated with an aquifer-filled fracture zone is the primary indicator of a fault. However, in cities with thick Quaternary alluvium, such clear signatures may not develop because the enclosing sediments themselves often have low resistivity due to high porosity and moisture content. Consequently, OCTEM-based urban fault screening requires integration of multiple indicators—including resistivity contrast, interface geometry, and borehole constraints—rather than reliance on a single diagnostic feature. In the context of the huge thickness of urban cover, fault interpretation needs to focus on the following characteristics:
- Sudden change in resistivity interface: The Quaternary layered interface (such as the boundary between Q3 and Q4) suddenly rises or falls laterally, which may indicate fault dislocation.
- Local high-gradient zone: The vertical gradient of resistivity increases significantly, reflecting an abrupt change in lithology or the fracture zone.
- Morphology of low-resistance anomalous zone: A strip-like or wedge-shaped low-resistance zone, if consistent with the regional fault trend, may be a water-filled or fractured fault zone.
- Discontinuity of stratigraphic structure: The resistivity distribution of the same stratigraphic unit in the transverse direction is broken or misaligned.
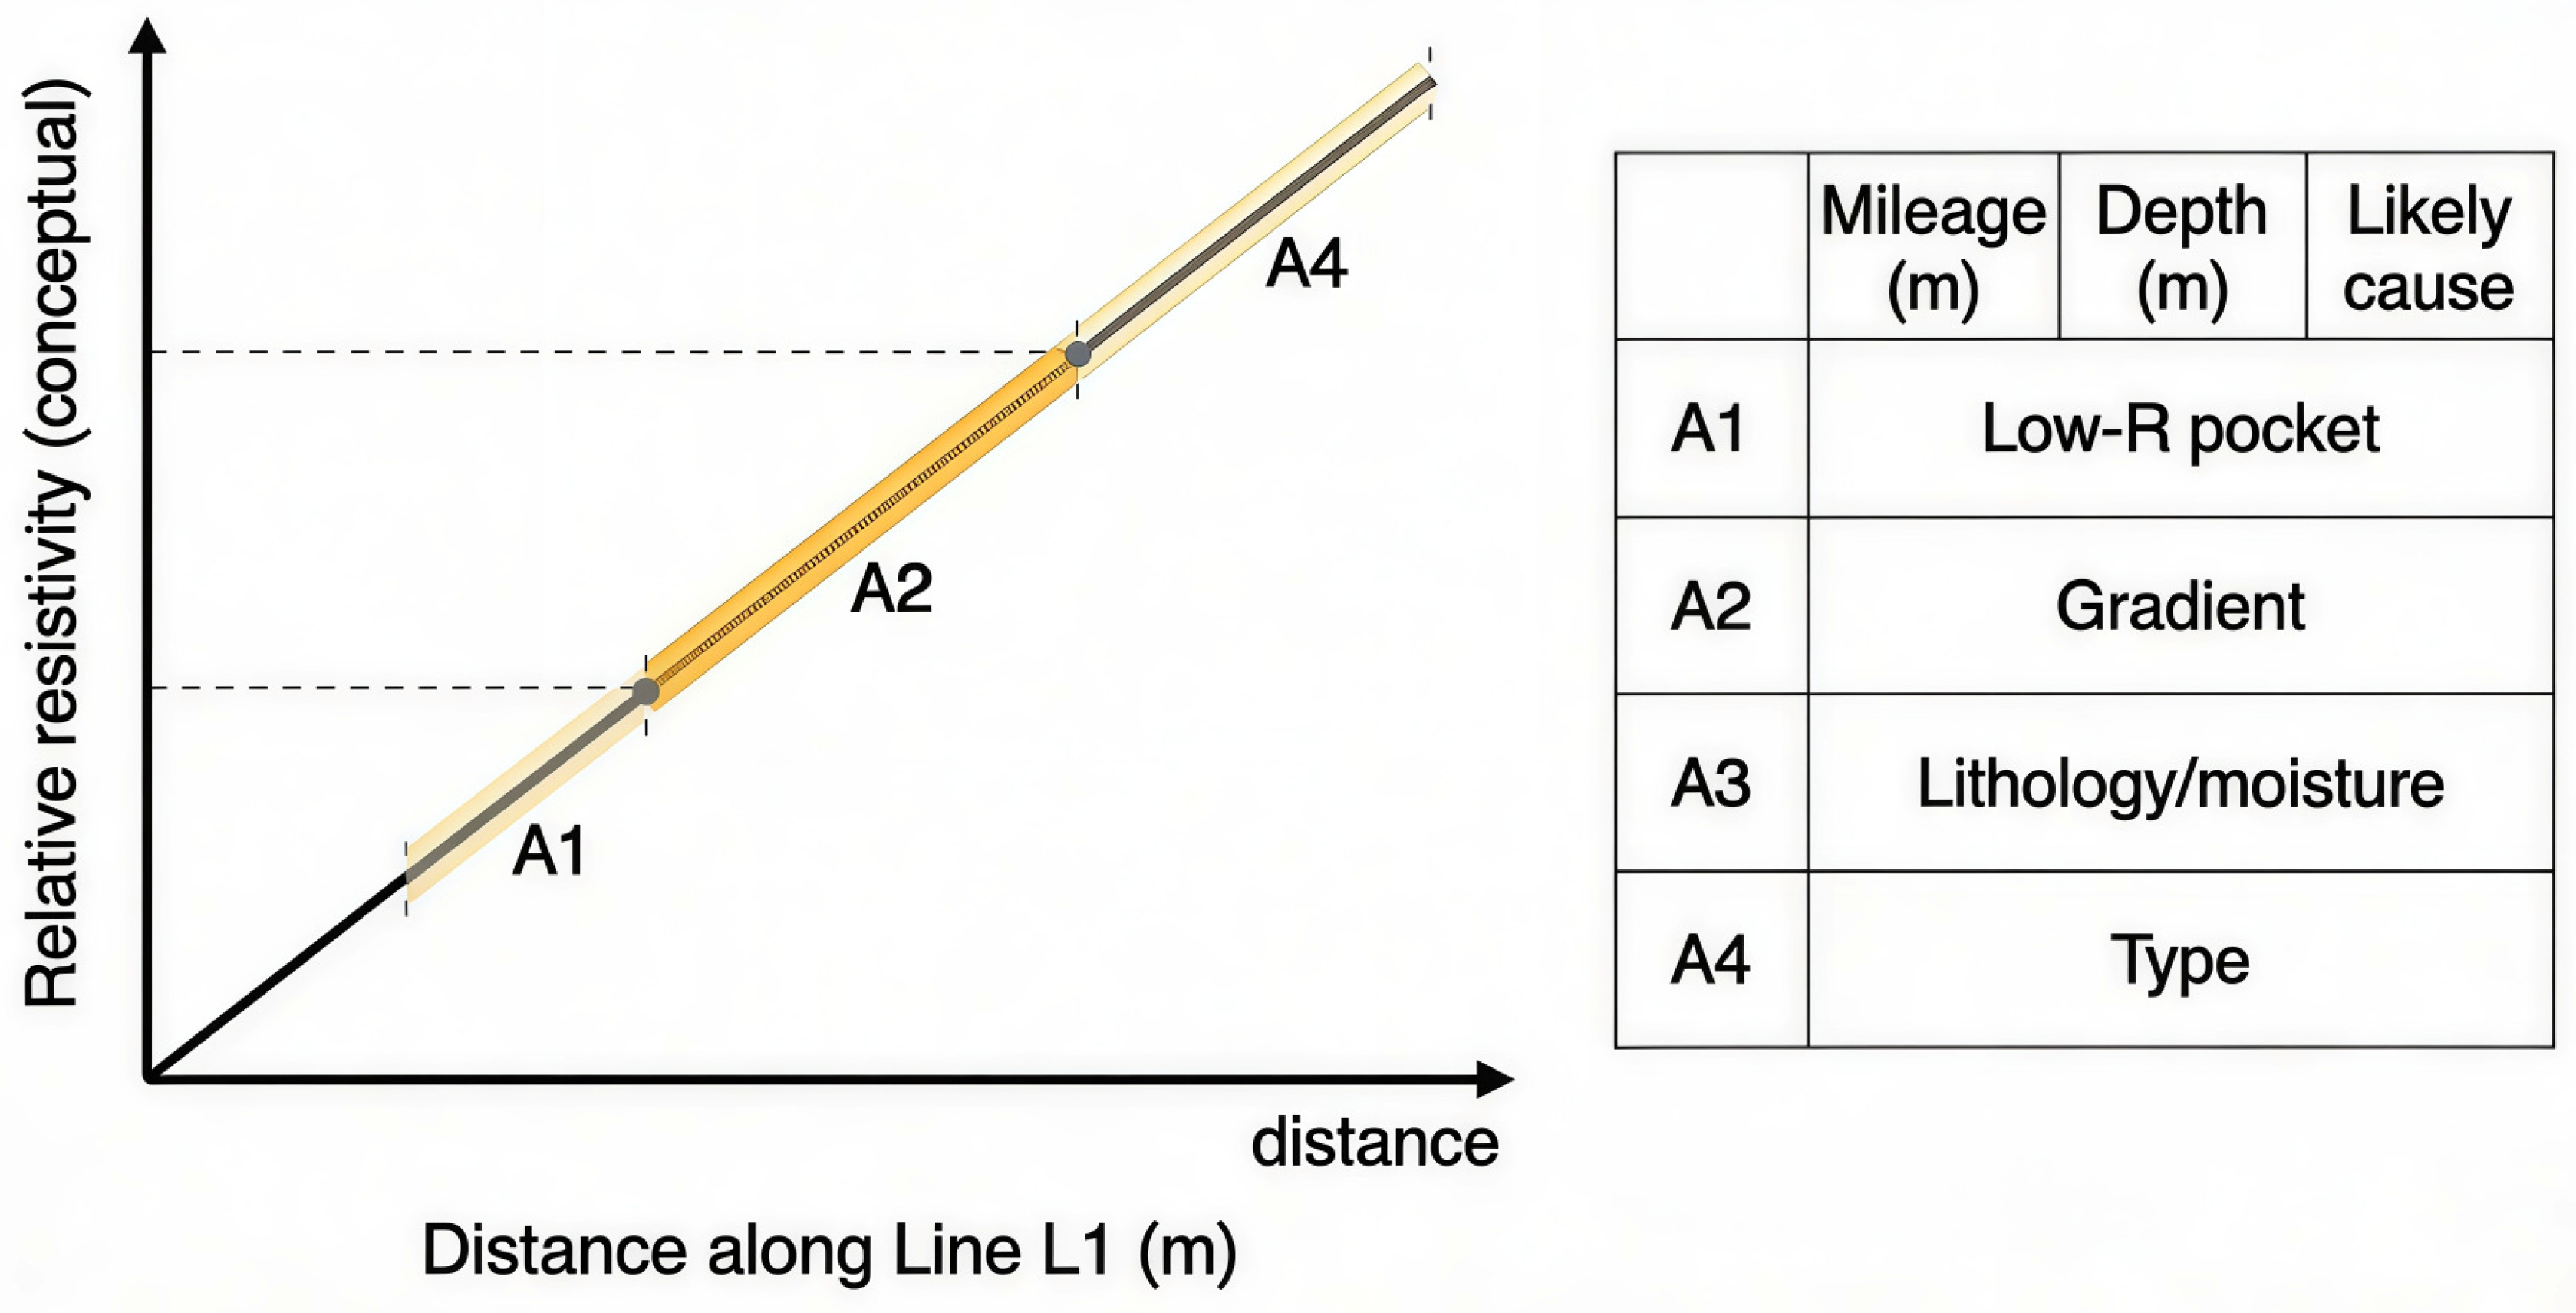
In addition to the obvious advantages of low resistivity, the OCTEM also has the advantages of high longitudinal and transverse resolution, and it is possible to infer potential faults through the discontinuous “upward movement” and “downward movement” of the top and bottom interfaces of the Quaternary lithological stratification in the transverse direction. These capabilities make the OCTEM particularly suitable for detecting subtle fault-related structural adjustments in thick urban overburden, where other methods may fail to resolve shallow discontinuities. As schematically summarized in Figure 12, the along-line resistivity pattern can be interpreted in terms of distinct anomaly types (A1–A4), which helps distinguish low-resistivity pockets, gradual trends, and lithology/moisture-related variations from potential fault-related discontinuities along Line L1.
Figure 12.
Inversion and inference interpretation of OCTEM for Line L1.
3.4. Inversion Results and Inference Interpretation of Profile of Exploration Line
As shown in Figure 13, the detection results of the Tiancheng Chengyuan exploration line show that the resistivity value of the underground rock stratum has a distribution characteristic of gradually increasing from top to bottom, the apparent resistivity value is generally low, and the maximum value does not exceed 420. The inversion resistivity of Line L1 ranges from 20 to 420 Ω·m. It is layered, and the resistivity gradually increases from top to bottom, which is in line with the electrical characteristics of Quaternary loose sediments. This typical resistivity pattern is clearly resolved by the OCTEM despite the urban electromagnetic background, confirming the method’s effectiveness in this setting.
Figure 13.
Inversion and inference interpretation of OCTEM for Line L1.
Shallow (0–50 m): The resistivity is 20–80 Ω·m, corresponding to the interbedding of Q4 Holocene silt and silty clay, which is significantly affected by surface humidity.
Middle (50–150 m): The resistivity is 80–200 Ω·m, corresponding to a clay layer of Upper Pleistocene silt in Q3, and the resistivity increases due to the decrease in porosity.
Deep (150–200 m): The resistivity is 200–420 Ω·m, presumed to be a dense silt layer or a locally cemented layer in the Middle Pleistocene in Q2.
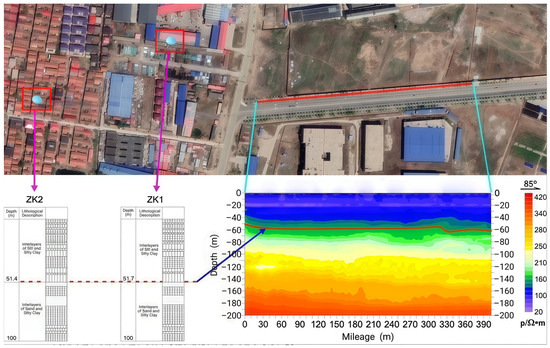
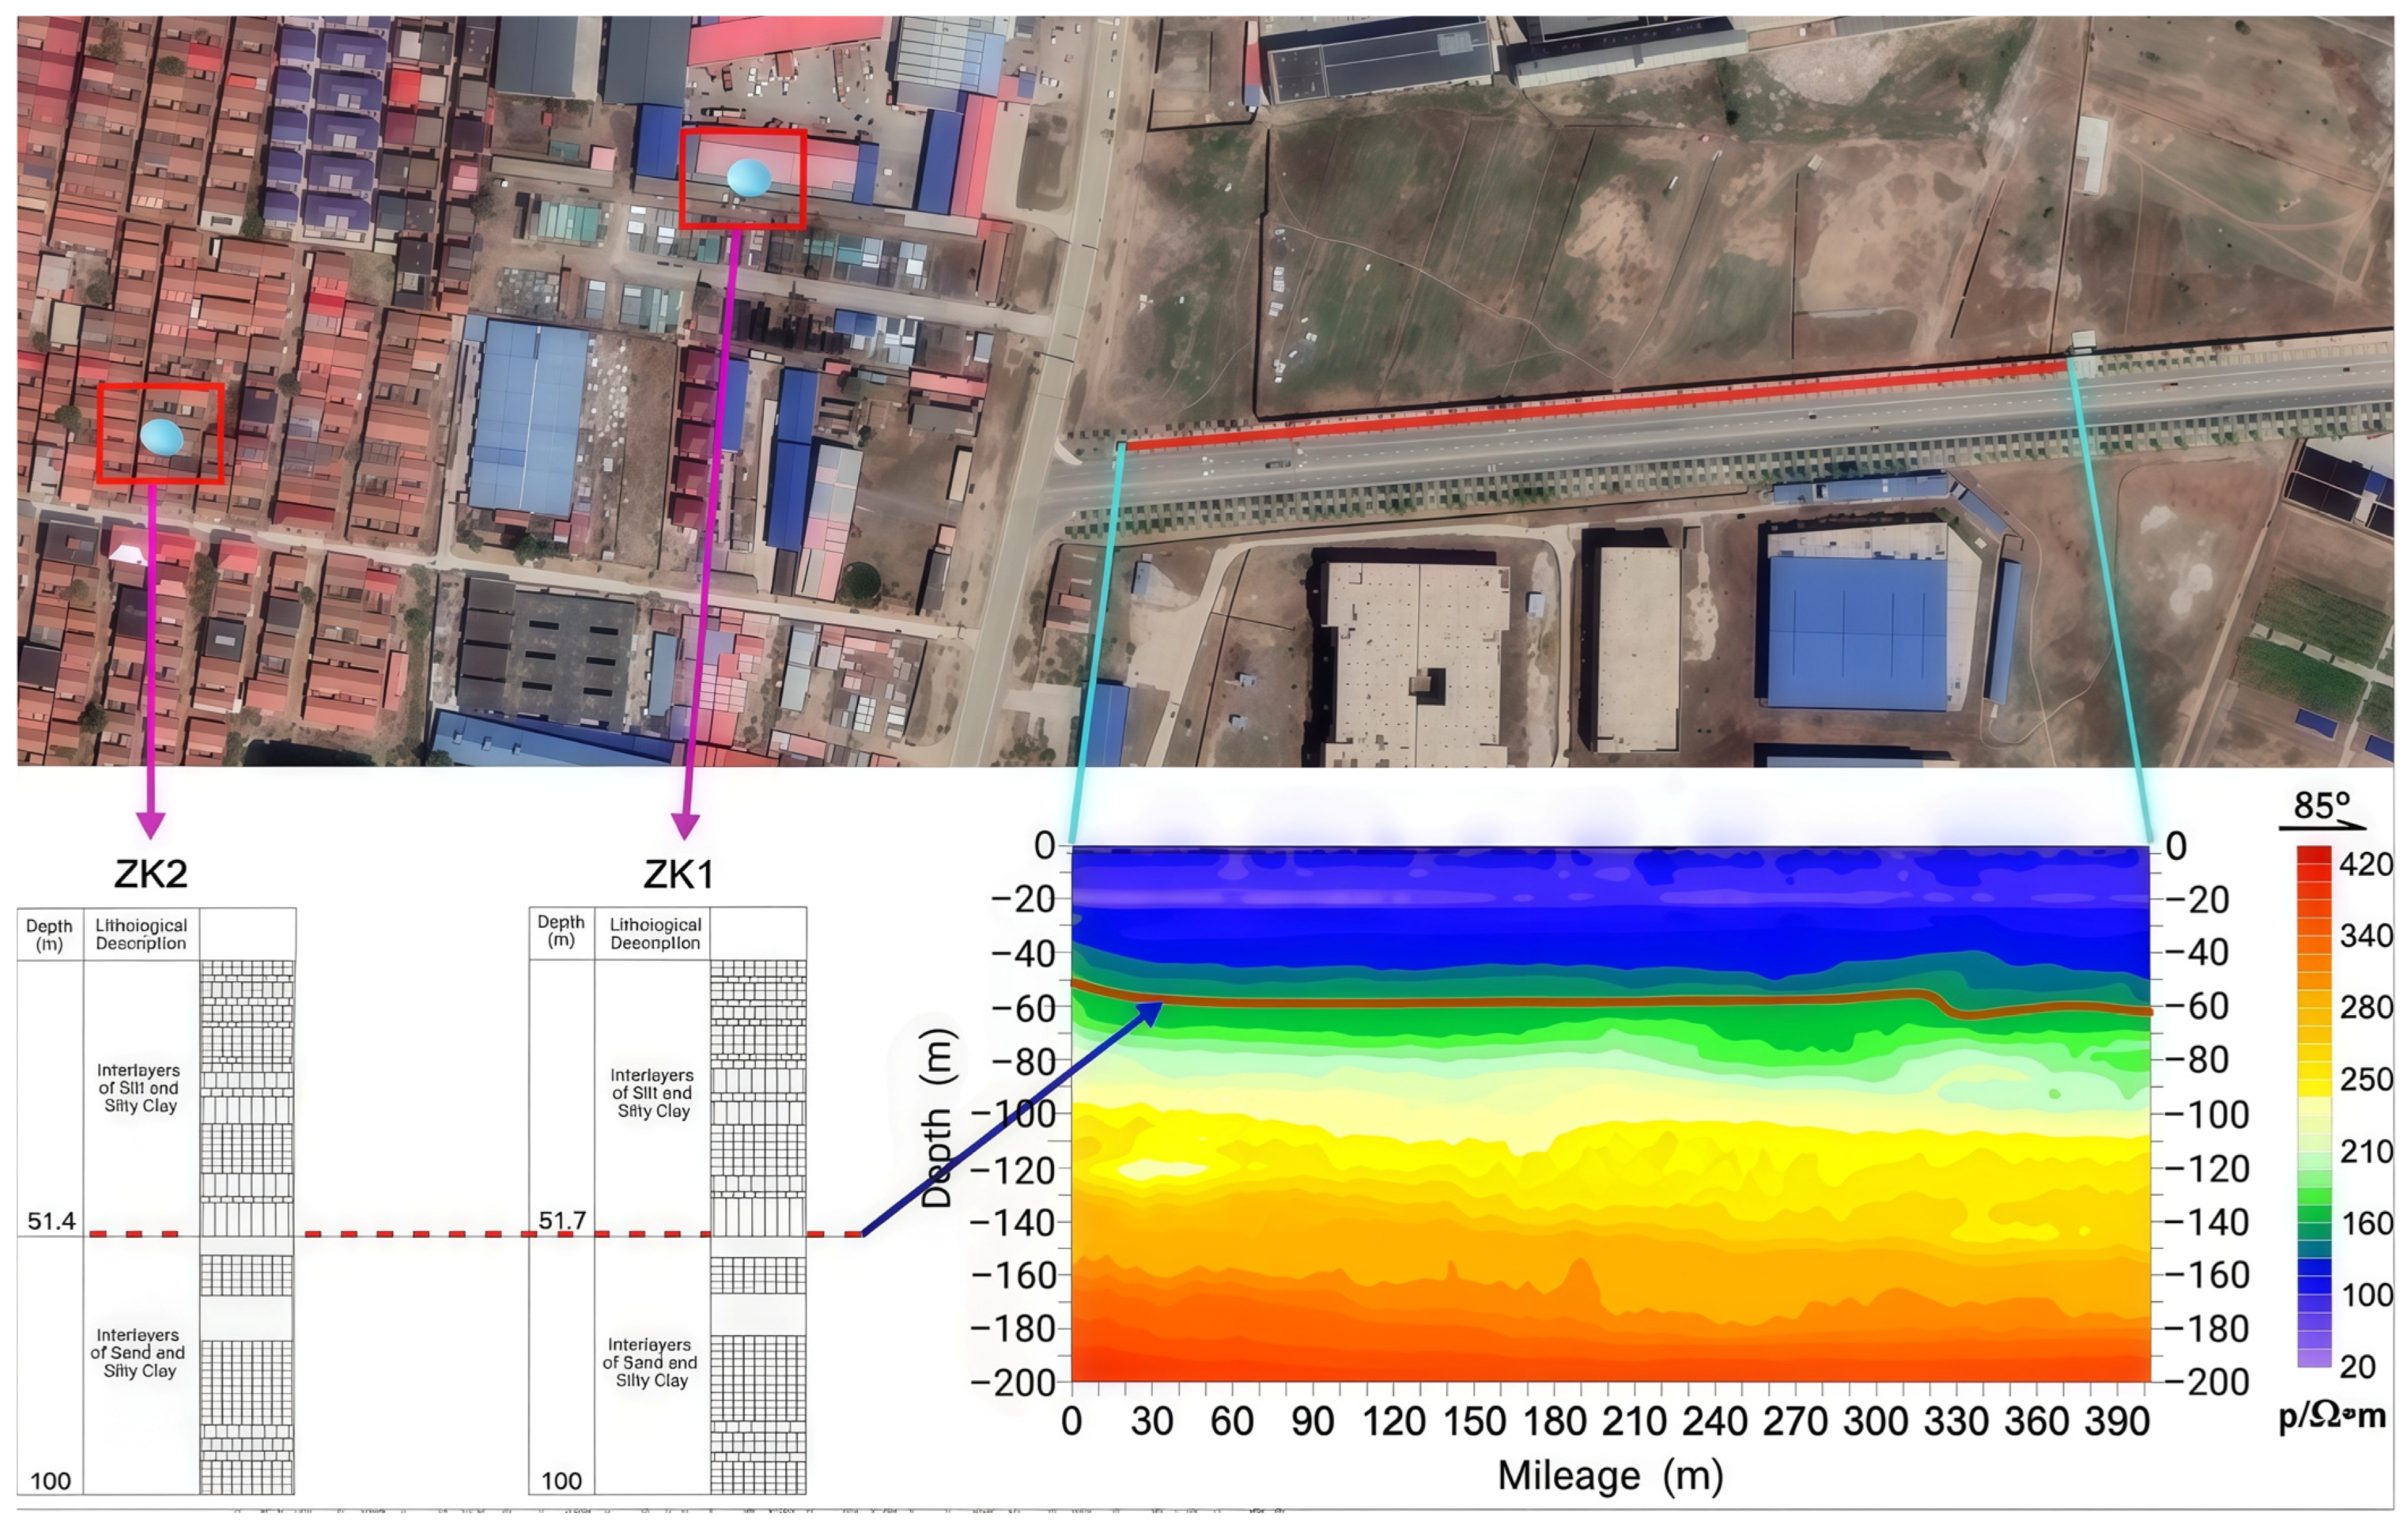
As shown in Figure 14, two boreholes (ZK1 and ZK2) located near the survey line were used as constraints to support lithologic interpretation of the resistivity layering. Within the investigated depth range (0–200 m), the inversion result is described as broadly consistent with a two-part stratigraphic pattern: an upper ~50 m low-resistivity interval dominated by silt–silty clay interbeds, and a deeper interval with relatively higher resistivity and stable layering. This agreement between OCTEM inversion and borehole data validates the reliability of electromagnetic interpretation in this urban setting.
Figure 14.
Borehole-to-section tie.
According to the geological data of this area, the thickness of the Quaternary evacuation overburden in this area can reach several hundred meters, so its resistivity value is relatively small overall, which is consistent with the measured results. In addition, combined with the results of ZK1 and ZK2 drillings on the west and northwest sides of the survey line, the strata within a buried depth of 200 m can be roughly divided into two layers: The upper layer is about 50 m thick, and the lithology is interbedded with silt and silty clay, showing low-resistance characteristics. The lower layer is interbedded with silt and silty clay and is a relatively high-resistance body; the stratigraphic structure reflected is relatively stable, and there are no geophysical anomalies related to “latent active faults”.
The results show that there are two localized anomalies at mileage 45–60 and 100–110. At the measuring mileage 135–180 (buried depth 80–120 m), the resistivity appears in a local low-resistance depression (80–120 Ω·m) transversely, with a width of about 20 m and a vertical extension of 150 m. Combined with the ZK2 borehole data, the lithology of this area is silt and clay, and the low resistance may be caused by an increase in clay content or local water content. The absence of fault fracture zone characteristics in this anomaly is consistent with the geological and paleoseismic stability expected for this region. At the measurement mileage 300–330 (buried depth 30–50 m), the resistivity gradient increases abruptly, and the vertical shift of the interface is about 5 m, which may reflect the local disturbance of the Q3/Q4 interface. Compared with the regional tectonic activity data, the Cangdong Fault is more than 10 km away from the field area, and no activity has been recorded since the Quaternary, suggesting that this is a sedimentary difference rather than fault activity.
Overall, the survey results indicate that the Q3/Q4 interfaces and lower interfaces in the resistivity section are generally continuous and smooth along Line L1. The integration of quality control, the resistivity pattern, borehole calibration, and regional context supports the interpretation that the subsurface along this profile does not exhibit clear evidence of throughgoing fault displacement at the scale and depth resolved by the OCTEM.
4. Discussion
4.1. OCTEM as an Effective Urban Fault-Screening Method
The primary contribution of this study lies in demonstrating that the OCTEM can serve as an effective, practical alternative to conventional seismic and electrical methods for fault screening in urban environments. For community-scale seismic safety assessment, the primary engineering need is a rapid and low-disruption method to screen whether a shallow subsurface structure is laterally continuous or shows fault-like discontinuities beneath dense urban infrastructure [30,31]. The OCTEM survey at Tiancheng Chengyuan was completed with minimal surface disruption (single 385 m line, ~5 m spacing) and provided a resistivity image to 200 m depth with demonstrable repeatability control (inspection workload of 5.19%; overall mean square relative error of 4.01%), all within a typical project timeline and budget. These practical advantages—rapid deployment, minimal infrastructure footprint, urban-compatible data acquisition, and clear interpretation of shallow structures—make the OCTEM well-suited for preliminary fault screening in urban settings where traditional seismic surveys are impractical.
From an applied perspective, the OCTEM’s documented success in this case study demonstrates its viability as part of a tiered geophysical approach: rapid OCTEM screening in the first instance, followed by higher-resolution or complementary methods (e.g., seismic reflection, gravity) only if fault-like signatures warrant further investigation.
4.2. Interpretation in Context of Urban Overburden and Electromagnetic Noise
The 20–420 Ω·m inverted resistivity section is predominantly layered and increases with depth, consistent with the expected Quaternary sedimentary stratigraphy at the site. This resistivity pattern directly reflects the known lithologic succession:
- (i)
- Shallow low resistivity (20–80 Ω·m, 0–50 m) corresponds to Holocene (Q4) silt and silty clay with a high moisture content and porosity.
- (ii)
- Intermediate resistivity (80–200 Ω·m, 50–150 m) matches Upper Pleistocene (Q3) silty clay with reduced porosity.
- (iii)
- Higher resistivity (200–420 Ω·m, 150–200 m) aligns with Middle Pleistocene (Q2) dense silt or locally cemented layers.
The lateral continuity and smooth vertical transitions of these resistivity interfaces are consistent with a stable sedimentary environment without significant throughgoing fault displacement. Local anomalies—such as the low-resistivity depression at mileage 135–180 (depth 80–120 m) and the interface gradient shift at mileage 300–330 (depth 30–50 m)—can be plausibly explained by lithologic heterogeneity (local clay-rich lenses, paleochannel fill), water-content variability (perched groundwater, localized saturation), and sedimentary disturbance (soft-sediment deformation, differential compaction).
Critically, these features do not exhibit the characteristics expected of fault zones:
- They are localized rather than forming throughgoing linear discontinuities across multiple depth intervals.
- They lack a systematic vertical offset of stratigraphic interfaces.
- They do not align with known regional fault trends (Cangdong Fault is >10 km away and strikes NE, whereas anomalies are isolated features).
- Borehole calibration (ZK1, ZK2) confirms stable layering without fault-zone lithologies.
Therefore, the OCTEM results are most consistent with a stratigraphically continuous, tectonically stable subsurface along Line L1 within the 0–200 m investigation interval, supporting the regional geological assessment that the Cangxian Uplift has not experienced significant Quaternary fault activity in this area.
4.3. Method Capabilities, Limitations, and Recommendations for Comprehensive Assessment
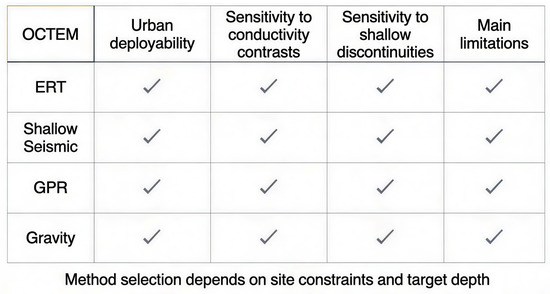
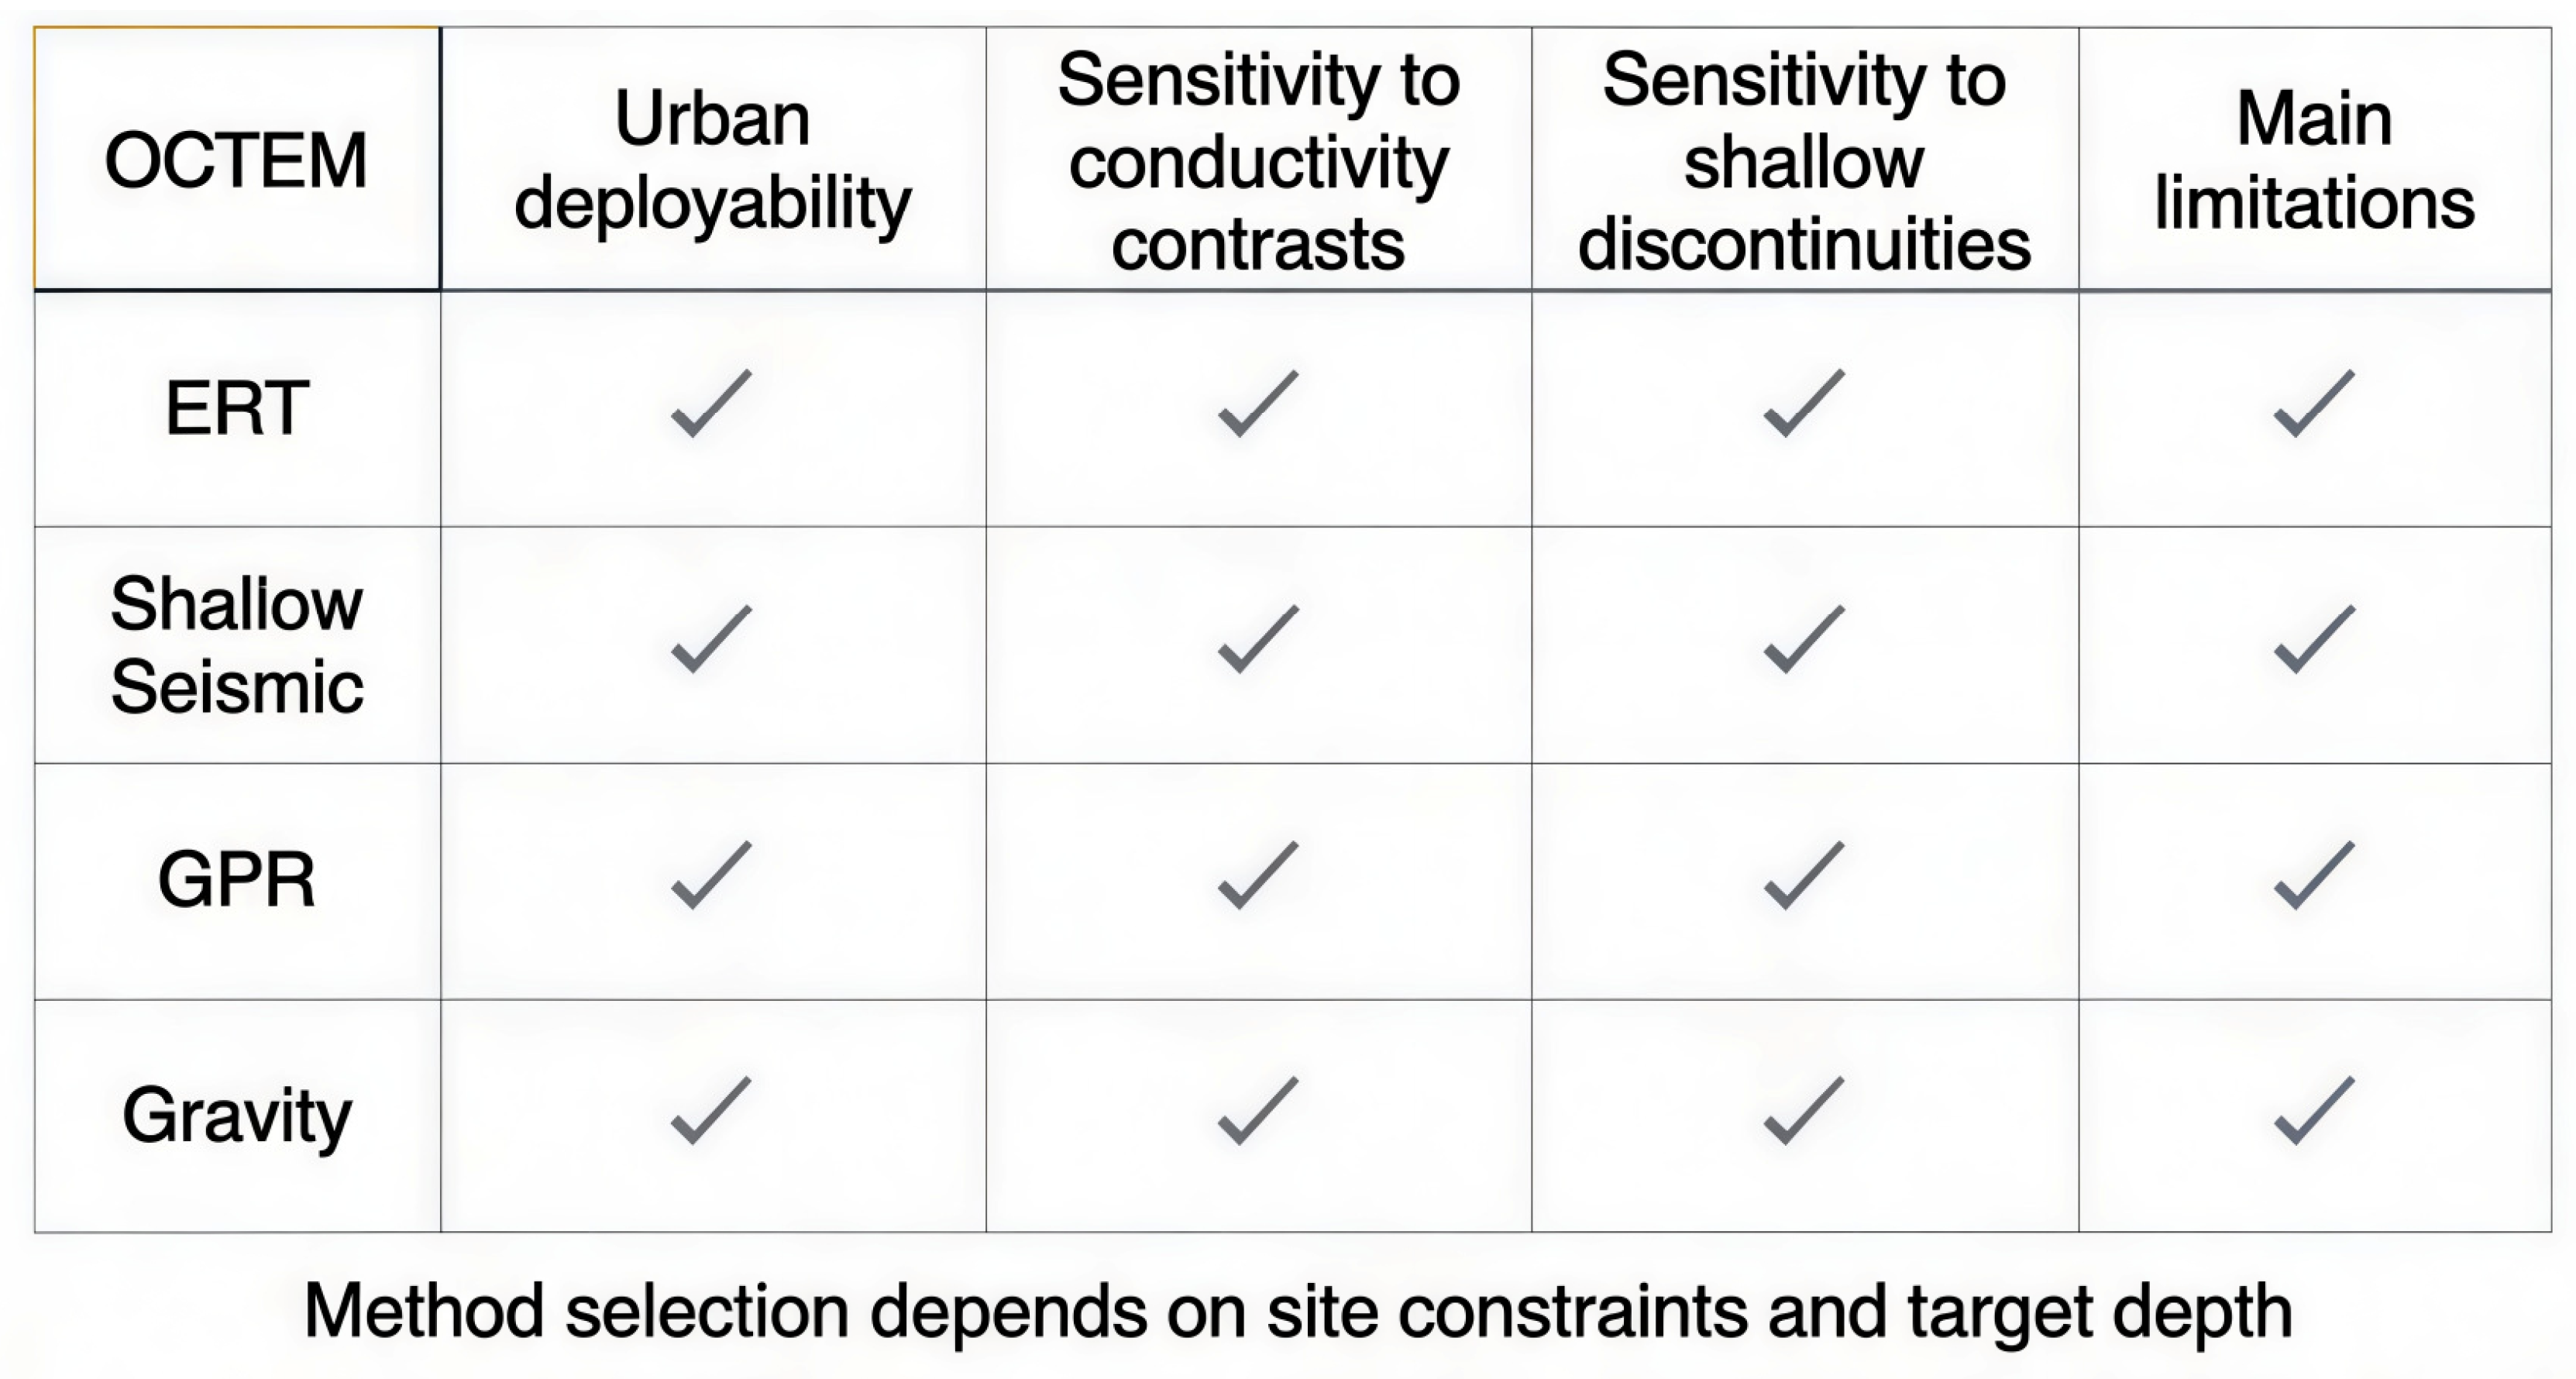
Figure 15 summarizes the effectiveness of several geophysical methods for identifying faults under urban geological conditions. The OCTEM demonstrates competitive advantages in cost, deployment speed, and minimal surface disruption compared to conventional seismic reflection, high-density electrical surveys, or magnetotellurics. Urban OCTEM measurements can be distorted by nearby metal objects and infrastructure, and published OCTEM work indicates that metal interference can significantly affect measurements, requiring cautious interpretation and good survey design [32,33]. In this study, the reported repeatability statistics indicate stable acquisition quality and suggest that urban electromagnetic noise was effectively managed through instrument design and survey protocol.
Figure 15.
Comparison of urban-capable geophysical methods for fault screening.
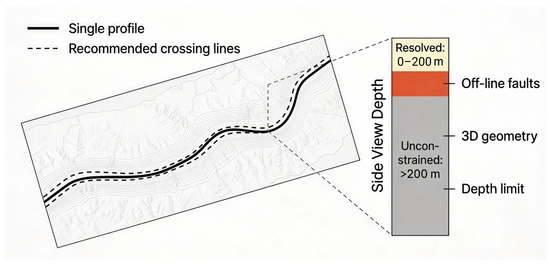
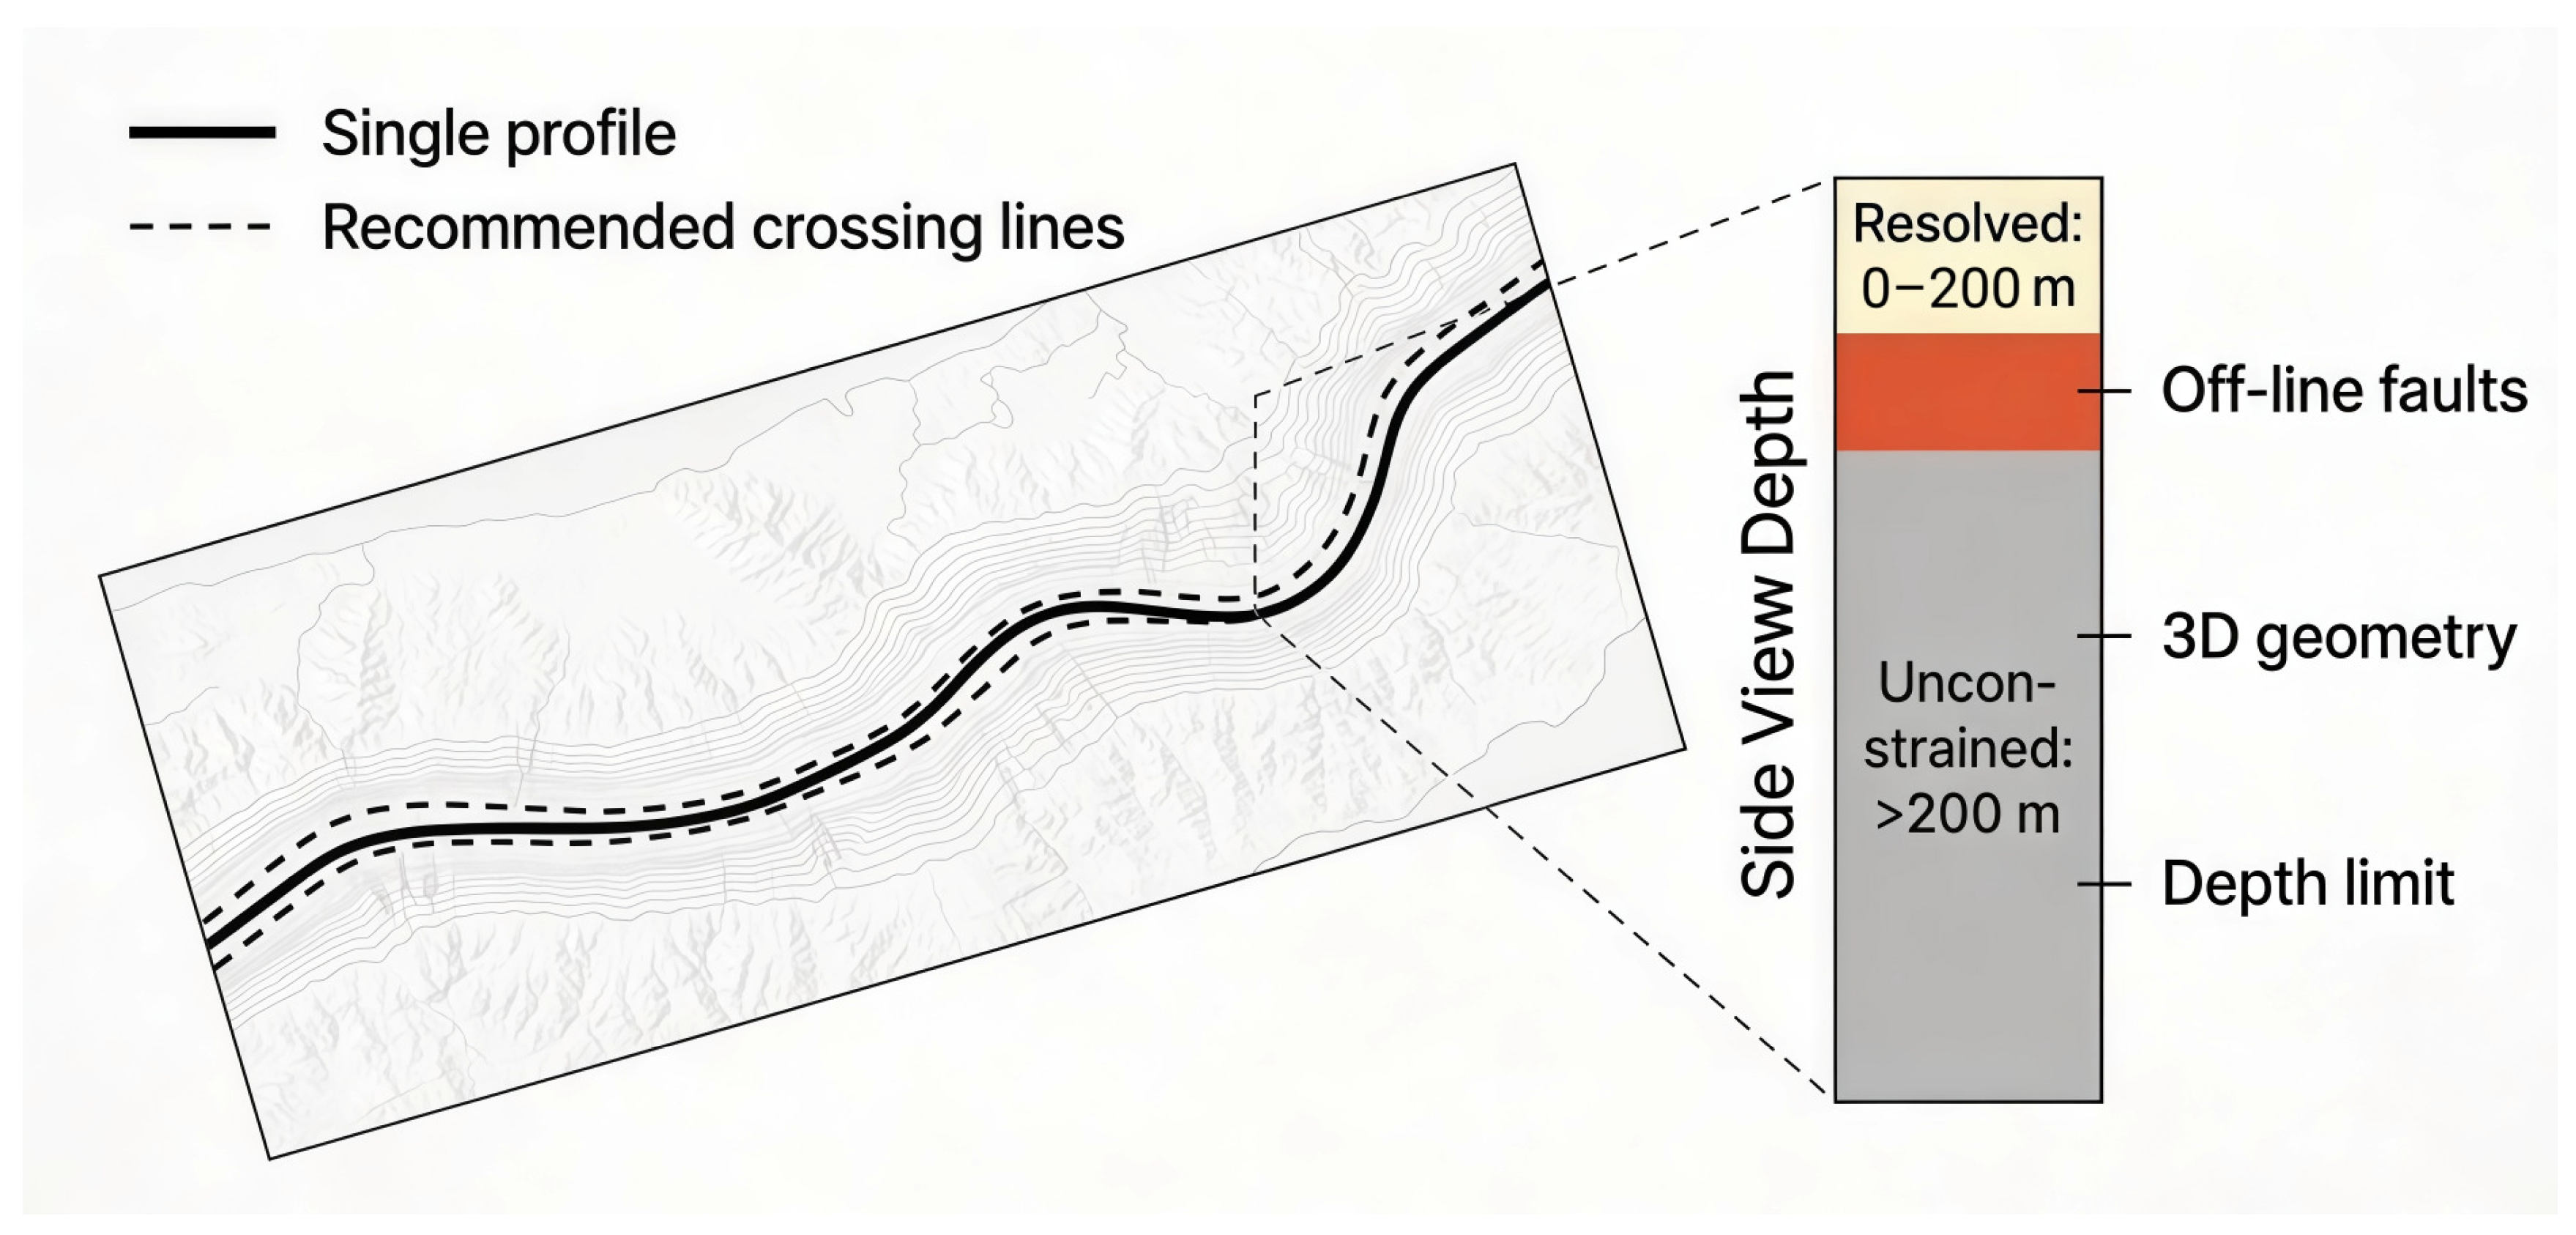
While this single-profile case study provides compelling evidence for the OCTEM’s practical utility as an urban screening tool, the method’s inherent limitations (non-uniqueness of resistivity interpretation, 2D limitation of a single line, presence of offline or subparallel faults) should be acknowledged. As illustrated in Figure 16 (attached image), the interpretation is explicitly bounded by the single-profile geometry and the effective depth of investigation (~0–200 m), so off-line/subparallel faults or deeper structures cannot be excluded without crossing lines or independent constraints. Therefore, the defensible engineering interpretation is that within the investigated corridor and effective depth of investigation (~0–200 m), the OCTEM acquired stable, high-fidelity data and identified a stratigraphically continuous subsurface pattern consistent with a tectonically stable block. However, as with all single-method, single-line surveys, off-line faults, faults subparallel to the profile, or deeper structures remain possible without additional intersecting profiles or complementary geophysical constraints.
Figure 16.
Interpretation scope and limitations.
To advance from screening-level findings to engineering-grade fault characterization, additional intersecting OCTEM profiles, independent constraints (e.g., gravity, seismic reflection, paleoseismic investigation), or higher-resolution surveys would be warranted if risk-critical applications justify the additional cost and effort.
5. Conclusions
This study applied the OCTEM along a single urban transect (Line L1; ~385 m length; 3–5 m station spacing) at the Tiancheng Chengyuan site in Cangzhou City under a challenging electromagnetic noise background. The OCTEM survey successfully demonstrated its practical effectiveness as a fault-screening tool in urban environments:
- Data Quality and Stability: The dataset shows excellent acquisition repeatability (mean square relative error of 4.01%), validating that the OCTEM can maintain high-fidelity measurements under complex urban electromagnetic conditions. The strict quality control protocols and borehole-calibrated inversion provide confidence in interpretation.
- Subsurface Characterization: The subsurface electrical structure is predominantly layered with resistivity increasing with depth, consistent with Quaternary sedimentary stratification. The OCTEM clearly resolved stratigraphic interfaces and localized heterogeneities, demonstrating its capability to detect subsurface features despite urban noise. Reported local anomalies are interpreted as lithology or moisture variability or local sedimentary disturbance.
- Method Viability for Urban Fault Screening: The OCTEM emerges as a robust, cost-effective alternative to conventional seismic and electrical methods for preliminary fault screening in densely developed urban settings. The method’s rapid deployment, minimal surface footprint, and clear subsurface imaging make it particularly valuable where traditional high-resolution seismic methods are impractical or uneconomical. In particular, the OCTEM is well-suited for tiered geophysical approaches, in which rapid OCTEM screening identifies potential problem areas that warrant further investigation by higher-resolution or complementary methods.
- Limitations and Future Work: This single-profile study demonstrates a proof of concept in a tectonically stable zone. Full fault characterization or active-fault assessment in more structurally complex areas would require intersecting OCTEM profiles, integration with independent geophysical datasets, and site-specific paleoseismic or paleoenvironmental studies. Nevertheless, the case study provides compelling evidence that the OCTEM should be considered as a primary tool in the geophysical toolkit for urban seismic hazard assessment and subsurface exploration in cities.
In synthesis, this work establishes the OCTEM as an effective and practical alternative to conventional fault-detection methods in urban environments, particularly where traditional approaches face logistical or economic constraints. Further application of the OCTEM across diverse urban geological settings and structural contexts will refine interpretive criteria and expand the scientific and practical utility of this method for urban geoscience.
Author Contributions
Conceptualization, S.Z.; methodology, S.Z.; software, S.C.; validation, S.C., X.Z., F.C. and H.W.; formal analysis, S.C., X.Z., F.C. and H.W.; investigation, S.C.; resources, S.Z.; data curation, S.C. and X.Z.; writing—original draft preparation, S.C.; writing—review and editing, S.Z., X.Z., F.C. and H.W.; visualization, S.C. and X.Z.; supervision, S.Z.; project administration, S.Z.; funding acquisition, S.Z. All authors have read and agreed to the published version of the manuscript.
Funding
This research was funded by Department of Science and Technology of Henan Province, grant number 252102210222. The APC was funded by Sixin Zhu, the first author.
Data Availability Statement
The data that support the findings of this study are available from the corresponding author upon reasonable request. The data are not publicly available due to privacy and security restrictions associated with sensitive urban survey information (e.g., site/location details).
Conflicts of Interest
The authors declare no conflict of interest.
References
- Fan, J.; Hou, E.; Jin, D.; Xi, Z.; Long, X.; Zhou, S.; Nan, S.; Liu, Y.; Guo, K.; Ning, D. Application of opposing coils transient electromagnetic method in urban area with metal interference. J. Appl. Geophys. 2024, 228, 105467. [Google Scholar] [CrossRef] [Scilit]
- Wang, Z.H.; Cai, X.; Yan, J.; Wang, J.; Liu, Y.; Zhang, L. Using the integrated geophysical methods detecting active faults: A case study in Beijing, China. J. Appl. Geophys. 2018, 156, 82–91. [Google Scholar] [CrossRef] [Scilit]
- Vargas, C.A.; Gomez, J.S.; Gomez, J.J.; Solano, J.M.; Caneva, A. Space–Time Variations of the Apparent Resistivity Associated with Seismic Activity by Using 1D-Magnetotelluric (MT) Data in the Central Part of Colombia (South America). Appl. Sci. 2023, 13, 1737. [Google Scholar] [CrossRef] [Scilit]
- Bartoń, R.; Urbaniec, A.; Łaba-Biel, A. Application of Vertical Seismic Profiling to Improve Seismic Interpretation of the Rotliegend Formation in Western Poland. Appl. Sci. 2025, 15, 11339. [Google Scholar] [CrossRef] [Scilit]
- Chen, J.; Tan, J.; Guo, N. Application of shallow seismic exploration in urban fault detection. Energy Technol. Manag. 2021, 46, 154–157. [Google Scholar] [CrossRef]
- Xi, Z.Z.; Xia, L.; Sheng, Z.; Long, H.; Gang, S.; Hou, H.T.; Liang, W. Shallow transient electromagnetic method based on the principle of equivalent inverse flux. Chin. J. Geophys. 2016, 59, 3428–3435. [Google Scholar] [CrossRef]
- Cao, Z.M. Opposing Coils Transient Electromagnetic Method; Chinese Geophysical Society: Beijing, China; Geological Society of China: Beijing, China, 2015. [Google Scholar]
- Xi, Z.-Z.; Long, X.; Zhou, S.; Huang, L.; Song, G.; Hou, H.T.; Wang, L. Opposing coils transient electromagnetic method for shallow subsurface detection. Chin. J. Geophys. 2016, 59, 551–559. [Google Scholar] [CrossRef] [Scilit]
- Lei, Z.; Cao, C.H.; Zhuan, D.; Tan, J.L.; Xia, L. Geophysical prospecting and water search experiments under limited site conditions in towns. Urban Geol. 2019, 14, 97–102. [Google Scholar] [CrossRef]
- Yang, G.; Xie, C.; Wu, T.; Wu, X.; Zhang, Y.; Wang, W.; Liu, G. Detection of permafrost in shallow bedrock areas with the opposing coils transient electromagnetic method. Front. Environ. Sci. 2022, 10, 909848. [Google Scholar] [CrossRef] [Scilit]
- Liu, H.D. Research on Urban Karst Exploration Based on Opposing Coils Transient Electromagnetic Method. Miner. Geol. 2021, 35, 511–516. [Google Scholar] [CrossRef]
- Zhao, X.L.; Ran, J.; Lei, K.; Liu, L.; Pei, S.; Zhang, J.; Zhang, J. Research and Application of Opposing Coils Transient Electromagnetic Method in Tunnel Advance Geological Prediction. Geophys. Geochem. Explor. Comput. Tech. 2023, 45, 523–530. [Google Scholar] [CrossRef]
- Han, L.M. Development Characteristics and Risk Assessment of Geological Hazards in the Section from Wolong to Zhibai River in the Brahmaputra River. Master’s Thesis, Chengdu University of Technology, Chengdu, China, 2018. [Google Scholar]
- Wang, L.; Dai, Y.F.; Bing, L.; Xia, L.; Jin, L.; Chen, X.P. Rapid detection of seawater intrusion based on opposing coils transient electromagnetic method. Prog. Geophys. 2023, 38, 1397–1407. [Google Scholar] [CrossRef]
- Sheng, H.; Wang, W.; Dong, G.-F.; Nan, X.-J.; Wei, F.-F.; Bai, Y.-Y. Application of opposing coils transient electromagnetic method in urban geological survey. Geophys. Geochem. Explor. 2023, 47, 1379–1386. [Google Scholar]
- Wu, X.; Xu, X.; Yu, G.; Ren, J.; Yang, X.; Chen, G.; Xu, C.; Du, K.; Huang, X.; Yang, H.; et al. The China Active Faults Database (CAFD) and its web system. Earth Syst. Sci. Data 2024, 16, 3391–3417. [Google Scholar] [CrossRef] [Scilit]
- Li, Z.Q.; Xi, Z.Z.; Lei, L.; Hu, M.J.; Ying, Z.; Hou, H.T.; Xia, L. Principle and Application of Well Medium Inverse Flux Transient Electromagnetic Method. Prog. Geophys. 2024, 39, 1512–1519. [Google Scholar] [CrossRef]
- Peng, L.; Hui, L.; Xie, Y.F.; Wei, S.; Yu, D. Application of Opposing Coils Transient Electromagnetic Method Transient Electromagnetic Method in Investigation of Hidden Disaster-induced Water Hazards in Mine Goafs. World Nonferrous Met. 2024, 6, 169–171. [Google Scholar]
- Yang, X.D.; Xi, Z.Z.; Xia, L.; Huang, J.W. Application of OCTEM method for detecting geological diseases in underground space. J. Railw. Sci. Eng. 2024, 21, 3434–3444. [Google Scholar] [CrossRef]
- Wang, B.Z.; Li, C.X.; Bo, Q.; Lei, L.; Zhou, S.C.; Ma, X.F.; Wang, J.J.; Guo, G.Y. Application of Equivalent Inverse Flux Transient Electromagnetic Method in Fine Detection of Urban Karst. Resour. Environ. Eng. 2021, 35, 727–732. [Google Scholar] [CrossRef]
- Zhao, Y.S. Joint application of high-density electrical method and Opposing Coils Transient Electromagnetic Methodtransient electromagnetic method in fine detection of karst collapse in Fasi. Chin. J. Eng. Geophys. 2022, 19, 348–355. [Google Scholar]
- Du, F. Research on Geophysical Prospecting Methods for ‘Lonely Stone’ Fine Detection: A Case Study of Fuzhou Binhai Express. Gansu Geol. 2022, 31, 70–76. [Google Scholar]
- Liu, Y. Application and optimization of fine geophysical prospecting technology in urban geological exploration. Gansu Sci. Technol. 2024, 40, 38–41. [Google Scholar] [CrossRef]
- Li, G.Y.; Hao, Y.J. Mine TEM Multi-turn Small Wire Frame Design Based on “Smoke Ring” Diffusion Angle Observation System. Coal Technol. 2024, 38, 90–93. [Google Scholar] [CrossRef]
- Zhou, J.; Cheng, J.; Wen, L.F. Research Progress and Prospect of Mine Transient Electromagnetic Inversion Method. Coal Mine Saf. 2017, 48, 180–183+187. [Google Scholar] [CrossRef]
- Yang, H.Y.; Li, F.P.; Yue, J.H.; Liu, X.H.; Zhao, H.J. Electromagnetic Optimization Inversion of Conical Field Source Transients Based on the Theory of “Smoke Rings”. J. China Univ. Min. Technol. 2016, 45, 1230–1237. [Google Scholar] [CrossRef]
- Guo, C.H. Analysis of operational problems and disposal methods of upper-air meteorological detection. Friends Farmers Get. Rich 2019, 10, 229. [Google Scholar]
- Tian, B.L.; Jie, J.; Hui, D.; Liu, G.Z.; Wei, Z. Application of Equivalent Inverse Flux Transient Electromagnetic Method in Geological Hazard Detection. Miner. Explor. 2024, 15, 237–242. [Google Scholar] [CrossRef]
- Zhu, X.W.; Ding, C.; Xue, K.X.; Cheng, J.; Han, K.M.; Luo, Q.; Yi, G.S. Application of Opposing Coils Transient Electromagnetic Method in Shallow Underground Water-rich Area: A Case Study of Xiacun Town, Xinyu City. Geophys. Geochem. Explor. 2024, 48, 1424–1436. [Google Scholar] [CrossRef]
- He, S.L. The Joint Application of Ground Opposing Coils Transient Electromagnetic Method and Tunnel Advance Geological Prediction in Karst Area: A Case Study of the Sogui Underground Excavation Section of the First Phase of Guiyang Rail Transit Line S1 Project. Eng. Technol. Res. 2025, 10, 8–11. [Google Scholar] [CrossRef]
- Zhang, X.Y.; Li, N.B.; Pei, S.J. Application of Opposing Coils Transient Electromagnetic Method in Subway Karst Survey. Railw. Surv. 2022, 48, 52–56. [Google Scholar] [CrossRef]
- Chen, S.J.; Luo, D.G.; Gan, J.S.; Huang, J. Application of shallow seismic exploration in near-field seismic safety assessment of engineering sites. Geophys. Geochem. Explor. 2004, 5, 463–466. [Google Scholar]
- Li, Q.L.; Lei, X.D.; Chen, L.; Yong, L.; Hui, Z.; Han, Y.D.; Zhao, X.C. Application of Opposing Coils Transient Electromagnetic Method in Ground Fissure Investigation. Chin. J. Eng. Geophys. 2023, 20, 716–724. [Google Scholar] [CrossRef]
Disclaimer/Publisher’s Note: The statements, opinions and data contained in all publications are solely those of the individual author(s) and contributor(s) and not of MDPI and/or the editor(s). MDPI and/or the editor(s) disclaim responsibility for any injury to people or property resulting from any ideas, methods, instructions or products referred to in the content. |
© 2026 by the authors. Licensee MDPI, Basel, Switzerland. This article is an open access article distributed under the terms and conditions of the Creative Commons Attribution (CC BY) license.