


Abstract
This paper presents a geometric difficulty analysis framework for Formula 1 racing lines based on telemetry data from the 2024 season. To ensure geometric consistency across multiple laps, a representative racing line is identified using the discrete Fréchet distance, and corner segments are modeled using biarc approximation to estimate stable curvature. Based on the resulting geometric representation, we introduce three curvature-based difficulty metrics—the Curvature Exposure Index (CEI), Maximum Curvature Severity (MCS), and Curvature Variation Index (CVI)—to quantify both local and global track characteristics. This approach establishes a strictly geometric definition of difficulty based on the planar projection of the trajectory, purposely decoupling structural complexity from 3D terrain features, vehicle dynamics, and race context. Experimental results across 24 tracks demonstrate that these metrics effectively capture distinct track characteristics: CEI ranged from 1.97 rad/km (Italian) to 8.44 rad/km (Monaco), MCS from 230.54 km−1 (Spanish) to 1689.54 km−1 (Monaco), and CVI from 7.60 (British) to 9.33 (Monaco and Qatar). Although this framework focuses on planar geometry, it provides a compact, extensible foundation for geometric analysis and future applications incorporating elevation profiles and dynamic variables.
1. Introduction
Modern motorsports, particularly Formula 1 (F1), generate multiple telemetry streams throughout practice, qualifying, and race sessions, including lap timing data, positional updates, car-state measurements, and high-resolution vehicle coordinates. These heterogeneous datasets form a rich foundation for engineering analysis and performance evaluation. Despite the abundance of high-resolution telemetry data, the geometric structure of the racing line itself is often left implicit. Most analyses operate directly on sampled positions or derived discrete kinematic quantities [1,2], without explicitly modeling the underlying trajectory as a continuous geometric entity. As a result, it remains challenging to reason about track structure, curvature distribution, or geometric complexity directly from telemetry data.
Reconstructing a continuous racing line from telemetry data presents several challenges. Raw positional measurements are discrete, and noise often occurs (see https://docs.fastf1.dev/data_reference/howto_accurate_calculations.html (accessed on 1 November 2025)). In addition to these measurement artifacts, driving trajectories vary naturally across laps due to changing tire conditions, fuel load, and driver corrections. Averaging point samples across multiple laps can therefore distort the underlying geometric structure of the true racing line, leading to oversmoothing or bias. From a Computer-Aided Geometric Design (CAGD) perspective, it is therefore essential to identify a robust reference trajectory and to approximate it using geometric primitives that preserve meaningful shape characteristics.
To establish a reliable reference among multiple recorded laps, an appropriate measure of geometric similarity is required. Each lap is represented as a discrete polyline with non-uniform sampling, rendering point-wise averaging ineffective. In this work, we employ the discrete Fréchet distance [3], which explicitly accounts for the sequential nature of curves and provides a robust metric for shape-based comparison. Using this distance, we identify a representative lap that best reflects the common geometric structure shared across multiple driving instances, while mitigating the influence of outliers and anomalous trajectories. This representative lap serves as a stable geometric backbone for subsequent modeling.
Once the representative racing line is identified, we propose a geometric modeling framework that converts the discrete trajectory into a structured parametric representation. The path is first segmented into straight and curved sections based on curvature characteristics. Curved segments are then approximated using biarcs [4], which are widely adopted in CAGD due to their ability to ensure tangent continuity () while maintaining a simple and interpretable geometric form. Unlike generic curve fitting approaches, the biarc representation yields piecewise-constant curvature, enabling direct access to curvature-related geometric quantities. This explicit curvature profile is crucial for quantifying the track’s geometric complexity, which serves as a proxy for driving difficulty.
In this work, the term “difficulty” of a track is used in a geometric sense. Rather than addressing overall race difficulty, which depends on contextual factors such as weather or vehicle dynamics, we focus exclusively on the intrinsic geometric complexity of the racing line itself. Difficulty is therefore defined as the structural demand imposed by curvature magnitude and curvature variation along the representative trajectory. This geometry-based definition provides a track-intrinsic baseline for objective comparison across tracks and complements more comprehensive performance or race-level analyses.
By approximating the racing line with biarcs [4], the proposed framework transforms raw telemetry data into a compact and geometrically meaningful representation. From this representation, we derive a curvature-based index that quantitatively characterizes track difficulty from a purely geometric perspective, capturing both the variation and distribution of curvature along the racing line. This geometry-driven approach avoids reliance on subjective driver feedback or aggregate lap times, and instead provides an objective and reproducible measure of track complexity. The main contributions of this study are summarized as follows:
- We present a data-driven framework for reconstructing a representative racing line from noisy and irregularly sampled telemetry data.
- We introduce a robust method for selecting a representative lap using the discrete Fréchet distance [3], ensuring geometric consistency across multiple driving instances.
- We approximate the racing line using straight segments and biarcs [4], yielding a structured parametric representation with explicitly defined curvature.
- We show that our representation exposes curvature-driven structural features of the track, enabling quantitative characterization of track difficulty beyond raw polyline data.
2. Related Work
Research on reconstructing track geometry from Formula 1 telemetry data and transforming it into curve-based representations constitutes an emerging application area in which several core technical domains converge. The methodological foundation of this work draws from prior studies on trajectory compression and polyline simplification, curve fitting and approximation, trajectory segmentation, and GPS-based path reconstruction. However, an integrated approach that simultaneously addresses the unique characteristics of motorsports telemetry, including closed-loop constraints, high-speed driving conditions, and low-frequency sampling, has received limited attention in existing studies.
In the area of polyline simplification, the algorithm introduced by Douglas and Peucker [5], commonly referred to as the Ramer–Douglas–Peucker (RDP) algorithm, has long served as a standard baseline. RDP recursively subdivides a polyline to minimize the number of points while preserving the overall shape within a prescribed tolerance. Visvalingam and Whyatt [6] introduced an alternative approach based on effective area removal, enabling progressive simplification that supports both minimal simplification and caricatural generalization. More recent studies have sought to overcome the limitations of rule-based methods. Jiang et al. [7] proposed a deep learning-based polyline simplification method using stacked autoencoders, reporting significantly improved shape preservation over traditional RDP and Wang–Müller algorithms by generating multi-level abstractions from features extracted across hidden layers. For GPS trajectory compression, Muckell et al. [8] introduced the SQUISH-E algorithm, which employs a priority queue-based strategy with spatiotemporal information to enable online, real-time compression. While effective in applications where both position and velocity are critical, such as vehicle telemetry, these compression-oriented methods typically target open trajectories and do not explicitly address the closed-loop continuity and tangent consistency constraints required for Formula 1 tracks.
In piecewise curve fitting, Schneider [9] presented a widely used automatic cubic Bézier curve fitting algorithm that guarantees continuity through recursive subdivision and least-squares optimization of control points. In parallel, significant progress has been made in optimizing motorsport trajectories. Choi and Elkaim [10] proposed two Bézier curve-based path planning algorithms that generate smooth, corridor-constrained trajectories by formulating the placement of control points as a constrained optimization problem. Fiebich [11] used Bézier curves to reconstruct and smooth racing trajectories for autonomous vehicles in simulation environments. Jain and Morari [12], for example, proposed a Bayesian optimization framework for computing optimal racing lines. However, such approaches primarily focus on generating optimal trajectories rather than reconstructing and structurally modeling existing driving trajectories from telemetry data.
Trajectory segmentation has been extensively studied in traffic data analysis and behavior recognition. Rosin [13] introduced a recursive segmentation method that fits line and circular arc models by identifying points of maximum deviation and selecting either a line or a circular arc model with lower error. Buchin et al. [14] proposed a dynamic programming-based segmentation framework that optimizes trajectory partitioning with respect to velocity, direction, and acceleration changes, formulating segmentation as a minimum-segment optimization problem. Etemad et al. [15] proposed the Octal Window Segmentation (OWS) algorithm, which segments raw trajectories into meaningful consecutive sub-sequences by processing an error signal derived from positional deviations.
For extracting road centerlines from multiple GPS trajectories, Biagioni and Eriksson [16] proposed a hybrid map inference pipeline that combines grid-based density estimation with gray-scale skeletonization, enabling robust centerline extraction under significant GPS noise and highly uneven trajectory coverage. Ahmed and Wenk [17] formalized the problem of reconstructing road networks from collections of noisy continuous trajectories and provided theoretical guarantees using partial Fréchet distance-based curve matching and minimum-link approximations, ensuring geometric proximity between reconstructed structures and the original trajectories. This line of work differs from simple trajectory aggregation by explicitly preserving the continuous geometric structure of the input curves and therefore shares a common problem formulation with the present study. Dal Poz et al. [18] further proposed a ribbon-based representation combined with skeletonization to extract stable track centerlines by integrating multiple trajectories.
In a complementary direction, Zhang et al. [19] introduced a two-step vehicle trajectory data reconstruction method that combines wavelet transforms with physically admissible acceleration ranges to detect and correct anomalies in speed and acceleration time series, thereby improving overall trajectory data quality. Bertolazzi et al. [20] addressed track geometry reconstruction from sampled point data using polynomial curve fitting with explicit Tikhonov regularization to enforce smoothness and suppress noise, demonstrating its effectiveness on real-world track border data. Instead, the present work addresses a different problem setting. Rather than emphasizing smooth reconstruction or trajectory optimization, our goal is to preserve essential geometric features of the racing line that are required for curvature-driven difficulty analysis. Excessive smoothing or global optimization may obscure local geometric details, such as curvature extrema and transition structures, that are critical to characterizing the geometric complexity of corner segments.
Loiacono et al. [21] proposed a method for generating high-quality racing tracks by applying evolutionary computation based on the entropy of curvature and speed profiles. Georgiou and Demiris [22] defined difficulty in a multidimensional manner by combining driving behavior and biometric data, while Kristensen and Burelli [23] designed the statistical properties of difficulty based on the distribution of player attempts. However, these studies primarily focused on track generation itself rather than difficulty assessment. Furthermore, game-based approaches are limited because they rely on player-driven data or biometric signals rather than objectively assessing difficulty based solely on the track’s geometric information.
These studies primarily focus on aggregating multiple trajectories to produce an average road or track representation, or on improving the quality of trajectory time series. The present work, by comparison, reconstructs a representative racing line while preserving the geometric structure of individual driving trajectories, with the explicit goal of enabling geometry-driven analysis of track characteristics.
3. Methodology
This section presents a geometric framework for quantifying track difficulty from racing-line trajectories. The proposed pipeline proceeds through a sequence that progressively refines raw F1 telemetry data into curvature-based difficulty metrics. In Section 3.1, raw vehicle trajectories are formalized into a consistent geometric representation that serves as the common input to all subsequent stages. Section 3.2 then restricts the analysis to geometrically valid lap-level trajectories by removing abnormal samples and enforcing basic consistency constraints. To eliminate redundancy while preserving characteristic geometry, Section 3.3 selects a single representative lap for each track using the discrete Fréchet distance [3] as a measure of inter-lap similarity. The selected trajectory is subsequently converted into a compact and curvature-aware form in Section 3.4, where straight and curved portions are explicitly modeled and globally regularized to ensure stability. Finally, Section 3.5 derives quantitative difficulty measures from the resulting curvature profile, enabling both local and global assessment of geometric difficulty along the racing line.
3.1. Input Trajectory Representation
The proposed method takes as input a discrete sequence of planar positional samples representing a vehicle trajectory. Each trajectory is given as an ordered set of points
recorded at monotonically increasing time stamps, where each point corresponds to an instantaneous vehicle position acquired from telemetry data. The input data are inherently point-wise and do not explicitly encode the continuous geometry of the driven path between successive samples. No assumption is made regarding uniform temporal sampling, and no additional kinematic information, such as velocity, acceleration, or steering angle, is used. All subsequent processing is based solely on positional measurements.
In practice, such positional samples often capture the overall geometric structure of the driven trajectory with sufficient fidelity, allowing directional changes and curvature trends to be inferred from the spatial arrangement of the points. Raw telemetry trajectories may nonetheless contain measurement noise, redundant samples, and irregular sampling densities. When multiple laps over the same track are recorded, the input trajectories do not generally form a single, well-defined closed loop. For this reason, a preprocessing stage is required to transform the raw point-wise trajectory data into a form suitable for geometric analysis and curve-based modeling.
3.2. Preprocessing and Lap-Level Segmentation
Prior to geometric modeling, a minimal reprocessing step is applied to ensure numerical stability while preserving the intrinsic structure of the telemetry data. To guarantee the reliability of geometric comparisons, a rule-based filtering step is first employed to exclude laps that fall outside the scope of competitive racing conditions. Specifically, laps affected by race control interventions are removed. These include laps driven under Safety Car (SC) or Virtual Safety Car (VSC) conditions, as well as laps subject to Yellow or Double Yellow flags or Red flag interruptions, during which drivers are required to reduce speed and cannot maintain a representative racing line. In addition, the first lap of each race is excluded because traffic congestion and cold tires result in driving behavior that deviates significantly from steady-state racing patterns.
Another group of excluded laps corresponds to incomplete trajectories caused by vehicle operation or status changes. Pit-in and pit-out laps are discarded because they follow alternative paths through the pit lane rather than the main racing track, preventing the formation of a closed-loop trajectory. Similarly, laps associated with mechanical failures or on-track incidents that result in a retirement are excluded, as they do not constitute a complete track traversal.
Even after rule-based filtering, residual outliers may remain due to factors such as intermittent GPS reception, sensor noise, or atypical driving behavior induced by lapping events, where backmarker vehicles temporarily slow to yield to faster cars. To further enhance statistical robustness, the distribution of lap-wise traveled distances is examined for each track, and laps whose total distance deviates by more than two standard deviations from the mean are treated as outliers and excluded from the final analysis set.
Raw lap trajectories may exhibit small-scale positional jitter caused by measurement errors, which can adversely affect subsequent geometric computations. Therefore a limited local stabilization is applied to each lap using a moving average filter [24]. For a given window size K, the stabilized point is computed as follows [24]:
The parameter K controls the degree of local stabilization; larger values produce smoother trajectories but may attenuate sharp geometric features such as corner transitions. To avoid oversmoothing, K is chosen conservatively to reduce local fluctuations without altering the overall shape of the driven path. We selected K empirically per track within a limited range (). This range was determined through exploratory experiments to ensure adequate noise reduction while preserving corner-level geometric features relevant to subsequent analysis. No resampling or global smoothing is performed, and the original sampling characteristics are retained.
For lap-level analysis, continuous telemetry streams from each session are segmented into individual laps using the start/finish line as a geometric reference. This converts long, uninterrupted trajectories into lap-wise point sequences, each corresponding to a single track traversal. Although laps recorded across different sessions and drivers are expressed in a common global coordinate frame, differences in the reference position may hinder direct geometric comparison. To address this, each lap is aligned by applying a planar translation that maps the start/finish location to a common reference point. Preprocessing is limited to local stabilization, lap segmentation, and coordinate alignment to avoid distorting the geometric characteristics of the racing line. The resulting lap representations remain close to the original telemetry data and serve as input for representative lap selection.
3.3. Representative Lap Selection
For each track and driver, multiple laps are typically recorded within a session. Since the subsequent geometric modeling aims to approximate a single, stable racing line, a representative lap must be selected from the available lap set. To quantify geometric similarity between laps, we employ the discrete Fréchet distance [3], which measures the maximum deviation between two point-wise trajectories while preserving their traversal order. Unlike point-set distances that ignore ordering, this distance captures global shape similarity along the driven path and is therefore well suited to trajectory-level comparison. Although lap trajectories are represented as discrete point sequences, all laps correspond to a traversal of the same physical track. In practice, sampling densities across laps are comparable, even though they are not strictly uniform. Under this assumption, the discrete Fréchet distance [3] is applied directly to the lap point sequences without explicit arc-length reparameterization or resampling.
Let denote the sequence of planar points representing the j-th lap. The representative lap is defined as the lap that minimizes the total discrete Fréchet distance to all other laps as follows [3]:
where denotes the discrete Fréchet distance. This selection criterion favors laps whose overall geometric shape is most consistent with the remainder of the dataset, while reducing sensitivity to localized deviations or isolated anomalies.
3.4. Biarc Approximation
Given the representative lap selected in the previous stage, this step focuses on geometrically modeling its corner segments. To obtain a representation that is both parsimonious and geometrically descriptive, we approximate each corner using a biarc model [4]. This choice enables a piecewise circular approximation that captures curvature variation more flexibly than a single circular arc, while remaining computationally simple and well-suited for stable local fitting. Rather than estimating curvature directly from discrete samples via numerical differentiation, which is highly sensitive to noise and sampling irregularities, the proposed approach derives curvature from an explicit geometric model of the trajectory.
Since each circular arc in a biarc has constant curvature by definition, curvature values are directly obtained from the fitted arc parameters, yielding a stable piecewise-constant curvature representation. The biarc fitting is performed within predefined geometric tolerances, ensuring that the approximation captures the underlying shape of the corner segment while suppressing high-frequency noise in the sampled trajectory. Such tolerance-based arc-fitting strategies are commonly adopted in biarc and arc-spline literature to balance geometric fidelity and robustness to noise [4].
In this context, a biarc consists of two circular arcs that meet at an internal junction point with continuity [4,25]. Let and denote two endpoints of a corner segment, with associated unit tangent and estimated from local point neighborhoods. A biarc is constructed to interpolate the endpoints while matching these boundary tangents, yielding a local continuous approximation of the corner geometry without enforcing continuity constraints with neighboring segments. Global smoothness and consistency across segment boundaries are addressed in the subsequent curve construction stage, where straight and biarc segments are assembled into a unified parametric representation of the racing line. All biarc constructions in this work were generated using a robust geometric implementation provided by the IRIT solid modeling kernel [26].
The proposed method does not enforce arc-based approximation uniformly over all curve segments. Instead, the input point sequence is represented using either biarc segments or polyline segments, according to the local geometric characteristics of the trajectory. Segments that exhibit high linearity are preserved as polylines rather than being unnecessarily approximated by circular arcs. As a result, the initial biarc approximation yields a mixed representation consisting of both biarc and polyline segments.
Although biarc fitting captures local curvature characteristics effectively, the resulting representation may lack global structural consistency due to the coexistence of biarc and polyline segments. Therefore, we apply a lightweight global refinement step that reevaluates the biarc-based segmentation from a trajectory-wide perspective by considering two structural patterns: biarc–polyline–biarc and polyline–biarc–polyline. In the former case, short polyline blocks between biarc segments are removed if their total length falls below a predefined tolerance of 50 m, allowing adjacent biarc segments to be directly connected. In the latter case, a central biarc block is retained only if it contains at least one arc whose curvature and length jointly indicate a meaningful curved segment; otherwise, it is merged into neighboring polyline segments and treated as part of a globally linear section.
After this refinement, remaining polyline segments below a minimum length are excluded from curvature-based analysis and used solely as connective elements. This process reduces sensitivity to local noise while preserving the overall geometric flow of the tracks, yielding a stable and interpretable representation for subsequent curvature-based difficulty analysis.
3.5. Track Difficulty Metrics
Based on the biarc-based geometric representation of the tracks, we introduce a set of curvature-driven metrics to quantitatively characterize track difficulty. Since the biarc approximation models the track as a sequence of circular arcs and straight lines, the curvature is a piecewise constant function. We define the following metrics to capture structural properties related to driving workload and geometric complexity.
Curvature Exposure Index (CEI).
The CEI measures the average curvature intensity normalized by the track length. Let be the total length of the tracks. The CEI is defined as follows [27]:
Geometrically, the integral represents the total turning angle accumulated over the lap. A high CEI indicates a technically demanding track dominated by cornering sections (high sinuosity), whereas a low CEI characterizes a power track with extended straight segments.
Maximum Curvature Severity (MCS). While CEI captures cumulative effects, the MCS focuses on the most demanding local feature of the track. It is defined as
This metric corresponds to the inverse of the minimum turning radius (). It highlights critical bottlenecks, such as hairpins or tight chicanes, which dictate the minimum cornering speed and impose maximal braking demands.
Curvature Variation Index (CVI). The CVI quantifies the frequency and magnitude of curvature transitions. Since the biarc representation yields a piecewise constant curvature profile, the variation is measured by the sum of absolute curvature jumps at the connection points. Let be the curvature of the i-th segment and N be the total number of segments. The CVI is defined as
Although the summation inside the logarithm has physical units, CVI is intentionally treated as a relative, dimensionless index rather than as a physical quantity with strict dimensional interpretation. The logarithmic scaling is introduced to compress the dynamic range of curvature variation and to facilitate comparative analysis across tracks. High CVI values indicate tracks with frequent and abrupt changes in geometry, such as compound corners or rapid esses, where drivers must constantly adapt their steering angle and manage transient load transfers.
The three curvature-based metrics introduced above capture complementary aspects of geometric difficulty along a track. Specifically, the CEI reflects the cumulative curvature load experienced over a lap, the MCS characterizes the most demanding local bottleneck through the minimum turning radius, and the CVI quantifies the frequency and abruptness of curvature transitions associated with dynamic steering demands.
Rather than collapsing these heterogeneous effects into a single scalar a priori, we represent track difficulty as a curvature difficulty vector
which provides a compact yet interpretable description of geometric demands across cumulative, local-extreme, and transitional dimensions. This vector formulation preserves information that a single aggregate score would obscure and enables direct comparison between tracks with distinct geometric profiles, such as high-speed tracks dominated by sustained curvature versus technical layouts characterized by sharp or rapidly alternating corners.
4. Experimental Results
4.1. Dataset Overview
For experimental validation, we collected telemetry data from all 24 tracks of the 2024 Formula 1 World Championship season. Data were obtained using the FastF1 API (see https://docs.fastf1.dev/ (accessed on 1 September 2025)), a community-maintained interface that provides programmatic access to publicly available and officially released Formula 1 timing and telemetry data. While FastF1 is not an official Formula 1 API, it has been widely adopted in both research and practitioner communities for systematic race telemetry analysis. To ensure consistency and comparability across tracks, our analysis focuses exclusively on race sessions. That is, practice and qualifying sessions were excluded, as they involve heterogeneous driving objectives and experimental conditions that are not representative of competitive race dynamics. Only valid race laps were retained, and for each track, telemetry data from up to 20 drivers were included, excluding drivers who did not start the race.
As summarized in Table 1, each race lap is represented by several hundred sampled points, even in the sparsest cases. This level of sampling resolution is sufficient to support stable geometric reconstruction and curvature-related analysis, and it does not constitute a limiting factor in the subsequent experiments. Overall, sampling density varies across tracks due to differences in track length, average speed, and cornering characteristics; however, it remains well within a range that supports consistent geometric analysis across all tracks.
Table 1.
Overview of the 2024 Formula 1 season dataset, reporting track length, the number of valid race laps used for analysis, and the sampling density per lap summarized by minimum, median, and maximum sample counts.
4.2. Representative Lap Selection Analysis
Table 2 summarizes the selected representative laps for each track together with the associated discrete Fréchet distance () statistics computed against all valid race laps. For each track, the table reports the driver and lap number of the selected representative lap, the number of sampled points, and the minimum, median, and maximum values observed across the lap set. The number of samples per representative lap varies across tracks, reflecting differences in lap duration and telemetry sampling density rather than any segmentation-related property.
Table 2.
Selected representative laps for each track and the corresponding discrete Fréchet distance [3] () statistics computed against all valid race laps, including the number of samples and the minimum, median, and maximum values.
The selected representative laps are drawn from a diverse set of drivers. While the championship leader (VER) appears in several cases, the representative set also includes drivers such as HUL, ZHO, SAR, COL, and others. This supports the interpretation that the representative lap selection is driven by geometric similarity under the discrete Fréchet distance, rather than by driver identity or exceptional lap-time performance.
4.3. Statistics of Biarc Approximation Results
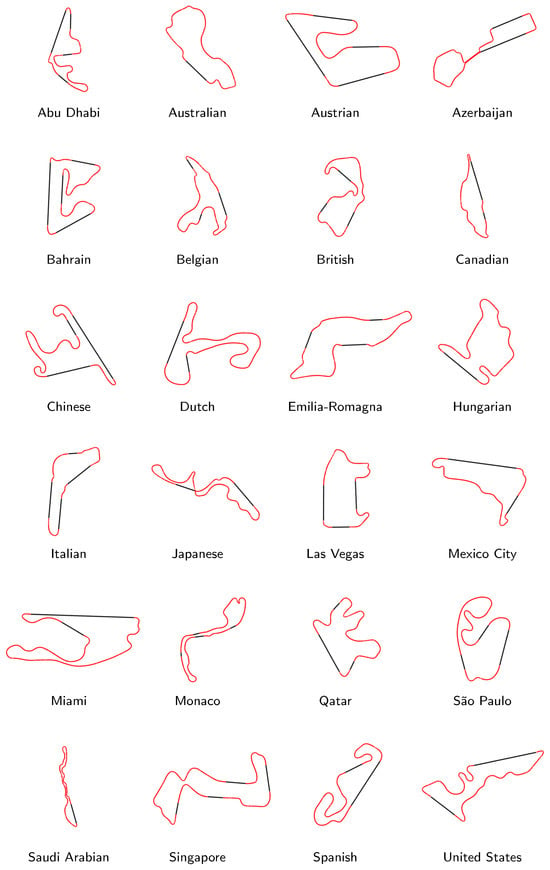
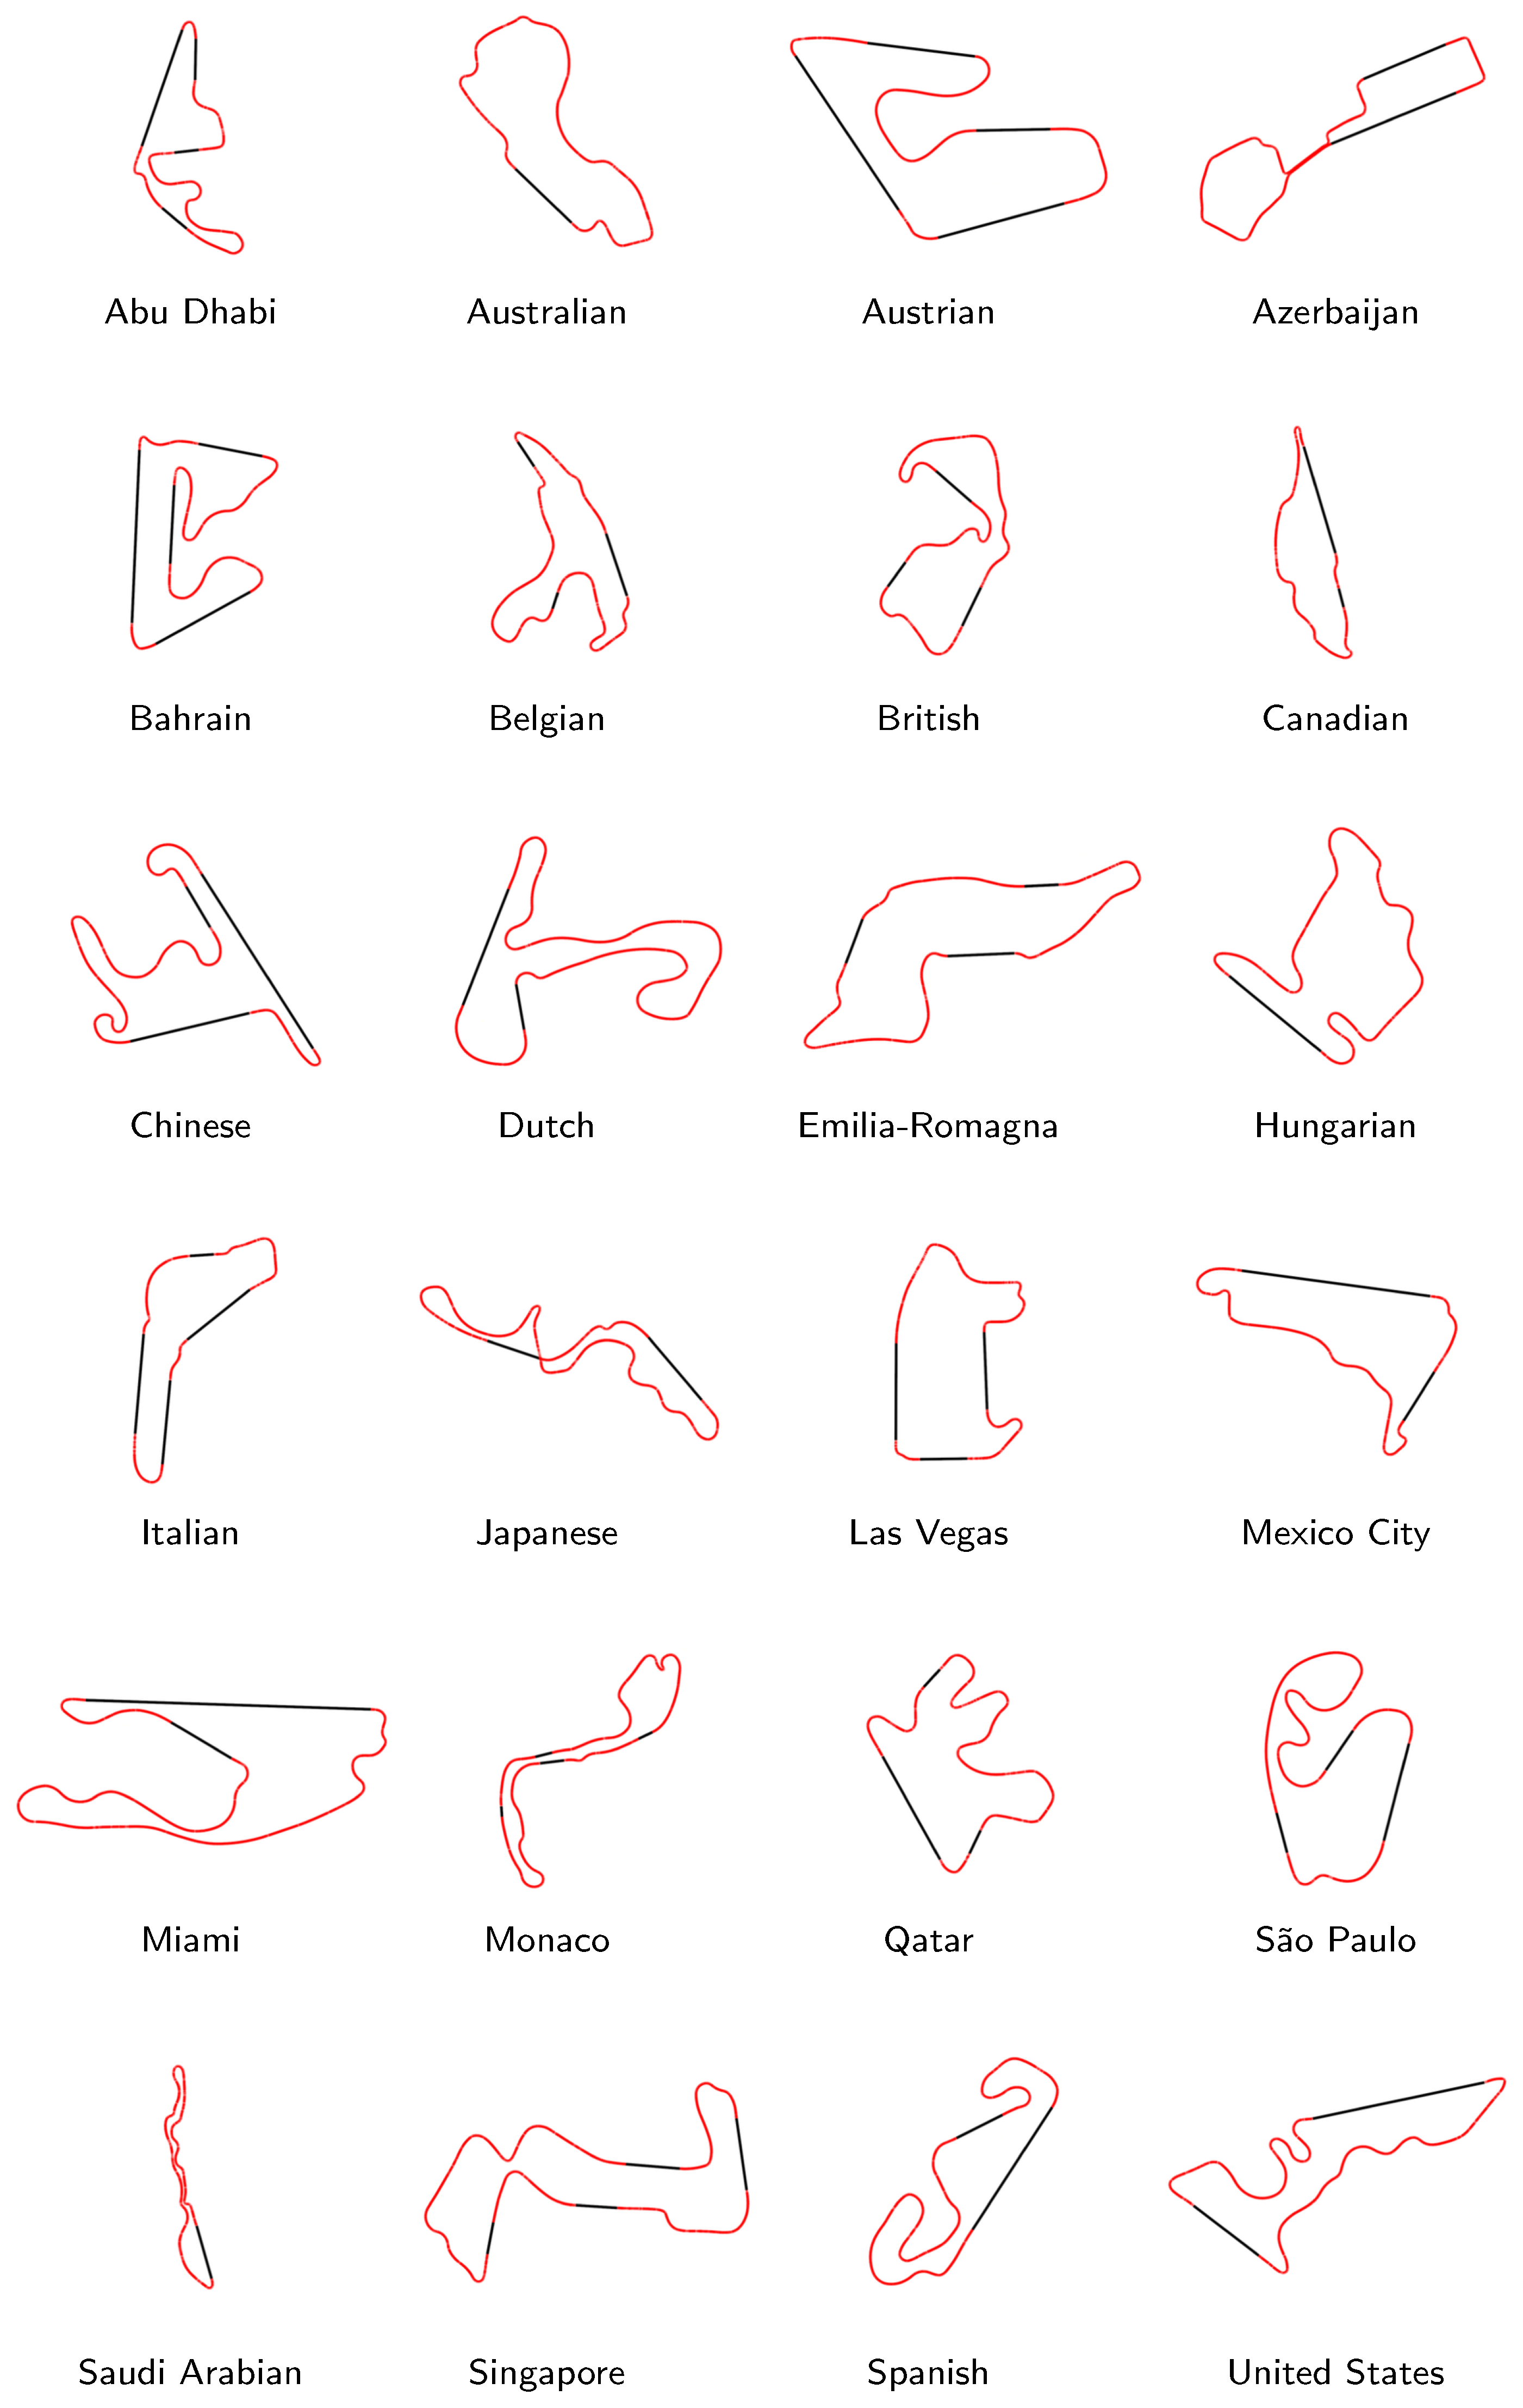
Figure 1 visualizes the straight–curve segmentation results obtained from the representative laps selected for all 24 tracks. Although the track layouts differ substantially, the figure provides a qualitative comparison of the distribution of straight and curved portions along each representative lap, highlighting track-specific geometric characteristics rather than serving as a quantitative assessment.
Figure 1.
Visualization of representative racing lines across all 24 tracks. Black segments indicate straight lines, while red segments indicate curve segments. The plots are intended for qualitative illustration; all geometric analyses are performed using the original telemetry coordinates with preserved physical scale.
Table 3 summarizes the structural statistics obtained from applying the proposed biarc approximation to all 24 tracks. In terms of curves, the Abu Dhabi track has the highest counts (5), while the Australian, Hungarian, and Saudi Arabian track has only a single curve segment. Regarding the total number of arcs, the Qatar track recorded the highest count with 142 arcs, followed by Miami (112) and Monaco (90), while the Emilia-Romagna and Italian tracks each comprise only 28 arcs, the lowest arc counts.
Table 3.
Summary of segment composition and curvature statistics obtained from biarc approximation of the representative racing line for each of the 24 tracks. # denotes the number of segments.
Curvature statistics further reveal substantial variability in local and global geometric characteristics across tracks. Median curvature values vary widely, reflecting differences in the prevalence of gentle versus sharp cornering. Maximum curvature values are dominated by tracks with extreme hairpin corners, whereas tracks such as the Spanish track exhibit comparatively low curvature extremes.
4.4. Metric Comparison
Table 4 presents the quantitative results of the three proposed difficulty metrics (CEI, MCS, and CVI) calculated for all 24 tracks. CEI is expressed in rad/km, and MCS has units of km−1. CVI is reported as a dimensionless index because curvature variation is logarithmically scaled. CEI results clearly distinguish tracks based on their cumulative turning demands relative to length. Most notably, the Monaco track exhibits a unique profile with a CEI of 8.44, the highest among all tracks. This exceptionally high value quantitatively confirms that Monaco is characterized by sustained, continuous cornering with very limited straight segments. A second cluster of high-CEI tracks includes the Dutch (5.50), United States (5.40), Hungarian (5.31), and Mexico City (5.14) tracks. These tracks feature dense sequences of alternating curvature, including chicanes and rapid direction changes, resulting in a high cumulative turning angle. By contrast, the Italian records the lowest CEI of 1.97, followed by Azerbaijan (2.37) and Las Vegas (2.47) tracks. These low values are consistent with the geometry of so-called power tracks, which prioritize long straight sections and chicanes over sustained cornering.
Table 4.
Quantitative evaluation results using Curvature Exposure Index (CEI), Maximum Curvature Severity (MCS), and Curvature Variation Index (CVI). CVI is a dimensionless index due to logarithmic scaling.
MCS identifies the single point of maximum geometric stress on each track. The Monaco track leads with an MCS of 1689.54 km−1 (at the Fairmont Hairpin), followed by Belgian (1527.96 km−1 at La Source) and Canadian (1321.26 km−1 at L’Epingle) tracks. While MCS highlights localized geometric bottlenecks that constrain minimum cornering speeds, the results show that such extreme curvature points occur across a wide range of tracks and are not directly indicative of the overall geometric difficulty represented by CEI.
CVI, which aggregates curvature transition magnitudes, shows an interesting qualitative association with on-track overtaking difficulty. High CVI values correspond to tracks with frequent, abrupt geometric changes, where drivers must continuously adapt their steering inputs, leaving little margin for car positioning errors or alternative racing lines. Tracks known for being difficult to overtake, such as the Monaco (see https://www.formula1.com/en/racing/2025/monaco (accessed on 10 November 2025) and https://www.theguardian.com/sport/article/2024/may/24/lewis-hamilton-monaco-grand-prix-circuit-overtaking-formula-one (accessed on 10 November 2025)), Qatar (see https://www.formula1.com/en/latest/article/need-to-know-the-most-important-facts-stats-and-trivia-ahead-of-the-2024-qatar.131JdDXXwp8cBESBH614eq (accessed on 10 November 2025)), and Mexico City (see https://www.formula1.com/en/latest/article/what-the-teams-said-qualifying-in-mexico-city-2025.28jYnSnc0HPiNBegOVzjlm (accessed on 17 November 2025)) tracks, record the highest CVI values. Conversely, tracks with lower CVI values, such as the British (see https://www.formula1.com/en/latest/article/why-we-love-the-british-grand-prix.7Kh16Wqsh72eZOoO3G99Wl (accessed on 17 November 2025)) and Las Vegas (see https://www.formula1.com/en/latest/article/speed-neon-and-the-strip-the-ultimate-fan-guide-to-las-vegas.6LafpqS1SuW41zYwdXz2iC (accessed on 2 December 2025)) tracks, are generally associated with more favorable overtaking opportunities.
5. Discussion
We propose a difficulty analysis framework based on the geometric characteristics of the Formula 1 racing lines from the 2024 season. At the same time, the proposed framework has several inherent limitations that should be considered when interpreting the results.
The proposed method is subject to the limitations of a 2D planar assumption. All driving trajectories are projected onto a 2D plane for analysis. While this assumption enables effective characterization of the geometric structure of the racing line in most track sections, it becomes restrictive in segments with significant elevation changes or strong banking. For example, in track sections such as the Eau Rouge–Raidillon complex in the Belgian track or banked turns in the Dutch track, 3D terrain features play a critical role in determining vehicle stability and achievable cornering speed. In banked corners, vehicles can sustain substantially higher speeds than in planar corners with the same projected curvature, leading to a reduction in effective driving difficulty that cannot be fully explained by planar curvature alone. To capture such dynamic effects, future work should extend the proposed framework to 3D curve modeling that incorporates elevation and banking information, or more generally, to surface-based representations that approximate the racing track as a 3D surface.
The proposed difficulty metric does not account for vehicle dynamics. The metric relies exclusively on the geometric shape of the racing line. However, the perceived difficulty experienced by a driver is influenced by a wide range of physical factors, including track grip level, tire condition, variations in vehicle mass due to fuel load, and aerodynamic downforce. For instance, under wet conditions or low track temperatures, even geometrically mild corners may become highly challenging due to reduced grip. Accordingly, the geometric difficulty metric proposed in this work should be interpreted strictly as a baseline measure of the structural difficulty imposed by track geometry. An important direction for future research is to extend this framework by integrating telemetry-derived dynamic information, such as speed and acceleration, to construct a composite difficulty metric.
We note that several well-known perceptions of track difficulty reflect factors beyond the scope of the proposed framework. For example, the Monaco track is widely regarded as difficult primarily because of its narrow layout and limited overtaking opportunities, rather than its extreme curvature variation (see https://www.theguardian.com/sport/article/2024/may/24/lewis-hamilton-monaco-grand-prix-circuit-overtaking-formula-one (accessed on 10 November 2025)). Also, localized corner sequences such as British’s Brooklands–Luffield–Woodcote may be technically demanding from a driving or performance perspective, yet their impact on the global curvature variation of the racing line remains limited (see https://www.redbull.com/in-en/silverstone-circuit-formula-racing-jehan-daruvala (accessed on 17 November 2025)).
In contrast, tracks characterized by frequent sharp corners and chicanes may exhibit high geometric difficulty scores even when non-geometric factors dominate real-world race difficulty. The contrast between the highest CEI observed for Monaco (8.44 rad/km) and the lowest for Italian (1.97 rad/km) reinforces that the proposed metric captures the geometric difficulty of the tracks, rather than overall driving or race difficulty, and should be interpreted accordingly.
It is also necessary to consider the limitations of the biarc-based curve representation adopted in this study. Biarc representations provide an intuitive description of local curvature and allow curvature values to be computed in closed form, making them well-suited for quantitative analysis tasks such as track difficulty evaluation. However, when extending the proposed framework to generative tasks such as automatic track generation or design optimization, biarc representations may not always be optimal. In such generative contexts, curve representations with higher degrees of freedom, such as splines, may be more suitable.
Therefore, the use of biarc representations in this study should be understood as a pragmatic choice for analyzing and comparing the geometric difficulty of tracks, rather than as a claim of universal optimality for curve generation. Future work may employ the proposed difficulty metric as a loss function or constraint within track generation frameworks that adopt more general curve representations.
6. Conclusions
We presented a geometric difficulty analysis framework for Formula 1 racing lines based on telemetry data. By modeling corner segments using a biarc-based representation, we derived curvature-based metrics that provide a compact and interpretable description of track difficulty. The proposed method focuses on the intrinsic geometric structure of racing lines, enabling stable estimation of geometry-based difficulty. Across the 24 tracks analyzed, CEI ranged from 1.97 rad/km (Italian) to 8.44 rad/km (Monaco), MCS from 230.54 km−1 (Spanish) to 1689.54 km−1 (Monaco), and CVI from 7.60 (British) to 9.33 (Monaco and Qatar). These results demonstrate that the proposed difficulty vector effectively captures complementary aspects of geometric track difficulty. While the current framework is limited to planar geometry and purely geometric measures, it establishes a foundation for several promising extensions. Future work includes incorporating 3D track geometry, integrating telemetry-derived dynamic variables, and employing the proposed metric as a constraint or loss function within automated track generation frameworks. Together, these directions position the proposed method as a flexible analytical tool for both geometric assessment and data-driven track modeling.
Author Contributions
Conceptualization, M.B. and Y.P.; methodology, M.B. and Y.P.; software, M.B. and T.N.; validation, T.N. and Y.P.; data curation, M.B.; writing—original draft preparation, M.B., T.N. and Y.P.; writing—review and editing, M.B., T.N. and Y.P.; visualization, T.N.; supervision, Y.P.; project administration, Y.P.; funding acquisition, Y.P. All authors have read and agreed to the published version of the manuscript.
Funding
This research was supported in part by the National Research Foundation of Korea (NRF) grant funded by the Korea government (MSIT) (RS-2023-00245613, RS-2024-00352439), in part by a New Faculty Research Grant of Pusan National University, 2025, as well as in part by the Regional Innovation System & Education (RISE) program through the institute for Regional Innovation System & Education in Busan Metropolitan City, funded by the Ministry of Education (MOE) and the Busan Metropolitan City, Republic of Korea (2025-RISE-02-004-12810001-04).
Institutional Review Board Statement
Not applicable.
Informed Consent Statement
Not applicable.
Data Availability Statement
The datasets used in this study are publicly available: FastF1 is available at https://docs.fastf1.dev/ (accessed on 1 September 2025). Derived data, including the extracted representative racing lines used for the analysis, can be made available for research purposes upon reasonable request.
Acknowledgments
During the preparation of this work, the authors used ChatGPT 5.2 in order to correct grammar. After using this service, the authors reviewed and edited the content as needed and take full responsibility for the content of the published article. The authors would like to thank the anonymous reviewers for their valuable comments and suggestions.
Conflicts of Interest
The authors declare no conflicts of interest.
References
- D’Aquino Noronha, L.F.Á. Development of a Lap Time Simulation Tool for Hybrid Vehicles. Master’s Dissertation, Universidade Federal de Santa Catarina, Florianópolis, Brazil, 2025. [Google Scholar]
- Boretti, A.; Ordys, A.; Al-Zubaidy, S. Dynamic analysis of an LMP1-H racing car by coupling telemetry and lap time simulations. In Proceedings of the International Conference on Applied Mechanics, and Industrial Systems, Muscat, Oman, 6–8 December 2016; pp. 8–10. [Google Scholar]
- Alt, H.; Godau, M. Computing the Fréchet distance between two polygonal curves. Int. J. Comput. Geom. Appl. 1995, 5, 75–91. [Google Scholar] [CrossRef] [Scilit]
- Meek, D.S.; Walton, D.J. Approximation of discrete data by G1 arc splines. Comput.-Aided Des. 1992, 24, 301–306. [Google Scholar] [CrossRef] [Scilit]
- Douglas, D.H.; Peucker, T.K. Algorithms for the reduction of the number of points required to represent a digitized line or its caricature. Cartogr. Int. J. Geogr. Inf. Geovisualization 1973, 10, 112–122. [Google Scholar] [CrossRef] [Scilit]
- Visvalingam, M.; Whyatt, J.D. Line generalisation by repeated elimination of points. Cartogr. J. 1993, 30, 46–51. [Google Scholar] [CrossRef]
- Jiang, B.; Xu, S.; Li, Z. Polyline simplification using a region proposal network integrating raster and vector features. GISci. Remote Sens. 2023, 60, 2275427. [Google Scholar] [CrossRef] [Scilit]
- Muckell, J.; Olsen, P.W., Jr.; Hwang, J.H.; Lawson, C.T.; Ravi, S. Compression of trajectory data: A comprehensive evaluation and new approach. GeoInformatica 2014, 18, 435–460. [Google Scholar] [CrossRef] [Scilit]
- Schneider, P.J. An algorithm for automatically fitting digitized curves. In Graphics Gems; Academic Press, Inc.: San Diego, CA, USA, 1990; pp. 612–626. [Google Scholar]
- Choi, J.W.; Elkaim, G.H. Bézier curves for trajectory guidance. In Proceedings of the World Congress on Engineering and Computer Science, WCECS, Citeseer, San Francisco, CA, USA, 22–24 October 2008; pp. 22–24. [Google Scholar]
- Fiebich, R.C. Bézier-Based Trajectory Generation for Autonomous Ground Vehicles. Master’s Thesis, University of California, Santa Cruz, CA, USA, 2013. [Google Scholar]
- Jain, A.; Morari, M. Computing the racing line using Bayesian optimization. In Proceedings of the 2020 59th IEEE Conference on Decision and Control, Jeju, Republic of Korea, 14–18 December 2020; pp. 6192–6197. [Google Scholar]
- Rosin, P.L.; West, G.A. Segmentation of edges into lines and arcs. Image Vis. Comput. 1989, 7, 109–114. [Google Scholar] [CrossRef] [Scilit]
- Buchin, M.; Driemel, A.; Van Kreveld, M.J.; Sacristán, V. Segmenting trajectories: A framework and algorithms using spatiotemporal criteria. J. Spat. Inf. Sci. 2011, 3, 33–63. [Google Scholar]
- Etemad, M.; Júnior, A.S.; Hoseyni, A.; Rose, J.; Matwin, S. A Trajectory Segmentation Algorithm Based on Interpolation-based Change Detection Strategies. In Proceedings of the EDBT/ICDT Workshops, Lisbon, Portugal, 26 March 2019; p. 6. [Google Scholar]
- Biagioni, J.; Eriksson, J. Map inference in the face of noise and disparity. In Proceedings of the 20th International Conference on Advances in Geographic Information Systems, Redondo Beach, CA, USA, 6–9 November 2012; pp. 79–88. [Google Scholar]
- Ahmed, M.; Wenk, C. Constructing street networks from GPS trajectories. In Proceedings of the European Symposium on Algorithms; Springer: Ljubljana, Slovenia, 2012; pp. 60–71. [Google Scholar]
- Dal Poz, A.P.; Martins, E.; Zanin, R.B. Road network extraction using GPS trajectories based on morphological and skeletonization algorithms. Int. Arch. Photogramm. Remote Sens. Spat. Inf. Sci. 2022, 43, 239–245. [Google Scholar] [CrossRef] [Scilit]
- Zhang, X.; Gao, Y.; Zhou, C. Enhancing Vehicle Trajectory Quality: A Two-Step Data Reconstruction Method Using Wavelet Transform and Normal Acceleration Value. Eng. Rep. 2025, 7, e13090. [Google Scholar] [CrossRef] [Scilit]
- Bertolazzi, E.; Frego, M.; Biral, F. Point data reconstruction and smoothing using cubic splines and clusterization. Math. Comput. Simul. 2020, 176, 36–56. [Google Scholar] [CrossRef] [Scilit]
- Loiacono, D.; Cardamone, L.; Lanzi, P.L. Automatic track generation for high-end racing games using evolutionary computation. IEEE Trans. Comput. Intell. AI Games 2011, 3, 245–259. [Google Scholar] [CrossRef] [Scilit]
- Georgiou, T.; Demiris, Y. Adaptive user modelling in car racing games using behavioural and physiological data. User Model. User-Adapt. Interact. 2017, 27, 263–289. [Google Scholar] [CrossRef] [Scilit] [PubMed]
- Kristensen, J.T.; Burelli, P. Difficulty modelling in mobile puzzle games: An empirical study on different methods to combine player analytics and simulated data. Int. J. Comput. Games Technol. 2024, 2024, 5592373. [Google Scholar] [CrossRef] [Scilit]
- Oppenheim, A.V. Discrete-Time Signal Processing; Pearson Education: Chennai, India, 1999. [Google Scholar]
- Bolton, K. Biarc curves. Comput.-Aided Des. 1975, 7, 89–92. [Google Scholar] [CrossRef] [Scilit]
- Elber, G. The Irit Modeling Environment, Version 13. 2023. Available online: https://gershon.cs.technion.ac.il/irit/ (accessed on 10 October 2025).
- Do Carmo, M.P. Differential Geometry of Curves and Surfaces: Revised and Updated Second Edition; Courier Dover Publications: Mineola, NY, USA, 2016. [Google Scholar]

Disclaimer/Publisher’s Note: The statements, opinions and data contained in all publications are solely those of the individual author(s) and contributor(s) and not of MDPI and/or the editor(s). MDPI and/or the editor(s) disclaim responsibility for any injury to people or property resulting from any ideas, methods, instructions or products referred to in the content. |
© 2026 by the authors. Licensee MDPI, Basel, Switzerland. This article is an open access article distributed under the terms and conditions of the Creative Commons Attribution (CC BY) license.