


Abstract
Fast neutron shielding is a critical component of radiation protection design. Conventional exponential attenuation models based on the narrow-beam (beam approximation) assumption often exhibit large deviations in realistic geometries because they neglect the contribution of scattered neutrons—an effect that becomes particularly prominent for thick hydrogenous shields such as polyethylene. To improve the accuracy of rapid shielding estimates, this study systematically investigates how the “source–shield–detector” geometric configuration influences fast neutron scattering in polyethylene. To overcome the limited adaptability of traditional build-up factor corrections in complex geometries, we propose a physics-informed scattering correction (SC) model. By introducing key geometric parameters—source-to-shield distance, shield thickness, and detector distance—the model dynamically modifies the classical exponential attenuation formulation and analytically integrates the scattered-neutron contribution to the detector flux. Validation against 70 representative geometric configurations simulated with the Monte Carlo code Geant4 shows that the proposed model reduces the mean absolute percentage error (MAPE) from approximately 54% for the exponential attenuation model to approximately 20%, effectively addressing severe flux underestimation in moderately thick shielding cases (5–20 cm). The results provide a practical and reliable tool, as well as a semi-empirical theoretical basis, for fast and accurate engineering estimation of polyethylene-based fast neutron shielding.
1. Introduction
Fast neutrons are widely used in industrial radiography, boron neutron capture therapy (BNCT), environmental monitoring, and security screening [1,2,3,4,5,6,7]. Due to their long mean free path in most materials (typically 5–15 cm in hydrogenous media), fast neutrons present a major focus and significant challenge in radiation protection [8,9]. When fast neutrons pass through living tissue, they interact with atomic nuclei in the tissue via mechanisms such as elastic and inelastic scattering. These interactions generate secondary particles, including recoil protons and γ-rays, which induce substantial ionization effects. The relative biological effectiveness of fast neutrons is considerably higher than that of X-rays and low-energy γ-rays, thereby significantly increasing health risks. Consequently, effective shielding against fast neutrons is a critical measure for safeguarding the health and safety of nuclear facility personnel, patients, and the public [10]. Neutron shielding calculations are routinely employed to predict the attenuation of fast neutron radiation, thereby providing a fundamental basis for the selection of shielding materials and the design of shield thickness. Estimating the flux attenuation of fast neutrons after passing through shielding materials is crucial for the design of fast neutron shielding.
Current neutron shielding calculations primarily rely on the Monte Carlo (MC) numerical simulation method [11,12]. The MC method accurately characterizes radiation field distributions in complex geometries by simulating stochastic particle transport processes. However, it is computationally intensive and time-consuming, particularly for deep-penetration problems or large-scale models, making it less practical for emergency response or rapid iterative design needs [13]. Additionally, deterministic methods and simplified models are employed in specific scenarios.
Deterministic methods compute neutron shielding by directly solving the neutron transport equation. For instance, analytical solutions to the time-dependent neutron diffusion equation in one-dimensional cylindrical geometry have been derived and applied to determining the neutron build-up factor [14]. Nevertheless, these methods often involve complex solving procedures, are limited to simple geometries, and frequently lack systematic validation against experimental data or other high-precision numerical methods, which restricts their engineering applicability. Therefore, workplace flux estimates typically employ simplified empirical formulas.
In engineering practice and emergency scenarios, simplified models such as the removal-diffusion method and the exponential attenuation model are commonly used for rapid estimation [15,16]. Among these, the exponential attenuation model based on the beam approximation is widely adopted due to its simple form and easily obtainable parameters. However, this model only considers the uncollided neutron component and fails to adequately account for complex scattering processes within the shield or the influence of geometric configurations [17]. Although fixed scattering correction factors Bn are used to correct scattering, the dynamic effects of geometric parameters are commonly overlooked, leading to systematic errors under complex geometries. This may result in inadequate shielding design, increasing radiation safety risks. Particularly for fast neutron shielding, the contribution from scattered neutrons may significantly elevate the equivalent dose at detection points [18]. Therefore, this study attempts to introduce a scattering correction method tailored to the geometric configuration based on the exponential decay model using beam approximation. The main contributions are as follows:
- (1)
- Use GEANT4 to simulate the scattering of a beam-like neutron source and qualitatively evaluate the contribution to the scattered neutron flux;
- (2)
- By fitting a power function, the ratio of forward-scattered neutrons to transmitted neutrons in the beam model is extracted, and an analytical scattering correction model applicable to this geometric configuration is derived;
- (3)
- Validate the scattering correction model through GEANT4 MC simulations and quantitatively evaluate the effectiveness of the scattering correction model.
This study systematically analyzes the influence mechanism of the geometric configuration among the “source-shield-detector” trio on neutron scattering behavior. A semi-empirical scattering correction (SC) model is proposed, enhancing the applicability and accuracy of the exponential decay model in practical engineering applications.
2. Fundamental Theory of Fast Neutron Shielding and Scattering Correction Methods
The interaction of fast neutrons with shielding materials primarily involves nuclear reaction processes such as elastic scattering, inelastic scattering, and radiation capture. Among these, elastic scattering serves as the dominant mechanism for fast neutron moderation. In this process, a neutron undergoes an elastic collision with an atomic nucleus, transferring part of its kinetic energy to the recoil nucleus while altering its own direction of motion. The amount of energy lost by the neutron per collision is inversely related to the mass of the recoil nucleus; thus, hydrogen nuclei, having a mass comparable to that of the neutron, act as the most efficient moderators. In hydrogen-rich materials, such as polyethylene, fast neutrons are rapidly moderated through successive elastic collisions with hydrogen nuclei. In contrast, inelastic scattering predominantly occurs during interactions between neutrons and medium-heavy or heavy nuclei. In this process, the recoil nucleus not only gains kinetic energy but is also elevated to an excited state. Subsequently, it de-excites by emitting secondary gamma rays. Although inelastic scattering contributes significantly to the deceleration of high-energy neutrons, its effective energy loss per interaction is generally less than that of elastic scattering. Furthermore, the average number of collisions required to moderate a fast neutron to thermal energies via inelastic scattering far exceeds that required when hydrogen nuclei are present [19].
The mechanism of fast neutron shielding reveals that during penetration through a shielding layer, in addition to the uncollided neutrons transmitting along the original direction, a significant number of neutrons are scattered, altering their paths. In traditional isotropic neutron shielding calculation models, the attenuation of fast neutrons through the shielding layer can be approximated by an exponential function, as expressed in Equation (1):
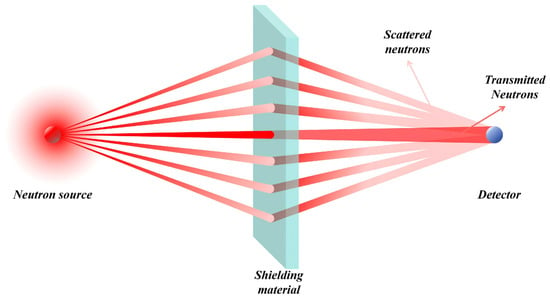
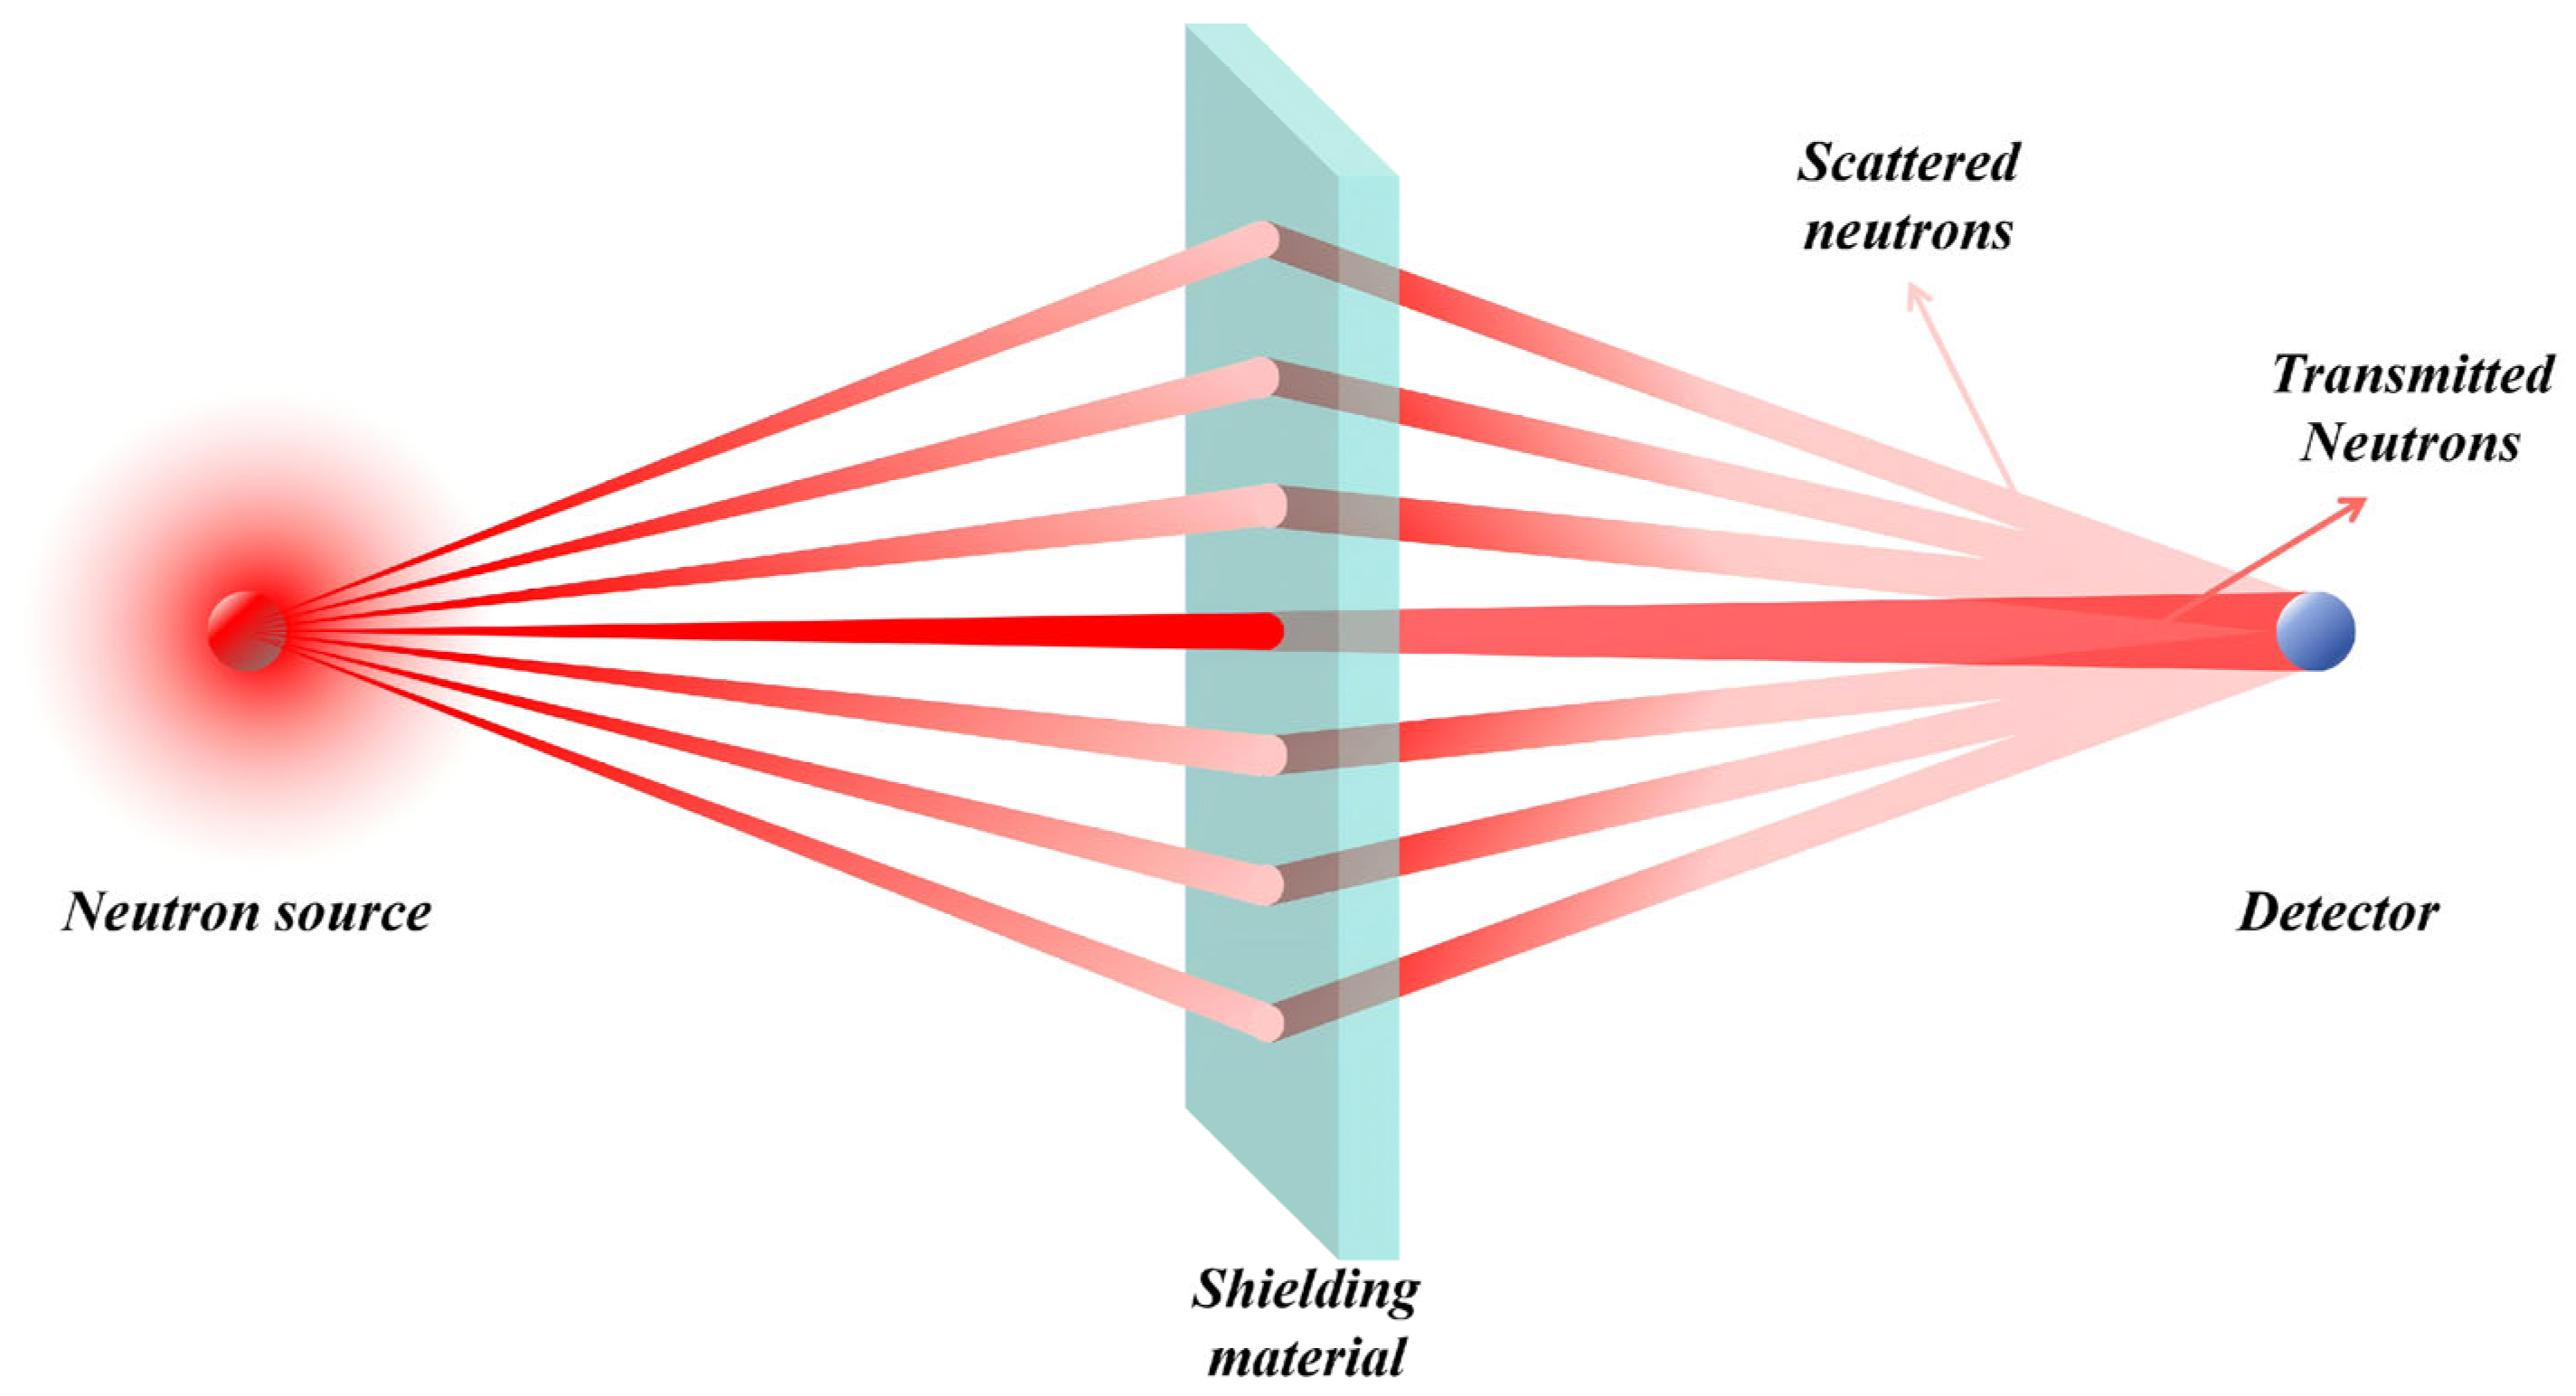
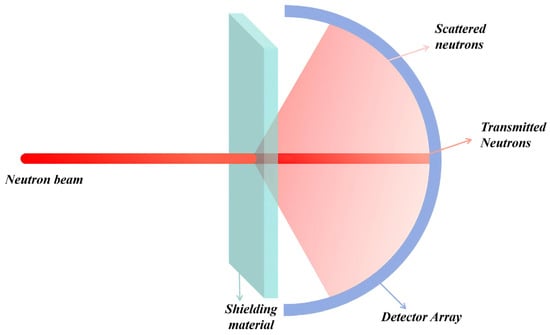
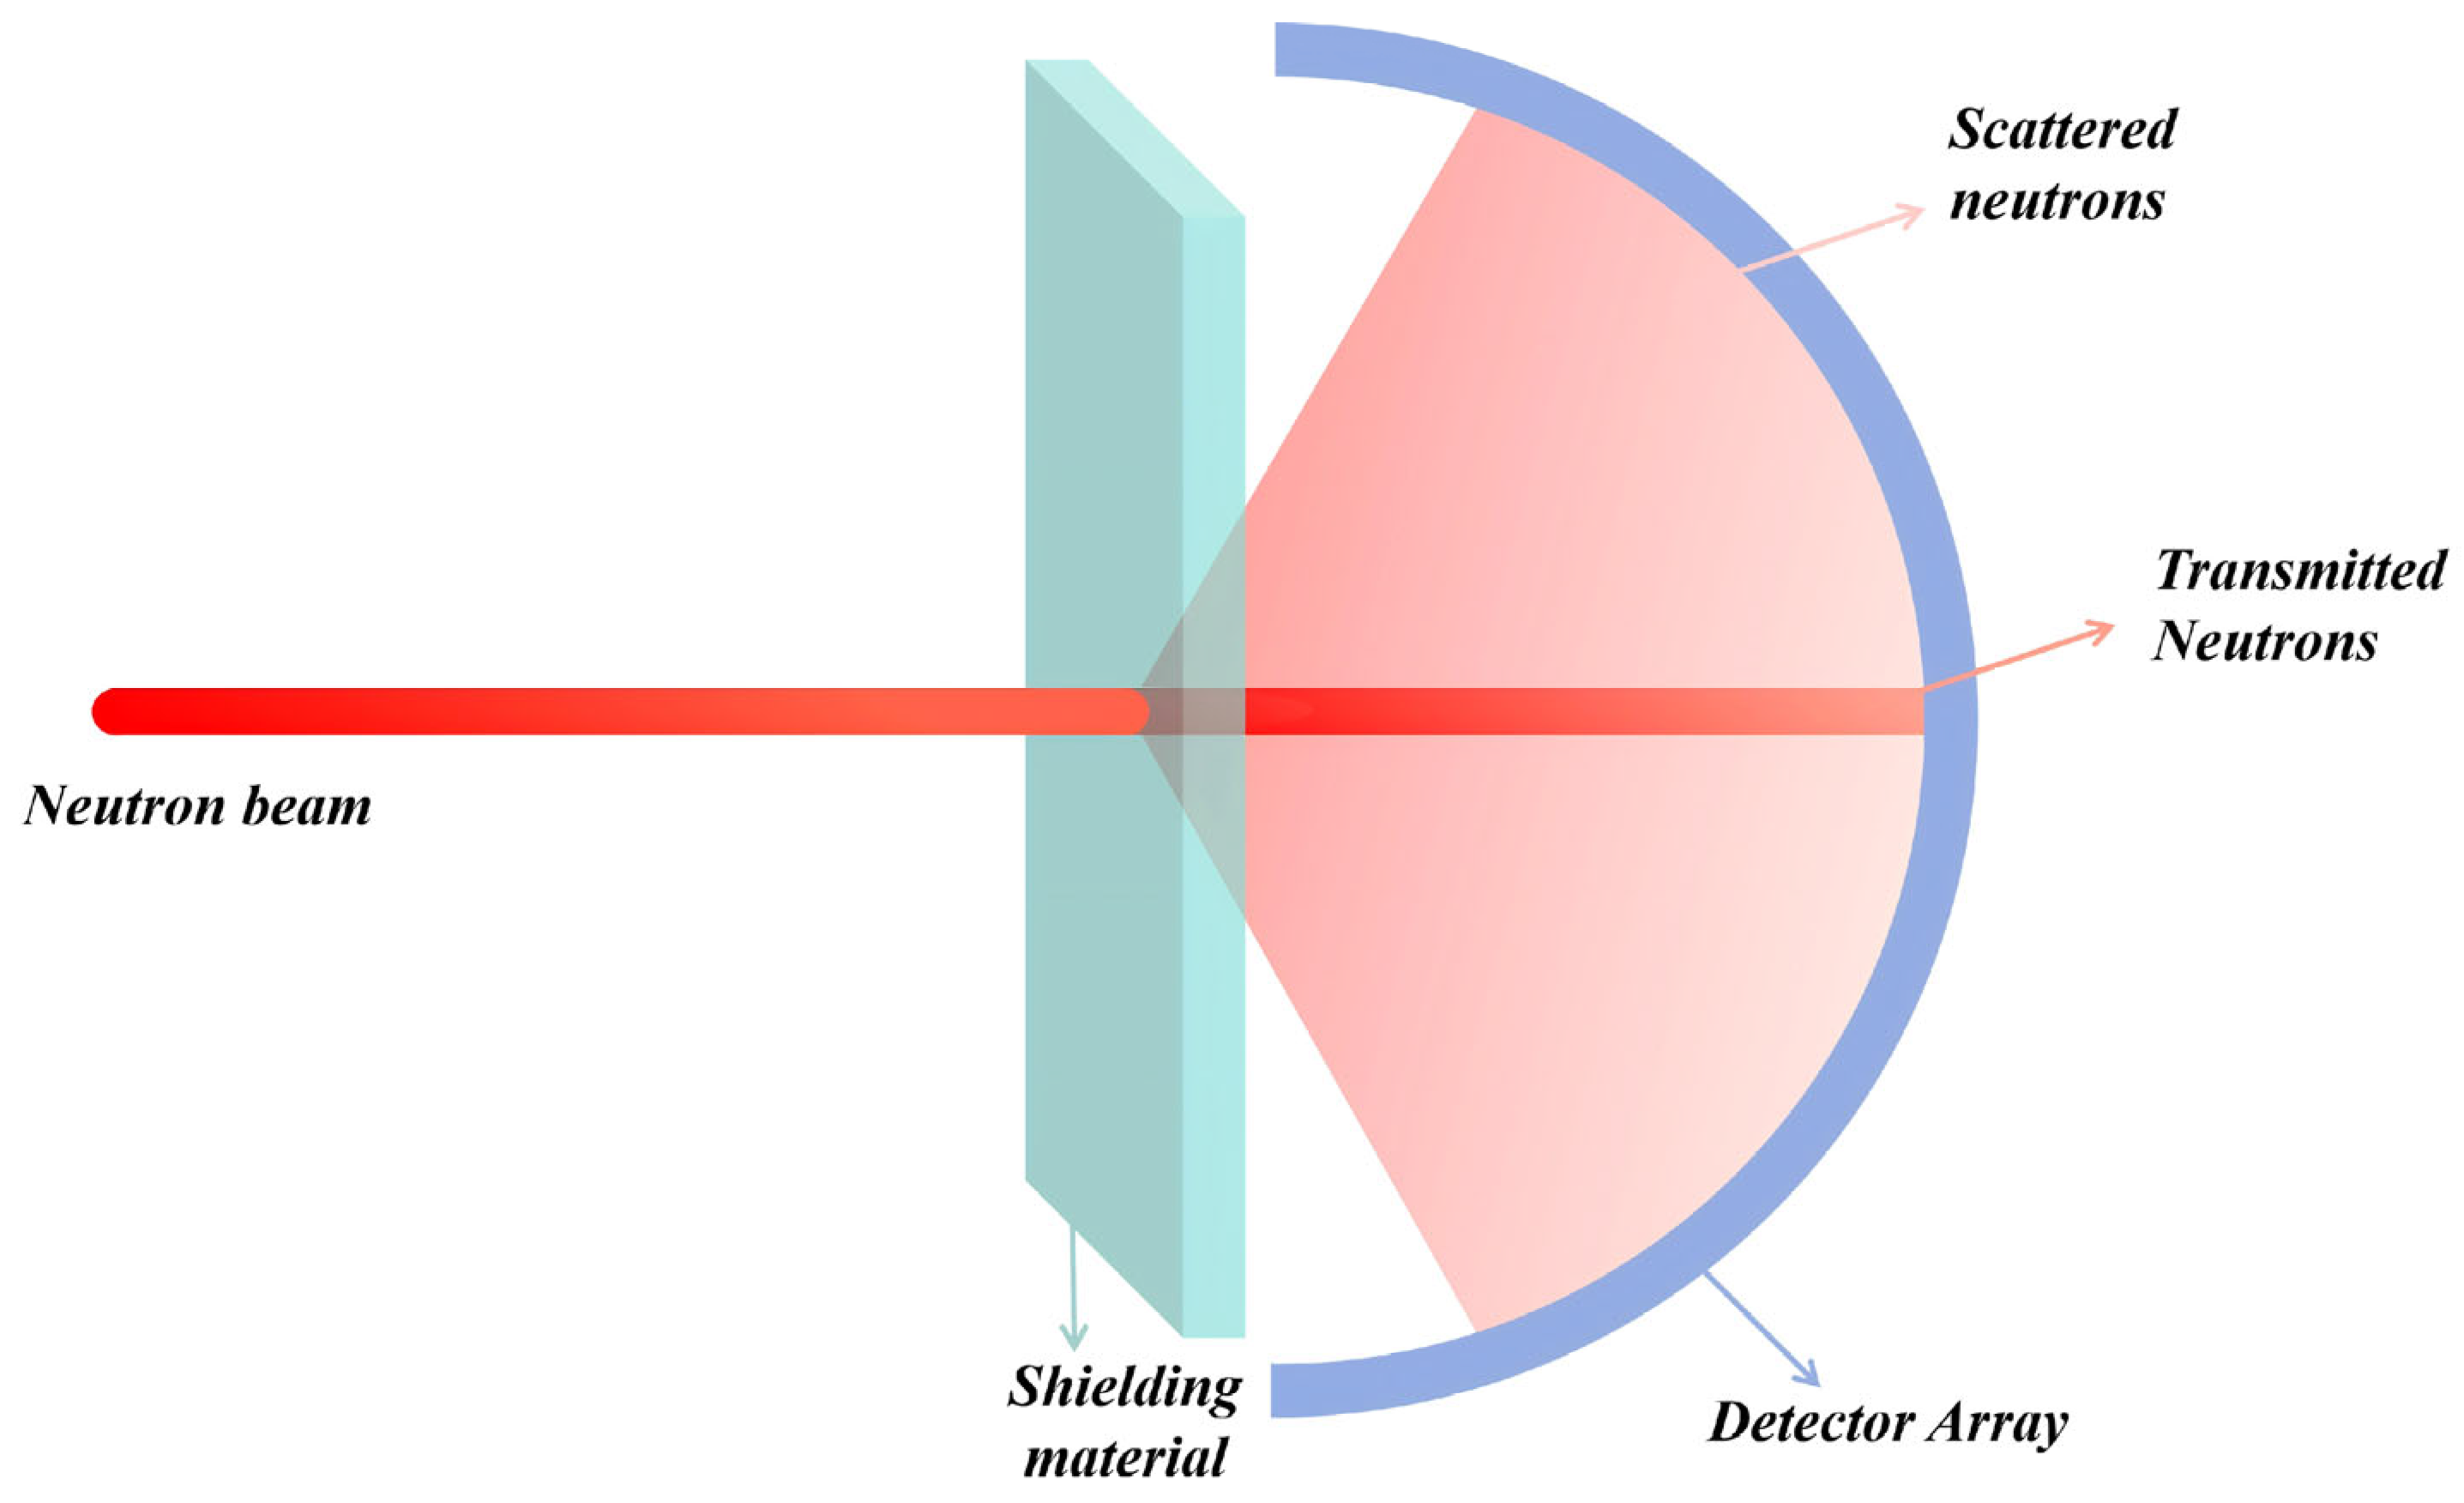
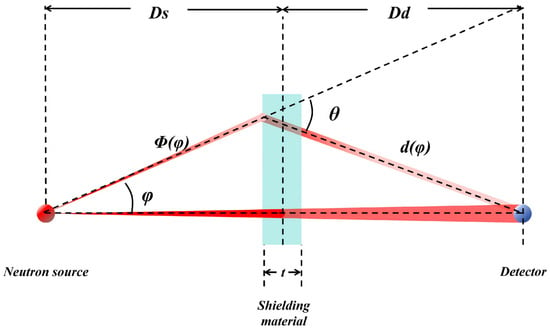
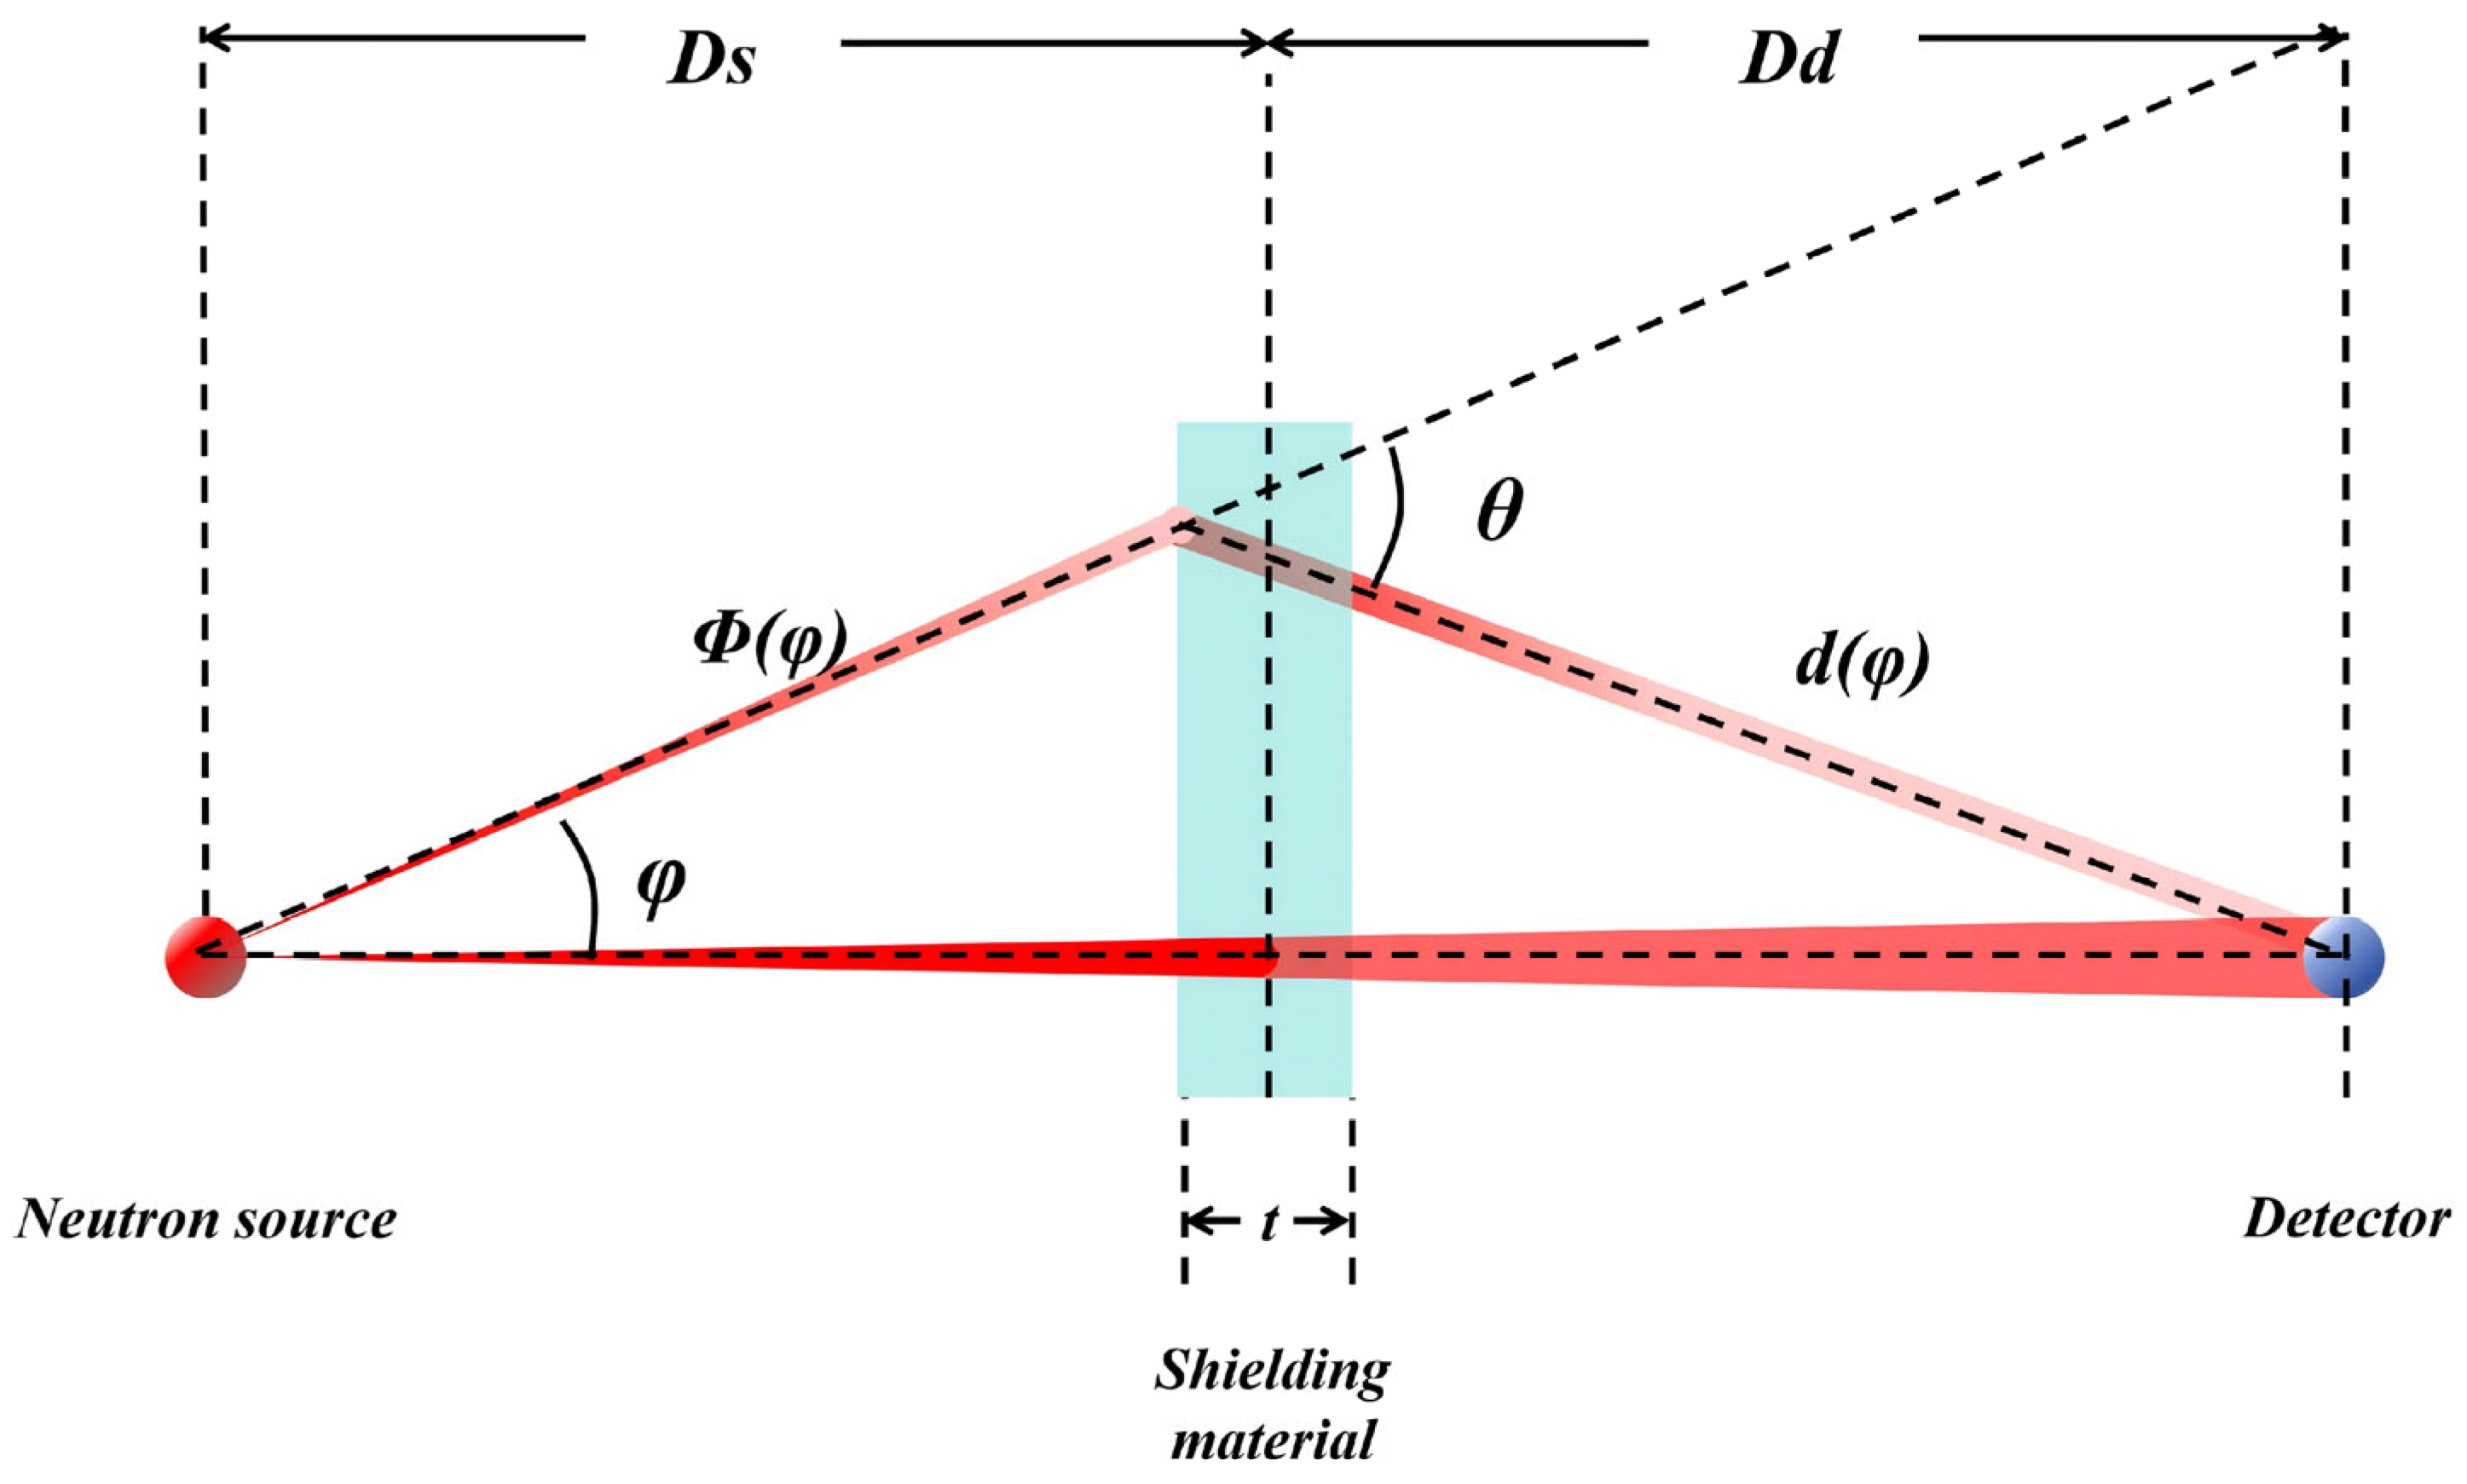
where is the neutron flux at a distance R from the source (n·cm−2·s−1), is the neutron source strength (n·s−1), is the macroscopic total cross-section of the shielding material (cm−1), and t is the thickness of the shielding layer (cm). The classical exponential attenuation model is predicated on the “narrow-beam geometry” assumption. This assumption posits that neutrons travel exclusively along the direct line connecting the source and the detector, with any neutron undergoing a scattering interaction being considered lost from the beam. However, as illustrated in Figure 1, under practical conditions such as broad-beam geometry or thick shielding, multiple scattering effects play a significant role. A substantial number of neutrons deviating from the original path can be re-directed through successive scattering events and ultimately reach the detector. This phenomenon results in a total neutron flux at the detector that is significantly higher than the theoretical prediction derived from the simple exponential model. Consequently, a detailed analysis of scattered neutrons is imperative for accurate assessment.
Figure 1.
Schematic diagram of neutron transport and detection in a shielding experiment.
The cut-off energy for scattered neutrons in shielding calculations was determined based on the fluence-to-dose conversion factor for Neutrons (FDCN) and the energy spectrum distribution of fast neutrons after passing through the shielding layer. Based on this, an analysis of scattered neutrons is conducted to establish a model capable of describing the number of scattered neutrons.
2.1. Scattered Neutron Energy Selection
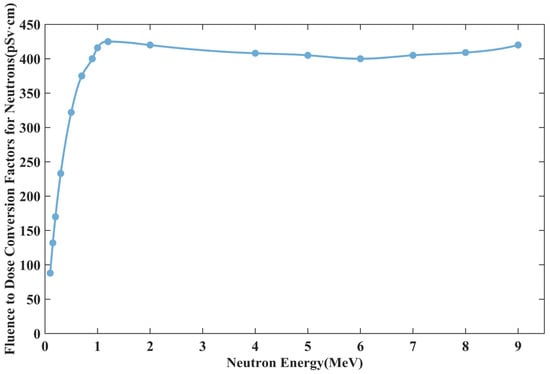
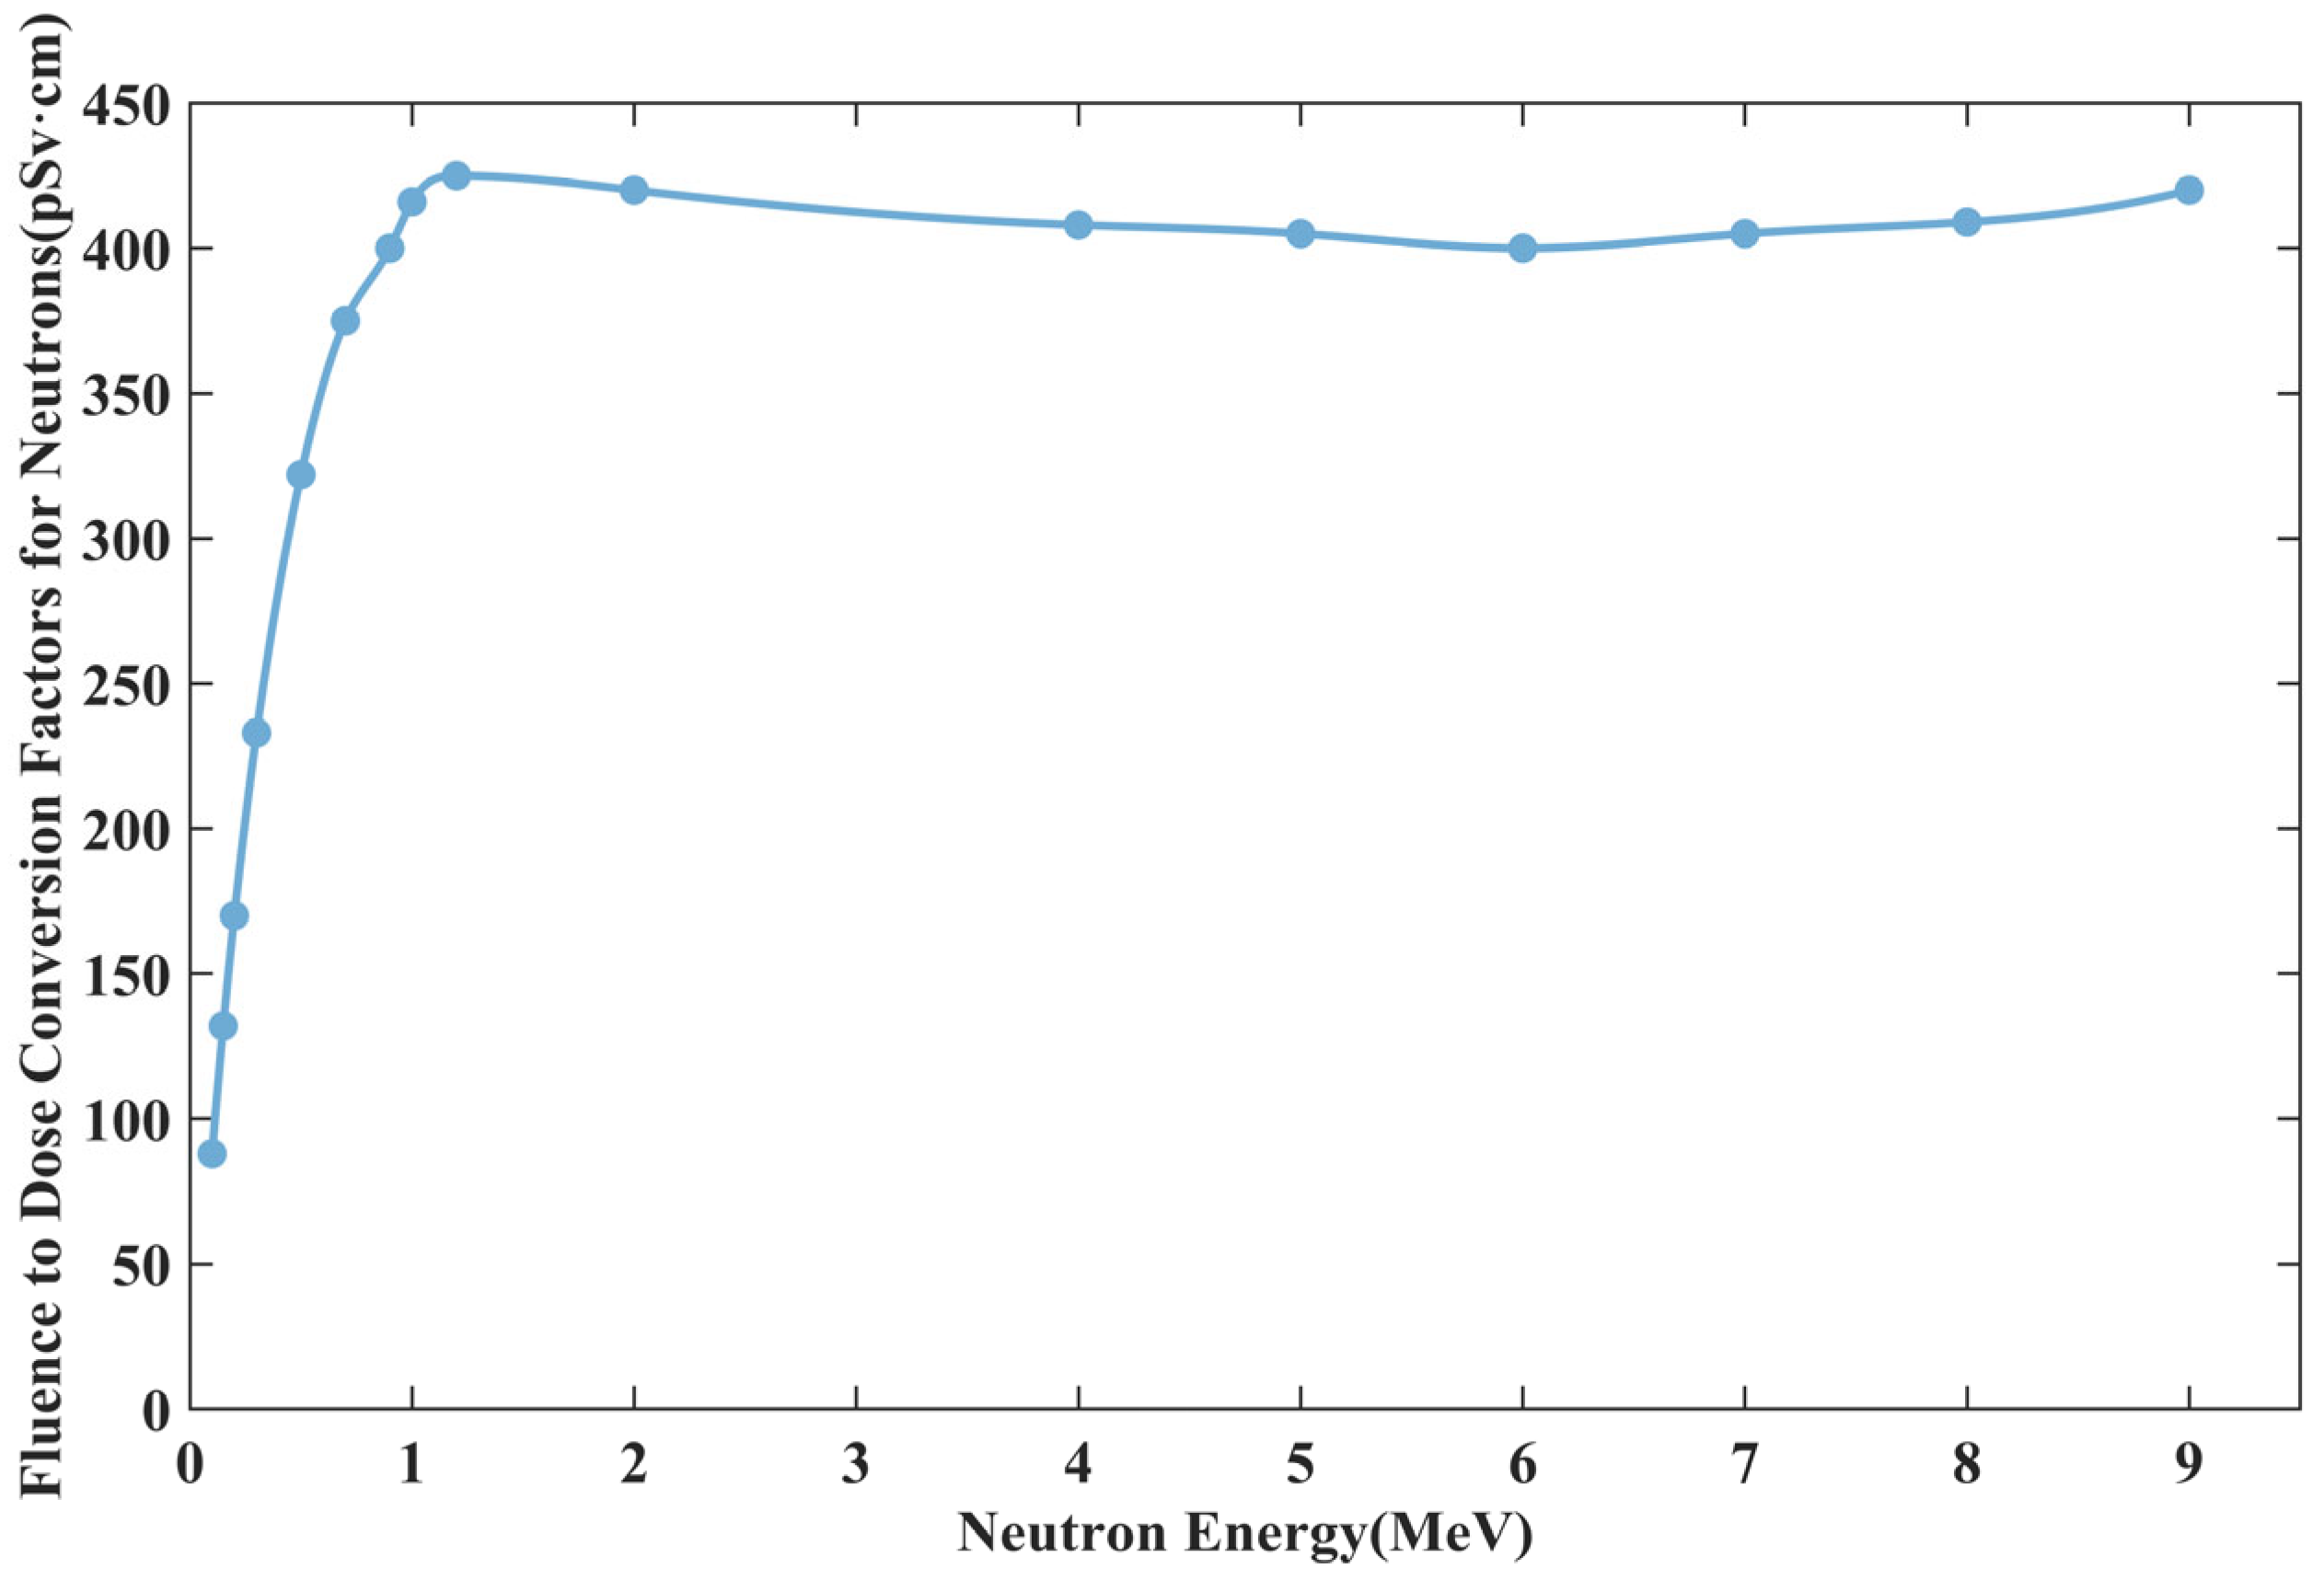
The influence of scattered neutron fluence must be assessed using the FDCN, which converts neutron flux into effective dose, with common units of pSv·cm2 [20,21]. As shown in Figure 2, the FDCN varies significantly with neutron energy: it is approximately 400 pSv·cm2 in the 1–3 MeV range, but decreases markedly below 1 MeV. For instance, the FDCN for 0.1 MeV neutrons is about 80 pSv·cm2, only one-fifth of that for 1 MeV neutrons. This characteristic indicates that when the scattered neutron fluence accumulates to a certain level, its biological impact cannot be overlooked. Therefore, whether scattered neutrons can be neglected must be determined by considering both the FDCN and the specific scattered neutron energy spectrum. Given the lower weighting of the dose contribution from neutrons below 0.1 MeV and their rapid moderation to even lower energies in polyethylene, setting this as the cut-off energy is justified.
Figure 2.
Fluence to Dose Conversion Factors for Neutrons (ICRP, 1997).
To accurately quantify the transport behavior and scattering effects of fast neutrons in shielding materials, a neutron scattering model was developed based on Geant4 v11.3.2. As illustrated in Figure 3, the simulation system comprises a beam-like neutron source, a polyethylene shielding layer, and a spherical detector array. The density range of standard polyethylene is 0.92–0.98 g/cm3. To simplify estimation and comparison processes, the commonly used density of 0.95 g/cm3 for radiation-shielding polyethylene is selected as the shielding layer specification. This study selected typical isotopic neutron sources as references: the average energy of a common Am-Be neutron source ranges from 4.1 to 4.5 MeV, while that of a 252Cf source ranges from 2.1 to 2.3 MeV, both falling within the fast neutron energy range. To guarantee good generalizability of the model across the fast neutron energy region, the neutron energy for simulation was set to 3.1 MeV, effectively covering the spectral characteristics of these common sources. Polyethylene, a hydrogen-rich material, was chosen as the shielding medium due to its excellent moderating capability for fast neutrons, making it a widely used lightweight shielding material in engineering applications. The detector is arranged around the source with an inner radius of 100 cm and an outer radius of 105 cm, covering a 180° polar angle to record the scattered neutron energy spectrum at different azimuth angles. The physics list QGSP_BERT_HP was employed to accurately describe key nuclear reaction processes, such as elastic scattering, inelastic scattering, and radiation capture.
Figure 3.
Schematic diagram of transmitted and scattered neutrons after a beam-like neutron beam passes through a shielding layer. The central beam represents the transmitted neutrons, while the surrounding components represent the neutrons that have undergone scattering within the shield.
The G4Track toolkit was employed to record the energy information of neutrons. In the simulations, neutrons with an initial energy of 3.1 MeV were defined as transmitted neutrons and counted for subsequent analysis. Secondary neutrons with energies below 3.1 MeV were classified as the scattered component; these were also counted, with particular focus placed on analyzing the influence of their energy spectrum distribution. To statistically evaluate the spectral characteristics of the scattered neutrons, shielding thicknesses were set to 2 cm, 10 cm, 20 cm, and 40 cm. For each thickness, a total of 1 × 10⁸ source neutrons were simulated. The energy spectrum data were binned at intervals of 0.031 MeV and normalized per unit incident neutron fluence. Simultaneously measure the number of transmitted neutrons, the count of scattered neutrons, and the energy of scattered neutrons.
To validate the model’s effectiveness, the statistically obtained transmitted neutron counts were fitted using an exponential decay model to estimate the macroscopic cross-section, which was then compared with the evaluated cross-section data. For polyethylene thicknesses of 15, 20, and 40 cm, the estimated macroscopic neutron cross-sections were approximately 0.289, 0.284, and 0.277 cm−1, respectively, decreasing gradually with increasing thickness. Since the IAEA database lacks neutron cross-section data for polyethylene, the cross-sections for its constituent elements were consulted: the neutron cross-section for H at 3.1 MeV is 2.28 barn, and for C at 3.1 MeV is 1.58 barn. The macroscopic neutron cross-section for polyethylene with a density of 0.95 g/cm3 is 0.250 cm−1. The exponential decay model estimates a neutron macroscopic cross-section with an error of approximately 10.8%. The error may stem from the overly idealized nature of the exponential decay model. It relies on critical assumptions: uniform and infinitely large materials, monochromatic unidirectional neutron incidence, and the occurrence of only single scattering or absorption events without secondary particle generation. Actual neutron transport processes are far more complex. GEANT4 employs Monte Carlo methods to track numerous neutrons, thereby more accurately reflecting these intricate interactions. Deviations between estimated cross-sections and those calculated from the IAEA database are inevitable. However, as the polyethylene thickness increases, the cross-section values estimated using the decay index model gradually decrease and approach the theoretical value of 0.250 cm−1. Therefore, this model is considered applicable. Subsequent analyses employ authoritative macroscopic cross-section values calculated from IAEA data to more accurately reflect the objective neutron attenuation conditions.
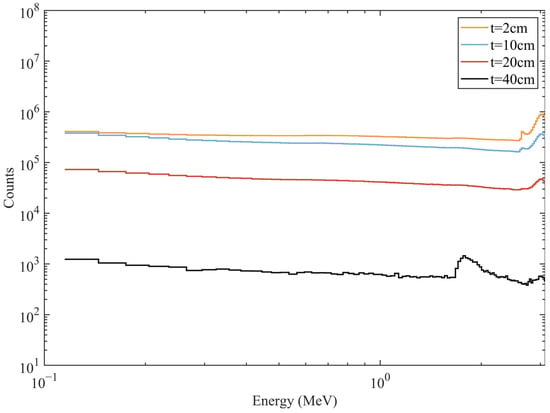
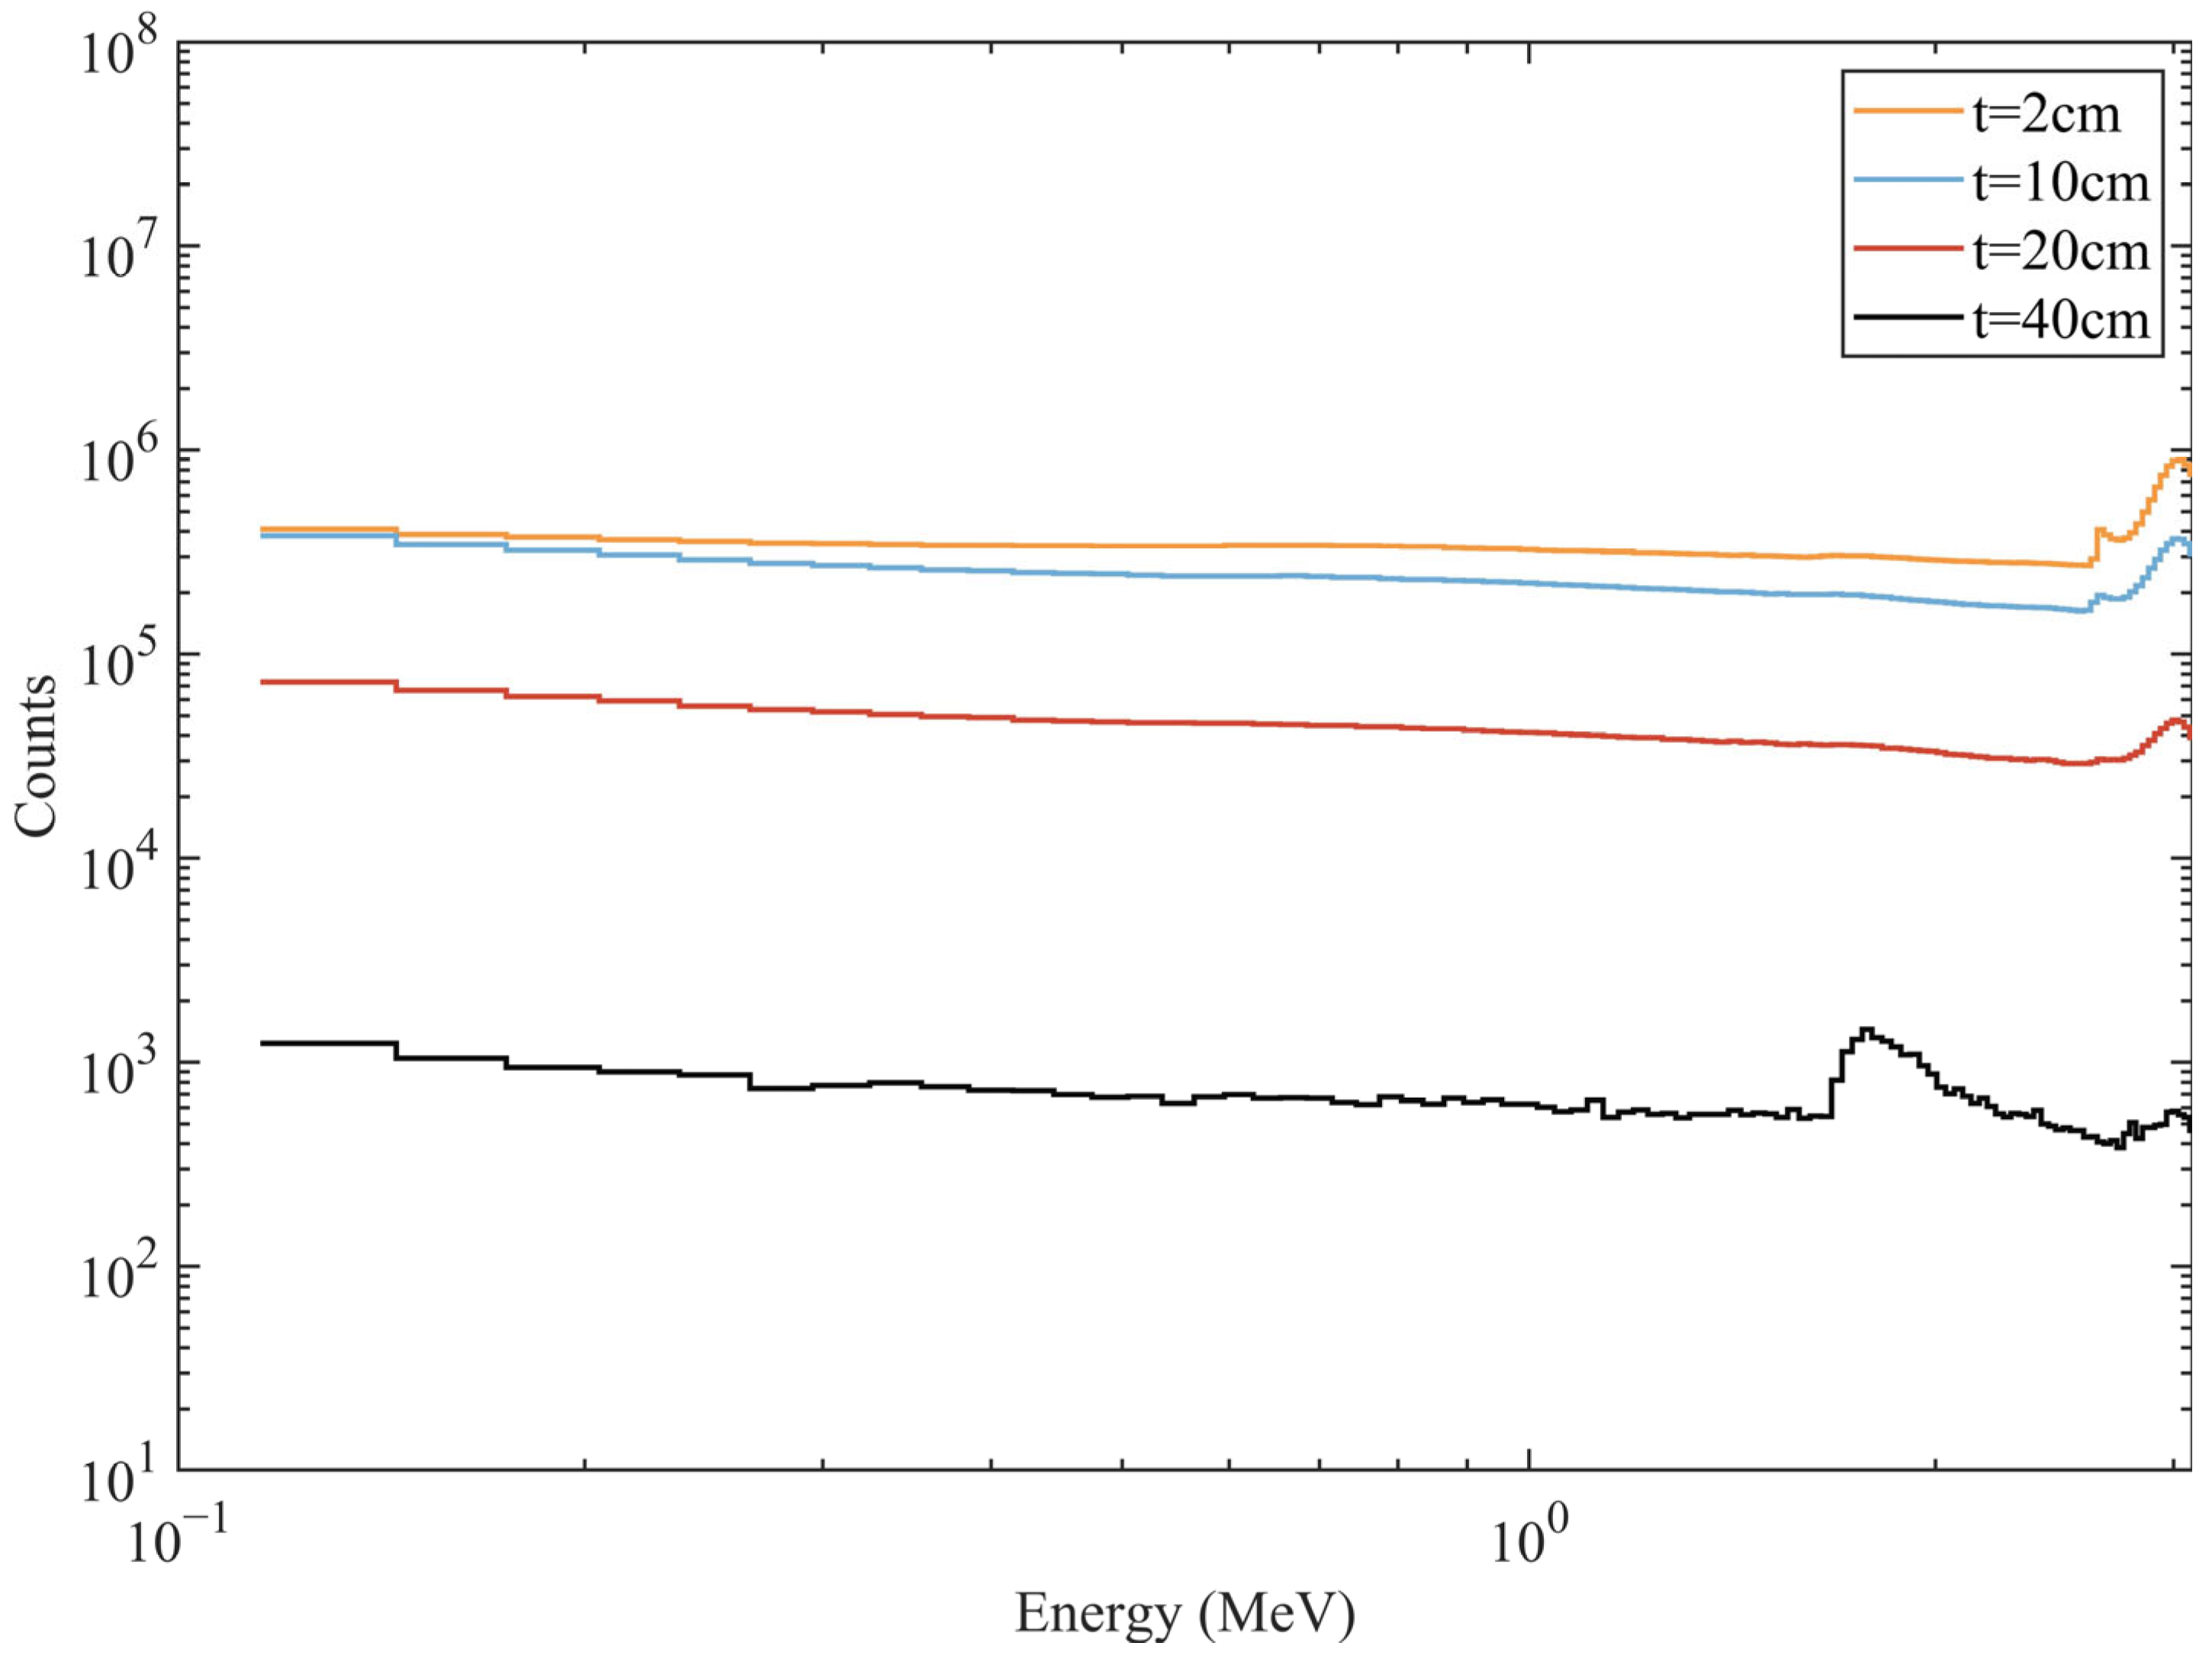
As shown in the energy spectrum distribution of scattered neutrons in Figure 4, within the energy range of 0.1 MeV to 3 MeV, the distribution of scattered neutron counts is relatively uniform with respect to energy. All four spectral lines exhibit approximately flat characteristics across this interval. The total count of scattered neutrons decreases significantly as the shielding thickness increases from 2 cm to 40 cm. Further observation reveals that with increasing shield thickness, the relative contribution of neutrons within the 0.1–2.5 MeV energy region rises. Nevertheless, the overall energy spectrum maintains a homogeneous distribution. This uniform characteristic indicates that setting the lower analytical energy cutoff to 0.1 MeV does not alter the assessment of the overall shape of the scattered neutron energy spectrum.
Figure 4.
Neutron Energy Spectrum After Shielding. The spectra illustrate the energy distribution of scattered neutrons after passing through polyethylene layers of varying thicknesses: 2 cm (orange), 10 cm (blue), 20 cm (red), and 40 cm (black).
2.2. Estimation of Forward-Scattered Neutron Counts in Bundle Models
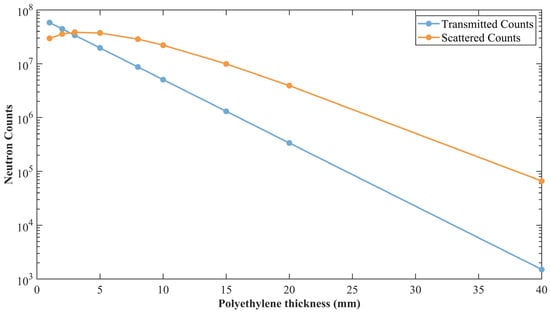
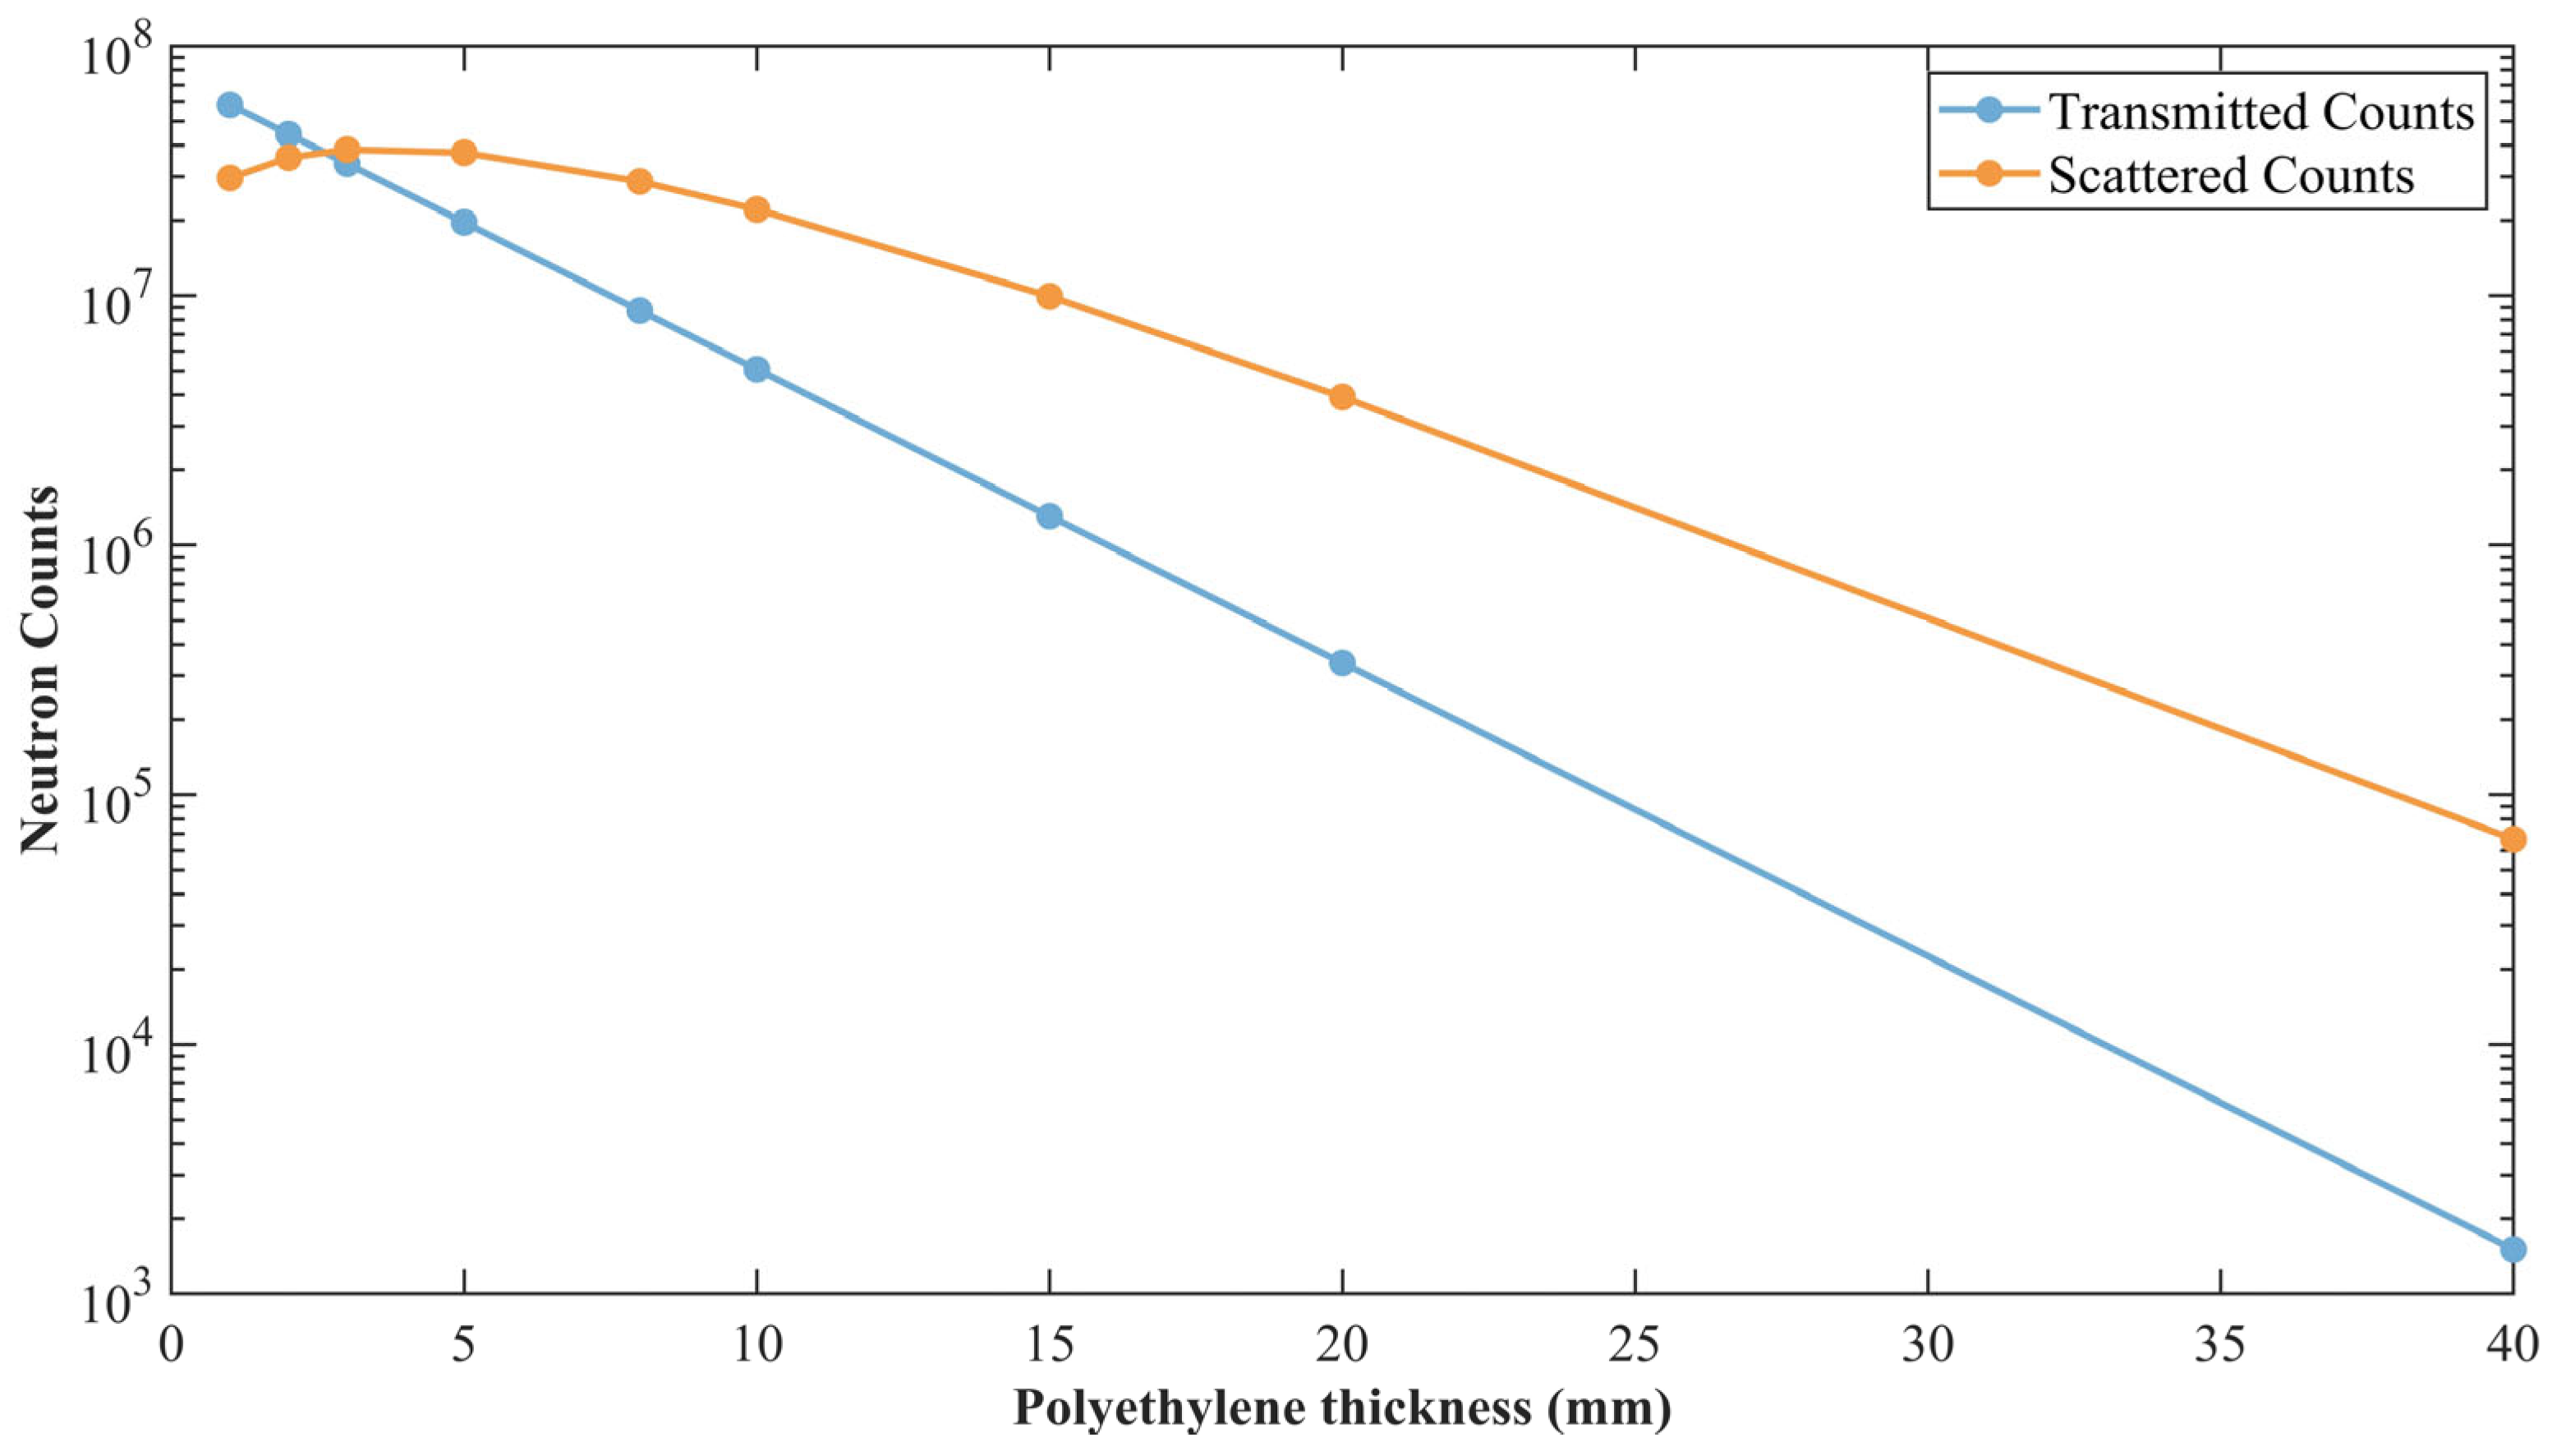
An isotropic neutron source can be regarded as multiple beam-like neutron sources oriented in different directions. To analyze the scattered neutrons from an isotropic neutron source, it is necessary to first analyze the scattering from beam-like neutron sources. Assuming that the vast majority of scattered neutrons in the beam model undergo forward scattering, the neutrons scattered backward can be considered negligible relative to the absorbed neutrons. The analysis results for transmitted neutrons and forward-scattered neutron counts in the bundle model are shown in Figure 5. The transmitted neutron flux decreases exponentially with increasing shield thickness t(cm), which is consistent with the classical attenuation law. In contrast, the number of scattered neutrons exhibits a non-monotonic trend with thickness: in the thin-shield regime, the scattering count increases with thickness due to the higher probability of neutrons undergoing multiple collisions with hydrogen nuclei. As the thickness increases further, neutron energy is gradually moderated to levels below the cut-off energy or absorbed, causing the scattered flux to decrease subsequently and forming a unimodal distribution characterized by an initial increase followed by a decrease.
Figure 5.
Scatter and transmission counts. Scattered and transmitted neutron counts on the detection plane after the neutron beam passes through shielding layers of different thicknesses.
To analyze scattered neutrons in a beam model, we need to determine the number of neutrons scattered forward when a neutron beam passes through a shielding layer. The number of forward scattered neutrons Ns(t) can be obtained by subtracting the number of absorbed neutrons Na(t) from the number of neutrons that did not transmit through the shielding layer, I0 − Nt(t).
Meanwhile, Nt(t) and Na(t) can be calculated from the macroscopic neutron cross-section and the macroscopic neutron absorption cross-section .
Therefore, the number of scattered neutrons can be calculated as
Since the cannot be found in the IAEA database, the number of forward scattered neutrons cannot be directly calculated when addressing scattering problems in practice. Therefore, we instead seek the relationship between the number of forward scattered neutrons and the number of transmitted neutrons within the beam model to calculate the number of scattered neutrons.
To quantify the relative relationship between scattering and transmission, the scattering-to-transmission ratio s(t) is defined as Ns(t)/Nt(t),
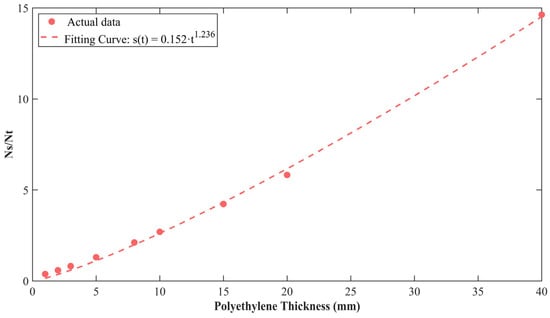
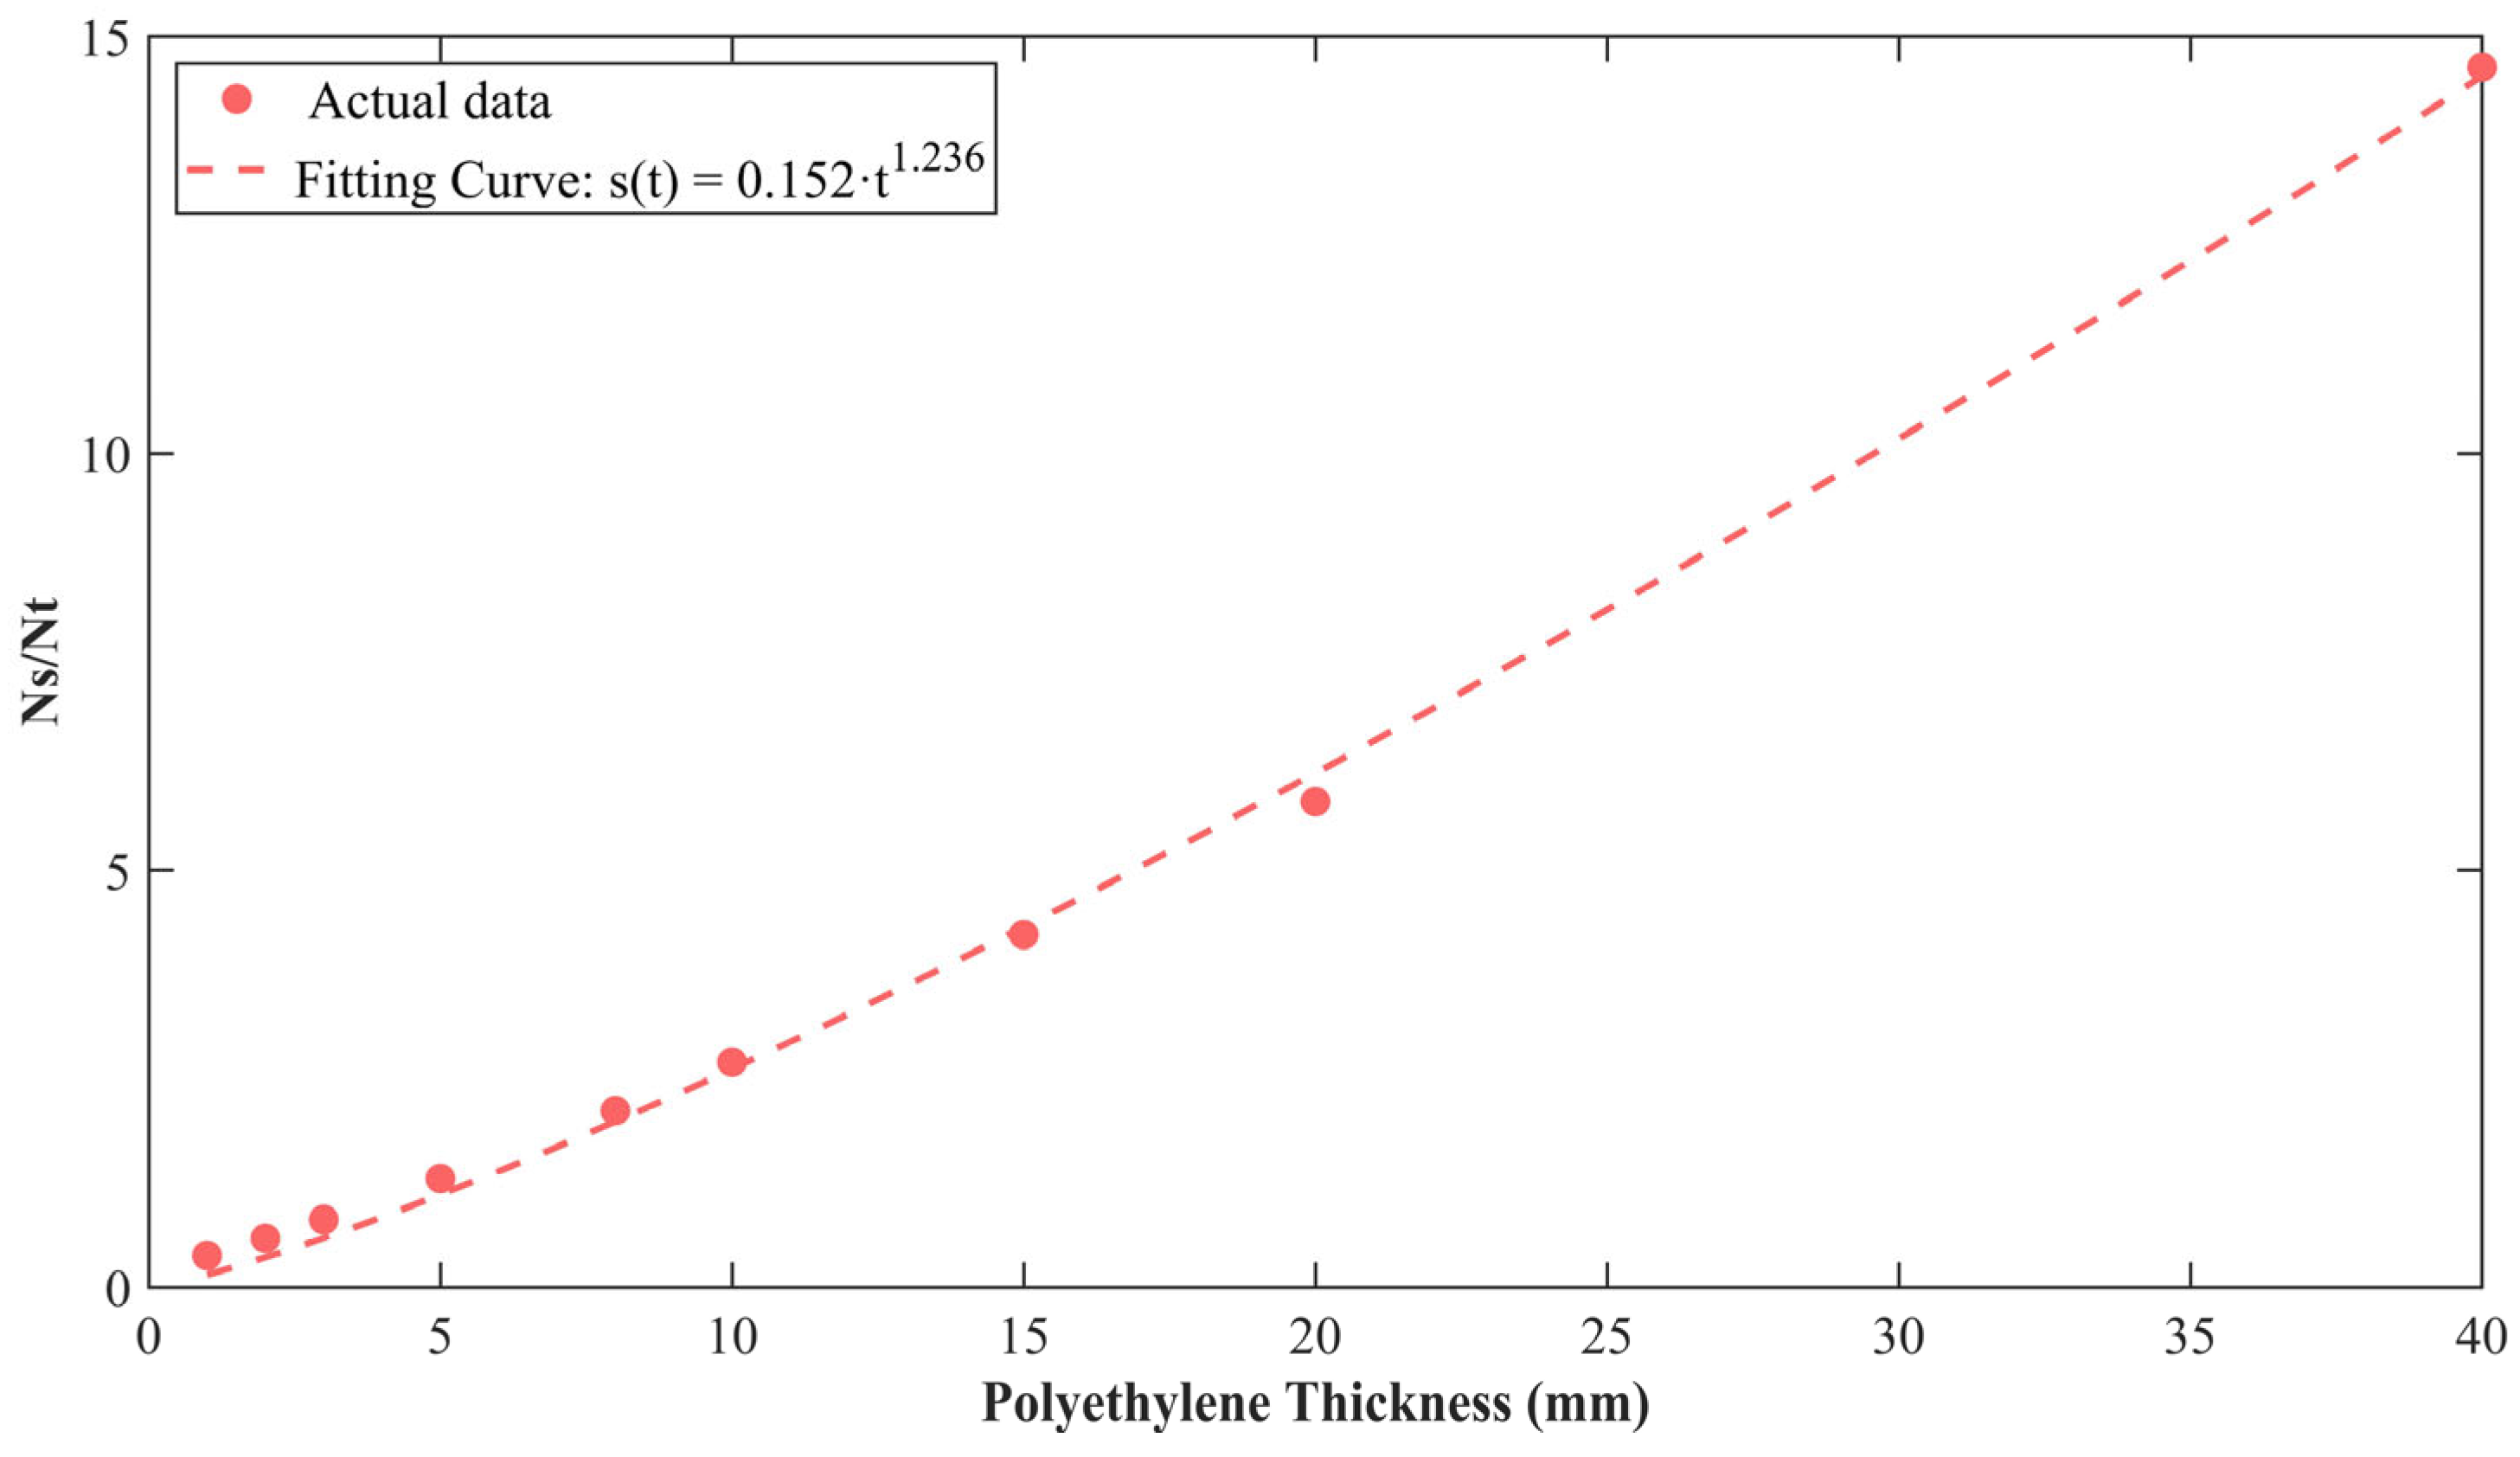
where Ns(t) and Nt(t) represent the numbers of scattered and transmitted neutrons, respectively. The s(t) serves as a key parameter for guiding shielding design, with a notable characteristic: when the shield thickness is zero, the scattered neutron count also becomes zero. Power functions inherently pass through the origin and possess only two parameters, offering a natural advantage for fitting under these conditions. The ratio is calculated between the scattered neutron count Ns(t) obtained from the beam model and the transmitted neutron count Nt(t) estimated using the macroscopic cross-section 0.25. A power function fit is then applied to this ratio to derive s(t). Figure 6 displays s(t) and its fitted curve, with the fitting function obtained via least squares regression:
s(t) = Ns(t)/Nt(t),
Figure 6.
Ratio of scattered neutron counts to estimated transmitted counts.
The calculated goodness-of-fit coefficient R2 = 0.9978 indicates that this function accurately describes the variation in the scatter-to-transmission ratio with thickness. The calculated results demonstrate that when the polyethylene thickness exceeds 18 cm, the total number of forward scattered neutrons already surpasses that of transmitted neutrons by more than fivefold. At a thickness of 40 cm, s(t) reaches approximately 14. This finding clearly indicates that for larger shield thicknesses, the contribution of scattered neutrons significantly exceeds that of transmitted neutrons. If shielding design were to rely solely on the exponential attenuation model for transmitted neutrons, the total neutron flux would be severely underestimated, thereby compromising the accuracy of the shielding effectiveness assessment.
The number of neutrons scattered forward from a beam-like neutron source, when statistically quantified, effectively reflects the quantity of forward-scattered neutrons per unit beam from an isotropic neutron source. Therefore, determining the proportion of forward-scattered neutrons produced by the beam- like neutron source is crucial for subsequent analysis of the scattering trajectories in isotropic neutron sources.
2.3. Scattering Correction Method for Isotropic Sources
The traditional method for scattering correction involves introducing the neutron build-up factor (Bn), which is defined as the ratio of the total neutron flux to the uncollided (direct) neutron flux, as expressed in Equation (8) [22]:
where Bn represents the neutron build-up factor, a dimensionless quantity; denotes the total neutron flux at a specific location, accounting for both directly transmitted and all scattered neutrons (n·cm−2·s−1); and signifies the transmitted neutron flux, which includes only neutrons that have reached the point without undergoing any scattering interactions (n·cm−2·s−1).
The Bn is introduced to empirically compensate for the contribution of scattered neutrons to the total dose. This approach partially mitigates the issue of neutron flux underestimation inherent in the traditional pure exponential attenuation model during practical shielding calculations. However, the determination of the Bn currently depends primarily on parameters such as the composition and thickness of the shielding material, as well as the energy of the incident neutrons. A systematic analysis of the Bn adapted to various geometric configurations remains lacking.
Therefore, we decompose each isotropic neutron source into multiple directional beam-like neutron sources for analysis:
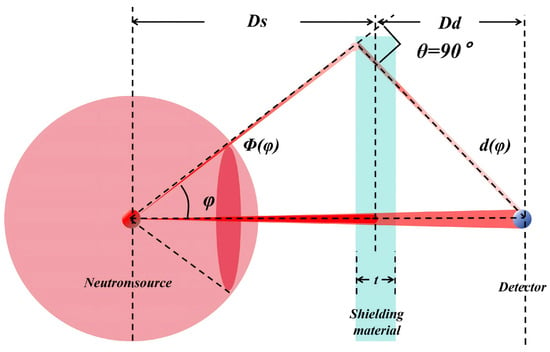
As shown in Figure 7, the simplified analytical model focuses on a single cross-section to streamline the analysis process. A neutron source located on the left, emitting a neutron beam confined within a unit solid angle, can be treated as a beam-like source. The distance from the source to the center of the polyethylene shielding layer of thickness t is denoted as Ds, and the distance from the center of the shielding layer to the center of a small spherical detector with a cross-sectional area of 1 cm2 is denoted as Dd. Given a total neutron flux of , the flux of a unit neutron beam with an initial emission direction at an angle relative to the detector direction is designated as . After being scattered within the shielding layer, this neutron beam is deflected by a polar angle and subsequently reaches the detector. The distance from the source to the detector is denoted as r, satisfying the relationship:
Figure 7.
Schematic of scattering analysis.
In practical scenarios, when fast neutrons collide with hydrogen nuclei in polyethylene, the significant mass proximity between the neutron and the proton leads to a strong preference for forward scattering of high-energy components in the laboratory coordinate system. For configurations where the source-detector distance is much greater than the shield thickness (Ds >> t), the incident neutron beam exhibits high collimation. Under this condition, the attenuation discrepancy arising from path length differences can be considered a higher-order infinitesimal and thus neglected. Under this approximation, to simplify the calculation, we consider only the dominant forward scattering contribution and define the effective solid angle for scattering as 2π. Therefore, the corresponding to polar scattering angles () ranging from 0° to 90°. The solid angle subtended at
Assuming all scattered neutrons undergo only one collision and that the angular distribution of scattering is unaffected by the incident angle of the shielding layer, we analyze the neutron beam with an initial emission angle relative to the detector direction. The total number of scattered neutrons after the beam passes through a shielding layer of thickness t can be expressed as:
The detector sphere has a cross-sectional area of 1 cm2. It can be regarded as a unit on a hemispherical shell of radius r. The undergoes a deflection angle , and the average number of neutrons scattered onto the detector can be expressed as:
At this point, the unit solid angle of neutron beam corresponds to a solid angle with a cross-sectional area of 1 cm2 at a distance r from the source. Below, we determine how many sets of neutron beams emitted from the source satisfy the condition of reaching the detector after scattering.
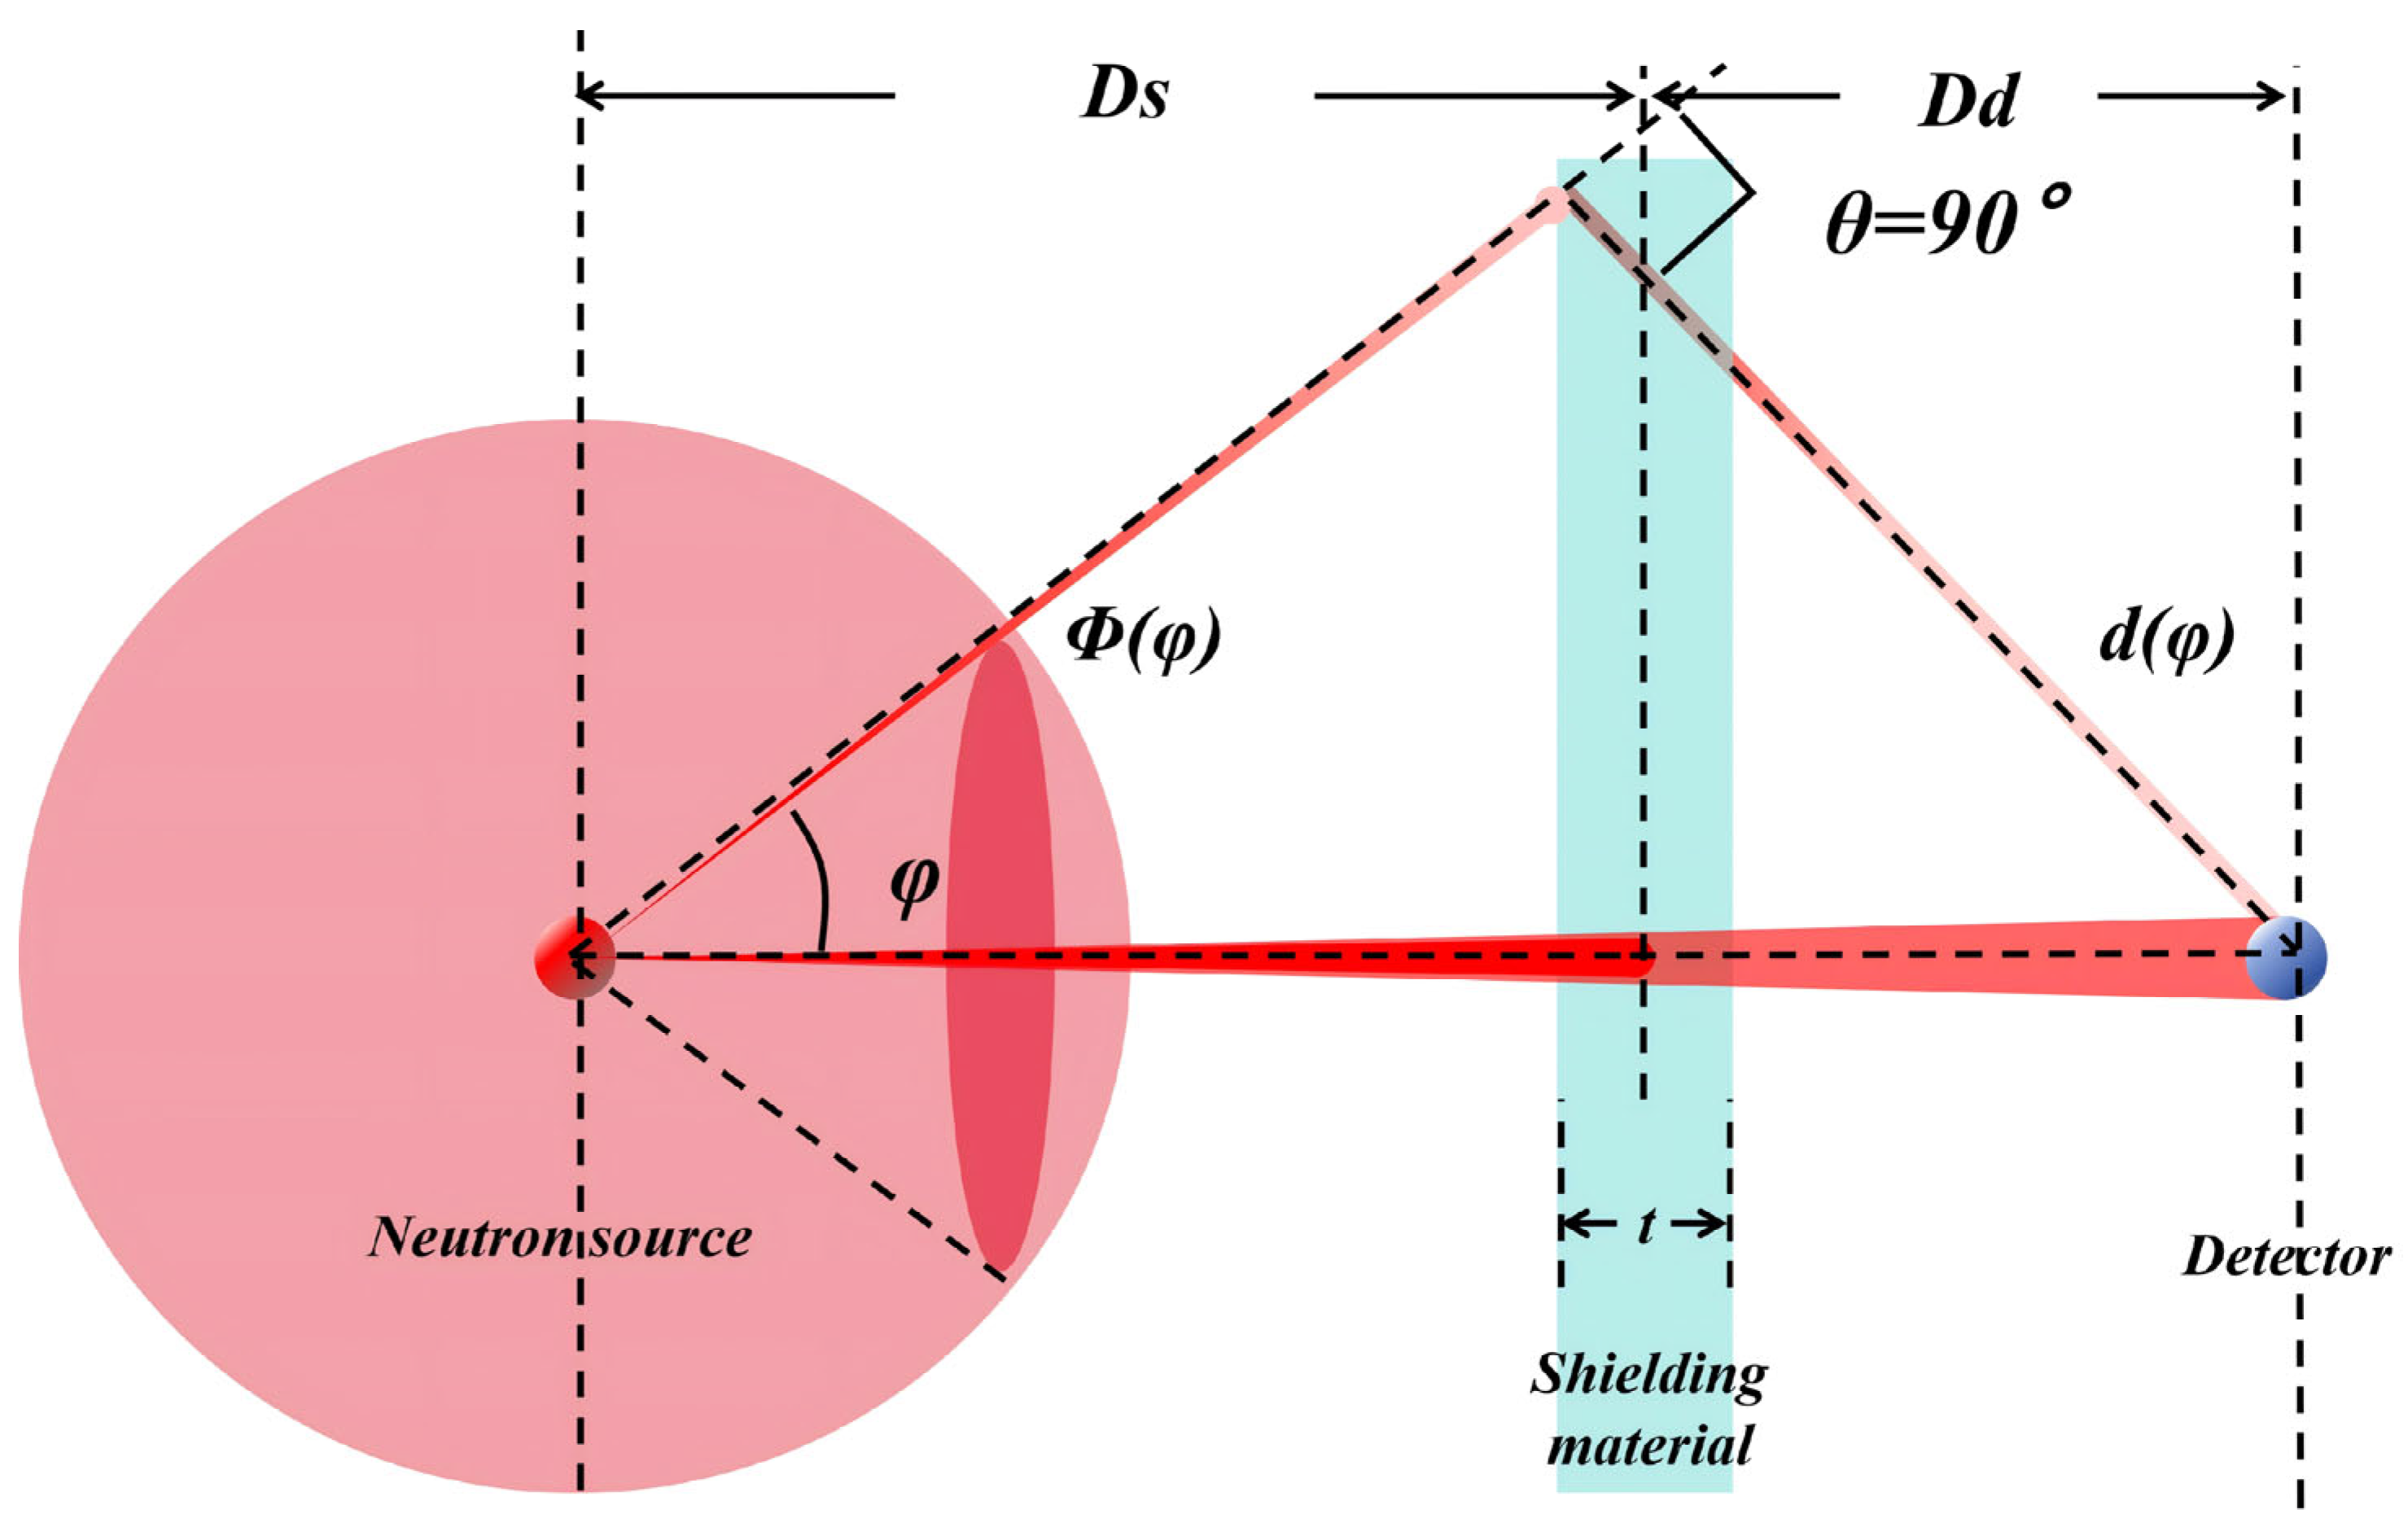
As shown in Figure 8, we assume neutron forward scattering is effective, so the boundary condition for neutron energy scattering to the detector is = 90°. At this point, only the neutron flux within the cone angle emitted by the source satisfies the condition of being detected by the detector after scattering. The average number of neutrons detected by the detector after scattering for each angle is .
Figure 8.
Boundary conditions when = 90°.
The total number of neutron beams capable of scattering is calculated as:
Sum all , The total number of scattered neutrons sr received by a detector sphere with a cross-sectional area of 1 cm2 placed at a distance r from the source can be calculated. Its expression is:
Building upon this, by further considering the contribution of transmitted neutrons to the flux per unit cross-sectional area of the detection spheres, one can obtain an estimated value for the scattered neutron flux received by each sphere under point source conditions.
In practical applications, as long as the lateral scale of the shielding layer is significantly larger than the average free path of neutrons within it, the half-width of the shielding layer can be considered infinite. At the boundary condition = 90°, the trajectories of scattered and transmitted neutrons form a right-angled triangle. At this point, can be expressed in terms of the geometric parameters Ds, Dd, and t.
Therefore, Equation (15) can be rewritten as:
Rewritten in the form of a cumulative factor, the final expression is as follows:
2.4. GEANT4 Simulation Verification Method
In contrast to a beam-like source, the shielding model was reconstructed for an isotropic neutron source, as illustrated in Figure 1. To enhance the statistical significance of the simulation results, 1 × 10⁹ source neutrons were tracked for each geometric configuration. However, due to computational resource constraints, a comprehensive analysis of all possible geometric combinations was practically infeasible. Consequently, 70 representative cases were selected for experimental validation. The shielding material was polyethylene, with thicknesses (t) set sequentially to 2 cm, 5 cm, 8 cm, 10 cm, and 20 cm. For each thickness, 14 distinct geometric settings were configured: the neutron source was positioned at 50 cm, 20 cm, t, and 0.5 t + 0.1 cm to the left of the shield center; correspondingly, a spherical sensitive region with a cross-sectional area of 1 cm2 was placed at 50 cm, 20 cm, t, and 0.5 × t + 0.6 cm to the right of the shield center to record transmitted neutron information. This includes certain extreme geometric conditions that do not satisfy Ds >> t and Dd >> t, serving to validate the model’s applicability under extreme scenarios. Neutron transport processes were tracked using the G4Track toolkit, with a cut-off energy of 0.1 MeV. The final neutron flux within the sensitive region was statistically analyzed. Detailed shield layer configurations are provided in the Table A1 below.
To evaluate the predictive capabilities of the two models, a comparative analysis was performed using GEANT4 simulation data as the benchmark. For the quantitative assessment of flux values, the Mean Absolute Percentage Error (MAPE) was employed as the primary metric, owing to the multi-order-of-magnitude span in the GEANT4 data, which makes relative error metrics more appropriate than absolute ones. Furthermore, the accuracy of the estimated Bn was comprehensively assessed against the simulated data using a set of five distinct performance indicators: the Mean Absolute Error (MAE), Mean Squared Error (MSE), Root Mean Squared Error (RMSE), MAPE, and the Coefficient of Determination (R2). The computational formulas for these five metrics are provided below:
3. Results and Discussion
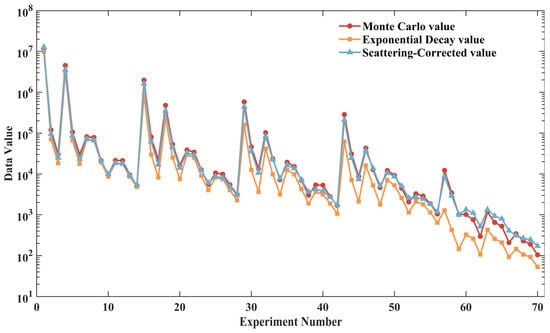
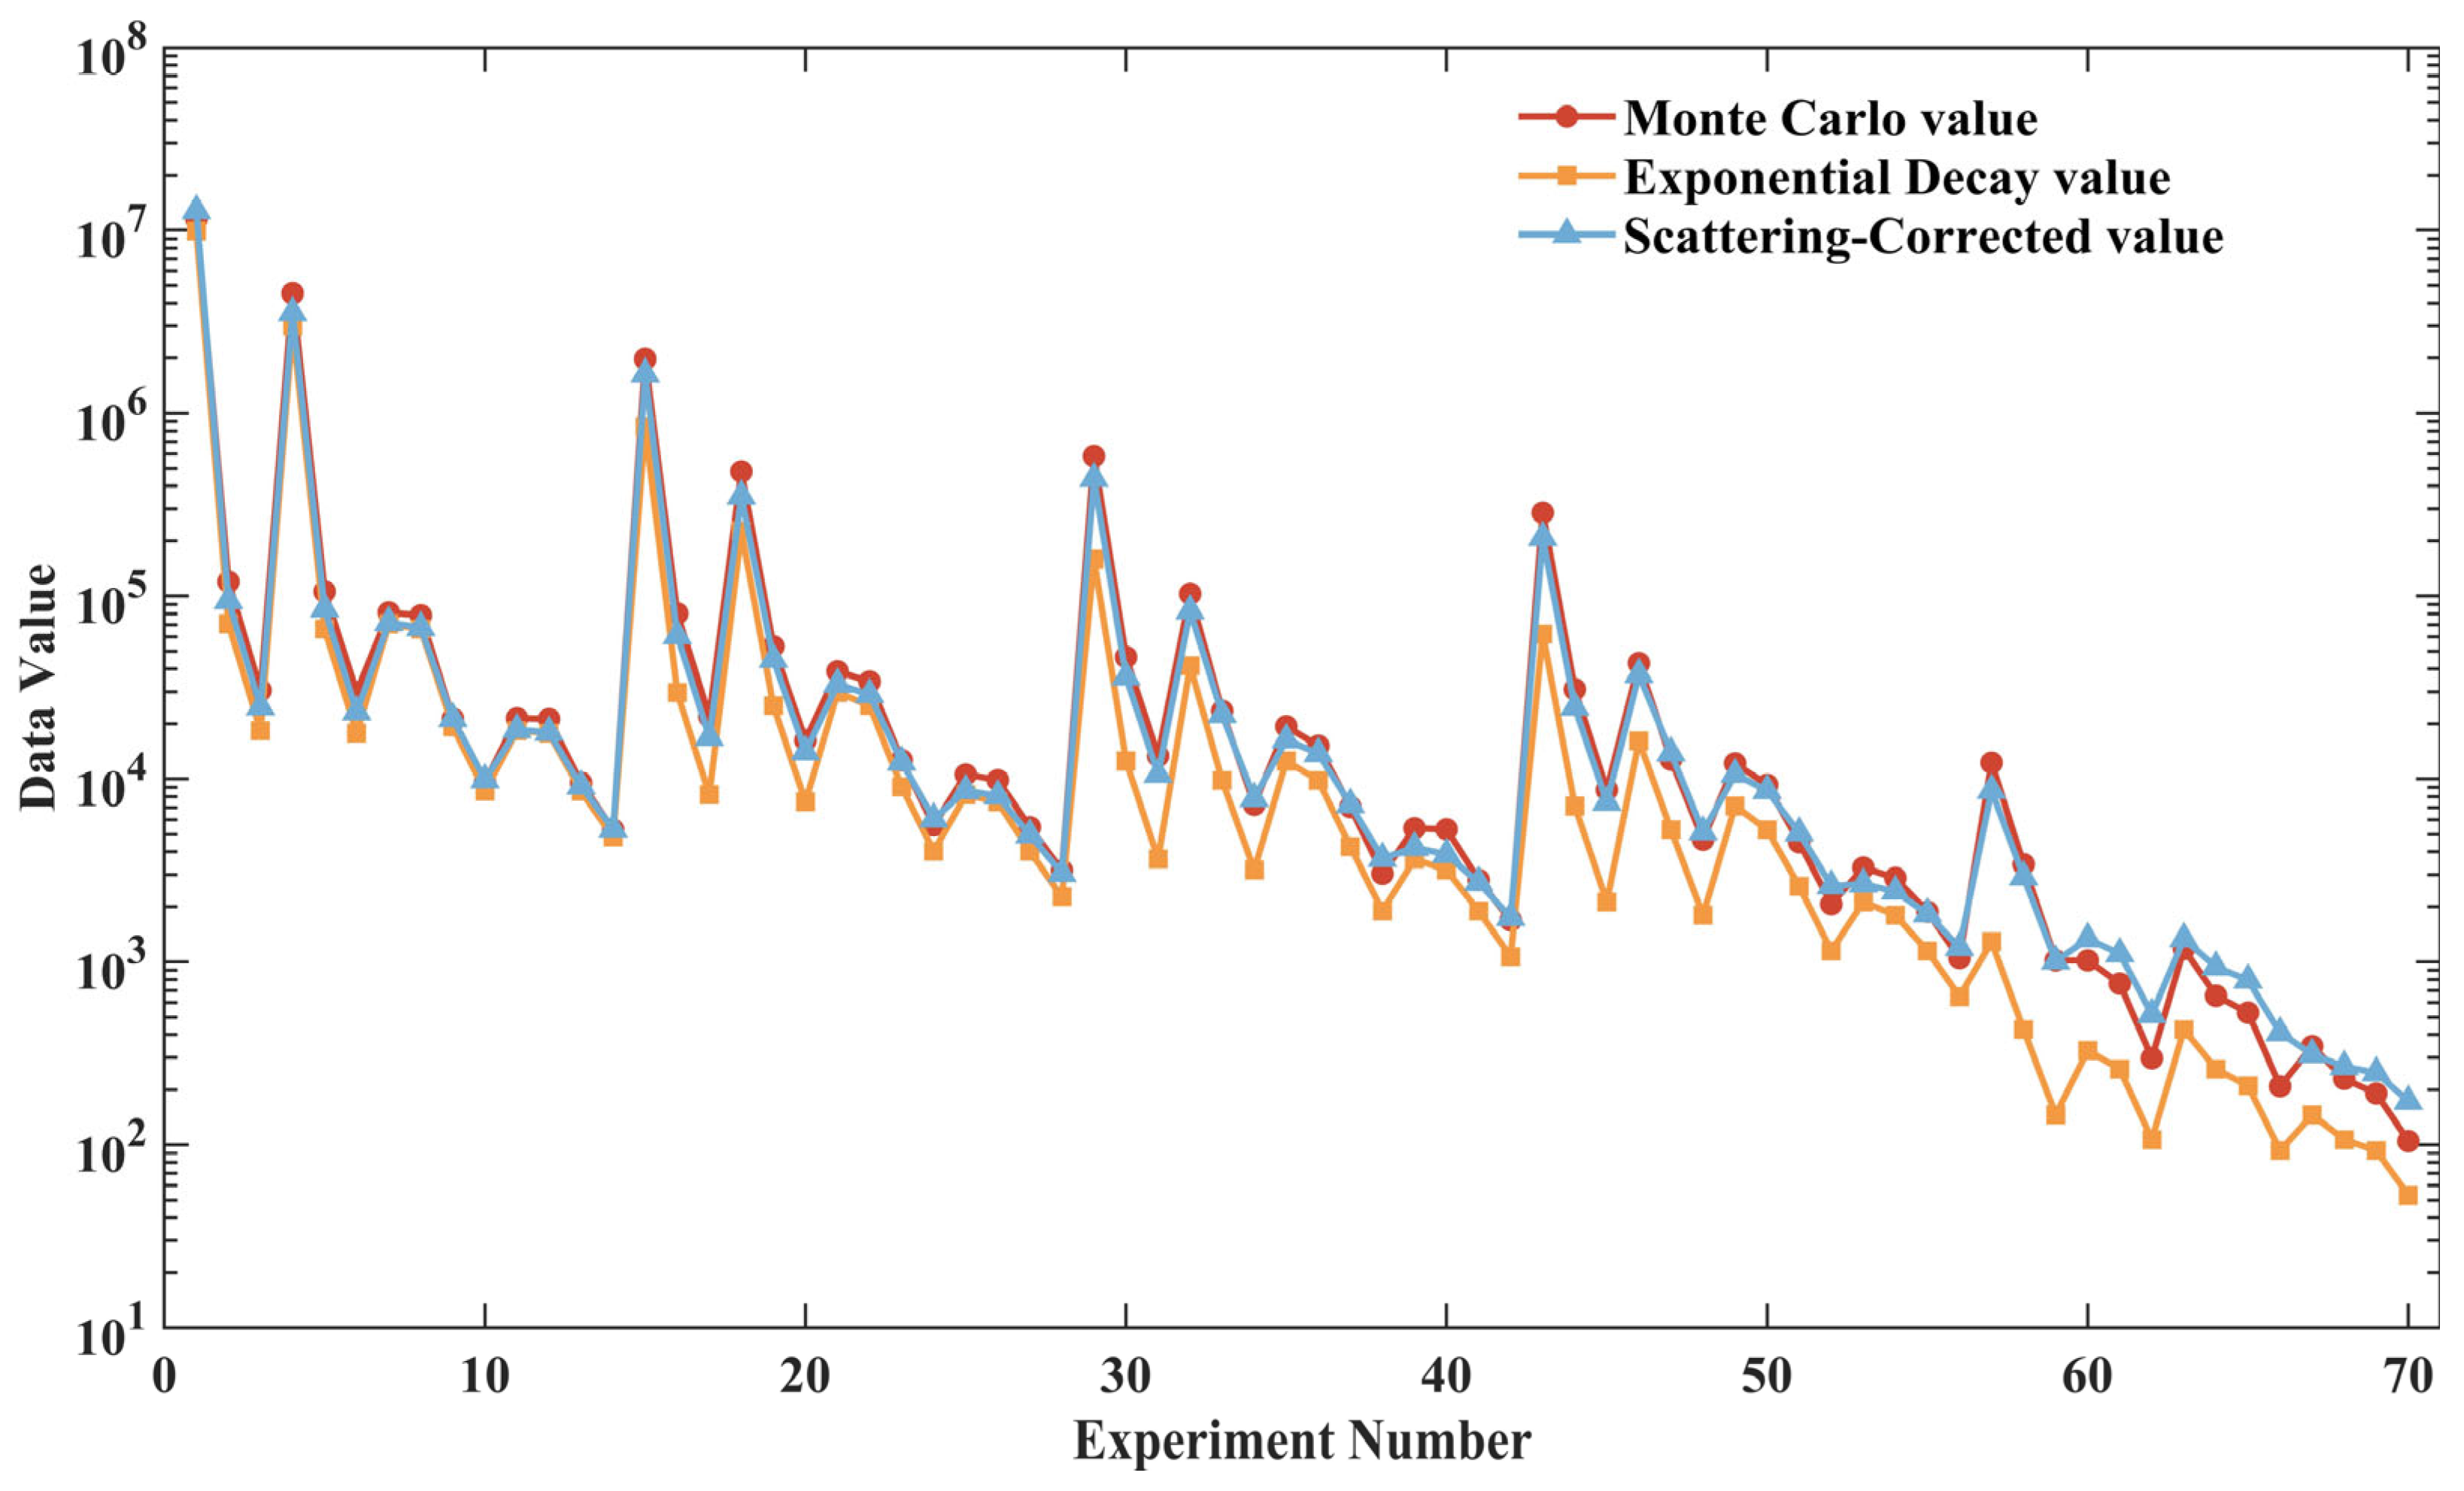
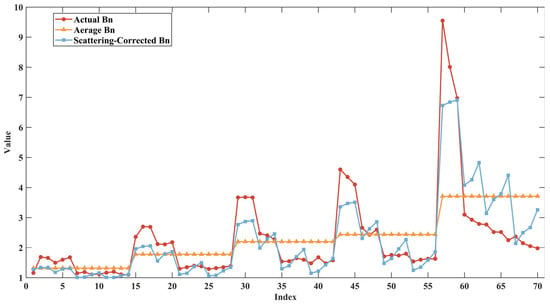
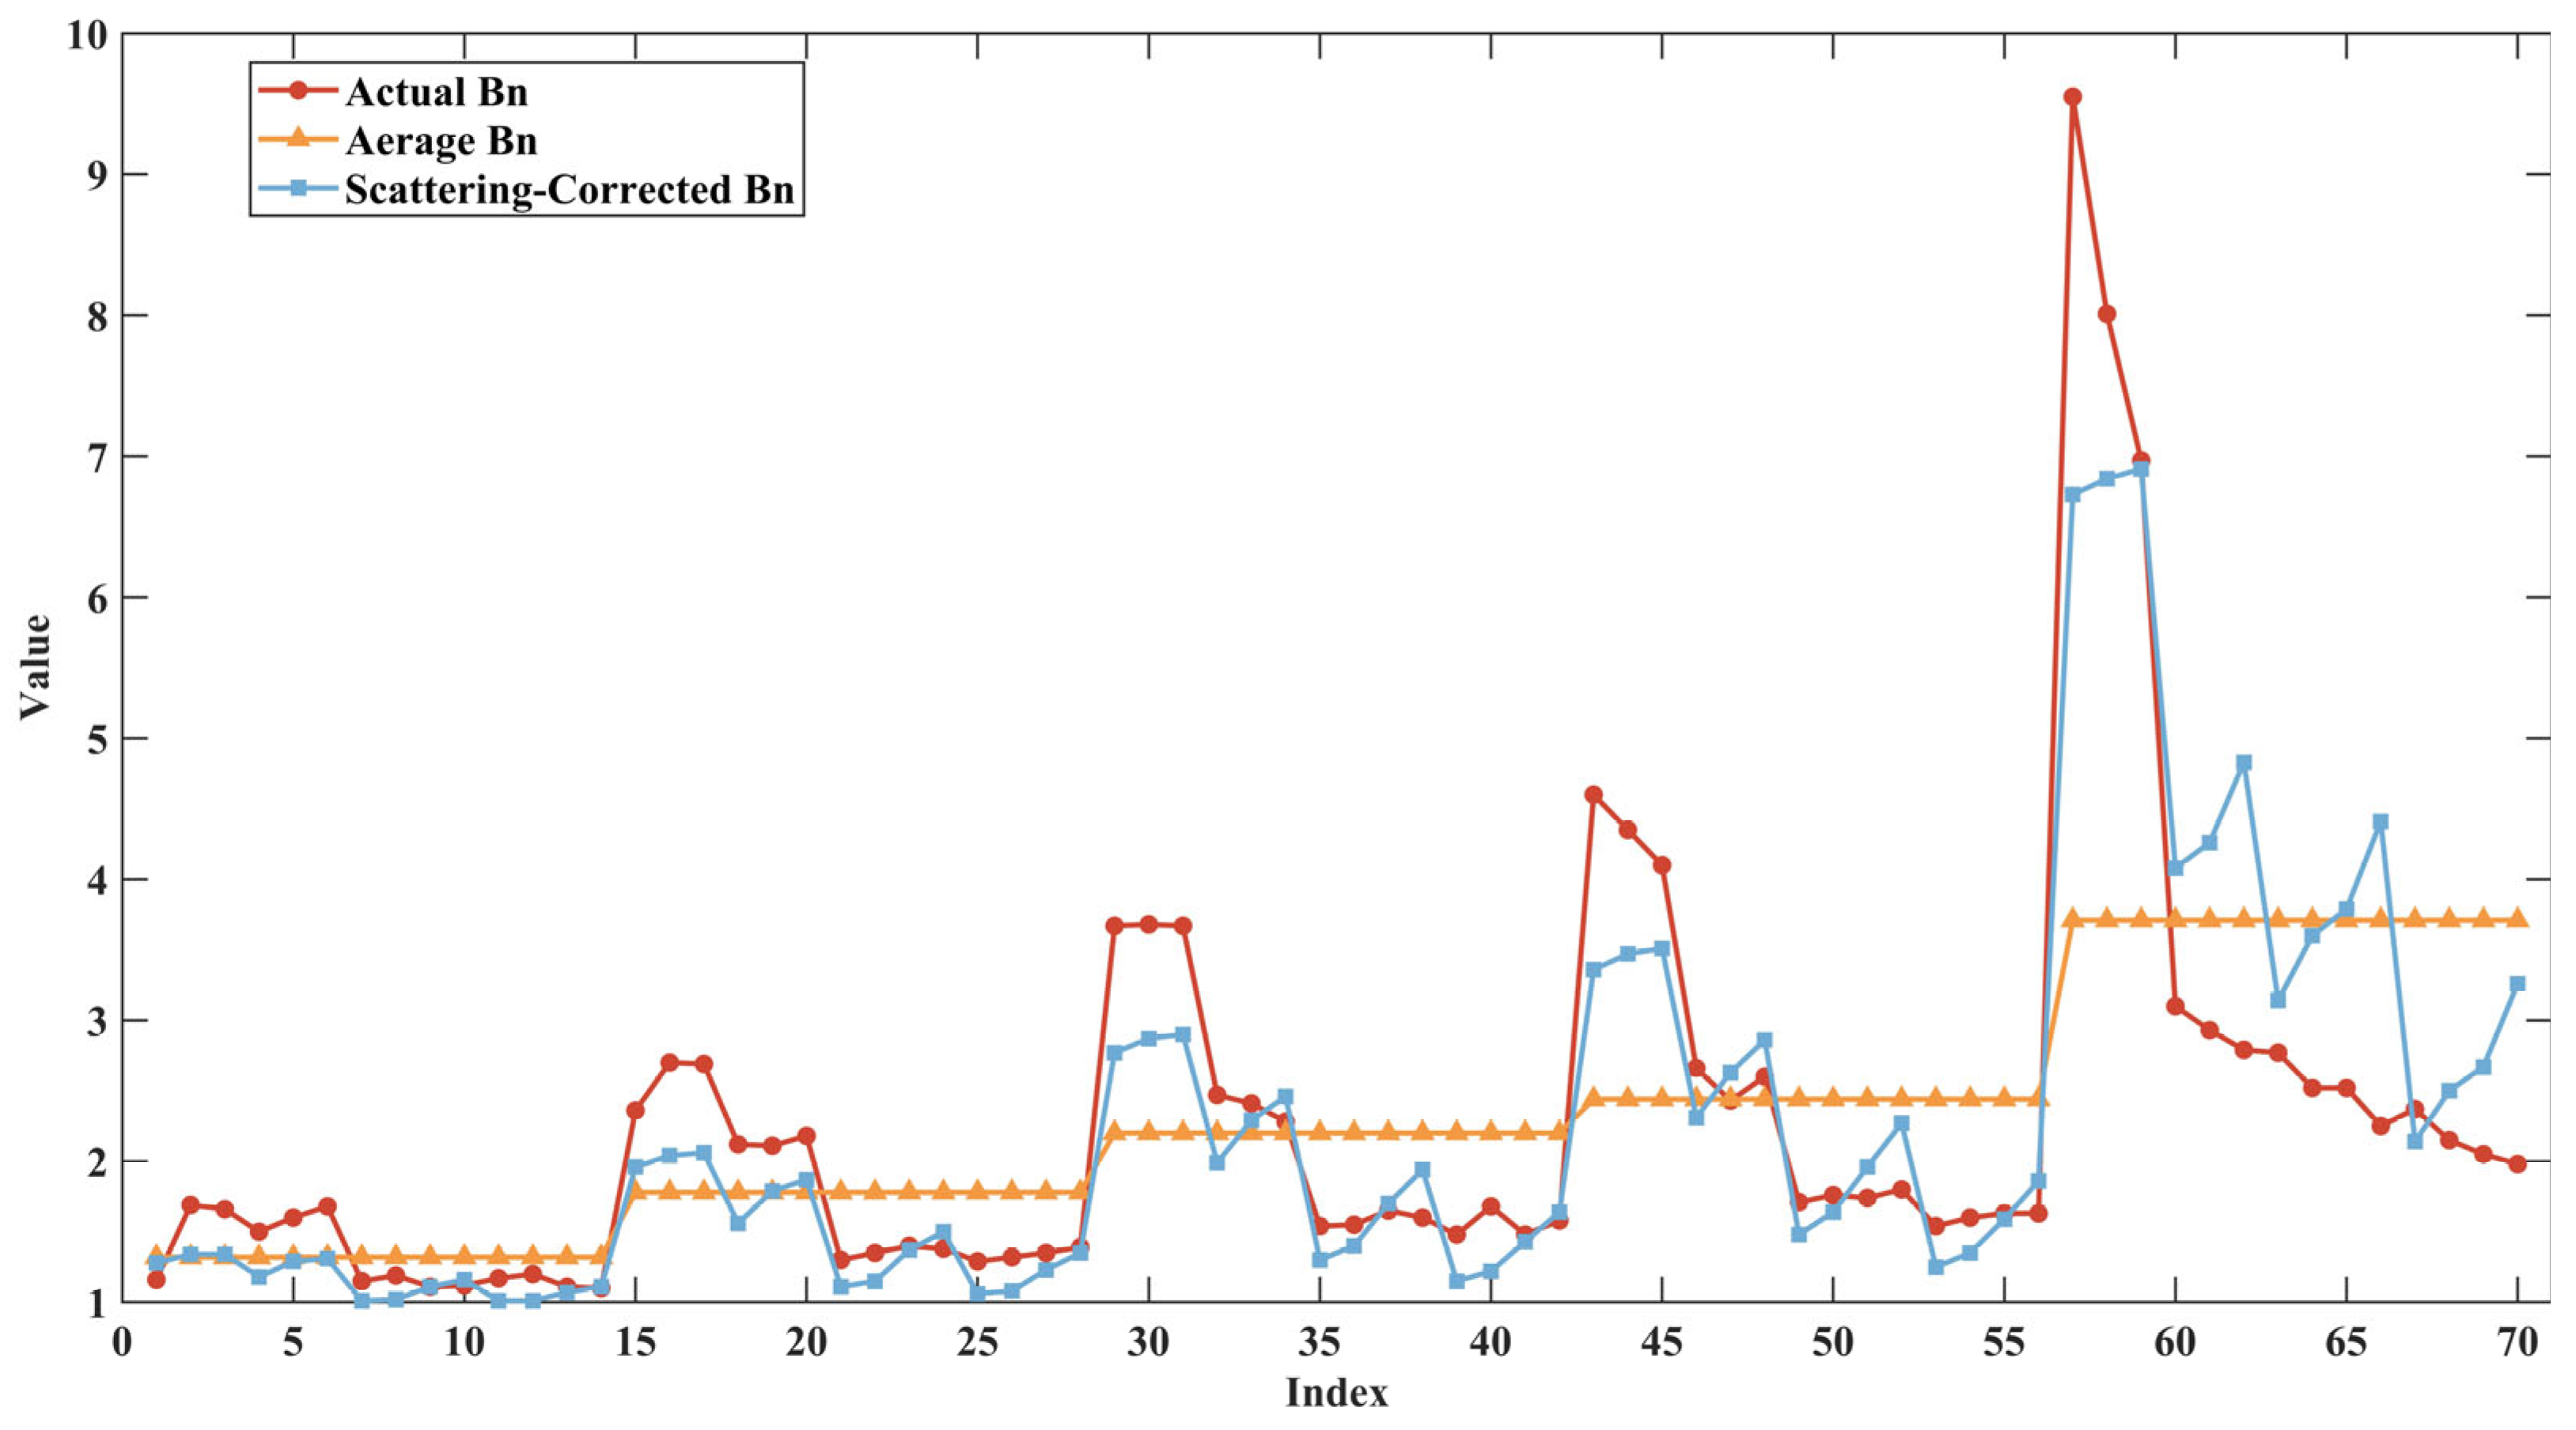
Substituting the aforementioned data into the scatter correction estimation model, the final counts and Bn are obtained as shown in Figure 9 and Figure 10:
Figure 9.
Comparison of Three Neutron Shielding Calculation Results.
Figure 10.
Comparison of Values Obtained from Three Calculation Methods.
3.1. Comparative Discussion of Two Methods
Both models demonstrate satisfactory accuracy at small shielding thicknesses. However, when the shielding thickness exceeds 5 cm (corresponding to the 15th dataset onward), the exponential attenuation model exhibits significant errors that increase progressively with greater thickness. In contrast, the SC model incorporates a comprehensive parametric combination including macroscopic cross-section, source-detector distance, shielding thickness, and detector position. This approach reveals a marked improvement in universality compared to the conventional model. The calculated MAPE values are summarized in Table 1.
Table 1.
Comparison of MAPE Between Exponential Decay Value and Scattering-Corrected Value.
Quantitative analysis demonstrates that the SC model derived in this study exhibits superior accuracy during testing. Under thin shielding conditions (t = 2 cm), the MAPE of the traditional exponential attenuation model reaches 22%, whereas the SC model significantly reduces the MAPE to 13%, representing an improvement of approximately 9%. As the shielding thickness increases, the MAPE of the traditional exponential attenuation model rises markedly, while the predictive accuracy of the correction model shows more substantial enhancement, fully validating its effective compensation for scattering effects.
Error statistics further reveal that the average error of the traditional exponential attenuation model across the entire dataset is approximately 45%, compared to about 19% for the SC model. This systematic improvement in accuracy confirms the theoretical soundness of the corrective terms. Notably, as shielding thickness increases, the deviation of the traditional model—resulting from its neglect of multiple scattering effects—becomes increasingly pronounced. In contrast, the correction model effectively mitigates errors through scattering compensation, demonstrating a more accurate characterization of radiation transport behavior under broad-beam conditions.
However, the model exhibits deviations from the simulated results in localized regions with larger shield thicknesses, a phenomenon attributable to the thin-shield approximation error. This overestimation likely occurs because, in practical thick shielding scenarios, the actual path length of neutrons undergoing multiple scattering within the material is significantly longer than a direct linear path, leading to greater absorption losses. Despite this, the SC model still demonstrates superior performance compared to models that entirely neglect the Bn.
The SC model can dynamically adjust its predictions based on the geometric configuration, effectively capturing the variation in neutron flux with different setups. Nevertheless, it also exhibits a notable parameter dependence: under conditions where the source-detector distance is small and the shield thickness is comparable to the detector distance, the predicted values tend to be overestimated, with localized relative errors potentially exceeding 30%. In contrast, the model fits well when the source-detector distance is large and the shield thickness is negligible.
3.2. Analysis of Bn Prediction Values
Further analysis of the Bn reveals that, at constant shielding material thickness, increasing source distance Ds causes the neutron beam incident on the shielding layer to undergo “parallel straightening.” This reduces geometric divergence, leading to an overall decrease in the proportion of effective neutrons captured by the shielding layer and scattered to the detection point. Overall, the real accumulation factor may deviate from the thickness-averaged value by more than ±80%, indicating that the geometric configuration significantly affects the Bn factor and cannot be ignored. Particularly when the shielding layer exceeds 10 cm in thickness, the accumulation factor may deviate from the average value by up to 120% under specific conditions for the same thickness. If a fixed Bn factor is still used for estimation in such cases, it will introduce significant bias.
In terms of predictive capability, the SC model demonstrates a high degree of concordance with the actual observed values across the entire index range. However, significant model deviations occur when the shielding layer thickness violates the thin-shield approximation. For instance, when t = 20, Ds = 10.1, and Dd = 10.1, the thin-shield approximation error, leading to model deviations exceeding 30%. This is particularly evident in groups 15–17, 29–31, 43–45, and 57–59, where the source is positioned too close to the shielding layer, resulting in errors significantly higher than other geometric configurations. This occurs because the distances between the source, shielding layer, and detector are too close. The shielding layer cannot be simply abstracted as a thin layer, and the attenuation caused by path differences cannot be abstracted as higher-order infinitesimals. This introduces additional errors that affect the model’s accuracy. The average Bn value consistently deviates from the actual value. The average value struggles to accurately reflect the dynamic variation in Bn with geometric settings. Therefore, the SC model demonstrates higher fidelity in predicting Bn.
The statistical metrics for Bn are calculated as shown in Table 2. Both models exhibit highly significant statistical relationships with the actual observed values (PValue_Regress < 0.001). However, in terms of specific prediction accuracy, goodness-of-fit, and error control, the two models exhibit distinct differences.
Table 2.
Comparison of Average Bn and Scattering-Corrected Bn Under Identical Statistical Metrics.
The SC model demonstrated low values across key indicators: MAE, MSE, and RMSE. These results indicate not only a small mean absolute deviation between its predicted values and the actual data but also superior control over larger errors, as reflected by the lower MSE and RMSE compared to the exponential attenuation model. The model achieved a MAPE of 18.766%, signifying that, on average, the prediction error accounts for about 18.8% of the actual value.
In contrast, all error metrics for the exponential attenuation model increased substantially. Its MAE, MSE, and RMSE were approximately 1.81 times, 3.20 times, and 1.79 times higher, respectively, than those of the SC model, indicating a significant degradation in accuracy. Crucially, a coefficient of R2 of 0.779 for the SC model shows that it captures over 78% of the flux variation induced by geometric configuration changes. Furthermore, its predictions align closely with the actual values both in magnitude and trend, exhibiting minimal systematic bias. Conversely, the model using the average Bn could only explain about 41% of the variation, and its predictions consistently underestimated the actual values. These results validate the exceptional performance of the scattering correction term in resolving geometric dependencies.
The remaining unexplained error in the SC model stems from the thin-shield approximation fails, resulting in estimated Bn values that are smaller than actual values. This leads to 22% of the data remaining unexplained.
Although the exponential decay model also exhibits statistical significance (p < 0.001), its goodness-of-fit (R2 = 0.291) is relatively low, with its predicted values consistently underestimating the magnitude of actual values. This indicates the model’s limited ability to explain data variability, with errors stemming from its inability to adapt to changes in Bn across geometric configurations. The model underperformed the scattering correction model across all error metrics, further confirming the stronger linear correlation between the scattering correction model and actual observations.
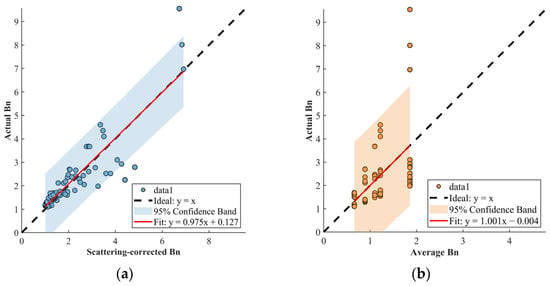
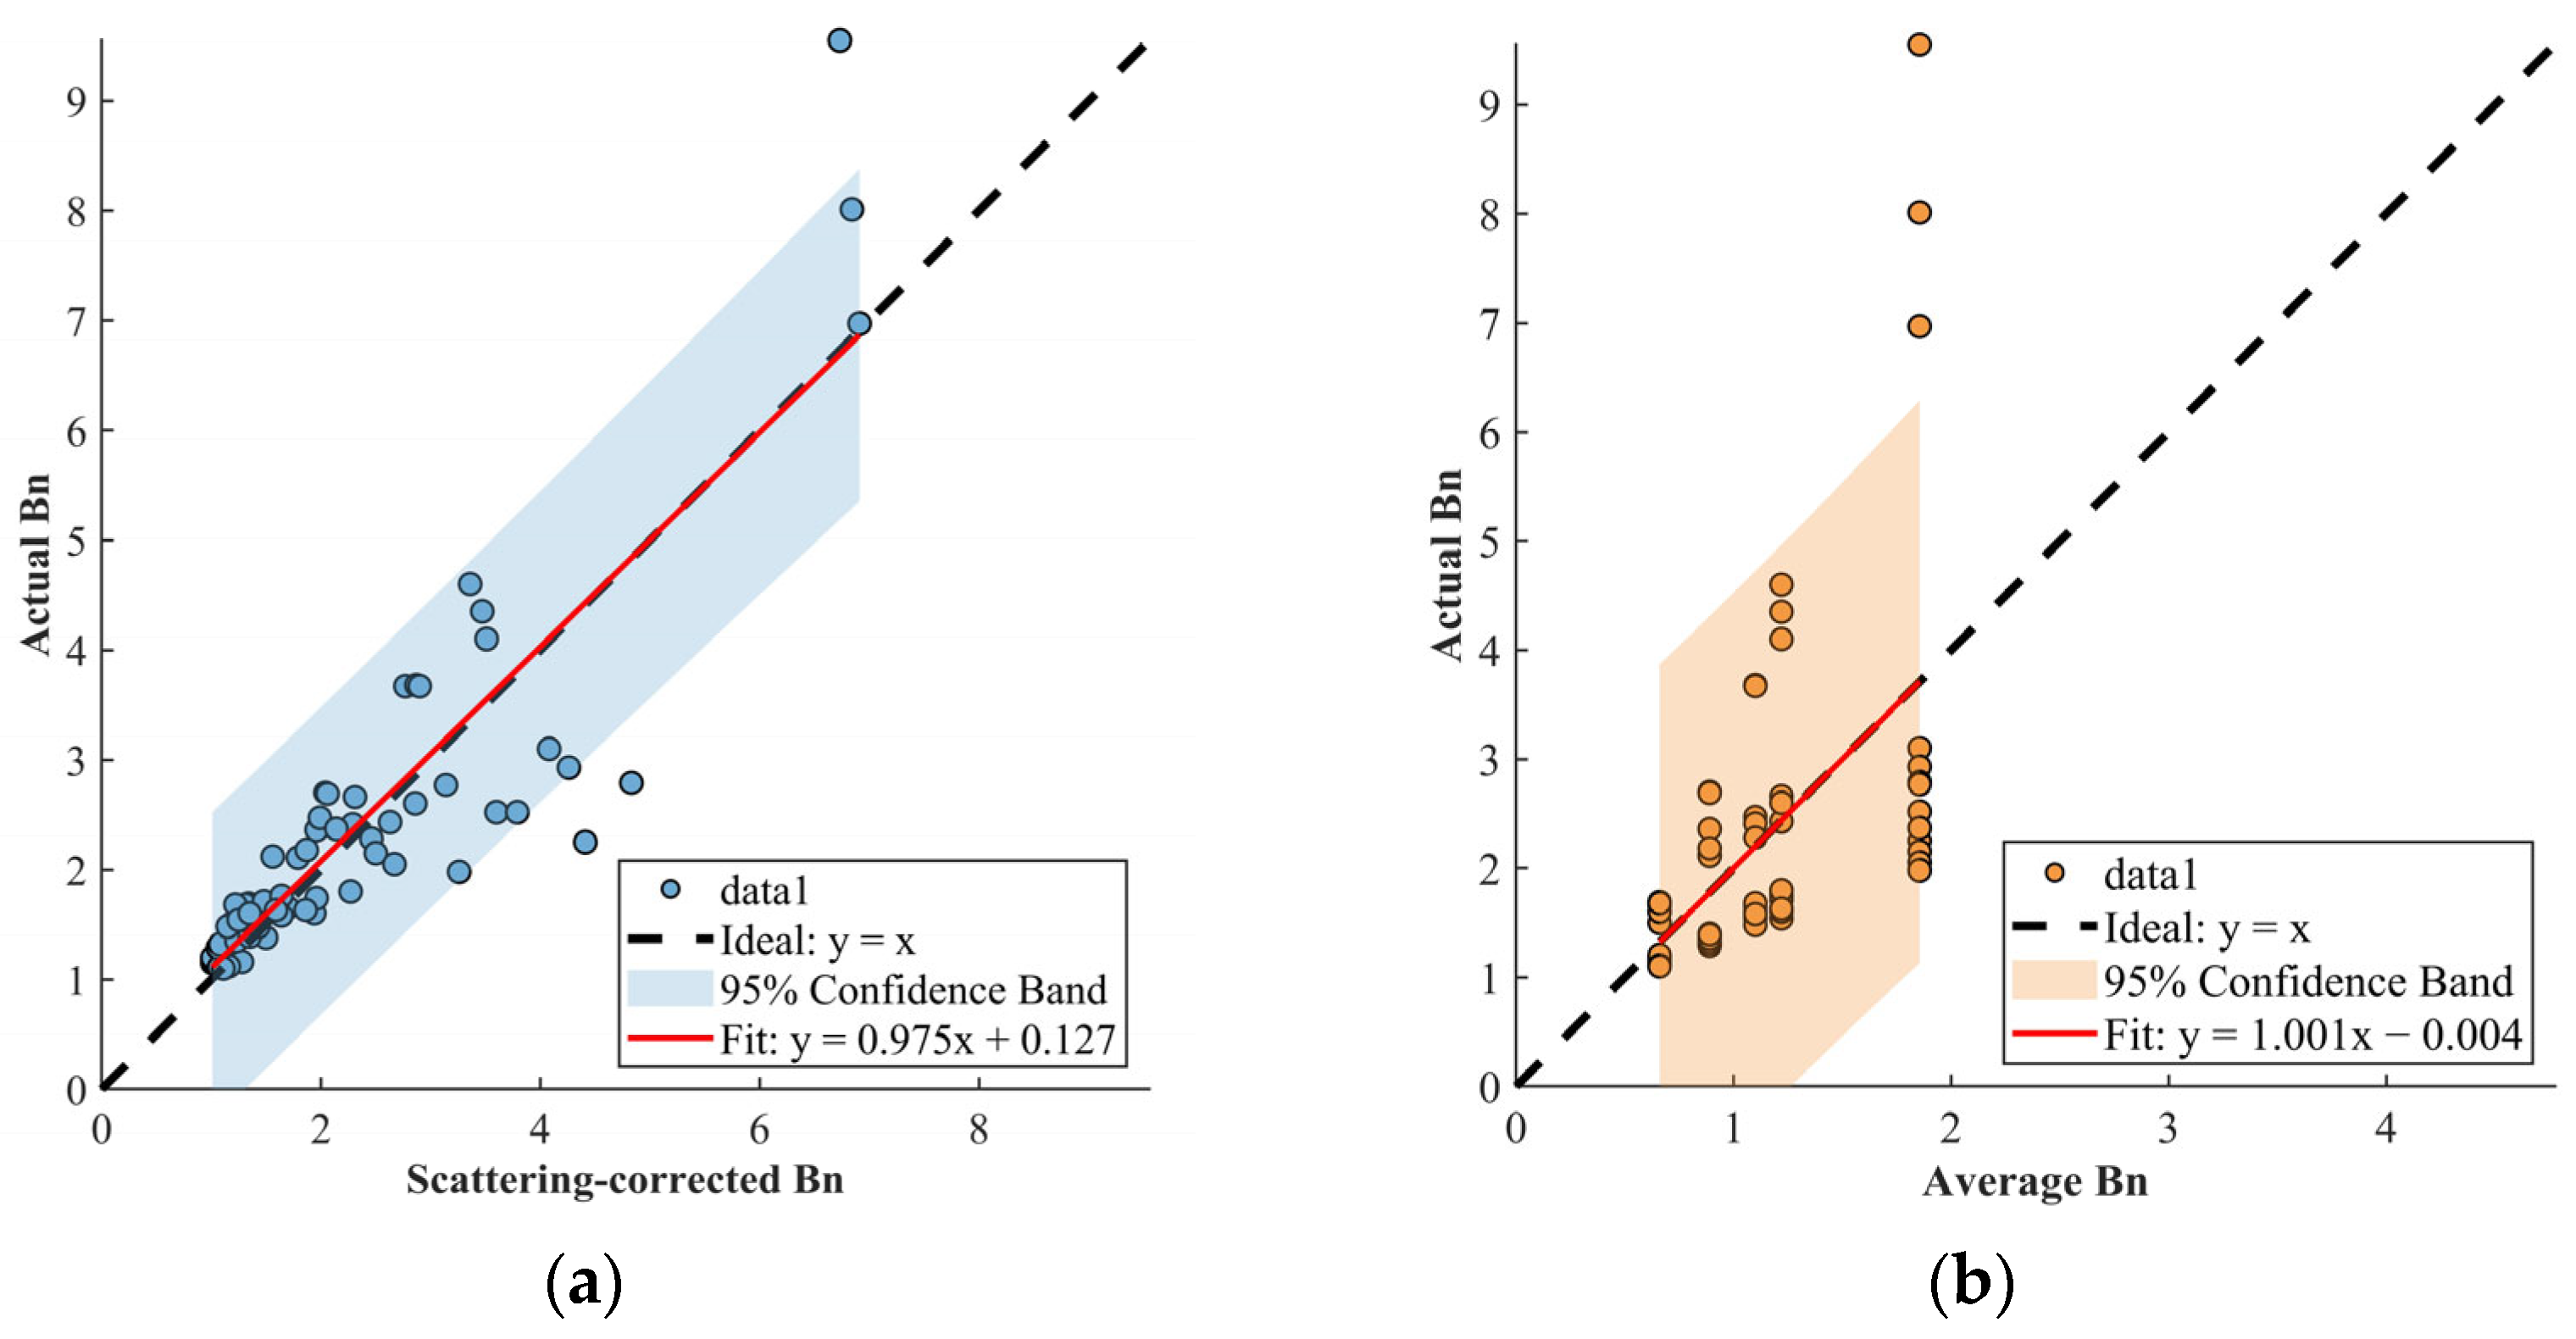
To quantitatively assess the unbiasedness of the two models, linear regression analysis was performed between the predicted values of both models and the MC simulated values. The results were statistically compared with the ideal equation (y = x). To further validate the unbiased prediction of the scattering correction model, linear regression analysis was conducted between the model predictions and Geant4 simulated values, and the results were compared with the ideal relationship (y = x). As shown in Figure 11a, the slope β1 of the scattering-corrected Bn regression line was 0.9754 (95% CI: from 0.8507 to 1.1002), with its confidence interval encompassing 1; the intercept β0 was 0.1273 (95% CI: from −0.1968 to 0.4515), with its confidence interval encompassing 0. The regression line shows no significant difference from the line y = x, demonstrating that the model exhibits no systematic bias across the entire dataset. Data points cluster closely around the ideal curve y = x, and the confidence band of the linear regression encompasses the line y = x, confirming the excellent unbiased predictive capability of the scatter correction model.
Figure 11.
Scatter Plot of Predicted vs. Actual Values. (a) Linear regression analysis of scattering correction Bn versus Monte Carlo simulation values; (b) Linear regression analysis of mean value Bn versus Monte Carlo simulation values.
As shown in Figure 11b, the mean value Bn is also an unbiased estimate. However, both its precision and goodness-of-fit are significantly lower than those of the scattering correction Bn. This precisely demonstrates that the scattering correction Bn is better suited to complex geometric environments and is statistically significantly superior to the mean value Bn.
4. Conclusions
This study addresses the large deviations exhibited by the conventional exponential attenuation model in fast neutron shielding estimation by proposing a semi-empirical physical correction method that incorporates spatial geometric scattering effects. By analyzing the relative position parameters between the “source-shielding material detector” system, it dynamically compensates for scattered neutron contributions, resolving the severe underestimation of flux by traditional beam approximation models under wide-beam conditions. Compared to conventional exponential decay models, the proposed model demonstrates superior accuracy and stability across various geometric configurations. Validation results indicate that this method reduces the mean relative error by approximately 34%. The Bn value of the SC model is statistically significantly superior to the average Bn, and its predictions are unbiased. This effectively enhances the reliability of flux prediction under medium-to-thick shielding conditions. This improvement holds clear engineering application value for radiation protection design and safety assessment, providing a theoretical basis and practical tool for rapid and precise shielding estimation.
However, the current model fails in the thin-shield approximation when shield thickness is large, introducing deviations exceeding 30% when Ds < 2 t and Dd < t. Therefore, the model’s assumptions regarding forward scattering require refinement under extreme geometric conditions. Future work will focus on shielding analysis for water and concrete, emphasizing the extension of the model’s shielding capability assessment by incorporating material density into the s(t) parameter. The ultimate goal is to propose a fast neutron shielding model for common shielding materials.
Author Contributions
Y.L.: Conceptualization; Visualization; Writing—original draft. P.X.: Investigation; Writing—original draft; Writing—review & editing. C.L.: Data curation; Validation. Y.W.: Validation. W.Y.: Formal analysis; Software. All authors have read and agreed to the published version of the manuscript.
Funding
This research received no external funding.
Institutional Review Board Statement
Not applicable.
Informed Consent Statement
Not applicable.
Data Availability Statement
The data that support the findings of this study are available from the corresponding author upon reasonable request.
Conflicts of Interest
The authors declare no conflicts of interest.
Abbreviations
The following abbreviations are used in this manuscript:
| SC | Scattering Correction |
| MC | Monte Carlo |
| FDCN | fluence-to-dose conversion factor for Neutrons |
| MAPE | Mean Absolute Percentage Error |
| MAE | Mean Absolute Error |
| MSE | Mean Squared Error |
| RMSE | Root Mean Squared Error |
Appendix A
Table A1.
Shielding Layer Geometric Configuration.
References
- Petrenko, A.; Maksimov, A.; Katalevich, A. Current State of Development of Industrial Power Complexes with Fast Neutron Reactors. Nucl. Eng. Des. 2022, 386, 111547. [Google Scholar] [CrossRef] [Scilit]
- Yu, W.; Xu, P.; Bao, J.; Zhou, M. Image Enhancement Using an Improved Adaptive Contrast Enhancement Algorithm in Neutron Radiography. AIP Adv. 2023, 13, 085112. [Google Scholar] [CrossRef] [Scilit]
- Behmadi, M.; Mohammadi, S.; Ravari, M.E.; Mohammadi, A.; Loushab, M.E.; Bahreyni Toossi, M.T.; Ghergherehchi, M. Neutron Dosimetry with a Pair of TLDs for the Elekta Precise Medical Linac and the Evaluation of Optimum Moderator Thickness for the Conversion of Fast to Thermal Neutrons. Nucl. Eng. Technol. 2024, 56, 753–761. [Google Scholar] [CrossRef] [Scilit]
- Golshanian, M.; Rajabi, A.A.; Kasesaz, Y. Evaluation of the Medical Staff Effective Dose during Boron Neutron Capture Therapy Using Two High Resolution Voxel-Based Whole Body Phantoms. Nucl. Eng. Technol. 2017, 49, 1505–1512. [Google Scholar] [CrossRef] [Scilit]
- Mouhssine, D.; Nourreddine, A.; Nachab, A.; Pape, A.; Fernandez, F. A New Environmental Dosimeter with Imaging Plates for the Fast Neutron Monitoring. Nucl. Instrum. Methods Phys. Res. Sect. B Beam Interact. Mater. At. 2005, 227, 609–616. [Google Scholar] [CrossRef] [Scilit]
- Truong, V.M.; Nguyen, X.H.; Cao, D.V.; Duong, T.T.; Pham, D.K.; Nguyen, H.P.; Nguyen, H.T.; Dinh, T.H.; Cao, V.H.; Phan, V.C.; et al. Determination of Fe and Tb Concentrations in Geological and Environmental Samples Using the Instrumental Neutron Activation Analysis Method Combined with the γ − γ Coincidence Technique. Radiat. Phys. Chem. 2022, 200, 110203. [Google Scholar] [CrossRef] [Scilit]
- Pesente, S.; Lunardon, M.; Nebbia, G.; Viesti, G.; Sudac, D.; Valkovic, V. Monte Carlo Analysis of Tagged Neutron Beams for Cargo Container Inspection. Appl. Radiat. Isot. 2007, 65, 1322–1329. [Google Scholar] [CrossRef] [Scilit] [PubMed]
- Masoudi, S.F.; Ghashami, M. D–T Neutron Generators as a Feasibility Tool for Landmine Detection Based on Neutron Backscattering Method. Ann. Nucl. Energy 2014, 65, 441–445. [Google Scholar] [CrossRef] [Scilit]
- Sowerby, B.D.; Tickner, J.R. Recent Advances in Fast Neutron Radiography for Cargo Inspection. Nucl. Instrum. Methods Phys. Res. Sect. A Accel. Spectrometers Detect. Assoc. Equip. 2007, 580, 799–802. [Google Scholar] [CrossRef] [Scilit]
- Zhang, Z.; Bai, J.; Meng, Q.; Zhang, R.; Dang, X.; Liu, X.; Yuan, Y.; Liu, H.; Ren, Y.; Yang, B.; et al. Effects of Neutron, γ-Ray, and Neutron–γ-Ray Mixed Radiations on Chromosomal Aberrations in Peripheral Blood Lymphocytes of Two Males. Radiat. Prot. Dosim. 2025, 201, 613–621. [Google Scholar] [CrossRef] [Scilit] [PubMed]
- Olukotun, S.F.; Gbenu, S.T.; Oladejo, O.F.; Balogun, F.O.; Sayyed, M.I.; Tajudin, S.M.; Obiajunwa, E.I.; Fasasi, M.K. The Effect of Incorporated Recycled Low Density Polyethylene (LDPE) on the Fast Neutron Shielding Behaviour (FNSB) of Clay Matrix Using MCNP and PHITS Monte Carlo Codes. Radiat. Phys. Chem. 2021, 182, 109351. [Google Scholar] [CrossRef] [Scilit]
- Abady, R.S.; Amro, B.M.S.; Saleh, H.; Alwaheba, A.; Esaifan, M.; Arslan, H.; Afaneh, F.; Tonguc, B.T. Comprehensive Evaluation of Epoxy/Li2B4O7 Composite for Neutron Shielding: Experimental Characterization and Geant4 Simulation Analysis. Radiat. Phys. Chem. 2026, 240, 113433. [Google Scholar] [CrossRef] [Scilit]
- Lamouri, H.; Mkhalet, M.E.; Lamdouar, N. Probabilistic Modeling and Structural Reliability Based Monte Carlo Simulation: A Case Study. Int. J. Eng. Trends Technol. 2024, 72, 321–331. [Google Scholar] [CrossRef] [Scilit]
- Fernandes, J.C.L.; Borges, V.; Vilhena, M.T.; Ernest, B. Determination of Neutron Buildup Factor Using Analytical Solution of One-Dimensional Neutron Diffusion Equation in Cylindrical Geometry. In Proceedings of the 2011 International Nuclear Atlantic Conference (INAC 2011), Belo Horizonte, MG, Brazil, 24–28 October 2011; p. 10. [Google Scholar]
- Chen, S.; Bernard, D.; Blaise, P. Attenuation of Neutron and Photon-Induced Irradiation Damage in Pressurized Water Reactor Pressure Vessels. Ann. Nucl. Energy 2020, 145, 107601. [Google Scholar] [CrossRef] [Scilit]
- Fragopoulou, M.; Zamani, M. Phenomenological Calculations of Shielding Spallation Neutron Sources. Nucl. Instrum. Methods Phys. Res. Sect. A Accel. Spectrometers Detect. Assoc. Equip. 2013, 714, 24–30. [Google Scholar] [CrossRef] [Scilit]
- Cacuci, D.G. Handbook of Nuclear Engineering; Springer: Berlin/Heidelberg, Germany, 2010. [Google Scholar]
- Alawi, M.A.; Hazzaa, Y.Z.; Fawrah, R.B.; Alhusini, F.M.; Alhawsawi, A.M.; Banoqitah, E.M. Characterization of the Direct and Scattered Neutron Flux Around Cyclotron Target. In Proceedings of the Challenges and Recent Advancements in Nuclear Energy Systems; Shams, A., Al-Athel, K., Tiselj, I., Pautz, A., Kwiatkowski, T., Eds.; Springer Nature: Cham, Switzerland, 2024; pp. 174–183. [Google Scholar]
- Mehelli, O.; Derradji, M.; Belgacemi, R.; Abdous, S. Development of Lightweight and Highly Efficient Fast Neutrons Composites Shields Based on Epoxy, UHMWPE Fibres and Boron Carbide Particles. Radiat. Phys. Chem. 2022, 193, 109510. [Google Scholar] [CrossRef] [Scilit]
- Jung, B. Conversion Coefficients for Use in Radiological Protection Against External Radiation. Acta Radiol. 1999, 40, 465–466. [Google Scholar]
- Udupi, A.; Shetty, P.K.; Panikkath, P.; Sarkar, P.K. Comparison of Different Methods of Estimating the Effective Dose and the Ambient Dose Equivalent for Neutrons from Measured Prompt Gamma Intensities. Nucl. Instrum. Methods Phys. Res. Sect. A Accel. Spectrometers Detect. Assoc. Equip. 2021, 993, 165072. [Google Scholar] [CrossRef] [Scilit]
- Yu, W.; Xu, P.; Zhou, M.; Bao, J.; Wang, Y. Scattering Correction in Fast Neutron Radiography Based on Gaussian Fitting Model of Point Scattered Function. Nucl. Eng. Technol. 2026, 58, 103980. [Google Scholar] [CrossRef] [Scilit]

Disclaimer/Publisher’s Note: The statements, opinions and data contained in all publications are solely those of the individual author(s) and contributor(s) and not of MDPI and/or the editor(s). MDPI and/or the editor(s) disclaim responsibility for any injury to people or property resulting from any ideas, methods, instructions or products referred to in the content. |
© 2026 by the authors. Licensee MDPI, Basel, Switzerland. This article is an open access article distributed under the terms and conditions of the Creative Commons Attribution (CC BY) license.