


Abstract
Reservoir bank collapse is a critical geological hazard during the operation of large-scale water conservancy projects, controlled by unique hydrodynamic mechanisms induced by reservoir impoundment, and differs significantly from ordinary landslides. Traditional risk assessment methods, however, often struggle to achieve effective integration between macro-regional zoning and micro-mechanical analysis. Against this limitation, this study proposes a GIS-integrated multi-scale risk screening framework to achieve the preliminary integration of qualitative regional evaluation and quantitative site-specific analysis. Compared with traditional multi-scale studies, the innovations of this research are as follows: (1) a customized GIS component was developed to realize semi-automatic profile extraction from high-resolution DEMs and batch Bishop stability calculations, overcoming the bottleneck of spatializing micro-models over large areas; (2) a “bottom-up” dynamic feedback mechanism was established, utilizing the quantitative safety factor from site-specific evaluations as an explicit indicator for the conservative screening correction of the macro-regional risk map. Applied to the Xiluodu Reservoir, this framework illustrates a potential multi-scale approach for cross-scale risk screening driven by physical–mechanical mechanisms. This provides both a global perspective and a localized physical basis, offering a strategic screening tool for reservoir management. By linking failure mechanisms directly to spatial impacts, the framework provides a plausible conservative feedback rule for risk-informed decision-making in complex reservoir settings.
1. Introduction
The definition of risk has long been a subject of interdisciplinary inquiry. Conceptualizations of risk vary across different fields: Webster’s Dictionary defines it as the “possibility of loss or injury,” whereas the insurance industry characterizes it as a “hazard or potential loss” [1,2]. In the specific context of reservoir bank collapse, risk refers to the progressive or sudden instability of reservoir banks induced by hydrodynamic forces, entailing potential adverse impacts on human lives, property, major engineering projects, and infrastructure [3]. Currently, risk assessment for reservoir bank collapse in China primarily draws upon the theories and methodologies established in geological hazard risk assessment.
Significant strides have been made in the field of geological hazard risk assessment over the past few decades. The 1960s and 1970s marked a period of pioneering theoretical research and assessment in developed nations, including the USA, Canada, and Australia. These efforts led to the establishment of comprehensive research programs, technical guidelines, and regulations, yielding numerous success stories in slope management and environmental control [4,5,6,7,8]. By the 1980s, the discipline had expanded globally. Notably, Varnes [9] formalized the definition of geological hazard risk as the expected loss of life, injury, property damage, or economic disruption resulting from specific natural phenomena over a given period. The 1990s brought a paradigm shift with the integration of spatial information technologies, specifically Geographic Information Systems (GIS) and Remote Sensing (RS) [10]. This technological evolution allowed researchers like Mejia [11] to perform regional risk assessments through the visual overlay of risk factors, while others, such as Ohlmacher et al. [12], integrated mathematical statistics with GIS for hazard evaluation. Recent studies have further optimized these spatial techniques, employing advanced remote sensing interpretation to update landslide inventories in near real-time [13,14]. In China, despite an initial lag behind international standards, scholars have made remarkable progress since the 2000s [15]. For instance, Xiang et al. [16] developed a holistic GIS-based framework for risk management, and Huang [17] expounded on the principles of GIS application in this field. Recently, the convergence of GIS with machine learning and big data has driven the field toward “smart” and refined assessment methodologies [18,19]. Current international research emphasizes multi-source data fusion. For example, Merghadi et al. [20] provided a comprehensive review of machine learning methods for landslide susceptibility, highlighting the superiority of ensemble models. Similarly, Ghorbanzadeh et al. [21] demonstrated the efficacy of deep learning convolutional neural networks (CNNs) in detecting landslide-prone areas from optical data. This trend is mirrored in domestic studies; for instance, Zhou et al. [22] proposed hybrid machine learning models to improve the accuracy of regional susceptibility mapping. Furthermore, current research emphasizes multi-source data fusion, such as combining InSAR with machine learning for precise risk classification [23], an approach also widely applied in domestic studies for detailed landslide evaluation [24].
Despite these advancements, reservoir bank collapse risk assessment remains challenged by the need to coordinate spatial scales. This process inherently involves evaluations at two distinct levels: the regional scale and the site-specific scale. Historically, regional risk assessment has relied on macro-factors for hazard zonation. While advantageous for providing decision-makers with a rapid overview of critical areas, these methods are predominantly qualitative or semi-quantitative [25], lacking the precision required to guide specific engineering designs. Although the application of GIS has facilitated the implementation of these regional approaches [26,27], their heavy reliance on historical disaster inventories often confines the results to qualitative expressions. Conversely, site-specific assessment focuses on calculating the stability of specific slopes using Limit Equilibrium Methods (LEM) or numerical analysis to provide quantitative safety factors [28]. However, due to the high demand for detailed data and the complexity of local geological factors, such methods are frequently conducted in isolation from regional assessments [29]. Consequently, a critical gap remains: regional and site-specific evaluations are often treated as independent entities, hindering the formation of a unified, multi-dimensional perspective on risk. Although some scholars have attempted to introduce multi-scale integration methods to break this isolation, they essentially remain “top-down” static displays—stacking small-scale local calculations onto large-scale zonation—lacking deep data feedback between scales. Furthermore, existing research on multi-scale fusion focuses more on parameter zoning of statistical samples across scales, rather than the correction of macro-evaluation logic by physical–mechanical mechanisms [30].
To address this issue, this paper proposes a GIS-integrated framework that organically couples regional macro-zonation with micro-mechanical analysis. By developing customized GIS components, the semi-automatic extraction of slope profiles and geometric parameter conversion based on high-resolution DEMs are realized, effectively overcoming the technical bottleneck of spatializing traditional site-specific stability analysis at a regional scale. Unlike the unidirectional hierarchical nesting logic in previous studies, this research establishes a bottom-up dynamic feedback mechanism, using the quantitative safety factor obtained at the micro-scale as an explicit indicator for the conservative adjustment of regional evaluation results. Simultaneously, the Bishop limit equilibrium method is integrated into the GIS spatial decision-making process to achieve a mechanical response-driven cross-scale risk screening, thereby enriching the assessment content and providing a preliminary physical–mechanical basis for disaster prevention and control in complex reservoir environments.
2. Materials and Methods
To address the disconnection between regional and site-specific scales in reservoir bank collapse risk assessment, this study proposes a multi-scale coupled risk assessment framework. This framework operates at two distinct scales, employing qualitative regional evaluation and quantitative site-specific analysis. The primary objective is to enable managers and decision-makers to not only obtain risk ratings across different scales but also comprehensively understand specific causative mechanisms, impact extents, and potential losses, thereby facilitating effective risk management and control. The entire research workflow is implemented within a GIS environment [31].
2.1. Regional-Scale Bank Collapse Risk Assessment Method
At the regional scale, conducting detailed mechanical calculations for every individual slope is impractical given the vast extent of the reservoir area. Consequently, GIS-based spatial overlay analysis is adopted as the primary methodological approach [32]. Given the specific context of the study area, constructing a comprehensive risk assessment model necessitates the integration of bank collapse characteristics (representing hazard) and socioeconomic conditions (representing vulnerability) [33,34].
2.1.1. Hazard Assessment
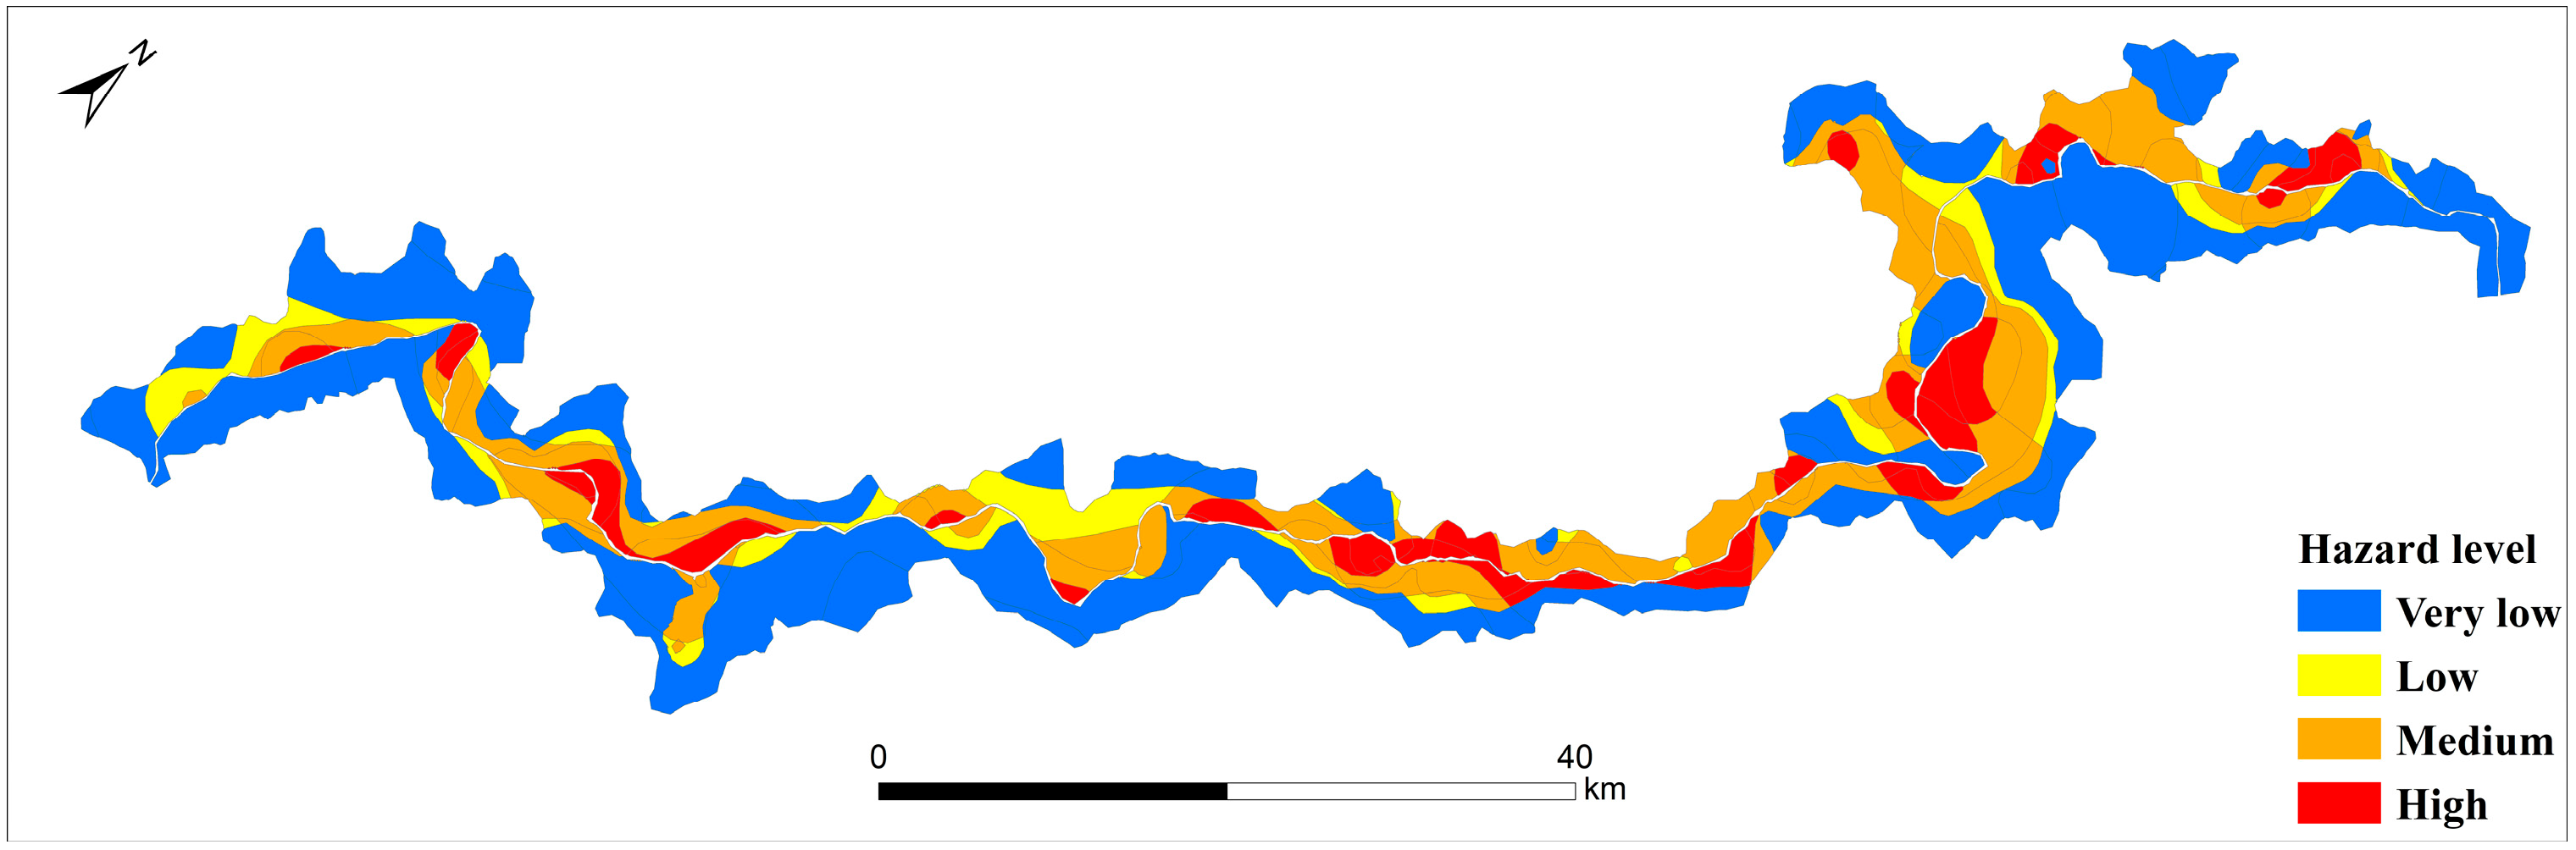
The hazard level is principally determined by the magnitude and spatial distribution of potential bank collapses. Vector boundaries of potential collapse masses were delineated based on field investigation data. Operating under the pragmatic simplification that larger collapse masses tend to release greater energy and affect a wider area, the area of each collapse polygon was adopted as a proxy weighting factor. Subsequently, the collapse polygons were converted into centroid point features using the geometric center tool, and the area weights were assigned to these points. The ArcGIS (version 10.4; Esri, Redlands, CA, USA) “Topo to Raster” tool was then employed, to characterize the regional hazard intensity [35]. This tool was selected for its ability to generate a globally smooth continuous surface while preserving local extreme characteristics from discrete attribute points, thereby scientifically simulating the spatial diffusion trend of hazard intensity.
2.1.2. Vulnerability Assessment
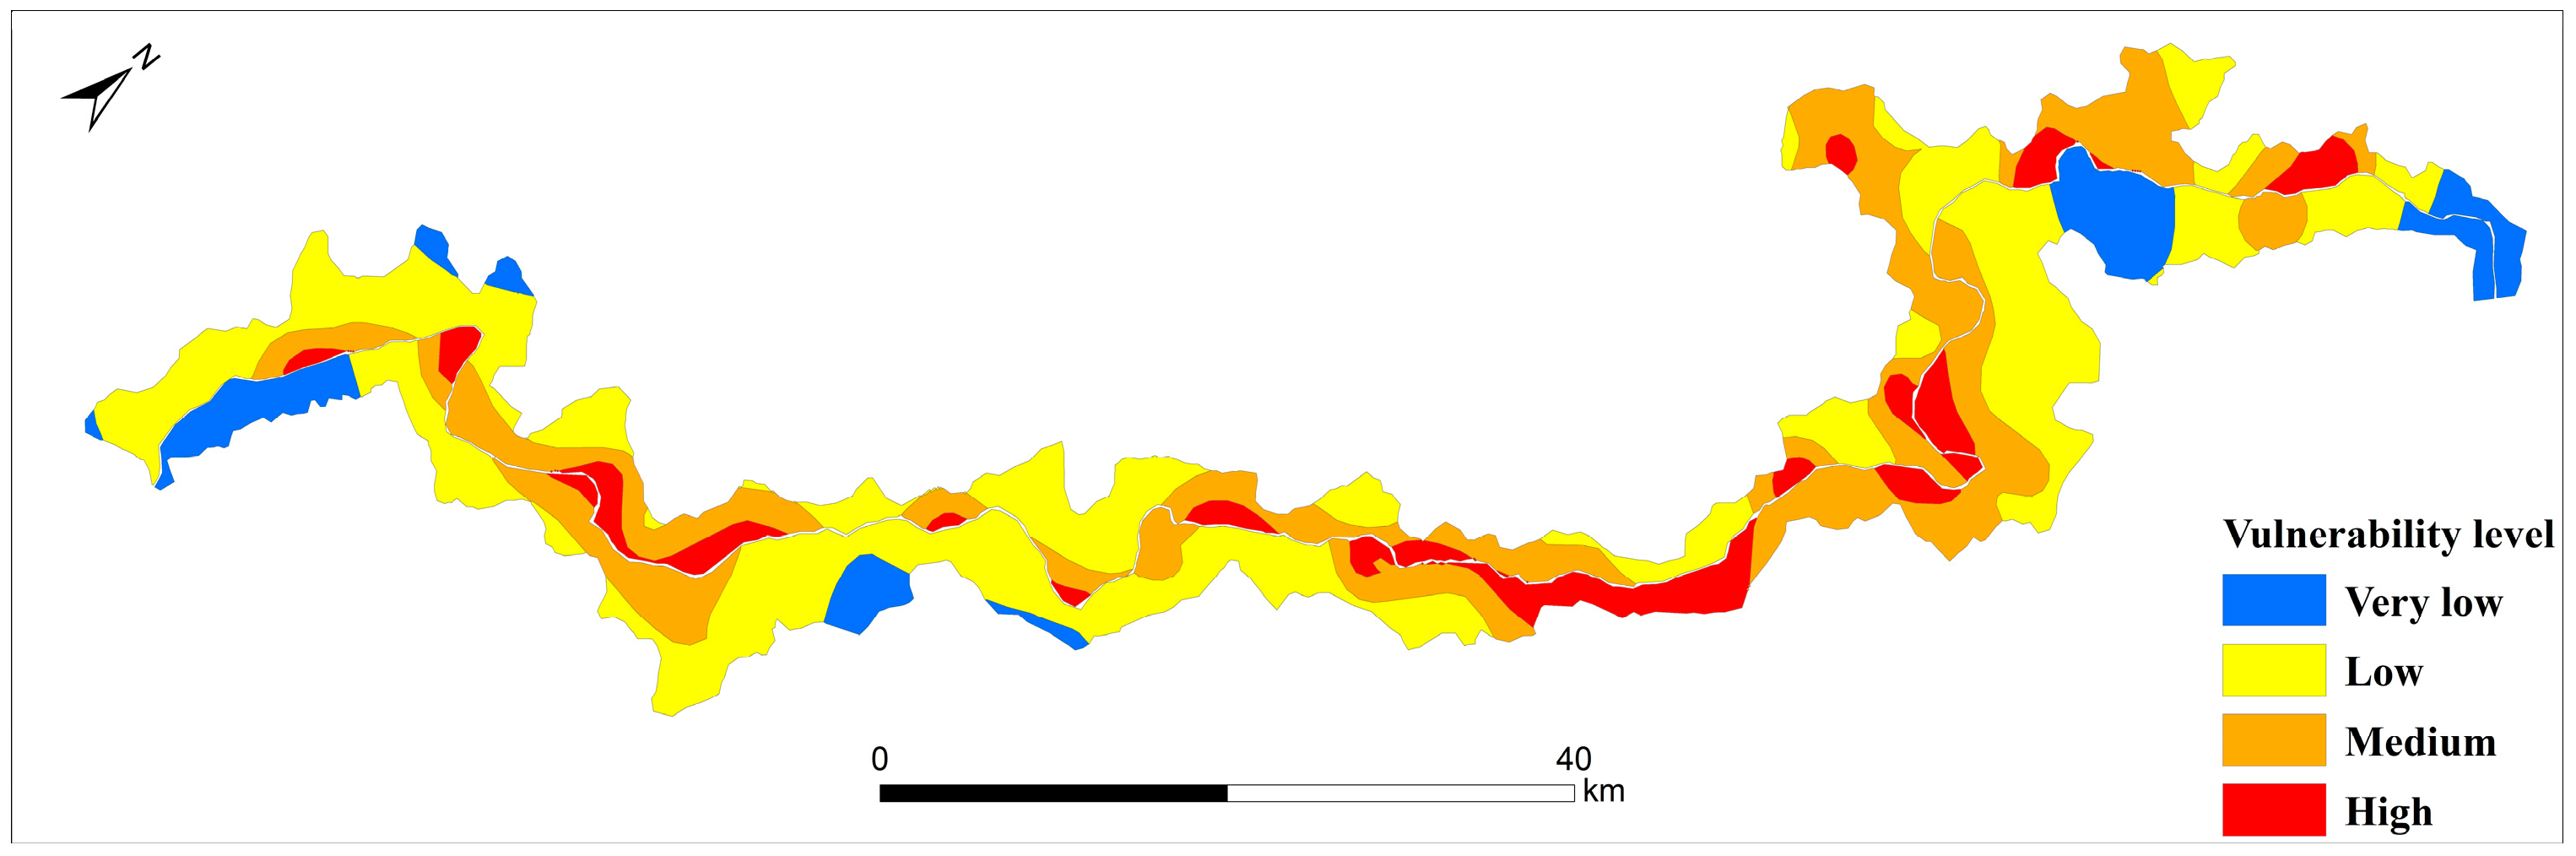
This study primarily focuses on the safety of elements at risk, specifically represented by residential structures. Vulnerability is quantified primarily through the lens of spatial exposure, measured by the spatial proximity between hazard sources and the elements at risk. The “Euclidean Distance” tool in ArcGIS (version 10.4) was employed to calculate the distance from each residential point to the nearest potential bank collapse body. Although Euclidean distance does not account for terrain aspect differences during the calculation, it serves as an explicit first-order index-based screening proxy for measuring the spatial exposure of elements at risk at a preliminary evaluation level. It should be explicitly noted that this indicator focuses solely on spatial exposure and does not incorporate multi-dimensional factors such as structural fragility, socioeconomic value, or complex consequence modeling. Accordingly, following the distance decay principle, it is posited that as the distance to the collapse source decreases, the exposure of the elements at risk increases, resulting in a correspondingly higher calculated vulnerability rating.
2.1.3. Comprehensive Risk Assessment
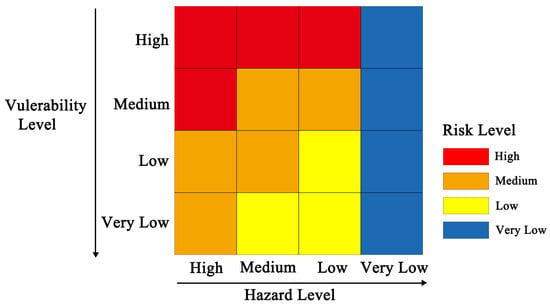
The risk matrix approach was employed to synthesize the assessment results. First, the continuous Hazard and Vulnerability layers generated in the preceding steps were reclassified into discrete grades. Subsequently, a spatial overlay analysis was conducted based on the matrix logic. This process categorizes the reservoir banks at a macroscopic scale into four relative risk screening grades, specifically High, Medium, Low, and Very Low [36]. These results provide a scientific basis for preliminary planning and the identification of priority investigation zones [37].
2.2. Site-Scale Bank Collapse Hazard Evaluation Method
For specific high-risk slopes or critical engineering parts identified via the regional assessment, a more rigorous deterministic analysis is required. Fundamentally, bank collapse represents a specialized form of instability in reservoir slopes, and its characteristic that significantly distinguishes it from ordinary landslides is the fact that failure is primarily caused by continuous scouring of the slope toe under the background of reservoir water level fluctuations, and it shows a trend of accelerated deformation development under rainfall-induced conditions [38]. Consequently, the Factor of Safety (), a standard metric in geotechnical engineering, is adopted as the core indicator to quantify slope stability and thereby represent the possibility and hazard intensity of bank collapse at the site-specific scale under static hydrological conditions.
2.2.1. Risk Simplification
Classical risk theory defines risk as the product of hazard, vulnerability, and exposure. However, the objects of site-specific assessment are inherently high-exposure targets (residential areas); thus, their vulnerability and exposure are treated as constants. In this context, vulnerability and exposure are assumed to reach their maximum values (i.e., 1.0) under extreme failure states to ensure a safety margin for engineering design. Consequently, the risk variation at the site-specific scale is primarily determined by the stability of the slope itself. This study focuses site-specific assessment on hazard analysis based on the Factor of Safety (), which both simplifies computational complexity and better reflects the physical essence of slope failure under hydrodynamic effects.
2.2.2. Selection of Algorithm
Methods for slope stability analysis are currently well-established, with the Limit Equilibrium Method (LEM) being one of the most prevalent approaches in two-dimensional space. Commercial software packages, such as GeoSlope (version 2018; GEOSLOPE International Ltd., Calgary, AB, Canada), are widely utilized for slope stability calculations and are extensively adopted by both researchers and engineers [39]. For instance, Simon et al. [40] developed tools based on VBA in Microsoft Excel to integrate three limit equilibrium formulations for calculating safety factors. Similarly, Reid et al. [41] utilized Bishop’s method combined with DEMs to assess slope stability in their study on the three-dimensional stability analysis of volcanic flanks.
Bishop’s simplified method serves as a practical and efficient limit equilibrium technique. It postulates a circular slip surface and accounts for inter-slice normal forces, operating under the assumption that the factor of safety against sliding remains constant across the base of all slices. The formulations are derived using effective stress principles but remain applicable to total stress analysis [42,43,44]. To establish a quantitative link between regional and site-specific risks, this study integrates Bishop’s simplified method into the GIS environment to calculate the Factor of Safety. By offering a robust balance between computational accuracy and efficiency, this approach proves highly suitable for the soil-like accumulation masses typical of reservoir banks. To implement this method at a regional scale, a customized GIS component was developed to automate the geometric parameter extraction, thereby overcoming the efficiency bottleneck of traditional manual modeling.
2.2.3. GIS Component Workflow
The implementation of the customized GIS tool (developed based on ArcGIS version 10.4; Esri, Redlands, CA, USA) follows a systematic data processing logic. Leveraging high-resolution DEMs, this component enables the automatic or semi-automatic extraction of slope profiles, slice boundaries, and slip surfaces, subsequently facilitating the rapid calculation of the factor of safety.
By establishing a mapping relationship between the Factor of Safety () and risk levels, the quantitative risk assessment of site-specific bank collapses is realized. This method provides reliable data support for the stability evaluation and engineering mitigation design of critical or representative collapse sites.
2.3. Coupling Method Between Risk Assessments at Different Scales
Regional risk assessment relies on the spatial analysis capabilities of GIS. However, when detailed collapse information is required at a finer scale, regional assessment alone proves insufficient, necessitating the acquisition of specific parameters through comprehensive field surveys and laboratory tests. This framework establishes a bidirectional coupling mechanism between the two scales, rather than treating them as isolated processes:
- (1)
- Top-down Guidance: The regional risk map serves as a screening tool. It guides decision-makers to concentrate limited budgets and time on areas flagged as “High Risk” for detailed investigation, achieving optimal resource allocation.
- (2)
- Bottom-up Conservative Correction: Quantitative results from the site-specific analysis are utilized to provide a heuristic safety check for the regional assessment, establishing spatial and attribute links via a Unique Identifier (Unique ID) within the GIS database. For instance, if Bishop’s calculation reveals that a slope safety factor is very low and is in an unstable state ( < 1.0), yet the regional evaluation initially classified it as “Medium Risk,” the system will forcibly upgrade the hazard level of that polygon unit to “High” through the unique identifier based on the conservative principle, and re-trigger the risk matrix calculation to update the final risk level. This mechanism acts as a localized safety check to prevent missing high-risk cases at specific sites, rather than a general update of the entire regional model based on limited data.
This “top-down” approach for identifying key areas, combined with the “bot-tom-up” correction of macro-level evaluations using quantitative results, effectively addresses the disconnect between evaluation outcomes at different scales. This method enhances both the accuracy and practicality of the risk assessment.
3. Implementation and Case Study
This study selected the backwater area of the Xiluodu Hydropower Station on the Jinsha River as the empirical study area. Characterized by a complex geological environment and an operational reservoir water level range (ranging from 540 m to 600 m), this area is prone to frequent bank collapse disasters. Following the initial impoundment period, the reservoir has entered a stable operational phase, with the water level currently maintained near the 600 m normal pool level subject only to minor seasonal micro-fluctuations. Under this long-term high-water condition, the reservoir banks have reached a quasi-steady state of saturation. This research addresses the bank stability under this high-water steady-state condition to provide a conservative screening baseline. Leveraging the ArcGIS platform and utilizing both its built-in spatial analysis modules and the custom extension components developed in this study, the complete workflow from regional reconnaissance to precise site-specific diagnosis was executed. This section details the data processing logic, algorithmic implementation, and practical application results.
3.1. Regional-Scale Reservoir Bank Collapse Risk Assessment
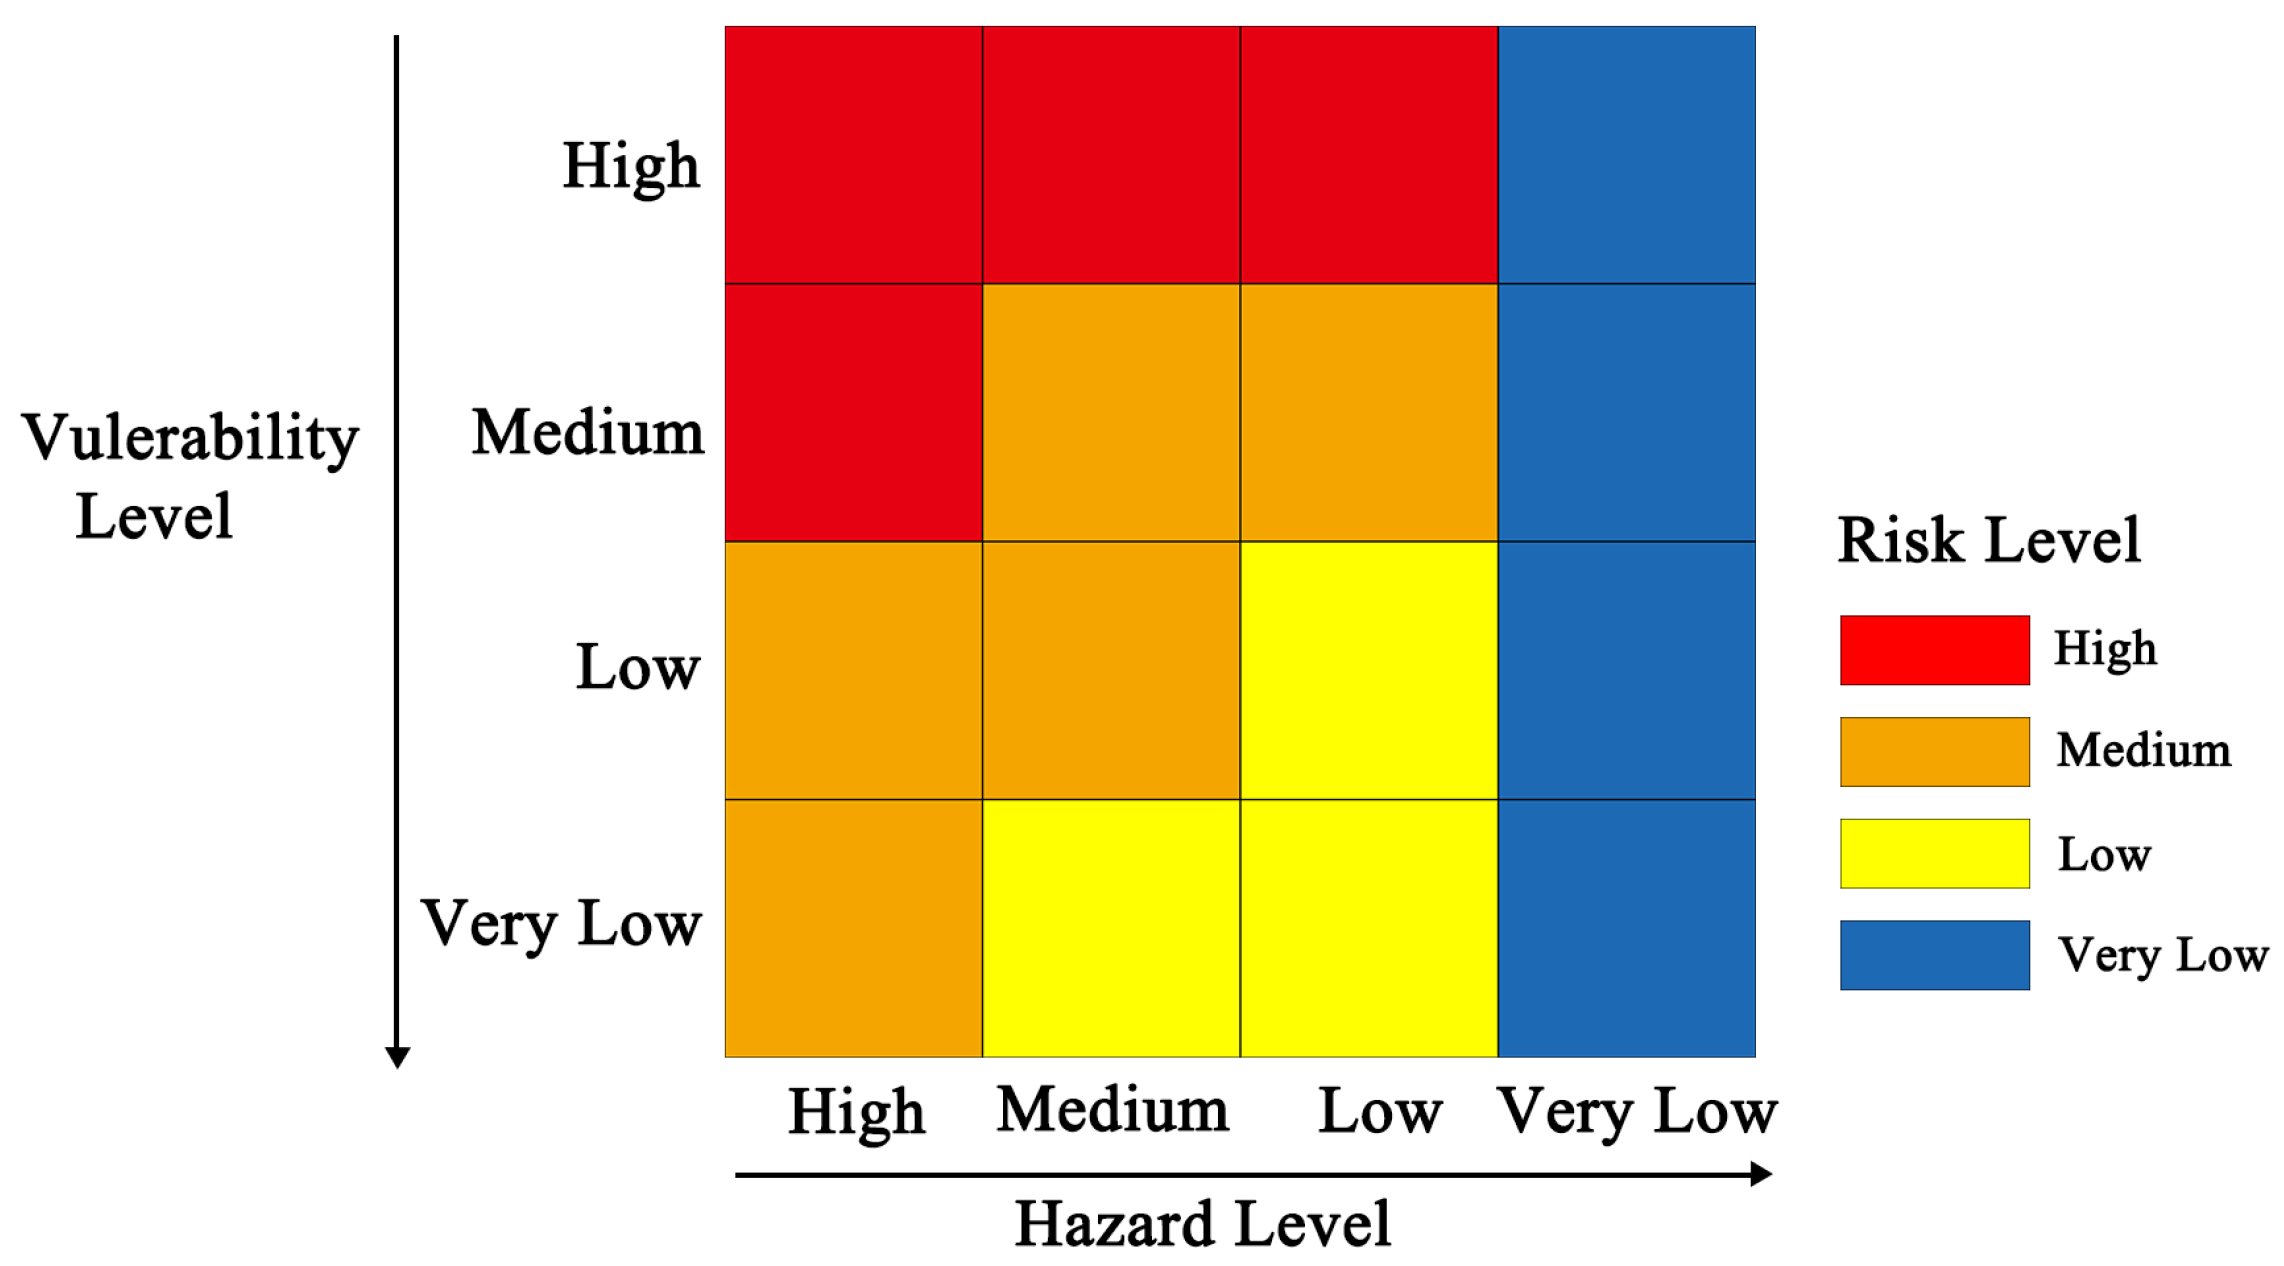
At the regional scale, the assessment prioritizes the rapid generation of a risk basemap utilizing limited available data. To facilitate this, the risk matrix shown in Figure 1 was adopted. The logic of this matrix refers to the internationally recognized framework in geological hazard risk management and relevant domestic technical specifications [9,45]. The use of a four-level risk classification aims to balance evaluation precision with decision-making practicality; this four-level division is sufficient to distinguish risk hotspots that require priority attention while avoiding over-classification due to qualitative data accuracy limitations.
Figure 1.
Matrix for ranking risk by combining hazard levels and vulnerability grades.
- (1)
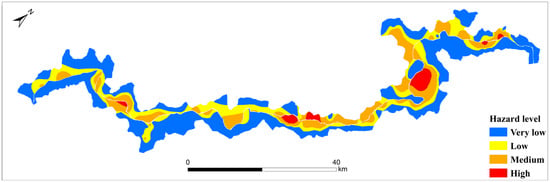
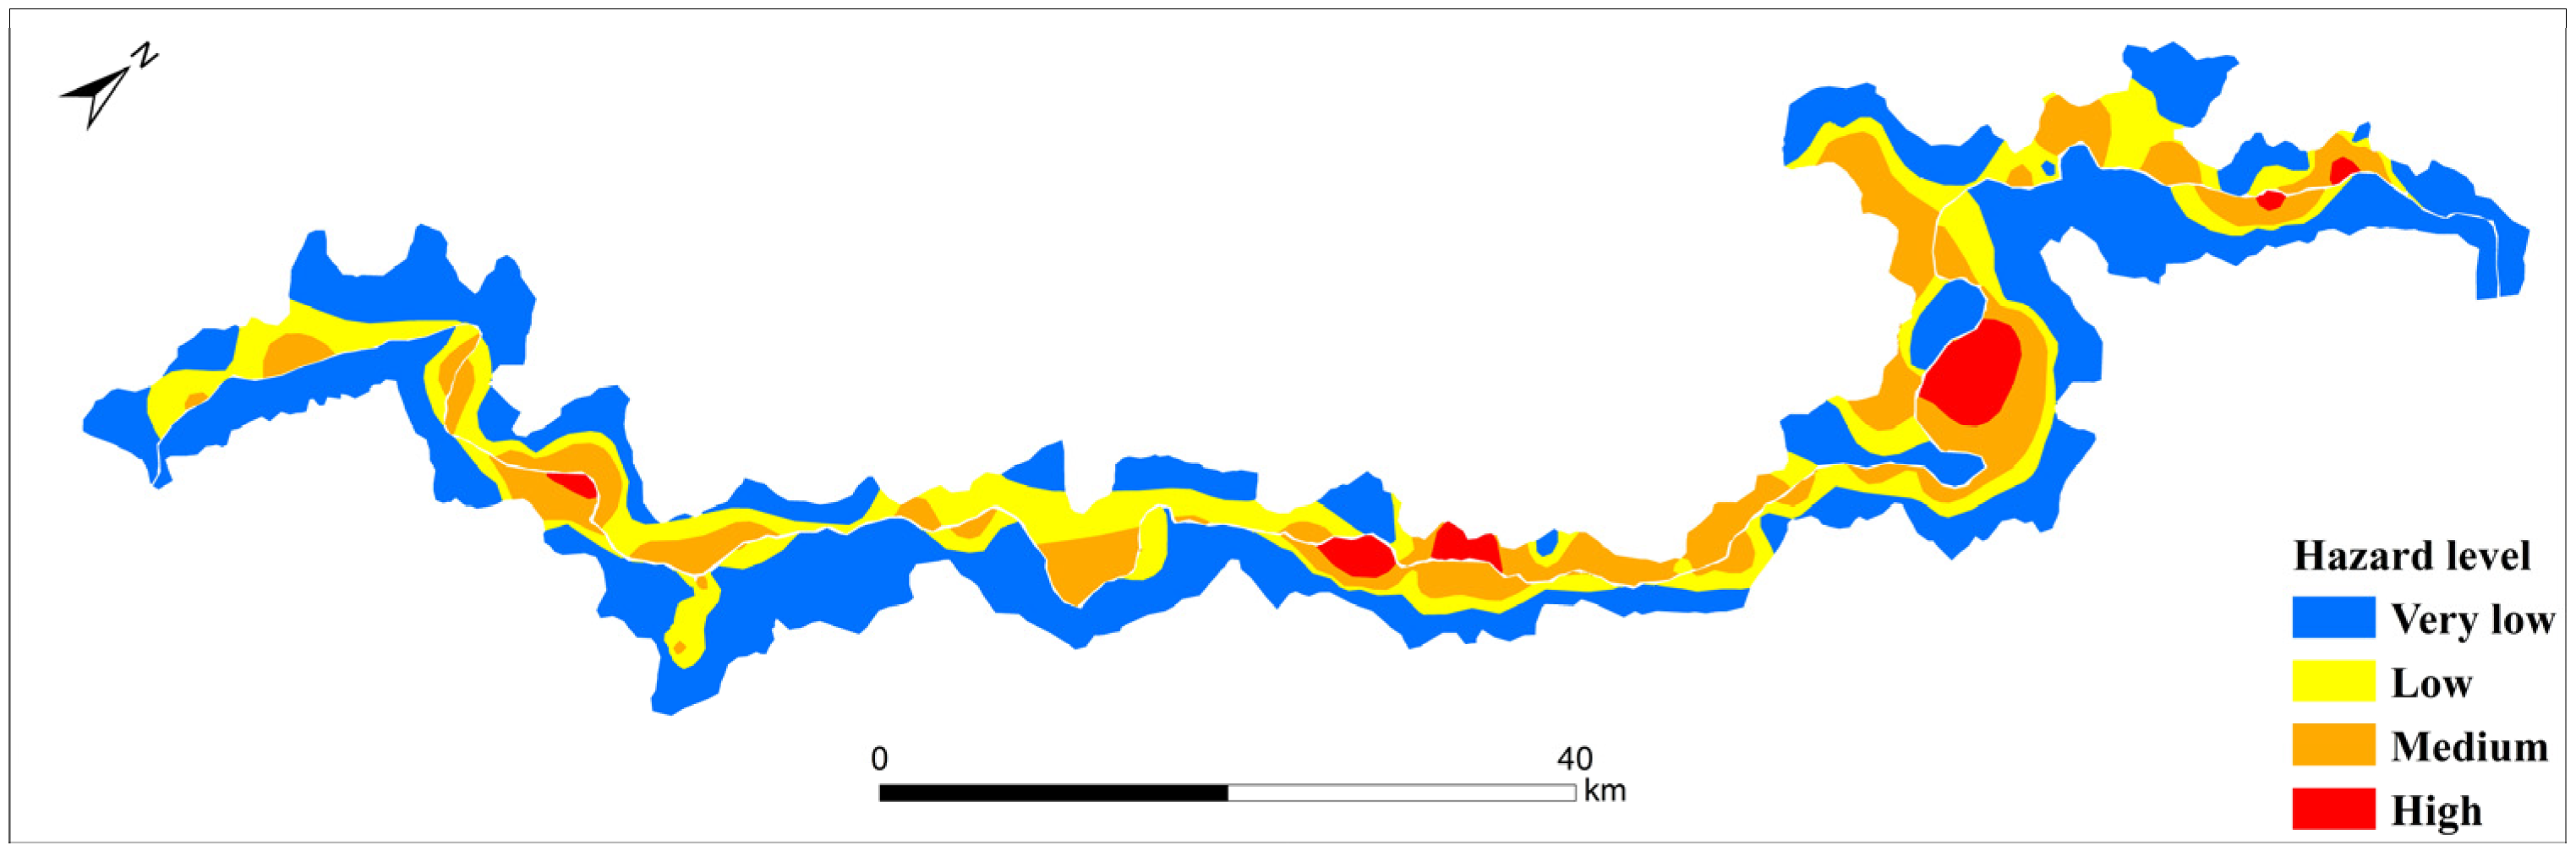
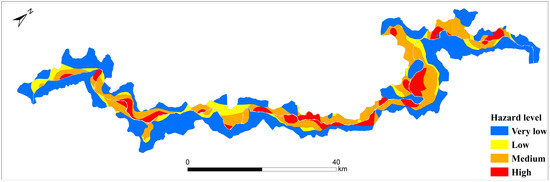
- Construction of the Hazard Layer: Based on field geological survey data, a vector database of potential bank collapse bodies was established. Considering that these identified accumulations are all distributed on the high and steep banks of the deep-cut Jinsha River valley, their topographic and geomorphological background is highly consistent. Therefore, the area attribute of the collapse polygons was selected as the input weight (Z-value) for interpolation, aiming to use it as a proxy indicator for potential collapse scale and energy release capacity to distinguish the destruction potential of different survey points at the regional level. In the interpolation process, the “Topo to Raster” tool in ArcGIS was utilized for calculation. The core algorithm of this tool is ANUDEM, which operates on the principle of iterative calculation via discretized thin-plate spline functions, generating a globally smooth spatial surface with continuous curvature while maintaining the extreme value characteristics of the input data. Specific parameters were set as follows: an output cell size of 10 m, 20 primary iterations, and the drainage enforcement option was disabled. Subsequently, the raster was reclassified into four discrete grades using the Natural Breaks (Jenks) method. Figure 2 illustrates the hazard classification map, showing that high-hazard zones are concentrated in deeply incised valley sections characterized by steep terrain and fractured rock-soil masses.Figure 2. Map showing the physical hazard levels of bank collapse across the study area.
- (2)
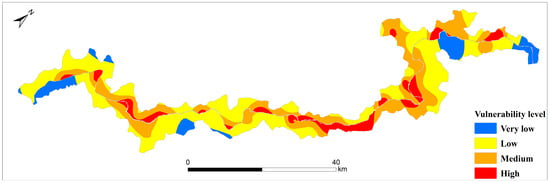
- Construction of the Vulnerability Layer: Data regarding elements at risk were derived from the interpretation of recent high-resolution satellite imagery and census data. The Euclidean Distance tool was utilized to calculate the distance from every pixel in the domain to the nearest settlement, generating a raster surface that conforms to the distance-decay law. Although Euclidean distance does not account for terrain aspect differences during the calculation process, it serves as an effective proxy indicator for measuring the spatial exposure of elements at risk in large-scale rapid evaluations at the regional scale. Subsequently, this raster was reclassified and converted into vector polygons. Figure 3 presents the vulnerability zonation results. The red high-vulnerability areas precisely cover towns and major transportation arteries along the river, reflecting the spatial exposure of human engineering activities.Figure 3. Vulnerability map showing the spatial exposure of residential buildings.
- (3)
- Synthesis of Risk Zonation: The topological overlay of vectorized Hazard and Vulnerability layers was executed using the Intersect tool. Subsequently, the assessment matrix logic in Figure 1 was implemented via the Python (version 2.7.10, integrated within ArcGIS version 10.4; Esri, Redlands, CA, USA) Field Calculator in the attribute table to synthesize final risk ratings. This computation classifies regional risk into four distinct levels: High, Medium, Low, and Very Low, and the generated regional risk zonation map is presented in Figure 4. The analysis reveals a macroscopic risk pattern where high-risk zones are distributed in patches across densely populated areas with historical landslide activity. These results provide clear spatial guidance for the subsequent selection of specific work sites.Figure 4. Regional risk zonation map synthesized through the spatial overlay of hazard and vulnerability layers.
3.2. Site-Scale Reservoir Bank Collapse Hazard Evaluation
To verify the effectiveness of the multi-scale framework, three benchmark slopes, Fujiapingzi, Damaopo, and Ganhaizi, all distributed in the middle and lower reaches of the studied river section, although spatially concentrated, were selected for detailed analysis from three perspectives: spatial distribution, geological type, and risk level. These three cases represent typical ancient landslide deposits, intact layered rock structures, and fractured rock structures in the reservoir area, respectively, covering high, medium, and low risk levels. Although currently limited by the acquisition of detailed exploration data and verified based on a small number of work sites, the developed standardized GIS calculation component possesses the technical prerequisite for migration to more extensive reservoir systems. This logic of calibrating macro-models with typical work sites provides a feasible path for the transition from qualitative estimation to physics-driven precision risk management. To quantitatively evaluate site-scale stability, risk classification criteria based on the safety factor () were established, as outlined in Table 1 [46].
Table 1.
Hazard level classification of bank collapse at site scale.
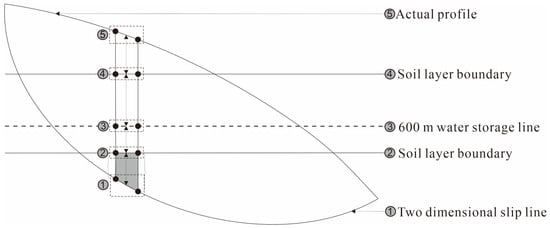
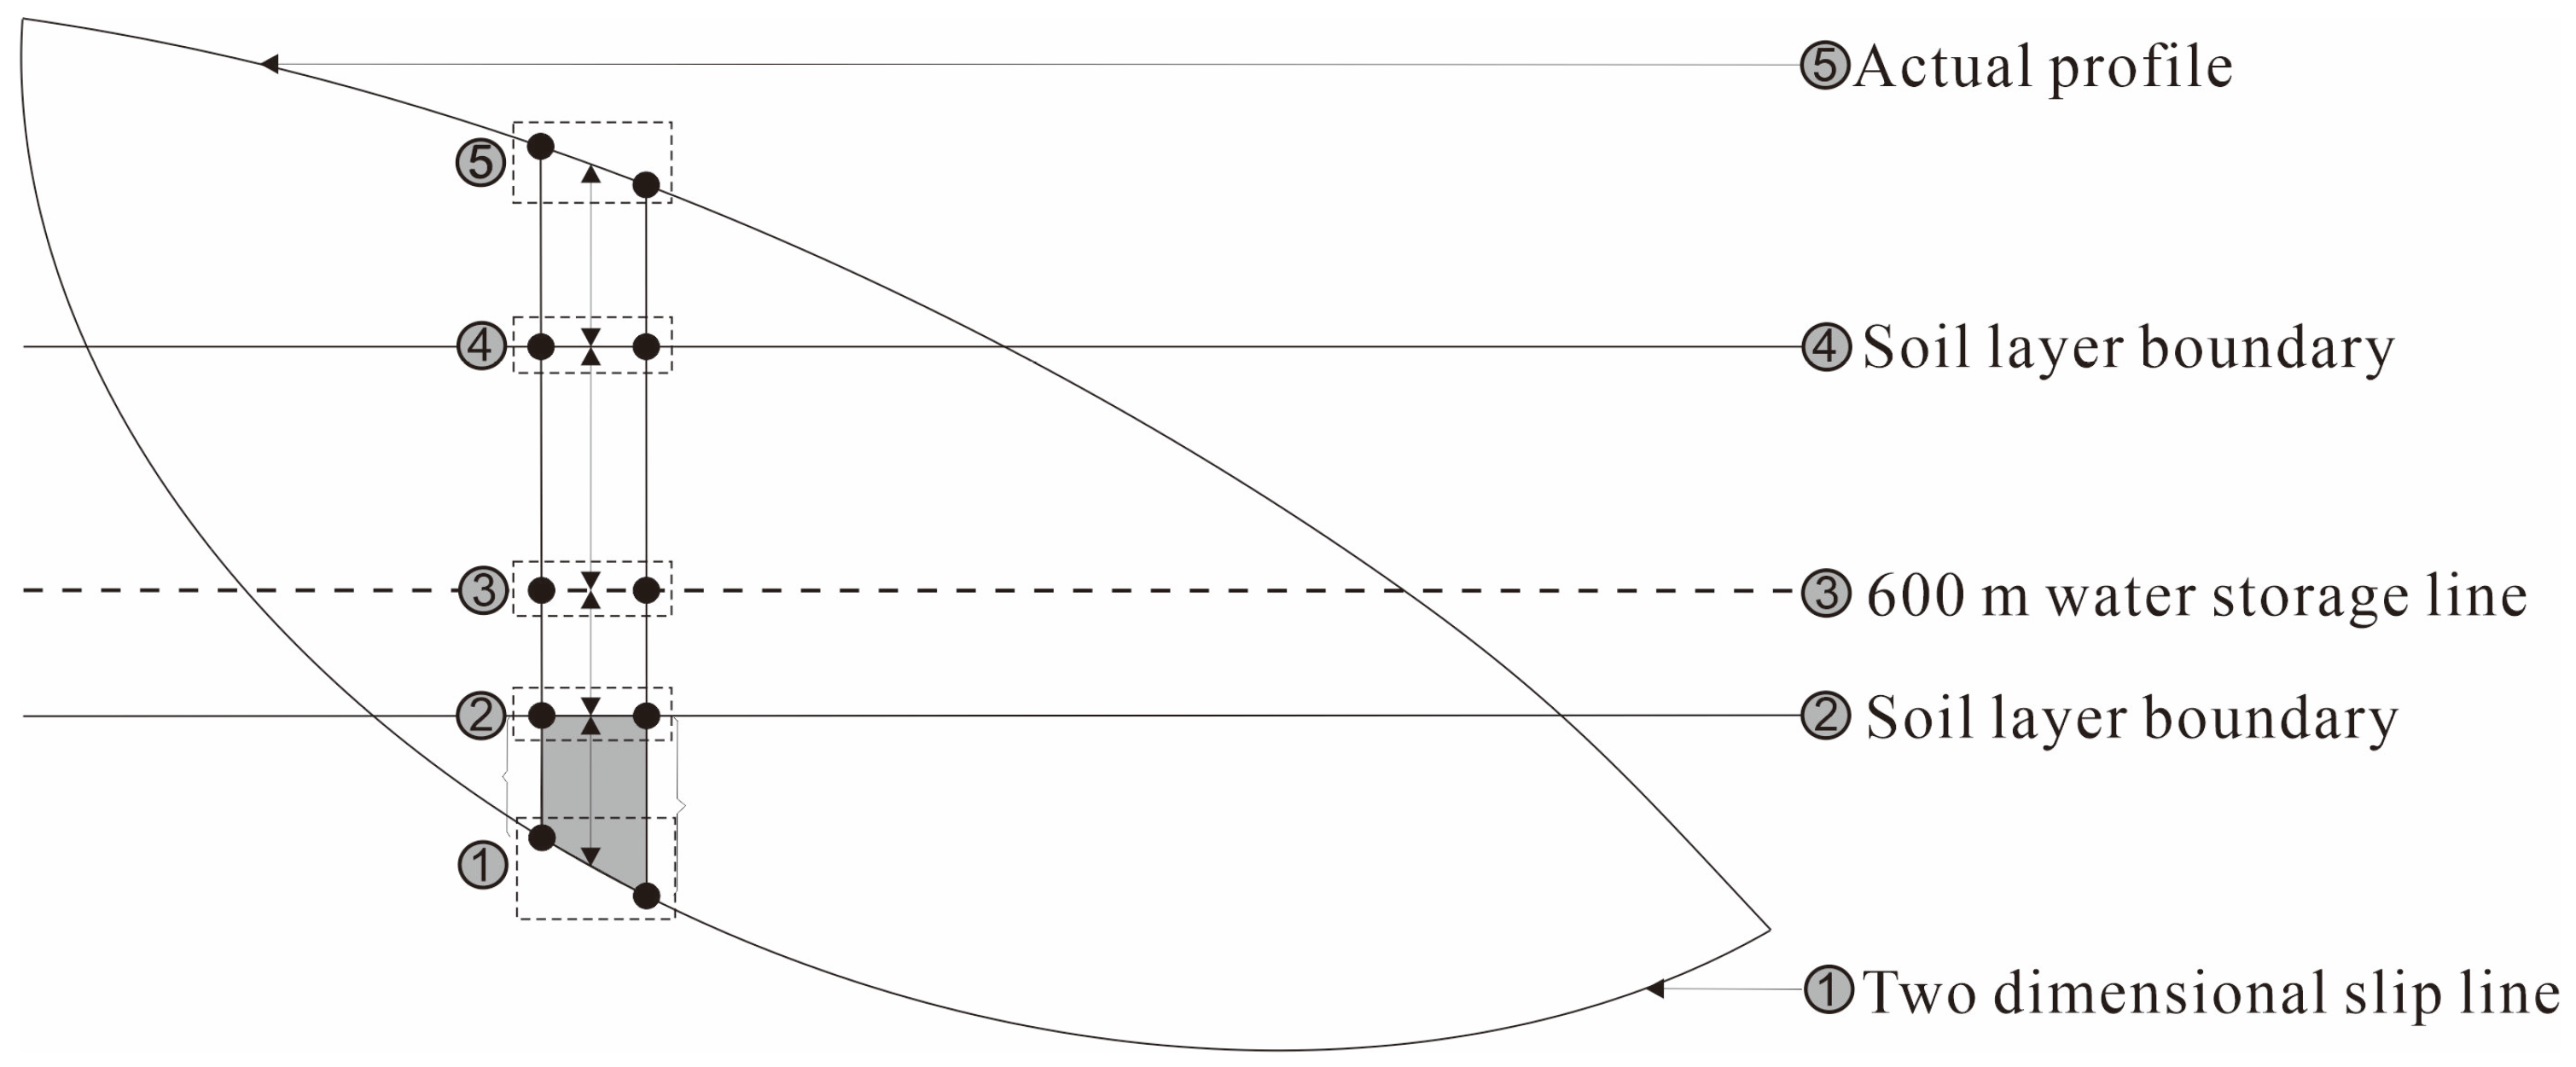
During the calculation of the Factor of Safety () using Bishop’s method, the bank collapse body was first divided into three stratigraphic layers based on geological survey data, as illustrated in Figure 5. The 600 m normal pool level of the reservoir was selected as the boundary to divide, the soil mass was separated into underwater and above-water sections, primarily based on the actual operating characteristics of the Xiluodu Reservoir. Since its completion, the water level has predominantly operated at the 600 m normal pool level with minor seasonal fluctuations. To simplify the calculation, saturated parameters were applied to the underwater section, while natural parameters were adopted for the section above the water level. The scope of this evaluation is strictly limited to this long-term high-water steady-state condition to establish a conservative stability baseline for regional-scale screening. Although this approach effectively reflects soil strength attenuation under peak water levels, it must be explicitly stated that the current model is a steady-state approximation and does not capture the most critical transient scenarios, most notably the hydrodynamic pressure effects associated with rapid reservoir drawdown. Utilizing the GIS component developed in this study and based on high-resolution DEMs, slope profiles were automatically extracted, and the equal-spacing slicing method was adopted. For small and medium-sized landslides, the horizontal spacing was set to 20 m, while for large-scale complex landslides, the spacing was refined to 5 m to enhance geometric fitting accuracy, with the absolute difference in safety factor between two iterations set to be less than 0.001. Following the delineation of soil zones and slices, and incorporating the slip surface determined via field surveys, the Factor of Safety was calculated using Bishop’s method. The soil parameters used in the calculation are listed in Table 2.
Figure 5.
Schematic diagram of soil stratification for site-specific stability analysis.
Table 2.
Soil parameters in natural state and saturated state 1.
Analysis of Calculation Results
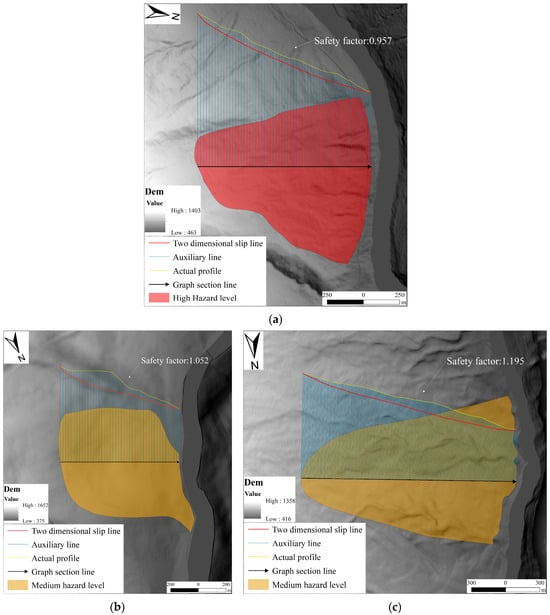
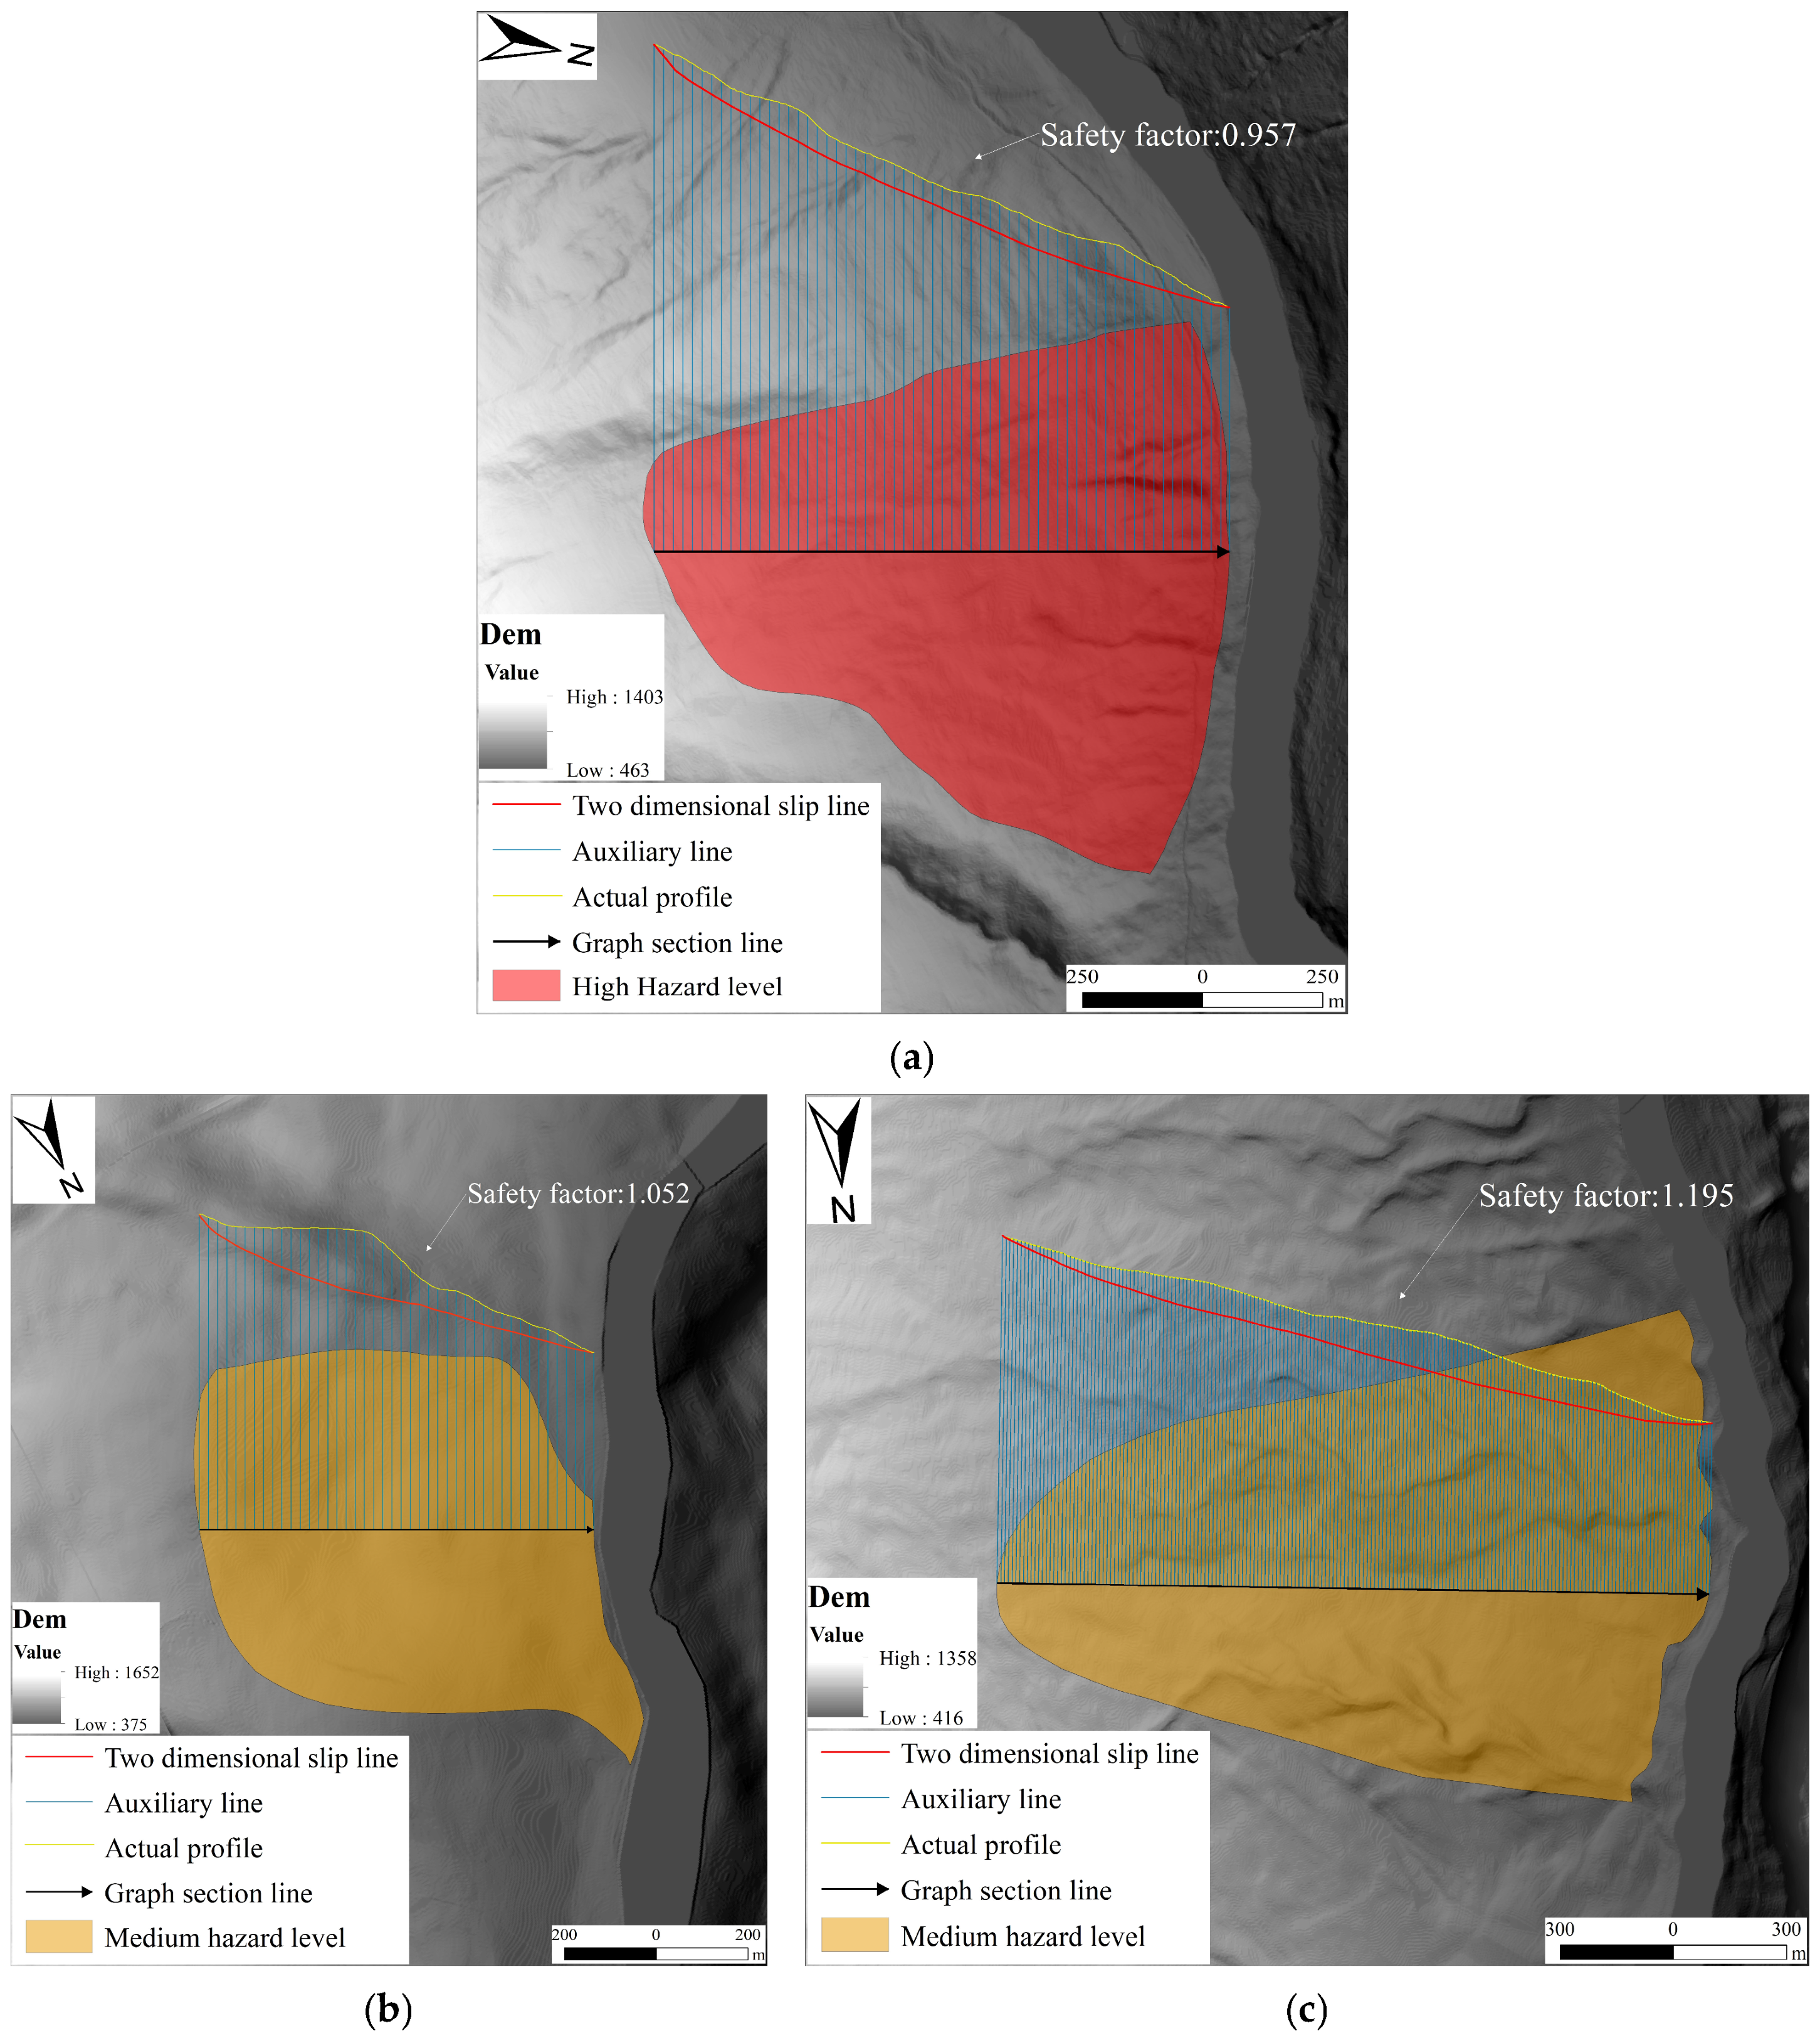
The iterative calculation results of Bishop’s method reveal the actual stability status of each slope under limit equilibrium conditions (Figure 6).
Figure 6.
Site-specific stability calculation results using Bishop’s method. (a) Fujiapingzi Landslide; (b) Ganhaizi Landslide; (c) Damaopo Landslide.
- (1)
- Fujiapingzi ( = 0.957): As shown in Figure 6a, the result is less than 1.0, with the critical slip surface cutting through the slope toe. This indicates that the slope is in an unstable state under full reservoir operation and is highly prone to large-scale reactivation. This finding corrects the risk underestimation in the regional assessment caused by vulnerability weighting, confirming its “High Hazard” classification.
- (2)
- Ganhaizi ( = 1.052): As shown in Figure 6b, the slope is in a marginally stable state (1.0 < < 1.05). Although failure has not yet occurred, safety reserves are insufficient under scenarios such as heavy rainfall or rapid drawdown. It is recommended to classify this as a “Medium Hazard” area requiring monitoring.
- (3)
- Damaopo ( = 1.195): As illustrated in Figure 6c, the safety factor is significantly greater than 1.15, indicating good overall stability. It falls within the “Low Hazard” category.
These quantitative data not only validate the trends identified in the regional assessment but also provide specific physical metrics, shifting engineering decision-making from “qualitative estimation” to “quantitative evidence.” Furthermore, to verify the stability of these deterministic results, a sensitivity test was conducted on the Fujiapingzi landslide. By applying a perturbation to the shear strength parameters (), the calculated fluctuated between 0.885 and 1.043, confirming that the slope remains in a critical or unstable state regardless of minor parameter variations, which further reinforces the reliability of the site-scale hazard classification.
3.3. Coupling and Feedback Between Risk Assessments at Different Scales
The final phase of implementation involves executing a “Bottom-up” data feedback loop, implemented as a heuristic, conservative screening correction to address potential underestimations in the macroscopic assessment. While this approach demonstrates how micro-scale findings can override macro-scale indices at specific nodes, it remains a local correction strategy.
- (1)
- Spatial Linkage and Attribute Updating: Linking the point or line features generated from site-specific calculations with regional polygon features relies on the data management and Spatial Join functionalities of the GIS platform. Within the database, every bank collapse object—whether a polygon in the regional assessment or a point/line feature in the site-specific assessment—is assigned a Unique Identifier (Unique ID). When a more accurate Factor of Safety () is obtained at the site-specific scale, this value is not used to directly overwrite the regional risk level but rather to calibrate the hazard attribute of the object. The specific logic is defined as follows: if the indicates that the slope is in an unstable state, the system will precisely locate the specific geological polygon unit containing the point via the identification code. Corrections are limited to evaluation units with clear physical associations, rather than indiscriminate full-area coverage. This local correction strategy maximizes the avoidance of regional over-correction risks caused by the uneven distribution of work sites. Subsequently, based on the updated Hazard level and the pre-existing Vulnerability level, the risk matrix logic is automatically re-executed to derive the corrected final Risk level. In this process, an unstable state ( < 1.0) overrides pre-existing vulnerability constraints to mandatorily upgrade the final rating to “High Risk” for maximum safety. This enables the macroscopic risk map to dynamically integrate micro-scale findings, thereby continuously approximating the true risk distribution.
- (2)
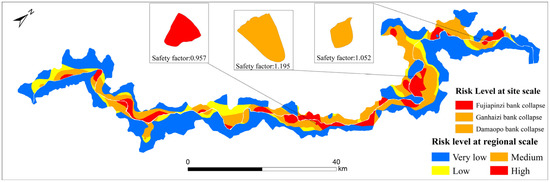
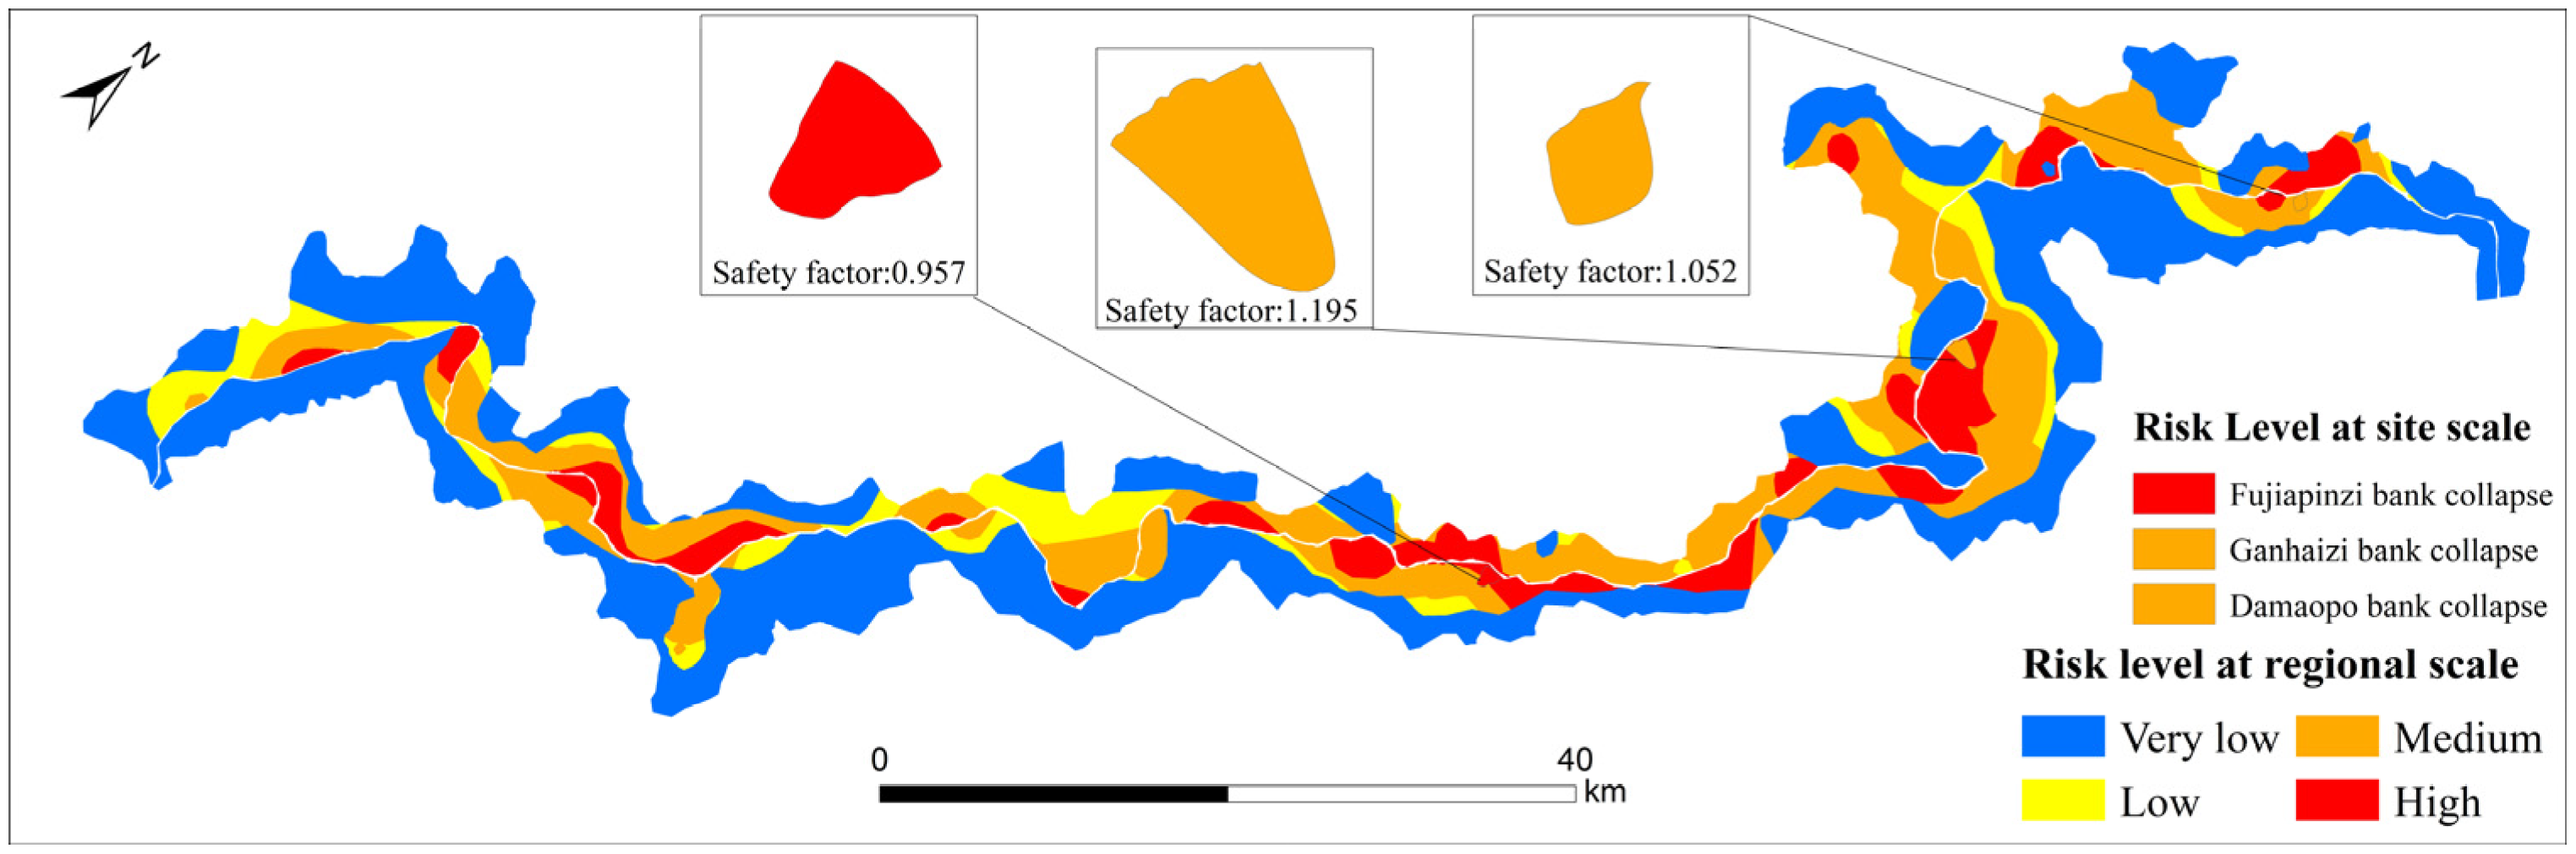
- Analysis of Dynamic Calibration Results: Taking the Fujiapingzi landslide as an example: in the initial regional assessment, its hazard was rated as “Medium” due to interpolation smoothing; combined with a relatively significant distance from settlements (indicating lower vulnerability), its comprehensive risk was initially classified as “Medium Risk.” However, site-specific physical calculations based on Bishop’s method confirmed that the slope is actually in a critical unstable state ( < 1.0). Based on this result, the system first corrected the Hazard level of the corresponding polygon to “High.” Consequently, the risk matrix recalculation process was triggered, finally outputting the comprehensive risk level for that area. Figure 7 illustrates the updated risk situation map. Compared to the initial state in Figure 4, the updated map provides more precise early warning information at critical local nodes. This dynamic correction mechanism, based on GIS data flow, successfully injects the computational precision of geotechnical mechanics into broad-scale spatial management, achieving a unity of “macroscopic controllability” and “microscopic reliability.”Figure 7. Updated regional risk map incorporating site-scale safety factor corrections.
3.4. Validation of Results
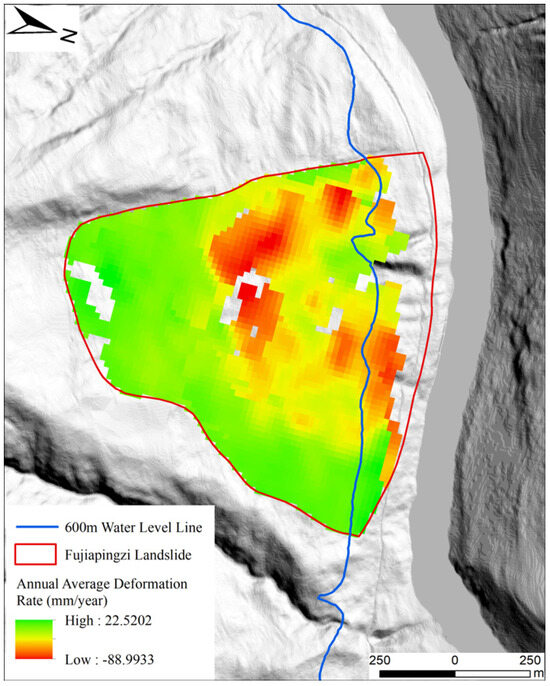
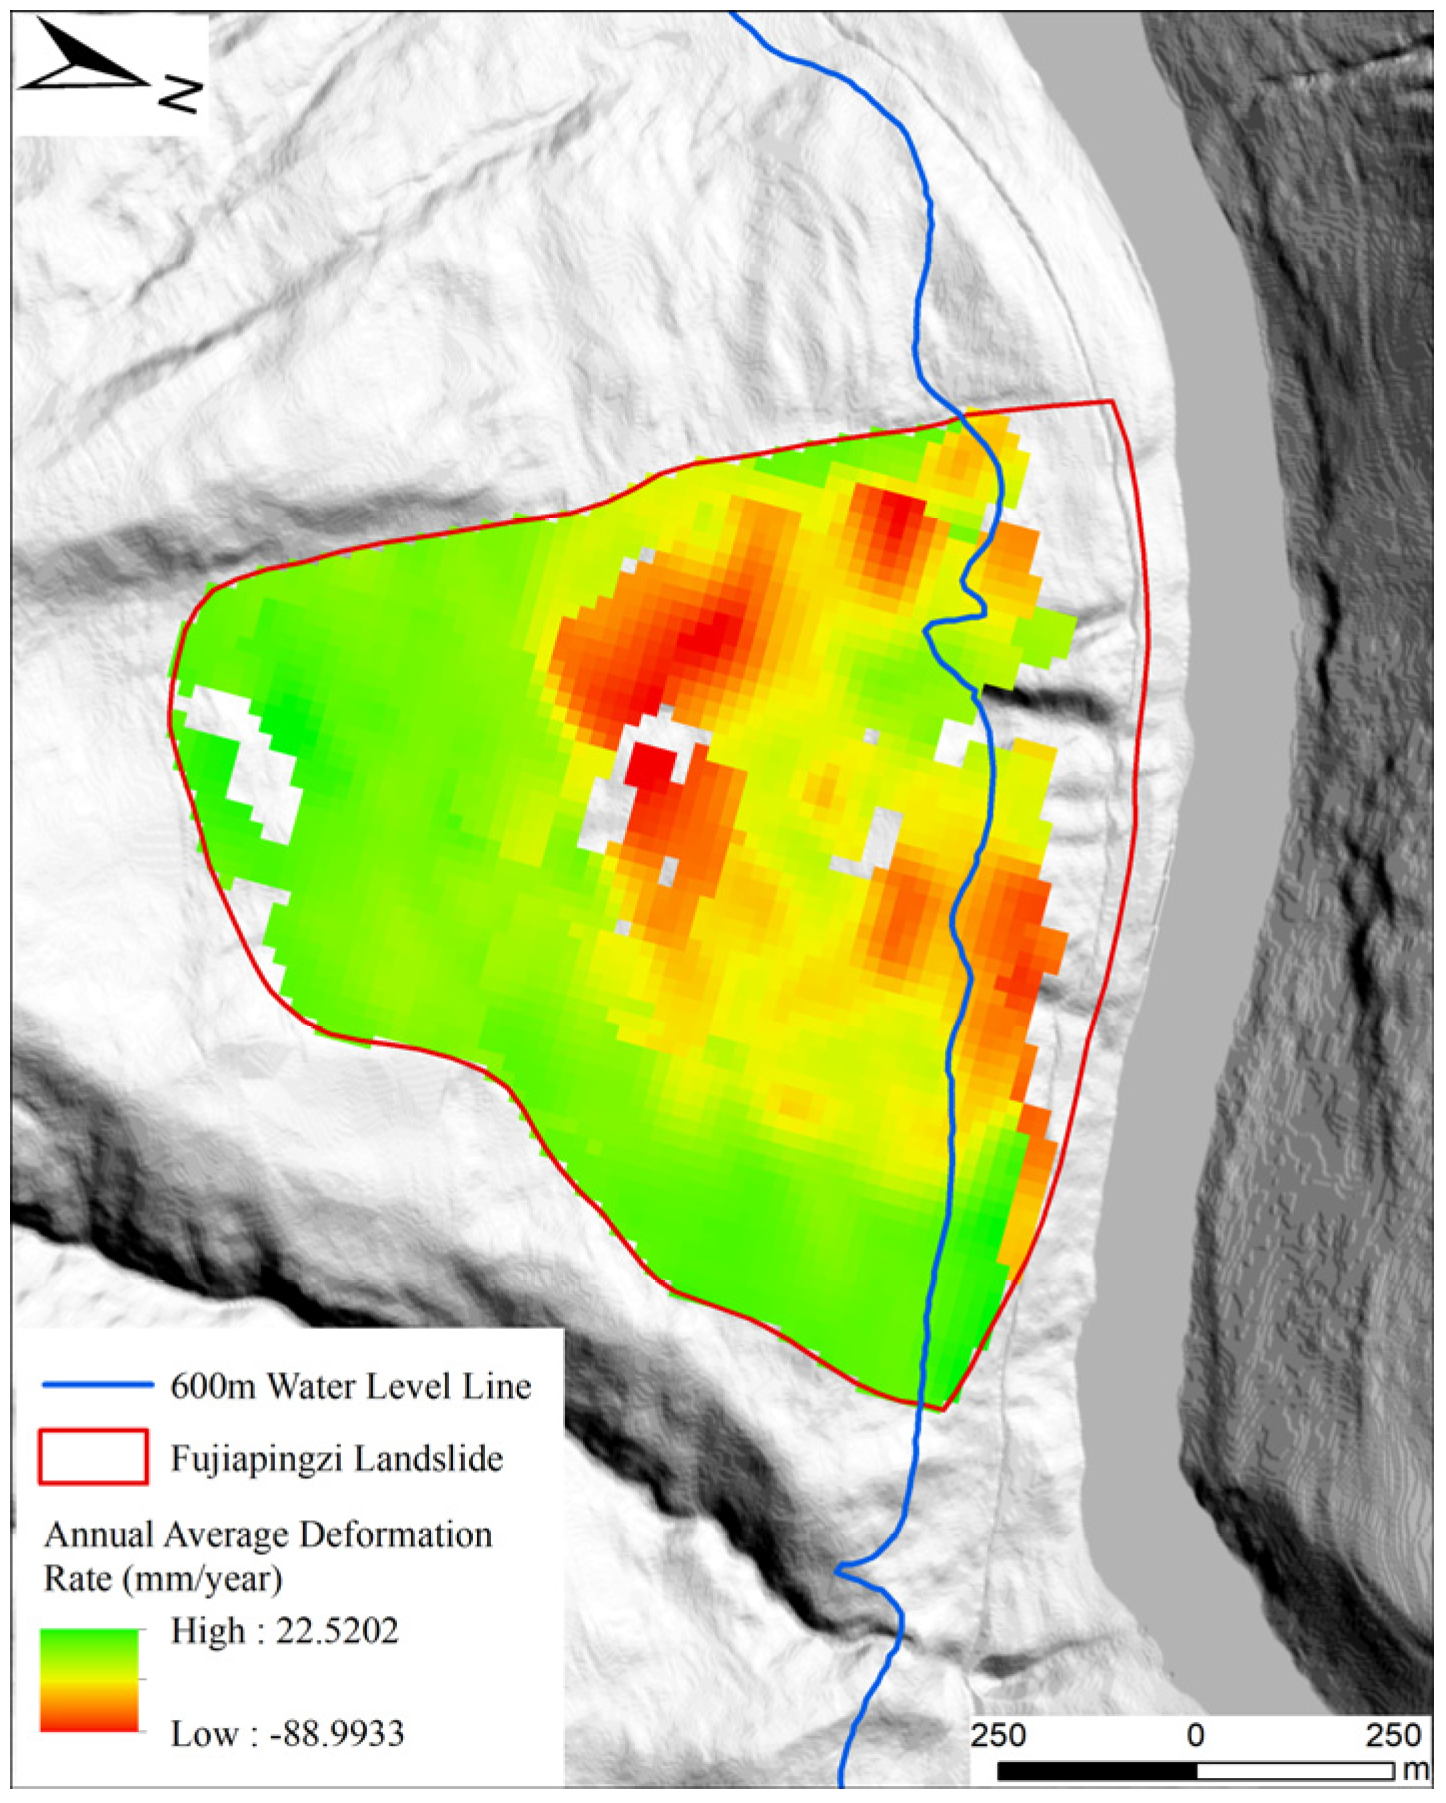
To validate the reliability of the proposed multi-scale assessment framework, independent surface deformation monitoring of the reservoir bank was conducted using SBAS-InSAR technology (utilizing 96 Sentinel-1A images from 2020 to 2024). The annual average deformation rate distribution (Figure 8) reveals significant subsidence within the Fujiapingzi landslide area, with a local maximum deformation rate reaching −88.99 mm/a. These active deformation zones exhibit high spatial consistency with the high-hazard areas identified by Bishop’s method, which were subsequently updated to “High Risk” in the final map.
Figure 8.
Surface deformation rate map of the Fujiapingzi landslide.
The monitoring data indicate that the slope is currently in an active creeping stage, which strongly corroborates the critical instability state ( = 0.957) identified through site-specific mechanical calculations. Consequently, the dynamic correction of the risk level for this area from the initial “Medium Risk” to “High Risk” is supported by robust empirical evidence. The convergence of multi-source data validates the inherent consistency between physical–mechanical diagnosis and surface monitoring results, demonstrating the effectiveness of the proposed framework in the risk identification of reservoir bank collapses.
4. Discussion
This study presents a multi-scale workflow that links preliminary regional risk screening with individual-scale hazard evaluations, enabling a more focused comprehension of reservoir bank collapse risks. At the regional scale, the macroscopic index serves as an efficient screening tool, assisting decision-makers in directing attention to specific areas requiring detailed investigation. As a first-order screening proxy based on spatial exposure, this regional index provides a strategic tool for prioritization without the immediate need for complex modeling of structural fragility or asset values. Although this GIS-based rapid identification has limited precision, it is invaluable for preliminary planning and risk zoning. At the site-specific scale, refined evaluation using Bishop’s method provides specific quantitative metrics that reflect slope stability.
- (1)
- Traditional regional assessments often rely excessively on heuristic qualitative factors, lacking physical mechanistic explanations. By developing a customized GIS component, this study achieved the automatic conversion of high-resolution DEMs into 2D computational profiles required for Bishop’s method. This innovation resolves a critical bottleneck in geological hazard analysis: the difficulty of batch-processing mechanical stability calculations over large areas. As demonstrated in the Xiluodu Reservoir case, the system successfully identified the unstable state of the Fujiapingzi slope ( < 1.0), a high risk that was masked in the initial regional interpolation. The application to the Xiluodu Reservoir demonstrates that embedding deterministic models into GIS offers a plausible mechanism for local risk correction based on physical evidence.
- (2)
- The “bottom-up” dynamic feedback mechanism realizes a paradigm shift in management. From the perspective of Spatial Decision Support, the proposed “bottom-up” feedback mechanism represents a shift from “static zoning” to “dynamic management,” which is of great significance for future disaster prevention and mitigation as well as engineering measures. The quantitative results provided by site-specific hazard assessments are used to dynamically correct regional evaluations, effectively enhancing the geological reliability of risk zoning. This correction logic was strongly supported in the verification stage: SBAS-InSAR monitoring showed significant deformation of the Fujiapingzi landslide, which is highly spatially coupled with the instability state obtained from mechanical calculation, proving that the feedback mechanism can accurately correct the deviation of macro-evaluation. The organic combination of these two scales achieves a more comprehensive and accurate identification and delineation of risk zones, providing strong support for the protection of critical infrastructure such as highways, bridges, and residential areas around the reservoir. This approach plays an irreplaceable role in ensuring the safety and resilience of large-scale hydraulic projects.
- (3)
- Sensitivity analysis confirmed the framework’s robustness. For the Fujiapingzi landslide, perturbations in shear strength parameters () resulted in values ranging from 0.885 to 1.043. Despite these fluctuations, the “High Risk” classification remained consistent across all unfavorable scenarios. This demonstrates that the “most unfavorable parameter” strategy effectively converts micro-level physical uncertainty into a macro-scale safety margin, providing a reliable physical baseline for rapid regional risk screening.
- (4)
- Limitations Analysis. Despite its advantages, several constraints should be noted. First, the inherent lag in post-impoundment geohazards and a limited number of monitoring samples currently hinder extensive statistical validation. Second, the hydrologic modeling is focused on steady-state conditions at the normal pool level. While this provides a conservative baseline for soil strength attenuation, it does not capture the most critical transient scenarios, such as hydrodynamic pressure effects during rapid reservoir drawdown. Consequently, the framework functions as a screening tool for static end-member conditions rather than a dynamic predictive model for operational fluctuations. Third, using collapse-polygon area as a magnitude weight is an approximation for regional screening and cannot substitute for detailed volume-based physical simulations. Fourth, the bottom-up feedback mechanism is currently a heuristic, conservative screening correction demonstrated on a small sample of benchmark slopes. While these cases illustrate the framework’s potential, a much broader evaluation across more sites would be required before claiming any systematic improvement of the entire regional zonation. Finally, the distance-based vulnerability proxy is a simplified measure that omits terrain influences and more detailed socioeconomic indicators.
- (5)
- Future Research Perspectives. To address the aforementioned limitations regarding static hydrological assumptions and historical data latency, future research could incorporate real-time monitoring data (e.g., InSAR) or machine learning algorithms, to continuously calibrate the assessment. To overcome the potential bias of heuristic feedback rules derived from the current small number of typical cases, expanding the site-specific calculation sample library will be essential to enhance the systematic accuracy of the framework. Meanwhile, to mitigate the uncertainties inherent in regional-scale hazard proxies, future studies could further introduce probabilistic models to more finely characterize the impact of site-scale parameter fluctuations on cross-scale feedback logic, thereby perfecting the prediction capability of the multi-scale coupled evaluation system under extreme conditions.
5. Conclusions
Accurate risk assessment of reservoir bank collapse is a prerequisite for the safe operation of large-scale hydraulic projects. To address the challenge of scale disconnection in current assessments, this paper proposes a GIS-integrated framework. The main conclusions are as follows:
- (1)
- Construction of a multi-scale coupled framework: A hierarchical assessment system was established and illustrated on a small number of benchmark slopes. At the regional scale, rapid zoning was achieved using a spatial multi-criteria risk screening index based on the “Hazard-Vulnerability” interaction. At the site-specific scale, a deterministic model based on Bishop’s method was introduced. The two scales are seamlessly connected via a GIS data management platform, realizing the organic fusion of qualitative screening and quantitative diagnosis.
- (2)
- Realization of automated geotechnical analysis within GIS: A customized GIS component was developed to automate slope profile extraction, geometric discretization, and water-level-dependent parameter mapping. Application in the Xiluodu Reservoir backwater area demonstrates that the tool efficiently calculated the stability of typical slopes, such as Fujiapingzi ( = 0.957, High Risk) and Ganhaizi ( = 1.052, Medium Risk), providing a conservative physical basis for risk grading under static hydrological conditions.
- (3)
- Realization of dynamic risk management: The “bottom-up” screening correction mechanism demonstrated a plausible conservative feedback rule. By illustrating the approach on a small number of benchmark slopes, this research provides a strategic screening tool for regional risk patterns. While its systematic reliability requires further validation across more sites, the framework illustrates a potential pathway for an integrated Spatial Decision Support System (SDSS) that balances macroscopic monitoring and microscopic engineering mitigation, ultimately enhancing the resilience of critical infrastructure in complex reservoir environments.
Author Contributions
Conceptualization, X.W.; Methodology, X.W., H.L. and Z.W.; Software, X.W. and Z.W.; supervision, X.W. and H.L.; Validation, Z.W.; Formal analysis, X.W. and Z.W.; Investigation, Z.W. and Y.L.; Resources, X.W. and H.L.; Data curation, X.W., Z.W. and Y.L.; Writing—original draft preparation, Z.W.; Writing—review and editing, X.W. and Z.W. All authors have read and agreed to the published version of the manuscript.
Funding
This research received no external funding.
Institutional Review Board Statement
Not applicable.
Informed Consent Statement
Not applicable.
Data Availability Statement
The raw data supporting the conclusions of this article will be made available by the authors on request.
Conflicts of Interest
The authors declare no conflicts of interest.
References
- Merriam-Webster. Merriam-Webster’s Collegiate Dictionary, 11th ed.; Merriam-Webster, Inc.: Springfield, MA, USA, 2003. [Google Scholar]
- Zhang, L. Theories and Methods of Geological Hazard Risk Assessment. China Geol. Miner. Econ. 1996, 4, 40–45+14. [Google Scholar]
- Tang, H.; Wasowski, J.; Juang, C.H. Geohazards in the Three Gorges Reservoir Area, China–Lessons Learned from Decades of Research. Eng. Geol. 2019, 261, 105267. [Google Scholar] [CrossRef] [Scilit]
- Hungr, O.; Fell, R.; Couture, R.; Eberhardt, E. (Eds.) Landslide Risk Management; CRC Press: Boca Raton, FL, USA, 2005. [Google Scholar] [CrossRef] [Scilit]
- Dai, F.C.; Lee, C.F.; Ngai, Y.Y. Landslide Risk Assessment and Management: An Overview. Eng. Geol. 2002, 64, 65–87. [Google Scholar] [CrossRef] [Scilit]
- Qiao, J.; Wang, M.; Wu, C. Study on Wenchuan earthquake-induced landslide risk zonation. J. Eng. Geol. 2015, 23, 175–181. [Google Scholar] [CrossRef]
- Wang, L.; Chang, M.; Xing, Y.L. Risk Assessment of Landslide Geological Hazards Based on Information Method Model and GIS. J. Geol. Hazards Environ. Preserv. 2021, 32, 14–20. [Google Scholar]
- Porter, M.; Morgenstern, N. Landslide Risk Evaluation: Canadian Technical Guidelines and Best Practices Related to Landslides: A National Initiative for Loss Reduction; Geological Survey of Canada Open File 7321; Natural Resources Canada: Ottawa, ON, Canada, 2013; pp. 1–21. [Google Scholar] [CrossRef] [Scilit]
- Varnes, D.J. Landslide Hazard Zonation: A Review of Principles and Practice; UNESCO Press: Paris, France, 1984; pp. 1–63. [Google Scholar]
- Yermolaev, O.; Usmanov, B.; Gafurov, A.; Poesen, J.; Vedeneeva, E.; Lisetskii, F.; Nicu, I.C. Assessment of Shoreline Transformation Rates and Landslide Monitoring on the Bank of Kuibyshev Reservoir (Russia) Using Multi-Source Data. Remote Sens. 2021, 13, 4214. [Google Scholar] [CrossRef] [Scilit]
- Mejía-Navarro, M.; Wohl, E.E.; Oaks, S.D. Geological Hazards, Vulnerability, and Risk Assessment Using GIS: Model for Glenwood Springs, Colorado. Geomorphology 1994, 10, 331–354. [Google Scholar] [CrossRef] [Scilit]
- Ohlmacher, G.C.; Davis, J.C. Using Multiple Logistic Regression and GIS Technology to Predict Landslide Hazard in Northeast Kansas, USA. Eng. Geol. 2003, 69, 331–343. [Google Scholar] [CrossRef] [Scilit]
- Bhardwaj, A.; Sam, L.; Bhardwaj, A.; Martín-Torres, F.J. LiDAR Remote Sensing of the Cryosphere: Present Applications and Future Prospects. Remote Sens. Environ. 2016, 177, 125–143. [Google Scholar] [CrossRef] [Scilit]
- Dikshit, A.; Pradhan, B.; Alamri, A.M. Pathways and Challenges of the Application of Artificial Intelligence to Geohazards Modelling. Gondwana Res. 2020, 100, 290–301. [Google Scholar] [CrossRef] [Scilit]
- Hu, R.; Fan, L.; Wang, S.; Wang, L.; Wang, X. Theory and method for landslide risk assessment-current status and future development. J. Eng. Geol. 2013, 21, 76–84. [Google Scholar] [CrossRef]
- Xiang, X.; Huang, R. Risk assessment and risk management for slope geohazards. J. Geol. Hazards Environ. Preserv. 2000, 11, 38–41. [Google Scholar] [CrossRef]
- Huang, Z.R. Research on Geological Hazard Risk Assessment Based on GIS—A Case Study of Shanggan Area, Fuzhou. Master’s Thesis, Fuzhou University, Fuzhou, China, 2005. [Google Scholar]
- Silva-Cancino, N.; Salazar, F.; Sanz-Ramos, M.; Bladé, E. A Machine Learning-Based Surrogate Model for the Identification of Risk Zones Due to Off-Stream Reservoir Failure. Water 2022, 14, 2416. [Google Scholar] [CrossRef] [Scilit]
- Wang, Z.; Chen, Z.; Ma, K.; Zhang, Z. Machine-Learning-Based Hybrid Modeling for Geological Hazard Susceptibility Assessment in Wudou District, Bailong River Basin, China. GeoHazards 2023, 4, 157–182. [Google Scholar] [CrossRef] [Scilit]
- Merghadi, A.; Yunus, A.P.; Dou, J.; Whiteley, J.; Pham, B.T. Machine Learning Methods for Landslide Susceptibility Studies: A Comparative Overview of Algorithm Performance. Earth-Sci. Rev. 2020, 207, 103225. [Google Scholar] [CrossRef] [Scilit]
- Ghorbanzadeh, O.; Blaschke, T.; Gholamnia, K.; Meena, S.; Tiede, D.; Aryal, J. Evaluation of Different Machine Learning Methods and Deep-Learning Convolutional Neural Networks for Landslide Detection. Remote Sens. 2019, 11, 196. [Google Scholar] [CrossRef] [Scilit]
- Zhou, X.; Wen, H.; Zhang, Y.; Xu, J.; Zhang, W. Landslide Susceptibility Mapping Using Hybrid Random Forest with GeoDetector and RFE for Factor Optimization. Geosci. Front. 2021, 12, 101211. [Google Scholar] [CrossRef] [Scilit]
- Novellino, A.; Cesarano, M.; Cappelletti, P.; Di Martire, D.; Di Napoli, M.; Ramondini, M.; Sowter, A.; Calcaterra, D. Slow-Moving Landslide Risk Assessment Combining Machine Learning and InSAR Techniques. CATENA 2021, 203, 105317. [Google Scholar] [CrossRef] [Scilit]
- Chen, B. Research on Refined Landslide Risk Assessment Method Coupling Information Value Model and Machine Learning. Master’s Thesis, East China University of Technology, Nanchang, China, 2023. [Google Scholar]
- Reichenbach, P.; Rossi, M.; Malamud, B.; Mihir, M.; Guzzetti, F. A Review of Statistically-Based Landslide Susceptibility Models. Earth-Sci. Rev. 2018, 180, 60–91. [Google Scholar] [CrossRef] [Scilit]
- Anbalagan, R.; Singh, B. Landslide Hazard and Risk Assessment Mapping of Mountainous Terrains—A Case Study from Kumaun Himalaya, India. Eng. Geol. 1996, 43, 237–246. [Google Scholar] [CrossRef] [Scilit]
- Lan, H.X.; Wang, L.J.; Zhou, C.H. Study on GIS-Aided Model for Analysis of Landslide Hazard. J. Eng. Geol. 2002, 10, 421–427. [Google Scholar]
- Ma, X.; Li, Q.; Zhang, H.; Gao, D.; Long, J.; Li, Z. Prediction of Reservoir Bank Collapse Based on the Limit Equilibrium Theory. Adv. Civ. Eng. 2023, 2023, 9050873. [Google Scholar] [CrossRef] [Scilit]
- Ma, X.; Li, Q.; Li, T.; Wang, C.; Gao, D.; Zhang, H.; Li, C. Study on the Influencing Factors and Evolution of Loess Bank Collapse with Physical Modelling. Geoenviron. Disasters 2023, 10, 26. [Google Scholar] [CrossRef] [Scilit]
- Yu, X. Research on Landslide Susceptibility Evaluation Methods Based on Multi-Source Data and Multi-Scale Analysis. Ph.D. Thesis, China University of Geosciences, Wuhan, China, 2016. [Google Scholar]
- Chen, W.; Li, Y.; Xue, W.; Shahabi, H.; Ahmad, B.B. Modeling Flood Susceptibility Using Data-Driven Approaches of Nave Bayes Tree, Alternating Decision Tree, and Random Forest Methods. Sci. Total Environ. 2019, 701, 134979. [Google Scholar] [CrossRef] [Scilit]
- Miao, F.; Ruan, Q.; Wu, Y.; Qian, Z.; Kong, Z.; Qin, Z. Landslide Dynamic Susceptibility Mapping Base on Machine Learning and the PS-InSAR Coupling Model. Remote Sens. 2023, 15, 5427. [Google Scholar] [CrossRef] [Scilit]
- Wang, Y.; Wen, H.; Sun, D.; Li, Y. Quantitative Assessment of Landslide Risk Based on Susceptibility Mapping Using Random Forest and GeoDetector. Remote Sens. 2021, 13, 2625. [Google Scholar] [CrossRef] [Scilit]
- Guzzetti, F.; Reichenbach, P.; Cardinali, M.; Galli, M.; Ardizzone, F. Probabilistic Landslide Hazard Assessment at the Basin Scale. Geomorphology 2005, 72, 272–299. [Google Scholar] [CrossRef] [Scilit]
- Hong, H.; Xu, C.; Revhaug, I.; Bui, D.T. Spatial Prediction of Landslide Hazard at the Yihuang Area (China): A Comparative Study on the Predictive Ability of Backpropagation Multi-Layer Perceptron Neural Networks and Radial Basic Function Neural Networks. In Cartography-Maps Connecting the World: 27th International Cartographic Conference 2015-ICC2015; Springer: Cham, Switzerland, 2015; pp. 175–188. [Google Scholar] [CrossRef] [Scilit]
- Corominas, J.; Westen, C.V.; Frattini, P.; Cascini, L.; Smith, J.T. Recommendations for the Quantitative Analysis of Landslide Risk. Bull. Eng. Geol. Environ. 2014, 73, 209–263. [Google Scholar] [CrossRef] [Scilit]
- Qin, Y.; Yang, G.; Lu, K.; Sun, Q.; Xie, J.; Wu, Y. Performance Evaluation of Five GIS-Based Models for Landslide Susceptibility Prediction and Mapping: A Case Study of Kaiyang County, China. Sustainability 2021, 13, 6441. [Google Scholar] [CrossRef] [Scilit]
- Wang, Y.; Huang, J.; Tang, H. Automatic identification of the critical slip surface of slopes. Eng. Geol. 2020, 273, 105672. [Google Scholar] [CrossRef] [Scilit]
- Duncan, J.M.; Wright, S.G. Soil Strength and Slope Stability; John Wiley & Sons: Hoboken, NJ, USA, 2005. [Google Scholar]
- Simon, A.; Curini, A.; Darby, S.E.; Langendoen, E.J. Bank and Near-Bank Processes in an Incised Channel. Geomorphology 2000, 35, 193–217. [Google Scholar] [CrossRef] [Scilit]
- Reid, M.E.; Christian, S.B.; Brien, D.L. Gravitational Stability of Three-dimensional Stratovolcano Edifices. J. Geophys. Res. Solid Earth 2000, 105, 6043–6056. [Google Scholar] [CrossRef] [Scilit]
- Chen, Z.Y. Soil Slope Stability Analysis: Theory, Methods and Programs; China Water & Power Press: Beijing, China, 2003. [Google Scholar]
- Li, Z.L.; Yao, Y.; Cao, L.Z. Automatic Searching of the Most Dangerous Sliding Surface of a Homogeneous Slope Based on the Bishop Method. Opencast Min. Technol. 2009, 1, 20–21,24. [Google Scholar]
- Li, L.; Deng, D.P.; Zhao, L.H. A New Method for Stability Analysis of Layered Slopes Based on the Search for the Sliding Surface. J. Cent. South Univ. Sci. Technol. 2012, 43, 3996–4002. [Google Scholar]
- DZ/T 0438-2023; Specification for Geological Hazard Risk Investigation and Evaluation (1:50,000). Ministry of Natural Resources of the People’s Republic of China: Beijing, China, 2023.
- T/CAGHP 011-2018; Specification for Engineering Investigation of Rock Falls and Collapses (Trial). China Association of Geological Hazard Prevention: Beijing, China, 2018.

Disclaimer/Publisher’s Note: The statements, opinions and data contained in all publications are solely those of the individual author(s) and contributor(s) and not of MDPI and/or the editor(s). MDPI and/or the editor(s) disclaim responsibility for any injury to people or property resulting from any ideas, methods, instructions or products referred to in the content. |
© 2026 by the authors. Licensee MDPI, Basel, Switzerland. This article is an open access article distributed under the terms and conditions of the Creative Commons Attribution (CC BY) license.