


Abstract
Public transportation is among the safest modes of travel, yet many passengers experience insecurity while accessing stations, waiting and travelling, with consequences for ridership and for the mobility of those who depend heavily on public transport. This study examines how perceived safety is conceptualized, which factors shape it and what consequences follow from it. It synthesizes 114 core empirical studies and 74 supplementary sources published between 1974 and September 2026 and identified through a systematic search of five databases. The findings show that perceived safety is a context-dependent assessment only loosely related to recorded risk. Feelings of insecurity are often strongest during access and waiting stages rather than inside vehicles. Sexual harassment is widespread and substantially underreported. Gender emerges as the most consistent source of social differentiation, while additional disadvantages affect sexual and gender minorities, older adults, people with disabilities and low-income passengers. Perceived safety is generally strengthened by lighting, visibility, reliable information, other passengers and visible staff, whereas the effects of surveillance cameras and law-enforcement presence vary across user groups and contexts. The study proposes an integrative framework linking individual characteristics, situational conditions, the physical and social environment and system-level factors. It identifies practical priorities for transport operators and planners and highlights major research gaps.
1. Introduction
Public transportation is one of the safest modes of travel, yet a large proportion of riders feel unsafe when using it. Mortality rates per passenger-kilometer on buses and in urban rail transit are well below those of private cars [1], yet passengers and non-users still describe buses, bus stops, and train stations as threatening places [2,3]. This analysis refers to this discrepancy between recorded risk and subjective assessment as the “perception gap”.
This gap has practical implications. People who feel unsafe change their routes, travel at different times, choose more expensive modes of transportation, or give up public transit altogether [4,5]. The loss of riders reduces fare revenue and undermines the case for investing in services, at a time when ridership in many cities is already under pressure [6]. Sustainable urban mobility planning is based on the premise that people are willing to switch from cars to public transit [7], and this premise fails when the walk to the station, the wait, and the ride itself are perceived as risky. Furthermore, the burden is distributed unevenly. Women, sexual and gender minorities, older adults, people with disabilities, and low-income travelers report higher levels of fear and have fewer alternatives [8,9,10]. Thus, perceived safety is as much a matter of equity as it is an attribute of service quality [11].
The term “safety” encompasses three different types of threats in the field literature, and studies do not always specify which one they are referring to. The first is personal safety, which refers to crime, harassment, violence, and antisocial behavior by others. The second is road and operational safety, which refers to accidents, falls, unsafe boarding and alighting from transportation, and the condition of vehicles. The third is public health safety (the risk of infection in shared and enclosed spaces), which became evident during the COVID-19 pandemic. Most of the data pertains to personal safety, and this analysis reflects that proportion while also covering the other two threats to the extent that they influence travel decisions.
Research on this topic has developed in distinct directions. Criminologists study areas where crime is concentrated in public transportation and how design influences feelings of fear [2,12]. Transportation researchers treat safety as an attribute of service quality and satisfaction [13,14]. Researchers in the fields of public health and gender studies document harassment and its consequences [15,16,17]. Existing analyses are largely limited to a single domain or a single mode of transportation, particularly to train stations [18] or to women’s fear of becoming victims [19], and to date, no study has integrated the individual, social, environmental, operational, and technological determinants of perceived safety in public transportation as a whole.
This analysis brings these lines of research together. Its first objective is to clarify what safety perception is and how it has been theorized and measured. The second objective is to synthesize current knowledge regarding the determinants of perceived safety, ranging from passenger characteristics to station design and service organization. The third objective is to identify the consequences for travel behavior, ridership, and equity. The final objective is to highlight the implications for practice and to establish a research agenda. Bus-based systems and their associated waiting environments receive special attention, as they carry the largest number of public transit passengers worldwide and are the least studied [20].
The remainder of this paper is organized as follows. Section 2 describes how the literature review was conducted. Section 3, Section 4, Section 5, Section 6, Section 7, Section 8, Section 9 and Section 10 present a thematic synthesis, beginning with concepts and measurement, moving through crime, harassment, social identity, the built environment, operations, and emerging modes of transportation, and concluding with behavioral consequences. Section 11 proposes an integrative framework, Section 12 discusses implications for practice and policy, Section 13 sets out directions for future research, Section 14 describes the limitations, and Section 15 presents the conclusions.
2. Scope and Analytical Approach
The articles were identified through a systematic search conducted and documented in accordance with the PRISMA 2020 statement [21]. Five databases were consulted in September 2026: Scopus, Web of Science, ScienceDirect, SpringerLink, and Google Scholar, the latter being used as an additional search engine for gray literature and for identifying chains of previous and subsequent citations. The search string (Appendix A) combined a set of transportation-related terms (“public transportation,” “public transit,” “transit,” “bus,” “metro,” “subway,” or “rail”) with a set of perception-related terms (“perception of safety,” “perceived safety,” “sense of safety,” “fear of crime,” “perception of security,” “passenger safety,” or “travel safety”), applied to titles, abstracts, and keywords. No restrictions were imposed regarding year of publication or geographic location.
Eligibility criteria were established using the SPIDER tool, which is suitable for syntheses combining qualitative, quantitative and mixed-methods evidence [22]. Studies were considered eligible when they presented original empirical research on perceived safety, fear of crime, or perceived security among public transit users, potential users, or residents of areas served by public transit. The focus was on bus transportation systems, as well as their stations and stops; studies on other modes of transportation were included when they presented findings related to buses, covered a multimodal system that included buses, or offered insights that could reasonably be extended to bus travel. Studies were excluded when they measured safety solely through crime or accident statistics, when they were not empirical, when they were not written in English, or when the full text could not be obtained.
The searches yielded 1624 records. After removing duplicates and one ineligible record (an editorial note), the titles and abstracts were independently screened by authors, with disagreements resolved through discussions, and 238 were evaluated based on the full text. Another 124 were excluded, most often because they concerned modes of transportation related to micromobility, lacked conclusions related to buses, lacked an empirical component, or did not measure perceived safety. The database search therefore yielded 114 core empirical studies. Citation searching and targeted searches of Google Scholar identified a further 74 sources (Figure 1) covering fundamental theory on fear of crime and risk perception, environmental criminology, feminist and intersectional works on fear, research on service quality, previous analyses, research on train stations and walking, as well as general information on COVID-19, vehicle automation, paratransit, and equity in transportation. Methodological quality of the core empirical studies was appraised with the Mixed Methods Appraisal Tool (MMAT, version 2018) [23], which applies five design-specific criteria to qualitative, quantitative and mixed-methods designs. Each study was appraised by two authors independently, with disagreements resolved by discussion. Studies meeting four or five criteria were rated high, three moderate, and two or fewer low quality. Low-quality studies were retained only when their findings were corroborated by at least one moderate- or high-quality study, or when they documented a context otherwise absent from the corpus. To summarize the strength of evidence behind each finding, we classified it as consistent when supported by at least three moderate- or high-quality studies from at least two countries with no contrary findings; mixed when studies of comparable quality reported effects in different directions or for different groups; and limited when supported by fewer than three studies or by low-quality studies only.
Figure 1.
PRISMA flowchart.
The 188 sources were published between 1974 and 2026. Fifteen sources appeared before 2000, 28 between 2000 and 2009, 23 between 2010 and 2014, 50 between 2015 and 2019, and 72 from 2020 onwards, so that about two thirds of the sources (122 of 188) date from 2015 or later. Their contexts and modes of transportation are unevenly distributed (Table 1). Europe and the United States together account for 73 of the 128 sources with a recorded geographic setting (57%), and only 29 sources specifically address buses, seven of which focus on autonomous buses and shuttles. Nearly half of the sources (88 of 188) address public transportation in general, without distinguishing between modes of transportation.
Table 1.
Characteristics of studies.
The 188 sources, comprising the 114 core studies and the 74 additional sources, are distributed across eleven themes (Figure 2). Each source is counted once, under the theme of its main contribution, although many are cited under several themes in the text. Four themes dominate the corpus: the built environment and the entire journey (38 sources), crime, fear and perceived risk (32), sexual harassment and sexual violence (32), and gender inequality and women’s safety (31). The concentration of the literature on crime, harassment and women’s safety, set against the small number of studies on other vulnerable groups, anticipates the research gaps discussed in Section 13.
Figure 2.
Distribution of the 188 sources by theme.
Sections are organized around key ideas, and studies are cited whenever they are relevant to the argument, so a single study may appear in multiple sections. Effect sizes were not pooled because the study designs, populations, and measurements differ too greatly.
3. Concepts, Theories and Measurement
3.1. Definitions of Safety Perception
Perception of safety is not a single construct. Research on fear of crime distinguishes between an emotional reaction (usually described as fear or anxiety), a cognitive judgment regarding the probability and consequences of victimization, and a behavioral reaction, such as avoidance [24,25]. Thus, validated survey instruments treat concern, perceived risk, and perceived control as distinct constructs [26]. Studies that ask a single question about “sense of safety” conflate these components, which is one reason why their results are difficult to compare.
The perception of safety is also better understood as a state rather than a trait. Gabriel [25] distinguishes between a general disposition toward fear and the fear experienced in a specific situation, and experience-sampling studies show that fear varies for the same person depending on location and time of day [27]. A traveler or commuter is therefore not simply fearful or fearless, as this assessment is constantly updated throughout the journey. Risk research explains why this assessment deviates from statistical expectations. Some judgements weigh anxiety, uncontrollability and unfamiliarity more heavily than frequency [28]. In the field of transportation, concerns about accidents and concerns about unpleasant incidents involving other people are distinct concerns that vary by mode of transportation and predict its use [29,30,31,32], and the risks perceived by rail passengers correlate only weakly with actual risks [33].
3.2. Theoretical Perspectives
Five theoretical frameworks reoccur in the literature, which are best viewed as complementary, as they address different questions (Table 2). Opportunity and routine activity theory holds that crimes occur where motivated offenders and suitable targets meet in the absence of capable guards [34] and has been used to explain why crimes on public transportation are concentrated at certain stations, train stations, and times [2,35]. Crime prevention through environmental (CPTED) design translates this reasoning into principles of surveillance, access control, territoriality, maintenance, and support for activities [36], which underpin most audits conducted at stations and transit stops [37]. The “view, hide, and escape” theory suggests that people fear places with limited visibility, which offer hiding places for a potential offender and have blocked exits [38,39]. Explanations based on vulnerability and disorderly behavior link fear to a person’s perceived ability to cope with the situation and to visible signs of disorder [40]. Finally, feminist and intersectional approaches treat fear as an expression of power relations that combine gender, race, age, sexuality, and social class [41,42].
Table 2.
Theoretical perspectives used in research on perceptions of safety in public transportation.
Environmental approaches dominate practice because they highlight aspects that a practitioner can change. Feminist geographers suggest that design alone cannot eliminate fear rooted in social relations [44,46]. The evidence analyzed below supports both positions, in the sense that design matters, and its effects differ depending on who is traveling.
A second, largely distinct tradition treats safety as an attribute of service quality. Customer satisfaction models include safety and security alongside reliability, frequency, comfort, and information [13,14,47,48], and behavioral models incorporate attitudes and perceptions to explain public transportation use [49]. This tradition links perceived safety to satisfaction, perceived accessibility and loyalty [50,51], although it often measures safety using only one or two elements.
3.3. Measurements of Safety Perception
The reviewed sources employ at least nine measurement approaches (Table 3). These range from individual questionnaire items and scenario evaluations, through multi-item latent constructs and composite indices, to visual experiments, victimization surveys, environmental audits, direct observation, digital traces, and qualitative accounts. The approaches involve clear trade-offs. Self-report measures are inexpensive and allow comparison across time and places, but single items mix emotional, cognitive and behavioral components and rarely specify the threat or the stage of the journey. Experimental designs offer control over individual attributes at the cost of realism, while audits and sensors measure conditions independently of respondents but say nothing directly about how those conditions are felt. Digital traces provide scale and spatial detail but represent self-selected users. Because each approach is biased in a different direction, the most informative studies combine them, for example by pairing environmental audits or sensor data with stage-specific surveys at the same sites [20,52,53].
Table 3.
Approaches to measuring perceptions of safety in major studies.
This diversity gives rise to three main measurement challenges. First, studies often fail to specify the particular source of fear, combining concerns related to crime, harassment, accidents, and infections within a single measure. Second, the stage of the journey is frequently not distinguished, despite evidence that perceptions of fear may vary considerably between walking to a station, waiting for public transport and travelling on board [68,80]. Third, most measurement instruments are applied at a single point in time and primarily to current public transport users, limiting their ability to capture changes over time or the experiences of individuals who have already reduced or discontinued their use of public transport [81].
4. Crime, Fear and the Perception Gap
4.1. A Gap Documented for Fifty Years
Passengers have rated transit as more dangerous than the records suggest since the first studies of the subject. An early analysis of a large transit system in the United States found that crime and harassment were more common on rapid transit than on surface transit and used a survey of public perceptions to develop its safety recommendations [82]. A victimization survey conducted among households in Los Angeles examined the extent to which fear for personal safety affected bus ridership and found that, among regular riders, older adults, women, Hispanic passengers, and those with low incomes were the most affected [67]. In Southampton, women reported high levels of insecurity when walking at night and when waiting for public transportation in isolated locations [4].
Later studies have confirmed this pattern in very different contexts. British rail users rated their risk of becoming victims of crime as much higher than official statistics suggested, which had negative effects on passenger numbers [63], and the risk perceived by rail passengers was found to be only weakly correlated with the actual risk [33]. In Mexico City, approximately 36% of public transportation users felt unsafe or not very safe, and the level of fear was similar across all modes of transportation and higher for trips longer than 30 min [54]. In Nigeria, fear of crime and perceived risk led commuters to avoid certain types of public transportation [83], and rail transit users estimated that the risk to which they were exposed was considerably higher than official data indicated [84]. In Santiago both men and women reported high levels of insecurity on buses, in the subway and at stations [55].
This discrepancy is not merely a matter of misjudgment. Official statistics underestimate what passengers experience, as many cases of harassment and minor crimes are never reported. Fear also responds to cues that statistics do not capture, including disorder, isolation, darkness, and the behavior of others.
4.2. Where Crime Is Concentrated
Crime on public transportation is highly concentrated in space and time, as predicted by opportunity theory [2]. In Los Angeles, the ten bus stops with the highest incidence of crime shared an abundance of negative environmental characteristics and a lack of protective ones [35], and subsequent studies have linked crime at bus and streetcar stops to the surrounding physical and social environment [85,86]. Crime rates also vary significantly among subway stations in Stockholm, Washington and London, depending on their environment and surroundings [87,88,89].
Most incidents occur in the open areas of stations, platforms and their surroundings, rather than inside vehicles, which are enclosed and easier to monitor [3]. Land use also plays a significant role. In Austin, higher density and mixed land use were associated with a higher crime rate near public transit stations, which, in turn, led to a decline in bus ridership [90]. In British city centers, feelings of anxiety at night were concentrated around bus stops, multi-story parking garages, and streets with numerous pubs and clubs, partly mirroring the rate of reported crime [91]. Recent data from Africa provide a comparison at the system-wide level. Lagos recorded 14.3 transportation-related crimes per 10,000 passengers, compared to 8.7 in Abuja, and technological interventions were associated with a lower crime rate [60].
4.3. Fear Has Its Own Geography
The places where people are victimized and the places where people feel unsafe only partially overlap. At train stations in Sweden, the geography of victimization differed from the geography of safety perceptions, and perceptions responded more strongly than victimization to the physical and social characteristics of the station [92]. On routes to a Brazilian university campus, locations with many violent incidents were perceived as unsafe, but actual exposure to violence influenced the choice of transportation more than perceptions of safety did [93]. In Chicago, perceptions of the safety of buses and trains depended on both individual characteristics and the neighborhood where people lived [75].
Signs of disorder are a constant trigger for fear. Bus riders in Edinburgh were discouraged from traveling at night because of intoxicated passengers [43], and in Santiago, robberies and neighborhood alcohol and drug use increased feelings of insecurity on public transportation [55]. A recent study found that the physical environment, social trends and networks, as well as criminal activity, shaped the sense of safety on public transportation, and that non-users’ opinions regarding safety interventions influenced their willingness to start using public transportation [94]. Young commuters in Malmö cited other people, bus stop design and surrounding traffic as factors that trigger feelings of insecurity [76].
4.4. Beyond Everyday Crime
In the perception of the commuters, other threats exist alongside everyday crime. Terrorism and major incidents are among these. Passengers at European train stations were surveyed regarding their acceptance of counterterrorism measures [95], and in the Delhi Metro, the presence and vigilance of security personnel had the strongest effect on commuters’ satisfaction, followed by metal detectors and measures to prevent accidents and attacks [96]. The Riga International Bus Terminal illustrates a formal, risk-based approach to terminal security [97].
Traffic and operational safety represent a second concern. In Lagos, inadequate facilities at rapid bus transit stations and unsafe boarding and alighting practices have shaped passengers’ perceptions, alongside crime [98]. Fear of traffic accidents has discouraged commuters on the Shenzhen metro from walking to stations and has directed them toward buses and shared bicycles [99]. When roads are used by both motorized and non-motorized traffic, pedestrians and cyclists bear the risk and public transportation cannot function well until their needs are met [100].
Ultimately, anxiety itself represents a daily cost. South African employees who rely on public transportation have reported concerns about their safety, which have affected their job performance [101], and fear of crime in pedestrian environments has also been associated with a reluctance to choose public transportation [102].
5. Sexual Harassment and Violence in Public Transportation
5.1. Prevalence
Sexual harassment is the most widely documented form of victimization on public transportation and is common across all continents studied. Reviews of the international literature reach the same conclusion from different disciplinary perspectives [15,16,17,103]. An identical survey conducted on a sample of approximately 13,000 college students from 18 cities on six continents found that harassment on public transportation was widespread everywhere, with rates varying by city and country [5,104].
Studies conducted in a single city provide insight into the extent of the phenomenon, although definitions and time frames vary. More than 60% of women surveyed on Barranquilla’s rapid bus transit system had been sexually harassed while using it [62]. In Hawassa, Ethiopia, 50.8% of women and girls experienced more than one type of violence on public transportation, and age, marital status, mode of transportation, trip duration, facilities, and service management were significant predictive factors [105]. In Chennai, approximately 35% of young women had been verbally, physically, psychologically, or financially harassed in the past six months, both by other passengers and by bus staff [106]. In Lucknow, harassment of female students was most common on buses and increased with the frequency of bus use [107].
Similar reports come from Kathmandu [108], Delhi [109], Bogotá [110], Bogotá and El Alto [111], Mexico City [112], Saltillo [113], São Paulo [114], paratransit services in Lahore [59], England [115] and Cape Town, where trains performed the worst [116]. College students, who often rely on public transportation, report high levels of victimization throughout their entire journey in New York and Los Angeles [68,117].
However, most incidents are never brought to the attention of the authorities. In a survey conducted in New Jersey, 84% of harassment incidents had not been reported, and sexual and gender minorities had the least trust in the authorities [118]. In Lucknow, students witnessed roughly as many incidents as they experienced themselves, suggesting that harassment is too common to attract the attention of other passengers [107]. Research in the United Kingdom identifies specific barriers to reporting [115], and a campaign in London designed to encourage the reporting of unwanted sexual behavior was formally evaluated [119]. Underreporting is particularly significant in relation to the perception gap because, when official figures capture only a fraction of incidents, the fear with which they are compared appears more exaggerated than it is.
5.2. Crowding, Coping and Women-Only Services
Overcrowding is the most obvious situational factor. Overcrowded buses had the strongest negative effect on women’s perceived risk of harassment in Barranquilla [62], and sexual assaults were more frequent in Bogotá’s overcrowded TransMilenio system than in informal transportation in El Alto [111]. Unwanted touching on crowded commuter trains led to the introduction of women-only cars in Japan [120]. The opposite extreme is equally threatening, as less crowded vehicles have diminished women’s sense of safety, according to a dataset covering 28 cities [78].
Bystanders also influence the results. In a vignette experiment, blame was attributed to the aggressor rather than the victim, and judgments regarding the severity of the offense and willingness to report depended on both passenger density and the severity of the behavior, while an awareness video increased only the reported likelihood of intervening [64].
Women manage risk through constant small adjustments. They avoid particular times, routes and modes, travel in company, pay for costlier alternatives, stand near other women and choose positions that are easy to defend [111,121]. Women waiting at bus terminals in Auckland remained vigilant, faked confidence, and used their phones and headphones as a shield [122], while young people in Stockholm who had been victims of abuse, particularly sexual abuse, took more precautions on trains and the subway [92].
Focus groups in Australia describe the cumulative cost as a burden on personal safety with cognitive, temporal, emotional, financial, and social dimensions and report that women tended to treat the system as given and their safety as their own responsibility [79]. The broader literature refers to these routines as “safety work” [45]. For some victims, these routines restore a sense of control, while others continue to live with hypervigilance and anxiety [111]. Daily harassment therefore reduces mobility even when no single incident is serious [123], and repeated exposure appears to influence long-term travel decisions [124]. Culture shapes how harassment is perceived and what responses women adopt, but access to a car plays a greater role in changing how they use public transportation [125].
Women-only services represent one of the most visible responses to safety concerns in public transport. They are particularly common in contexts where harassment is widespread and, in Mexico City, have also been examined in relation to their effects on public perceptions of women’s mobility [112]. However, the literature generally regards such services as only a partial solution, as they may offer protection to female passengers without addressing the behavior of perpetrators. Accordingly, they are often discussed alongside complementary measures such as reducing overcrowding, improving reporting mechanisms, and promoting bystander intervention [111]. Measures related to staff, reporting procedures, and design are discussed further in Section 8 and Section 12.
6. Gender, Sexuality, and Social Identity
6.1. The Gender Gap
Gender is the most consistent social predictor of fear in transportation settings [121,126]. The best estimate of its magnitude comes from customer satisfaction data from 28 cities between 2009 and 2018, according to which women were 10% more likely than men to feel unsafe on the subway and 6% more likely on buses. The gap was wider with regard to safety than to overall satisfaction, where it stood at 3% and 2.5%, respectively [78].
Urban studies agree on the nature of this difference. In Santiago, feelings of insecurity were more pronounced among women, older adults, and nationals [55]. In the Paris region, half of female commuters felt safe, and their characteristics and travel habits revealed four distinct profiles of women [69]. At an Italian train station, gender was the personal attribute that most influenced travel behavior and perceptions of safety [66], while in Jounieh, Lebanon, gender ranked alongside frequency of use, bus quality and car ownership among the main predictors of subjective safety [127]. At 232 Danish train stations, women and gender-nonconforming travelers felt less safe than men at the stations and in their surroundings [52]. On social media in Shenzhen, approximately 74% of posts about public transportation were written by women, who focused on comfort and safety, particularly at night [77].
This difference does not reflect a general fear of the transit system. Ouali et al. [78] show that it varies depending on reported incidents of violence, vehicle size and occupancy, indicating that men and women assess the same conditions differently. The same measure can also have different effects depending on gender. On Chicago trains, video cameras made women feel less safe than men; service frequency and punctuality mattered more to men, while past safety issues carried greater weight for women [128].
Institutional responses to women’s mobility and safety concerns have remained relatively limited. A survey of public transport operators in the United States found that most respondents recognized specific safety needs for women and acknowledged their influence on travel choices [129]. Similarly, research on both the London Underground and the Tehran Metro suggests that public transport services are still insufficiently planned around women’s experiences and needs [130]. At the European level, survey-based research has likewise identified safety and security, together with accessibility and reliability, as key concerns shaping women’s mobility [131].
Moreover, gender-related fear takes different forms depending on the location. In Jakarta, women’s negative perceptions were linked to reluctance toward motorcycles, while in Kuala Lumpur they were linked to the absence of other pedestrians and the image of the place [132]. In the Dammam region, the lack of gender-responsive design led women to opt for select taxis, where privacy and safety remained concerns when traveling alone or with children [133]. In Lima and Asunción, a survey conducted among both female users and non-users showed that women’s feelings of insecurity and victimization on public transportation had altered their mobility patterns [81]. In South Africa, women generally made fewer trips and more care-related trips, as a consequence of harassment risks [116]. In Central Java, women’s use of the rapid bus transit system was associated with the presence of security personnel at bus stops [134].
6.2. Sexual and Gender Minorities
Research that goes beyond a simple comparison between men and women is recent and its findings are consistent. In New Jersey, sexual and gender minorities (and in particular transgender passengers and those who do not conform to gender norms) were more likely to report safety issues, harassment, and repeated harassment, and less likely to feel safer in the presence of police [118]. Interviews conducted in Portland describe harassment, discrimination, and violence as routine occurrences and argue that research on mobility from a gender perspective must be grounded in a broader understanding of the concept of gender [10,135,136]. Transgender travelers and those with diverse gender identities in Istanbul report similar experiences and point to driver training and public awareness campaigns as practical solutions [137]. These findings have implications for policy design, as measures based on a contrast between men and women (including services reserved exclusively for women and increased police presence) may leave the most vulnerable passengers unprotected.
6.3. Age, Disability, Income and Ethnicity
Age shapes perceptions of safety at different stages of the life course. In the United States, adolescents’ mobility is constrained not only by parental concerns about safety but also by transport costs and land-use patterns [138]. Among young people in Melbourne, perceptions of safety on public transport were strongly influenced by their attitudes toward and experiences with other passengers [139]. At the other end of the age spectrum, older passengers have reported greater feelings of insecurity in Santiago [55] and were found to be disproportionately represented among victims in Los Angeles [67].
Disability introduces an additional set of barriers to safe and accessible mobility. Blind and deaf-blind passengers encounter safety challenges beginning with access to travel information, although assistive technologies can help reduce some of these difficulties [140]. Women with disabilities also face mobility needs that are rarely incorporated into transport planning and service provision [141]. Research in Dhaka similarly shows that women, people with disabilities, older adults, and low-income populations experience substantial disadvantages in accessing safe public transportation [142].
Socioeconomic status and ethnicity further influence exposure to insecurity. Public transport-dependent passengers in Portland described experiences of exclusion and vulnerability, as well as an unequal distribution of transport services that may contribute to safety risks [136]. In Los Angeles, poorly illuminated bus stops were particularly concentrated in the lowest-income neighborhood examined [53]. Because low-income passengers often have fewer alternatives to public transport, safety becomes not only a service-quality issue but also a question of transport equity [9,11,143]. Ethnicity may also shape perceptions and coping strategies: in Auckland, women from ethnic minority groups reported feeling less safe during the daytime than white women and were more likely to use mobile applications to minimize waiting times [122].
These characteristics do not operate independently. From an intersectional perspective, the mobility experiences of, for example, a young, low-income woman from an ethnic minority cannot be understood simply as the cumulative effect of age, gender, income, and ethnicity considered separately [41,42]. However, relatively few studies of public transportation have been explicitly designed to examine such intersecting dimensions of vulnerability, leaving an important gap that is further addressed in Section 13.
7. The Built Environment and the Entire Journey
7.1. Access, Waiting Places and Audit Methods
A public transit trip has at least three stages: the walk to the stop, the stop or station, and the vehicle [80]. Passengers evaluate the entire chain, and the weakest link determines whether or not they will travel [68,144]. Operators typically control only the vehicle and part of the station, so much of what discourages passengers lies outside the operator’s boundary.
Commuting accounts for a large portion of perceived risk. In Chicago, a study based on stated preferences found that travel time, safety from crime, and the availability of sidewalks all influenced the willingness to walk to public transportation [65]. A complementary study on commutes to work found that violent crime in the neighborhood reduces the likelihood of walking, cycling, or using public transit and estimated significant welfare gains resulting from safer access to travel [145]. Crime around tram stops also influences how passengers choose to get there [146].
The perceived safety of sidewalks leading to bus stops was modeled as a standalone concept and correlated with bus ridership [56], and the quality of the first and last mile affects passenger satisfaction and loyalty [147]. At 232 Danish train stops, the surrounding area was just as important as the stop itself, and its importance varied depending on whether the trip was ending at home or at a work destination [52]. In Copenhagen, perceived safety at stations was correlated with people’s decision to use public transportation or not [148]. Studies on walking reach similar conclusions, in that both fear of crime and fear of traffic discourage walking, although the magnitude of the effect varies from one study to another [126,149,150].
Bus stops have been studied far less than train stations, but the evidence is consistent. At six stops in Stockholm, environmental features and real-time information influenced perceived safety and perceptions of crime, both during the day and at night [20,151]. Benches and shelters reduced perceived waiting times at all types of stations in the United States [73], and young travelers in Malmö identified station design and surrounding traffic as sources of insecurity [76].
Currently, there are several methods for evaluating transit stations. One of the earliest methods inventoried negative and protective environmental characteristics at ten high-crime transit stations in Los Angeles [35]. A proactive “fuzzy” assessment, applied along an urban corridor in Kolkata, evaluated design and management deficiencies and was validated using accident data [70]. A method based on three groups of criteria assessed 151 bus stops in a Polish metropolitan area and established priorities for remedial work [71]. Field inspections, supported by geographic information systems, assessed road safety, security, comfort and accessibility along bus routes in the province of Brescia [72], and nighttime lighting measurements were used to determine actual light levels at bus stops [53].
7.2. Train Stations and Transit Hubs
Research on stations is more advanced and has generated a common vocabulary. A scale based on the CPTED principles evaluates stations from the perspectives of surveillance, access control, maintenance, territoriality, and support for activities [37], and case studies of British rail stations demonstrate how these principles are translated into management practice [63]. A systematic review of train stations finds that passengers’ perceptions of safety depend on station characteristics (such as lighting, surveillance and maintenance), the presence of staff and other people, and the passenger’s profile [18].
More specific studies provide additional insight into how safety is experienced across different transport settings. At an Italian railway station, women reported feeling safer when other people were present and expressed a preference for transfer facilities located close to station entrances and nearby shops [66]. On the Izmir metro, feelings of insecurity were reported across all stages of the journey and were associated with environmental conditions, service characteristics and management practices to a similar extent [152]. At transit hubs, overall satisfaction appears to depend on the combined quality of information, safety and waiting conditions [153]. Similarly, commuters using a metro–bus interchange in Delhi differentiated among safety-related attributes according to their perceived importance [61].
7.3. Visibility, Neighborhood and Land-Use
Lighting is the most consistent physical determinant of perceived safety. Field measurements at bus stops in Los Angeles showed that approximately half of them were adequately lit, and a quarter were well lit, with the poorest coverage recorded in the neighborhood with the lowest income. A shelter with integrated lighting was the strongest predictor of light levels, and inventories of light poles provided a misleading picture of actual conditions [53]. Good lighting increased the sense of safety for all gender groups in Denmark [52] and reduced women’s perceived risk of harassment in Barranquilla [62]. These findings are consistent with the broader evidence that better street lighting reduces crime and feelings of fear and brings pedestrians back onto the streets after dark [154,155].
Visibility works in tandem with lighting. People fear places with poor visibility, places where a criminal might hide, and places from which it is difficult to escape [38]. In transportation settings, these include underpasses, isolated waiting areas, nearby parks, multi-story parking garages, and enclosed facades [4,52,91]. Green spaces illustrate this point. They are usually promoted as landscape features, but women at an Italian train station did not appreciate the hedges and plants outside the station, whereas men did not share the same view [66].
Stations and stops reflect the character of their surrounding environment. Crime at tram stations in Los Angeles mirrored neighborhood conditions [85]. Compact, mixed-use development may contribute to higher crime levels around public transport stops, potentially discouraging ridership and creating an unintended challenge for transit-oriented development strategies [90]. When services and infrastructure are unevenly distributed, safety risks are also unevenly distributed [136]. Table 4 summarizes the direction of the evidence for the main design features discussed in this section.
Table 4.
Design features and their reported effect on perceived safety.
8. Situational and Operational Factors
8.1. Time of Day, Exposure and Waiting Duration
Darkness emerges as one of the most consistent situational factors shaping perceptions of safety. Across studies conducted in Southampton, Santiago, Stockholm, Barranquilla, Edinburgh, and Shenzhen, travelling at night was associated with lower perceived safety [4,20,43,55,62,77]. Evidence from Lagos similarly indicates that temporal conditions contribute to feelings of insecurity alongside physical and socioeconomic factors [98]. The length of exposure also appears to matter. In Mexico City, fear was greater on journeys lasting more than 30 min [54], while in Hawassa, trip duration was identified as a predictor of violence against women and girls [105].
Furthermore, before onboarding, waiting represents a particularly vulnerable stage of the journey, as passengers remain stationary, highly visible and are often alone. Evidence shows that perceived waiting time can substantially exceed actual waiting time. In one study combining video observations with passenger surveys, reported waiting times were on average 1.21 times longer than observed times, while at stops lacking amenities, perceived waits were typically at least 1.3 times longer than their actual duration. This discrepancy was especially pronounced among women waiting more than ten minutes in environments they perceived as unsafe, who substantially overestimated their waiting times and reported longer perceived waits than men at the same locations [73]. Uncertainty therefore appears to amplify the perceived burden of waiting, making the service seem slower than it actually is. Real-time information can reduce this uncertainty and improve the waiting experience [20], while women using transit terminals in Auckland have been shown to use mobile applications to better time their arrival and minimize waiting periods [122].
8.2. Crowding and Emptiness
Perceived safety appears to decline at both extremes of passenger occupancy. At high occupancy levels, crowding is shaped not only by the number of passengers but also by the way environmental conditions are experienced. In subway cars observed across 14 density levels, satisfaction declined steadily as passenger numbers increased. However, perceived noise contributed more strongly to assessments of overcrowding than the actual number of passengers, followed by odor, while fear of crime also increased discomfort [156]. Similar patterns were identified on Swiss railway platforms, where higher measured density was associated with more frequent movement within the danger zone near the platform edge, perceived crowding being also linked to lower perceived safety [74]. Crowding may additionally create conditions conducive to harassment, while its negative effects on passenger comfort and public transport demand are well established [157,158].
At the opposite extreme, very low occupancy may also undermine perceived safety by removing the informal protection associated with the presence of other passengers. Women reported feeling less safe in sparsely occupied train cars [78], while the presence of other people at stations was associated with greater perceived safety [66]. Conversely, being alone increased the perceived risk of harassment [62]. More broadly, trust in fellow passengers has been identified as one of the strongest determinants of perceived safety in public transport environments [139,159].
8.3. Staff, Surveillance and Security Personnel
The visible presence of transport staff is generally regarded as an important contributor to perceived safety. Women in Sydney and Melbourne identified trained personnel as a reassuring presence, while also noting that increasing automation has reduced staff visibility in some systems [79]. On the Delhi Metro, the presence of security personnel emerged as the strongest factor associated with satisfaction with safety [96], while in Central Java it was also linked to higher levels of female public transport use [134].
The role of uniformed law enforcement is less straightforward. In Malmö, the presence of security guards and police officers increased perceived safety for some respondents but heightened feelings of insecurity for others [76]. Similarly, sexual and gender minorities in New Jersey were less likely to report feeling safer in the presence of police [118]. Recent evidence also suggests that non-users of public transport may respond differently to social service-oriented safety interventions than to more conventional measures such as policing and improved lighting [94]. Staff behavior itself can also become a source of insecurity. In Chennai, bus employees were identified among the perpetrators of harassment [106], while in Hanoi, staff conduct influenced students’ willingness to use public transport [160]. In Lagos, unsafe practices by operators when allowing passengers to exit buses were likewise found to shape perceptions of safety [98].
On the other hand, surveillance cameras are less effective than their widespread use might suggest. On trains in Chicago, video cameras had a weaker effect on women’s sense of safety than on men’s [128]. Measures must also be visible to be effective, and in Ann Arbor, passengers’ reactions to a package of safety measures depended on whether or not they saw them [161]. At the system level, Lagos scored higher than Abuja in terms of surveillance coverage, emergency response, security personnel, and technology, although it also recorded a higher number of crimes per passenger, and in both cities, technological interventions showed a negative correlation with crime [60].
8.4. Information, Reliability and Service Quality
Perceived safety is closely connected to the overall quality of public transport services. Evidence from five Northern European cities shows that service quality shapes perceived accessibility partly through its influence on travel safety, with information provision and comfort emerging as particularly important factors [50]. In Chicago, frequent and punctual train services were associated with a stronger increase in perceived safety among men than among women [128]. Conversely, when services are limited in terms of routes and operating hours, and system design does not adequately respond to women’s mobility needs, as observed in the Dammam region, women may shift toward alternative modes such as taxis [133]. These findings suggest that reliability and access to clear information should themselves be understood as components of transport safety, as they reduce waiting time and uncertainty while helping maintain passenger presence at stops and stations.
9. The Pandemic, Digital Tools and Emerging Modes of Transportation
9.1. COVID-19 and Public Health Safety
The pandemic has transformed a defining characteristic of public transportation (namely, the presence of large numbers of people in an enclosed space) into a perceived danger [162,163]. Early surveys conducted in Australia, Poland and Romania recorded drastic declines in ridership and strong concerns about sharing vehicles [164,165,166].
Health-related risks have become an increasingly important component of perceived safety in public transport. The COVID-19 pandemic altered passengers’ interpretations of crowding, particularly in rail systems, with direct implications for service operations under social-distancing requirements [167], while Cho et al. [168] further examined the effects of crowding on travel behavior during the pandemic. Psychological responses also played an important role. In eight Chinese cities where public transport services had been suspended, situational anxiety was associated with lower perceived safety, while greater perceived safety contributed to higher satisfaction. Anxiety was also more pronounced among passengers who felt a stronger psychological connection to the pandemic [169].
Perceived infection risk similarly influenced modal choice. Among 559 commuters, individuals who considered the risk of infection on public transport to be higher were less willing to use rail services, while occupation, previous travel mode, and walking time to the station also affected their decisions [170]. In this context, operational procedures and information provision became important components of perceived safety. Evidence from Malaysia, for example, links perceived safety to assessments of infection risk, compliance with standard operating procedures, and the credibility of information provided to passengers [171].
However, these effects were not consistent across contexts. Among students in Hanoi, fear of infection had relatively little influence on continued bus use, whereas the introduction of cleaner electric buses encouraged some passengers to return to public transport [160]. In Santiago, researchers consequently proposed broadening conventional measures of transport safety to include contagious diseases alongside concerns such as harassment, discrimination, and public unrest [55]. Taken together, these findings suggest a wider understanding of perceived safety as an assessment of whether risks are visible, predictable, and effectively managed. In the context of health threats, clear procedures and credible information may therefore perform a role similar to that of lighting, surveillance, or staff presence in relation to crime-related concerns.
9.2. Phones, Apps and Digital Traces
Personal technology is already part of how passengers manage risk. Women use phones and earbuds to signal unavailability and mobile apps to minimize wait times [122]. Apps dedicated to personal safety have received a mixed reception, as users weigh the benefits against privacy concerns and the disclosure of their location [172]. Assistive technology enables safe and independent travel for blind and deaf-blind passengers [140]. For operators, intelligent transportation systems provide pre-trip and in-trip information, route guidance, and safety services, and female passengers in Central Java prioritized precisely these features [134]. For researchers, social media posts and participatory maps provide data on where and when feelings of insecurity arise [76,77].
9.3. Autonomous Buses and Shuttles
Automation is reshaping how passengers perceive safety, and evidence from real-world assessments shows that these perceptions are multidimensional. In Vantaa, Finland, passengers considered road safety on a driverless bus to be better than on a conventional bus, yet 64% rated safety inside the vehicle as worse or much worse, with women expressing greater concern than men [173]. A subsequent Finnish study of driverless shuttle usage similarly found that passengers’ feelings on board could not be explained solely through rational risk assessment [174]. In Carinthia, Austria, passengers interviewed after using an autonomous shuttle generally reported positive attitudes, with previous experience and vehicle speed emerging as the main factors shaping perceived safety [175]. Comparable post-use evaluations of acceptance were also conducted among passengers on an automated bus in Berlin [176].
Greater hesitation is evident among people who have not yet used autonomous public transport. In Michigan, approximately half of surveyed public transport users expressed reluctance to use autonomous buses, citing concerns about safety, the absence of a human driver, and distrust of the technology. Willingness to use such services was highest among younger men and lowest among women, older adults, and people with mobility disabilities [177]. Similarly, among U.S. passengers, willingness to use automated public transport declined substantially when no staff member was present on board [178]. Focus-group research also identified system failure and terrorism among the perceived risks of driverless buses, despite recognition of potential benefits related to costs, congestion, and emissions [179]. These findings underline an often-overlooked function of the driver: beyond operating the vehicle, the driver also provides a visible staff presence and a potential source of reassurance. Consequently, removing the driver may also remove the only staff member with whom many bus passengers have direct contact.
9.4. Paratransit, Ride-Sharing Services and Three-Wheeled Electric Vehicles
Across much of Africa, Asia and Latin America a substantial share of collective mobility is provided through informal or semi-formal transport services [180,181], yet research on perceived safety in these modes remains relatively recent. In Cochabamba, Bolivia, perceived safety influenced both the likelihood of using paratransit and passengers’ willingness to pay for safety improvements, with willingness to pay varying across sociodemographic groups [182]. In Lahore, researchers developed a composite index of transport safety for women using paratransit and modeled perceived safety as a determinant of women’s intention to use these services [58,59]. In Patna, electric-rickshaw users expressed concerns about vehicle construction, including lightweight bodies, limited enclosure, inadequate handrails, insufficient protection against rear-end collisions, and the safety of young children. Passengers who perceived these shortcomings, particularly women, were less willing to continue using this mode [183]. In El Alto, sexual assault was also reported as a significant concern in informal transport, although at lower levels than in Bogotá’s overcrowded formal system [111]. For ride-sourcing services, perceived safety, together with service quality and user engagement, has been associated with passenger loyalty [51], while research in Jounieh has compared perceived safety across public transport and ride-sharing services [127].
Shared micromobility is also becoming increasingly important as a first- and last-mile connection to public transport. In Shenzhen, perceived accident risk discouraged walking to metro stations and increased the likelihood of using dockless bike-sharing services or buses instead [99]. Across these emerging and alternative transport modes, a consistent pattern is evident: women, older adults, people with disabilities, and passengers travelling with children tend to express the greatest hesitation toward new services. These are also among the groups that experience the greatest safety-related disadvantages in conventional public transport systems.
10. Impact on Travel Behavior, Ridership and Equity
10.1. Adaptation
Passengers who feel unsafe rarely stop traveling all at once. They adapt, and these adaptations come at a cost. Some adaptations are temporary, such as when people avoid traveling at night or during off-peak hours, or leave earlier than they normally would [4,5,66]. Other adaptations are spatial in nature, in the sense that people avoid certain stations, routes, train stations, and train cars and choose locations that are easy to defend [76,111,121]. Modal adaptation involves switching to cars, taxis, or on-demand transportation services and, often, choosing a more expensive option [125,133,170]. Social adaptation means traveling with others or standing next to other women [79,111], while vigilance and self-presentation involve staying alert, projecting confidence, and using a phone or headphones as a shield [79,122]. The final stage is withdrawal, in which people make fewer trips or stop using public transportation altogether [76,116,184]. In Malmö, one in ten respondents often or very often avoided public transportation due to feelings of insecurity [76], and among Austrian women, frightening situations during their daily commutes led many of them to change their travel behavior [185].
10.2. Choice of Transportation Mode
Perceived safety has a measurable effect on public transit use, and this effect is more pronounced among women. In Melbourne, the sense of safety had a significant, although modest, positive effect on the frequency with which people used public transit [159]. In Los Angeles, a “before-and-after” comparative study of a new tram line found that safety concerns influenced public transit use more than environmental attitudes, and that living near a new station increased ridership significantly less among women than among men [186]. In Polokwane, South Africa, commuters’ perceptions of safety (specifically crime prevention) were significant predictors of mode choice in a new rapid bus transit system [57]. In Austin, crimes near public transit stations reduced the number of bus passengers [90], and in Chicago, violent crimes in the neighborhood reduced the use of public transit for commutes to work [145]. In Hanoi, the perceived risk of sexual harassment was among the psychological factors that led students to stop taking buses [160], and in Nigeria, fear and perceived risk reduced the use of certain types of public transportation [83].
Behavioral change depends on the availability of an alternative. Access to a car determined whether women changed their use of public transportation in response to harassment [125]. In South Africa, mode choice did not differ by gender, despite women’s greater exposure to harassment, likely due to financial reasons [116]. On routes to a Brazilian campus, walking and other sustainable modes of transportation were most common where insecurity was highest, indicating the presence of “captive” users rather than indifference [93]. “Captive” passengers continue to travel and bear the cost in the form of stress and vigilance, and passenger count figures therefore underestimate the scale of the problem.
Perceived safety also shapes several outcomes of direct relevance to public transport operators. It has been associated with higher overall satisfaction in China following the lifting of COVID-19 restrictions [169], greater loyalty among users of on-demand transport services [51], and increased satisfaction and loyalty during first- and last-mile travel [147]. Perceived safety can also mediate the relationship between service quality and perceived accessibility, understood as the extent to which passengers feel able to reach desired destinations by public transport [50,187]. More broadly, studies of passenger satisfaction consistently identify safety as one of the key attributes contributing to overall evaluations of public transport services [14,188].
10.3. Well-Being and Equity
The consequences of perceived insecurity extend well beyond transportation itself. Fear of crime has been linked to poorer mental health and lower levels of social and physical activity through multiple pathways [189]. Previous studies have also shown that commuting-related anxiety can negatively affect work performance [101], while victims of sexual assault during travel may experience persistent hypervigilance [111]. Women have further described safety concerns as a continuous psychological burden associated with everyday mobility [79]. In addition, insecurity can alter the experience of travel itself by making journeys feel longer than their actual duration [73].
These consequences are most severe for groups with limited mobility alternatives. Low-income passengers and those who depend heavily on public transport often have little capacity to avoid unsafe or uncomfortable travel conditions [9,135]. Adolescents’ mobility may also be constrained by parental concerns about safety [138], while in Latin American cities, insecurity has been shown to disproportionately shape women’s everyday travel patterns and routines [81]. From the perspectives of transport equity and transport justice, this represents a distributive failure: if certain groups cannot use a transport system without experiencing disproportionate fear or insecurity, then access cannot be considered genuinely equal [8,143].
11. An Integrative Framework
The reviewed studies explain perceived safety from several disciplinary perspectives, each focusing on a different set of determinants. Taken together, the findings support a transactional model in which perceived safety reflects a passenger’s appraisal of a specific situation and context, shaped by the system’s ability to convey a sense of control (Figure 3). The framework is conceptual: it organizes the evidence synthesized in Section 4, Section 5, Section 6, Section 7, Section 8, Section 9 and Section 10 and generates hypotheses for testing.
Figure 3.
Integrative framework of safety perception in public transport. Four layers of determinants feed a single appraisal, which produces a feeling, leading to adaptation and wider outcomes; the dashed line marks feedback from experience.
11.1. Structure of the Framework
The framework distinguishes four levels of determinants. The individual level describes who is travelling and includes gender, gender identity and sexual orientation, age, disability, ethnicity, income, prior victimization and the availability of alternative modes of transport (Section 5 and Section 6). The situation level encompasses conditions that vary from hour to hour, such as darkness, waiting time, crowding or emptiness, and the company one is in (Section 8). The environment level represents the physical and social characteristics of the access route, the stop, the station, the vehicle and the neighborhood (Section 7). The system level covers what the operator and the municipality provide, including staff, information, reliability, reporting channels and technology (Section 8 and Section 9).
These determinants feed an appraisal that, as the reviewed studies suggest, passengers make implicitly by asking three questions. The first is whether there is a threat, which may be crime, harassment, an accident or an infection. The second is whether they could cope with the situation or get help, which depends on the presence of other people and staff and on their own vulnerability. The third is whether the place is under control, which they infer from lighting, order and information. This third question explains several findings that opportunity theory, taken on its own, does not account for: perceptions reflect the visible state of stations more closely than recorded victimization [92]; security measures are effective only if passengers notice them [161]; and during the pandemic, credible procedures and information became indicators of safety in their own right [171]. The appraisal produces a feeling (worry, vigilance, perceived risk), which leads to adaptation (changes in time, route, mode or company, or fewer trips) and, in aggregate, to wider outcomes for ridership, satisfaction, well-being and equity (Section 10).
Five relationships describe how the framework operates. First, the levels interact, so no single factor has a uniform effect on all passengers: surveillance cameras affect the perceived safety of women and men differently [128], landscaping is perceived differently by women and men [66], and police presence increases perceived safety for some travelers while generating insecurity for others [76,118]. Second, safety is assessed progressively throughout the journey: access, waiting and in-vehicle travel each generate distinct evaluations, and the stage perceived as least safe can determine the decision to travel [52,68]. Third, visible signs of control may influence perceived safety more than recorded levels of risk, so reductions in crime or incidents may have limited effects on perceptions unless they are accompanied by changes that passengers can observe. Fourth, adaptation can conceal the cost of insecurity: passengers with limited alternatives continue to use public transport but compensate through greater vigilance, extra travel time or higher costs, so ridership data alone underestimate the burden [79,93]. Fifth, individual adaptations can accumulate into system-level effects through a feedback loop: declining ridership leaves vehicles and stations emptier, which may further reduce the perceived safety of those who remain [78], whereas higher passenger presence strengthens informal surveillance and reassurance.
11.2. Derivation and Supporting Evidence
The framework was developed inductively from the thematic synthesis, in three steps. First, the determinants of perceived safety reported in the empirical studies were listed during data extraction. Second, they were grouped by the level at which they operate and by the actor who can change them: individual characteristics are beyond the control of planners, situational conditions vary from hour to hour, environmental features are relatively fixed properties of places, and system-level factors are the services and procedures provided by operators and municipalities. Third, the explanations that the studies themselves offer for why these determinants matter were compared and condensed into the three appraisal questions. The sequence from appraisal to feeling and adaptation follows the distinction between the cognitive, emotional and behavioral components of fear of crime (Section 3.1) [24,25,26].
A component or relationship was retained only if at least two empirical studies supported it; the feedback loop, which rests mainly on inference from the reviewed evidence, is marked as such. Table 5 lists the evidence for each element and grades its strength using the criteria defined in Section 2.
Table 5.
Evidence supporting the components and relationships of the integrative framework.
The four levels of determinants and the link from feelings to adaptation are well supported. The third appraisal question, the effects of security measures at the system level and the feedback loop rest on fewer or less consistent studies and are therefore proposed for testing rather than asserted.
11.3. Relation to Existing Theoretical Approaches
The framework draws on and extends the theoretical perspectives reviewed in Section 3.2. Its core adapts the transactional model of stress and appraisal [190], in which a person’s response depends on a primary appraisal of whether a situation is threatening and a secondary appraisal of whether they have the resources to cope with it. The first two questions of the framework correspond to these appraisals; the third, about control, is specific to public spaces managed by others and is derived from the transit literature. In criminology, the risk-interpretation model of fear of crime [191] likewise treats fear as the outcome of how people interpret cues in their surroundings, and vulnerability and disorder explanations [40] identify which cues matter. The framework retains these insights but places them in a sequence that continues to behavioral adaptation and its consequences for ridership.
Environmental criminology, including routine activity theory, CPTED and the prospect–refuge–escape model [34,36,38], explains where crime and fear concentrate and why design matters. In the framework, these principles inform the environment level and the control question. Opportunity theories, however, focus on offenders and recorded crime and cannot by themselves account for the findings associated with the control question. Feminist and intersectional approaches [41,42,44] show that the same setting is experienced differently by different people. The framework reflects this by treating individual characteristics not as one more set of independent variables but as conditions that shape the whole appraisal, so that the effects of the other levels differ between groups (Section 6). Finally, the service-quality tradition [13,14] treats safety as one attribute among many. The framework instead positions perceived safety as an appraisal that mediates between service attributes and outcomes such as satisfaction, perceived accessibility and ridership, consistent with evidence that safety mediates the effect of service quality on perceived accessibility [50].
Compared with earlier syntheses specific to public transport, which focus on rail stations [18], on women’s fear of victimization [19] or on crime in transit environments [12], the framework makes four specific contributions. First, it brings the different threats that passengers face (crime, harassment, road and operational hazards, and infection) into a single appraisal, rather than treating them as separate. Second, it distinguishes a system level of determinants (staff, information, reliability, reporting and technology) from the physical environment, identifying the levers available to operators and municipalities. Third, it proposes perceived control as the mechanism linking visible cues to perceived safety, which accounts for the gap between perceived and recorded risk discussed in Section 4. Fourth, it treats perceived safety as dynamic, assessing at each stage of the journey and updated by experience, so that individual adaptations can accumulate into system-level effects on ridership.
The framework also has methodological implications. Research on perceived safety would have much to gain from specifying the type of threat being assessed, the stage of the journey considered, the population examined, and the situational and environmental conditions under which the assessment is made.
12. Implications for Practice and Policy
Evidence points to the need for investments in what passengers can see and experience during their access journey and while waiting, tailored to the profile of travelers. A list of priorities, along with the actor best positioned to act on each one (Table 6), could be the starting point for policy changes.
Table 6.
Priorities for practice and policy derived from the synthesis analysis.
The first group of priorities concerns the waiting area and the route leading to it. Lighting should be measured directly at the station rather than inferred from street lighting inventories; shelters should have integrated lighting, and improvements should begin in low-income areas, where facilities are the most inadequate [52,53]. Real-time information on transit arrivals, benches, and shelters reduces perceived wait times and yields the greatest benefits at low-frequency stops in less safe areas [20,73]. This approach should be treated as an integral part of the station, which means repairing sidewalks, opening up closed facades, and redesigning parking lots and isolated sections [56,145,147]. Existing audit tools for stations and stops allow for the classification and scheduling of these works [37,70,71,72].
The second group relates to people. Visible and trained staff, shops, and other activities inside stations, as well as avoiding empty platforms, help maintain a human presence [66,79,96]. Operators must manage both overcrowding and underutilization by increasing capacity on overcrowded routes, guiding passengers along platforms, and adjusting vehicle size to off-peak demand [62,74,78]. Drivers and crews should receive training on harassment and gender diversity, and misconduct and unsafe driving by staff should be penalized [98,106,137].
The third group pertains to reporting and safety. Reporting procedures that are easy and inspire trust, with discreet channels, feedback to victims, and options that do not rely on the police [115,118,119], have the potential to decrease feelings of unsafety. The presence of security forces should be differentiated, combining staff, social services and law enforcement, and its effects should be tested on different groups of passengers [76,94]. And, equally important, any measures taken need to be made visible in order to drive a change in the perceptions of passengers [161,171].
The fourth group concerns new and informal modes of transportation. Automation should be planned with onboard safety in mind, which requires specifying a human presence or a substitute for it before eliminating drivers [173,177,183]. Paratransit can be integrated into safety policy through vehicle standards, driver screening, and station improvements [59,182,183].
Four broader issues arise from these priorities. Reliability is in itself a safety measure, as a frequent and punctual service reduces the time spent waiting at the stop and keeps more people present, while service reductions have the opposite effect and are experienced most strongly in the evening, when fear levels are highest. Planning should also take gender considerations into account. Studies from Denmark, Ethiopia, and across Europe call for station design and service planning that account for gender considerations [52,105,131], a need long recognized by operators [129], and the features that have provided a sense of safety for women and non-binary travelers in Denmark [52], such as adequate lighting and clear signage, have also increased the perception of safety among men.
Perception should be monitored in parallel with crime rates. Reported crime underestimates harassment and does not account for feelings of fear; therefore, periodic perception surveys should be disaggregated by gender, age, and stage of the journey and should also include people who do not use public transportation [55,81]. Land use and public transportation should also be coordinated, as density and mixed-use development around stations bring activity and surveillance but can also attract crime. Thus, plans for station areas must include an explicit safety component [86,90].
Two approaches are poorly supported by evidence. One is a uniform package of measures, consisting of surveillance cameras and patrols, whose effects vary from one group of passengers to another. The other is treating services reserved exclusively for women as a comprehensive solution, since they protect users without changing the conditions that give rise to harassment [111,112].
13. Future Research Directions
The literature is extensive but uneven, and several gaps limit the conclusions that can be drawn and the recommendations that can be made with confidence. The most significant issue is the lack of causal evidence. Nearly all studies are cross-sectional surveys, and only one of the core empirical studies reviewed used a longitudinal quasi-experimental design [186]. “Before-and-after” studies on lighting improvements, staffing changes, real-time information, and awareness campaigns at bus stops would reveal which factors are causal, and the introduction of autonomous shuttles and electric fleets provides natural experiments [160,173].
Measurement represents the second gap. Validated instruments that distinguish between concern, perceived risk, and behavioral adaptation, and that identify both the threat and the stage of the trip [25,26], are needed. Without them, results cannot be aggregated or compared across modes of transportation and cultures. Fear also varies throughout a trip, and experience sampling, participatory mapping, sensors, and social media data can capture it where and when it occurs [27,74,76,77].
A third gap concerns the study participants. Existing research shows that ethnicity, age, marital status, and income influence exposure and fear, in addition to gender [105,122], but few studies analyze how these factors interact. Older adults, people with disabilities, children, and adolescents who travel alone, travelers from rural areas, and those who do not use public transportation have been studied very little, as samples have largely consisted of women, college students and commuters [138,140,141].
A fourth gap concerns the location where research is conducted. Buses and bus stops carry the most passengers but are the subject of only a small portion of the research. Paratransit and informal transport services dominate in Africa, South Asia, and Latin America, where data are the most recent and least abundant [58,59,182], and comparative studies would help distinguish universal determinants from local ones [5,132].
Long-term effects and the evaluation of responses constitute a fifth area. Little is known about how repeated harassment manifests over the course of a lifetime or how the loss of service users alters conditions for those who remain [124,184]. Services exclusively for women, staff training, social service-based approaches, witness programs, and safety apps are widely discussed but rarely evaluated, and data on costs and willingness to pay would help service providers choose among these options [64,145,172,182].
Two other questions are specific to the current period. One concerns whether the aversion to crowding observed during the pandemic has persisted [166,167,168], while another concerns how safety on board should be ensured once vehicles no longer have drivers [173,174,177].
14. Limitations
This review has limitations at three levels. First, the search and selection. Only English-language publications were included, which underrepresents research published in Spanish, Portuguese, French, Chinese and other languages, including much of the Latin American and francophone literature [12]. Two of the five sources (SpringerLink, Google Scholar) are not bibliographic databases and cannot be searched in a fully reproducible way, and the review protocol was not registered. Gray literature from transit agencies and NGOs was searched only through Google Scholar and is therefore incompletely covered.
Second, the evidence base. In total, 57% of studies with a recorded geographic setting come from Europe or North America, while Africa, the Middle East and much of Asia are represented by few studies, often from a single city. Most studies are cross-sectional, and only one used a longitudinal quasi-experimental design [186], so the associations reported here should not be read as causal effects. Measures of perceived safety differ so widely (Table 3) that effect sizes could not be pooled, and samples overrepresent students, women and current users.
Third, the synthesis. The narrative synthesis involves judgment in the classification of sources by theme, in the grading of evidence and in the derivation of the framework. Although each core empirical study was appraised with the MMAT, individual ratings are not reported study by study, so readers cannot verify how the appraisal informed the grading of evidence in Table 5 and Table 6. Assigning each source to a single theme simplifies studies that address several. The integrative framework (Section 11) is conceptual: it organizes the reviewed findings but has not itself been tested.
The review also rests on two assumptions. It assumes that findings from rail, metro and multimodal settings can inform bus-based systems where the mechanisms involved (for example lighting, waiting and the presence of others) are common to both. It also assumes that self-reported perceptions measured in surveys, interviews and digital traces capture the same underlying construct, even though, as Section 3.1 shows, they emphasize its emotional, cognitive and behavioral components to different degrees.
15. Conclusions
The perception of safety in public transportation is a contextual assessment made by a specific individual at a specific stage of the journey and is only loosely linked to the actual risk. Five decades of research support several conclusions. Fear is concentrated more during the access phase and while waiting than inside the vehicle. Harassment is common and, for the most part, underreported, and provides a rational basis for much of the fear that make statistics seem exaggerated. Gender is the strongest factor in social differentiation, and sexual and gender minorities, older adults, people with disabilities, and low-income riders bear additional burdens. Lighting, visibility, maintenance, information, the presence of other people, and visible staff increase perceived safety, while the effects of surveillance cameras and the presence of law enforcement depend on the individual being surveyed. People adapt before they travel, so passenger count data underestimates the cost, and this cost falls on those with the fewest alternatives.
The pandemic and vehicle automation have added health risks and the absence of a driver to a longer list of concerns. They have also clarified the underlying mechanism: passengers look for signs indicating that a location is under control and that help is available.
From a practical standpoint, these findings call for investments in the day-to-day quality of bus stops, access to them, and services, for maintaining passenger presence, and for testing measures in relation to the experiences of different groups of riders. From a research perspective, they call for causal studies, common indicators, and increased attention to buses, paratransit, and the regions where the majority of the world’s passengers travel. Public transportation cannot ensure sustainability or inclusivity if a large proportion of its potential users are afraid to wait for it.
Author Contributions
Conceptualization, T.-C.M. and E.-M.B.; Methodology, T.-C.M., E.-M.B. and R.R.; Software, T.-C.M., S.-C.M., Ș.D. and E.-M.B.; Validation, T.-C.M., E.-M.B., S.-C.M., Ș.D. and R.R.; Formal Analysis, T.-C.M., E.-M.B., S.-C.M., Ș.D. and R.R.; Investigation, T.-C.M., E.-M.B., S.-C.M., Ș.D. and R.R.; Resources, S.-C.M., Ș.D. and R.R.; Data Curation, T.-C.M., E.-M.B., S.-C.M., Ș.D. and R.R.; Writing—Original Draft Preparation, T.-C.M. and E.-M.B.; Writing—Review & Editing, T.-C.M., E.-M.B., S.-C.M., Ș.D. and R.R.; Visualization, E.-M.B.; Supervision, T.-C.M. and Ș.D.; Project Administration, T.-C.M. and S.-C.M.; Funding Acquisition, T.-C.M. and S.-C.M. All authors have read and agreed to the published version of the manuscript.
Funding
This work was supported by a grant of the Ministry of Education and Research, CCCDI—UEFISCDI, project number PN-IV-P6-6.1-CoEx-2024-0042, within PNCDI IV; by Vâlcea County Territorial Development Plan in a Geographic Information System [Planul de Amenajare a Teritoriului Județean Vâlcea în Sistem Informațional Geografic], (PATJ Vâlcea), project code 5013/09.04.2025; and by Elaboration of the Bistrița-Năsăud County Territorial Development Plan [Elaborarea Planului de Amenajare a Teritoriului Județean Bistrița-Năsăud], (PATJ BN), project code 18213/10.06.2025.
Data Availability Statement
No new data were created or analyzed in this study. Data sharing is not applicable to this article.
Acknowledgments
During the preparation of this manuscript, the authors used Claude (Anthropic, Opus 5.5) solely for language editing, including improving grammar, clarity and readability and rephrasing passages of the authors’ own text. The tool was not used to generate ideas, analyze or interpret data, select or evaluate the literature, or draw conclusions. The authors have reviewed and edited all output and take full responsibility for the content of this publication.
Conflicts of Interest
The authors declare no conflicts of interest. The funders had no role in the design of the study; in the collection, analyses, or interpretation of data; in the writing of the manuscript; or in the decision to publish the results.
Abbreviations
The following abbreviations are used in this manuscript:
| COVID-19 | Coronavirus Disease 2019 |
| CPTED | Crime Prevention Through Environmental Design |
| GIS | Geographical Information System |
| PRISMA | Preferred Reporting Items for Systematic Reviews and Meta-Analyses |
| SPIDER | Sample, Phenomenon of Interest, Design, Evaluation, Research Type |
Appendix A. Database-Specific Search Strategy
| Database | Field | Search Code |
| Scopus | Title, abstract, keywords | TITLE-ABS-KEY ((“public transportation” OR “public transit” OR transit OR bus OR metro OR subway OR rail) AND (“perception of safety” OR “perceived safety” OR “sense of safety” OR “fear of crime” OR “perception of security” OR “passenger safety” OR “travel safety”)) |
| Web of Science Core Collection | Topic, which covers title, abstract, author keywords and Keywords Plus | TS=(“public transportation” OR “public transit” OR transit OR bus OR metro OR subway OR rail) AND TS=(“perception of safety” OR “perceived safety” OR “sense of safety” OR “fear of crime” OR “perception of security” OR “passenger safety” OR “travel safety”) |
| ScienceDirect | Title, abstract or author-specified keywords | (“public transportation” OR “public transit” OR transit OR bus OR metro OR subway OR rail) AND “perception of safety” |
| (“public transportation” OR “public transit” OR transit OR bus OR metro OR subway OR rail) AND “perceived safety” | ||
| (“public transportation” OR “public transit” OR transit OR bus OR metro OR subway OR rail) AND “sense of safety” | ||
| (“public transportation” OR “public transit” OR transit OR bus OR metro OR subway OR rail) AND “fear of crime” | ||
| (“public transportation” OR “public transit” OR transit OR bus OR metro OR subway OR rail) AND “perception of security” | ||
| (“public transportation” OR “public transit” OR transit OR bus OR metro OR subway OR rail) AND “passenger safety” | ||
| (“public transportation” OR “public transit” OR transit OR bus OR metro OR subway OR rail) AND “travel safety” | ||
| SpringerLink | Main search box | (“public transportation” OR “public transit” OR transit OR bus OR metro OR subway OR rail) AND (“perception of safety” OR “perceived safety” OR “sense of safety” OR “fear of crime” OR “perception of security” OR “passenger safety” OR “travel safety”) |
| Google Scholar | - | “perceived safety” OR “sense of safety” OR “perception of safety” “public transport” OR “public transit” OR bus |
| “fear of crime” OR “perception of security” “public transport” OR “public transit” OR bus OR metro | ||
| “passenger safety” OR “travel safety” “public transport” OR “public transit” OR bus OR subway |
References
- Savage, I. Comparing the Fatality Risks in United States Transportation across Modes and over Time. Res. Transp. Econ. 2013, 43, 9–22. [Google Scholar] [CrossRef] [Scilit]
- Smith, M.J.; Clarke, R.V. Crime and Public Transport. Crime Justice 2000, 27, 169–233. [Google Scholar] [CrossRef] [Scilit]
- Loukaitou-Sideris, A. Safe on the Move: The Importance of the Built Environment. In The Urban Fabric of Crime and Fear; Ceccato, V., Ed.; Springer: Dordrecht, The Netherlands, 2011; pp. 85–110. [Google Scholar]
- Lynch, G.; Atkins, S. The Influence of Personal Security Fears on Women’s Travel Patterns. Transportation 1988, 15, 257–277. [Google Scholar] [CrossRef] [Scilit]
- Ceccato, V.; Loukaitou-Sideris, A. Fear of Sexual Harassment and Its Impact on Safety Perceptions in Transit Environments: A Global Perspective. Violence Women 2022, 28, 26–48. [Google Scholar] [CrossRef] [Scilit] [PubMed]
- Graehler, M.; Mucci, R.A.; Erhardt, G.D. Understanding the Recent Transit Ridership Decline in Major US Cities: Service Cuts or Emerging Modes? In Proceedings of the Transportation Research Board 98th Annual Meeting, Washington, DC, USA, 13–17 January 2019. [Google Scholar]
- Rupprecht, S.; Brand, L.; Böhler-Baedeker, S.; Brunner, L. Guidelines for Developing and Implementing a Sustainable Urban Mobility Plan, 2nd ed.; European Commission: Brussels, Belgium, 2019. [Google Scholar]
- Di Ciommo, F.; Shiftan, Y. Transport Equity Analysis. Transp. Rev. 2017, 37, 139–151. [Google Scholar] [CrossRef] [Scilit]
- Garrett, M.; Taylor, B. Reconsidering Social Equity in Public Transit. Berkeley Plan. J. 1999, 13, 6–27. [Google Scholar] [CrossRef] [Scilit]
- Lubitow, A.; Abelson, M.J.; Carpenter, E. Transforming Mobility Justice: Gendered Harassment and Violence on Transit. J. Transp. Geogr. 2020, 82, 102601. [Google Scholar] [CrossRef] [Scilit]
- Lucas, K. Transport and Social Exclusion: Where Are We Now? Transp. Policy 2012, 20, 105–113. [Google Scholar] [CrossRef] [Scilit]
- Ceccato, V.; Gaudelet, N.; Graf, G. Crime and Safety in Transit Environments: A Systematic Review of the English and the French Literature, 1970–2020. Public Transp. 2022, 14, 105–153. [Google Scholar] [CrossRef] [Scilit]
- Eboli, L.; Mazzulla, G. Service Quality Attributes Affecting Customer Satisfaction for Bus Transit. J. Public Transp. 2007, 10, 21–34. [Google Scholar] [CrossRef] [Scilit]
- Van Lierop, D.; Badami, M.G.; El-Geneidy, A.M. What Influences Satisfaction and Loyalty in Public Transport? A Review of the Literature. Transp. Rev. 2018, 38, 52–72. [Google Scholar] [CrossRef] [Scilit]
- Gekoski, A.; Gray, J.M.; Adler, J.R.; Horvath, M.A.H. The Prevalence and Nature of Sexual Harassment and Assault against Women and Girls on Public Transport: An International Review. J. Criminol. Res. Policy Pract. 2017, 3, 3–16. [Google Scholar] [CrossRef] [Scilit]
- Ding, H.; Loukaitou-Sideris, A.; Agrawal, A.W. Sexual Harassment and Assault in Transit Environments: A Review of the English-Language Literature. J. Plan. Lit. 2020, 35, 267–280. [Google Scholar] [CrossRef] [Scilit]
- Useche, S.A.; Colomer, N.; Alonso, F.; Faus, M. Invasion of Privacy or Structural Violence? Harassment against Women in Public Transport Environments: A Systematic Review. PLoS ONE 2024, 19, e0296830. [Google Scholar] [CrossRef] [Scilit] [PubMed]
- Sundling, C.; Ceccato, V. The Impact of Rail-Based Stations on Passengers’ Safety Perceptions. A Systematic Review of International Evidence. Transp. Res. Part F Traffic Psychol. Behav. 2022, 86, 99–120. [Google Scholar] [CrossRef] [Scilit]
- Noor, S.; Iamtrakul, P. A Semi-Systematic Literature Review, Identifying the Relationship between Transit Environments and Women’s Fear of Victimization in Transportation Systems: A Global Perspective. Public Transp. 2024, 16, 551–581. [Google Scholar] [CrossRef] [Scilit]
- Abenoza, R.F.; Ceccato, V.; Susilo, Y.O.; Cats, O. Individual, Travel, and Bus Stop Characteristics Influencing Travelers’ Safety Perceptions. Transp. Res. Rec. J. Transp. Res. Board 2018, 2672, 19–28. [Google Scholar] [CrossRef] [Scilit]
- Page, M.J.; McKenzie, J.E.; Bossuyt, P.M.; Boutron, I.; Hoffmann, T.C.; Mulrow, C.D.; Shamseer, L.; Tetzlaff, J.M.; Akl, E.A.; Brennan, S.E.; et al. The PRISMA 2020 Statement: An Updated Guideline for Reporting Systematic Reviews. BMJ 2021, 372, n71. [Google Scholar] [CrossRef] [Scilit] [PubMed]
- Cooke, A.; Smith, D.; Booth, A. Beyond PICO: The SPIDER Tool for Qualitative Evidence Synthesis. Qual. Health Res. 2012, 22, 1435–1443. [Google Scholar] [CrossRef] [Scilit] [PubMed]
- Hong, Q.N.; Fàbregues, S.; Bartlett, G.; Boardman, F.; Cargo, M.; Dagenais, P.; Gagnon, M.-P.; Griffiths, F.; Nicolau, B.; O’Cathain, A.; et al. The Mixed Methods Appraisal Tool (MMAT) Version 2018 for Information Professionals and Researchers. Educ. Inf. 2018, 34, 285–291. [Google Scholar] [CrossRef] [Scilit]
- Ferraro, K.F.; Grange, R.L. The Measurement of Fear of Crime. Sociol. Inq. 1987, 57, 70–97. [Google Scholar] [CrossRef] [Scilit]
- Gabriel, U. The Psychology of Fear of Crime. Conceptual and Methodological Perspectives. Br. J. Criminol. 2003, 43, 600–614. [Google Scholar] [CrossRef] [Scilit]
- Jackson, J. Validating New Measures of the Fear of Crime. Int. J. Soc. Res. Methodol. 2005, 8, 297–315. [Google Scholar] [CrossRef] [Scilit]
- Solymosi, R.; Bowers, K.; Fujiyama, T. Mapping Fear of Crime as a Context-dependent Everyday Experience That Varies in Space and Time. Leg. Criminol. Psychol. 2015, 20, 193–211. [Google Scholar] [CrossRef] [Scilit]
- Slovic, P. Perception of Risk. Science 1987, 236, 280–285. [Google Scholar] [CrossRef] [Scilit] [PubMed]
- Backer-Grøndahl, A.; Fyhri, A.; Ulleberg, P.; Amundsen, A.H. Accidents and Unpleasant Incidents: Worry in Transport and Prediction of Travel Behavior. Risk Anal. 2009, 29, 1217–1226. [Google Scholar] [CrossRef] [Scilit] [PubMed]
- Benedek, J.; Ciobanu, S.M.; Man, T.C. Hotspots and Social Background of Urban Traffic Crashes: A Case Study in Cluj-Napoca (Romania). Accid. Anal. Prev. 2016, 87, 117–126. [Google Scholar] [CrossRef] [Scilit] [PubMed]
- Benedek, J.; Hărăngus, I.; Man, T. Commuting Patterns in Romania: Case Study on Clui County. Reg. Stat. 2016, 6, 39–53. [Google Scholar] [CrossRef] [Scilit]
- Bîrsănuc, E.M.; Man, T.C.; Petrea, D. What Does Unsustainable Urban Sprawl Bring? Spatial Patterns Analysis of Built Environment in Cluj Metropolitan Area. J. Settl. Spat. Plan. 2019, 10, 121–130. [Google Scholar] [CrossRef] [Scilit]
- Thomas, L.J.; Rhind, D.J.A.; Robinson, K.J. Rail Passenger Perceptions of Risk and Safety and Priorities for Improvement. Cogn. Technol. Work 2006, 8, 67–75. [Google Scholar] [CrossRef] [Scilit]
- Cohen, L.E.; Felson, M. Social Change and Crime Rate Trends: A Routine Activity Approach. Am. Sociol. Rev. 1979, 44, 588. [Google Scholar] [CrossRef] [Scilit] [PubMed]
- Loukaitou-Sideris, A. Hot Spots of Bus Stop Crime: The Importance of Environmental Attributes. J. Am. Plan. Assoc. 1999, 65, 395–411. [Google Scholar] [CrossRef] [Scilit]
- Cozens, P.; Saville, G.; Hillier, D. Crime Prevention through Environmental Design (CPTED): A Review and Modern Bibliography. Prop. Manag. 2005, 23, 328–356. [Google Scholar] [CrossRef] [Scilit]
- Rahaman, M.; Currie, G.; Muir, C. Development and Application of a Scale to Measure Station Design Quality for Personal Safety. Transp. Res. Rec. J. Transp. Res. Board 2016, 2540, 1–12. [Google Scholar] [CrossRef] [Scilit]
- Fisher, B.S.; Nasar, J.L. Fear of Crime in Relation to Three Exterior Site Features: Prospect, Refuge, and Escape. Environ. Behav. 1992, 24, 35–65. [Google Scholar] [CrossRef] [Scilit]
- Nasar, J.L.; Fisher, B. ‘Hot Spots’ of Fear and Crime: A Multi-Method Investigation. J. Environ. Psychol. 1993, 13, 187–206. [Google Scholar] [CrossRef] [Scilit]
- Hale, C. Fear of Crime: A Review of the Literature. Int. Rev. Vict. 1996, 4, 79–150. [Google Scholar] [CrossRef] [Scilit]
- Crenshaw, K. Mapping the Margins: Intersectionality, Identity Politics, and Violence against Women of Color. Stanf. Law Rev. 1991, 43, 1241. [Google Scholar] [CrossRef] [Scilit]
- Pain, R. Gender, Race, Age and Fear in the City. Urban Stud. 2001, 38, 899–913. [Google Scholar] [CrossRef]
- Stradling, S.; Carreno, M.; Rye, T.; Noble, A. Passenger Perceptions and the Ideal Urban Bus Journey Experience. Transp. Policy 2007, 14, 283–292. [Google Scholar] [CrossRef] [Scilit]
- Koskela, H.; Pain, R. Revisiting Fear and Place: Women’s Fear of Attack and the Built Environment. Geoforum 2000, 31, 269–280. [Google Scholar] [CrossRef] [Scilit]
- Vera-Gray, F.; Kelly, L. Contested Gendered Space: Public Sexual Harassment and Women’s Safety Work. Int. J. Comp. Appl. Crim. Justice 2020, 44, 265–275. [Google Scholar] [CrossRef] [Scilit]
- Bîrsănuc, E.M.; Man, T.C. Isn’t the Glass Ceiling Thick Enough? Mapping Perceptions on Women’s Economic Empowerment in North-West Region of Romania. Cogent Soc. Sci. 2023, 9, 2242612. [Google Scholar] [CrossRef] [Scilit]
- dell’Olio, L.; Ibeas, A.; Cecin, P. The Quality of Service Desired by Public Transport Users. Transp. Policy 2011, 18, 217–227. [Google Scholar] [CrossRef] [Scilit]
- Hensher, D.A.; Stopher, P.; Bullock, P. Service Quality––Developing a Service Quality Index in the Provision of Commercial Bus Contracts. Transp. Res. Part Policy Pract. 2003, 37, 499–517. [Google Scholar] [CrossRef] [Scilit]
- Spears, S.; Houston, D.; Boarnet, M.G. Illuminating the Unseen in Transit Use: A Framework for Examining the Effect of Attitudes and Perceptions on Travel Behavior. Transp. Res. Part Policy Pract. 2013, 58, 40–53. [Google Scholar] [CrossRef] [Scilit]
- Friman, M.; Lättman, K.; Olsson, L.E. Public Transport Quality, Safety, and Perceived Accessibility. Sustainability 2020, 12, 3563. [Google Scholar] [CrossRef] [Scilit]
- Su, D.N.; Nguyen-Phuoc, D.Q.; Johnson, L.W. Effects of Perceived Safety, Involvement and Perceived Service Quality on Loyalty Intention among Ride-Sourcing Passengers. Transportation 2021, 48, 369–393. [Google Scholar] [CrossRef] [Scilit]
- Başaran, G.G.; Ingvardson, J.B.; Nielsen, O.A. Where the Station Ends and Surroundings Begin: A Holistic Gender Perspective on Perceived Safety in Public Transport. Cities 2026, 172, 106873. [Google Scholar] [CrossRef] [Scilit]
- Reginald, M. Illuminating Issues in Bus Stop Lighting: A Case Study of Los Angeles. Transp. Res. Rec. J. Transp. Res. Board 2025, 2679, 660–672. [Google Scholar] [CrossRef] [Scilit]
- Vilalta, C.J. Fear of Crime in Public Transport: Research in Mexico City. Crime Prev. Community Saf. 2011, 13, 171–186. [Google Scholar] [CrossRef] [Scilit]
- Busco, C.; González, F.; Lillo, N. Safety, Gender, and the Public Transport System in Santiago, Chile. Sustainability 2022, 14, 16484. [Google Scholar] [CrossRef] [Scilit]
- Sethulakshmi, G.; Mohan, M. Modelling Sidewalk Safety Perceptions of Pedestrians Accessing Bus Stops and Uncovering Its Role in Shaping Bus Ridership: An Empirical Investigation. Transp. Res. Part F Traffic Psychol. Behav. 2025, 114, 441–460. [Google Scholar] [CrossRef] [Scilit]
- Risimati, B.; Ingwani, E.; Chakwizira, J.; Gumbo, T. Safety Performance in Leeto La Polokwane Bus Rapid Transit System, South Africa. Sustainability 2026, 18, 8780. [Google Scholar] [CrossRef] [Scilit]
- Talpur, A.; Nadeem, M.; Sahito, N.; Baig, F.; Lee, J.J.; Basheer, M.A.; Ali, A.; Feng, M. Inclusive Mobility at Risk: Perceived Safety and Women’s Intentions to Use Paratransit in Lahore. J. Transp. Health 2026, 49, 102335. [Google Scholar] [CrossRef] [Scilit]
- Nadeem, M.; Khaliq, N.; Baig, F.; Sahito, N.; Ali, A.; Habib, H.A. Measuring Women’s Perceived Safety in Paratransit: A Composite Index Approach for Gender-Inclusive Urban Mobility in Lahore. J. Transp. Secur. 2026, 19, 41. [Google Scholar] [CrossRef] [Scilit]
- Medayese, S.; Akande, O.S.; Magidimisha-Chipungu, H.H. Public Transport Safety and Crime Patterns in Lagos and Abuja. Discov. Cities 2025, 2, 95. [Google Scholar] [CrossRef] [Scilit]
- Kumar, P.; Kulkarni, S.Y.; Parida, M. Security Perceptions of Delhi Commuters at Metro-Bus Interchange in Multi Modal Perspective. J. Transp. Secur. 2011, 4, 295–307. [Google Scholar] [CrossRef] [Scilit]
- Orozco-Fontalvo, M.; Soto, J.; Arévalo, A.; Oviedo-Trespalacios, O. Women’s Perceived Risk of Sexual Harassment in a Bus Rapid Transit (BRT) System: The Case of Barranquilla, Colombia. J. Transp. Health 2019, 14, 100598. [Google Scholar] [CrossRef] [Scilit]
- Cozens, P.; Neale, R.; Hillier, D.; Whitaker, J. Tackling Crime and Fear of Crime While Waiting at Britain’s Railway Stations. J. Public Transp. 2004, 7, 23–41. [Google Scholar] [CrossRef] [Scilit]
- Ball, K.S.; Wesson, C.J. Perceptions of Unwanted Sexual Behaviour on Public Transport: Exploring Transport Density and Behaviour Severity. Crime Prev. Community Saf. 2017, 19, 199–210. [Google Scholar] [CrossRef] [Scilit]
- Tilahun, N.; Li, M. Walking Access to Transit Stations: Evaluating Barriers with Stated Preference. Transp. Res. Rec. J. Transp. Res. Board 2015, 2534, 16–23. [Google Scholar] [CrossRef] [Scilit]
- Coppola, P.; Silvestri, F. Gender Inequality in Safety and Security Perceptions in Railway Stations. Sustainability 2021, 13, 4007. [Google Scholar] [CrossRef] [Scilit]
- Levine, N.; Wachs, M. Bus Crime in Los Angeles: II—Victims and Public Impact. Transp. Res. Part Gen. 1986, 20, 285–293. [Google Scholar] [CrossRef] [Scilit]
- Natarajan, M.; Schmuhl, M.; Sudula, S.; Mandala, M. Sexual Victimization of College Students in Public Transport Environments: A Whole Journey Approach. Crime Prev. Community Saf. 2017, 19, 168–182. [Google Scholar] [CrossRef] [Scilit]
- Vanier, C.; d’Arbois De Jubainville, H. Feeling Unsafe in Public Transportation: A Profile Analysis of Female Users in the Parisian Region. Crime Prev. Community Saf. 2017, 19, 251–263. [Google Scholar] [CrossRef] [Scilit]
- Cheranchery, M.F.; Bhattacharyya, K.; Salih, M.; Maitra, B. A Proactive Approach to Assess Safety Level of Urban Bus Stops. Int. J. Inj. Contr. Saf. Promot. 2019, 26, 260–270. [Google Scholar] [CrossRef] [Scilit] [PubMed]
- Tubis, A.A.; Skupień, E.T.; Rydlewski, M. Method of Assessing Bus Stops Safety Based on Three Groups of Criteria. Sustainability 2021, 13, 8275. [Google Scholar] [CrossRef] [Scilit]
- Rossetti, S. In Field Assessment of Safety, Security, Comfort and Accessibility of Bus Stops: A Planning Perspective. Eur. Transp. Eur. 2020, 80, 1–17. [Google Scholar] [CrossRef] [Scilit]
- Fan, Y.; Guthrie, A.; Levinson, D. Waiting Time Perceptions at Transit Stops and Stations: Effects of Basic Amenities, Gender, and Security. Transp. Res. Part Policy Pract. 2016, 88, 251–264. [Google Scholar] [CrossRef] [Scilit]
- Schneider, A.; Krueger, E.; Vollenwyder, B.; Thurau, J.; Elfering, A. Understanding the Relations between Crowd Density, Safety Perception and Risk-Taking Behavior on Train Station Platforms: A Case Study from Switzerland. Transp. Res. Interdiscip. Perspect. 2021, 10, 100390. [Google Scholar] [CrossRef] [Scilit]
- Yavuz, N.; Welch, E.W.; Sriraj, P.S. Individual and Neighborhood Determinants of Perceptions of Bus and Train Safety in Chicago, Illinois: Application of Hierarchical Linear Modeling. Transp. Res. Rec. J. Transp. Res. Board 2007, 2034, 19–26. [Google Scholar] [CrossRef] [Scilit]
- Stjernborg, V. Triggers for Feelings of Insecurity and Perceptions of Safety in Relation to Public Transport; the Experiences of Young and Active Travellers. Appl. Mobil. 2025, 10, 269–289. [Google Scholar] [CrossRef] [Scilit]
- Luo, S.; He, S.Y. Understanding Gender Difference in Perceptions toward Transit Services across Space and Time: A Social Media Mining Approach. Transp. Policy 2021, 111, 63–73. [Google Scholar] [CrossRef] [Scilit]
- Ouali, L.A.B.; Graham, D.J.; Barron, A.; Trompet, M. Gender Differences in the Perception of Safety in Public Transport. J. R. Stat. Soc. Ser. A Stat. Soc. 2020, 183, 737–769. [Google Scholar] [CrossRef] [Scilit]
- King, J.A.; Greer, D.A.; Danvers, R.S.M.; Keating, B.W. The Personal Safety Burden for Women Taking Public Transport in Australia and Implications for Provision of Equitable Public Transport. J. Public Transp. 2025, 27, 100118. [Google Scholar] [CrossRef] [Scilit]
- Masoumi, H.E.; Fastenmeier, W. Perceptions of Security in Public Transport Systems of Germany: Prospects for Future Research. J. Transp. Secur. 2016, 9, 105–116. [Google Scholar] [CrossRef] [Scilit]
- Jaitman, L. Public Transport from a Gender Perspective: Insecurity and Victimization in Latin America. The Case of Lima and Asuncion Metropolitan Areas. J. Econ. Race Policy 2020, 3, 24–40. [Google Scholar] [CrossRef] [Scilit]
- Shellow, R.; Romualdi, J.P.; Bartel, E.W. Crime in Rapid Transit Systems: An Analysis and a Recommended Security and Surveillance System. Transp. Res. Rec. 1974, 487, 1–12. [Google Scholar]
- Badiora, A.; Ojewale, O.; Okunola, O.H. Perceived Risk and Fear of Crime at Public Transit Hubs: The Nigerian Transit Experience. Int. J. Crim. Justice Sci. 2015, 10, 139–151. [Google Scholar]
- Badiora, A.; Wojuade, C.A.; Adeyemi, A.S. Personal Safety and Improvements Concerns in Public Places: An Exploration of Rail Transport Users’ Perception. J. Place Manag. Dev. 2020, 13, 319–346. [Google Scholar] [CrossRef] [Scilit]
- Loukaitou-Sideris, A.; Liggett, R.; Iseki, H.; Thurlow, W. Measuring the Effects of Built Environment on Bus Stop Crime. Environ. Plan. B Plan. Des. 2001, 28, 255–280. [Google Scholar] [CrossRef] [Scilit]
- Loukaitou-Sideris, A.; Liggett, R.; Iseki, H. The Geography of Transit Crime: Documentation and Evaluation of Crime Incidence on and around the Green Line Stations in Los Angeles. J. Plan. Educ. Res. 2002, 22, 135–151. [Google Scholar] [CrossRef] [Scilit]
- Ceccato, V.; Uittenbogaard, A.; Bamzar, R. Security in Stockholm’s Underground Stations: The Importance of Environmental Attributes and Context. Secur. J. 2013, 26, 33–59. [Google Scholar] [CrossRef] [Scilit]
- Irvin-Erickson, Y.; La Vigne, N. A Spatio-Temporal Analysis of Crime at Washington, DC Metro Rail: Stations’ Crime-Generating and Crime-Attracting Characteristics as Transportation Nodes and Places. Crime Sci. 2015, 4, 14. [Google Scholar] [CrossRef] [Scilit]
- Newton, A.D.; Partridge, H.; Gill, A. In and around: Identifying Predictors of Theft within and near to Major Mass Underground Transit Systems. Secur. J. 2014, 27, 132–146. [Google Scholar] [CrossRef] [Scilit]
- Zhang, W. Does Compact Land Use Trigger a Rise in Crime and a Fall in Ridership? A Role for Crime in the Land Use–Travel Connection. Urban Stud. 2016, 53, 3007–3026. [Google Scholar] [CrossRef] [Scilit]
- Bromley, R.; Thomas, C.; Millie, A. Exploring Safety Concerns in the Night-Time City: Revitalising the Evening Economy. Town Plan. Rev. 2000, 71, 71. [Google Scholar] [CrossRef] [Scilit]
- Ceccato, V.; Sundling, C.; Gliori, G. What Makes a Railway Station Safe and for Whom? The Impact of Transit Environments on Passengers’ Victimisation and Safety Perceptions. Eur. Transp. Res. Rev. 2024, 16, 21. [Google Scholar] [CrossRef] [Scilit]
- Capasso Da Silva, D.; Rodrigues Da Silva, A.N. Sustainable Modes and Violence: Perceived Safety and Exposure to Crimes on Trips to and from a Brazilian University Campus. J. Transp. Health 2020, 16, 100817. [Google Scholar] [CrossRef] [Scilit]
- Kapatsila, B.; Grisé, E. An Empirical Investigation of the Impact of Preferences for Physical, Social, and Security Factors on the Feeling of Safety on Public Transit. Transp. Res. Part Policy Pract. 2025, 196, 104501. [Google Scholar] [CrossRef] [Scilit]
- Carter, E.; Paragreen, J.; Valfrè, G.; Fletcher, D. Passenger Acceptance of Counter-terrorism Security Measures in Stations. IET Intell. Transp. Syst. 2016, 10, 2–9. [Google Scholar] [CrossRef] [Scilit]
- Srivastava, G.N. Understanding Perception of Commuters for Safety and Risk Mitigation Mechanism: The Case of Public Transportation. Int. J. Appl. Manag. Sci. 2019, 11, 370. [Google Scholar] [CrossRef] [Scilit]
- Gromule, V.; Yatskiv, I.; Pēpulis, J. Safety and Security of Passenger Terminal: The Case Study of Riga International Coach Terminal. Procedia Eng. 2017, 178, 147–154. [Google Scholar] [CrossRef] [Scilit]
- Adesanya, A.A.; Tayo, Y.A.; Das, B. Commuters’ Security and Safety Perception of the Bus Rapid Transit System: An Experience of an Emerging Mega City in Sub-Saharan Africa. Afr. Transp. Stud. 2026, 4, 100086. [Google Scholar] [CrossRef] [Scilit]
- Guo, Y.; Yang, L.; Huang, W.; Guo, Y. Traffic Safety Perception, Attitude, and Feeder Mode Choice of Metro Commute: Evidence from Shenzhen. Int. J. Environ. Res. Public Health 2020, 17, 9402. [Google Scholar] [CrossRef] [Scilit] [PubMed]
- Mohan, D. Road Accidents in India. IATSS Res. 2009, 33, 75–79. [Google Scholar] [CrossRef] [Scilit]
- Gobind, J. Transport Anxiety and Work Performance. SA J. Hum. Resour. Manag. 2018, 16, a943. [Google Scholar] [CrossRef] [Scilit]
- Fatma, D. Reducing Fear of Crime to Encourage Public Transit Use: Identifying Variables Influencing Perceptions of Crime in Public Transit. 2012. Available online: https://www.hues.kyushu-u.ac.jp/wp-content/uploads/2022/10/2HE11026E.pdf (accessed on 16 October 2026).
- Gardner, N.; Cui, J.; Coiacetto, E. Harassment on Public Transport and Its Impacts on Women’s Travel Behaviour. Aust. Plan. 2017, 54, 8–15. [Google Scholar] [CrossRef] [Scilit]
- Loukaitou-Sideris, A.; Ceccato, V. Sexual Harassment on Transit: A Global, Comparative Examination. Secur. J. 2022, 35, 175–204. [Google Scholar] [CrossRef] [Scilit]
- Kacharo, D.K.; Teshome, E.; Woltamo, T. Safety and Security of Women and Girls in Public Transport. Urban Plan. Transp. Res. 2022, 10, 1–19. [Google Scholar] [CrossRef] [Scilit]
- Valan, M.L. Victimology of Sexual Harassment on Public Transportation: Evidence from India. J. Vict. Vict. Justice 2020, 3, 24–37. [Google Scholar] [CrossRef] [Scilit]
- Tripathi, K.; Borrion, H.; Belur, J. Sexual Harassment of Students on Public Transport: An Exploratory Study in Lucknow, India. Crime Prev. Community Saf. 2017, 19, 240–250. [Google Scholar] [CrossRef] [Scilit]
- Neupane, G.; Chesney-Lind, M. Violence against Women on Public Transport in Nepal: Sexual Harassment and the Spatial Expression of Male Privilege. Int. J. Comp. Appl. Crim. Justice 2014, 38, 23–38. [Google Scholar] [CrossRef] [Scilit]
- Nayak, J.K.; Benazeer, D. Identifying and Addressing the Issue of Women’s Fear of Victimization in Public Transport: A Case of Delhi. J. East. Asia Soc. Transp. Stud. 2017, 12, 2392–2407. [Google Scholar]
- Quinones, L.M. Sexual Harassment in Public Transport in Bogotá. Transp. Res. Part Policy Pract. 2020, 139, 54–69. [Google Scholar] [CrossRef] [Scilit]
- Kash, G. Always on the Defensive: The Effects of Transit Sexual Assault on Travel Behavior and Experience in Colombia and Bolivia. J. Transp. Health 2019, 13, 234–246. [Google Scholar] [CrossRef] [Scilit]
- Dunckel Graglia, A. Finding Mobility: Women Negotiating Fear and Violence in Mexico City’s Public Transit System. Gend. Place Cult. 2016, 23, 624–640. [Google Scholar] [CrossRef] [Scilit]
- Infante-Vargas, D.; Boyer, K. Gender-Based Violence against Women Users of Public Transport in Saltillo, Coahuila, Mexico. J. Gend. Stud. 2022, 31, 216–230. [Google Scholar] [CrossRef] [Scilit]
- Moreira, G.C.; Ceccato, V.A. Gendered Mobility and Violence in the São Paulo Metro, Brazil. Urban Stud. 2021, 58, 203–222. [Google Scholar] [CrossRef] [Scilit]
- Fielding, L.; Tzani, C.; Ioannou, M.; Artinopoulou, V. Sexual Harassment on Public Transport in England: Prevalence, Experiences and Barriers to Reporting. Assess. Dev. Matters 2021, 13, 30–37. [Google Scholar] [CrossRef] [Scilit]
- Vanderschuren, M.J.W.A.; Phayane, S.R.; Gwynne-Evans, A.J. Perceptions of Gender, Mobility, and Personal Safety: South Africa Moving Forward. Transp. Res. Rec. J. Transp. Res. Board 2019, 2673, 616–627. [Google Scholar] [CrossRef] [Scilit]
- Loukaitou-Sideris, A.; Brozen, M.; Ding, H.; Pinski, M.; Siddiq, F. Safety in Public Transportation Among College Students; California Department of Transportation: Sacramento, CA, USA, 2020. [Google Scholar]
- Younes, H.; Rosenthal, S.; Heady, C.; Carnegie, J. Public Transit User Experiences and Feelings of Safety among Marginalized Genders. Transp. Res. Rec. J. Transp. Res. Board 2026, 2680, 623–636. [Google Scholar] [CrossRef] [Scilit]
- Solymosi, R.; Cella, K.; Newton, A. Did They Report It to Stop It? A Realist Evaluation of the Effect of an Advertising Campaign on Victims’ Willingness to Report Unwanted Sexual Behaviour. Secur. J. 2018, 31, 570–590. [Google Scholar] [CrossRef] [Scilit]
- Horii, M.; Burgess, A. Constructing Sexual Risk: ‘Chikan’, Collapsing Male Authority and the Emergence of Women-Only Train Carriages in Japan. Health Risk Soc. 2012, 14, 41–55. [Google Scholar] [CrossRef] [Scilit]
- Loukaitou-Sideris, A. Fear and Safety in Transit Environments from the Women’s Perspective. Secur. J. 2014, 27, 242–256. [Google Scholar] [CrossRef] [Scilit]
- Chowdhury, S.; Van Wee, B. Examining Women’s Perception of Safety during Waiting Times at Public Transport Terminals. Transp. Policy 2020, 94, 102–108. [Google Scholar] [CrossRef] [Scilit]
- Osmond, J.; Woodcock, A. Are Our Streets Safe Enough for Female Users? How Everyday Harassment Affects Mobility. In International Conference on Ergonomics & Human Factors 2015; Taylor and Francis: London, UK, 2015. [Google Scholar]
- Sarker, R.; Currie, G.; Chowdhury, S. Exploring the Long-Term Impacts of Harassment on Women’s Public Transport Use. Transp. Policy 2026, 186, 104249. [Google Scholar] [CrossRef] [Scilit]
- Hsu, H.-P. How Does the Fear of Sexual Harassment on Public Transportation Affect Women’s Use of It? In Proceedings of the 4th International Conference; Transportation Research Council: Washington, DC, USA, 2010; Volume 2. [Google Scholar]
- Loukaitou-Sideris, A. Is It Safe to Walk?1 Neighborhood Safety and Security Considerations and Their Effects on Walking. J. Plan. Lit. 2006, 20, 219–232. [Google Scholar] [CrossRef] [Scilit]
- Maroun, R.; Sleiman, S.; Gerges, C.; Mehriar, M.; Masoumi, H. Perception of Subjective Security in Public Transportation. J. Transp. Secur. 2024, 17, 3. [Google Scholar] [CrossRef] [Scilit]
- Yavuz, N.; Welch, E.W. Addressing Fear of Crime in Public Space: Gender Differences in Reaction to Safety Measures in Train Transit. Urban Stud. 2010, 47, 2491–2515. [Google Scholar] [CrossRef] [Scilit] [PubMed]
- Loukaitou-Sideris, A.; Fink, C. Addressing Women’s Fear of Victimization in Transportation Settings: A Survey of U.S. Transit Agencies. Urban Aff. Rev. 2009, 44, 554–587. [Google Scholar] [CrossRef] [Scilit]
- Kim, H. Service Design for Public Transportation to Address the Issue of Females’ Fear of Crime. Transportation 2021, 48, 167–192. [Google Scholar] [CrossRef] [Scilit]
- Pirra, M.; Kalakou, S.; Carboni, A.; Costa, M.; Diana, M.; Lynce, A.R. A Preliminary Analysis on Gender Aspects in Transport Systems and Mobility Services: Presentation of a Survey Design. Sustainability 2021, 13, 2676. [Google Scholar] [CrossRef] [Scilit]
- Hidayati, I.; Tan, W.; Yamu, C. How Gender Differences and Perceptions of Safety Shape Urban Mobility in Southeast Asia. Transp. Res. Part F Traffic Psychol. Behav. 2020, 73, 155–173. [Google Scholar] [CrossRef] [Scilit]
- Al-Rashid, M.A.; Nahiduzzaman, K.M.; Ahmed, S.; Campisi, T.; Akgün, N. Gender-Responsive Public Transportation in the Dammam Metropolitan Region, Saudi Arabia. Sustainability 2020, 12, 9068. [Google Scholar] [CrossRef] [Scilit]
- Romadlon, F.; Saintika, Y.; Aliyah, K.; Hamid, A. Forecasting the Needs of the Intelligent Transportation System (ITS) Based on Perspectives on Passenger Comfort and Safety in Trans Jateng. In Proceedings of the 2024 International Conference on ICT for a Smart Society (ICISS), Bandung, Indonesia, 4–5 September 2024; pp. 1–6. [Google Scholar]
- Lubitow, A.; Carathers, J.; Kelly, M.; Abelson, M. Transmobilities: Mobility, Harassment, and Violence Experienced by Transgender and Gender Nonconforming Public Transit Riders in Portland, Oregon. Gend. Place Cult. 2017, 24, 1398–1418. [Google Scholar] [CrossRef] [Scilit]
- Lubitow, A.; Rainer, J.; Bassett, S. Exclusion and Vulnerability on Public Transit: Experiences of Transit Dependent Riders in Portland, Oregon. Mobilities 2017, 12, 924–937. [Google Scholar] [CrossRef] [Scilit]
- Shakibaei, S.; Vorobjovas-Pinta, O. Access to Urban Leisure: Investigating Mobility Justice for Transgender and Gender Diverse People on Public Transport. Leis. Sci. 2024, 46, 639–657. [Google Scholar] [CrossRef] [Scilit]
- Cain, A. Teenage Mobility in the United States: Issues and Opportunities for Promoting Public Transit. Transp. Res. Rec. J. Transp. Res. Board 2006, 1971, 140–148. [Google Scholar] [CrossRef]
- Currie, G.; Delbosc, A.; Mahmoud, S. Factors Influencing Young Peoples’ Perceptions of Personal Safety on Public Transport. J. Public Transp. 2013, 16, 1–19. [Google Scholar] [CrossRef] [Scilit]
- Azenkot, S.; Prasain, S.; Borning, A.; Fortuna, E.; Ladner, R.E.; Wobbrock, J.O. Enhancing Independence and Safety for Blind and Deaf-Blind Public Transit Riders. In Proceedings of the SIGCHI Conference on Human Factors in Computing Systems; ACM: Vancouver BC Canada, 2011; pp. 3247–3256. [Google Scholar]
- Iudici, A.; Bertoli, L.; Faccio, E. The ‘Invisible’ Needs of Women with Disabilities in Transportation Systems. Crime Prev. Community Saf. 2017, 19, 264–275. [Google Scholar] [CrossRef] [Scilit]
- Rahman, D. Inclusive Urban Transport for Vulnerable Groups: The Case of Dhaka City. Master’s Thesis, Brac University, Dhaka, Bangladesh, 2019. [Google Scholar]
- Martens, K. Transport Justice; Routledge: New York, NY, USA, 2016. [Google Scholar]
- Evans, G. Accessibility, Urban Design and the Whole Journey Environment. Built Environ. 2009, 35, 366–385. [Google Scholar] [CrossRef] [Scilit]
- Tilahun, N.; Thakuriah, P.; Li, M.; Keita, Y. Transit Use and the Work Commute: Analyzing the Role of Last Mile Issues. J. Transp. Geogr. 2016, 54, 359–368. [Google Scholar] [CrossRef] [Scilit]
- Kim, S.; Ulfarsson, G.F.; Todd Hennessy, J. Analysis of Light Rail Rider Travel Behavior: Impacts of Individual, Built Environment, and Crime Characteristics on Transit Access. Transp. Res. Part Policy Pract. 2007, 41, 511–522. [Google Scholar] [CrossRef] [Scilit]
- Park, K.; Farb, A.; Chen, S. First-/Last-Mile Experience Matters: The Influence of the Built Environment on Satisfaction and Loyalty among Public Transit Riders. Transp. Policy 2021, 112, 32–42. [Google Scholar] [CrossRef] [Scilit]
- Ingvardson, J.B.; Nielsen, O.A. The Influence of Vicinity to Stations, Station Characteristics and Perceived Safety on Public Transport Mode Choice: A Case Study from Copenhagen. Public Transp. 2022, 14, 459–480. [Google Scholar] [CrossRef] [Scilit]
- Foster, S.; Giles-Corti, B. The Built Environment, Neighborhood Crime and Constrained Physical Activity: An Exploration of Inconsistent Findings. Prev. Med. 2008, 47, 241–251. [Google Scholar] [CrossRef] [Scilit] [PubMed]
- Carver, A.; Timperio, A.; Crawford, D. Playing It Safe: The Influence of Neighbourhood Safety on Children’s Physical Activity—A Review. Health Place 2008, 14, 217–227. [Google Scholar] [CrossRef] [Scilit] [PubMed]
- Cozens, P.; Neale, R.; Whitaker, J.; Hillier, D. Managing Crime and the Fear of Crime at Railway Stations—A Case Study in South Wales (UK). Int. J. Transp. Manag. 2003, 1, 121–132. [Google Scholar] [CrossRef] [Scilit]
- Deniz, D. Improving Perceived Safety in Public Transportation Through Design. In Sustainable City 2025; WIT Press: Ashurst, UK, 2018; pp. 199–208. [Google Scholar]
- Lois, D.; Monzón, A.; Hernández, S. Analysis of Satisfaction Factors at Urban Transport Interchanges: Measuring Travellers’ Attitudes to Information, Security and Waiting. Transp. Policy 2018, 67, 49–56. [Google Scholar] [CrossRef] [Scilit]
- Painter, K. The Influence of Street Lighting Improvements on Crime, Fear and Pedestrian Street Use, after Dark. Landsc. Urban Plan. 1996, 35, 193–201. [Google Scholar] [CrossRef] [Scilit]
- Welsh, B.C.; Farrington, D.P. Effects of Improved Street Lighting on Crime. Campbell Syst. Rev. 2008, 4, 1–29. [Google Scholar] [CrossRef] [Scilit]
- Wang, B.; Zacharias, J. Noise, Odor and Passenger Density in Perceived Crowding in Public Transport. Transp. Res. Part Policy Pract. 2020, 135, 215–223. [Google Scholar] [CrossRef] [Scilit]
- Börjesson, M.; Rubensson, I. Satisfaction with Crowding and Other Attributes in Public Transport. Transp. Policy 2019, 79, 213–222. [Google Scholar] [CrossRef] [Scilit]
- Tirachini, A.; Hensher, D.A.; Rose, J.M. Crowding in Public Transport Systems: Effects on Users, Operation and Implications for the Estimation of Demand. Transp. Res. Part Policy Pract. 2013, 53, 36–52. [Google Scholar] [CrossRef] [Scilit]
- Delbosc, A.; Currie, G. Modelling the Causes and Impacts of Personal Safety Perceptions on Public Transport Ridership. Transp. Policy 2012, 24, 302–309. [Google Scholar] [CrossRef] [Scilit]
- Nguyen, M.H.; Pojani, D. Why Are Hanoi Students Giving up on Bus Ridership? Transportation 2023, 50, 811–835. [Google Scholar] [CrossRef] [Scilit] [PubMed]
- Wallace, R.R.; Rodriguez, D.A.; White, C.; Levine, J. Who Noticed, Who Cares? Passenger Reactions to Transit Safety Measures. Transp. Res. Rec. J. Transp. Res. Board 1999, 1666, 133–138. [Google Scholar] [CrossRef] [Scilit]
- Gkiotsalitis, K.; Cats, O. Public Transport Planning Adaption under the COVID-19 Pandemic Crisis: Literature Review of Research Needs and Directions. Transp. Rev. 2021, 41, 374–392. [Google Scholar] [CrossRef] [Scilit]
- Tirachini, A.; Cats, O. COVID-19 and Public Transportation: Current Assessment, Prospects, and Research Needs. J. Public Transp. 2020, 22, 1–21. [Google Scholar] [CrossRef] [Scilit] [PubMed]
- Beck, M.J.; Hensher, D.A. Insights into the Impact of COVID-19 on Household Travel and Activities in Australia—The Early Days under Restrictions. Transp. Policy 2020, 96, 76–93. [Google Scholar] [CrossRef] [Scilit] [PubMed]
- Przybylowski, A.; Stelmak, S.; Suchanek, M. Mobility Behaviour in View of the Impact of the COVID-19 Pandemic—Public Transport Users in Gdansk Case Study. Sustainability 2021, 13, 364. [Google Scholar] [CrossRef] [Scilit]
- Man, T.-C.; Andor, C.-F.; Bîrsănuc, E.-M. First Year of COVID-19. The Impact of Pandemic Waves on Public Transport Usage in Cluj-Napoca, Romania. J. Settl. Spat. Plan. 2022, 13, 71–79. [Google Scholar] [CrossRef] [Scilit]
- Aghabayk, K.; Esmailpour, J.; Shiwakoti, N. Effects of COVID-19 on Rail Passengers’ Crowding Perceptions. Transp. Res. Part Policy Pract. 2021, 154, 186–202. [Google Scholar] [CrossRef] [Scilit] [PubMed]
- Cho, S.-H.; Park, H.-C.; Choo, S.; Park, S.H. How Crowding Impedance Affected Travellers on Public Transport in the COVID-19 Pandemic. Transp. Res. Part F Traffic Psychol. Behav. 2024, 100, 69–83. [Google Scholar] [CrossRef] [Scilit]
- Dong, H.; Ma, S.; Jia, N.; Tian, J. Understanding Public Transport Satisfaction in Post COVID-19 Pandemic. Transp. Policy 2021, 101, 81–88. [Google Scholar] [CrossRef] [Scilit]
- Tan, L.; Ma, C. Choice Behavior of Commuters’ Rail Transit Mode during the COVID-19 Pandemic Based on Logistic Model. J. Traffic Transp. Eng. Engl. Ed. 2021, 8, 186–195. [Google Scholar] [CrossRef] [Scilit]
- Sham, R.; Kai Xuen, C.; Yi Ting, L.; Hye, M.N. Public Transport, Ridership and Safe Travelling Environment during COVID-19 Pandemic. Environ.-Behav. Proc. J. 2022, 7, 339–346. [Google Scholar] [CrossRef] [Scilit]
- McCarthy, O.T.; Caulfield, B.; O’Mahony, M. How Transport Users Perceive Personal Safety Apps. Transp. Res. Part F Traffic Psychol. Behav. 2016, 43, 166–182. [Google Scholar] [CrossRef] [Scilit]
- Salonen, A.O. Passenger’s Subjective Traffic Safety, in-Vehicle Security and Emergency Management in the Driverless Shuttle Bus in Finland. Transp. Policy 2018, 61, 106–110. [Google Scholar] [CrossRef] [Scilit]
- Salonen, A.; Haavisto, N. Towards Autonomous Transportation. Passengers’ Experiences, Perceptions and Feelings in a Driverless Shuttle Bus in Finland. Sustainability 2019, 11, 588. [Google Scholar] [CrossRef] [Scilit]
- Hilgarter, K.; Granig, P. Public Perception of Autonomous Vehicles: A Qualitative Study Based on Interviews after Riding an Autonomous Shuttle. Transp. Res. Part F Traffic Psychol. Behav. 2020, 72, 226–243. [Google Scholar] [CrossRef] [Scilit]
- Nordhoff, S.; De Winter, J.; Madigan, R.; Merat, N.; Van Arem, B.; Happee, R. User Acceptance of Automated Shuttles in Berlin-Schöneberg: A Questionnaire Study. Transp. Res. Part F Traffic Psychol. Behav. 2018, 58, 843–854. [Google Scholar] [CrossRef] [Scilit]
- Kassens-Noor, E.; Kotval-Karamchandani, Z.; Cai, M. Willingness to Ride and Perceptions of Autonomous Public Transit. Transp. Res. Part Policy Pract. 2020, 138, 92–104. [Google Scholar] [CrossRef] [Scilit]
- Dong, X.; DiScenna, M.; Guerra, E. Transit User Perceptions of Driverless Buses. Transportation 2019, 46, 35–50. [Google Scholar] [CrossRef] [Scilit]
- López-Lambas, M.E.; Alonso, A. The Driverless Bus: An Analysis of Public Perceptions and Acceptability. Sustainability 2019, 11, 4986. [Google Scholar] [CrossRef] [Scilit]
- Cervero, R.; Golub, A. Informal Transport: A Global Perspective. Transp. Policy 2007, 14, 445–457. [Google Scholar] [CrossRef] [Scilit]
- Behrens, R.; McCormick, D.; Mfinanga, D. Paratransit in African Cities; Routledge: New York, NY, USA, 2015. [Google Scholar]
- Tiede, A.; Czerwenka, A.; Mendez, L.; Blaquiere, L.; Gamarra, S.; Gantier, L.; Cabrera, J.E.; Schlüter, J.C. How Does the Perception of Safety on Paratransit Influence Usage and Willingness to Pay. Res. Transp. Bus. Manag. 2025, 60, 101358. [Google Scholar] [CrossRef] [Scilit]
- Priye, S.; Manoj, M. Exploring Usage Patterns and Safety Perceptions of the Users of Electric Three-Wheeled Paratransit in Patna, India. Case Stud. Transp. Policy 2020, 8, 39–48. [Google Scholar] [CrossRef] [Scilit]
- Sarker, R.; Currie, G.; Chowdhury, S. Women’s Perceived Precautionary Safety on Public Transit—A Life Course Perspective on Harassment Experiences, Anxiety, and Coping Behaviour. Transp. Res. Part F Traffic Psychol. Behav. 2026, 116, 103415. [Google Scholar] [CrossRef] [Scilit]
- Stark, J.; Meschik, M. Women’s Everyday Mobility: Frightening Situations and Their Impacts on Travel Behaviour. Transp. Res. Part F Traffic Psychol. Behav. 2018, 54, 311–323. [Google Scholar] [CrossRef] [Scilit]
- Hsu, H.-P.; Boarnet, M.G.; Houston, D. Gender and Rail Transit Use: Influence of Environmental Beliefs and Safety Concerns. Transp. Res. Rec. J. Transp. Res. Board 2019, 2673, 327–338. [Google Scholar] [CrossRef] [Scilit]
- Lättman, K.; Friman, M.; Olsson, L.E. Perceived Accessibility of Public Transport as a Potential Indicator of Social Inclusion. Soc. Incl. 2016, 4, 36–45. [Google Scholar] [CrossRef] [Scilit]
- Abenoza, R.F.; Cats, O.; Susilo, Y.O. Travel Satisfaction with Public Transport: Determinants, User Classes, Regional Disparities and Their Evolution. Transp. Res. Part Policy Pract. 2017, 95, 64–84. [Google Scholar] [CrossRef] [Scilit]
- Lorenc, T.; Clayton, S.; Neary, D.; Whitehead, M.; Petticrew, M.; Thomson, H.; Cummins, S.; Sowden, A.; Renton, A. Crime, Fear of Crime, Environment, and Mental Health and Wellbeing: Mapping Review of Theories and Causal Pathways. Health Place 2012, 18, 757–765. [Google Scholar] [CrossRef] [Scilit] [PubMed]
- Folkman, S. Stress: Appraisal and Coping. In Encyclopedia of Behavioral Medicine; Gellman, M.D., Turner, J.R., Eds.; Springer: New York, NY, USA, 2013; pp. 1913–1915. [Google Scholar]
- Ferraro, K.F. Fear of Crime: Interpreting Victimization Risk; SUNY Series in New Directions in Crime and Justice Studies; State University of New York Press: Albany, NY, USA, 1995. [Google Scholar]
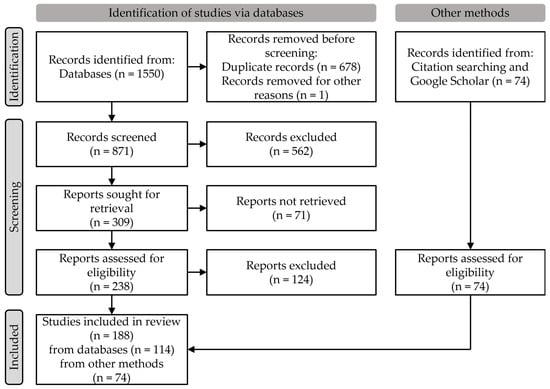
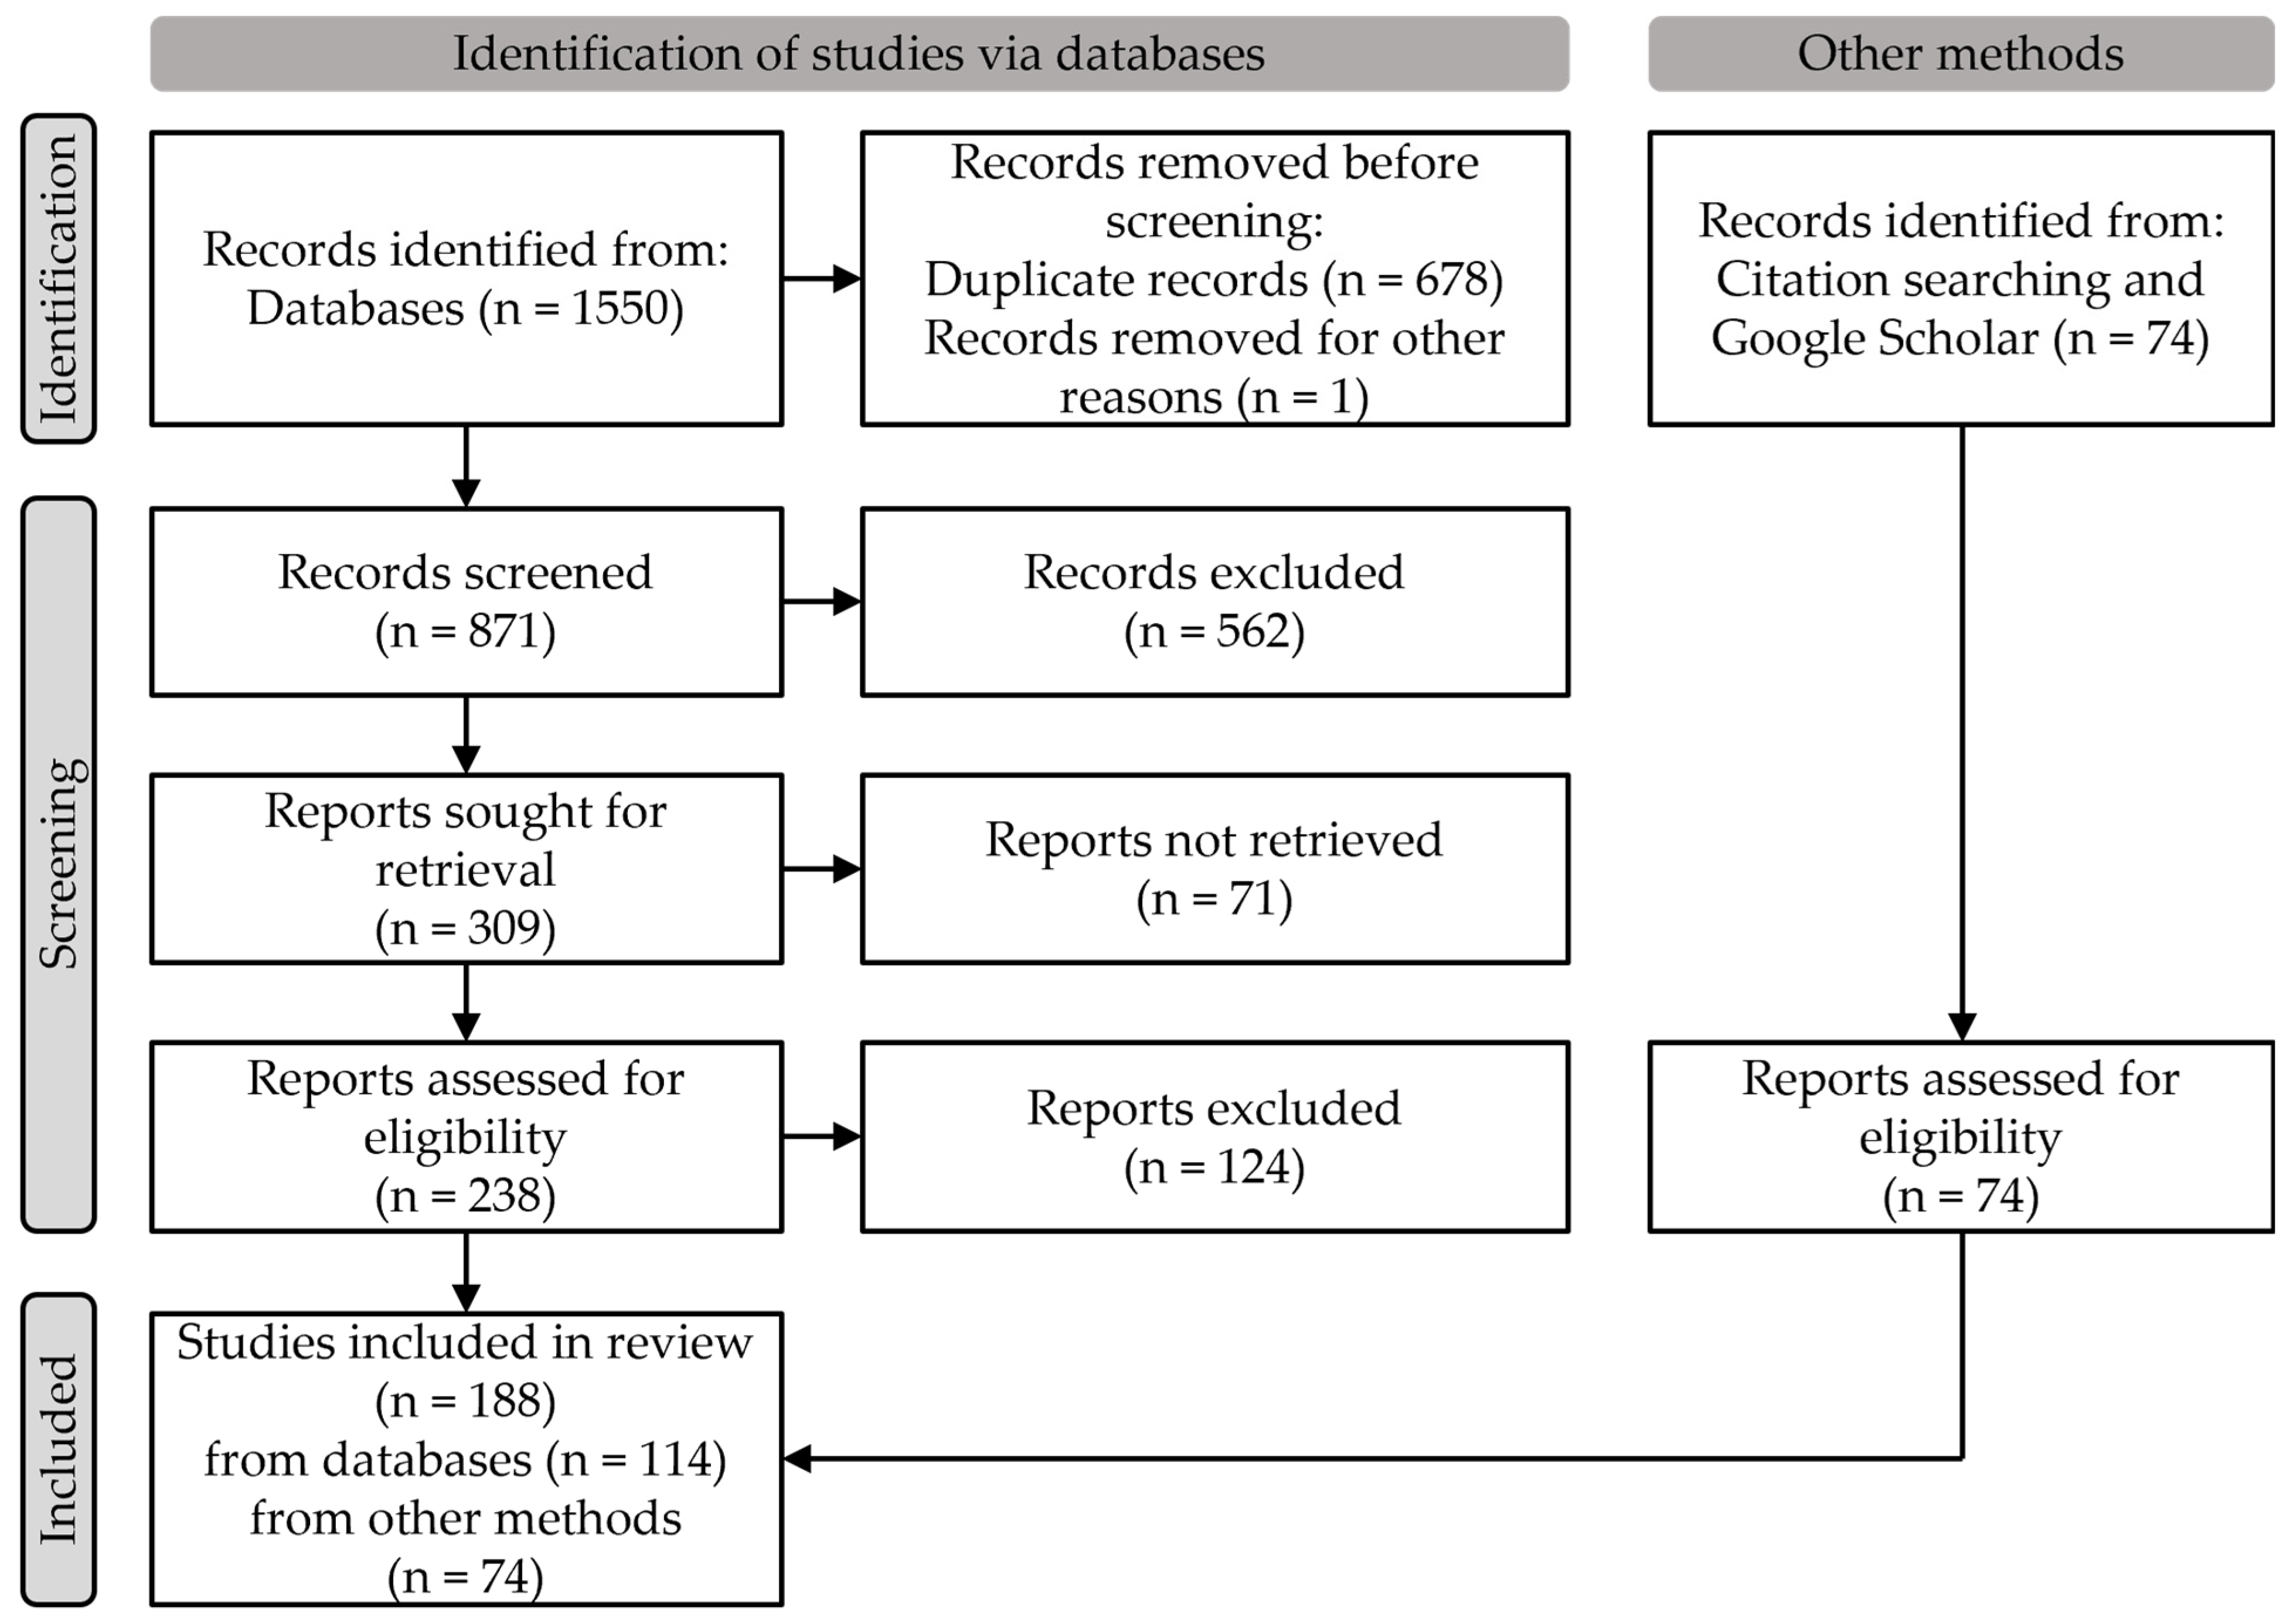
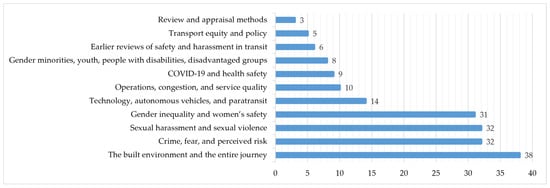
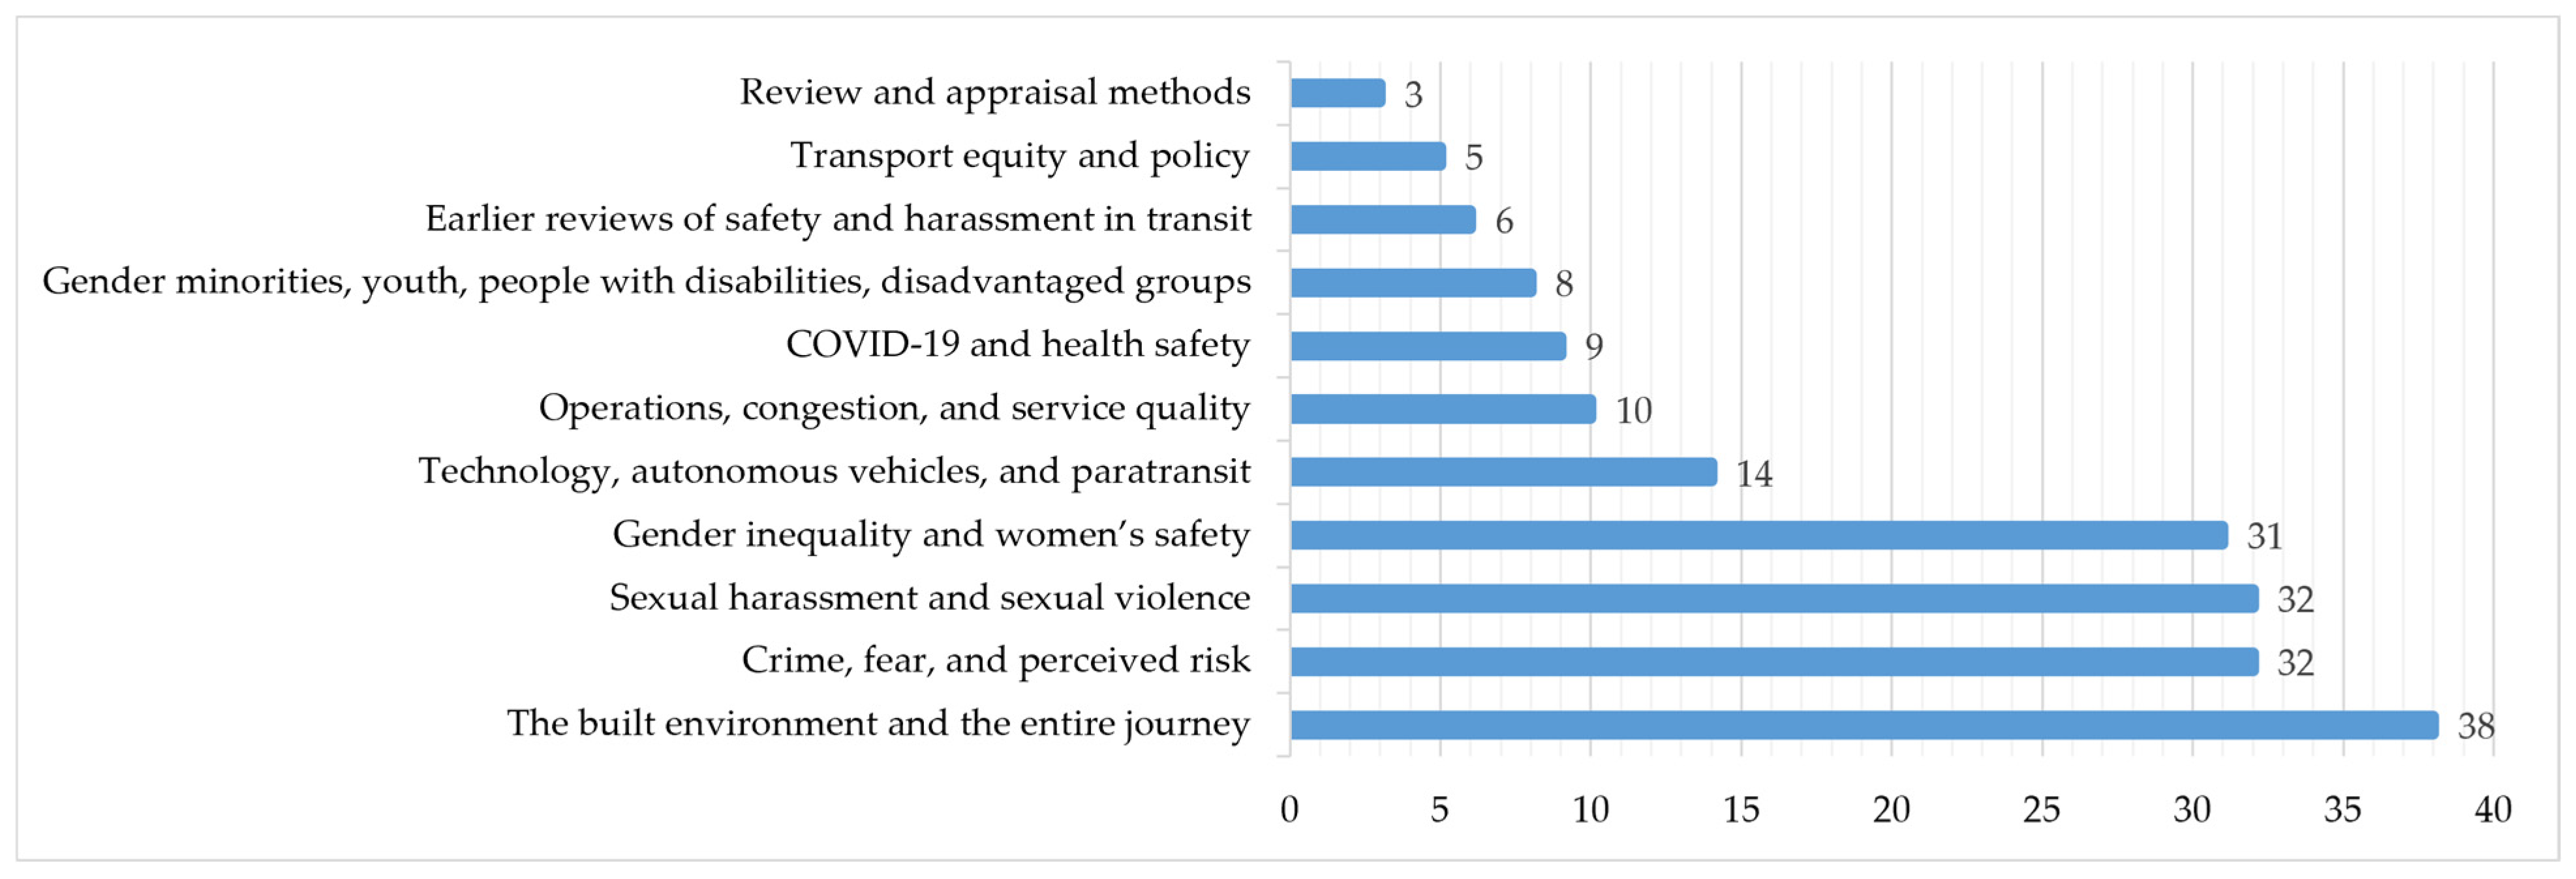
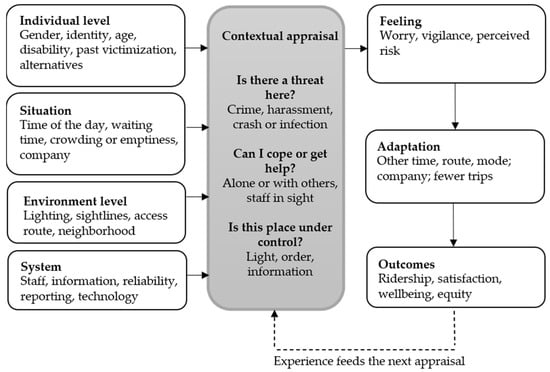
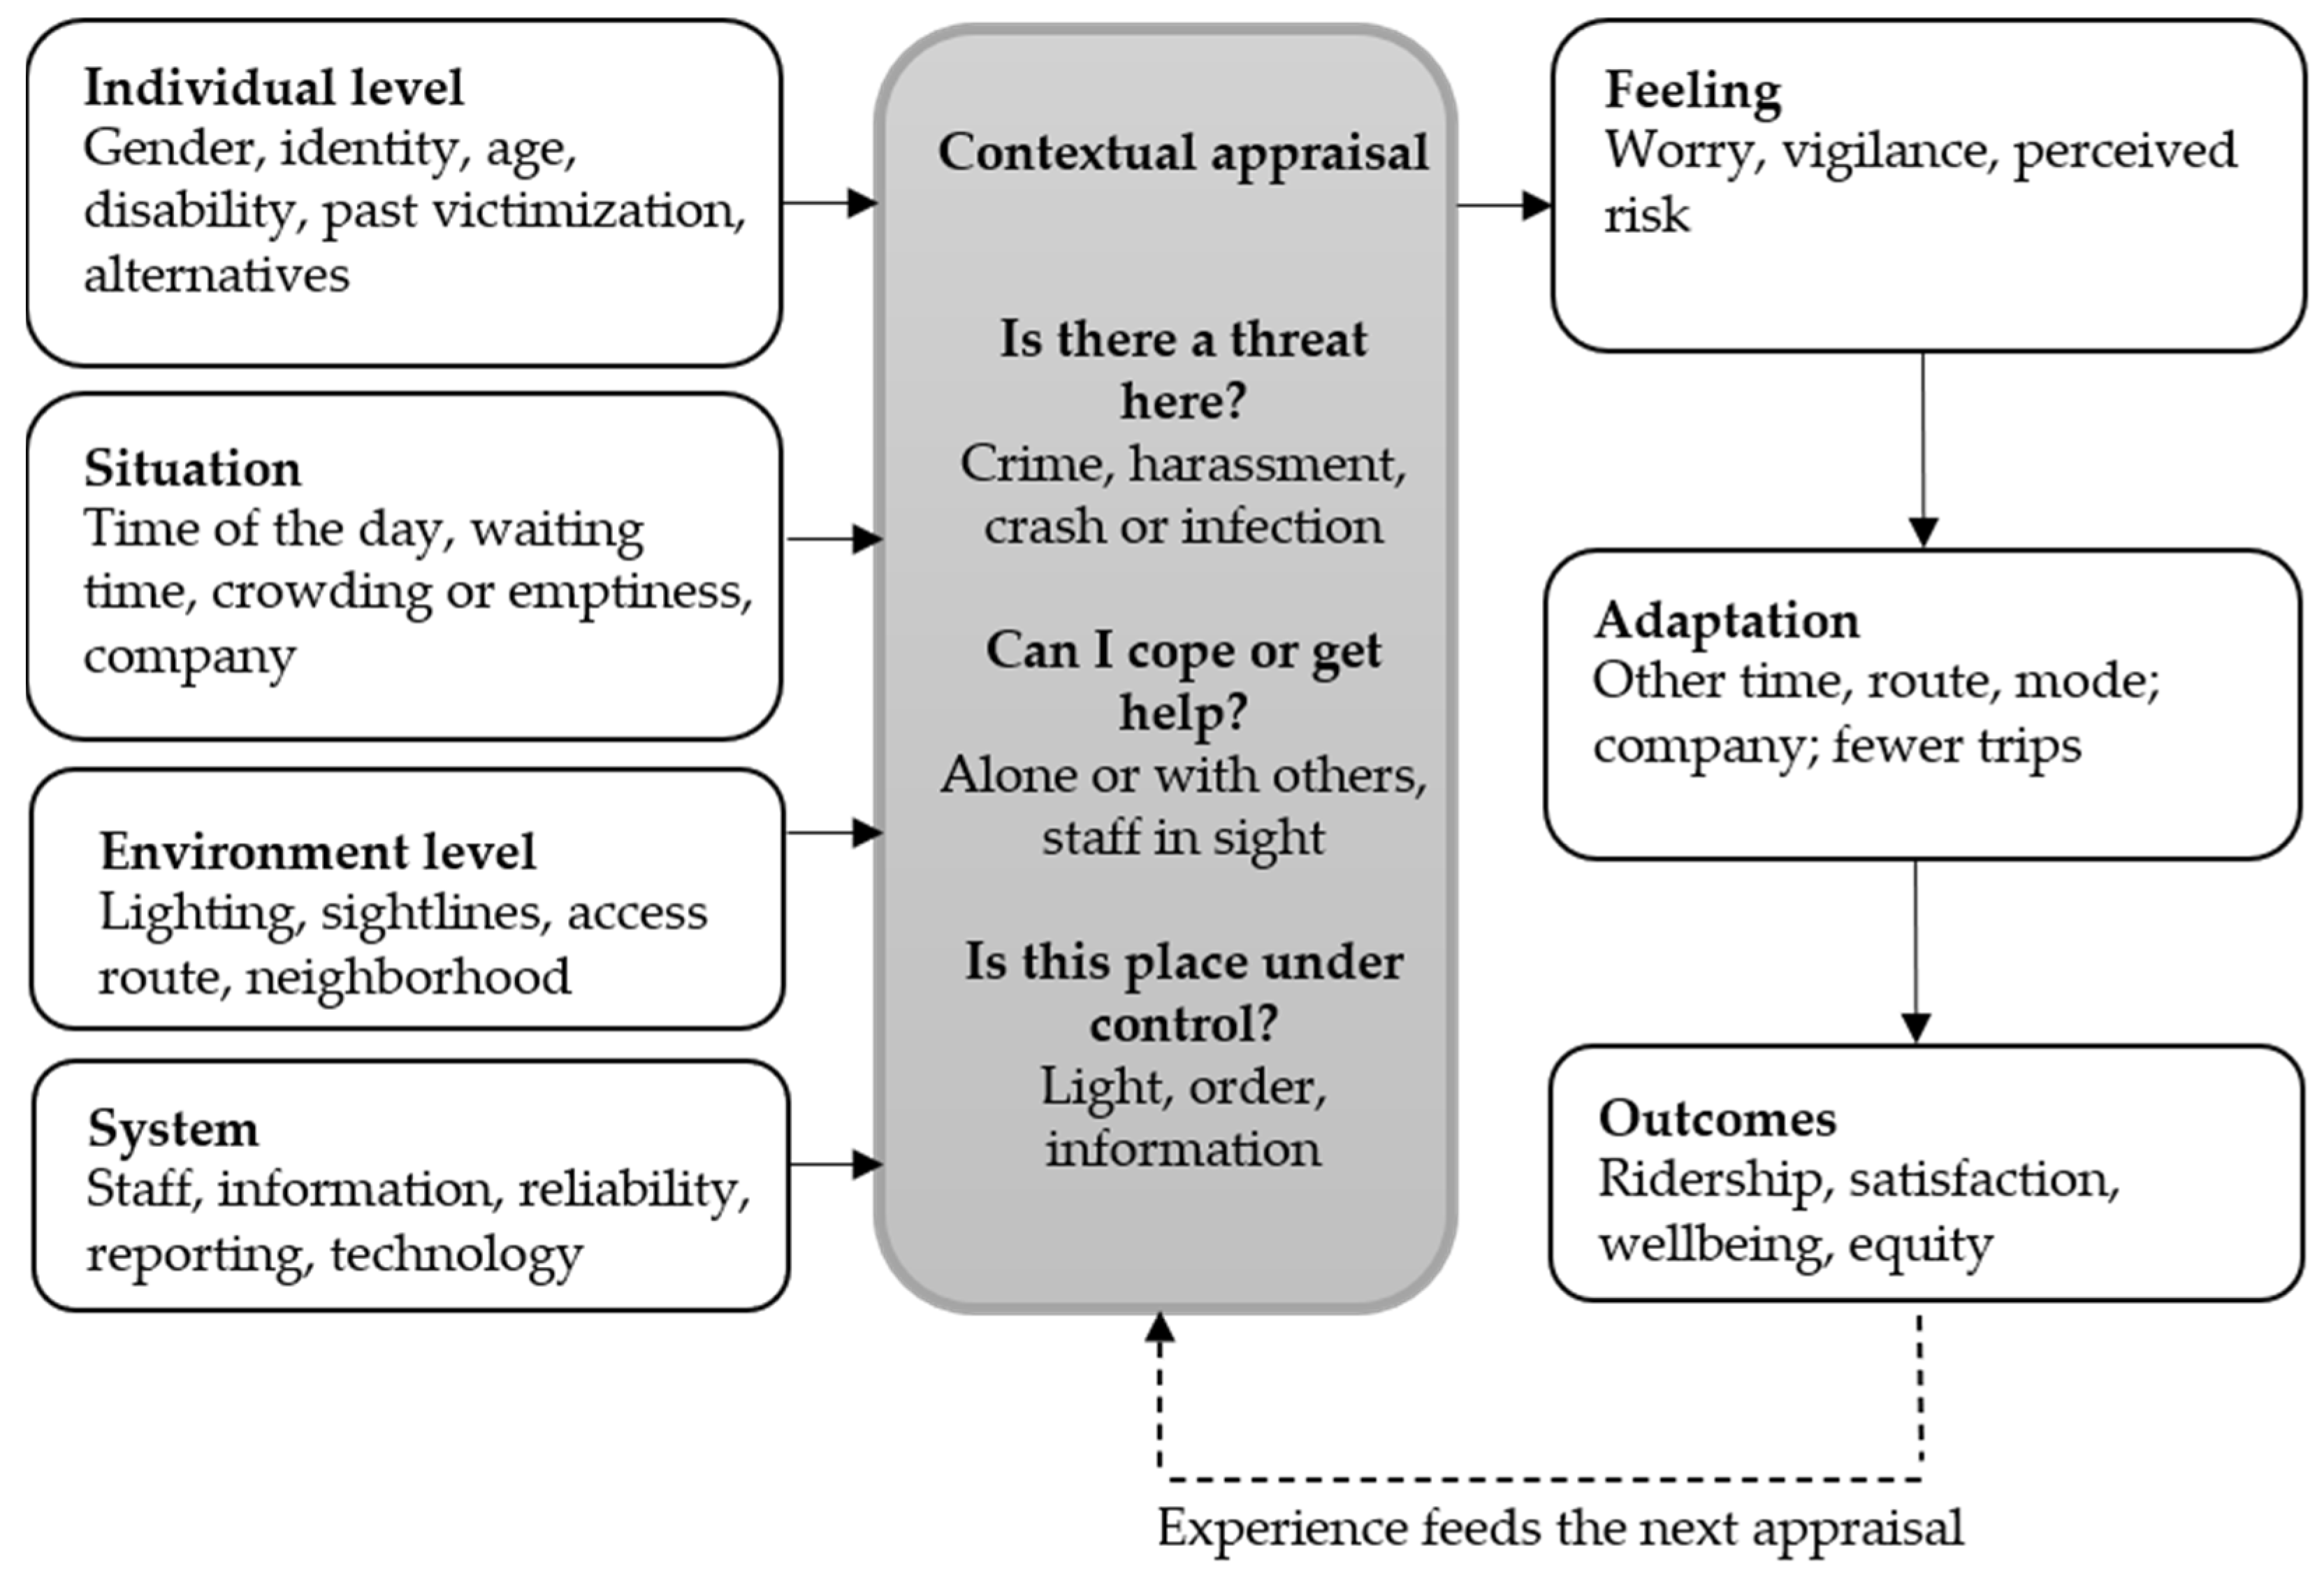

Disclaimer/Publisher’s Note: The statements, opinions and data contained in all publications are solely those of the individual author(s) and contributor(s) and not of MDPI and/or the editor(s). MDPI and/or the editor(s) disclaim responsibility for any injury to people or property resulting from any ideas, methods, instructions or products referred to in the content. |
© 2026 by the authors. Licensee MDPI, Basel, Switzerland. This article is an open access article distributed under the terms and conditions of the Creative Commons Attribution (CC BY) license.