


Abstract
Sheet metal forming is widely used to manufacture parts with complex geometries, but dimensional accuracy is often reduced by springback. This study investigates the springback behavior of SUS304 stainless steel during V-bending by combining numerical simulations, experimental testing, and microstructural analyses. The effects of key parameters, such as bending speed, friction condition, and holding time, are examined. The results show that the friction coefficient plays the most important role in the bending angle, followed by bending speed and holding time. Moreover, increasing the friction coefficient reduces the bending angle. The smallest bending angle is achieved with a high friction coefficient of μ = 0.5 (dry friction) and a low velocity of 5 mm/s. The lowest bending angle in the simulation study is 90.40°, which is close to the experimental value of 90.33°. Increasing the holding time and reducing the bending speed reduce the bending angle. Compared with experimental data, the simulation method’s accuracy and reliability deviate by less than 5%. Furthermore, microstructural analysis reveals that strain hardening is driven by the transformation from austenite to martensite. The proportion of the α’-martensite phase is about 28%. Overall, integrating simulation with experimental validation helps optimize tool design and process conditions, significantly reducing trial-and-error costs and improving dimensional accuracy in industrial manufacturing.
1. Introduction
In many sheet metal forming methods, bending is widely used. Bending changes the shape of a workpiece while the volume remains the same, and parts are created that require geometric form or complex bent profiles. Bending is often described as the forming of a sheet or plate to create angled portions or sheet profiles. Some common bending methods include air bending, V-bending, and roll bending, each with specific applications and advantages. These typical processes include measuring specifications, determining bending positions, and using machines to perform the bending [1,2,3,4].
A phenomenon known as “springback” occurs during this process. Researchers have extensively studied springback in sheet metal bending through analytical, experimental, and numerical approaches. Researchers have focused on understanding the deformation mechanics and developing methods to predict and mitigate springback effects. Plate material properties and bending methods strongly affect springback [5]. Leu et al. [6] show that springback and damaged materials can cause serious problems when bending sheet metal. Mullan [7] experimentally analyzed how material and loading factors influence springback and developed an equation to predict it. Buang [8] provided an overview of how material parameters affect springback.
Carden et al. [9] introduced a systematic method for measuring springback, thereby determining post-unloading shape changes, bending angles, and the impact of strip tension. They also developed a computational model to predict springback, noting that it relies on geometry, elasticity, and material behavior during direction changes [10]. Furthermore, Leu et al. [11] showed that springback is caused by elastic recovery after unloading, which changes the bend radius. Therefore, predicting springback during the design phase is crucial for precise process control and accurate final measurements. The Taguchi method was applied to determine the optimal parameters for dwell time, bending velocity, and friction coefficient [12].
In addition to experimental methods, the Finite Element Method (FEM) is commonly used to analyze and predict springback in sheet metal bending. FEM can simulate the entire forming process, from tool contact through plastic deformation to unloading. Panthi [13,14] used FEM for elasto-plastic analysis to evaluate how shape changes after unloading under different forming conditions. Furthermore, FEM has been applied to specific geometries, such as L-bending [15], U-bending [16], V-bending [17], and V-die coining bending [18]. These studies show that FEM not only predicts the final bend angle and shape but also reveals stress distributions and residual stress states. Overall, research [13,14,15,16,17,18] shows that FEM accuracy depends heavily on proper modeling of material properties, contact conditions, and the unloading step.
Additionally, springback is strongly influenced by material properties and process parameters. Khudadad et al. [19] found that material type and sheet thickness significantly affect springback, with properties such as elastic modulus and yield strength playing key roles. Wasif et al. [20] (high-tensile steels) and Örnekci and Ekşi [21] (AA6061 aluminum) confirmed that different materials show different springback behaviors under identical conditions. Tool design also matters; Buang et al. [22] showed that punch and die radii directly impact elastic recovery in stainless steel. Moreover, Ramezani et al. [23] investigated the springback phenomenon in high-strength steel, indicating that holding time has minimal effect on springback reduction, while over-pressing has a significant impact. Nur et al. [24] successfully used a Central Composite Design (CCD) approach to evaluate multiple bending parameters for AISI 304 stainless steel.
The anisotropy of sheet material characteristics is one of the most important elements in bending. This phenomenon can affect the springback angle during V-bending. Bending in a transverse orientation could result in a higher springback angle than in a longitudinal orientation [25,26]. Sharma et al. [25] studied the bending process of a three-ply clad sheet, revealing that the clad sheet samples that are transverse to the rolling direction are found to have the highest springback values. Le et al. [26] investigated the V-bending technique with V-grooving. They indicated that, because of material anisotropy, springback decreased with alignment with the rolling direction and increased with sheet thickness.
In addition, Zhou et al. [27] examined the springback behavior of AA7075 aluminum alloys, considering the impacts of punch size, holding force, and deformation temperature. According to the findings, the punch radius directly affects how springback angles vary. The springback angles rise as the blank holder force increases and the deformation temperature decreases. Zhang et al. [28] proposed a five-stress-state-sensitive (Five-SSS) yield function to capture tension–compression asymmetry (TCA) across various stress levels. The Five-SSS yield function can considerably enhance the forecast accuracy of V-bending springback compared to other functions since it simulates the TCA in both uniaxial and plane-strain states. Mithu et al. [29] predicted the springback behavior in V-bending by using Response Surface Methodology (RSM). This study investigates the optimization of springback in V-bending by analyzing how load-holding time and heat treatment affect materials such as aluminum, mild steel, and stainless steel. Extended load-holding times help reduce springback by promoting stress relaxation, with aluminum showing the greatest reduction. Annealing substantially reduces springback by softening the material, whereas normalizing and quenching yield different degrees of reduction, especially in steel.
Overall, previous studies have established that springback is a complex phenomenon arising from interactions among material properties, sheet thickness, bending tool geometry, and process parameters. Research on aluminum alloys, high-strength steels, and stainless steels has provided valuable insights into the general mechanisms governing elastic recovery. However, the springback behavior of each material system is strongly dependent on its specific elastic–plastic response, work-hardening characteristics, and deformation history. Therefore, experimental results obtained from aluminum alloys or high-strength steels cannot be directly generalized to SUS304 stainless steel. Although previous studies have investigated stainless steel and AISI 304 in V-bending [22,24], further systematic investigation is still valuable, particularly regarding the quantitative relationship between springback angle and the combined effects of key geometric and process parameters. Therefore, the present study investigates the springback effect in the V-bending process of SUS304 stainless steel, with particular emphasis on experimentally quantifying the springback angle and evaluating the effects and interactions of selected bending parameters. The results are expected to provide a more systematic understanding of the springback behavior of SUS304 and to inform the selection of appropriate process parameters to improve dimensional accuracy in sheet-metal bending.
2. Materials and Methods
2.1. Materials
In this study, SUS304 austenitic stainless steel sheet was selected as the workpiece material for the V-bending investigation. SUS304 stainless steel has high strength, excellent corrosion resistance, and good formability. It is used in many areas, such as food, medical, pharmaceutical, construction, and the chemical industry. The specimen dimensions were 56.15 mm × 20.57 mm × 1.5 mm (length × width × thickness). The material properties used in the study are under annealed conditions, based on the SUS304 CO/CQ material data provided by POSCO (Seoul, South Korea), and are summarized in Table 1 and Table 2. During the bending process, we select the transverse orientation, which carries a lower risk of cracking than the longitudinal orientation. This orientation could increase the springback angle compared to the longitudinal one [25,26].
Table 1.
Nominal chemical composition of SUS304 stainless steel.
Table 2.
Nominal mechanical properties of SUS304 stainless steel.
2.2. Numerical Simulation
For the numerical simulation, the material model was defined in Simufact Forming (Version 15.0) based on the mechanical properties of SUS304. The plastic flow behavior was represented using the Hollomon equation. The strength coefficient and strain-hardening applied in the material model were K = 1400 MPa and n = 0.44, respectively. The simulation was conducted in the transverse orientation. The simulation results are presented in Table 3. This table is designed using the L9 orthogonal array of the Taguchi method with Minitab software version 20.3.
Table 3.
Simulation case with different bending speeds, holding time, and friction coefficients following the L9 Taguchi design.
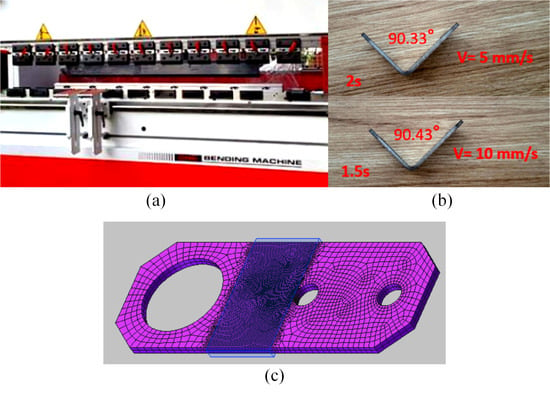
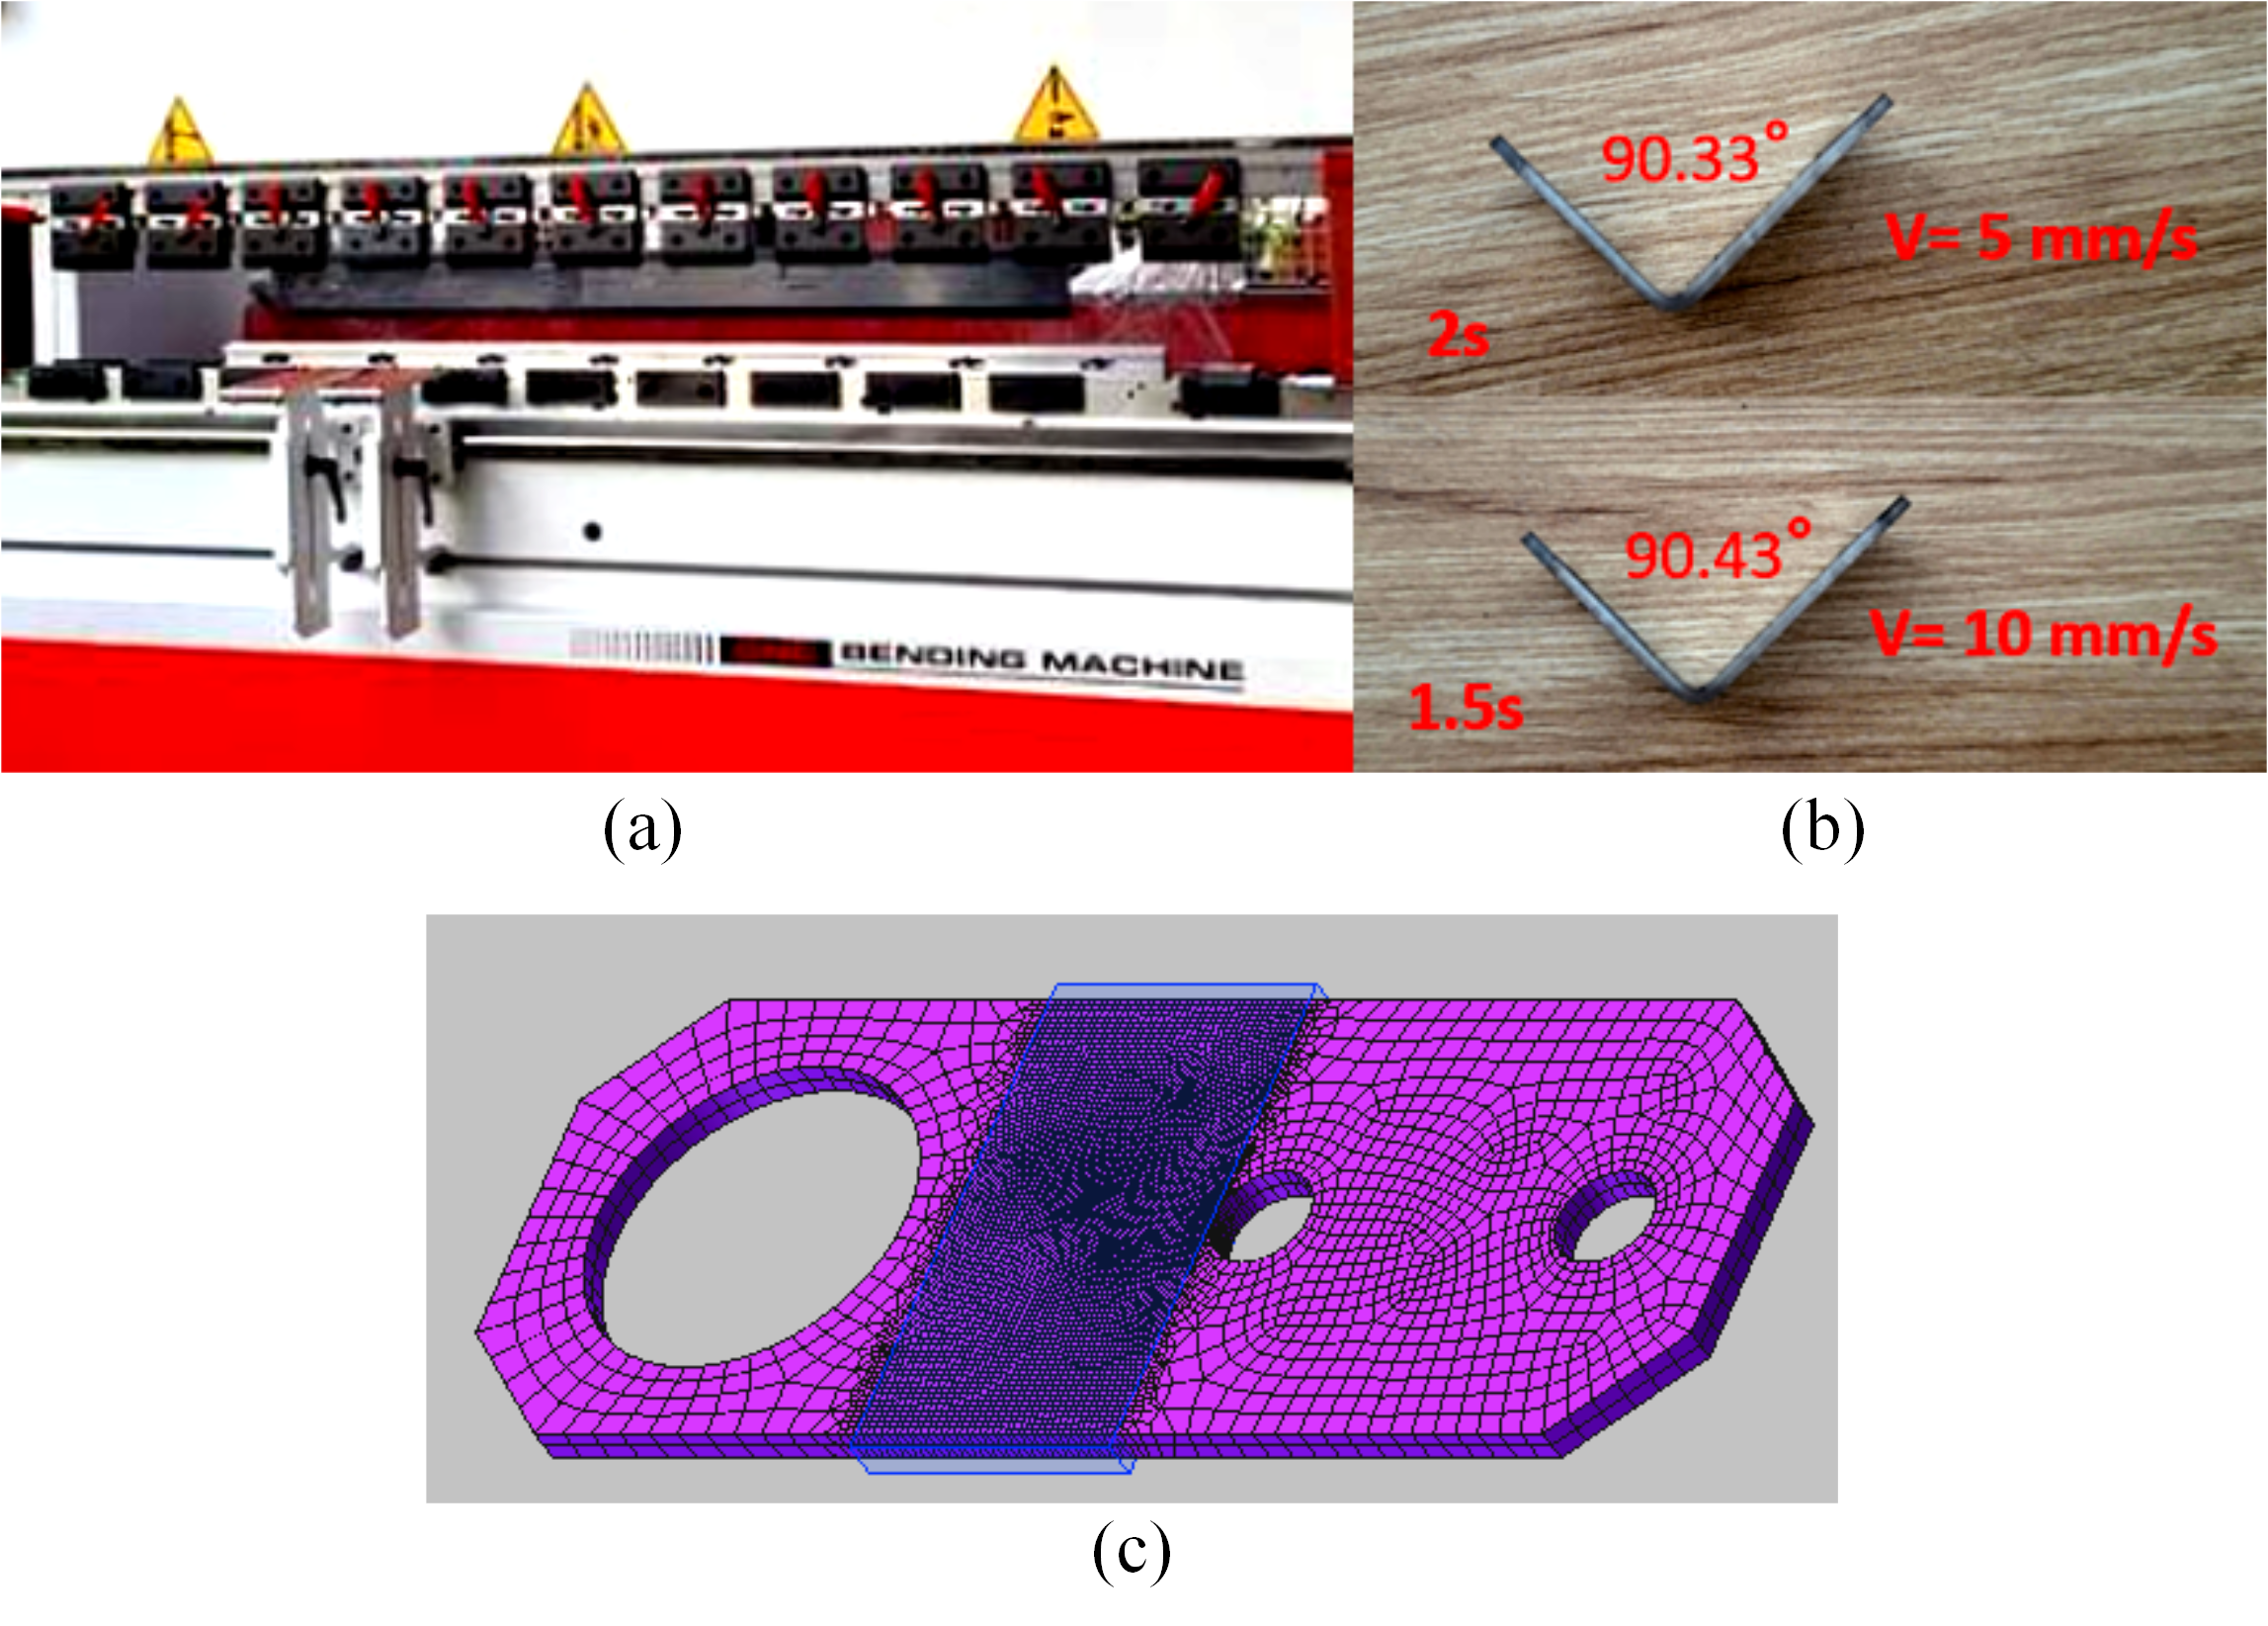
The workpiece material parameters are set according to the CO/CQ table for SUS304. The material is selected from the Simufact forming material library and adjusted to match the workpiece material parameters. Re-enter the mechanical parameters, such as tensile strength, elongation, and elastic modulus. Moreover, the outer mesh size is set to 1.5 mm, and the mesh level is set to 2, yielding a mesh size of about 0.1 mm (1/16 of the outer size), as shown in Figure 1c. This meshing convergence is configured to balance accuracy and simulation cost. The loading and unloading speeds are kept constant. After unloading, the material exhibits recoverable deformation, which is related to its mechanical characteristics [30].
Figure 1.
Experiment and simulation: (a) Bending machine JFY TMP8 100 hydraulic press brake (b), experimental sample, (c) meshing process.
2.3. Experimental Procedures
The experimental procedure consisted of three main stages: sheet blank preparation, bending parameter setup, and V-bending. The SUS304 sheets were cut to the required specimen dimensions (56.15 mm × 20.57 mm × 1.5 mm) using a CNC laser-cutting machine. The V-bending experiments were conducted using a JFY TMP8 100 hydraulic press brake, as shown in Figure 1. The bending parameters were selected to correspond to the conditions investigated in the numerical simulation. The parameters for the press brake, punch, and Die are summarized in Table 4.
The punch angle of the press brake punch is 86°; the target punch angle setting is 88.5°, aiming to achieve an angle of about 90° after bending. The springback angle is calculated by subtracting the unloaded angle from the loaded angle, with the loaded angle set at 88.5°:
where Δθ is the springback angle, θunloaded is the unloaded angle, and θloaded is the loaded angle, which is equal to 88.5°.
Δθ = θunloaded − θloaded
The relative error between the simulation and experiment angles is calculated via this equation:
where θsim is the simulation angle, and θexp is the experimental angle.
Table 4.
Input parameters for the press brake punch and die.
The resulting springback angles were measured using an electronic digital protractor (TMT333601; TOTAL Tools Co., Suzhou City, Jiangsu Province, China) with a resolution of 0.05°.
3. Results and Discussion
3.1. Simulation Results
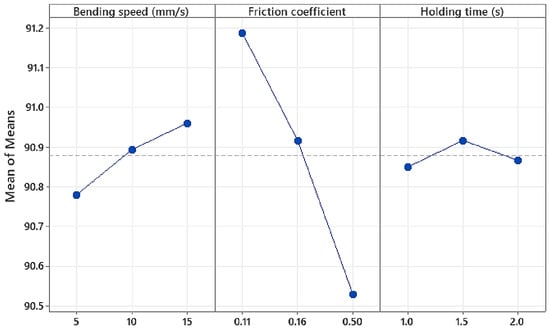
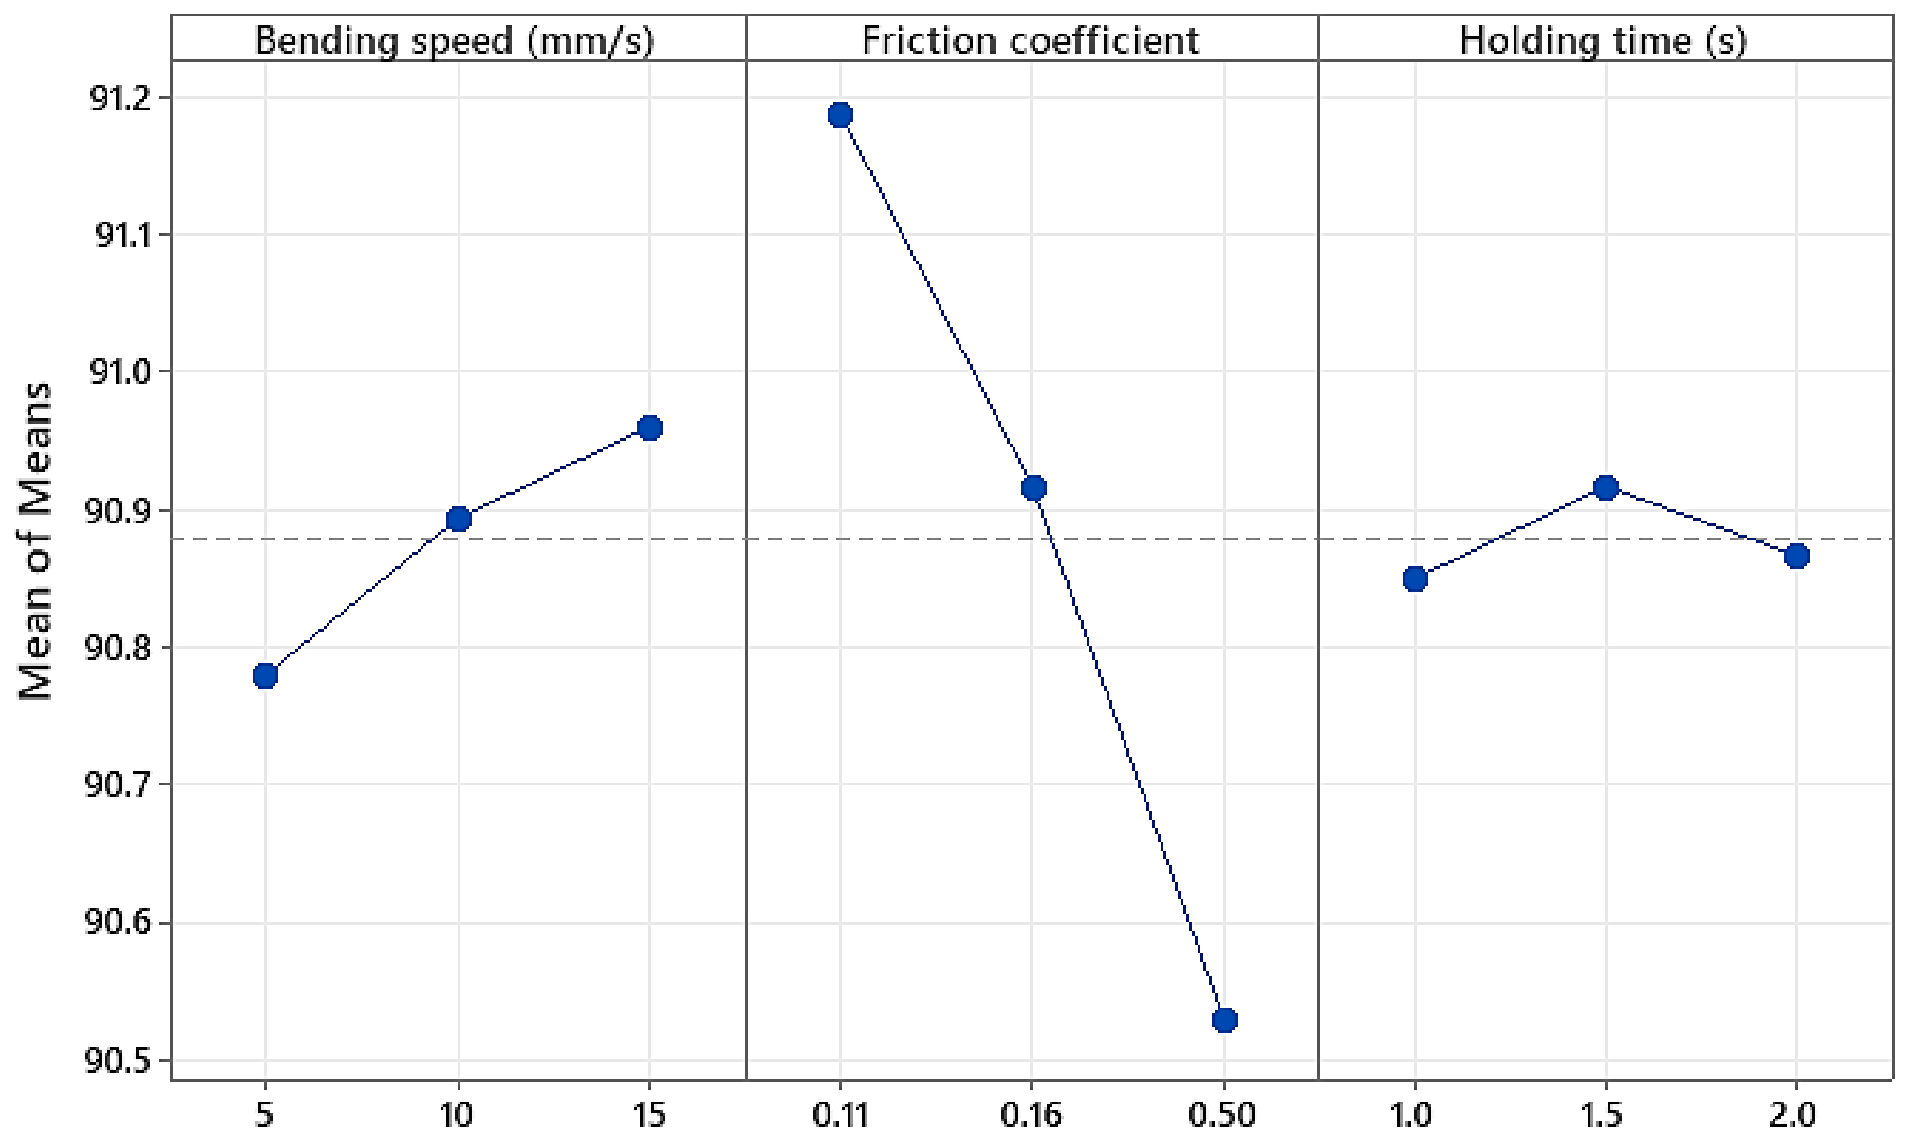
The response table of the bending angle means is shown in Table 5. The results indicate that the friction coefficient plays the most important role in the bending angle, followed by bending speed and holding time. This is why controlling the friction coefficient can achieve high efficiency, which directly impacts the deformation process [16]. The results in Figure 2 show that increasing the friction coefficient and reducing the bending speed reduce the bending angle. The optimal parameters for the lowest bending angle are a bending speed of 5 mm/s, a coefficient of 0.5, and a holding time of 1.0, yielding a predicted bending angle of 90.4044°. In addition, the regression equation is calculated as follows, indicating that the friction coefficient factor has a negative value, meaning that increasing this factor could lead to a reduction in bending angle:
Bending angle = 91.054 + 0.01800 × Bending speed − 1.484 × Friction coefficient + 0.0167 × Holding time
Table 5.
Response table for means of the bending angle results (normal is best).
Figure 2.
Main effects plot for means of the simulation results (nominal is best).
Table 6 shows the Analysis of Variance (ANOVA) for the bending angle results. ANOVA determines the significance of one or more factors by comparing their means across different factor levels. The R-squared value is 90.07%, along with low p-values for the regression (0.006) and the friction coefficient (0.001), indicating statistical significance. With a high p-value for bending speed (0.124) and holding time (0.871), these factors are not statistically significant at the 5% significance level. Therefore, this issue could cause the discrepancy between the predicted optimal condition and the validation result.
Table 6.
Analysis of variance table for the bending angle results.
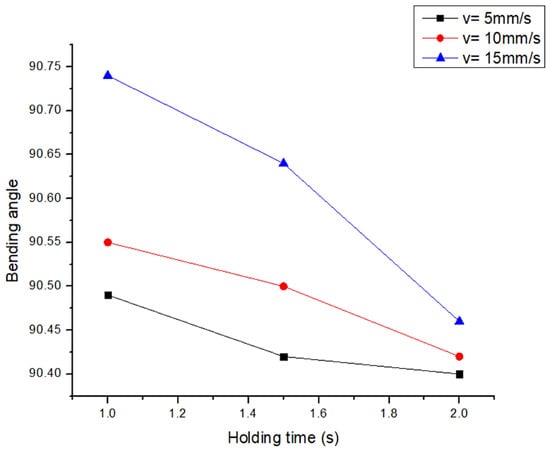
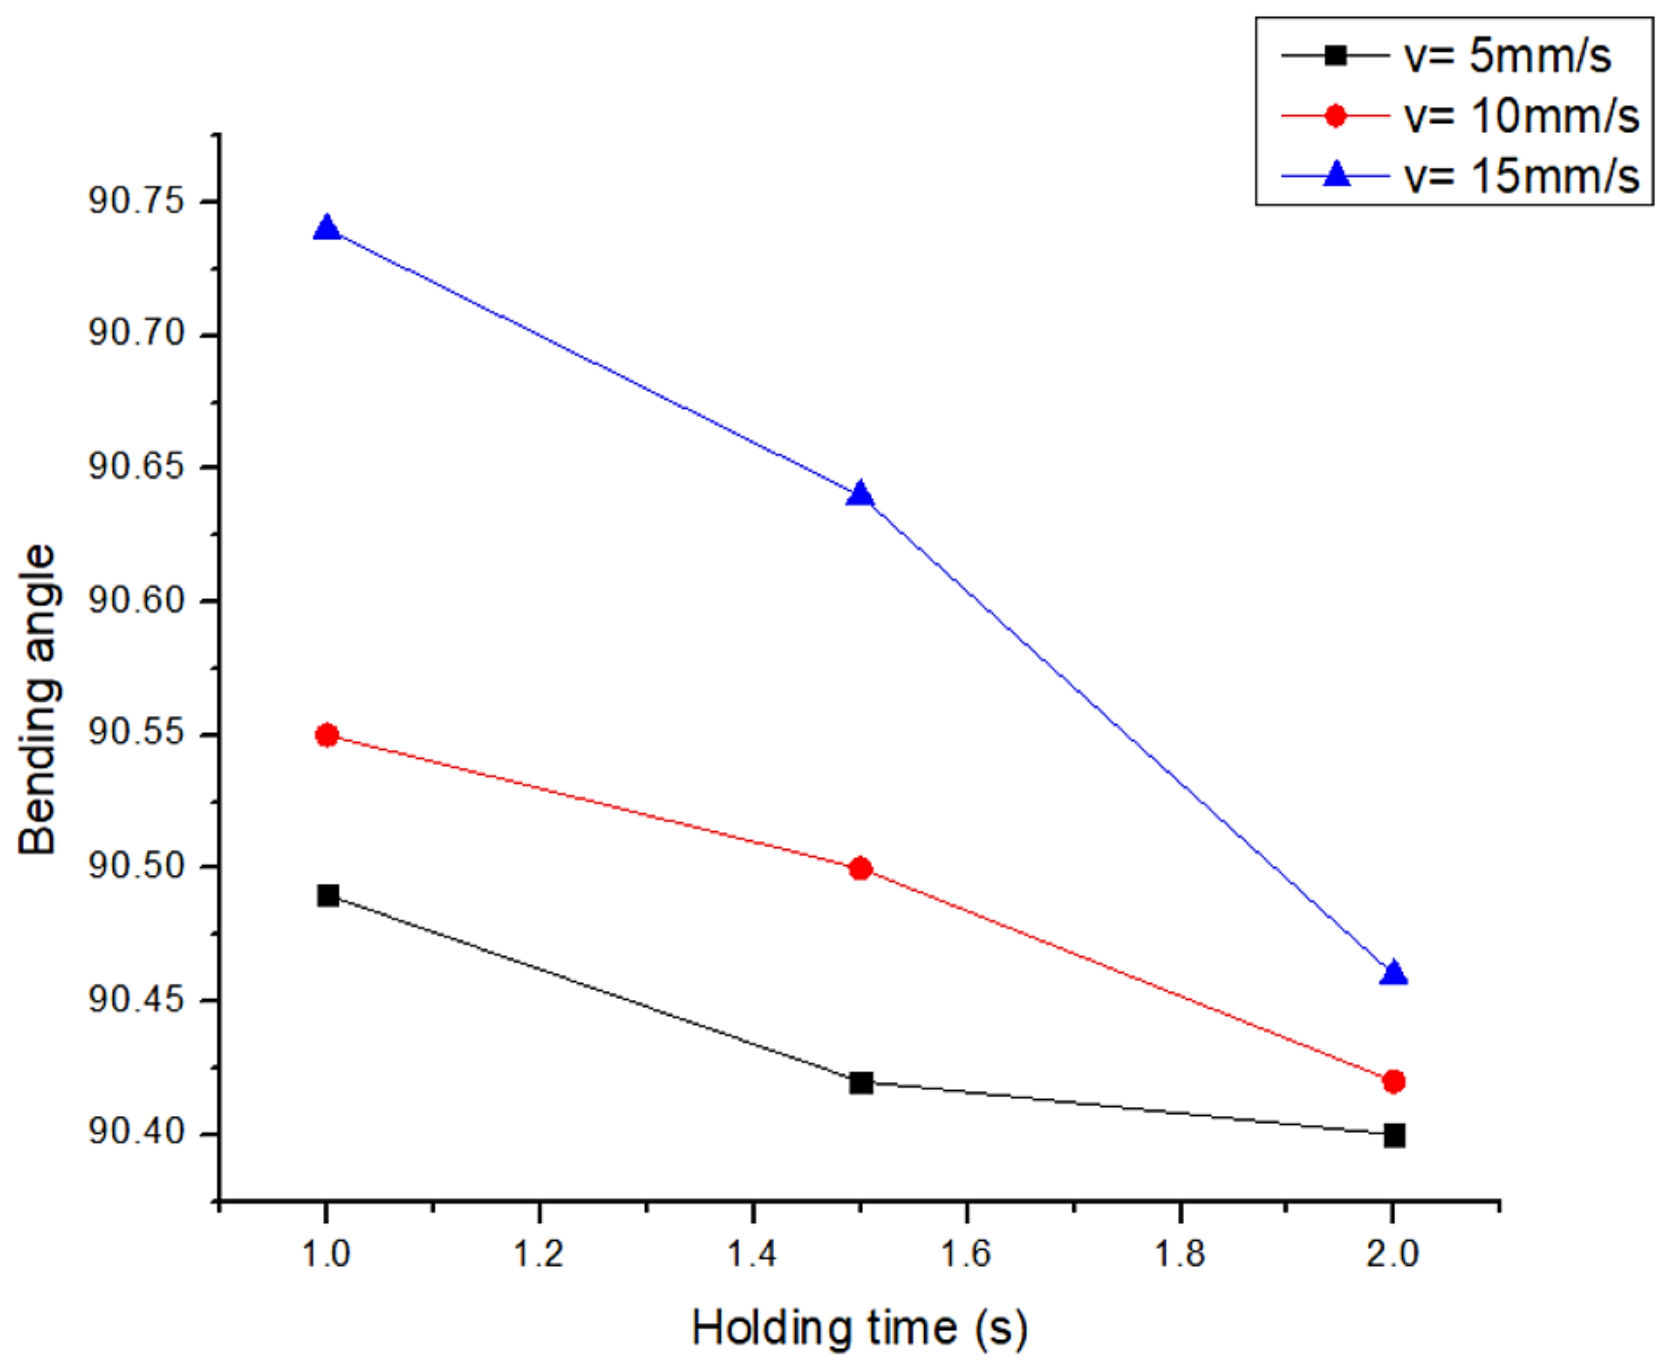
Interestingly, the optimal friction coefficient at a low bending angle is 0.5, which corresponds to a dry condition. This is the most convenient condition during the bending process. Therefore, further research has been conducted under dry-friction conditions with varying holding times and bending speeds. Figure 3 displays the effects of holding time and bending speed on the bending angle. Under a constant friction coefficient of 0.5, the holding times were set to 1 s, 1.5 s, and 2 s, corresponding to bending speeds of 5 mm/s, 10 mm/s, and 15 mm/s, as shown in Table 7. Notably, the impact of holding time on the bending angle is quite similar to the impact of the friction coefficient. This means that increasing the holding time reduces the bending angle. Moreover, increasing the bending speed increases the bending angle [16]. The reason is that there is less time for materials to respond and distribute stress [3]. For example, at a 1.0 s holding time, the bending angles are 90.49°, 90.55°, and 90.74°, corresponding to bending speeds of 5 mm/s, 10 mm/s, and 15 mm/s. At the same bending speed of 5 mm/s, the bending angle values are 90.49°, 90.42°, and 90.40°, corresponding to the holding times of 1.0 s, 1.5 s, and 2.0 s. Generally, the minimum bending angle of 90.40° is reached with a holding time of 2 s and a velocity of 5 mm/s.
Figure 3.
The effect of holding time and bending speed on the bending angle (degrees).
Table 7.
Simulation case with different bending speeds and holding times.
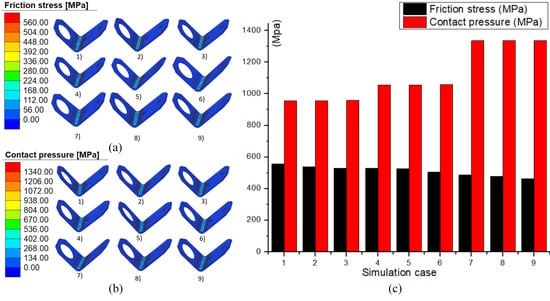
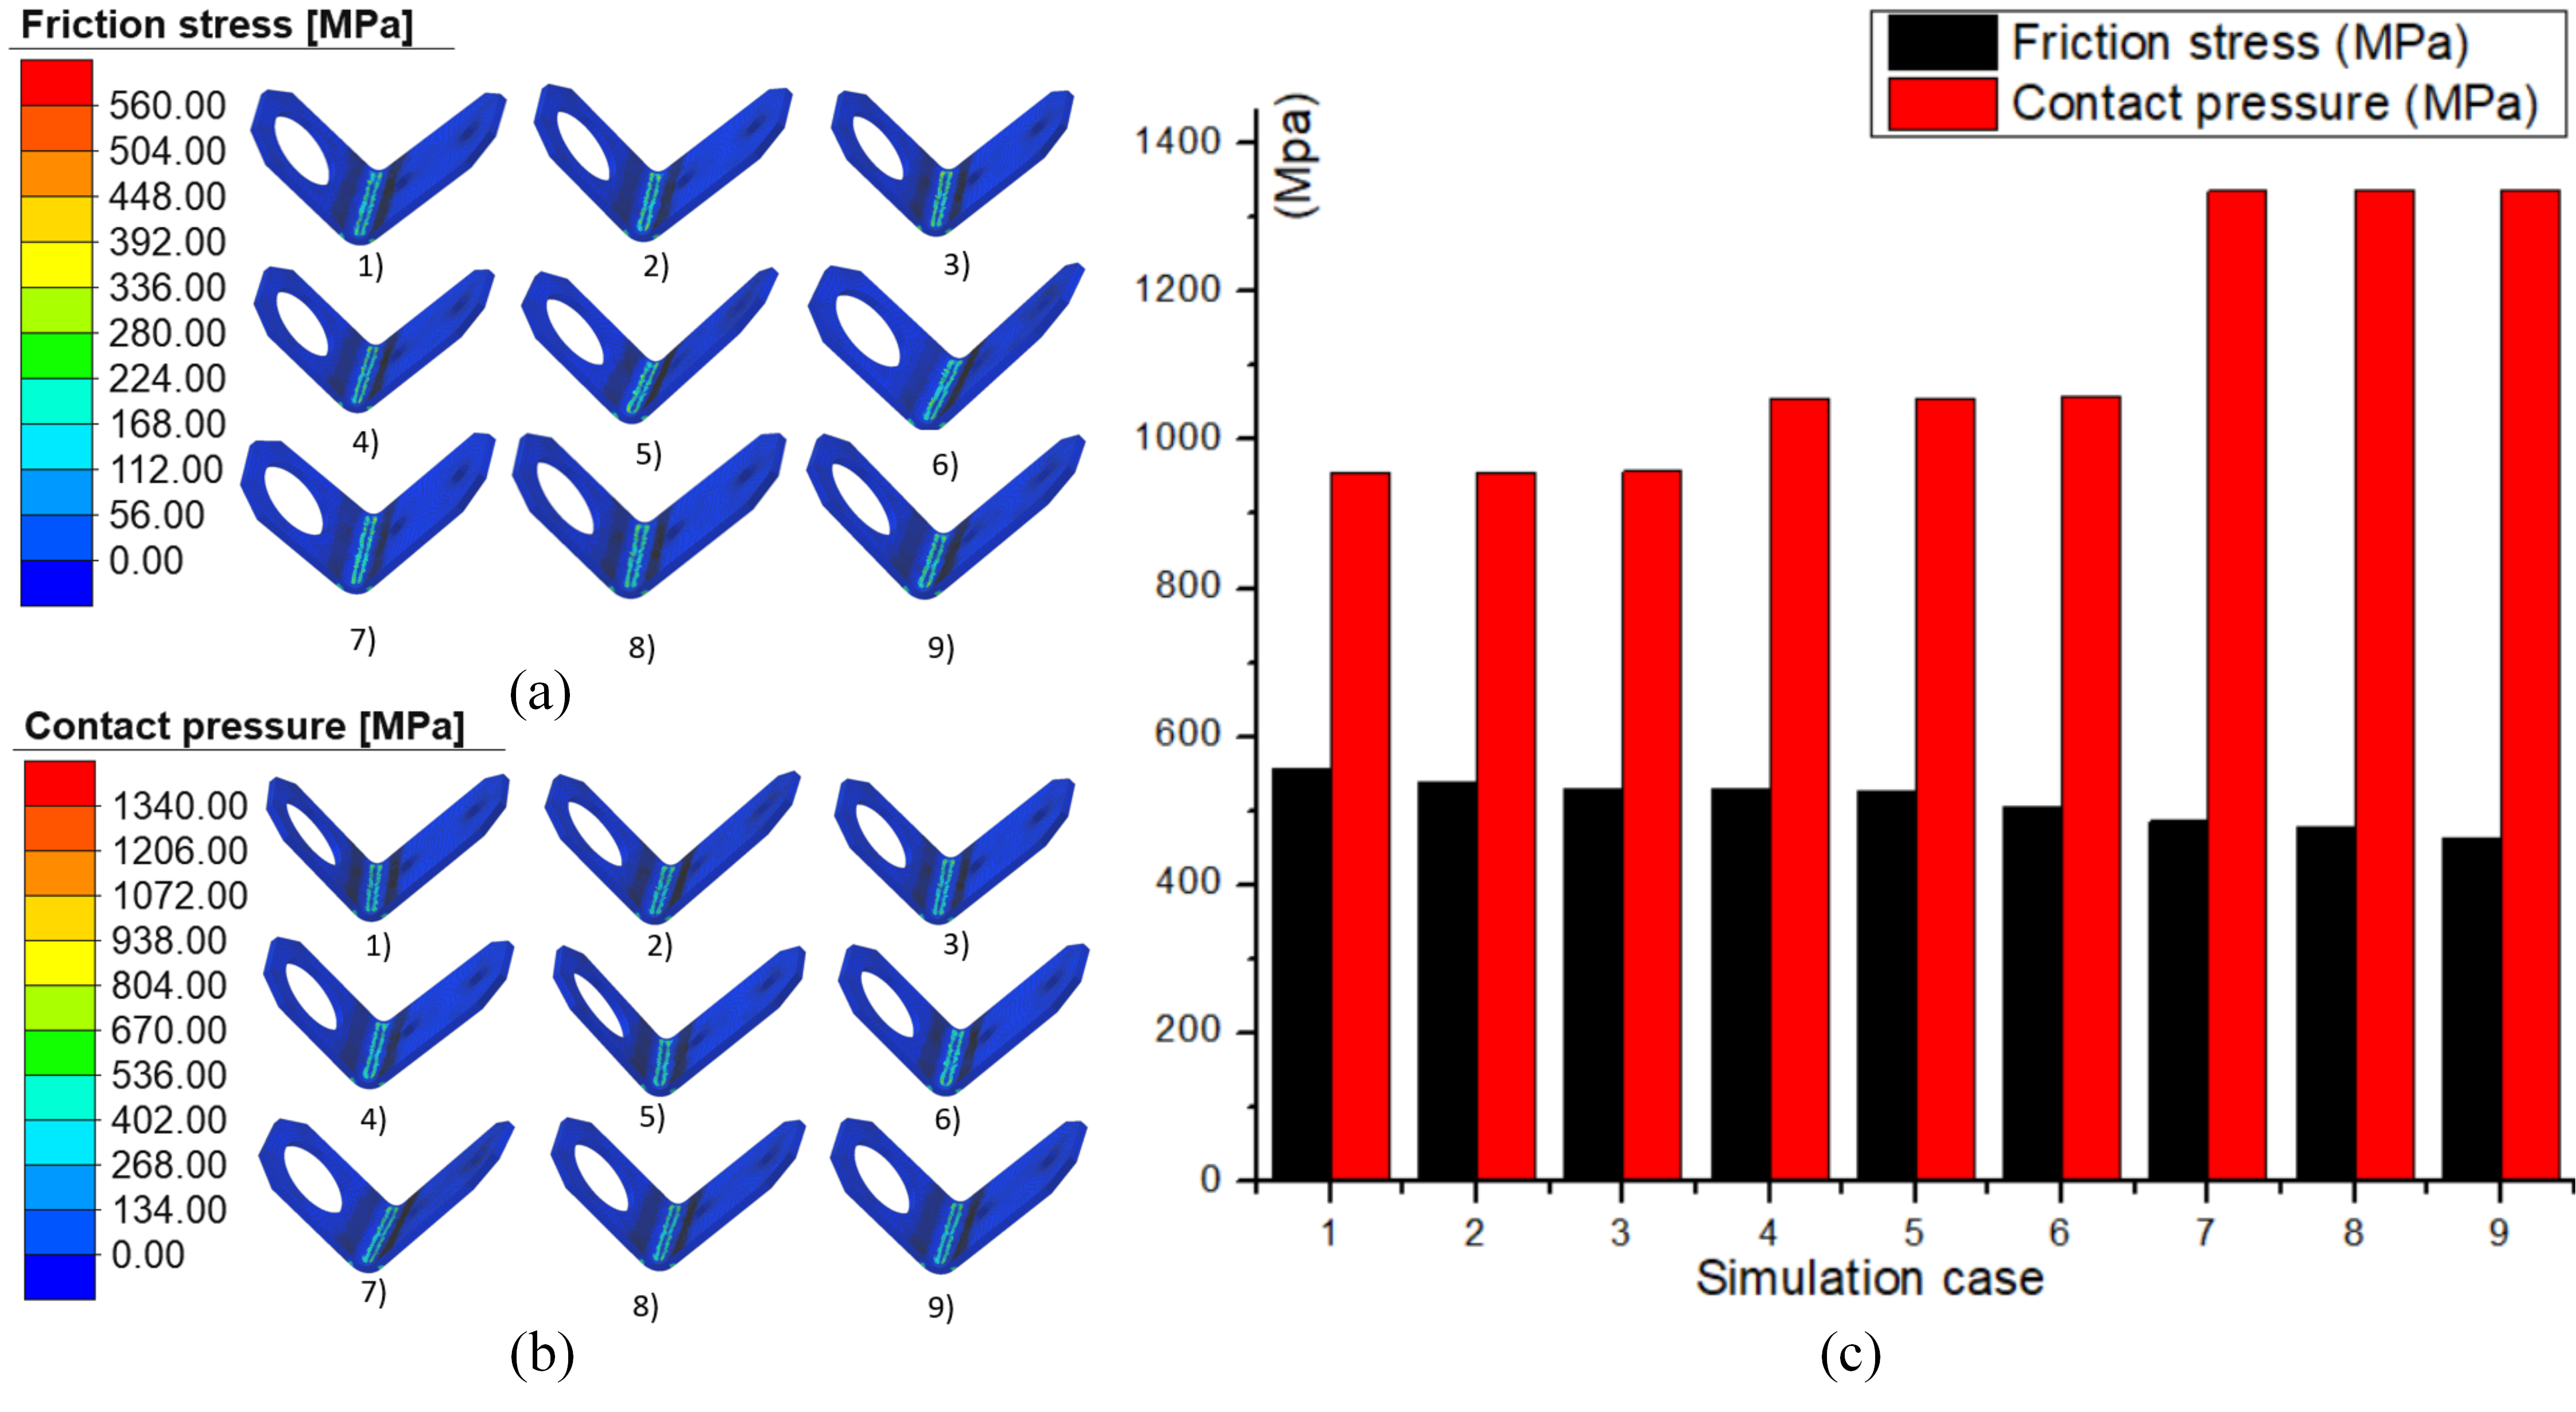
Figure 4 compares friction stress and contact pressure across 9 simulation cases, using the parameters in Table 7. The friction coefficient is fixed at 0.5, as it yielded the best result with the lowest bending angle. The results reveal that the friction stress decreases as the bending speed and the holding time increase. For instance, at a constant holding time of 1.0 s, the friction stress values decrease markedly from 557.88 MPa to 528.09 MPa and 485.43 MPa as the bending speed increases from 5 mm/s to 10 mm/s and 15 mm/s. At the same bending speed of 5 mm/s, the friction stresses also slightly decrease from 557.88 to 536.76 MPa and 530.23 MPa when the holding time increases from 1.0 s to 1.5 s and 2.0 s. Interestingly, these values are quite high; therefore, they could lead to a lower level of springback angle [31]. Similarly, holding time has a minor impact on contact pressure. On the other hand, the contact pressure increases significantly at higher speeds. At a holding time of 1.0 s, the values of the three cases are 956.94 MPa, 1055.54 MPa, and 1335.56 MPa, corresponding to the bending speeds of 5 mm/s, 10 mm/s, and 15 mm/s.
Figure 4.
Comparisons of friction stress and contact pressure of different cases during the bending process: (a) friction stress, (b) contact pressure, and (c) comparisons.
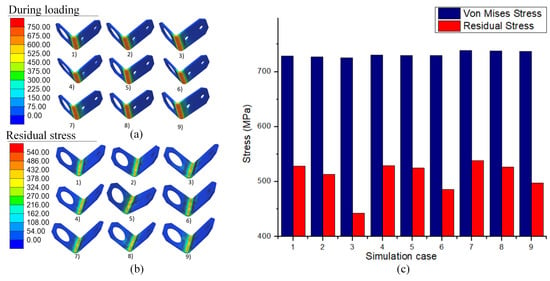
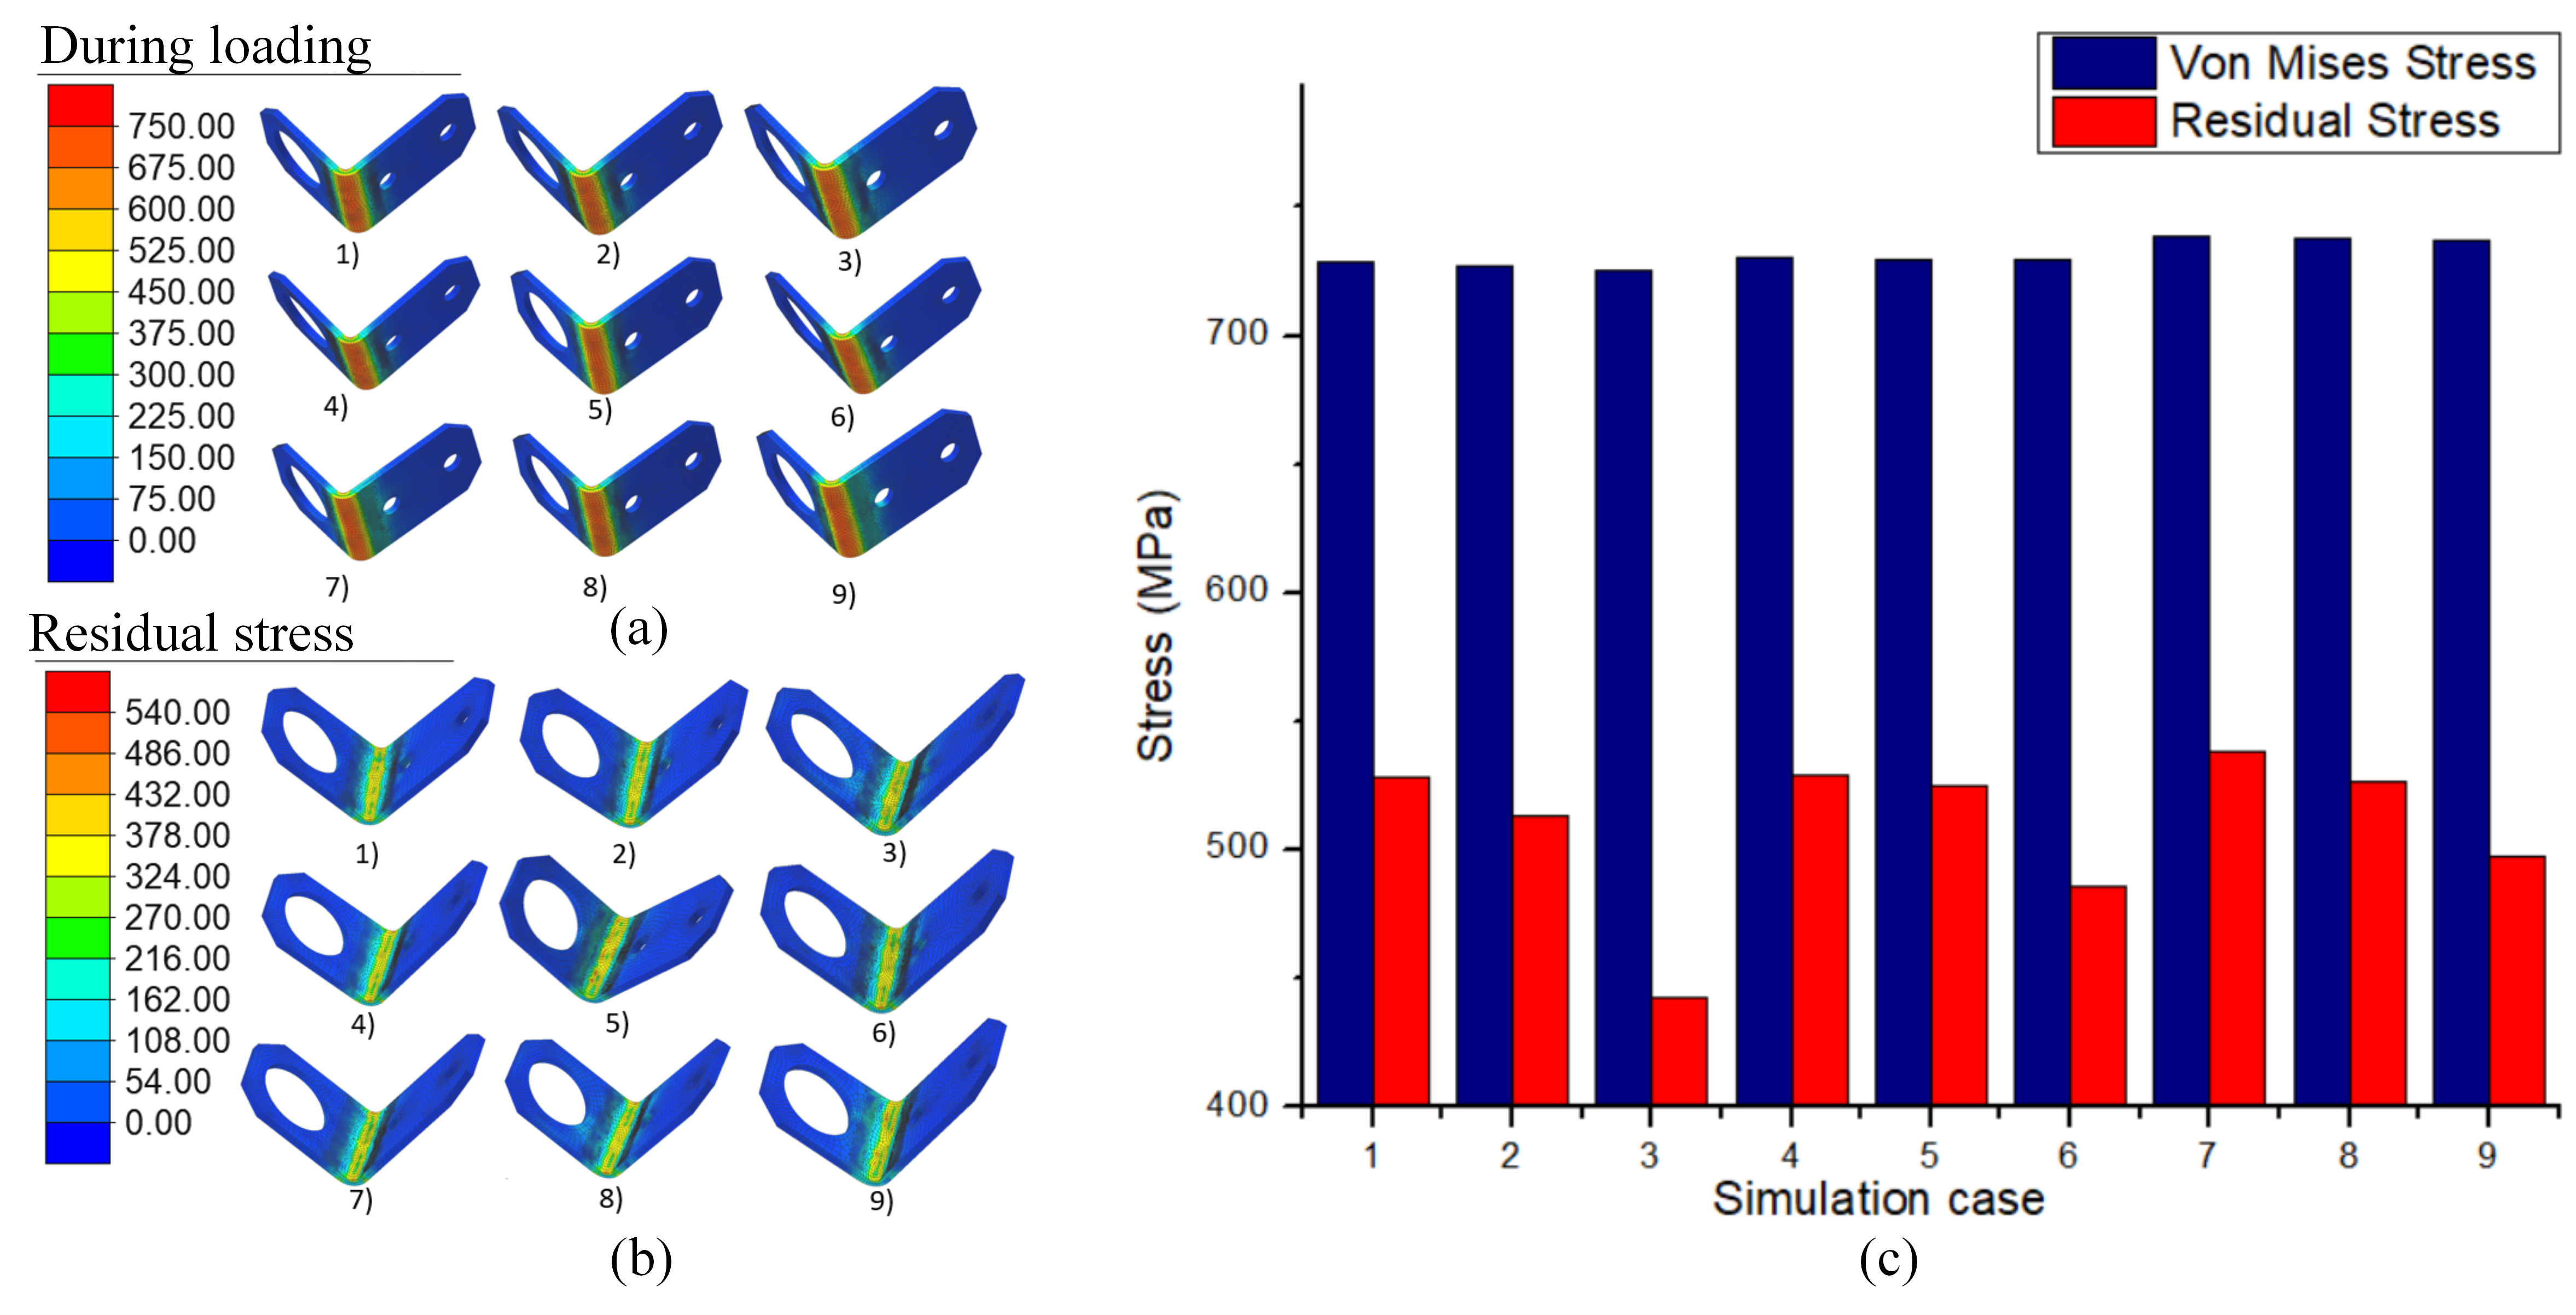
Figure 5 compares Von Mises stress and residual stress across nine simulation cases. The top-left image shows the maximum Von Mises stress during loading, which can reach 750 MPa. The highest stress levels, shown in red and orange, are concentrated along the bend line because this area undergoes the most bending and plastic deformation. In contrast, areas further away experience much lower stress below 150 MPa. Additionally, the top-right image shows residual stress in the part after unloading, peaking at about 540 MPa along the bend. Finally, the bar chart compares peak and residual stress across all nine cases. The maximum Von Mises stress (blue bars) remains nearly constant at 740 MPa, indicating that changes in input parameters have little effect on peak stress. However, the residual stress (red bars) ranges from 440 to 540 MPa, with case 3 showing the lowest and case 7 the highest. Remarkably, at a given sample bending speed, increasing the holding time reduces the residual stress.
Figure 5.
Comparison of Von Mises stress: (a) during loading, (b) residual stress after unloading, and (c) comparisons.
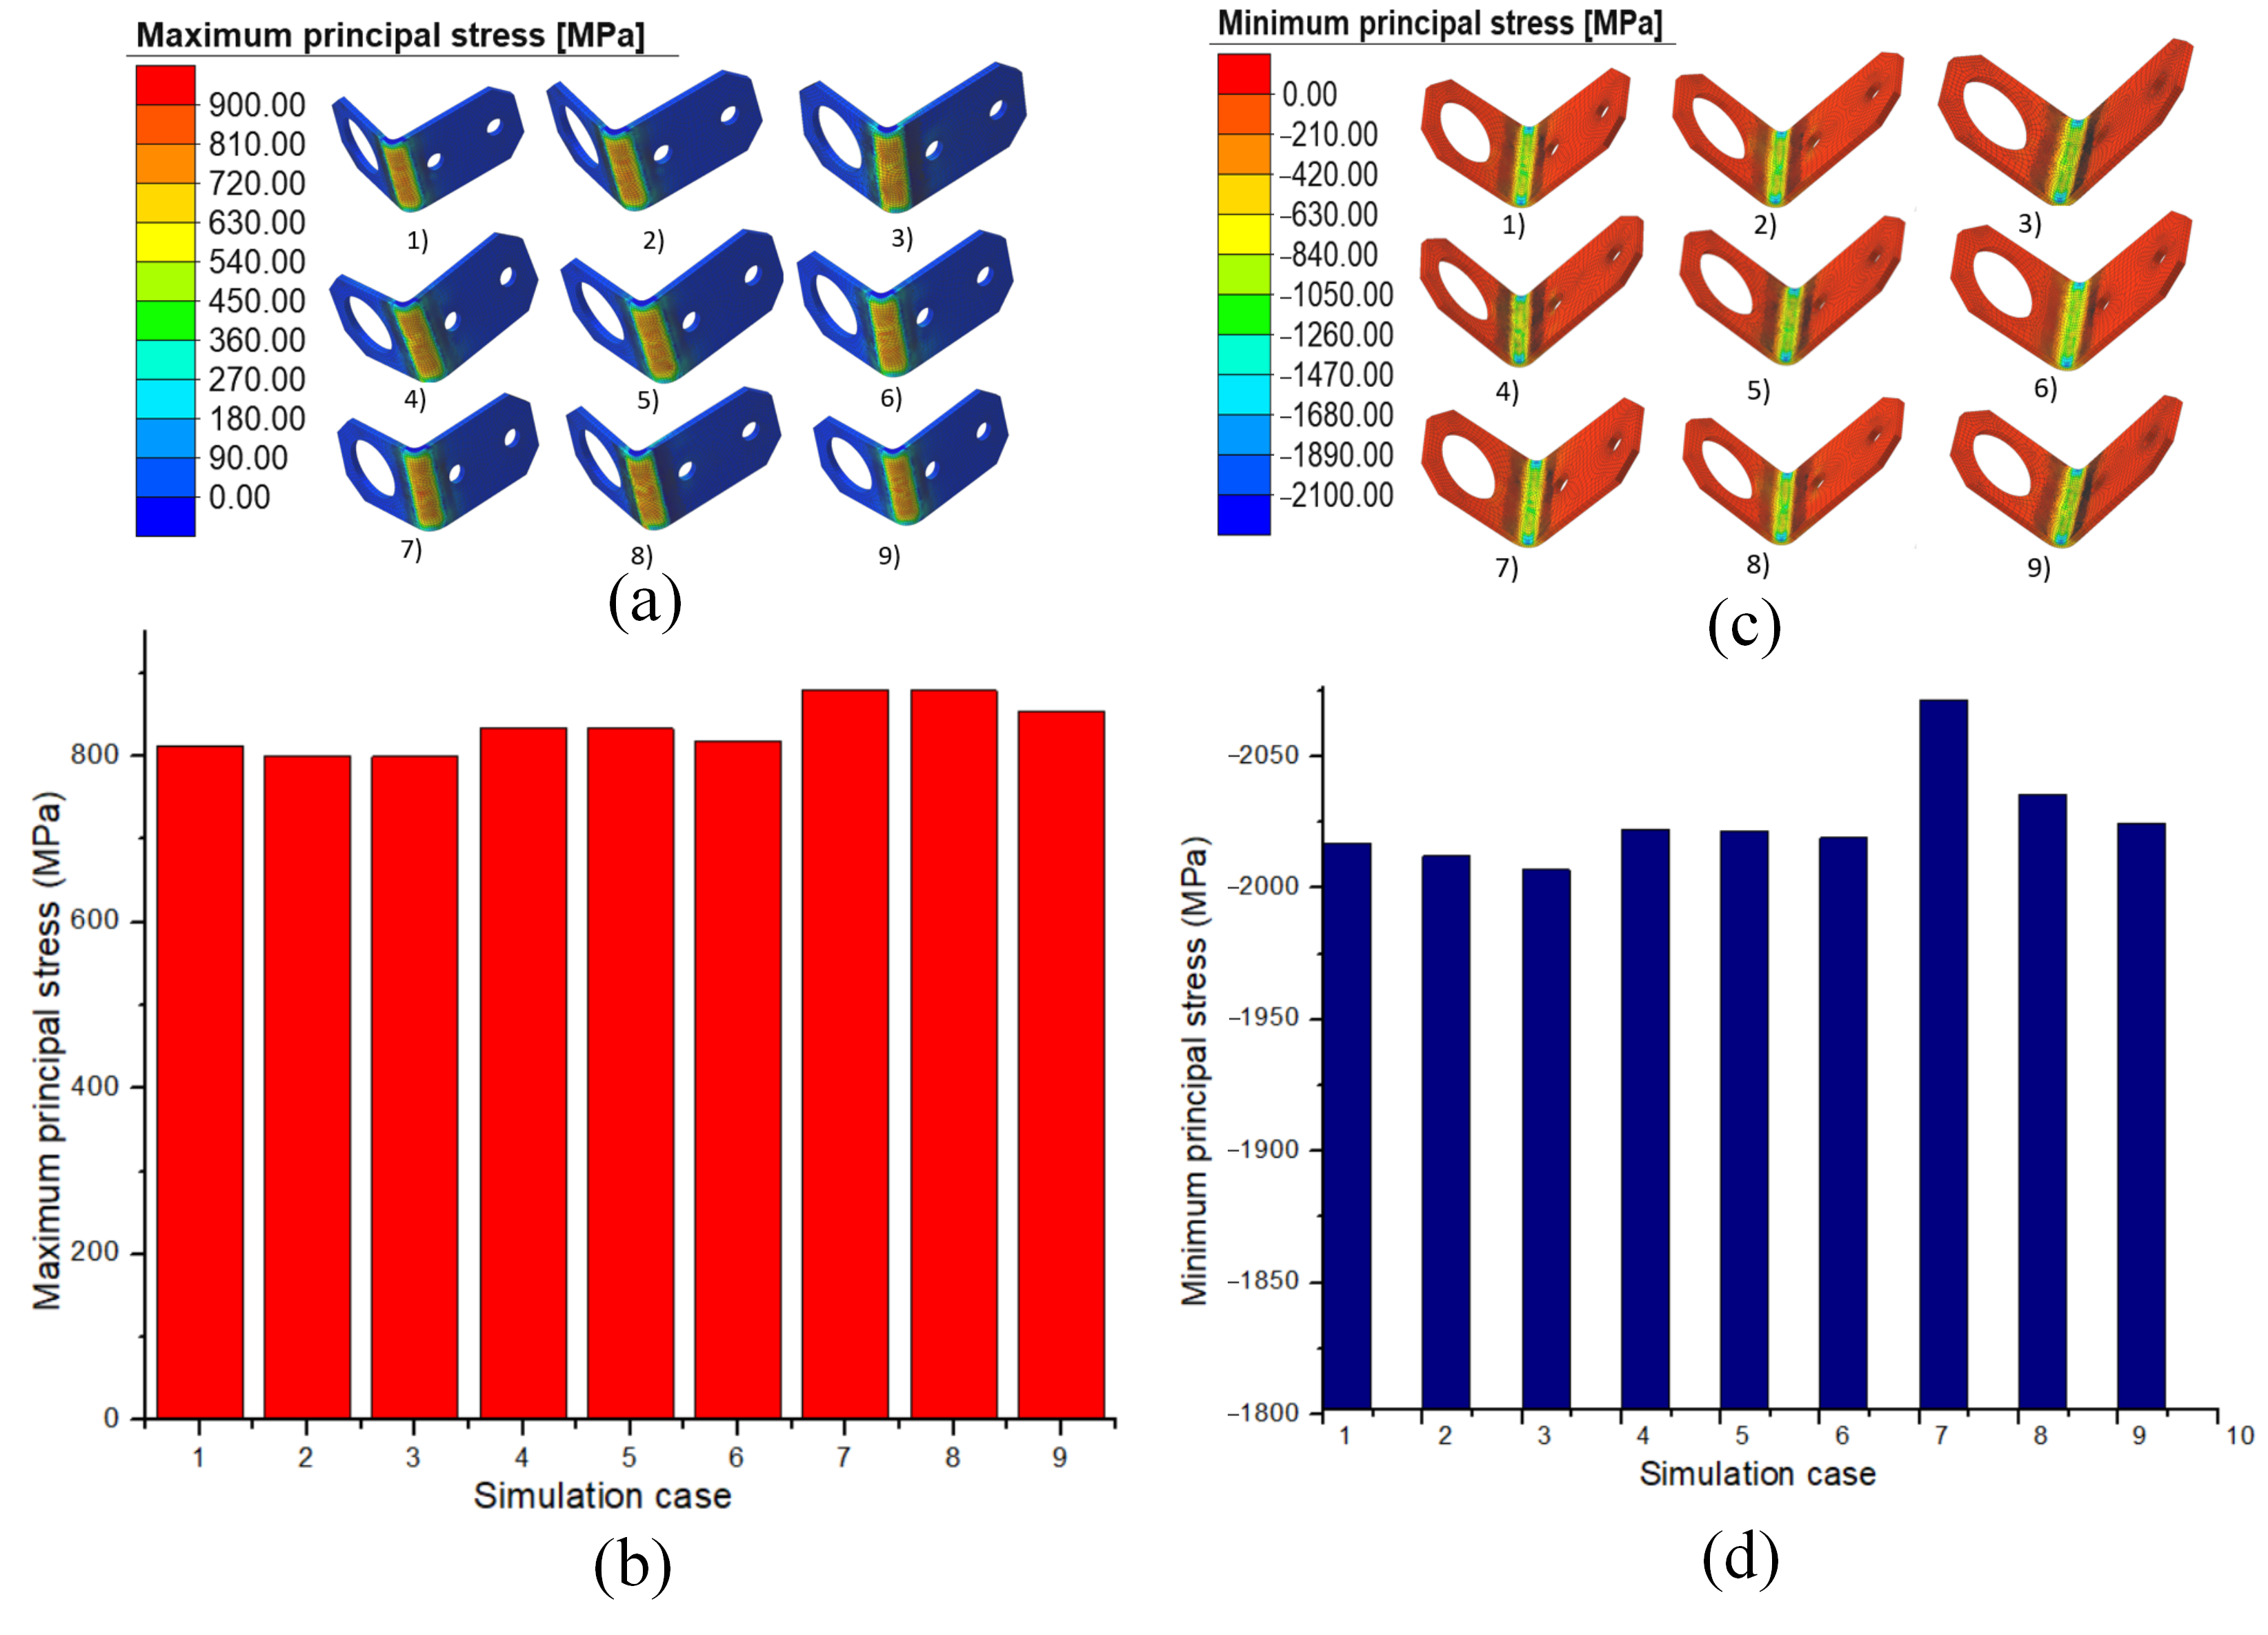
Figure 6 compares the maximum and minimum principal stresses of nine cases. The results reveal that the maximum principal stress decreases slightly as the holding time increases. At the same bending speed of 5 mm/s, the maximum principal stress value slightly decreases from 811.9 MPa to 800.91 MPa and 799.38 MPa when the holding time increases from 1.0 s to 1.5 s and 2.0 s. However, it increases when the bending speed increases. For instance, at a constant holding time of 1.0 s, the maximum principal stress values increase from 799.38 MPa to 817.17 MPa and 853.67 MPa when the bending speed increases from 5 mm/s to 10 mm/s and 15 mm/s. In addition, the minimum principal stress exhibits the same pattern of change as the holding time and bending speed change. Remarkably, due to the high strain-hardening effect, the SUS304 material can suffer a high maximum principal stress [32]. This phenomenon will be discussed in the following results of the martensite microstructure. The minimum principal stress variation also has the same changing pattern as the maximum principal stress. Interestingly, case 7 achieves both the highest maximum principal stress and the lowest minimum principal stress. This case also has the largest bending angle of 90.74°.
Figure 6.
Comparison of maximum and minimum principal stress of nine cases: (a) maximum principal stress distribution, (b) comparison of maximum principal stress, (c) minimum principal stress distribution, and (d) comparison of minimum principal stress distribution.
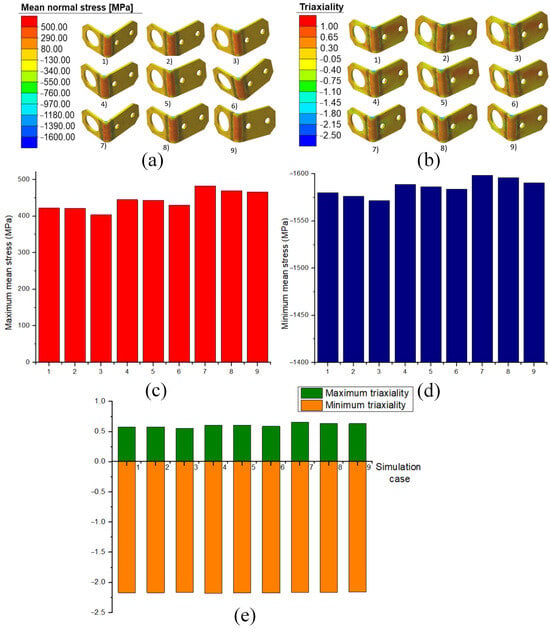
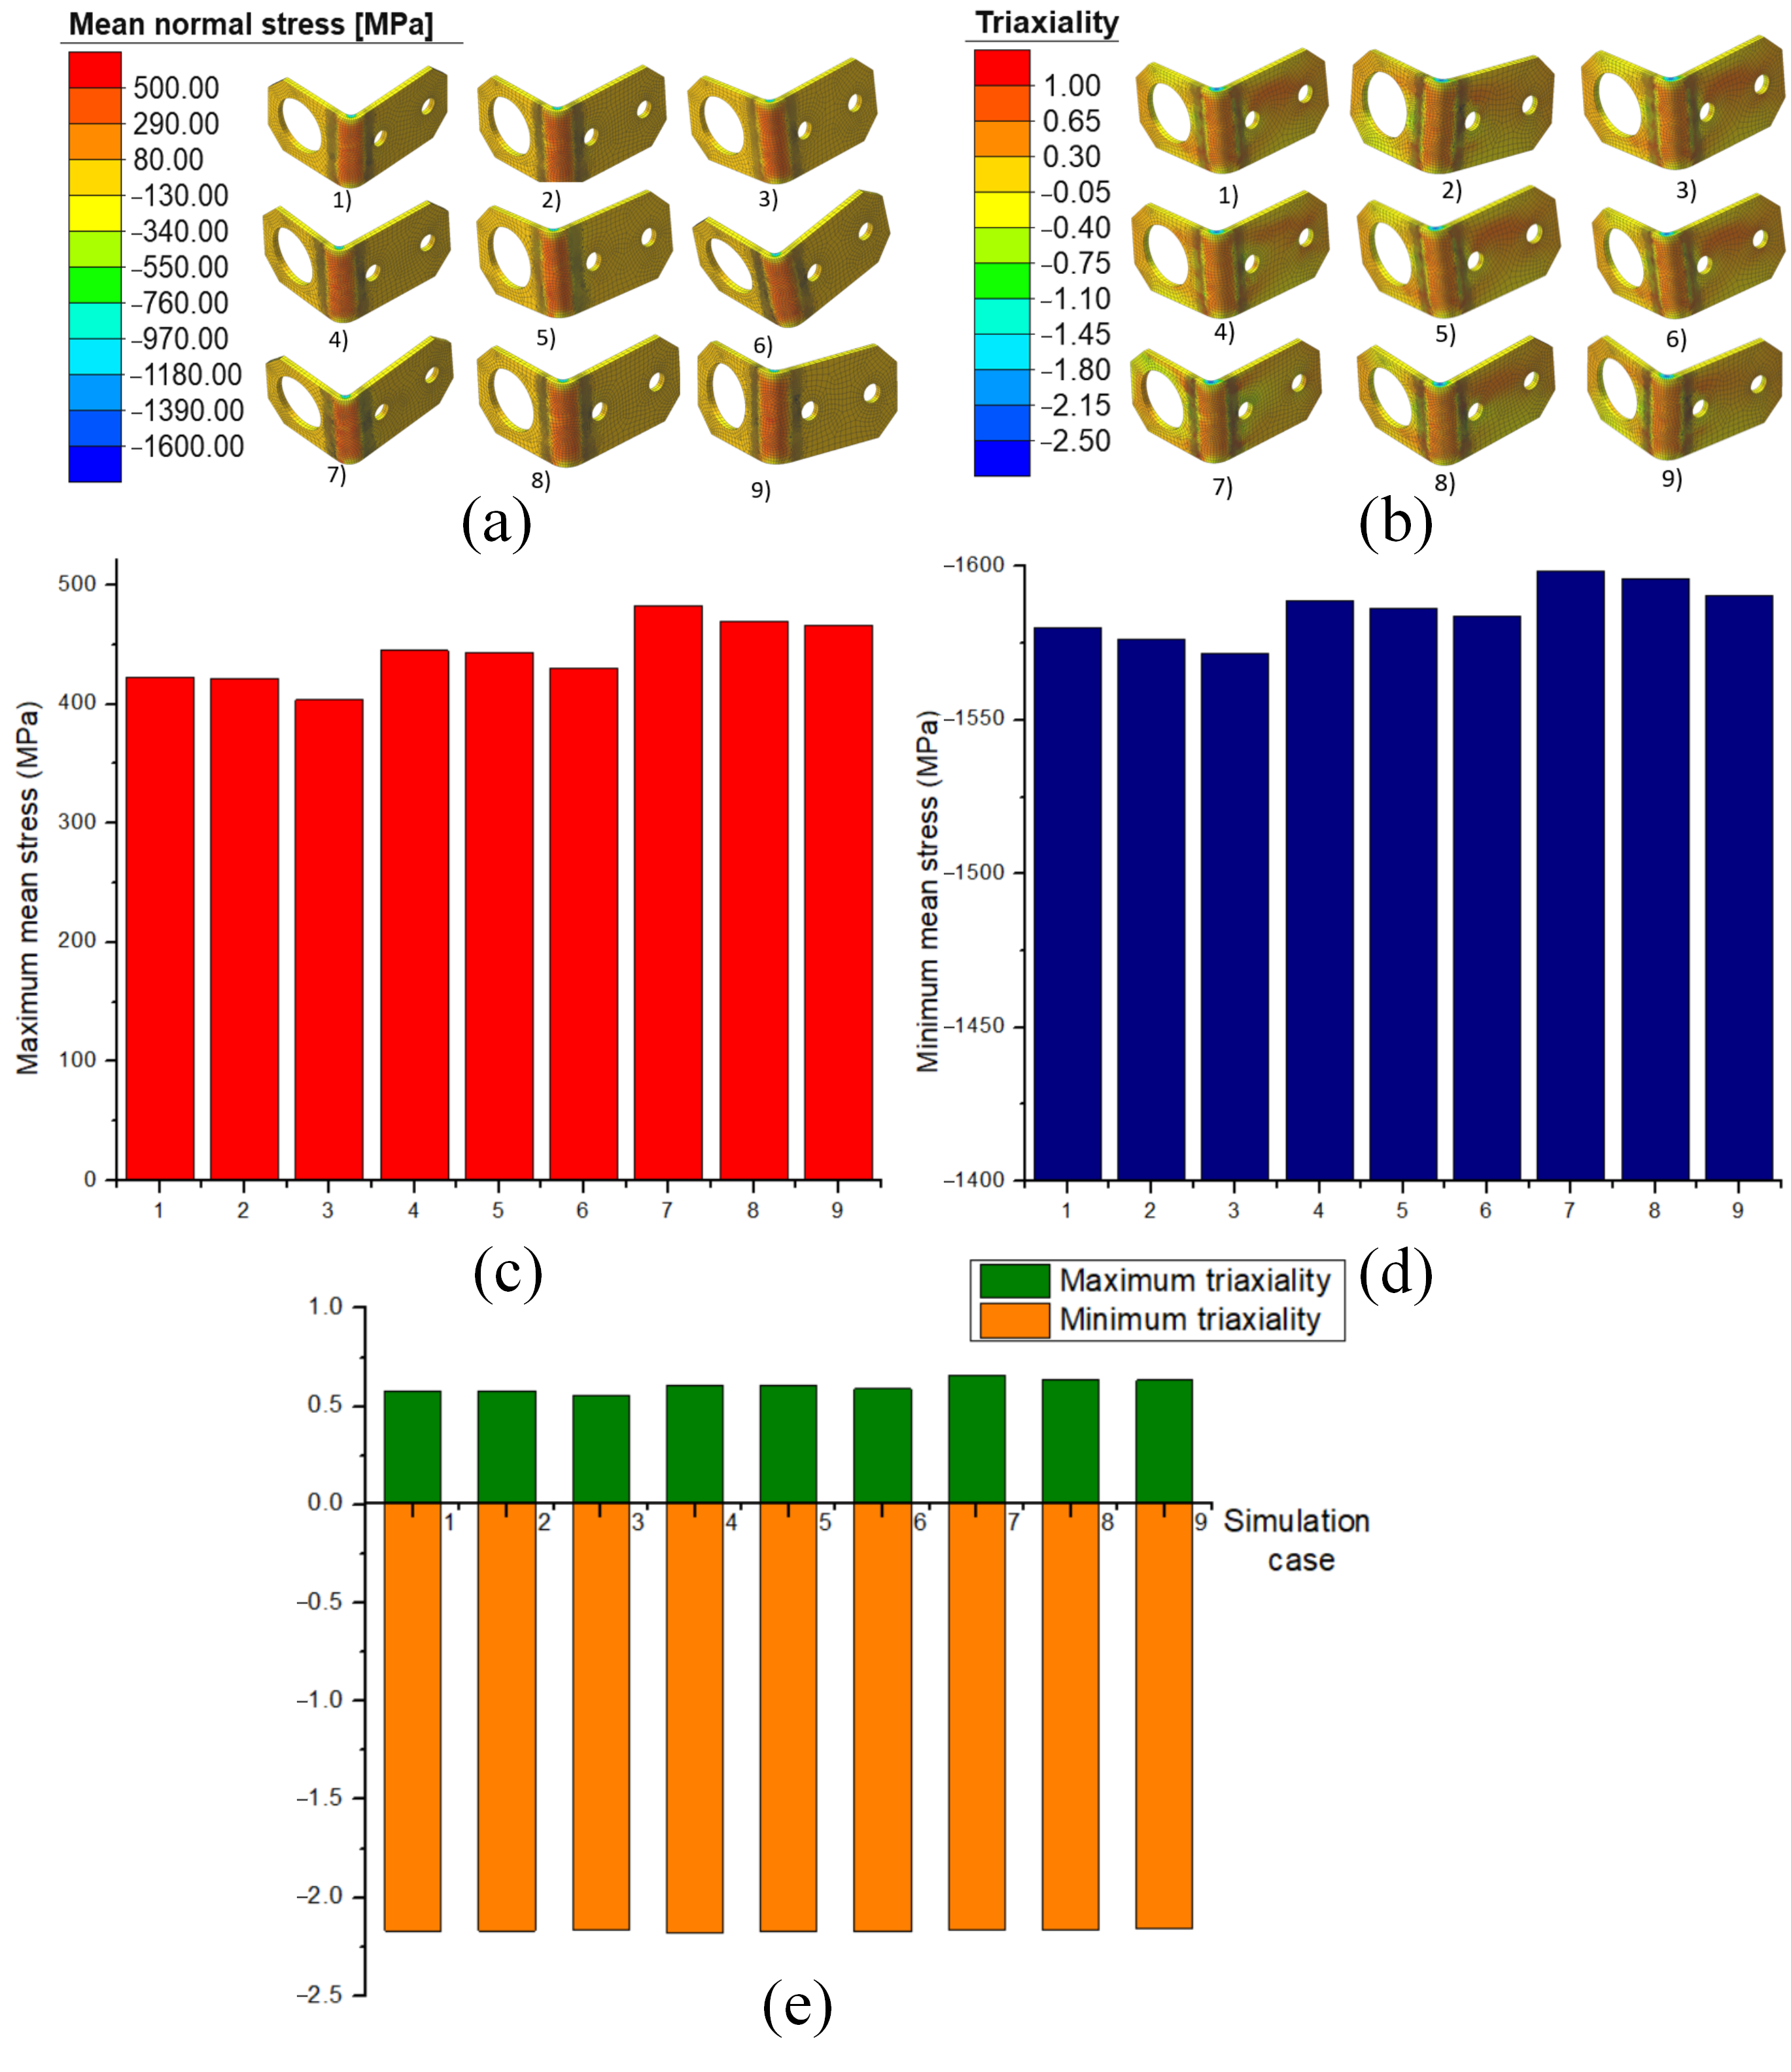
Figure 7 compares the mean stress and triaxiality for nine cases. The maximum and minimum mean stress represent the tensile and compressive states of the bending sheet. These values also have the same changing pattern as the maximum principal stress, friction stress, and contact pressure, as presented in Figure 4. The mean stress values for nine simulation cases increase with bending speed, from 406 MPa to 489 MPa. The charts show no significant difference in stress values across the 9 simulation cases. Case 7 has the highest stress value when compared to the others. Because Case 7 has the highest bending speed and shortest dwell time, the tensile and compressive stresses are higher than those of the others, leaving insufficient time to reduce residual stress and resulting in the greatest springback angle. Case 3 shows the lowest stress due to the slowest bending speed and longest dwell time, resulting in the smallest springback angle and the lowest risk of fracture. The chart comparing the maximum and minimum stress triaxiality values across nine simulation cases is shown in Figure 7e. First, the green bars show the maximum triaxiality, which ranges from about +0.55 to +0.65. Since a normal pulling force has a value of +0.33, these higher positive numbers mean the material is under strong stretching forces from multiple directions. This state usually causes tiny holes inside the material to grow and form cracks, and will be discussed further with the following Forming Limit Diagram (FLD). On the other hand, the orange bars represent the minimum triaxiality, which remains nearly the same across all cases, around −2.15 to −2.20. These negative values indicate a strong pushing force that actually prevents small holes from growing, even though the material still experiences high pressure.
Figure 7.
Comparison of mean stress and triaxiality of nine cases: (a) mean normal stress distribution, (b) triaxiality distribution, (c) comparison of maximum mean stress distribution, (d) comparison of minimum mean stress distribution, and (e) comparisons of maximum and minimum triaxiality.
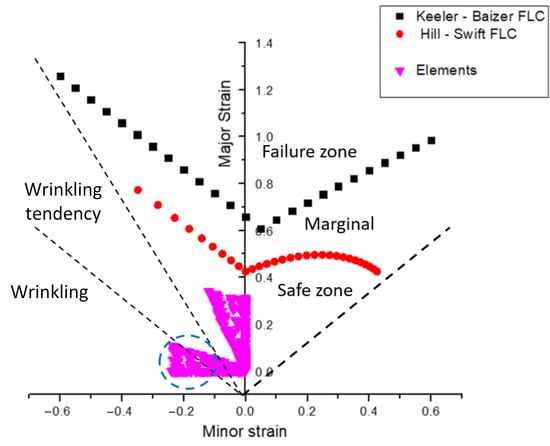
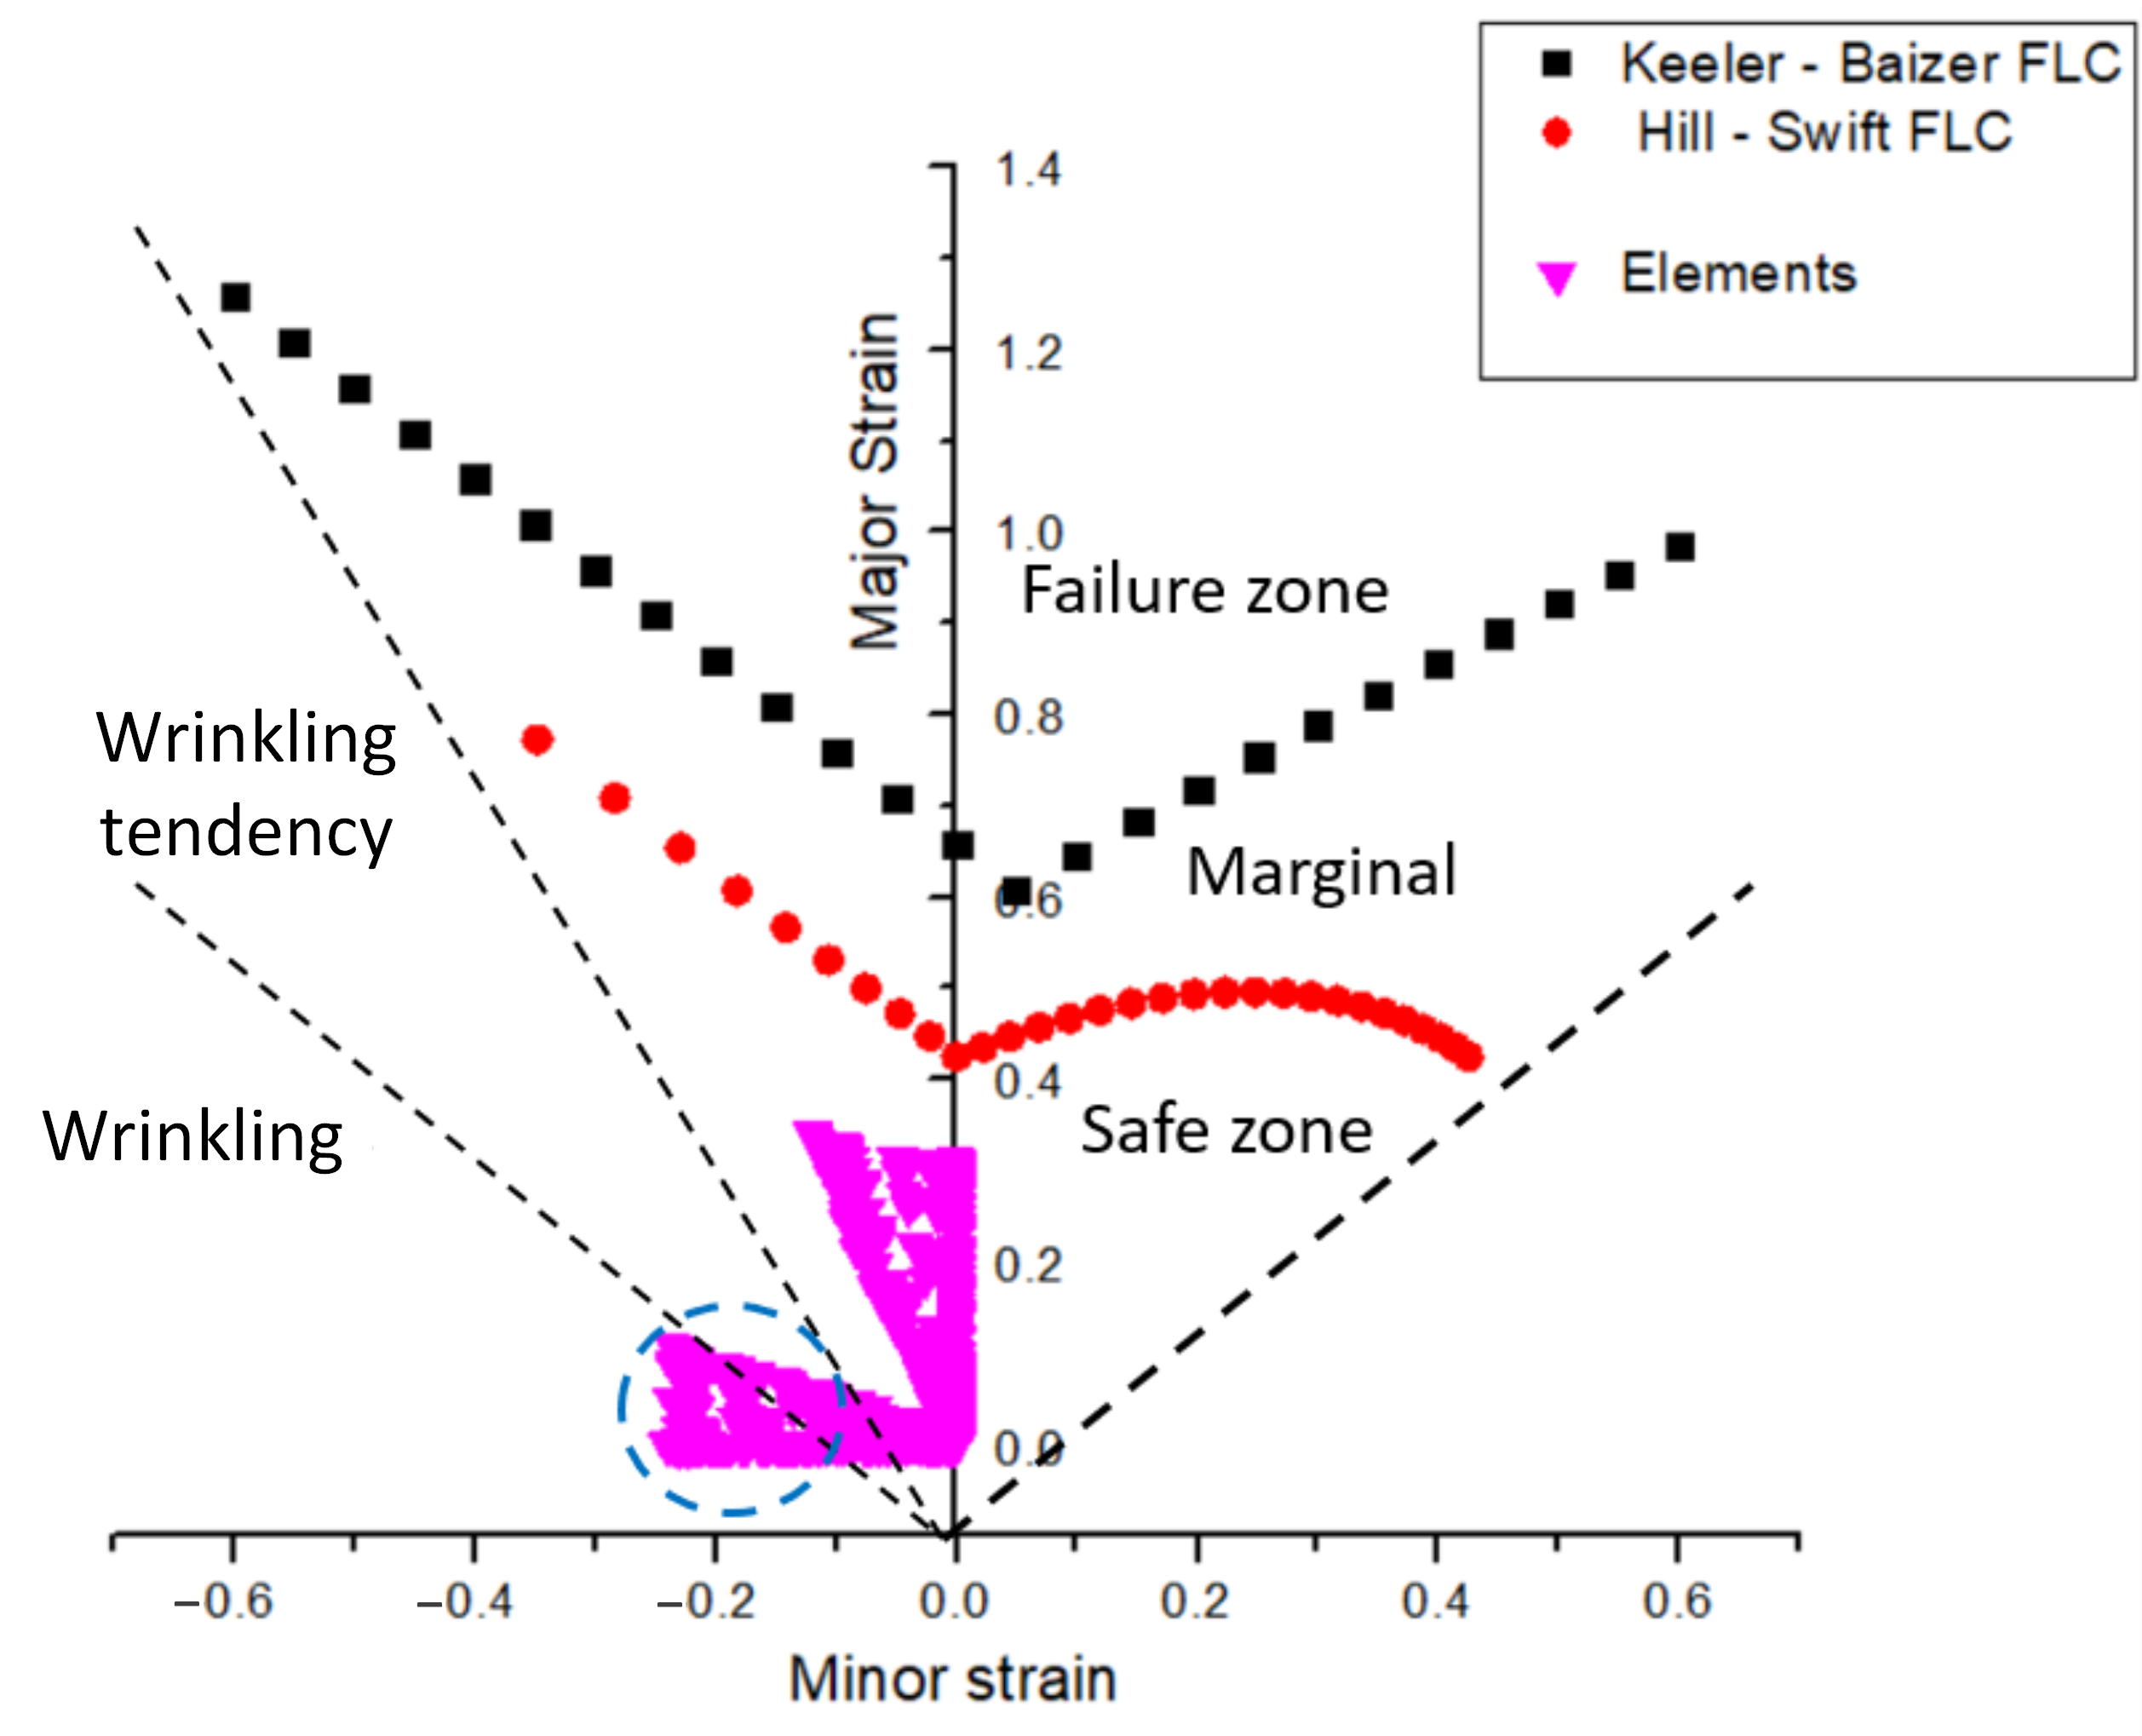
In sheet metal forming analysis, the major and minor true strain values are used to construct the Forming Limit Diagram (FLD). This diagram is used to evaluate the material’s deformation state, thereby identifying safe zones, the onset of necking, and regions at risk of failure such as material tearing and wrinkling. Figure 8 shows the Forming Limit Diagram (FLD) of the simulation at a forming speed of 15 mm/s. All deformation state points (Elements) remain well below both the Keeler–Baizer and Hill–Swift Forming Limit Curves (FLCs), indicating that no localized necking or material tearing occurs under this condition. However, a cluster of elements located in the negative minor strain region (highlighted in the blue circle) falls into the wrinkling zone. This suggests that while a speed of 15 mm/s successfully prevents failure due to thinning, it induces localized compressive instability, leading to potential wrinkling in the formed part, which is consistent with the results in Figure 6c,d.
Figure 8.
FLD of the simulation result at 15 mm/s (pink color).
3.2. Experimental Results
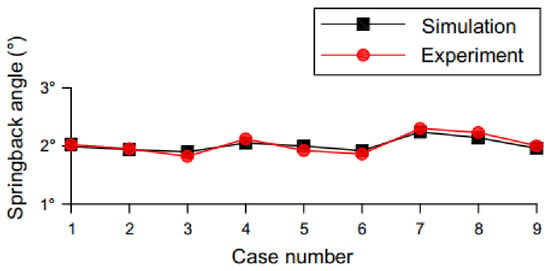
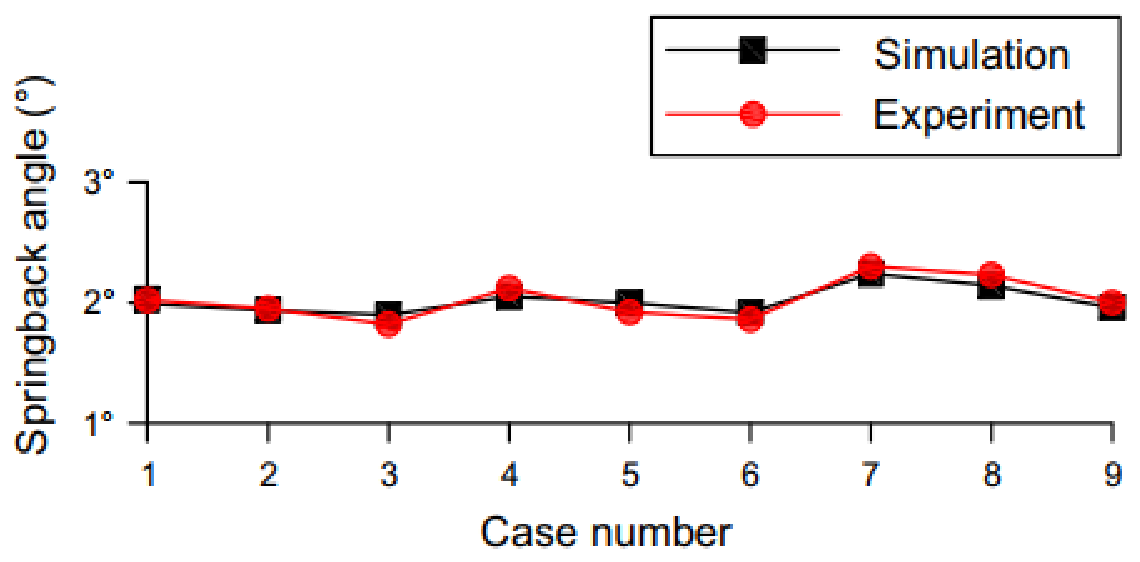
In this study, a friction coefficient of μ = 0.5 was adopted as an assumed parameter to describe the dry contact condition between the SUS304 sheet and the SCM440 punch and die in the experiment, for comparison with the related simulation results, which could vary from 0.4 to 0.6. Further investigation should be conducted to determine this value. After obtaining 45 experimental samples across the nine cases (five samples per case), as presented in Table 8, a comparison between the experimental and simulation results was performed, as shown in Figure 9. The results indicate that the experiment is aligned with the simulation results; the springback angle increases as the bending speed rises and decreases as the holding time increases. The differences in bending angle between the simulation and experiment are less than 5%, indicating the reliability of using simulation results for bending prediction and design. In addition, the standard deviation is around 0.1°, which is relatively small, indicating good repeatability. The presentation of the standard deviation in Table 8 enhances data reliability by demonstrating experimental variability and measurement consistency [32].
Table 8.
Comparison of simulated and experimental springback angle.
Figure 9.
Comparison of simulated and experimental springback angles.
SUS304 stainless steel belongs to the austenitic steel group and, at room temperature, has a face-centered cubic (FCC) crystal lattice structure consisting of 100% austenite phase. This structure gives the material extremely high ductility, good corrosion resistance, and, in particular, non-magnetic properties. However, this structure can undergo transformation under mechanical stress. During cold forming processes such as V-bending, external forces generate large residual stresses and plastic deformations within the crystal lattice. This mechanical energy activates a non-diffusion phase transformation, converting the flexible austenite phase into the harder and more brittle martensite phase [31]. This phenomenon is called strain-induced martensite formation (SIM). The volume of the transformed phase is proportional to the degree of deformation: the deeper the material is bent, the more martensite phase is generated.
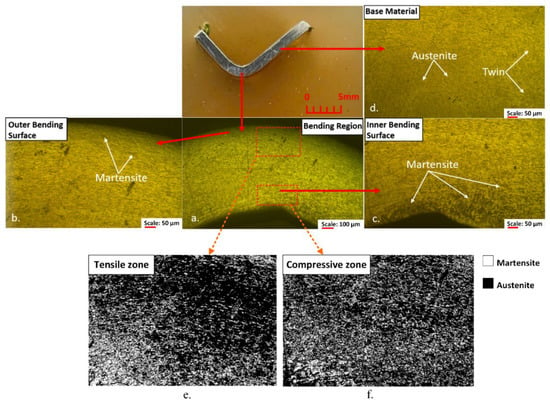
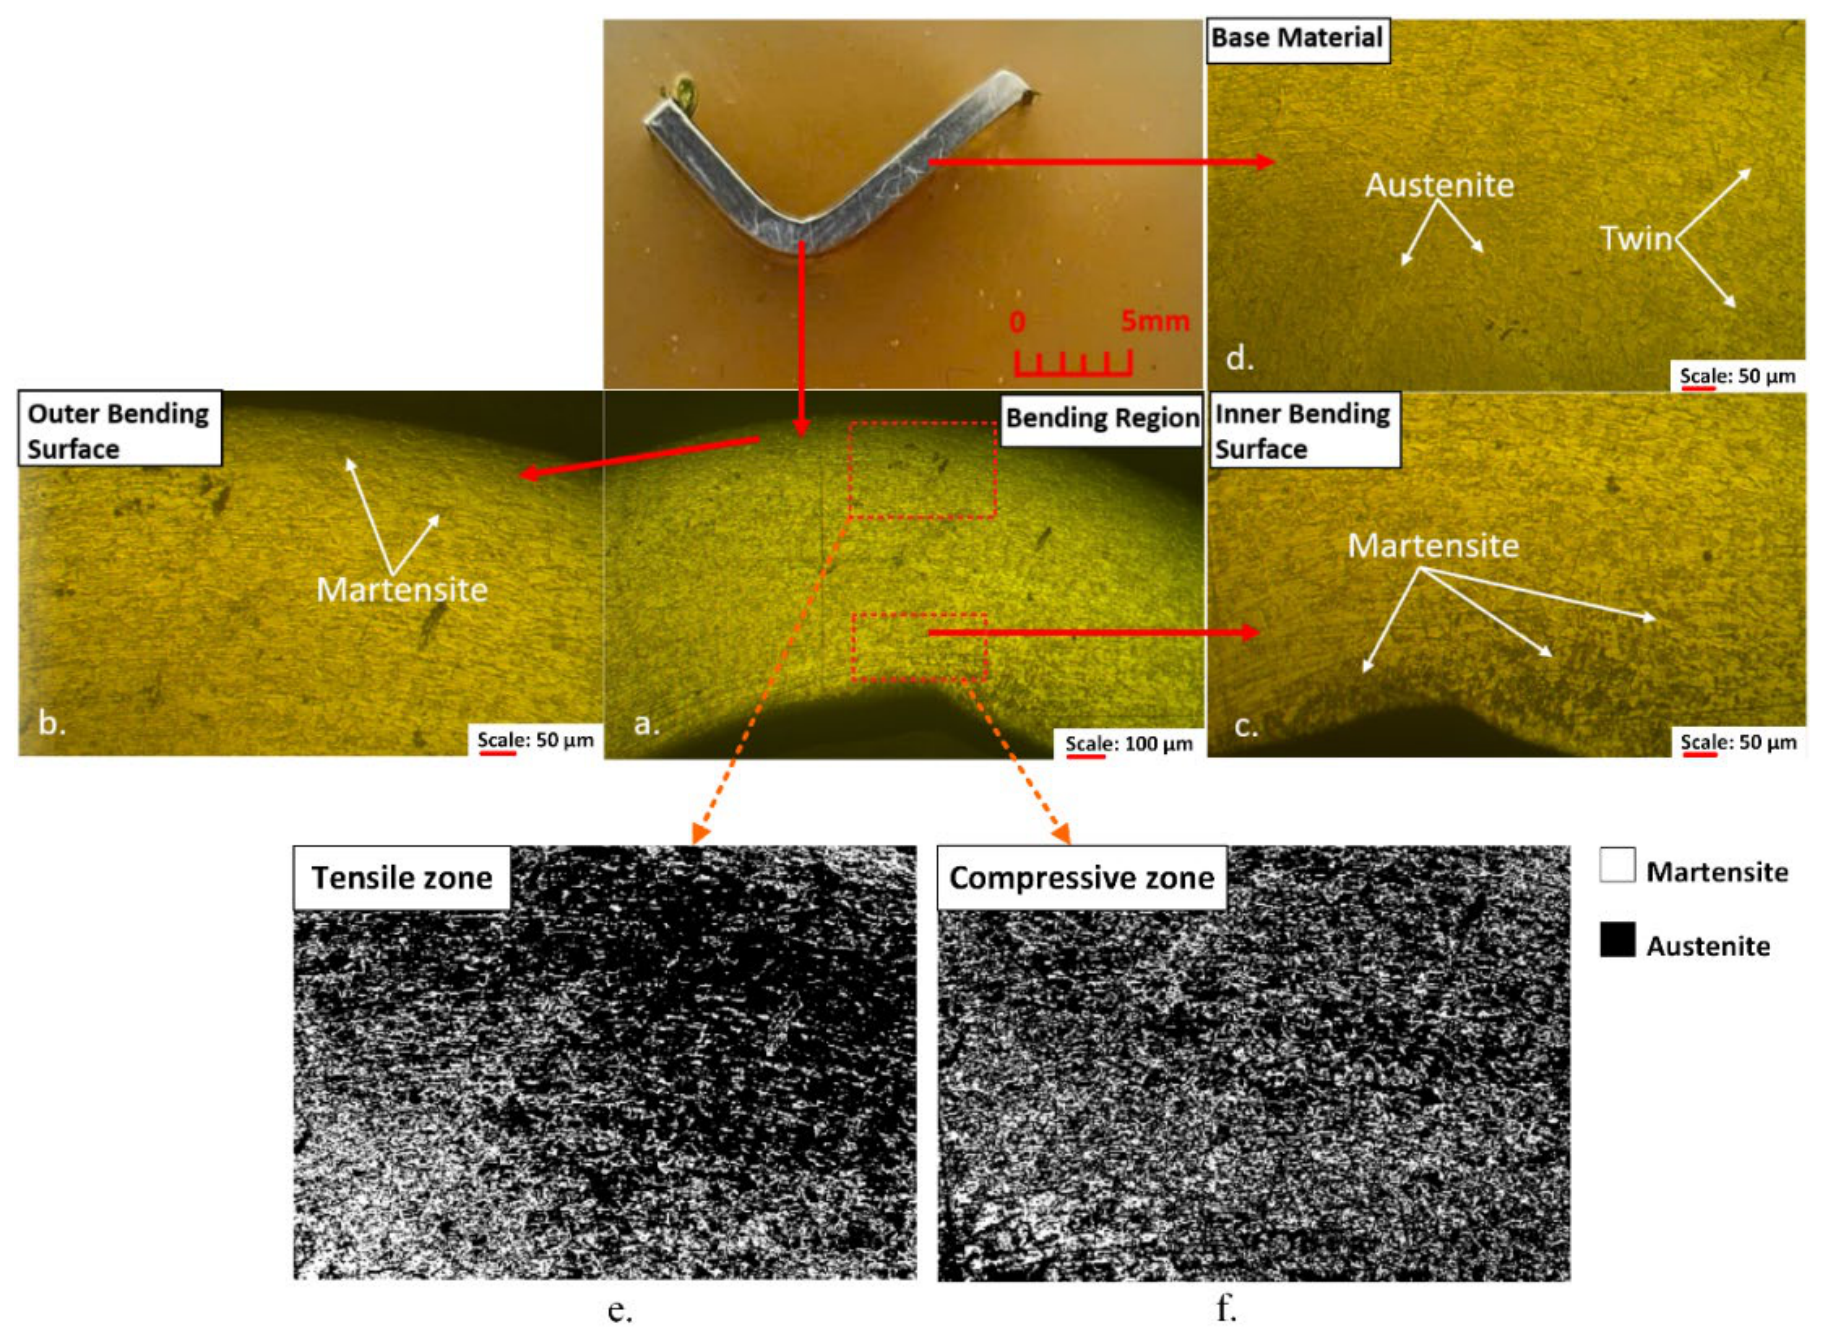
Figure 10 shows the microstructure of dissimilar bending regions of SUS304. There are austenite phases and twins within the austenite grains in the undeformed region, as shown in Figure 10d. At the bending areas, phase transformation occurs from the austenitic phase into the martensite phase, as shown in Figure 10a–c. The volume fraction of martensite was determined through microstructural analysis using ImageJ version 1.54g for two examined zones: the tensile and compressive zones, as shown in Figure 10e,f. The micrographs were converted into 8-bit grayscale images, and a fixed grayscale threshold range of 0–103 was applied to identify the martensite phase and the matrix. This technique only provides approximate values and requires further analysis using XRD or EBSD. The results indicate that the proportion of martensite phase transformed after bending was about 27.6% for the compressive zone and approximately 28.2% for the tensile zone. The results reveal that the amount of transformed martensite in the tensile zone exceeds that in the compressive zone by approximately 0.6%. In austenitic SUS304 stainless steel, the plastic deformation generated by V-bending facilitates strain-induced martensitic transformation. This transformation improves the transformation-induced plasticity (TRIP) effect and affects strain-hardening behavior. This result is consistent with findings from another study [33]. The difference in phase area fraction accounts for the disparity in residual stress [34] and the degree of work hardening between the tensile and compressive sides. The martensite phase exhibits significantly higher stiffness and strength compared to the austenite matrix [35,36].
Figure 10.
The microstructure of dissimilar bending regions of SUS304: (a) Bending region, (b) Outer bending surface, (c) Inner bending surface, (d) Base material of SUS304 (etching with HCl + HNO3), (e) martensite phase of the compressive zone, and (f) martensite phase of the tensile zone.
Table 9 presents some comparisons with other research. The average springback angle in this study is 2.03°, which is higher than those reported by Adnan et al. [37] and S. Thipprakmas et al. [38] due to differences in materials. The reason for this phenomenon is the higher strength and stiffness of SUS304 compared to A6061 and A1050-H4. However, it is comparable to that of S. Saravanan et al. [39], who achieved 2.80°.
Table 9.
Springback angle comparisons with other research.
4. Conclusions
By combining numerical simulations with experimental testing, optimal process parameters—including forming force, speed, and punch holding time—can be determined, and the necessity of lubrication can be evaluated. Some key conclusions can be noted as follows:
- -
- The friction coefficient factor plays the most important role in the bending angle value, followed by the bending speed and holding time. Moreover, increasing the friction coefficient reduces the bending angle. The smallest bending angle is achieved with a high friction coefficient of μ = 0.5 (dry friction) and a low velocity of 5 mm/s. The simulation study’s lowest bending angle, 90.40°, is comparable to the experimental result of 90.33°.
- -
- Increasing the holding time and reducing the bending speed leads to a reduction in the bending angle. The friction stress also decreases as the bending speed and the holding time increase. The holding time has a minor impact on the contact pressure. On the other hand, the contact pressure increases significantly at higher speeds. The proportion of the martensite phase is about 28%.
- -
- The accuracy and reliability of the simulation method are confirmed by a deviation of less than 5% compared to experimental results. Simulating the V-bending process plays a crucial role in predicting not only springback but also potential manufacturing defects, thereby helping to minimize the time and costs associated with repeated bending trials.
Author Contributions
Conceptualization, Q.A.P. and V.-T.N.; methodology, V.-T.N.; software, Q.T.L.; validation, V.-T.N., M.N.N.T., and Q.T.L.; formal analysis, Q.T.L.; investigation, M.N.N.T.; resources, V.-T.N.; data curation, M.D.P.; writing—original draft preparation, Q.A.P.; writing—review and editing, Q.A.P.; visualization, Q.T.L.; supervision, V.-T.N.; project administration, V.T.T.N.; funding acquisition, V.T.T.N. All authors have read and agreed to the published version of the manuscript.
Funding
This research received no external funding.
Data Availability Statement
The raw/processed data required to reproduce these findings cannot be shared at this time as the data also forms part of an ongoing study.
Acknowledgments
The authors acknowledge the support of the Ho Chi Minh City University of Technology and Engineering (HCM-UTE) for this research and thank Le Hai Nam and Vo Van Huy Bao for their assistance and discussions regarding the experiments.
Conflicts of Interest
The authors declare no conflict of interest.
References
- Altan, T.; Tekkaya, A.E. (Eds.) Sheet Metal Forming: Processes and Applications; ASM International: Materials Park, OH, USA, 2012. [Google Scholar]
- Marciniak, Z.; Duncan, J.L.; Hu, J. Mechanics of Sheet Metal Forming; Butterworth-Heinemann: Waltham, MA, USA, 2002. [Google Scholar]
- Huda, Z. Bending of Sheet Metal; Springer Nature: Berlin/Heidelberg, Germany, 2024; pp. 217–237. [Google Scholar] [CrossRef] [Scilit] [PubMed]
- Suyuti, M.A.; Iswar, M.; Nur, R. Effect of punch angle and punch radius on bend angle through air V-bending of sheet metal. In AIP Conference Proceedings; AIP Publishing LLC: Melville, NY, USA, 2019; Volume 2187, p. 030002. [Google Scholar] [CrossRef] [Scilit]
- Suyuti, M.A.; Iswar, M.; Nur, R. Effect of punch parameters on springback for mild carbon steel in a V-Shape bending process. In IOP Conference Series: Materials Science and Engineering; IOP Publishing: Bristol, UK, 2019; Volume 541, p. 012015. [Google Scholar] [CrossRef] [Scilit]
- Leu, D.-K. Position deviation and springback in V-die bending process with asymmetric dies. Int. J. Adv. Manuf. Technol. 2015, 79, 1095–1108. [Google Scholar] [CrossRef] [Scilit]
- Mullan, H.B. Improved prediction of springback on final formed components. J. Mater. Process. Technol. 2004, 153–154, 464–471. [Google Scholar] [CrossRef] [Scilit]
- Buang, M.S.; Abdullah, S.A.; Saedon, J. An overview of the impacts of material parameters on springback. Appl. Mech. Mater. 2014, 564, 323–328. [Google Scholar] [CrossRef] [Scilit]
- Carden, W.D.; Geng, L.M.; Matlock, D.K.; Wagoner, R.H. Measurement of springback. Int. J. Mech. Sci. 2002, 44, 79–101. [Google Scholar] [CrossRef] [Scilit]
- Appiah, E.; Jain, M. A new constitutive model for prediction of springback in sheet metal forming. In AIP Conference Proceedings; American Institute of Physics: College Park, MD, USA, 2004; Volume 712, pp. 1651–1657. [Google Scholar] [CrossRef] [Scilit]
- Leu, D.-K. Relationship between mechanical properties and geometric parameters to limitation condition of springback based on springback–radius concept in V-die bending process. Int. J. Adv. Manuf. Technol. 2019, 101, 913–926. [Google Scholar] [CrossRef] [Scilit]
- Thipprakmas, S.; Phanitwong, W. Process parameter design of spring-back and spring-go in V-bending process using Taguchi technique. Mater. Des. 2011, 32, 4430–4436. [Google Scholar] [CrossRef] [Scilit]
- Panthi, S.K.; Ramakrishnan, N.; Ahmed, M.; Singh, S.S.; Goel, M.D. Finite element analysis of sheet metal bending process to predict the springback. Mater. Des. 2010, 31, 657–662. [Google Scholar] [CrossRef] [Scilit]
- Panthi, S.K.; Ramakrishnan, N.; Pathak, K.K.; Chouhan, J.S. An analysis of springback in sheet metal bending using finite element method (FEM). J. Mater. Process. Technol. 2007, 186, 120–124. [Google Scholar] [CrossRef] [Scilit]
- Ling, Y.E.; Lee, H.P.; Cheok, B.T. Finite element analysis of springback in L-bending of sheet metal. J. Mater. Process. Technol. 2005, 168, 296–302. [Google Scholar] [CrossRef] [Scilit]
- Cho, J.R.; Moon, S.J.; Moon, Y.H.; Kang, S.S. Finite element investigation on spring-back characteristics in sheet metal U-bending process. J. Mater. Process. Technol. 2003, 141, 109–116. [Google Scholar] [CrossRef] [Scilit]
- Chan, W.M.; Chew, H.I.; Lee, H.P.; Cheok, B.T. Finite element analysis of spring-back of V-bending sheet metal forming processes. J. Mater. Process. Technol. 2004, 148, 15–24. [Google Scholar] [CrossRef] [Scilit]
- Huang, Y.-M. Finite element analysis on the V-die coining bend process of steel metal. Int. J. Adv. Manuf. Technol. 2007, 34, 287–294. [Google Scholar] [CrossRef] [Scilit]
- Khudadad, A.R.; Ghazi, S.K.; Al-Arkawazi, R.R.; Al-Obaidi, M.A.; Abdullah, M.A. Comparative Study of Springback in Different Sheet Metal Alloys and Thicknesses in V-Shaped Bending Process. Appl. Mech. Mater. 2025, 928, 3–9. [Google Scholar] [CrossRef] [Scilit]
- Wasif, M.; Iqbal, S.A.; Tufail, M.; Karim, H. Experimental analysis and prediction of springback in V-bending process of high-tensile strength steels. Trans. Indian Inst. Met. 2020, 73, 285–300. [Google Scholar] [CrossRef] [Scilit]
- Örnekci, A.O.; Ekşi, S. Experimental study on springback properties of 6061 aluminum in V-bending. Sak. Univ. J. Sci. 2024, 28, 646–653. [Google Scholar] [CrossRef] [Scilit]
- Buang, M.S.; Abdullah, S.A.; Saedon, J. Effect of die and punch radius on springback of stainless steel sheet metal in the air v-die bending process. J. Mech. Eng. Sci. 2015, 8, 1322–1331. [Google Scholar] [CrossRef] [Scilit]
- Ramezani, M.; Mohd Ripin, Z.; Ahmad, R. Modelling of kinetic friction in V-bending of ultra-high-strength steel sheets. Int. J. Adv. Manuf. Technol. 2010, 46, 101–110. [Google Scholar] [CrossRef] [Scilit]
- Nur, R.; Suyuti, M.A.; Iswar, M.; Muttaqin, A.N. Springback Analysis in the Bending Process of V-shaped Stainless Steel AISI 304 Using Central Composite Design (CCD) Approach. In E3S Web of Conferences; EDP Sciences: Les Ulis, France, 2024; Volume 517, p. 12001. [Google Scholar] [CrossRef] [Scilit]
- Sharma, P.K.; Gautam, V.; Agrawal, A.K. Experimental and numerical investigations of springback and residual stresses in bending of a three-ply clad sheet. Proc. Inst. Mech. Eng. Part L J. Mater. Des. Appl. 2021, 235, 2823–2838. [Google Scholar] [CrossRef] [Scilit]
- Le, A.C.; Nguyen, H.; Tran, A.S.; Banh, Q.N.; Ho, M.T. Effect of V-Grooving Technique on Springback Behavior of SS304 Sheet in V-Bending Process: An Experimental Study. In EAI International Conference on Renewable Energy and Sustainable Manufacturing; Springer Nature: Cham, Switzerland, 2025; pp. 481–493. [Google Scholar] [CrossRef] [Scilit]
- Zhou, J.; Yang, X.; Wang, B.; Xiao, W. Springback prediction of 7075 aluminum alloy V-shaped parts in cold and hot stamping. Int. J. Adv. Manuf. Technol. 2022, 119, 203–216. [Google Scholar] [CrossRef] [Scilit]
- Zhang, C.; Lou, Y. Influences of the evolving plastic behavior of sheet metal on V-bending and springback analysis considering different stress states. Int. J. Plast. 2024, 173, 103889. [Google Scholar] [CrossRef] [Scilit]
- Mithu, M.A.H.; Karim, M.A.; Taj, F.A.; Rahman, A. Predicting springback in V-bending: Effects of load, load holding time, and heat treatment on common sheet-metal forming operations. Mater. Today Commun. 2025, 43, 111668. [Google Scholar] [CrossRef] [Scilit]
- Xie, J.; Xu, Y.; Meng, Z.; Liang, M.; Zhou, Y.; Šavija, B. Impact behavior of auxetic cementitious cellular composites (ACCCs) architected through additive manufacturing (AM) assisted casting: Experiment and modelling. Constr. Build. Mater. 2025, 471, 140692. [Google Scholar] [CrossRef] [Scilit]
- Trzepiecinski, T.; Lemu, H.G. Effect of computational parameters on springback prediction by numerical simulation. Metals 2017, 7, 380. [Google Scholar] [CrossRef] [Scilit]
- Zhang, Y.; Liu, M.; Han, J.; Zhai, S.; Liu, X.; Yan, X.; Nie, F.; Peng, Z. Hard-turning-induced surface integrity and fatigue performance of 18CrNiMo7-6 steel for V-notched specimens. Precis. Eng. 2025, 97, 268–278. [Google Scholar] [CrossRef] [Scilit]
- Seol, J.B.; Jung, J.E.; Jang, Y.W.; Park, C.G. Influence of carbon content on the microstructure, martensitic transformation and mechanical properties in austenite/ε-martensite dual-phase Fe–Mn–C steels. Acta Mater. 2013, 61, 558–578. [Google Scholar] [CrossRef] [Scilit]
- Ahmadi, M.; Sadeghi, B.M.; Arabi, H. Experimental and numerical investigation of V-bent anisotropic 304L SS sheet with spring-forward considering deformation-induced martensitic transformation. Mater. Des. 2017, 123, 211–222. [Google Scholar] [CrossRef] [Scilit]
- Gutiérrez, I.; Altuna, M.A. Work-hardening of ferrite and microstructure-based modelling of its mechanical behaviour under tension. Acta Mater. 2008, 56, 4682–4690. [Google Scholar] [CrossRef] [Scilit]
- Ren, C.X.; Wang, Q.; Zhang, Z.J.; Yang, H.J.; Zhang, Z.F. Enhanced tensile and bending yield strengths of 304 stainless steel and H62 brass by surface spinning strengthening. Mater. Sci. Eng. A 2019, 754, 593–601. [Google Scholar] [CrossRef] [Scilit]
- Adnan, A.F.; Abdullah, A.B.; Samad, Z. Study of springback pattern of non-uniform thickness section based on V-bending experiment. J. Mech. Eng. Sci. 2017, 11, 2845–2855. [Google Scholar] [CrossRef] [Scilit]
- Thipprakmas, S. Spring-back factor applied for V-bending die design. J. Adv. Mech. Des. Syst. Manuf. 2020, 14, JAMDSM0037. [Google Scholar] [CrossRef] [Scilit]
- Saravanan, S.; Saravanan, M.; Jeyasimman, D. Study on effects of spring back on sheet metal bending using simulation methods. Int. J. Mech. Prod. 2018, 8, 923–932. [Google Scholar] [CrossRef] [Scilit]

Disclaimer/Publisher’s Note: The statements, opinions and data contained in all publications are solely those of the individual author(s) and contributor(s) and not of MDPI and/or the editor(s). MDPI and/or the editor(s) disclaim responsibility for any injury to people or property resulting from any ideas, methods, instructions or products referred to in the content. |
© 2026 by the authors. Licensee MDPI, Basel, Switzerland. This article is an open access article distributed under the terms and conditions of the Creative Commons Attribution (CC BY) license.