


Featured Application
The relational approach presented in this study provides a framework for examining how complete sets of colors are organized rather than evaluating individual colors in isolation. The resulting structures may inform future research on the design and evaluation of color systems in information visualization, user interfaces, graphic communication, and environmental wayfinding. By distinguishing shared organizational patterns from individual variability and potentially unstable group differences, this approach offers a basis for developing and experimentally testing color arrangements intended for diverse user populations.
Abstract
Color organization in visual communication depends not only on individual colors but also on relationships within complete color sets. However, whether freely generated relational structures are shared across individuals and vary with residential environment remains unclear. This study examined arrangements produced by 1000 adults from urban (n = 632) and rural (n = 368) populations. Participants freely arranged 24 color stimuli on a fixed 6 × 4 grid without a prescribed organizing criterion. Each arrangement was represented by 276 pairwise Euclidean spatial distances. Consensus structures were evaluated using mean- and median-based estimators, split-half reliability, participant-level permutation tests, and bootstrap analyses. Despite substantial individual variability, reproducible group-level structures emerged. Urban and rural mean consensus structures showed strong correspondence (Pearson’s r = 0.975; RMS difference = 0.0786), with no statistically significant global difference under unrestricted (p = 0.322) or region-stratified permutation (p = 0.297). A supplementary median-based analysis yielded a nominally significant region-stratified result (p = 0.0328), although pair-specific group contrasts showed limited reproducibility. These findings indicate that the dominant relational organization was largely shared across residential groups, while evidence for systematic environmental differences remained inconclusive. The proposed framework provides a basis for investigating relational color organization and its potential relevance to visual communication and interface design.
1. Introduction
Color is a fundamental component of visual communication, contributing to the differentiation, organization, and interpretation of information in graphic products, digital interfaces, and information displays. Its communicative function, however, rarely depends on individual colors alone. Most visual systems employ combinations in which colors acquire meaning and functional significance through their relationships with other elements. The effectiveness of color coding and screen-based information presentation therefore depends not only on the selection of individual colors but also on their combination, arrangement, and integration into the overall visual structure [1,2]. Understanding color as a relational component of visual communication consequently requires consideration of how complete sets of colors are organized and interpreted. The importance of these relationships extends beyond the functional differentiation of visual elements. Aesthetic responses to color combinations involve distinguishable dimensions of preference, harmony, and similarity, which cannot be treated as equivalent properties of a configuration [3]. Preferences for particular combinations are also associated with similarity-based relationships among their constituent colors, indicating that the evaluation of a combination cannot be reduced to the independent evaluation of each color [4]. Furthermore, color preferences may be shaped by affective associations acquired through interactions with objects and environments, suggesting that visual experience contributes to the evaluation of chromatic stimuli [5]. These perspectives establish the relevance of relational and experiential factors in color-related judgments while also drawing attention to the distinction between aesthetic evaluation, perceived similarity, and the organization of a color set. The relational organization of color can also be approached through multidimensional representations, in which the analytical focus shifts from the properties of individual stimuli to the structure of relationships among them. Research using Gestalt formation tasks and multidimensional scaling has shown that color-dissimilarity structures can be represented configurationally and that individuals may differ in the organization of these relationships [6]. Spatial-arrangement methods provide a complementary approach by allowing participants to position multiple stimuli simultaneously within a shared spatial field. Such procedures can efficiently capture relational information that would otherwise require numerous separate pairwise judgments, and their applicability extends to complex, high-dimensional semantic structures [7,8]. By dealing with the configuration, these methods make it possible to investigate patterns of organization that may be less apparent when stimuli are evaluated independently.
Nevertheless, the meaning attributed to a spatial configuration depends on the task through which it was produced. Methodological evaluations of spatial-arrangement procedures have identified limitations in their interpretation and demonstrated that the resulting relational representations are influenced by the measurement approach [9,10]. When participants are instructed to arrange stimuli according to similarity, spatial proximity can be interpreted in relation to that explicitly defined criterion. In an arrangement task without a prescribed organizing principle, however, proximity may reflect several possible considerations, including perceptual similarity, categorical associations, aesthetic balance, contrast, or individual organizational strategies. The relationship between color sorting and the development of color terminology further illustrates that the organization of color samples can be connected to categorical processes rather than determined exclusively by continuous perceptual differences [11]. Consequently, the spatial structure produced in a free-arrangement task should be understood as an observable organizational outcome, without assuming it represents a single perceptual or cognitive dimension. The possibility that color organization is influenced by visual experience introduces a further theoretical consideration. Human vision operates within environments characterized by statistical regularities in the distribution of luminance, contrast, spatial structure, and chromatic information. These regularities provide a framework for understanding how perceptual processing relates to the properties of the visual input encountered in everyday life [12]. Natural scenes exhibit measurable relationships among chromatic signals, including structured distributions of cone-excitation ratios and substantial variation in the number of perceptually distinguishable surface colors [13,14]. Relationships between perceptual color representations and natural image statistics, together with comparisons of chromatic distributions in paintings and natural scenes, further demonstrate that the statistical structure of visual material can be investigated across different environmental and representational contexts [15,16]. These findings provide a basis for considering the visual environment as a potentially relevant source of variation in color-related judgments, although environmental chromatic statistics and the organization of a color set remain distinct levels of analysis. The relationship between environmental exposure and color perception has also been investigated through direct measurements of the chromatic characteristics of everyday visual experience. Comparisons of individuals living in remote rainforest and urban environments, based on calibrated recordings of their visual surroundings, have identified differences in chromatic exposure and examined their relationship with color discrimination and preference [17]. This approach is particularly relevant because it characterizes the visual input encountered by individuals rather than relying exclusively on broad assumptions about their surroundings. At the same time, color discrimination, preference, and spatial organization are different empirical outcomes. Associations between environmental exposure and one of these outcomes cannot automatically be interpreted as evidence of corresponding effects on the others.
Environmental influences on visual processing may also extend beyond chromatic experience. Differences in attentional engagement and context-sensitive attention have been investigated in relation to urbanization and urban–rural living environments, indicating that environmental and developmental conditions may be associated with variation in visual-attentional behavior [18,19]. Such findings provide a broader context for examining the possible relationship between residential environment and visual organization. Nevertheless, urban and rural categories encompass heterogeneous visual environments, and their use as explanatory variables requires caution. The conventional distinction between natural and urban environments does not necessarily correspond to how environments are visually perceived or differentiated, highlighting the limitations of broad environmental classifications [20]. Residential context can therefore provide a useful basis for population comparisons, but it should not be regarded as a direct measure of individual chromatic exposure or as an independently established mechanism of perceptual difference.
The practical significance of relational color organization is particularly apparent in digital information environments, where users must identify relevant elements, distinguish categories, interpret status indicators, and navigate visually complex displays. In these contexts, the effectiveness of color combinations depends on their interaction with the characteristics of the task and the surrounding interface. Icon color combinations can influence performance under different levels of cognitive load, while background color, polarity, and saturation contribute to recognition and visual search performance [21,22]. Similar considerations arise in navigational information systems, where color combinations have been investigated in relation to visual search efficiency and user experience in metro electronic guide screens [21]. These applications demonstrate that color relationships have functional consequences within specific communication tasks, although the conditions that support effective performance may vary across interfaces and user requirements.
The organization of colors in interfaces also involves relationships between visual grouping, aesthetic coherence, and attentional selection. Research addressing harmonious color combinations and grouping has considered their relationship with search performance and interface aesthetics [23]. In parallel, investigations of color–color feature guidance in visual search have examined how combinations of color features contribute to attentional selection [24]. These findings illustrate the functional importance of relationships among visual attributes, while also emphasizing that aesthetic coherence, visual discrimination, and attentional guidance are not necessarily governed by identical organizational principles. The relevance of color combinations extends beyond screen-based interaction to graphic reproduction and the presentation of information across different media. Legibility in printed and digital formats depends on the selection of effective color combinations and their interaction with the conditions of presentation [25]. Comparable considerations arise in information visualization and environmental wayfinding, where colors may be required to support differentiation, grouping, hierarchy, and coherent interpretation within the same communication system. However, the functional effectiveness of a color arrangement must ultimately be evaluated in relation to the task for which it is intended. The identification of organizational regularities within a color set does not, by itself, demonstrate that those arrangements improve legibility, usability, or navigational performance.
A consistent stimulus set is also important when comparing how individuals organize colors. Standardized color collections, such as the ColorChecker chart originally developed for photographic color reproduction and evaluation, provide a defined set of stimuli that can be used across participants [26]. In an arrangement task, however, the physical and colorimetric characteristics of the stimuli must be distinguished from the spatial relationships produced by participants. The former describes the properties of the presented colors, whereas the latter characterize the configuration generated within the experimental procedure. This distinction is essential when interpreting spatial distances, particularly when the task does not explicitly require participants to organize colors according to perceptual similarity.
Taken together, these perspectives establish color organization as a phenomenon that can be examined at several interconnected levels. Research on color combinations addresses aesthetic and functional relationships; multidimensional and spatial-arrangement approaches provide methods for characterizing relational structures; investigations of environmental statistics and visual attention offer a basis for considering experiential influences; and applied studies demonstrate the importance of color relationships in communication systems. Although these research traditions share an interest in how colors are related, they address different constructs and employ different measurement procedures. Distinguishing perceptual similarity, categorical organization, aesthetic evaluation, attentional guidance, and freely generated spatial relationships is therefore necessary for a rigorous interpretation of color organization and its possible variation across individuals and residential environments.
Research Gap and Study Objectives
Existing research has established the importance of color relationships in perceptual judgments, aesthetic evaluation, and visual communication. However, these relationships have predominantly been investigated through predefined criteria, including perceived similarity, harmony, preference, and performance in specific visual tasks [3,25,27]. Although these approaches provide valuable insights into aspects of color organization, they offer a less direct account of the relational structures that emerge when individuals arrange a complete color set without an explicitly prescribed organizing principle. Spatial-arrangement methods provide an established framework for representing relationships among multiple stimuli, particularly when spatial proximity is used to express perceived similarity [7,8]. Nevertheless, the interpretation of these configurations depends on the instructions and measurement procedure, and spatial distances cannot automatically be regarded as direct measures of perceptual similarity [9,10]. In a free-arrangement task, the resulting configuration may reflect several organizational principles operating simultaneously. Its relational structure can therefore be examined as an observable property of the arrangement without attributing it to a single perceptual or cognitive mechanism.
An additional question concerns whether such relational structures are consistent across individuals and populations with different residential backgrounds. Research on environmental chromatic statistics, visual experience, and attentional processing suggests that environmental context may be associated with variation in color-related judgments and visual behavior [17,19]. However, the extent to which these associations are reflected in the relational organization of freely arranged colors remains insufficiently characterized. Furthermore, urban and rural residence represent broad contextual classifications rather than direct measures of individual chromatic exposure, requiring caution when interpreting potential between-group differences [20].
The present study examines the relational organization of 24 color stimuli freely arranged by 1000 adult participants from urban and rural populations. Participants were not instructed to arrange the colors according to similarity, harmony, preference, or any other predefined criterion. Each arrangement was represented by the complete set of 276 pairwise Euclidean spatial distances among the stimuli, allowing relational configurations to be analyzed without treating these distances as direct measures of perceptual color difference. The study pursues three objectives: (1) to characterize the relational structures emerging from free color arrangements and assess the stability of their aggregate organization; (2) to examine the correspondence between urban and rural consensus structures and identify potential differences associated with residential context; and (3) to evaluate the robustness of the observed patterns through alternative consensus estimators, resampling procedures, and assessments of the reproducibility of between-group contrasts.
By addressing these objectives, the study contributes a framework for describing and evaluating relational color organization under unconstrained arrangement conditions. Rather than identifying optimal color combinations or attributing observed spatial relationships to a particular perceptual mechanism, it focuses on the consistency, variability, and robustness of the organizational structures produced by participants. This approach provides an empirical foundation for subsequent investigations of the relationship between color organization, visual experience, and the design of color systems in visual communication.
2. Materials and Methods
2.1. Participants
The study included 1000 adult participants from Croatia, aged 18–64 years (M = 42.49, SD = 12.44). The sample comprised 496 men (49.6%) and 504 women (50.4%). Participants were recruited from an established participant database and invited to participate by email. Recruitment was organized to ensure broad geographic coverage across five regions of Croatia, while also seeking a balanced distribution of participants by sex and age. These characteristics were considered during sample recruitment to support demographic and geographic diversity; however, age, sex, and geographic region were not examined as independent explanatory variables in the present stage of the research. Data collection was conducted online, with participation restricted to desktop and laptop computers. Smartphones and tablets were not permitted. Participants who self-reported a color-vision deficiency were excluded. Current place of residence was recorded at the settlement level, together with the corresponding county, and used to classify participants according to urban or rural residence. Of the 1000 participants, 632 (63.2%) were classified as urban residents and 368 (36.8%) as rural residents. Although demographic and geographic information was collected, the primary analysis focused on residential classification. Geographic region was additionally used as a stratification variable in the permutation-based sensitivity analysis to account for differences in regional composition between the urban and rural groups. Age and sex were not included as covariates or examined as potential moderators of relational color organization in this study.
2.2. Stimuli and Free Color Arrangement Task
The stimulus set consisted of the 24 colors of the ColorChecker Classic, originally introduced as the Macbeth ColorChecker [26]. Originally developed as a reference for evaluating photographic color reproduction, the ColorChecker provides an established and heterogeneous collection of color samples. The stimuli were implemented using predefined hexadecimal color values corresponding to published sRGB reference specifications of the ColorChecker patches [28].
The 24 patches include colors associated with familiar natural objects and surfaces: Dark Skin (#735244), Light Skin (#C29682), Blue Sky (#627A9D), Foliage (#576C43), Blue Flower (#8580B1), and Bluish Green (#67BDAA). The additional chromatic samples comprise Orange (#D67E2C), Purplish Blue (#505BA6), Moderate Red (#C15A63), Purple (#5E3C6C), Yellow Green (#9DBC40), and Orange Yellow (#E0A32E), followed by Blue (#383D96), Green (#469449), Red (#AF363C), Yellow (#E7C71F), Magenta (#BB5695), and Cyan (#0885A1). The set also includes six approximately neutral patches: White (#F3F3F2), Neutral 8 (#C8C8C8), Neutral 6.5 (#A0A0A0), Neutral 5 (#7A7A79), Neutral 3.5 (#555555), and Black (#343434). The correspondence between the 24 stimulus identifiers (C1–C24), ColorChecker sample names, nominal sRGB hexadecimal values, and corresponding CIELAB coordinates is provided in Supplementary Table S1. These coordinates describe nominal digital stimulus specifications rather than colorimetric measurements of the participants’ displays.
The ColorChecker was selected to provide a standardized stimulus set encompassing a broad range of nominal color characteristics, including differences in hue, lightness, and saturation. Its relatively small number of samples also allowed all stimuli to be presented and manipulated simultaneously. In the present study, the chart was used as a source of color stimuli rather than for its conventional purpose of assessing color reproduction accuracy. The experiment did not involve colorimetric matching or the measurement of perceptual differences between the samples.
The task was administered through an online interface. All 24 color stimuli were presented simultaneously on the right side of the screen, while an empty 6 × 4 grid containing 24 positions was displayed on the left. Participants were instructed to arrange the colors within the grid according to their own choice. They could select any available color and place it in an unoccupied grid position, continuing until all 24 positions had been filled. Each completed arrangement therefore contained every stimulus exactly once. Importantly, participants were not instructed to group or order the colors according to perceptual similarity, hue, lightness, saturation, aesthetic harmony, preference, or any other predefined criterion. The task was intentionally unconstrained with respect to the organizing principle, allowing participants to determine the arrangement independently. Consequently, the resulting configurations were treated as expressions of spatial color organization rather than as direct measurements of any single perceptual or cognitive construct. Because data collection was conducted remotely, participants used their own desktop or laptop computers under uncontrolled viewing conditions. Individual displays were not calibrated or characterized, and differences in display technology, rendering settings, ambient illumination, and viewing conditions could influence the appearance of the stimuli. Although the hexadecimal values define the nominal digital specifications of the stimuli, they do not establish the colors reproduced by individual displays. Accordingly, the experiment does not support an absolute colorimetric interpretation of the displayed stimuli. The present analysis instead focuses on the spatial relationships established among the same 24 nominal color stimuli within each completed arrangement.
2.3. Construction of Individual Relational Matrices
Each completed color arrangement was converted into a relational representation based on the spatial positions of the 24 stimuli within the 6 × 4 grid. The grid positions were indexed by row and column, and the final position of each stimulus was represented by a coordinate pair (ri, ci), where ri denotes the row and ci the column occupied by stimulus i. For each participant, the spatial distance between every pair of stimuli was calculated using the Euclidean distance between their grid coordinates:
where d_{ij} represents the spatial distance between stimuli i and j, expressed in grid units. This procedure produced a symmetric 24 × 24 distance matrix for each participant, with zeros along the diagonal and 276 unique pairwise distances, calculated as 24(24 − 1)/2. Because every participant placed all 24 stimuli exactly once within the same fixed grid, the set of available spatial distances was identical across arrangements. Consequently, participants could not differ in the overall distribution of distances imposed by the grid geometry. Instead, their arrangements differed in which stimulus pairs occupied relative positions. The analysis therefore focused on how spatial relationships were distributed among color pairs rather than on the total spatial separation within an arrangement. Each participant’s matrix was represented by the 276 unique pairwise distances, providing a common relational representation for subsequent analyses. This approach preserved the spatial relationships among all stimuli without requiring the identification of predefined color groups, sequences, or organizational categories. Importantly, the calculated distances describe the spatial separation of stimuli within the completed arrangements, not their perceptual or colorimetric differences. A smaller distance indicates that two stimuli were placed closer together, but it does not establish that they were perceived as more similar in color. Likewise, a larger distance indicates greater spatial separation without identifying the perceptual or cognitive principle underlying that placement. The resulting relational matrices were therefore treated as observable representations of participants’ organizational choices. They provided the basis for constructing aggregate consensus structures, comparing urban and rural populations, and evaluating the stability and reproducibility of the observed relational patterns.
2.4. Consensus Structure and Multidimensional Scaling
To characterize the relational organization of the color stimuli at the group level, individual distance matrices were aggregated into consensus structures. For each of the 276 unique stimulus pairs, the corresponding Euclidean spatial distances were summarized across participants. This procedure produced a 24 × 24 consensus distance matrix representing the aggregate spatial relationships among the complete set of stimuli. The primary consensus estimator was the arithmetic mean. For each pair of stimuli i and j, the mean consensus distance was calculated as:
where denotes the spatial distance between stimuli i and j in participant p’s arrangement, and N is the number of participants included in the corresponding group. The resulting matrix describes the average spatial separation of each stimulus pair across participants.
As an alternative estimator, the median distance was calculated independently for each stimulus pair:
The median provides a complementary representation of the aggregate relational structure by reducing the influence of relatively extreme pairwise distances. Comparing mean- and median-based consensus structures therefore allows the sensitivity of the observed patterns to the choice of aggregation method to be examined.
Both consensus estimators were calculated for the complete sample (N = 1000) and separately for participants classified as urban (n = 632) and rural (n = 368). Each resulting matrix was symmetric, contained zeros along its diagonal, and retained the same ordering of the 24 stimuli, allowing direct comparisons across groups and estimators. Consensus matrices were interpreted as aggregate representations of spatial organization rather than as arrangements produced by any individual participant. Because distances were aggregated separately for each stimulus pair, the resulting matrices were not assumed to correspond to a physically realizable arrangement of all 24 stimuli within the original grid. Instead, they summarized the relative spatial relationships that emerged across multiple individual arrangements.
The mean consensus matrices provided the principal basis for descriptive characterization and urban–rural comparison. Median consensus matrices were used in complementary analyses to assess whether the observed correspondence and between-group differences remained consistent under an alternative aggregation procedure. This distinction was maintained in the subsequent permutation, resampling, and reproducibility analyses.
2.5. Descriptive Analysis and Multidimensional Scaling
The full-sample consensus matrix was examined to characterize the aggregate spatial relationships among the 24 color stimuli. Descriptive analyses included the range and overall mean of the 276 unique pairwise distances, together with between-participant variability in the spatial distance associated with each stimulus pair. These measures were used to identify color pairs that were consistently positioned relatively close together or farther apart, as well as pairs exhibiting greater variability across individual arrangements.
Classical multidimensional scaling (MDS) was applied to the mean consensus distance matrix to obtain a two-dimensional representation of the aggregate relational structure. MDS provides a framework for representing relationships among multiple stimuli based on a matrix of pairwise distances or dissimilarities [7]. In the present analysis, the first two dimensions were retained for graphical presentation, allowing the principal relationships contained in the consensus matrix to be inspected visually.
The proportion of the sum of positive eigenvalues accounted for by the first two dimensions was calculated to indicate how much of the positive-eigenvalue information was represented in the two-dimensional solution. This measure was used to describe the extent of dimensional reduction rather than to establish the existence of an underlying two-dimensional perceptual structure. The MDS configuration was interpreted exclusively as a descriptive visualization of the observed spatial relationships. Because participants arranged the stimuli freely within a discrete grid and were not instructed to evaluate perceptual similarity or dissimilarity, the resulting distances cannot be assumed to represent perceptual color differences. Accordingly, no perceptual, psychological, or colorimetric meaning was assigned to the MDS axes, and the configuration was not treated as a reconstruction of an underlying perceptual color space.
The visualization was therefore used to facilitate interpretation of the aggregate relational structure, complementing the numerical analysis of pairwise spatial distances without introducing assumptions about the specific organizational principles underlying participants’ arrangements.
2.6. Urban–Rural Consensus Comparison
Urban and rural consensus matrices were compared to assess the degree of correspondence between the relational structures observed in the two residential groups. Comparisons were performed separately for mean- and median-based consensus matrices, using the 276 unique pairwise spatial distances associated with the same color pairs in each group. Pearson correlation coefficients were calculated to evaluate the linear correspondence between urban and rural consensus distances. Spearman rank correlation coefficients were additionally calculated to assess the consistency of the relative ordering of color pairs according to their spatial distances. Together, these measures provided complementary descriptions of the similarity between the two consensus structures.
The magnitude of the between-group differences was quantified using the mean absolute difference (MAD) and root-mean-square (RMS) difference across corresponding stimulus pairs. The MAD was calculated as:
The RMS difference was calculated as:
where (d{ij,U}) and (d{ij,R}) denote the consensus spatial distances between stimuli (i) and (j) in the urban and rural groups, respectively. Both measures are expressed in grid units. Whereas MAD summarizes the average absolute difference across color pairs, RMS assigns relatively greater weight to larger differences.
These measures were used to characterize different aspects of between-group correspondence. High Pearson or Spearman correlations indicate that the two groups exhibit similar aggregate relational patterns, but do not establish that the corresponding distances are identical or statistically equivalent. Conversely, MAD and RMS quantify the magnitude of the observed differences without independently establishing whether those differences exceed what could be expected under random reassignment of residential-group labels. Accordingly, the descriptive comparison was complemented by participant-level permutation tests, described in Section 2.7, to evaluate the statistical evidence for differences between urban and rural consensus structures. The reproducibility of the observed between-group contrasts was subsequently examined through resampling procedures, as described in Section 2.8.
2.7. Participant-Level Permutation Tests
The statistical evidence for differences between urban and rural consensus structures was evaluated using participant-level permutation tests. The test statistic was the root-mean-square (RMS) difference between the corresponding urban and rural consensus matrices, calculated across all 276 unique stimulus pairs, as defined in Section 2.6. Permutation tests were conducted separately for mean- and median-based consensus structures to assess the sensitivity of the findings to the choice of aggregation method. In the unrestricted permutation procedure, residential-group labels were randomly reassigned among participants while preserving the original group sizes (632 urban and 368 rural). For each permutation, the urban and rural consensus matrices were recalculated from the reassigned participants, and the RMS difference between the resulting matrices was obtained. This procedure was repeated 9999 times to generate a reference distribution of RMS differences under random reassignment of residential-group labels. The observed RMS difference was compared with the permutation distribution to determine whether the between-group discrepancy was unusually large relative to the differences obtained under random reassignment. The permutation p-value was calculated as:
where T{\mathrm{obs}} denotes the observed RMS difference, Tb is the RMS difference obtained in permutation b, B = 9999 is the number of permutations, and I(\cdot) is an indicator function taking the value 1 when the permuted statistic is greater than or equal to the observed statistic and 0 otherwise.
Because the proportions of urban and rural participants varied across the geographic regions represented in the sample, an additional region-stratified permutation procedure was performed. In this analysis, residential-group labels were randomly reassigned only among participants belonging to the same geographic region. This preserved the observed numbers of urban and rural participants within each region while generating alternative group assignments. As in the unrestricted procedure, consensus matrices and their RMS differences were recalculated for each of 9999 permutations. The unrestricted and region-stratified procedures address related but distinct questions. The unrestricted analysis evaluates the observed difference against a reference distribution generated without conditioning on geographic region. The stratified analysis evaluates the difference while preserving the regional composition of the residential groups, thereby reducing the potential influence of differences in regional representation on the permutation comparison.
Both procedures were applied independently to mean- and median-based consensus matrices. The resulting permutation p-values were interpreted alongside the descriptive correspondence measures and the subsequent resampling analyses rather than as standalone evidence of a residential-group effect. These tests evaluate the evidence for differences under their respective exchangeability assumptions. They do not establish statistical equivalence between urban and rural populations, and a nonsignificant result cannot be interpreted as demonstrating the absence of a residential-group association. Furthermore, because residential classification was observational rather than experimentally assigned, the permutation analyses do not support causal conclusions regarding the effects of the living environment on relational color organization.
2.8. Consensus Stability and Reproducibility of Group Contrasts
Resampling analyses were conducted to assess the stability of consensus relational structures and the reproducibility of differences between urban and rural participants. These analyses addressed two distinct aspects of reliability: the consistency of aggregate spatial relationships within each residential group and the extent to which the observed between-group contrasts could be replicated across independent participant subsets. Within-group consensus stability was evaluated using repeated split-half sampling. For each iteration, participants within the urban and rural groups were randomly divided into two non-overlapping subsets. Median consensus distance matrices were calculated independently for each subset, and their correspondence was assessed using Pearson correlation coefficients across the 276 unique stimulus pairs. This procedure was repeated 1000 times for each residential group, producing distributions of split-half correlations that characterized the stability of the aggregate relational structures. A separate split-half analysis was performed to assess the reproducibility of urban–rural differences. In each iteration, the urban and rural samples were independently divided into two non-overlapping subsets. Urban and rural consensus matrices were calculated for each set of subsets, and the corresponding between-group difference vectors were obtained by subtracting rural consensus distances from urban consensus distances for all 276 stimulus pairs.
To assess the reproducibility of the urban–rural difference pattern, participants within each residential group were randomly divided into two non-overlapping subsets. Urban–rural consensus differences were calculated independently for the two subsets, yielding two vectors of 276 corresponding pairwise-distance contrasts. Reproducibility was evaluated using Pearson correlation to quantify linear correspondence between the contrast vectors and Spearman rank correlation to assess the consistency of their relative ordering. In addition, sign agreement was calculated as the proportion of stimulus pairs for which the urban–rural differences had the same direction in both subsets. These measures were summarized across repeated random splits. This analysis distinguished the stability of the consensus structures within each residential group from the reproducibility of the differences between groups.
The distinction between consensus stability and contrast reproducibility is important because a highly stable aggregate structure does not necessarily imply that small differences between groups are themselves reliable. Two residential groups may exhibit strongly corresponding and internally stable consensus structures while the pairwise differences between them remain sensitive to participant sampling.
Accordingly, the within-group split-half analysis was used to evaluate the reliability of the estimated consensus organization, whereas the between-group split-half analysis assessed the reproducibility of the residential-group contrast pattern. These complementary procedures provided an additional basis for interpreting the urban–rural comparison beyond the magnitude of the observed differences and their permutation-based statistical significance.
2.9. Bootstrap Analysis and Interpretation of Statistical Evidence
Bootstrap resampling was used to characterize the sampling variability associated with the magnitude of the urban–rural differences in both mean- and median-based consensus structures. Participants were resampled with replacement separately within the urban and rural groups, preserving the original sample sizes of 632 and 368 participants, respectively. For each bootstrap sample, mean and median consensus distance matrices were calculated separately for both groups, and the root-mean-square (RMS) difference between the corresponding 276 pairwise distances were obtained for each estimator. This procedure was repeated 5000 times, generating separate bootstrap distributions of RMS differences for mean- and median-based consensus structures. The 2.5th and 97.5th percentiles of each bootstrap distribution were used to summarize the variability of the corresponding RMS statistic. Because RMS is a non-negative measure and may be affected by sampling-induced upward bias, these percentile ranges were interpreted cautiously as descriptions of bootstrap variability rather than as evidence of statistical equivalence or as direct tests of the absence of between-group differences.
Attention was given to the distinction between the stability of aggregate relational structures and the reproducibility of between-group contrasts. Strong correspondence between urban and rural consensus matrices, or high within-group split-half reliability, was not considered sufficient evidence that the groups were equivalent. Similarly, a statistically significant permutation result was not interpreted as establishing a robust residential-group effect without considering its sensitivity to the consensus estimator, permutation scheme, and reproducibility of the underlying difference pattern. Because the study was observational, residential classification was treated as a contextual grouping variable rather than a direct measure of individual environmental exposure. Consequently, the analyses were not designed to establish a causal relationship between residential environment and relational color organization. Nonsignificant permutation results were likewise not interpreted as evidence that such a relationship was absent.
Taken together, these complementary procedures were intended to provide a cautious assessment of the consistency, magnitude, statistical evidence, and reproducibility of relational color organization across urban and rural populations.
3. Results
The results are presented in three stages. First, the consensus relational structure is characterized using pairwise spatial distances and multidimensional scaling. Second, urban and rural consensus structures are compared to assess their correspondence and the magnitude of between-group differences. Finally, permutation and resampling analyses are used to evaluate the statistical evidence, stability, and reproducibility of the observed patterns.
3.1. Consensus Relational Structure
Each of the 1000 completed color arrangements yielded 276 unique pairwise spatial distances among the 24 color stimuli. Averaging the corresponding distances across participants produced the consensus matrix presented in Figure 1. Mean pairwise distances ranged from 1.517 to 3.899 grid units, with an overall mean of 2.686. These values indicate that the aggregate spatial relationships were not uniformly distributed across color pairs. Some stimuli tended to be positioned relatively close together, whereas others were more frequently separated within the grid. To facilitate examination of the overall relational structure rather than individual color identities, the stimuli were consistently labeled C1–C24 throughout the analysis and visualizations.
Figure 1.
Consensus matrix of mean pairwise spatial distances among the 24 color stimuli across all participants (N = 1000). Each cell represents the mean Euclidean distance between a pair of stimuli in grid units, with smaller values indicating closer average placement and larger values indicating greater average separation.
The consensus structure did not imply uniformity across individual arrangements. Between-participant standard deviations of spatial distance ranged from 0.804 to 1.528 grid units across the 276 stimulus pairs, with a mean of 1.163. These values indicate substantial variability in the spatial relationships established by individual participants, despite the differentiated relational pattern observed at the aggregate level. Classical multidimensional scaling provided a complementary visualization of the mean consensus structure (Figure 2). The first two dimensions accounted for 31.42% of the sum of positive eigenvalues, indicating that the two-dimensional configuration captured only part of the relational information contained in the complete 24 × 24 consensus matrix. The resulting configuration was therefore treated as a reduced descriptive representation rather than a complete reconstruction of the observed relationships. As specified in the methodological framework, neither the axes nor the positions of individual stimuli were assigned perceptual, psychological, or colorimetric interpretations. The same C1–C24 labels were retained to maintain consistency with the consensus matrix.
Figure 2.
Two-dimensional classical multidimensional scaling (MDS) representation of the full-sample mean consensus distance matrix. Distances between points approximate the aggregate spatial relationships among the 24 color stimuli. The first two dimensions account for 31.42% of the sum of positive eigenvalues. The axes are not assigned perceptual or colorimetric interpretations.
3.2. Urban–Rural Concordance
Separate mean consensus matrices were calculated for the 632 urban and 368 rural participants. The two structures showed a high degree of correspondence across the 276 unique stimulus pairs, with a Pearson correlation coefficient of r = 0.975 and a Spearman rank correlation coefficient of ρ = 0.947. The relationship between the urban and rural mean consensus distances is illustrated in Figure 3.
Figure 3.
Concordance between urban and rural mean consensus structures across the 276 unique stimulus pairs. Each point represents the mean spatial distance for a particular stimulus pair among urban participants and the corresponding mean distance among rural participants. The diagonal reference line indicates identical mean distances in the two groups. Distances are expressed in grid units, grey dots representing urban and black dots rural.
The absolute differences between the two consensus matrices were relatively small compared with the range of mean distances observed in the full-sample structure. The mean absolute difference across stimulus pairs was 0.0608 grid units, while the root-mean-square (RMS) difference was 0.0786 grid units. The largest absolute difference for an individual stimulus pair was 0.2877 grid units. Taken together, these descriptive measures indicate that urban and rural participants produced closely corresponding aggregate relational structures, although differences were observed for individual stimulus pairs. The high correlations indicate substantial agreement in the overall pattern and relative ordering of pairwise spatial distances, whereas the difference measures quantify the magnitude of the observed discrepancies. However, descriptive correspondence does not establish statistical equivalence between the two residential groups. Nor do the observed differences independently demonstrate a systematic association between residential classification and relational color organization. The statistical evidence for the urban–rural difference was therefore evaluated using participant-level permutation tests, beginning with the unrestricted analysis presented in Section 3.3.
3.3. Global Permutation Test
The observed root-mean-square (RMS) difference between the urban and rural mean consensus matrices was 0.0786 grid units. Its statistical significance was evaluated against a permutation distribution generated from 9999 random reassignments of residential-group labels at the participant level, while preserving the original group sizes.
The permutation distribution had a median RMS difference of 0.0761 grid units, with an interquartile range of 0.0728–0.0797. The observed RMS difference fell within this distribution (Figure 4), yielding a permutation p-value of 0.3216.
Figure 4.
Permutation distribution of the RMS difference between urban and rural mean consensus matrices, obtained from 9999 unrestricted participant-level permutations of residential-group labels. The vertical reference line indicates the observed RMS difference of 0.0786 grid units.
The observed difference between the urban and rural mean consensus structures was therefore not statistically distinguishable from the differences generated under random reassignment of residential-group labels. Although individual stimulus pairs exhibited differences in their mean spatial distances, the unrestricted permutation test did not provide statistically significant evidence of an overall association between residential classification and the mean consensus relational structure.
This result does not establish equivalence between the two residential groups or exclude the possibility of smaller or more localized differences. The sensitivity of the finding to geographic composition and the choice of consensus estimator was examined in the subsequent analyses.
3.4. Sensitivity to Regional Composition
The proportions of urban and rural participants differed across the geographic regions represented in the sample. To assess the sensitivity of the primary finding to these differences in regional composition, the permutation analysis was repeated with residential-group labels reassigned exclusively among participants within the same geographic region. This procedure preserved the observed numbers of urban and rural participants within each region across all 9999 permutations. The region-stratified permutation distribution had a median RMS difference of 0.0758 grid units, with an interquartile range of 0.0724–0.0793. The observed RMS difference between the urban and rural mean consensus matrices remained 0.0786 grid units and fell within the stratified permutation distribution, yielding a p-value of 0.2969. The stratified analysis therefore produced a result consistent with the unrestricted permutation test (p = 0.3216). Preserving the regional composition of the residential groups did not materially alter the statistical evidence concerning the overall difference between their mean consensus structures. These findings indicate that the observed global RMS difference was not statistically significant under either permutation procedure. However, the consistency of the two results does not establish equivalence between urban and rural populations, nor does it exclude differences that may be detectable using alternative representations of the relational structure. The sensitivity of the findings to the consensus estimator was therefore examined in the subsequent analysis.
3.5. Sensitivity to Consensus Estimation
To assess the sensitivity of the urban–rural comparison to the method of aggregation, the analysis was repeated using median rather than mean pairwise spatial distances. The median-based consensus structures remained strongly correlated across the two residential groups, although their correspondence was lower than that observed with mean aggregation. Pearson’s correlation decreased from 0.975 for the mean consensus matrices to 0.904 for the median consensus matrices. Similarly, the RMS difference increased from 0.0786 to 0.2388 grid units.
The permutation analyses also revealed differences between the two consensus estimators. For mean-based consensus structures, neither the unrestricted permutation test (p = 0.3216) nor the region-stratified permutation test (p = 0.2969) provided statistically significant evidence of an overall urban–rural difference. In contrast, the median-based analysis yielded an unrestricted permutation p-value of 0.0517 and a region-stratified p-value of 0.0328. The latter result crossed the conventional 0.05 significance threshold, whereas the unrestricted result remained slightly above it.
The correspondence between urban and rural consensus distances under both aggregation methods is illustrated in Figure 5. The comparison shows that the degree of agreement between the residential groups depends partly on how individual spatial distances are summarized. Although both estimators indicate substantial correspondence between the aggregate relational structures, median aggregation produces a larger observed discrepancy and a different pattern of permutation results. These findings demonstrate that the statistical evidence for an urban–rural difference is sensitive to the consensus estimator and permutation scheme. The nominally significant result obtained for the region-stratified median analysis should therefore be interpreted alongside the nonsignificant results obtained under the other analytical specifications. The reproducibility of the corresponding between-group differences is examined in the following section.
Figure 5.
Comparison of urban and rural consensus relational structures using two aggregation methods: (A) arithmetic mean and (B) median. Each point represents one of the 276 unique pairs of color stimuli, with the urban consensus distance plotted on the horizontal axis and the corresponding rural consensus distance on the vertical axis. Dashed diagonal lines indicate identical distances between the two residential groups. Pearson correlation coefficients were 0.975 for mean-based consensus and 0.904 for median-based consensus, while the corresponding root-mean-square (RMS) differences were 0.0786 and 0.2388 grid units, respectively. All distances are expressed in grid units.
3.6. Consensus Stability and Reproducibility of Urban–Rural Contrasts
The stability of the median-based consensus relational structures was assessed through 1000 random split-half repetitions conducted separately within the urban and rural groups. In each repetition, the participants in a given group were divided into two subsets, and the corresponding consensus structures were independently estimated and compared using Pearson correlation coefficients. The urban group exhibited a median split-half correlation of 0.906, with a 2.5th–97.5th percentile range of 0.885–0.925. The corresponding median correlation for the rural group was 0.879, with a percentile range of 0.850–0.900. These results indicate that the overall relational organization was consistently recovered across independent subsets of participants in both residential groups. The somewhat lower stability observed in the rural group should be considered in relation to its smaller sample size (n = 368, compared with n = 632 for the urban group). The reproducibility of the urban–rural difference was evaluated separately using 2000 split-half repetitions. For each repetition, independently estimated urban–rural contrast vectors were compared to determine whether the differences between corresponding stimulus pairs were consistently reproduced across sample subsets. The median Pearson correlation between contrast vectors was 0.085, with a 2.5th–97.5th percentile range of −0.064 to 0.223. The median Spearman correlation was 0.110, with a corresponding percentile range of −0.027 to 0.238. The median proportion of stimulus pairs exhibiting the same direction of difference across independent contrasts was 0.607.
These results reveal a marked distinction between the stability of the consensus structures and the reproducibility of the differences between them. Although the aggregate relational patterns were relatively stable within both residential groups, the specific urban–rural differences were only weakly reproduced across independent sample splits. Figure 6 illustrates this distinction through the distributions of within-group consensus correlations and between-group contrast correlations.
Figure 6.
Split-half stability of consensus relational structures and reproducibility of urban–rural contrasts. (A) Distributions of Pearson correlations between independently estimated median consensus structures within urban and rural groups, based on 1000 random split-half repetitions per group. (B) Distribution of Pearson correlations between independently estimated urban–rural difference vectors across 2000 split-half repetitions. Dashed vertical lines indicate the median correlations. The panels use separate horizontal scales to accommodate the different correlation ranges.
The weak reproducibility of the urban–rural contrast is particularly relevant to the estimator-sensitive findings reported in Section 3.5. Although the region-stratified permutation test identified a nominally significant difference under median aggregation, the split-half results indicate that the detailed pattern of between-group differences was not consistently recovered across independent subsets of participants. Accordingly, the observed median-based difference should be interpreted cautiously rather than as evidence of a robust and reproducible residential-group effect.
3.7. Bootstrap Analysis and Uncertainty of Urban–Rural Differences
The uncertainty associated with the observed urban–rural differences was further examined using 5000 participant-level bootstrap resamples drawn independently within each residential group. For each resample, the urban and rural consensus structures were recalculated, and the root-mean-square (RMS) difference between the corresponding pairwise spatial distances was obtained. Bootstrap analyses were conducted for both mean-based and median-based consensus estimators. For the mean-based consensus structures, the observed RMS difference was 0.0786 grid units. The bootstrap distribution had a mean of 0.1095 and a median of 0.1089 grid units, with a 95% percentile interval of 0.0958–0.1259 grid units. The distribution was therefore displaced toward higher RMS values relative to the observed statistic, as illustrated in Figure 7.
Figure 7.
Bootstrap distribution of the root-mean-square (RMS) difference between urban and rural mean consensus relational structures, based on 5000 participant-level bootstrap resamples within residential groups. The solid vertical line indicates the observed RMS difference (0.0786 grid units), while the dashed vertical lines mark the 2.5th and 97.5th percentiles of the bootstrap distribution (0.0958–0.1259 grid units) while distances are expressed in grid units.
A similar pattern was observed for the median-based consensus structures. The observed RMS difference was 0.2388 grid units, whereas the bootstrap distribution had a mean of 0.2639 and a median of 0.2641 grid units. The corresponding 95% percentile interval extended from 0.2341 to 0.2939 grid units. The estimated bootstrap bias, calculated as the difference between the bootstrap mean and the observed statistic, was 0.0251 grid units. Thus, the median-based analysis also exhibited an upward displacement of the resampled RMS estimates, although its observed value remained within the percentile interval. The displacement of the bootstrap distributions is relevant to the interpretation of these results. RMS is a nonnegative measure of discrepancy, and variability introduced through independent resampling of the two residential groups can increase the expected distance between their estimated consensus structures. Consequently, a percentile interval obtained directly from the bootstrap distribution of RMS differences should not be interpreted as a hypothesis test against zero difference. In particular, the position of the observed mean-based RMS difference below the lower percentile bound does not establish a statistically significant residential-group effect.
The bootstrap analyses therefore characterize the sampling variability and estimator sensitivity of the observed discrepancies, but do not independently establish either a systematic urban–rural difference or statistical equivalence between the groups. Considered alongside the permutation and split-half analyses, the results indicate that the mean-based consensus structures were highly concordant and showed no statistically significant global difference under the tested permutation schemes. Median-based aggregation produced a larger observed discrepancy and a nominally significant region-stratified permutation result, but the weak reproducibility of the urban–rural contrast limits the strength of the evidence for a stable residential-group effect.
4. Discussion
The present study examined whether the relational organization of colors in a free-arrangement task differed between participants from urban and rural environments. Across 1000 participants, the arrangements revealed a differentiated pattern of spatial relationships among the 24 color stimuli, despite considerable variation between individual arrangements. The mean consensus structures of the urban and rural groups were highly concordant (r = 0.975; ρ = 0.947), and their overall difference was relatively small. Neither the unrestricted permutation test (p = 0.3216) nor the region-stratified analysis (p = 0.2969) provided statistically significant evidence of a global difference between the mean consensus structures. The additional analyses, however, suggest a more nuanced interpretation than the mean-based comparison alone would allow. Median aggregation produced a larger discrepancy between the residential groups, with the region-stratified permutation test yielding a nominally significant result (p = 0.0328). This finding was not consistently supported across analytical specifications, and the split-half analyses showed that the detailed pattern of urban–rural differences was only weakly reproducible. By contrast, the consensus structures themselves remained relatively stable when estimated from independent subsets of participants. The distinction between the stability of an overall relational pattern and the reproducibility of differences within that pattern is therefore central to interpreting the findings. Taken together, the results suggest that urban and rural participants shared much of the aggregate relational organization expressed in this particular arrangement task. This should not be taken to mean that residential environment is unrelated to color perception or visual experience. The study did not directly measure environmental exposure, and the absence of a statistically significant difference in the primary analysis does not establish equivalence between the two populations. Rather, the findings indicate that the broad relational pattern was similar across residential groups, while the evidence for a systematic and reproducible difference remained sensitive to the analytical approach. Understanding this distinction requires consideration of both the structure imposed by the arrangement task and the ways in which environmental experience might influence the organization of visual information.
4.1. Robustness of Relational Color Organization
An important aspect of the present study is that color organization was examined through relationships among stimuli rather than through the positions or characteristics of individual colors. Each arrangement yielded 276 pairwise spatial distances, allowing the organization of the complete stimulus set to be examined as an interconnected relational structure. This approach provides information about which colors participants tended to place closer together or farther apart, without requiring an explicit judgment of perceptual similarity. The geometry of the arrangement task is particularly relevant to the interpretation of these relationships. Because all participants placed the same 24 stimuli within a fixed 6 × 4 grid, the set of available spatial distances was identical across arrangements. Differences between participants could therefore arise from the assignment of colors to positions, rather than from differences in the overall spatial extent of the configurations. Similarly, differences between urban and rural consensus structures would reflect changes in the distribution of spatial relationships among stimulus pairs, not a general expansion or contraction of the arrangement. The high correspondence between the mean consensus matrices suggests that this distribution was broadly similar across the two residential groups. The split-half analyses provide additional support for the stability of the aggregate relational structure. Independently estimated median consensus matrices showed relatively high correlations within both urban and rural groups, indicating that the main pattern of relationships could be recovered from different subsets of participants. At the same time, the weaker reproducibility of the urban–rural contrast suggests that the differences between the two group-level structures were less stable than the structures themselves. This distinction is important because a consistent aggregate pattern can coexist with small, variable differences between populations. The results therefore support the reproducibility of the broad relational organization more strongly than they support a specific residential-group effect.
Nevertheless, the stability of the consensus structures should not be confused with uniformity in individual arrangements. Participants differed considerably in the spatial relationships they established, and the consensus matrices represent an aggregate tendency rather than a configuration consistently reproduced by every individual. The resulting structure emerges from many distinct arrangements and should be interpreted at that level. This is particularly relevant for free-arrangement methods, where participants may rely on different organizing principles even when their responses produce similar aggregate patterns. Spatial arrangement methods offer a practical means of examining relationships among relatively large sets of stimuli, but the resulting configurations depend on both participants’ judgments and the constraints of the task [7]. In the present experiment, participants were not instructed to arrange the colors according to perceptual similarity, hue, brightness, preference, or any other specified criterion. Consequently, the observed spatial distances cannot be treated as direct estimates of perceptual color differences. They describe how participants organized the stimulus set under the conditions of the task, potentially drawing on several perceptual, cognitive, or associative principles.
The principal contribution of this relational approach is therefore not the identification of a single underlying color dimension or a universal arrangement of the stimuli. Rather, it lies in demonstrating that a recognizable aggregate pattern can emerge from unconstrained individual arrangements and remain relatively stable across independent subsets of participants. The limited reproducibility of the observed urban–rural differences further illustrate why the stability of a consensus structure and the robustness of a between-group contrast should be evaluated separately.
4.2. Environmental Visual Experience
The distinction between urban and rural environments provided the theoretical basis for the comparison undertaken in this study. Everyday visual experience is shaped, at least in part, by the physical and chromatic characteristics of the environments in which individuals live and interact. Natural landscapes, vegetation, architectural surfaces, transportation infrastructure, commercial signage, and artificial lighting contribute to visual scenes with different distributions of colors, contrasts, and spatial features. Previous research has demonstrated that the chromatic statistics of natural and built environments can be described quantitatively and that these statistics vary with scene content and environmental conditions. Such differences provide a plausible basis for considering whether repeated exposure to environmental regularities might influence how people attend to, interpret, or organize visual information. However, the existence of differences between visual environments does not necessarily imply corresponding differences in every aspect of color-related behavior. Environmental experience may influence visual processing through several mechanisms, including perceptual adaptation, attentional learning, familiarity with objects and scenes, and the development of associations between colors and their typical contexts. These mechanisms operate at different levels and need not produce the same behavioral outcomes. A change in the perceived salience or familiarity of a particular color, for example, does not necessarily imply a change in how that color is positioned relative to an entire set of other colors. This distinction is especially important in the present study, where participants were asked to organize 24 stimuli simultaneously rather than evaluate individual colors in isolation.
Research on environmental influences on visual attention and processing provides further grounds for considering residential context as a potentially relevant factor. Nevertheless, findings concerning attentional behavior, scene perception, or visual experience cannot be assumed to extend directly to the relational organization of color stimuli. The processes involved in interpreting a complex visual scene differ from those involved in arranging a fixed set of color patches on a grid. In the latter task, participants may rely on perceptual resemblance, categorical distinctions, learned associations, or a combination of organizing principles. Consequently, environmental differences that affect one form of visual processing may have a weaker, more selective, or qualitatively different influence on another. Against this background, the strong correspondence between the urban and rural mean consensus structures is informative, although it requires careful interpretation. If residential context were associated with a substantial reorganization of the relationships among the complete stimulus set, this would be expected to appear as a systematic redistribution of pairwise spatial distances between the two groups. The primary analysis did not reveal such a difference beyond that expected under participant-level permutation. At the same time, the median-based analysis suggested some sensitivity to the choice of consensus estimator, while the split-half results indicated that the detailed pattern of urban–rural differences were weakly reproducible. The findings therefore offer stronger support for the presence of a broadly shared aggregate organization than for either the complete absence or the consistent presence of an environmental effect.
One possible interpretation is that the relational structure observed in this task is influenced by constraints and experiences that are widely shared across the two residential groups. Basic properties of color appearance, common conventions of color categorization, exposure to manufactured objects and digital media, and similarities in the cultural environment may all contribute to patterns of organization that extend across residential contexts. The fixed stimulus set and the geometry of the arrangement task may also favor certain relational configurations. These possibilities are not mutually exclusive, and the present data do not establish their relative contributions. The stability of the consensus structures should therefore be understood as a property of the observed responses under the experimental conditions, rather than as evidence that relational color organization is independent of learning or environmental experience.
A further consideration concerns the relationship between residential classification and actual visual exposure. Urban and rural environments are not internally homogeneous categories. Individuals living in the same type of settlement may encounter substantially different visual surroundings depending on their occupation, mobility, daily activities, access to green spaces, and use of digital media. Conversely, participants from different residential categories may share considerable portions of their visual experience. Current place of residence also provides limited information about childhood environment, previous residential history, or the duration and intensity of exposure to visual conditions. As a result, urban–rural classification can serve as a useful contextual comparison without functioning as a direct measure of the environmental properties that might influence color organization.
This limitation has implications for interpreting both the strong overall correspondence and the smaller differences observed under median aggregation. A weak association with residential classification does not exclude the possibility that more precisely measured aspects of visual experience are related to color relationships. Such associations might concern specific stimulus pairs, subsets of colors, or individual organizing strategies rather than the complete consensus structure. Conversely, an apparent difference between residential groups cannot be attributed to environmental adaptation without evidence linking participants’ actual visual histories to their responses.
Future research could address these questions by combining free-arrangement tasks with more direct measures of environmental exposure. Quantitative descriptions of the chromatic characteristics of participants’ everyday surroundings, information about residential history, and measures of visual-media exposure would permit more specific hypotheses than a binary residential comparison. Repeated measurements or experimentally controlled exposure could also help distinguish relatively stable organizing tendencies from responses influenced by recent visual experience. These approaches would make it possible to investigate whether environmental regularities are associated with relational features while retaining the broader structural perspective developed in the present study.
The present findings thus suggest that differences in residential context, as operationalized here, were not associated with a robust reorganization of the overall relational structure of the color arrangements. They do not diminish the theoretical relevance of environmental visual experience. Rather, they indicate that its potential influence should be examined at an appropriate level of specificity, with greater attention to the distinction between environmental categories, actual exposure, and the different perceptual and cognitive processes through which colors may be organized.
4.3. Implications for Visual Communication and UX Design
The relational perspective adopted in this study is particularly relevant to visual communication and user experience design, where colors rarely function as isolated elements. Digital interfaces, information graphics, navigation systems, and other forms of visual communication commonly employ multiple colors within a shared visual context. Their effectiveness depends not only on the properties of individual colors but also on the relationships established between them. Colors may distinguish categories, indicate functional states, establish visual hierarchy, or support the grouping of related information [29]. Understanding how users organize colors in relation to one another may therefore offer an additional perspective on the design and evaluation of such systems. Conventional approaches to color selection often emphasize measurable color differences, contrast relationships, established harmonies, and compliance with accessibility requirements. These considerations remain essential, particularly where legibility, visibility, and the reliable identification of information are concerned. However, colorimetric separation does not necessarily describe how users interpret relationships among several colors presented simultaneously. Two colors may be sufficiently distinguishable while still being perceived as belonging to the same category or functional group. Conversely, colors that are visually similar may acquire different meanings through their associations with objects, conventions, or interface functions. Relational arrangement data could complement established colorimetric and usability measures by providing information about the organization that emerges when users consider an entire set of colors rather than isolated pairs.
The high correspondence between the urban and rural mean consensus structures is relevant in this context because many visual communication systems are intended for audiences with different environmental backgrounds. The findings suggest that a substantial part of the aggregate relational organization observed in the present task was shared across the two residential groups. This provides a basis for investigating whether some relational patterns might also be recognizable across heterogeneous user populations. Nevertheless, the estimator-sensitive differences and their limited reproducibility caution against treating the observed consensus as a universal or culturally independent structure. The present results concern a particular stimulus set, task, and participant sample; their generalizability to other populations and design contexts remains to be established.
One potential application concerns the organization of categorical information in digital interfaces and data visualizations. When several colors are used to represent categories, their relationships may influence whether users interpret those categories as distinct, related, or hierarchically organized. Experimentally derived relational information could be used to construct alternative color systems that either preserve or deliberately modify relationships identified through free-arrangement tasks. For example, a visualization could be designed so that colors assigned to conceptually related categories correspond to pairs that participants tended to place near one another, while another version could use a different relational organization. Comparing these alternatives would make it possible to examine whether correspondence between perceived color relationships and conceptual structure affects the interpretation of information [30].
A similar approach could be considered in navigation and wayfinding systems, where color is frequently used to identify routes, zones, destinations, or levels of information. In these settings, effective communication requires more than the ability to distinguish individual colors. Users must also recognize consistent associations, understand the organization of the system, and retrieve relevant information under varying viewing conditions. Relational color data might help formulate hypotheses about how different sets of route or category colors are mentally organized. However, such applications would require dedicated evaluation, particularly because the demands of navigation, including visibility, rapid identification, and accessibility, differ substantially from those of an unconstrained arrangement task. The distinction between descriptive organization and functional performance is therefore fundamental. The present experiment did not measure visual-search efficiency, recognition accuracy, response times, cognitive workload, or usability. Nor did it establish that preserving the observed consensus relationships would improve performance. These outcomes would need to be investigated experimentally. One possible approach would be to develop otherwise equivalent interfaces or information displays using color assignments derived from the observed relational structure and compare them with assignments based on alternative principles. Measures of task completion time, error rates, visual-search behavior, eye movements, and perceived organization could then be used to determine whether the relational properties identified in the arrangement task have measurable consequences for interaction [7].
Such experiments should also consider the distinction between perceptual organization and learned meaning. In practical communication systems, colors often carry established semantic associations that may reinforce or override relationships observed in a free-arrangement task. The interpretation of a warning color, for example, depends not only on its visual properties but also on conventions, context, and prior experience. Relational color organization should consequently be treated as one potential component of a broader design framework rather than as a substitute for semantic consistency, accessibility assessment, or user testing [31]. The methodological contribution of the present study lies in providing a way to describe and compare the relational organization of a complete color set. The resulting matrices can be examined alongside conventional colorimetric measures and, in future studies, linked to behavioral indicators of visual communication performance. This would allow researchers to test whether relational patterns support information grouping, category differentiation, or the interpretation of visual hierarchy. The value of the approach is therefore not that it directly prescribes effective color combinations, but that it offers an empirical basis for developing and evaluating hypotheses about how multiple colors function together in designed visual systems.
4.4. Limitations and Future Research
Several limitations should be considered when interpreting the findings and assessing their applicability beyond the conditions of the present experiment. These concern the presentation of color stimuli, the characterization of environmental experience, the constraints of the arrangement task, and the statistical interpretation of differences between consensus structures. Although the study provides evidence of a relatively stable aggregate relational organization, these methodological considerations define the extent to which the observed patterns can be generalized or attributed to perceptual and environmental mechanisms.
An important limitation arises from the online experimental setting. Participants completed the task using their own desktop or laptop computers, without calibration or standardization of display characteristics and viewing conditions. Differences in display technology, color management, screen settings, ambient illumination, and viewing geometry may therefore have influenced the appearance of individual stimuli. The nominal color values used to construct the stimulus set cannot be assumed to have produced identical colorimetric outputs across participants. Consequently, the observed arrangements should not be interpreted as responses to precisely controlled colorimetric stimuli. Nevertheless, all 24 colors were presented within the same display environment for each participant, allowing the analysis to focus on their relative spatial organization rather than on absolute color appearance. This does not eliminate the influence of display variability, which may also affect relationships among simultaneously presented colors, but it places the findings within the context of heterogeneous viewing conditions characteristic of many everyday digital interactions. The use of urban and rural residence as an indicator of environmental experience introduces a second limitation. Although residential context provides a theoretically relevant basis for comparison, it does not directly describe the visual environments encountered by individual participants. People living within the same residential category may differ substantially in their daily activities, mobility, occupational environments, exposure to natural and built surroundings, and use of digital media. Furthermore, current residence does not necessarily reflect the environments experienced during childhood or earlier stages of life. The present study therefore cannot determine whether exposure to environmental color distributions contributed to the observed arrangements. Future investigations could combine residential information with measures of environmental history and quantitative characterization of everyday visual surroundings. Calibrated photographic sampling, analysis of environmental chromatic distributions, and longitudinal information about visual exposure would provide a more direct basis for examining the relationship between environmental experience and relational color organization.
The selection of stimuli and the geometry of the arrangement task also constrain the interpretation of the results. The 24 ColorChecker Classic stimuli provide a standardized and reproducible set of colors, but they represent only a limited sample of the chromatic variation encountered in natural scenes, manufactured objects, and designed communication systems. Different stimulus sets, including those selected to represent color categories or application contexts, might produce different relational patterns. Similarly, the fixed 6 × 4 grid restricts participants to a finite number of positions and spatial distances. Because each position must be occupied by exactly one stimulus, the geometry determines the overall distribution of available distances, while participants determine which stimulus pairs occupy those relationships. This distinction is central to the present analytical approach, but it also means that the resulting consensus structures are partly dependent on the spatial constraints of the task. Comparisons with larger grids, continuous arrangement spaces, or alternative spatial configurations would help establish which aspects of the observed organization remain stable across different experimental formats.
A related consideration concerns the interpretation of the organizing principles underlying individual arrangements. Participants were deliberately not instructed to organize the stimuli according to perceptual similarity, preference, brightness, hue, or any other predefined criterion. This allowed the task to capture relationships emerging from participants’ own organizing strategies, but it also means that the psychological basis of those relationships cannot be determined from spatial distances alone. Two colors placed close together may have been considered perceptually similar, categorically related, aesthetically compatible, or associated through previous experience. The same spatial relationship may therefore arise from different judgments across participants. Future research could compare free arrangements with tasks based on explicit similarity judgments, semantic associations, color preferences, or functional grouping. Such comparisons would help determine whether the aggregate relational structure reflects organizing principles shared across tasks or relationships specific to the freedom afforded by the present procedure.
The statistical analyses introduce further considerations. The primary urban–rural comparison was based on mean pairwise distances, for which neither unrestricted nor region-stratified permutation testing provided statistically significant evidence of a global difference. However, median-based aggregation yielded a larger observed discrepancy and a nominally significant result under region-stratified permutation. This dependence on the consensus estimator indicates that the conclusions cannot be reduced to a single measure of group correspondence. Moreover, the split-half analyses revealed that the consensus structures were substantially more stable than the detailed urban–rural contrasts. The latter were only weakly reproduced across independent subsets of participants, limiting confidence in the interpretation of between-group differences as stable characteristics of the residential populations. The bootstrap analyses also require careful interpretation. Resampling produced distributions of RMS differences that were displaced toward higher values relative to the observed statistics. Because RMS is a nonnegative discrepancy measure, independent sampling variability in the estimated group consensus structures can increase the expected difference between them. The resulting percentile intervals therefore cannot be treated as direct evidence of statistical significance or equivalence. More generally, failure to reject the null hypothesis in the primary permutation analyses does not establish that the urban and rural relational structures are identical. Demonstrating equivalence would require a separately defined equivalence criterion and an inferential procedure appropriate to that objective. Future studies could also examine the reproducibility of individual stimulus-pair differences in independent samples and assess whether subsets of relationships exhibit more consistent associations with environmental variables. The distinction between aggregate and individual organization presents another direction for further investigation. The consensus matrices summarize recurring spatial relationships across participants, but considerable variation remained among individual arrangements. A relatively stable group-level pattern may therefore coexist with different organizing strategies or subgroups of participants whose arrangements depart from the consensus. Analyses of individual relational profiles, clustering approaches, and repeated arrangements from the same participants could help distinguish between stable individual tendencies and variability arising from the task itself. Such approaches could also clarify whether the apparent similarity between residential groups reflects broadly shared organization at the individual level or the aggregation of heterogeneous response patterns. Finally, the functional relevance of the observed relational structures remains to be established. The present experiment did not assess whether relationships identified through free arrangements improve visual search, information recognition, category differentiation, or interaction with designed systems. Future studies could incorporate the derived relational patterns into controlled experiments involving interfaces, information visualizations, and wayfinding systems. Alternative color assignments could be constructed to preserve or modify the observed relationships, while their effects could be evaluated through task performance, response times, error rates, eye movements, and measures of perceived organization. Such experiments would allow the descriptive findings to relate to measurable outcomes in visual communication and user experience design.
Taken together, these limitations do not diminish the value of examining color organization as a relational structure. Rather, they indicate that the observed consensus should be understood as a reproducible aggregate pattern within a specific experimental framework, rather than as a universal representation of color relationships. Extending the approach to controlled viewing conditions, alternative stimulus sets, more direct measures of environmental experience, and independent participant samples would help clarify which aspects of relational color organization are stable, which are sensitive to context, and which may have practical significance for visual communication.
5. Conclusions
The present study contributes to the understanding of color organization by examining whether the relationships established among colors exhibit a consistent aggregate structure and whether that structure differs between urban and rural populations. The findings indicate that a recognizable pattern of relational organization emerges despite substantial variability in individual arrangements. This suggests that individual differences in the organization of colors do not necessarily prevent the formation of a relatively stable group-level structure. More broadly, the results support the relevance of examining color organization as a system of interdependent relationships rather than exclusively through the properties or evaluation of individual stimuli. The comparison between urban and rural participants revealed substantial correspondence in their overall relational structures. The mean-based analyses showed that the dominant pattern of relationships was largely preserved across the two residential groups, with no statistically significant global difference identified by either unrestricted or region-stratified permutation testing. However, the median-based analyses produced a more differentiated picture, including a nominally significant result under regional stratification. This sensitivity to the consensus estimator indicates that the relationship between residential context and color organization cannot be adequately characterized by a single statistical result. An important finding is the distinction between the stability of the relational structures themselves and the reproducibility of differences between them. While the consensus structures remained relatively stable across independent subsets of participants, the specific urban–rural contrasts showed limited reproducibility. The evidence therefore supports the existence of a broadly shared aggregate organization more strongly than it supports a systematic and stable differentiation between the residential groups. This distinction is relevant beyond the present comparison, as it demonstrates that the reproducibility of a group-level pattern does not necessarily imply the reproducibility of relatively small differences between populations.
From a theoretical perspective, these findings suggest that the relationship between environmental visual experience and color organization may be more complex than a direct correspondence between residential context and the overall structure of color relationships. Differences in everyday visual environments may contribute to the familiarity, salience, interpretation, or associative meaning of colors without necessarily altering their broader relational organization. At the same time, common perceptual constraints, shared cultural experiences, and learned organizing principles may contribute to the similarities observed across residential groups. The present findings are compatible with these explanations but do not establish their relative importance. They therefore support a distinction between the potential influence of environmental experience on color-related responses and its possible influence on the organization of an entire set of color relationships.
The results also have implications for how variability and consistency are understood in visual perception and communication. The coexistence of substantial individual variation and a stable aggregate pattern suggests that relational organization should not be interpreted solely in terms of uniform individual responses. Instead, recurring relationships may emerge at the population level even when individuals employ different organizing strategies. This observation provides a basis for further investigating which aspects of color organization are broadly shared and which are sensitive to individual experience, contextual conditions, or specific task demands.
In the context of visual communication and user experience design, the findings reinforce the importance of considering colors as components of interconnected visual systems. The relationships among colors may contribute to how information is grouped, differentiated, and interpreted, particularly in interfaces, information visualizations, and navigation systems. The relatively high correspondence between the residential groups provides a reason to investigate whether certain relational patterns are recognizable across heterogeneous user populations. Nevertheless, the functional value of such patterns cannot be inferred from the present findings alone. Their relevance to communication effectiveness, visual-search performance, and usability remains a question for further experimental investigation.
Taken together, the findings indicate that relational color organization exhibits a degree of aggregate stability that extends across the urban and rural groups examined in this study, while the evidence for systematic residential differences remains dependent on analytical choices and limited by the reproducibility of the observed contrasts. The principal contribution of the research is therefore twofold: it provides empirical evidence of a broadly shared relational structure emerging from heterogeneous individual arrangements, and it demonstrates the importance of distinguishing structural stability from the robustness of between-group differences. This perspective offers a foundation for a more differentiated understanding of color organization, in which perceptual, experiential, and contextual influences are considered not only in relation to individual colors but also in relation to the broader systems of relationships through which colors acquire organizational and communicative significance.
Supplementary Materials
The following supporting information can be downloaded at: https://www.mdpi.com/article/10.3390/app162211208/s1, Table S1: Color stimulus specifications, including stimulus identifiers (C1–C24), corresponding ColorChecker sample names, nominal sRGB hexadecimal values, and CIELAB coordinates (D65 reference white).
Author Contributions
Conceptualization, T.Ž. and M.M. (Mile Matijević); methodology, T.Ž., M.M. (Mile Matijević) and K.H.; validation, K.H. and M.M. (Marko Morić); formal analysis, T.Ž.; investigation, T.Ž. and M.M. (Mile Matijević); resources, M.M. (Mile Matijević) and M.M. (Marko Morić); data curation, T.Ž.; writing—original draft preparation, T.Ž.; writing—review and editing, M.M. (Mile Matijević), K.H. and M.M. (Marko Morić); visualization, T.Ž. and M.M. (Marko Morić); supervision, M.M. (Mile Matijević); project administration, M.M. (Mile Matijević). All authors have read and agreed to the published version of the manuscript.
Funding
This research received no external funding.
Informed Consent Statement
Informed consent was obtained from all subjects involved in the study.
Data Availability Statement
The data supporting the findings of this study are part of a broader research dataset that remains under active analysis. To protect the integrity of ongoing research and planned analyses, the dataset is not currently publicly available. Data availability will be reconsidered following completion of these analyses.
Conflicts of Interest
The authors declare no conflict of interest.
References
- Smallman, H.S.; Boynton, R.M. On the Usefulness of Basic Colour Coding in an Information Display. Displays 1993, 14, 158–165. [Google Scholar] [CrossRef] [Scilit]
- Wu, F.-G.; Chen, C.-Y. Effects of Color Display, Color Name, Color Formation and Color Alignment on the Screen Layout Usability of Customized Product Color Combinations. Int. J. Ind. Ergon. 2009, 39, 655–666. [Google Scholar] [CrossRef] [Scilit]
- Schloss, K.B.; Palmer, S.E. Aesthetic Response to Color Combinations: Preference, Harmony, and Similarity. Atten. Percept. Psychophys. 2011, 73, 551–571. [Google Scholar] [CrossRef] [Scilit] [PubMed]
- Deng, X.; Hui, S.K.; Hutchinson, J.W. Consumer Preferences for Color Combinations: An Empirical Analysis of Similarity-based Color Relationships. J. Consum. Psychol. 2010, 20, 476–484. [Google Scholar] [CrossRef] [Scilit]
- Palmer, S.E.; Schloss, K.B. An Ecological Valence Theory of Human Color Preference. Proc. Natl. Acad. Sci. USA 2010, 107, 8877–8882. [Google Scholar] [CrossRef] [Scilit] [PubMed]
- Bimler, D.; Kirkland, J.; Pichler, S. Escher in Color Space: Individual-Differences Multidimensional Scaling of Color Dissimilarities Collected with a Gestalt Formation Task. Behav. Res. Methods Instrum. Comput. 2004, 36, 69–76. [Google Scholar] [CrossRef] [Scilit] [PubMed]
- Hout, M.C.; Goldinger, S.D.; Ferguson, R.W. The Versatility of SpAM: A Fast, Efficient, Spatial Method of Data Collection for Multidimensional Scaling. J. Exp. Psychol. Gen. 2013, 142, 256–281. [Google Scholar] [CrossRef] [Scilit] [PubMed]
- Richie, R.; White, B.; Bhatia, S.; Hout, M.C. The Spatial Arrangement Method of Measuring Similarity Can Capture High-Dimensional Semantic Structures. Behav. Res. 2020, 52, 1906–1928. [Google Scholar] [CrossRef] [Scilit] [PubMed]
- Verheyen, S.; Voorspoels, W.; Vanpaemel, W.; Storms, G. Caveats for the Spatial Arrangement Method: Comment on Hout, Goldinger, and Ferguson (2013). J. Exp. Psychol. Gen. 2016, 145, 376–382. [Google Scholar] [CrossRef] [Scilit] [PubMed]
- Verheyen, S.; White, A.; Storms, G. A Comparison of the Spatial Arrangement Method and the Total-Set Pairwise Rating Method for Obtaining Similarity Data in the Conceptual Domain. Multivar. Behav. Res. 2022, 57, 356–384. [Google Scholar] [CrossRef] [Scilit] [PubMed]
- Lindsey, D.T.; Brown, A.M.; Violette, A.N.; Lange, R.; Deshpande, P.S. Color Sorting and Color Term Evolution. Color Res. Appl. 2024, 49, 318–338. [Google Scholar] [CrossRef] [Scilit] [PubMed]
- Simoncelli, E.P. Vision and the Statistics of the Visual Environment. Curr. Opin. Neurobiol. 2003, 13, 144–149. [Google Scholar] [CrossRef] [Scilit] [PubMed]
- Nascimento, S.M.C.; Ferreira, F.P.; Foster, D.H. Statistics of Spatial Cone-Excitation Ratios in Natural Scenes. J. Opt. Soc. Am. A 2002, 19, 1484. [Google Scholar] [CrossRef] [Scilit] [PubMed]
- Marin-Franch, I.; Foster, D.H. Number of Perceptually Distinct Surface Colors in Natural Scenes. J. Vis. 2010, 10, 9. [Google Scholar] [CrossRef] [Scilit] [PubMed]
- McDermott, K.C.; Webster, M.A. Uniform Color Spaces and Natural Image Statistics. J. Opt. Soc. Am. A 2012, 29, A182. [Google Scholar] [CrossRef] [Scilit] [PubMed]
- Montagner, C.; Linhares, J.M.M.; Vilarigues, M.; Nascimento, S.M.C. Statistics of Colors in Paintings and Natural Scenes. J. Opt. Soc. Am. A 2016, 33, A170. [Google Scholar] [CrossRef] [Scilit] [PubMed]
- Skelton, A.E.; Maule, J.; Floyd, S.; Wozniak, B.; Majid, A.; Bosten, J.M.; Franklin, A. Effects of Visual Diet on Colour Discrimination and Preference. Proc. R. Soc. B 2024, 291, 20240909. [Google Scholar] [CrossRef] [Scilit] [PubMed]
- Linnell, K.J.; Caparos, S.; De Fockert, J.W.; Davidoff, J. Urbanization Decreases Attentional Engagement. J. Exp. Psychol. Hum. Percept. Perform. 2013, 39, 1232–1247. [Google Scholar] [CrossRef] [Scilit] [PubMed]
- Mavridis, P.; Kärtner, J.; Cavalcante, L.I.C.; Resende, B.; Schuhmacher, N.; Köster, M. The Development of Context-Sensitive Attention in Urban and Rural Brazil. Front. Psychol. 2020, 11, 1623. [Google Scholar] [CrossRef] [Scilit] [PubMed]
- Davies, J.L.; Stevanov, J.; Leonards, U. Rethinking the Nature vs. Urban Environment Dichotomy: Aligning Research Classifications with Human Visual Perception. J. Environ. Psychol. 2025, 101, 102507. [Google Scholar] [CrossRef] [Scilit]
- Guo, J.; Song, F.; Liu, Y.; Wang, W.; Wang, Y. The Impact of Color Combination on Visual Search Efficiency and User Experience in Human-Machine Interface: A Case Study of Metro Electronic Guide Screen. Int. J. Hum. – Comput. Interact. 2025, 41, 11915–11933. [Google Scholar] [CrossRef] [Scilit]
- Yu, N.; Ouyang, Z. Effects of Background Colour, Polarity, and Saturation on Digital Icon Status Recognition and Visual Search Performance. Ergonomics 2024, 67, 433–445. [Google Scholar] [CrossRef] [Scilit] [PubMed]
- Search Performance and Aesthetics: Harmonious Colours and Grouping for a Better User Interface. Teh. Vjesn. 2023, 30, 506–513. [Google Scholar] [CrossRef] [Scilit]
- Wang, Y.; Buetti, S.; Cui, A.Y.; Lleras, A. Color-Color Feature Guidance in Visual Search. Atten. Percept. Psychophys. 2025, 87, 1496–1517. [Google Scholar] [CrossRef] [Scilit] [PubMed]
- Buljat, P.; Kovačević, D.; Kulčar, R. Determining Effective Color Combinations for Enhanced Legibility Presented on Print and Digital Formats. Appl. Sci. 2024, 14, 11498. [Google Scholar] [CrossRef] [Scilit]
- McCamy, C.S.; Marcus, H.; Davidson, J.G. A Color-Rendition Chart. J. Appl. Photogr. Eng. 1976, 2, 95–99. [Google Scholar]
- Yang, L.; Qi, B.; Guo, Q. The Effect of Icon Color Combinations in Information Interfaces on Task Performance under Varying Levels of Cognitive Load. Appl. Sci. 2024, 14, 4212. [Google Scholar] [CrossRef] [Scilit]
- Ahtik, J. Comparison of ICC and DNG Colour Profile Workflows Based on Colorimetric Accuracy. J. Print. Media Technol. Res. 2023, 6, 115–121. [Google Scholar] [CrossRef] [Scilit]
- Ware, C. Information Visualization: Perception for Design. In Interactive Technologies, 3rd ed.; Morgan Kaufmann: Waltham, MA, USA, 2013; ISBN 978-0-12-381464-7. [Google Scholar]
- Munzner, T. Visualization Analysis and Design; A K Peters/CRC Press: Boca Raton, FL, USA, 2014; ISBN 978-0-429-08890-2. [Google Scholar]
- Elliot, A.J.; Maier, M.A. Color Psychology: Effects of Perceiving Color on Psychological Functioning in Humans. Annu. Rev. Psychol. 2014, 65, 95–120. [Google Scholar] [CrossRef] [Scilit] [PubMed]
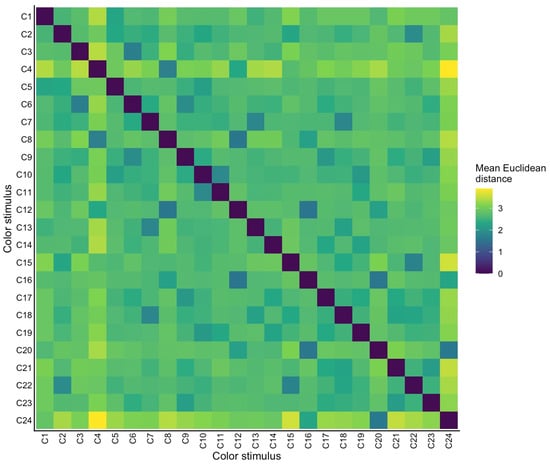
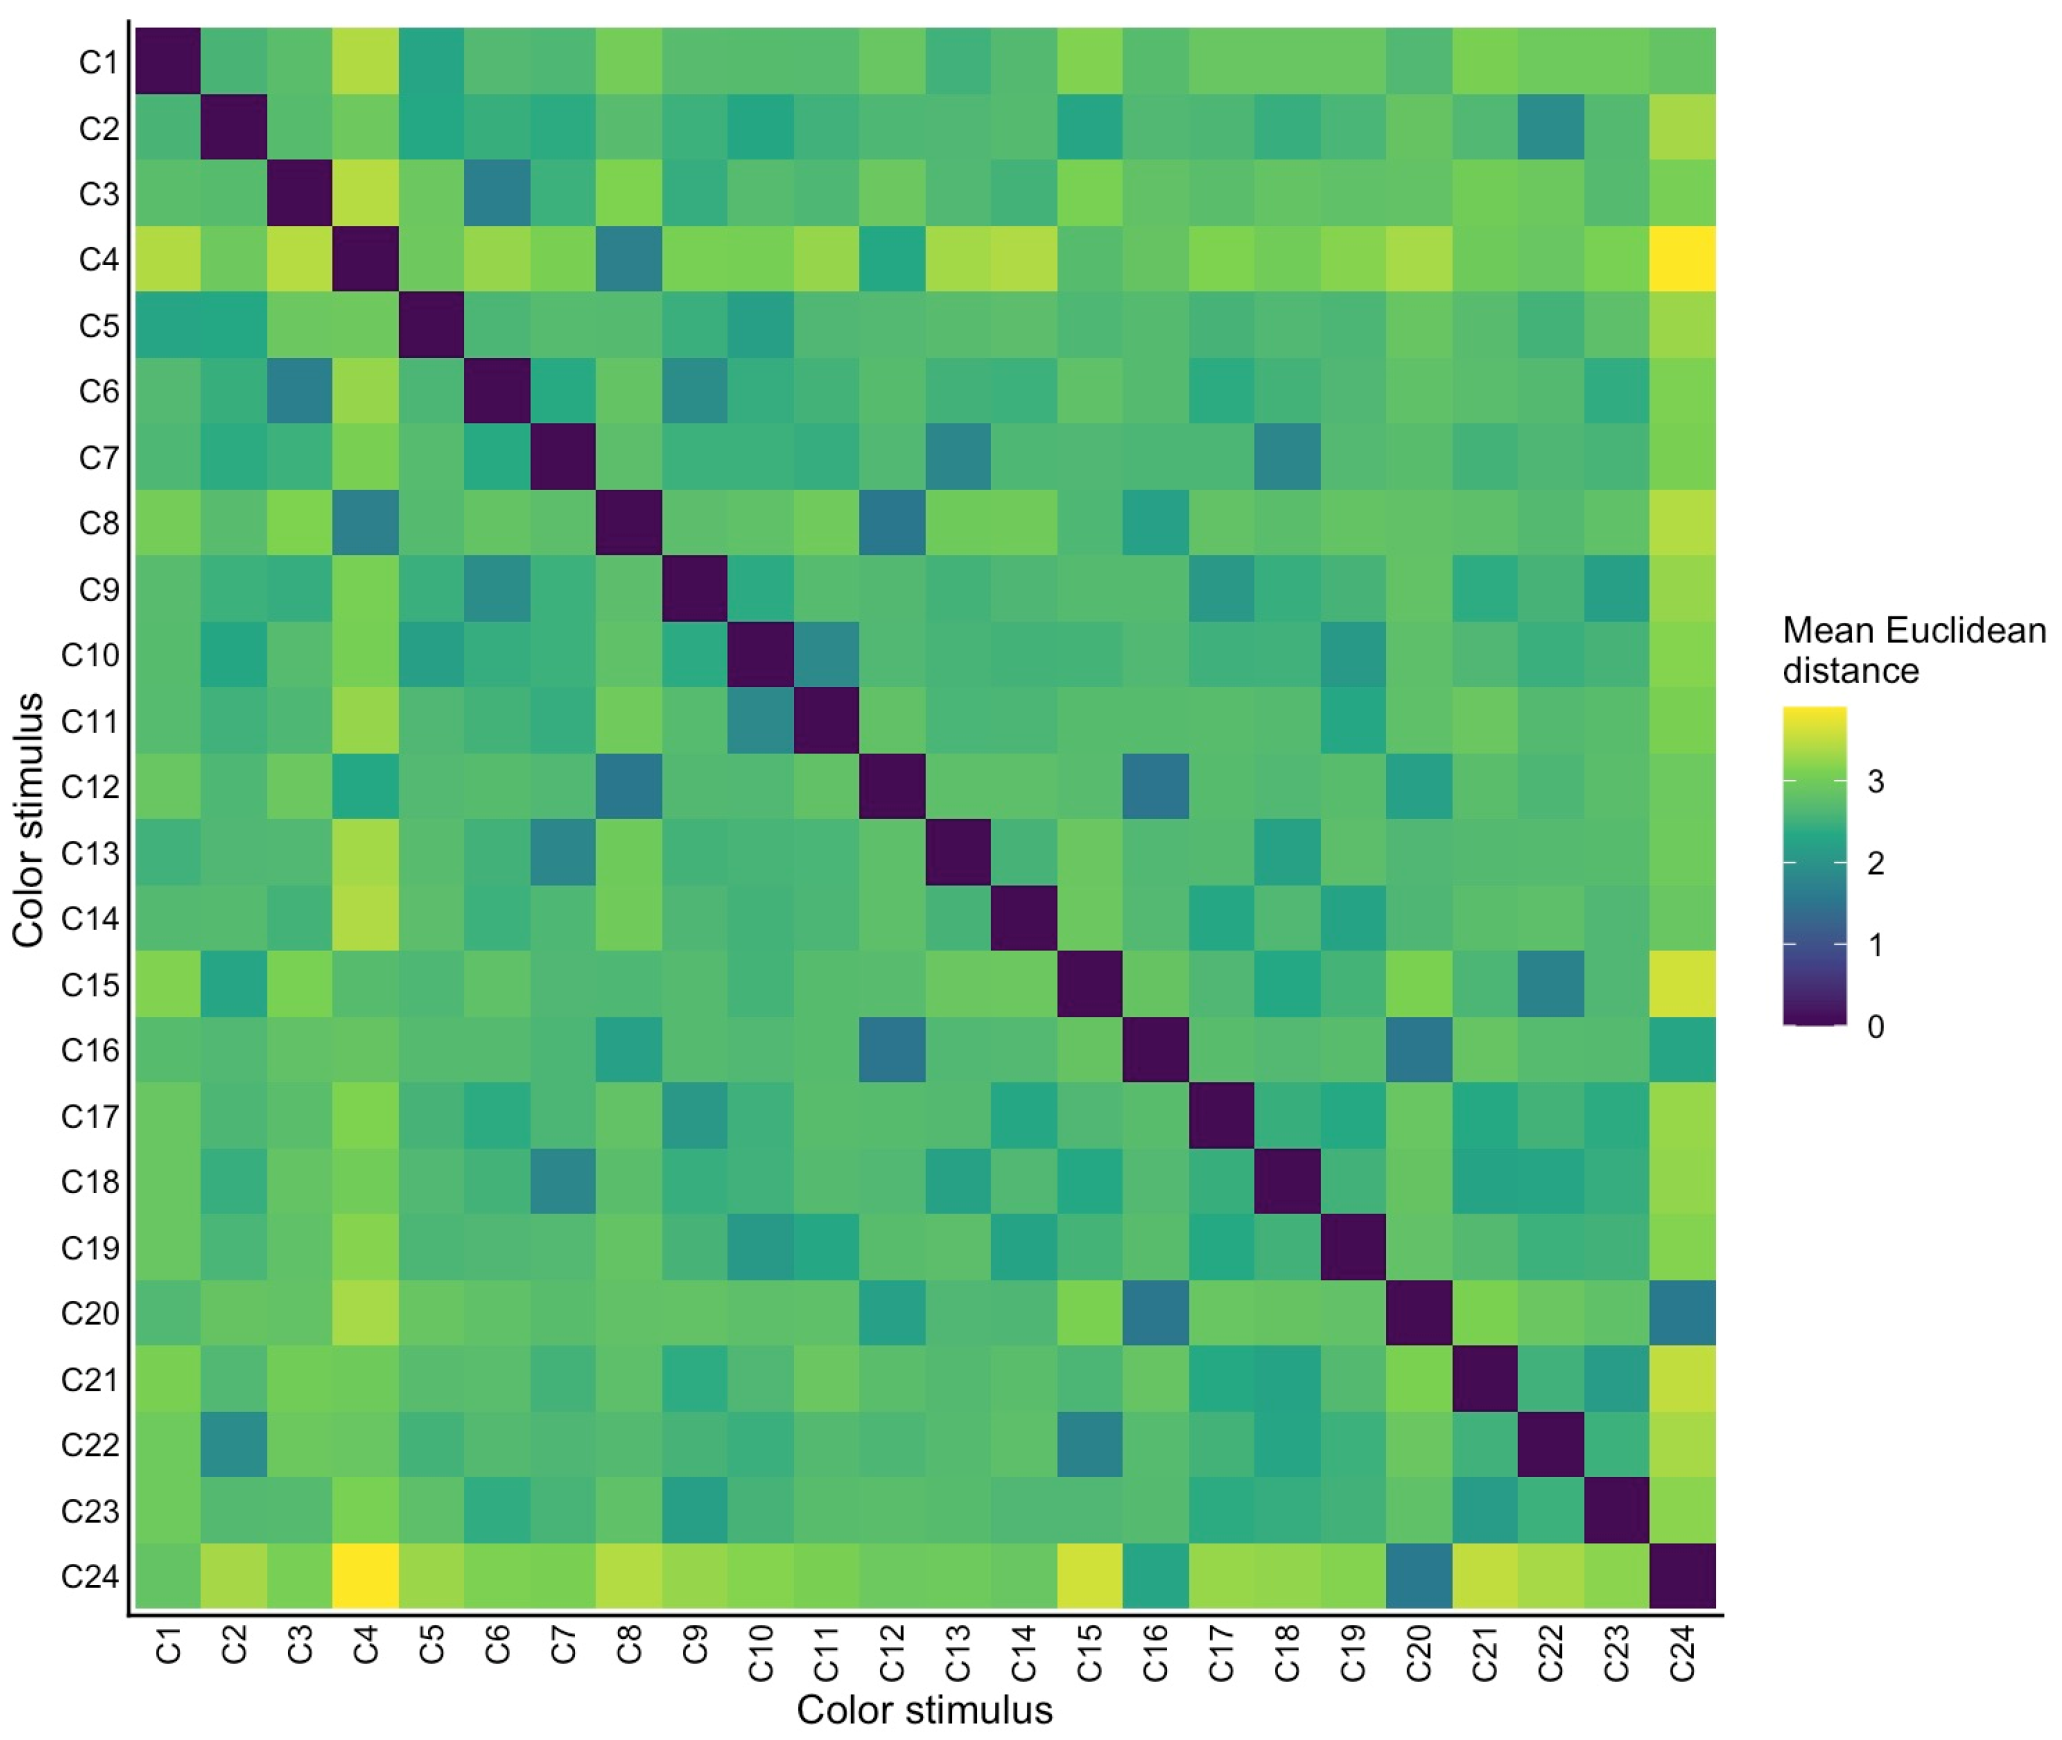
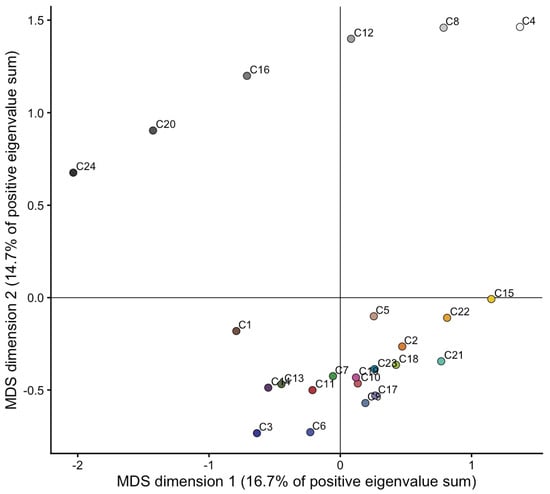
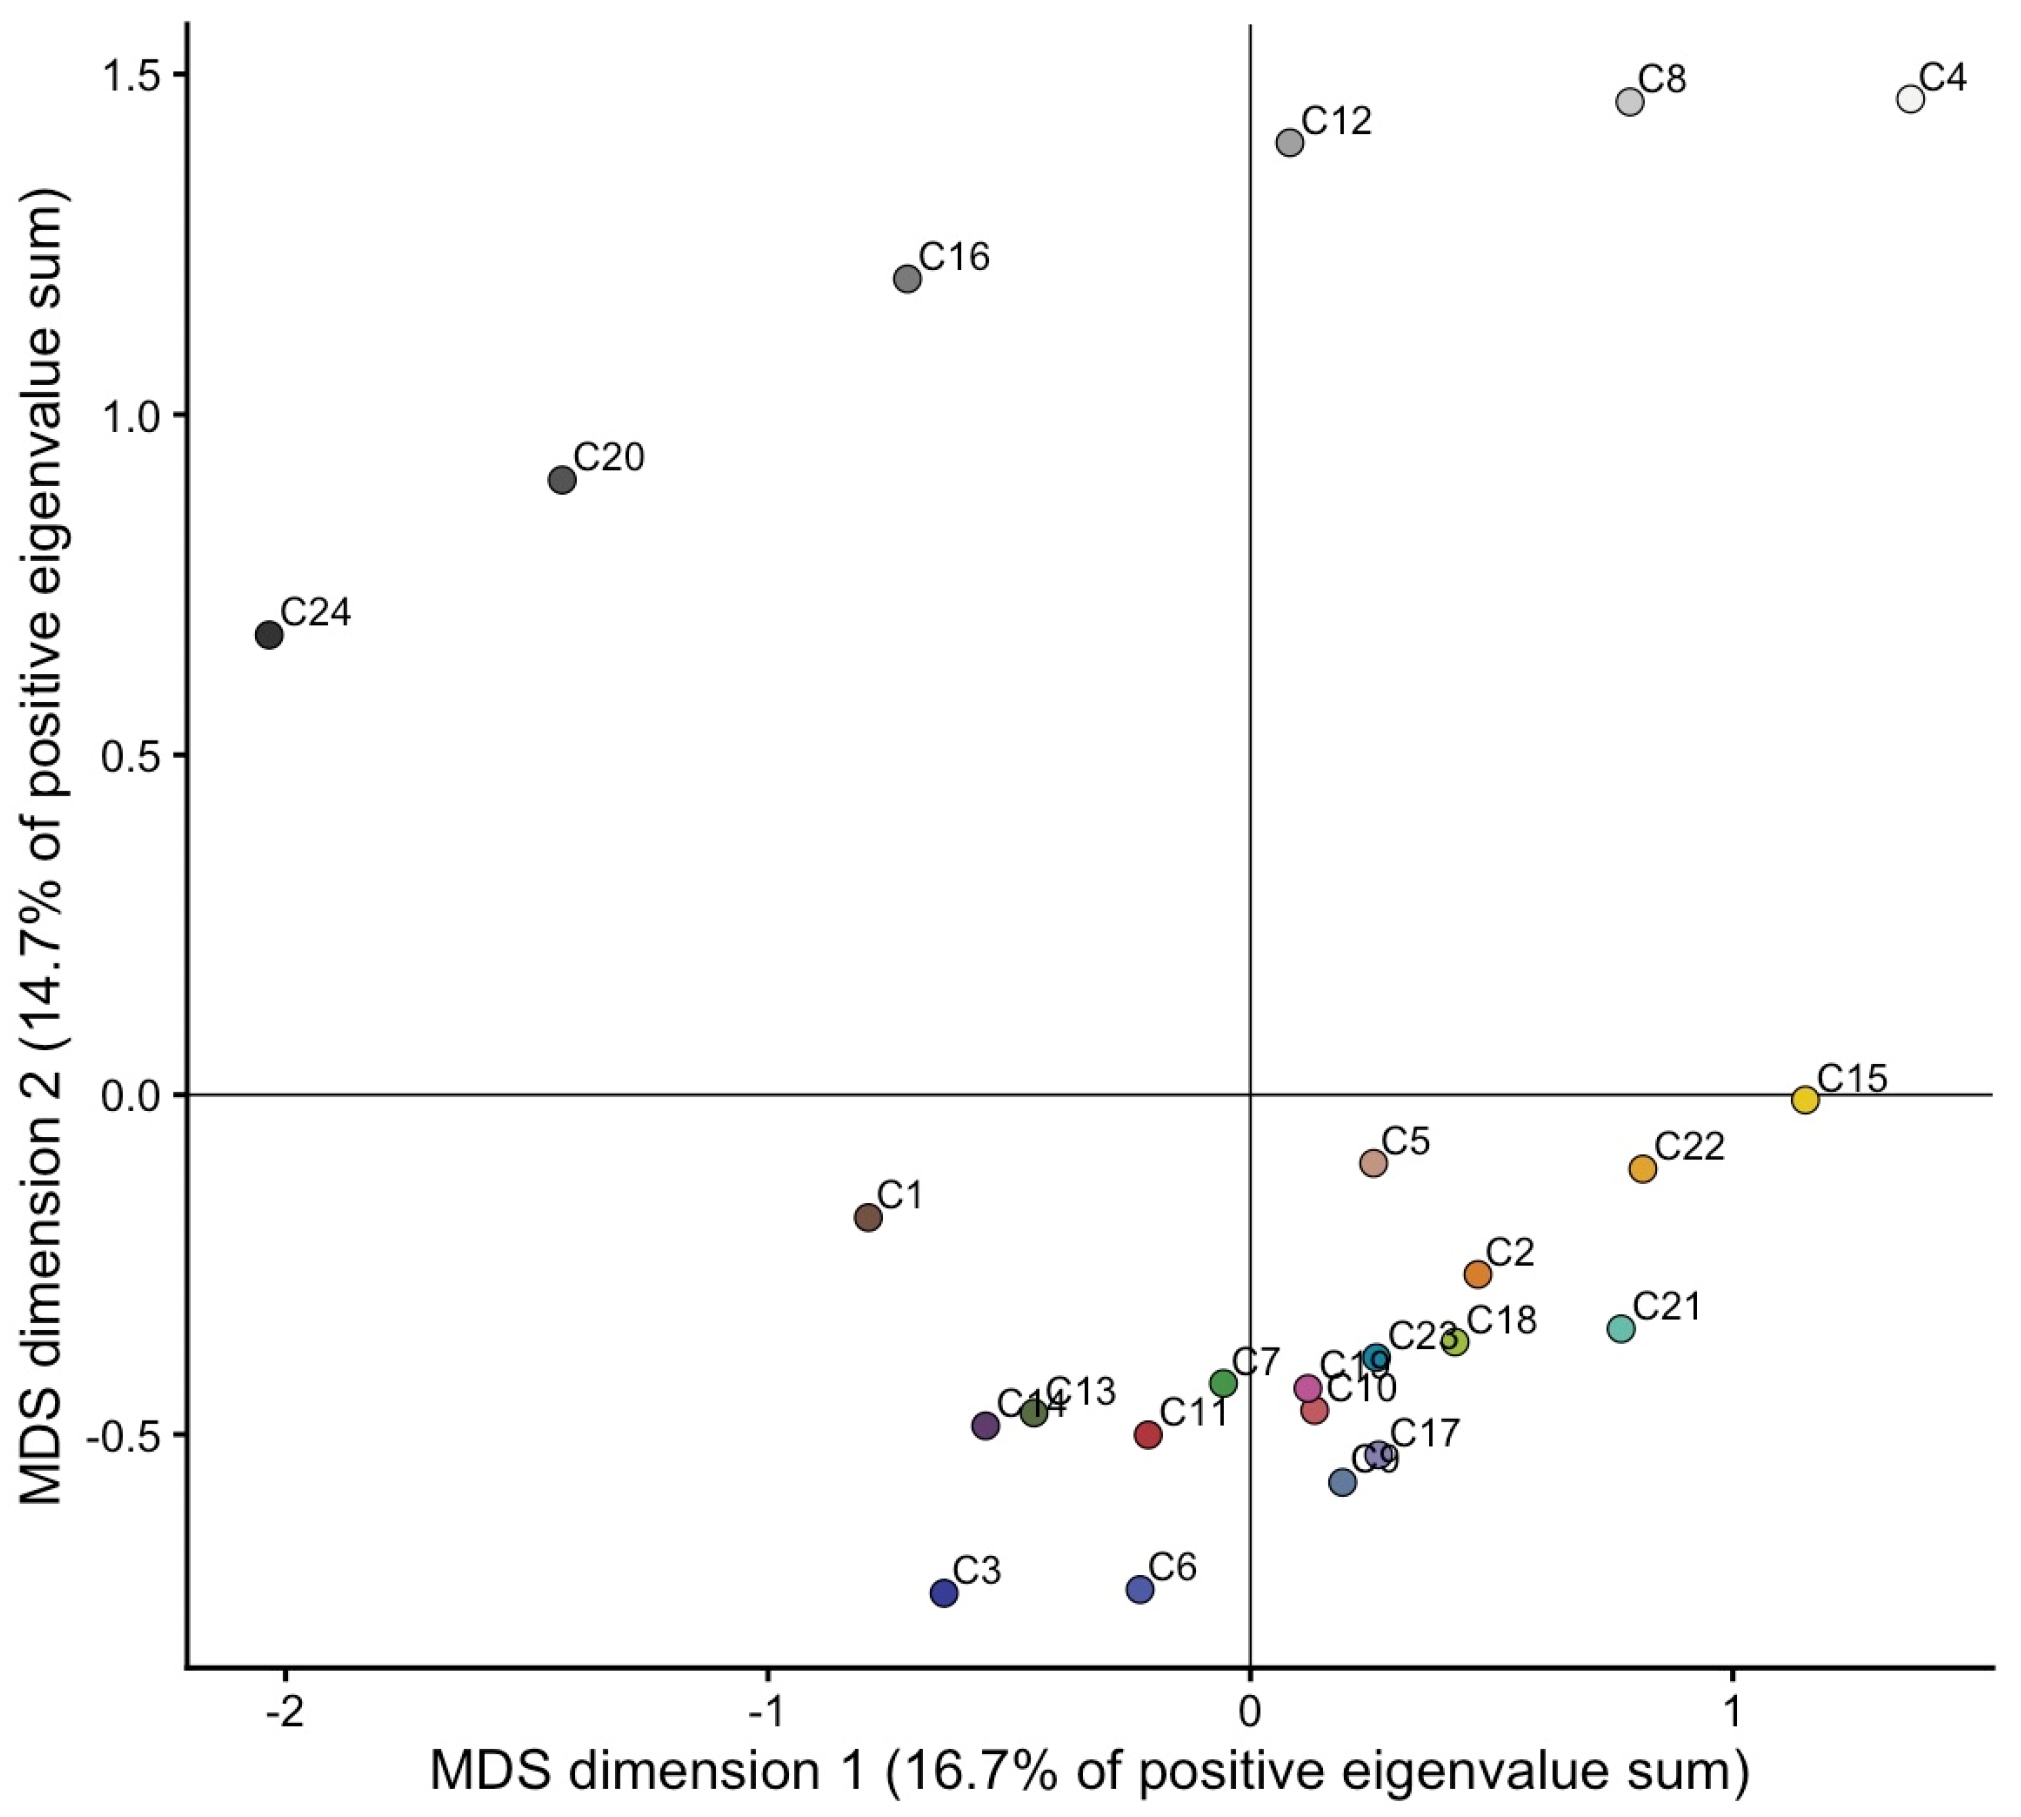
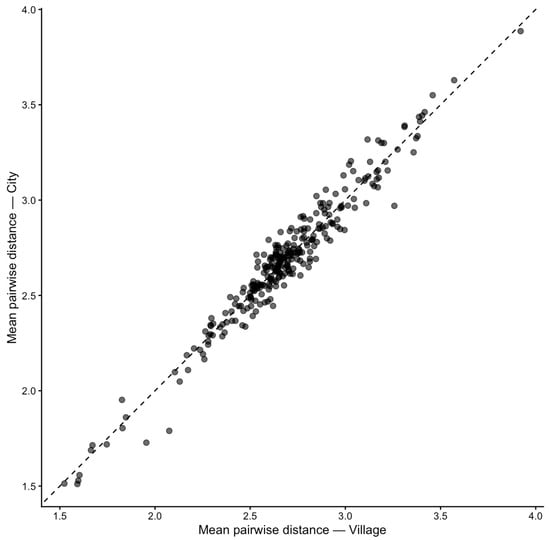
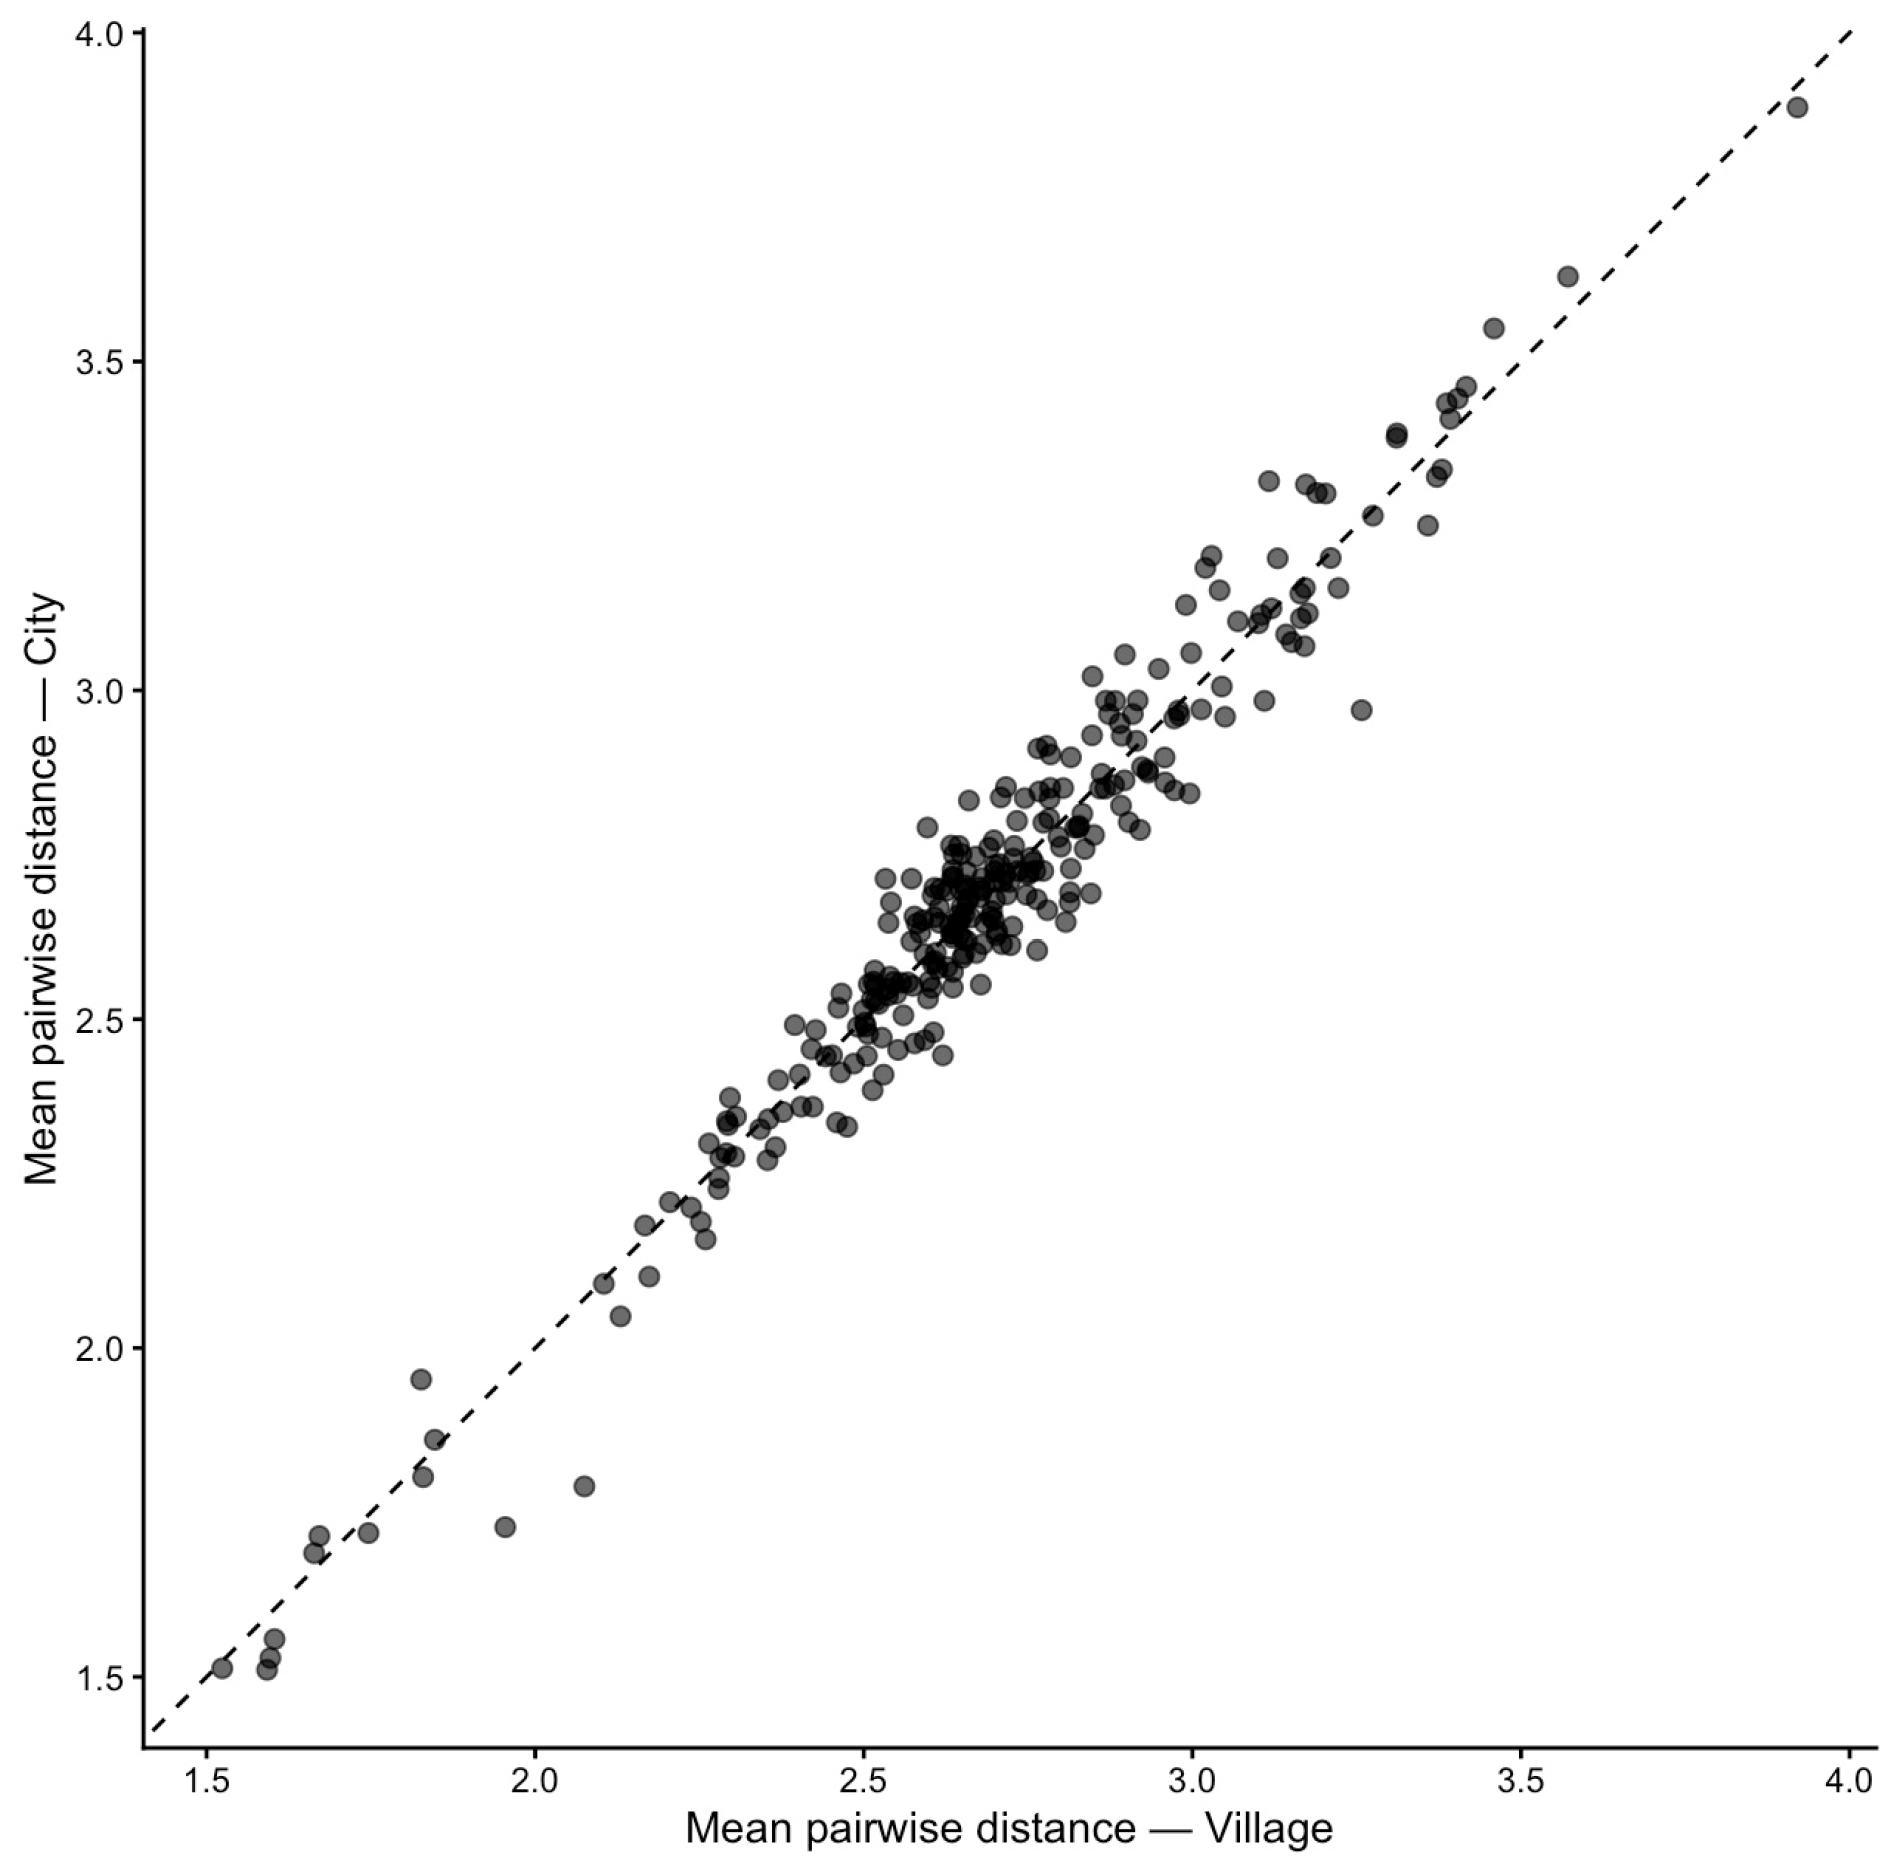
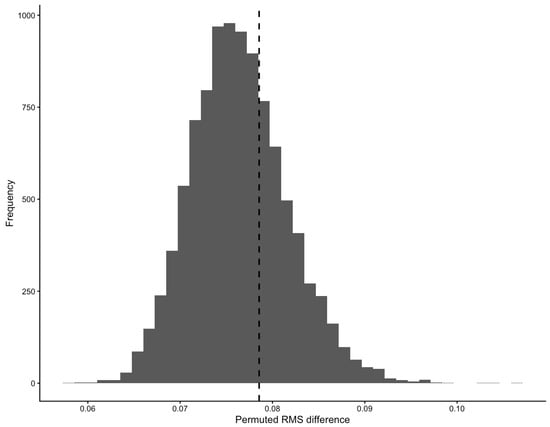
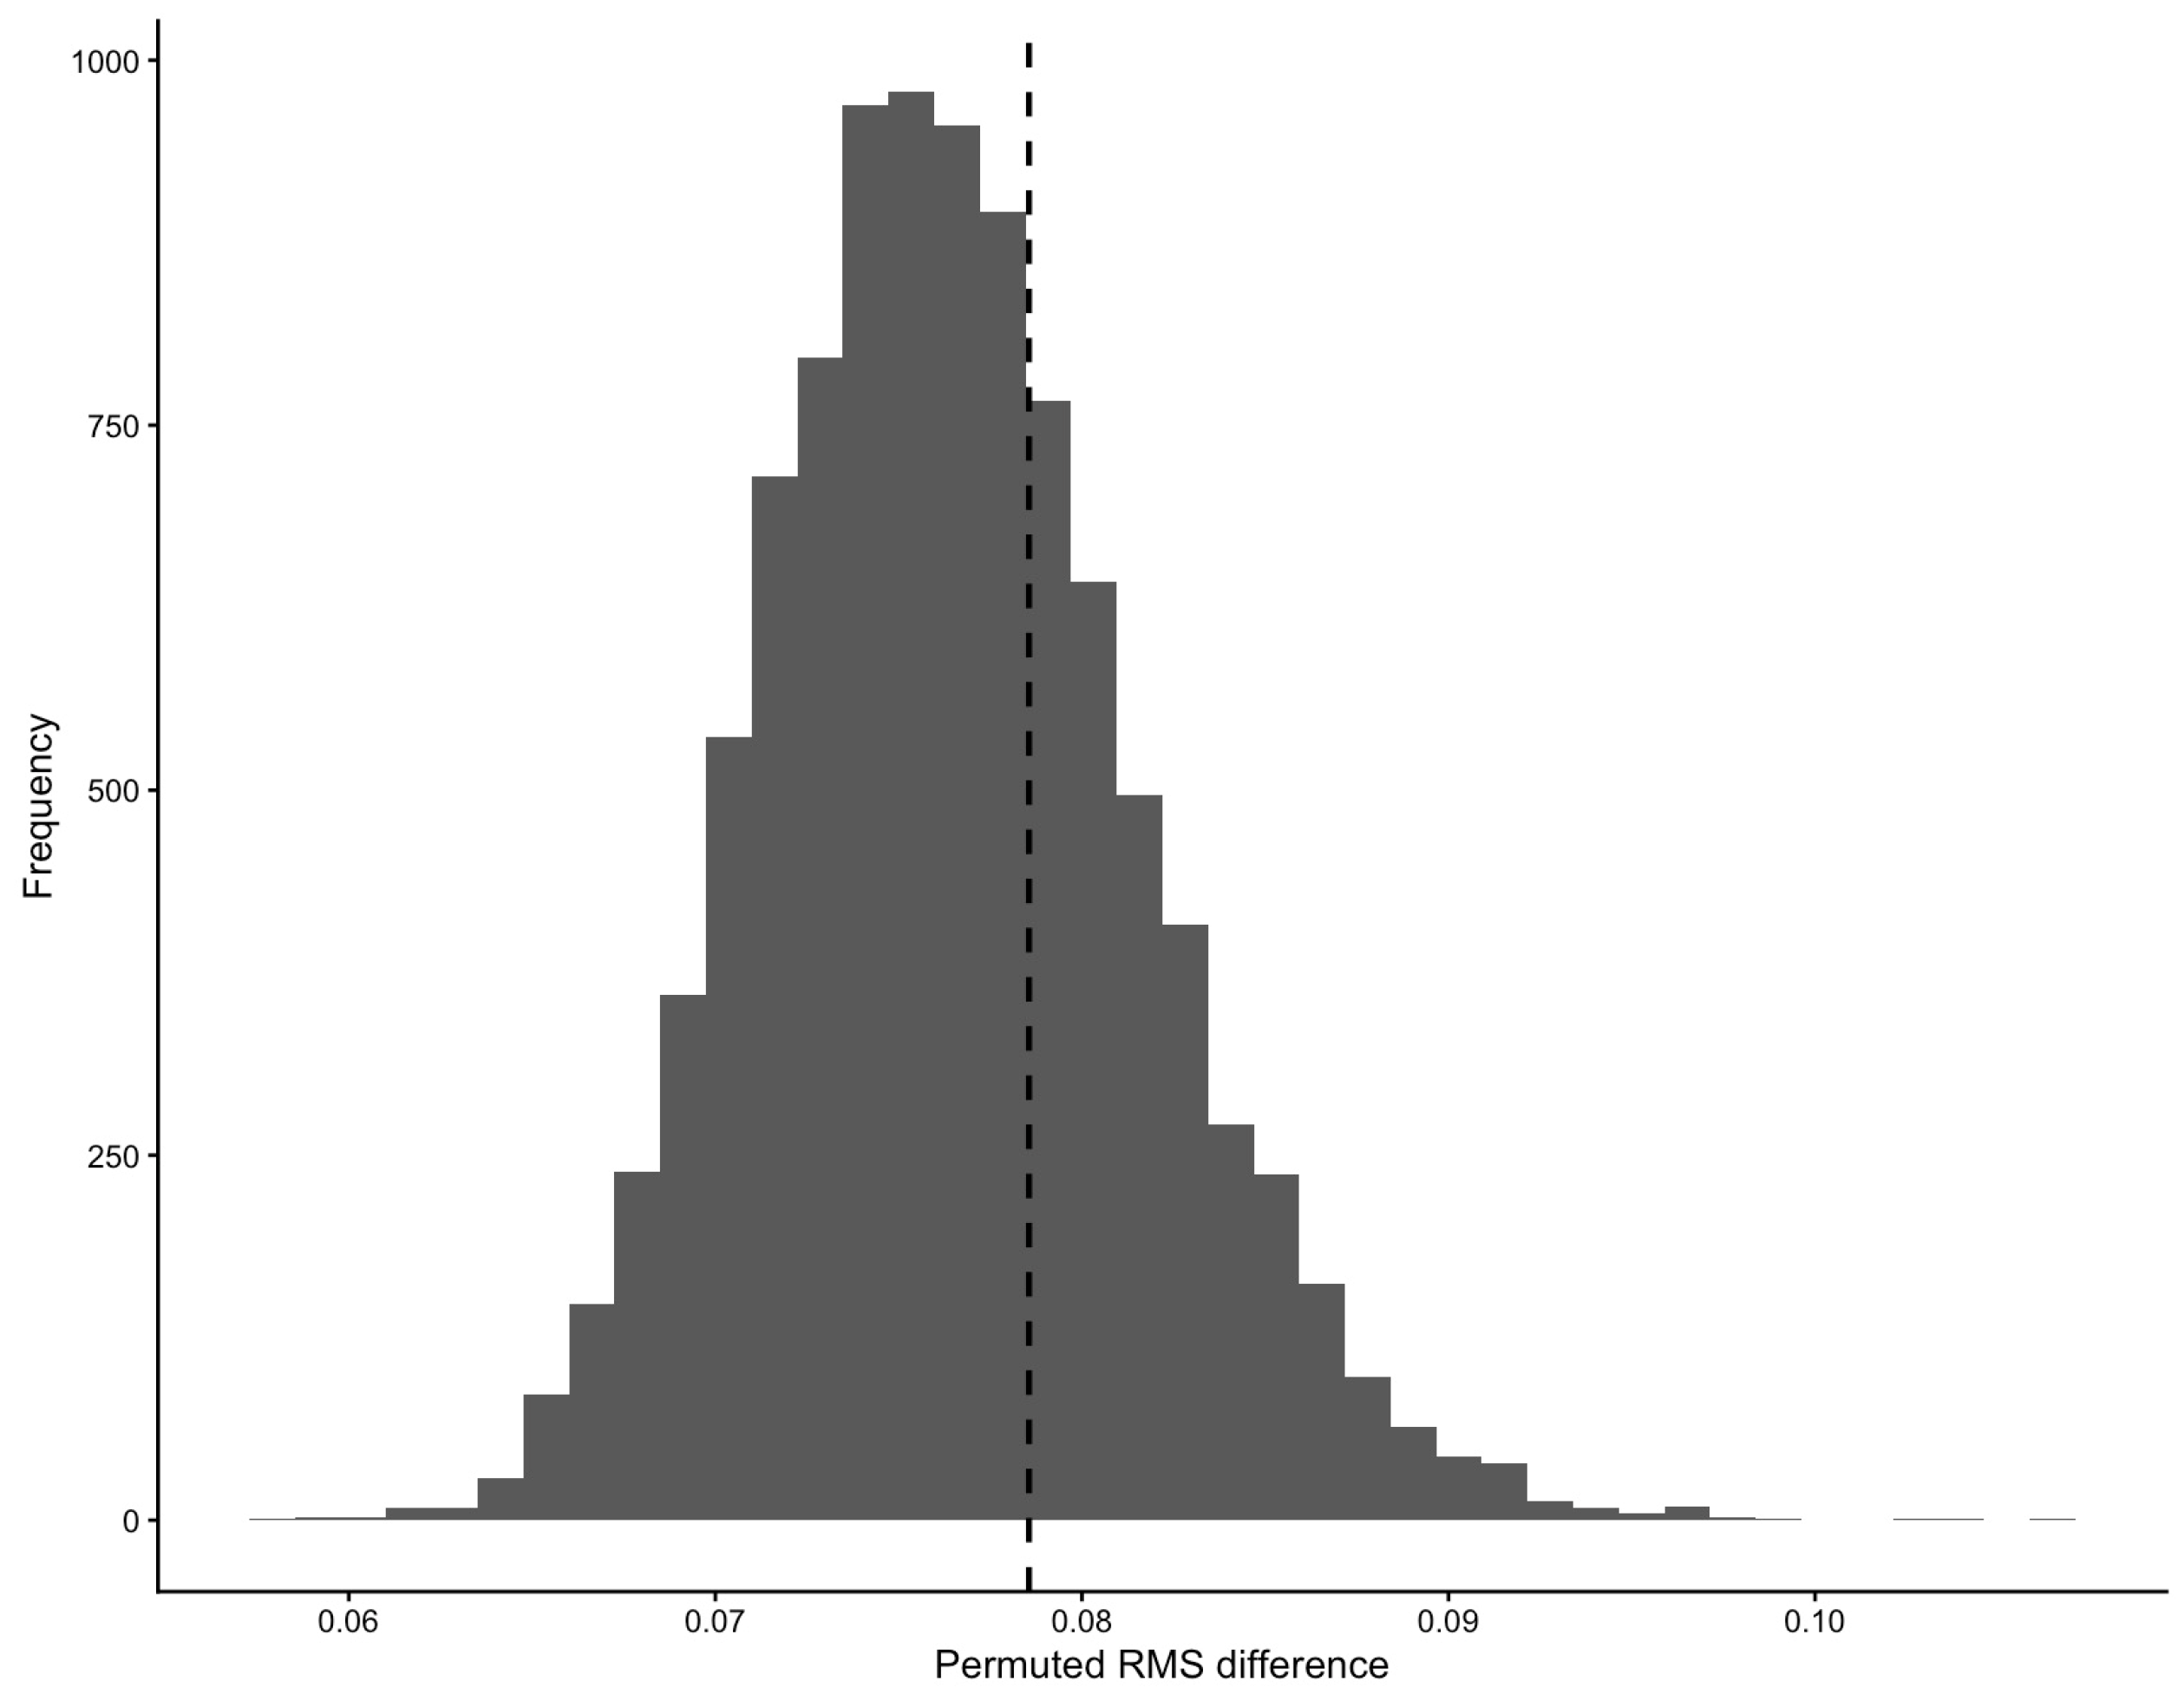
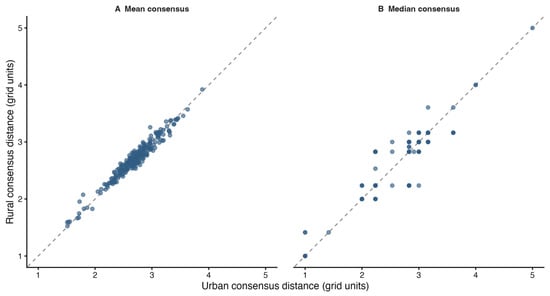
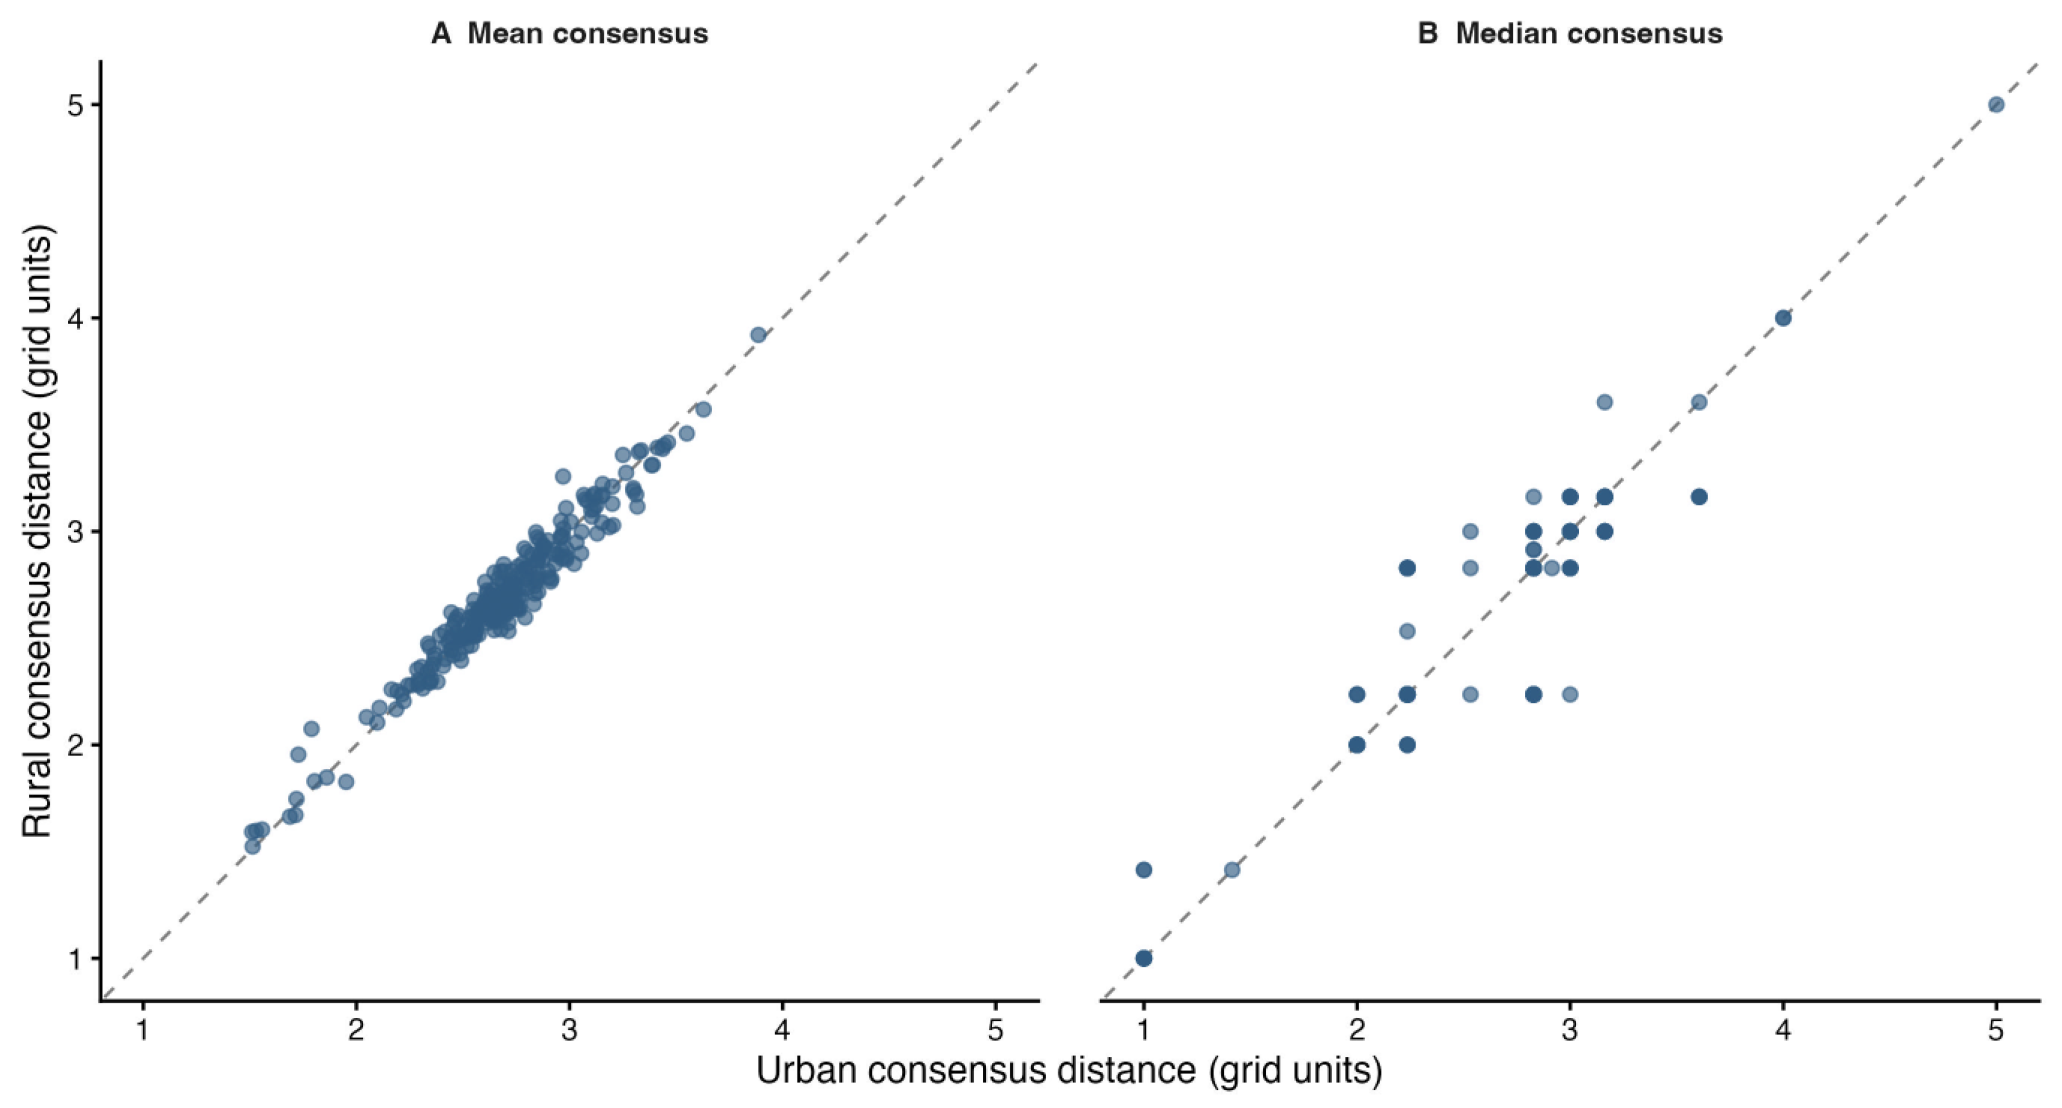
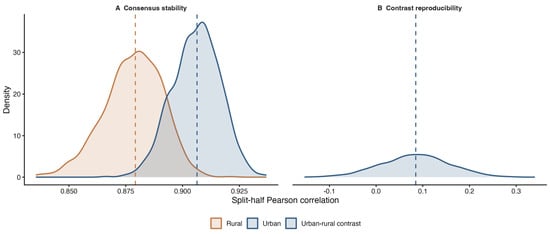
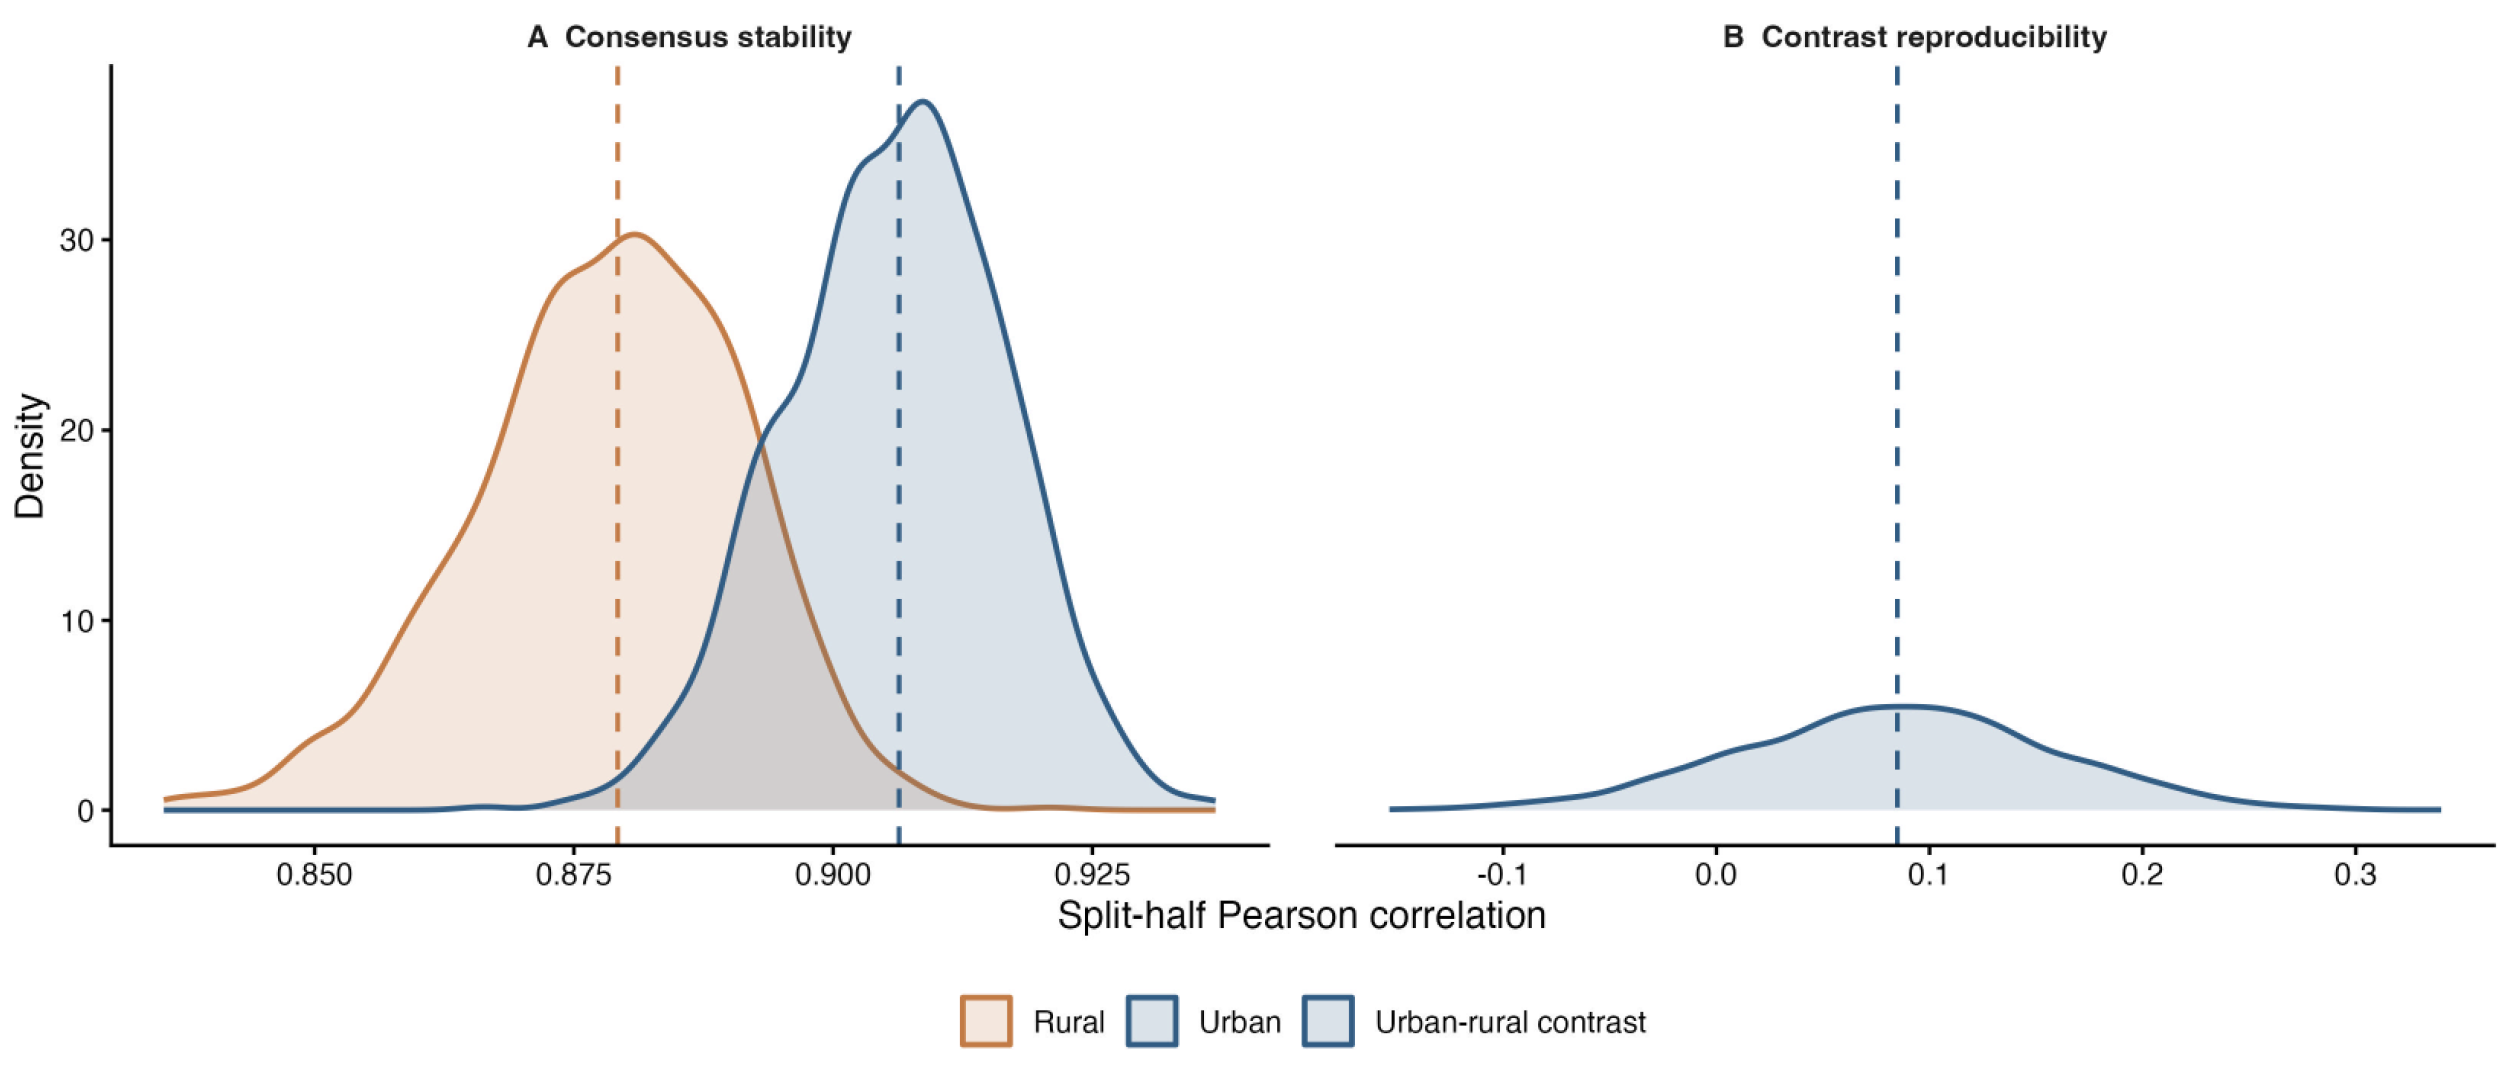
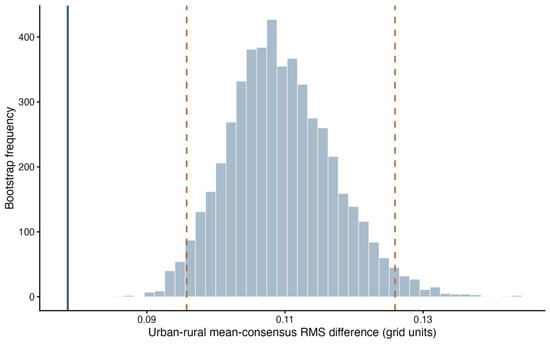
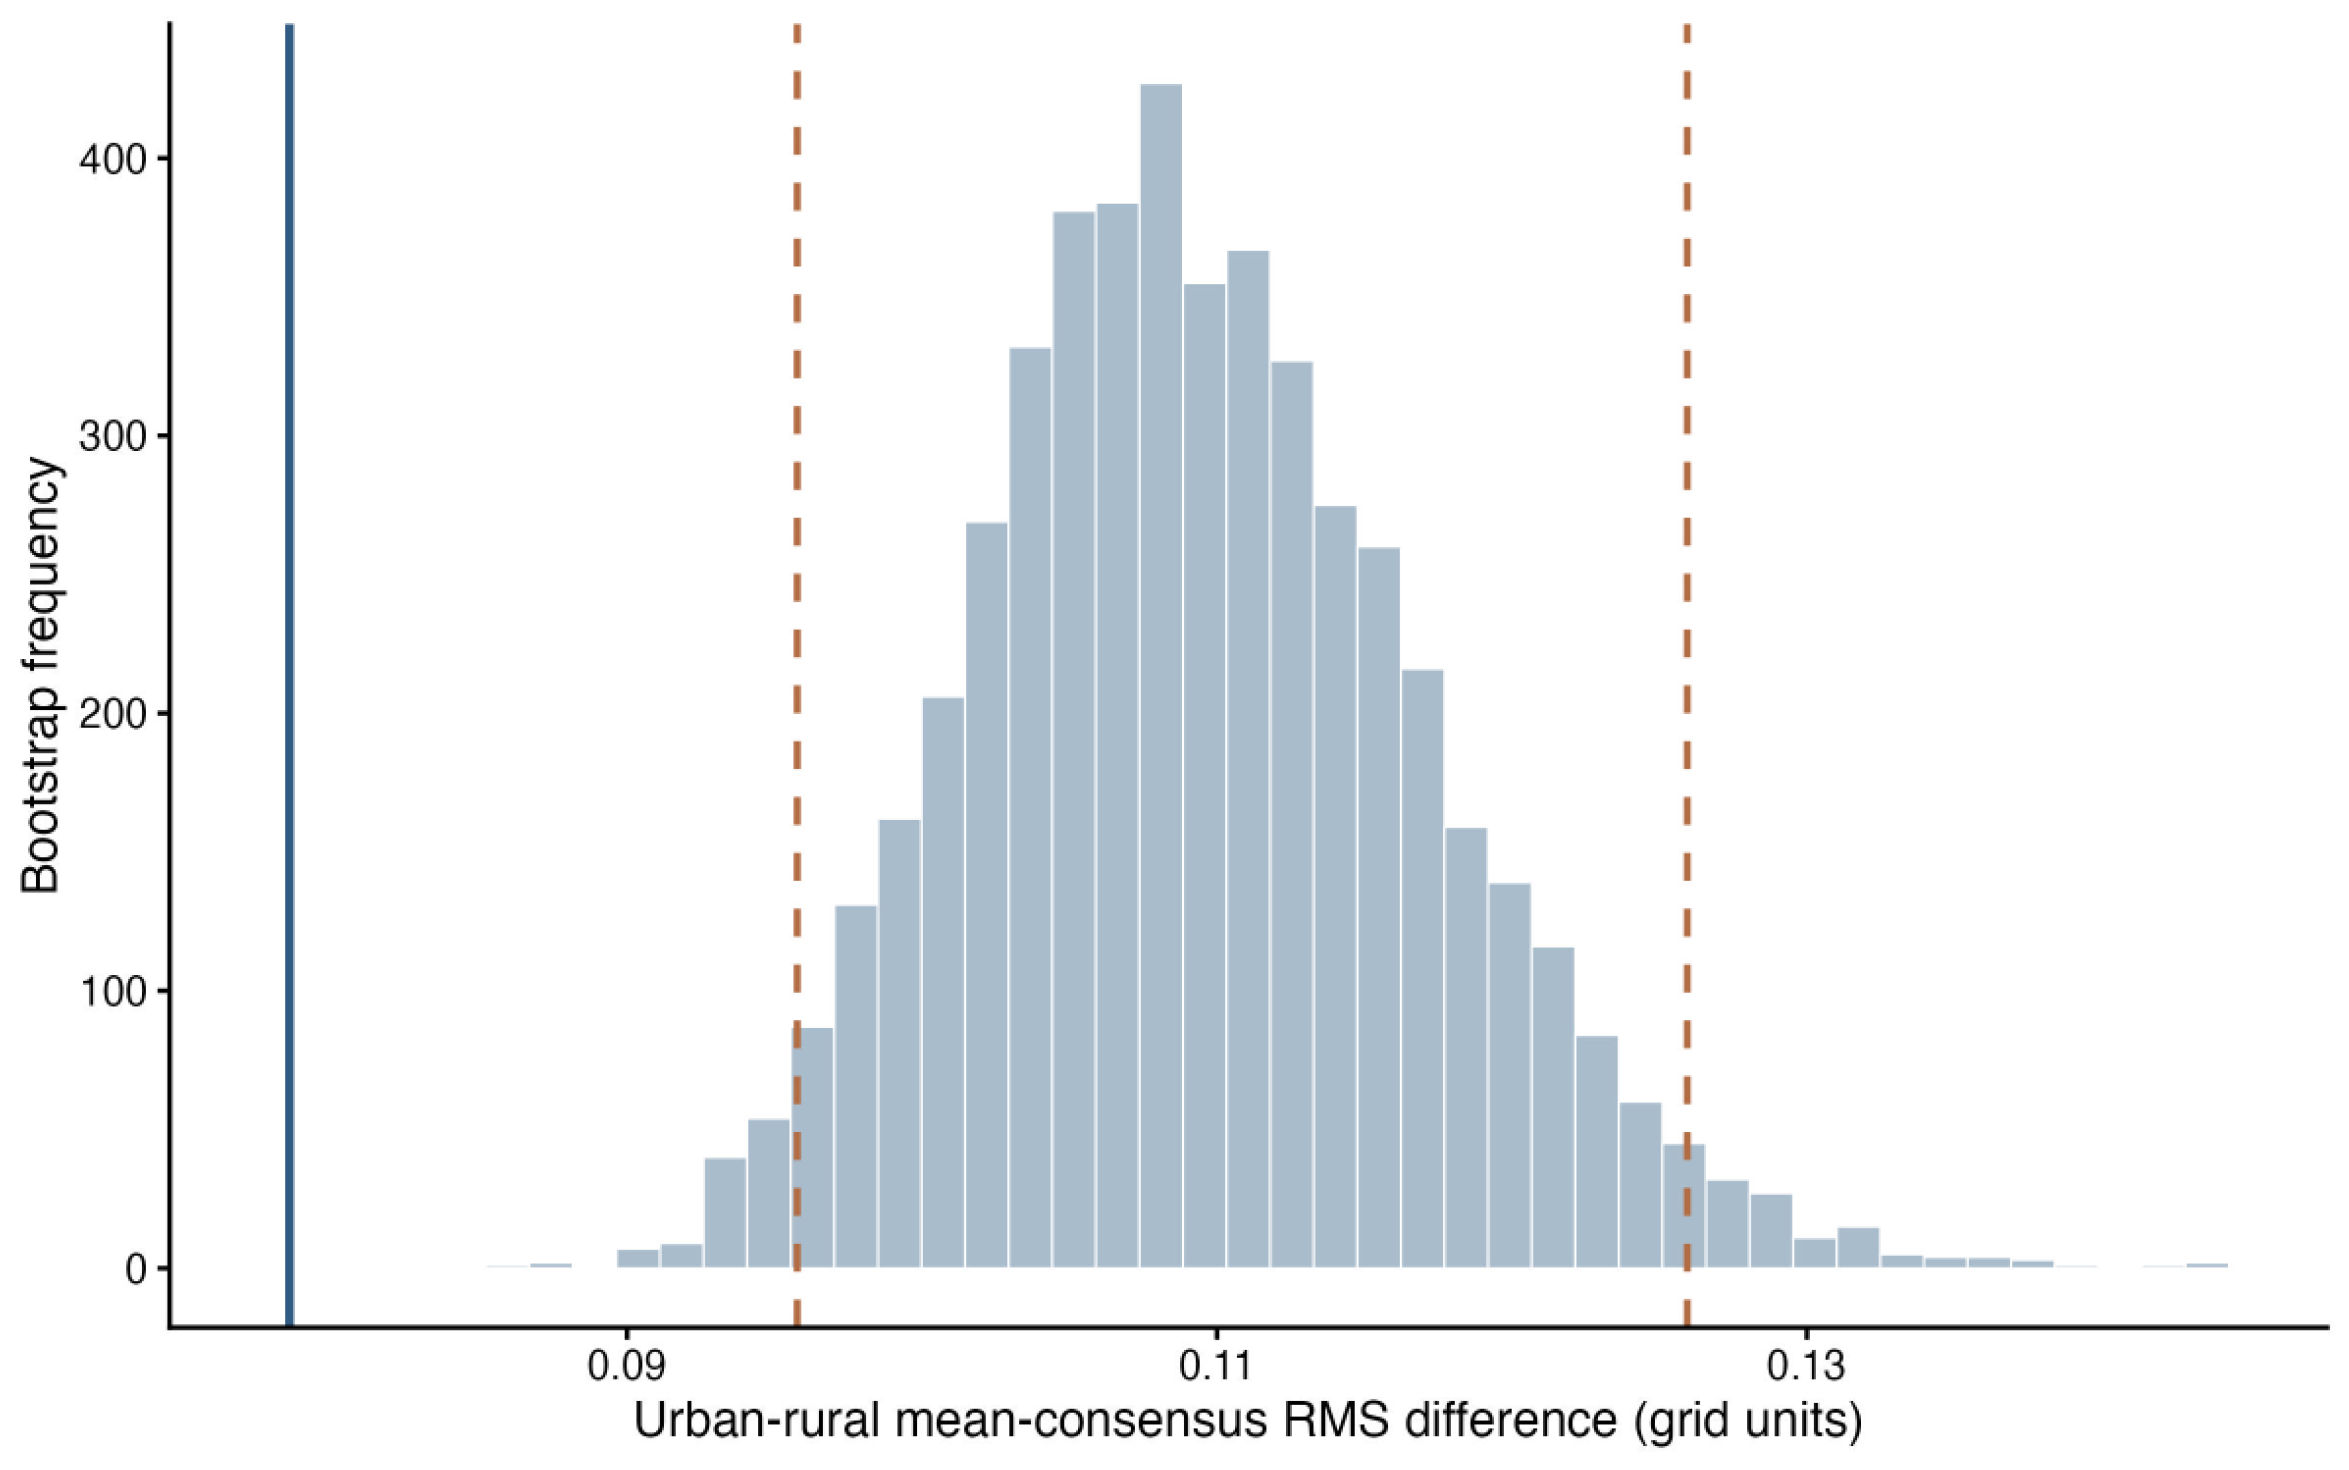
Disclaimer/Publisher’s Note: The statements, opinions and data contained in all publications are solely those of the individual author(s) and contributor(s) and not of MDPI and/or the editor(s). MDPI and/or the editor(s) disclaim responsibility for any injury to people or property resulting from any ideas, methods, instructions or products referred to in the content. |
© 2026 by the authors. Licensee MDPI, Basel, Switzerland. This article is an open access article distributed under the terms and conditions of the Creative Commons Attribution (CC BY) license.