


Featured Application
This study is of interest to road safety practitioners, researchers and road agency managers, given its focus on factors related to crashes on pavements under adverse weather conditions, differentiated for road jurisdictions.
Abstract
Crashes on pavements affected by adverse weather conditions are still of interest given that there is still room for infrastructure improvement, even if other influential factors should be considered. The main objectives of this study are the identification of the most relevant factors associated with crashes occurring on pavements affected by adverse weather conditions for different road types and the investigation of the relationships between those factors from the perspective of the Safe System approach. To reach these aims, a multi-level methodology was used, based on a traditional logistic regression model approach coupled with gradient boosting models interpreted based on variable importance and SHAP values for the first step, and association rule mining for the second step. The dataset for the most recent three-year period (2022–2024) of fatal+injury crashes that occurred in Italy was used. In both methodological steps, the results were differentiated by road jurisdiction (municipality, province, state, motorway agency). The findings include the identification of several factors associated with crashes that occurred under adverse pavement conditions, in some cases varying across road jurisdictions. Among them, the influence of horizontal curves, season, hour, crash types and heavy vehicles was particularly highlighted. Several relationships between crash factors were further identified and discussed from the perspective of the Safe System approach.
1. Introduction
Crashes on pavements affected by adverse weather conditions are still of great interest for road authorities and, to a broader extent, for the community, given their social costs. In fact, on the one hand, a significant number of fatal crashes (more than 10%) occur on wet pavements [1]. On the other hand, wet pavement conditions are among the most evident infrastructure-related crash factors that can be tackled by road managing agencies through different practices such as improving friction or managing speeds accordingly [2,3]. Other examples of good practice are roadside safety improvement campaigns (e.g., [4]) to mitigate consequences of crashes once they have already occurred.
The phenomenon of crashes on road pavements affected by adverse weather conditions has largely been studied from different perspectives in previous research. Differentiating among the different possible adverse conditions, much of the research focused on wet pavement conditions, with the effect of snowy/icy conditions having been studied in detail only occasionally (see e.g., [5] for the effect of snowfall). In fact, while the latter aspect can be important for winter maintenance [6] in some geographic contexts, rainfall is by far the most common adverse weather condition. One of the main aspects of wet conditions considered in road safety research is the influence on tire–pavement friction and the consequences for road design. For example, among others, Fwa (2017) [7] conducted a study on how to predict skidding risk based on a tridimensional tire–pavement contact model considering vehicle speed and water film depth. A useful output from these studies for road safety practice is the identification of “safe speeds” (speeds below the threshold that activates the skidding process) for given road conditions. The determination of safe speeds can also take into account geometric configurations by combining horizontal and vertical alignment information, an approach proposed, e.g., by Colonna et al. [8,9], who also considered different combinations of horizontal and vertical alignments. These aspects can be directly related to actual run-off crashes [10]. In fact, according to Das et al. [11], the most significant crash type in the case of rainy weather was found to be the single-vehicle run-off crash, associated with both the horizontal and vertical curvature, and with the absence of lighting at night. Clearly, other physical factors which may influence the skidding risk phenomenon under wet conditions are the pavement roughness and the rain intensity. Thus, their effect on crashes was studied as well. For example, the increase in pavement roughness was found to reduce severe crashes [12], especially at curves [2], while intense rain was associated with lower crash rates than those observed during light rain, likely due to speed reduction and increased driver attention [13]. The latter conclusion was also reached in another study conducted on an Italian motorway, in the case of conventional pavements [14], while in another American (Texas) study [15], more intense rainfall was associated with higher crash rates. Also considering other infrastructure-related factors, high-performance pavement markings can be influential as well, being related to night crash reduction under wet conditions [16].
The previously shown general relationships between road safety and crash factors under wet conditions can vary considerably with the specific road environment, as well as their influence on crash rates. Several studies investigated this topic in different geographic areas, confirming the variability of effects with road type, mostly in Europe (e.g., [17]) and the United States (e.g., [15]). In detail, considering the European context, a large-scale study investigating the effects of weather on crash risk was conducted, covering three countries (France, the Netherlands and Greece) and different road types [18]. The authors found that rainfall is positively correlated with injury crashes in France (for motorways and main roads) and in the Netherlands (for motorways and rural roads), while it is negatively correlated in Greece (for urban roads). They also suggested that the relationship can be mitigated by exposure, but the positive correlation is confirmed after controlling for exposure for the most important roads (e.g., the case of French motorways). A Romanian study found that the odds of fatal crashes are much higher on highways than on streets under wet conditions [19]. In other studies [20,21], a positive correlation between rainfall and urban crash rates was found, with different magnitudes, revealing that the effect can be context-specific and related to several other factors. Moreover, adverse weather conditions were related to different types of crashes [22] and hourly crash probabilities [23], based on German data. Considering the American context [15], a long time-series analysis (15 years) of Texas crash and weather data revealed that rainfall increases the crash risk for all the considered road types. However, the relative risk is much higher for the most important roads (such as motorways and interstate highways) than for minor roads (secondary rural roads or urban streets), likely attributable to differences in operating speeds. Similar results were obtained in another study in the same context [24]. However, it is also important to note that this result may be context-specific, as shown in [25], in which the crash risk during rainfall was found to increase more for urban counties than for rural ones (even without disaggregation by road type), based on data from six other American states.
An analysis of previous research reveals that the effect of adverse weather conditions on safety can vary considerably according to different physical, geometric, environment-related and context-specific aspects, which sometimes also provide contrasting results. In this sense, it is a typical road safety problem which should be analyzed from the perspective of the Safe System approach, considering road-, user-, vehicle- and speed-related factors (see, e.g., [26,27,28]). Given this background, the present study, included in the context of a larger research project focused on the use of artificial intelligence for developing tools useful for monitoring and managing road infrastructures, is focused on revealing complex relationships related to crashes on pavements affected by adverse weather conditions considering their variability across different road types. This will be conducted through a multi-level approach based on the following steps:
- (1)
- Identifying the most relevant factors associated with crashes occurring under adverse weather conditions for different road types;
- (2)
- Investigating the relationships between factors associated with the above-defined crashes by finding the most frequent associations between factors;
- (3)
- Interpreting the previous relationships for different road types from the perspective of the Safe System Approach.
The specific methodologies integrated in this multi-level approach are described in detail in the next section, alongside the data used. Afterward, results from the application of the chosen methodology are presented and discussed, also in light of previous research. Finally, conclusions are drawn at the end of this study, considering limitations and possible practical implications.
2. Materials and Methods
The baseline dataset used in this study is first defined. Afterward, the methodologies used for the multi-level analysis are described.
2.1. Dataset
The starting dataset used for this study is derived from the publicly available data about fatal + injury crashes that occurred in Italy in the most recent available 3-year period, from 2022 to 2024, made available online by the Italian National Institute of Statistics (ISTAT). The original data include several factors recorded in each crash record, providing general information and road-, vehicle-, driver-, environment- and crash-specific details. Given the objectives of this study, the variable reporting road pavement conditions, which includes records of pavement conditions affected by adverse weather (not dry, i.e., wet, icy, snowy or otherwise slippery), was used as the main target variable. In detail, 14.2% of crash records are associated with non-dry pavements, and among them, 93.6% are on wet pavements. The other crash-related variables used in this study and the corresponding modalities are:
- •
- Year (2022, 2023, 2024);
- •
- Italian macro-region (Northwest, Northeast, Center, South, Islands), based on the province record, aggregated into macro-regions according to the European Union NUTS-1 classification;
- •
- Large city (yes, no), based on the municipality record; yes means a crash occurred in the municipality area of one of the ten Italian cities with a population greater than 300,000;
- •
- Weekend (yes, no), based on the weekday record; yes means a crash occurred on Saturdays or Sundays;
- •
- Rural area (yes, no), based on the road type record; yes means a crash occurred on roads labelled as rural;
- •
- Cross-section (one-way single carriageway, two-way single carriageway, dual carriageway, more than two carriageways);
- •
- Element type (crossing or unsignalized intersection, roundabout, signalized intersection, intersection with traffic lights, tangent, curve, vertical curve or bottleneck, grade, tunnel), based on the road element type record, with only two further simplifications: crossings were merged with unsignalized intersections given their similar practical meaning (uncontrolled accesses, see also [29]) in the dataset and rail crossings (an almost empty class) were merged with intersections with traffic lights, given that road-rail crossings are governed by traffic lights as well;
- •
- Signage (no signs, only vertical signs, only horizontal signs, both horizontal and vertical signs, temporary work zone signs);
- •
- Crash type (angle, head-on, sideswipe, rear-end, pedestrian hit, hit, run-off, under braking or fallen from vehicle), based on the crash type record, with only two further simplifications: all hit crashes with stopped vehicles or other obstacles were merged together in a general “hit” category and injuries that occurred under braking or by falling from the vehicle were merged together given that their atypical mechanism differs from that of usual traffic crashes;
- •
- Heavy vehicle (HV) involved (yes, no), based on the records of types of vehicles (max. three vehicles) involved in the crash; yes means at least one HV involved;
- •
- Two-wheeled (TW) vehicle involved (yes, no) based on the same records described above; yes means at least one TW vehicle involved;
- •
- Distracted driver involved (yes, no) based on the crash circumstance record associated with the drivers (for max. two drivers) involved in the crash, including possible police-reported traffic violations; yes means at least one involved driver for whom a distracted or erratic behavior violation was recorded;
- •
- Speeding driver involved (yes, no) based on the same records described above; yes means at least one involved driver for whom a driving-too-fast-for-conditions or speed-limit violation was recorded;
- •
- Driver with other aberrant behavior involved (yes, no) based on the same records described above; yes means at least one involved driver for whom another traffic violation other than speeding or distraction was recorded;
- •
- Vehicle with issues involved (yes, no) based on the issues (e.g., mechanical failures) record associated with vehicles (for max. two vehicles) involved in the crash, yes means at least one involved vehicle for which an issue was recorded;
- •
- Old vehicle involved (yes, no) based on the year of registration of the vehicles involved in the crash (for max. three vehicles), yes means at least one involved vehicle registered before 2014, the year in which some safety systems (e.g., the Electronic Stability Control) became mandatory in the European Union;
- •
- Young driver involved (yes, no) based on the age record associated with the drivers (for max. three drivers) involved in the crash; yes means at least one involved driver who was less than 30 years old;
- •
- Old driver involved (yes, no) based on the same records described above; yes means at least one involved driver who was more than 64 years old;
- •
- Female driver involved (yes, no) based on the sex record associated with involved drivers (max. three drivers), yes means at least one female driver involved;
- •
- Fatal crash (yes, no);
- •
- Hour (late night: 00:00–02:59, dawn: 03:00–05:59, morning rush hours: 06:00–08:59, late morning: 09:00–11:59, early afternoon: 12:00–14:59, afternoon: 15:00–17:59, evening: 18:00–20:59, night: 21:00–23:59) based on the hour record associated with the crash, aggregated into three-hour groups;
- •
- Season (winter: January, February, March; spring: April, May, June; summer: July, August, September; autumn: October, November, December).
This dataset is updated with respect to a previous version used for a preliminary exploratory study conducted by the same authors [30], considering only the rural environment and a single-step analysis for associating crash factors on wet pavements. Descriptive statistics reporting the percentage split of the modalities of each of the above-reported categorical variables are presented in the next table, classified by road jurisdiction, according to the objectives of this study. The four jurisdictions considered are: municipality, province, state and motorway managing agency. These are the main levels of Italian road authorities, also reflecting an increasing scale of importance from municipal roads to motorways:
- •
- Municipality-managed roads are mainly urban streets and suburban roads or minor local rural roads in the municipality areas;
- •
- Province-managed roads are mainly rural collector roads;
- •
- State-managed roads are mainly rural arterial roads;
- •
- Motorways, are multi-lane access-controlled primary roads with separated carriageways.
The four above-mentioned classes account for about 97% of crashes in the dataset. Hence, given the very rare occurrence of both region-managed (which are present only in a few Italian regions) and “other” roads (for which a jurisdiction is not clearly defined), these two classes were excluded from further analyses. Defining the jurisdiction does not automatically define the road cross-section, which may vary for each level of the network, even if double carriageway roads are more frequent with increased road importance (especially considering the rural environment) and one-way roads are more frequent on municipal roads. Hence, in this study, the cross-sectional variability was investigated after grouping by road jurisdiction to reveal its additional influence, without further disaggregating the dataset.
2.2. Data Analysis Methods
In this sub-section, the methods used for multi-level data analysis are presented. Given the objectives of this study, two main steps are considered: (1) the identification of factors related to crashes on pavements affected by adverse weather conditions and (2) the association between crash-related factors under the same above-mentioned conditions.
2.2.1. Methods for Identifying Factors Related to Crashes on Pavements Affected by Adverse Weather Conditions
Two complementary approaches are used for identifying factors related to crashes on pavements affected by adverse weather conditions (see also [31]). Both a traditional approach, based on the application of a binary logistic regression model, and a machine learning approach, based on Gradient Boosting classification, are used for this purpose, briefly defined as follows. In both approaches, the outcome variable is the pavement condition related to the crash. Other adverse weather conditions which result in pavement conditions other than wet account for only about 1% of total cases, unlike other geographic contexts in which icy and snowy pavements are more relevant for safety studies [32]. Given this, the outcome variable was assumed to be binary, with the following modalities:
- •
- 0 = Dry pavement;
- •
- 1 = Other conditions, meaning a pavement affected by adverse weather conditions (wet, icy, snowy, otherwise slippery).
The logistic regression model is expressed as follows:
where
- p(k) is the probability associated with case k, equal to ;
- are model coefficients representing, respectively, the intercept and the i-th coefficient estimates associated with the predictor variables ;
- ε = error term.
Given this structure, by exponentiating each model coefficient, it is possible to obtain the odds ratio (, that is the ratio of the odds of observing a crash on a road pavement affected by adverse weather conditions to the odds of observing a crash on dry pavement, for a given modality of the variable with respect to the reference modality (in the case of categorical variables), controlling for the other variables. Considering the objectives of this study, four separate models were estimated, one for each considered jurisdiction, including the full set of categorical variables previously defined in Table 1. All categorical variables with more than two modalities (non-binary) were transformed into binary dummy variables to independently assess their significance. In these cases, one of the dummy variables representing the different modalities was omitted from the model to avoid perfect multicollinearity. The assessment of model goodness of fit was based on likelihood ratio tests against the null model and on the pseudo-R2 estimation. The modeling process was run in the Stata 19 environment.
Table 1.
Descriptive statistics of the four subsets of data obtained from the original dataset of 505,778 fatal + injury crashes for each jurisdiction (percentage split of the modalities of each categorical variable used).
The Gradient Boosting model is a tree ensemble model used in this case for a binary classification problem (above-defined outcome variable: pavement conditions) and relies on additive functions [33,34]. The model is trained by iteratively adding those functions which provide the best improvement, considering the minimization of a given loss function as the target, in this case the Bernoulli loss function expressed as follows:
where varies between 0 and 1, and is the estimated probability that the i-th observation belongs to class 1 of the outcome variable.
At each step, tree structures are built and scored, while in subsequent steps the branches which provide the best possible split are added. In this study, the Stata19 algorithm via H2O was used for model training and evaluation, which also requires tuning a vector of hyperparameters. Hyperparameters were tuned through a random grid search algorithm, considering the following intervals for each hyperparameter: number of trees (20–100), learning rate (0.01–0.20), maximum tree depth (1–10), minimum number of observations for a leaf split (1–15). Furthermore, 10-fold stratified cross-validation was used to preserve the distribution of positive and negative outcomes across folds. The following metrics were also considered:
where true positives, = false positives, = false negatives.
These baseline metrics are combined to derive more complex performance metrics such as the AUCPR (area under precision–recall curve) and the F1-score, defined below:
After the model definition, two additional approaches were used to help with the model interpretation (see, e.g., [35]) namely:
- •
- Variable importance, which is a measure of the influence of each variable on the outcome (which can be expressed as a percentage of importance among the full list of variables), used to assign variable ranks accordingly. It is based on a metric calculated by summing the squares of relative improvements associated with node splits and by using the cross-entropy as an impurity measure [36], averaging over all the trees;
- •
- SHAP (Shapley Additive exPlanations) values [37], which are used to explain the obtained machine learning model through a simple linear model defined as follows:where represents each input binary variable and is the Shapley value, which is the effect attributed to each variable, calculated as the weighted average of the differences between predictions obtained from models trained including that variable and models not including the same variable. After having calculated mean Shapley values, the stability of the top three variables in terms of variable importance was assessed by means of bootstrap resampling, checking that the same top three variables were ranked among the top three in at least 95% of simulations for each model.
2.2.2. Methods for Finding Associations Between Factors
The second step of the analysis is dedicated to find associations between factors specifically related to crashes that occurred on pavements affected by adverse weather conditions. In this case, since the focus is shifted to a particular category of the outcome variable and given the vast prevalence of wet conditions among the adverse weather conditions, associations are sought between factors related to wet pavement crashes. The technique used for this step of analysis is the Association Rule Mining (ARM) approach, which is commonly used for identifying hidden associations between variables in a dataset, also in road safety research [38,39,40,41]. Finding frequent associations between factors (sets of items) through this approach implies that causal implications and predefined assumptions on the relationships between variables and on the parameter distributions are not necessary, resulting in a flexible yet powerful approach. This approach is used in this study through the application of the Apriori algorithm [42], briefly described as follows. First, the associations to be searched should be defined in terms of association “rules”, setting the number of antecedents (also called left-hand itemsets (LHS), or, in the simplest terminology, each antecedent can be identified with the letter X) and consequents (also called right-hand itemsets (RHS), or simply identified with the letter Y). The association rule to be searched can be written as: X → Y. Among all the possible rules (associations of itemsets) present in the dataset, some measures are used to define and limit their extraction, typically Support (S), Confidence (C) and Lift (L). These measures are defined as follows, with respect to both the rule X → Y and the single itemsets X and Y:
where N is the total number of observations, is the total number of occurrences of the X and Y itemsets taken together, Support measures the probability of the co-occurrence of the X and Y itemsets in the dataset, Confidence measures the probability of occurrence of the Y itemset, given that the X has occurred, Lift measures the interdependence between X and Y, indicating the strength of the association (if greater than 1).
Thresholds for Support and Confidence are first defined to limit the extraction of rules and afterward, another Lift threshold can be used to highlight only the strongest associations. In particular, in this study, Support, Confidence and Lift are set to 0.06, 0.40 and 1.30, a maximum of three items is set for the X itemset and a maximum of one item for the Y itemset for the sake of easing the interpretability of the results. Fisher’s exact tests were used to assess the statistical significance of each mined rule. Moreover, the rules extracted and filtered based on the Lift measures can be further analyzed with respect to rules having one fewer item in the itemset and further pruned if the ratio of the two lifts is below a given threshold [41]. In this study, this test is expressed as follows:
The procedure described here is separately applied to the four subsets of the initial dataset of crashes that occurred on wet pavements, divided according to the road jurisdiction. The whole described process was implemented in R (using the arules package). The results obtained from this step, taking into account those obtained from the first step, will also be discussed from the perspective of the Safe System approach, that is, considering road-, driver-, vehicle- and speed-related factors (post-crash care is the only aspect not considered here given that there are no relevant variables for taking it into account).
3. Results
The presentation of results is divided according to the two main steps of the methodological framework described in the previous section: the first step is dedicated to the analysis of factors related to crashes that occurred on pavements affected by adverse weather conditions and the second step to the identification of associations between crash-related factors.
3.1. Results from the First Methodological Step
The results from the application of the first methodological step are presented as follows, divided according to the two complementary approaches used, logistic regression and Gradient Boosting.
3.1.1. Results from the Logistic Regression Models
Results from the four logistic regression models, built by selecting the pavement conditions as the binary classification outcome (0: Dry, 1: Otherwise) are shown in Table 2 below. The odds ratios related to each categorical variable used as an independent predictor are separately shown for the four road jurisdictions considered (in bold statistically significant coefficient estimates, at the p = 0.05 level).
Table 2.
Results of the binary logistic models applied to the four jurisdictions (outcome variable: pavement conditions, 0 = Dry, 1 = Otherwise), with odds ratios expressed for each independent binary (or dummy) variable included in the models (in bold if the corresponding p-values are less than 0.05 and underlined if they correspond to increased/decreased odds of the outcome of more than 25%) and information on model metrics at the end.
The analysis of the previous table is useful to highlight associations between crash-related factors and the considered outcome (adverse pavement conditions recorded in the crash dataset, with respect to dry conditions), focusing on statistically significant odds ratios, considering the ceteris paribus condition and the corresponding reference category while reporting on each variable, as follows. For years after 2022, crashes are more likely to be observed under adverse pavement conditions for all road jurisdictions, with a greater effect shown for 2024 (notable increase of the odds of the outcome for motorways, about +60%) than for 2023. It is less likely to observe crashes under adverse pavement conditions for all Italian regions other than the Northwest for all road jurisdictions, especially for islands (a reduction of about 50% of the odds for all road types) and southern regions in the case of municipal roads. The effect of large cities is mixed: except for municipal roads, mainly urban, in the areas of large cities, crashes are less likely to be observed under adverse pavement conditions. Weekends are instead constantly associated with a slightly decreased likelihood of the outcome for all road types. The effect of being on rural or urban roads is practically negligible on the outcome, once analyzing the phenomenon by jurisdiction classes. The same holds for the effects of cross-section, which seem almost irrelevant once jurisdiction is defined. The influence of the element type seems much more significant instead, considering the baseline tangent segment category. While the influence of crossings and signalized intersections is mixed and small, roundabouts and curves can be highlighted as the most influential element types, both resulting in a notable increase of the odds of the outcome, which also increases with the jurisdiction importance (up to 43% more for roundabouts on state roads, which are not present on motorways, and 146% more for curves on motorways). Except for motorways, the influence of grades is relevant as well (between 70% and 90% increased odds of the outcome of adverse crash-related pavement conditions). A mixed result is highlighted for tunnels, which are associated with a significantly increased/decreased odds of the outcome (+78%/−34%) for, respectively, provincial roads and motorways. Finally, a modest increase of the odds is noted for intersections with traffic lights in the case of municipal and provincial roads. Considering signage, its influence is practically irrelevant on the outcome, except for temporary work-zone signs, for which an increase/decrease in the odds of the outcome is noted for, respectively, municipal roads and motorways. As far as crash types are concerned, all types other than the omitted run-off category are associated with decreased odds of the adverse pavement condition outcome, with the only exception of cases in which people were injured in vehicles under braking or fell from vehicles. The decreased odds are relevant (about −50% or even less) for all road types in the case of sideswipe, rear-end and pedestrian hit crashes. The decreased odds for head-on and angle crashes are relevant as well even if less pronounced (also, the angle coefficient is not statistically significant for motorways). The positive association between the type under braking/falling from a vehicle should instead be highlighted for all road jurisdictions other than municipalities (an increase in odds of more than 100%). The involvement of heavy vehicles is associated with a pronounced decrease of the odds of the outcome for all road types (a reduction of up to −68% for state roads), while the decreasing effect is less relevant in the case of two-wheeled vehicles involved. The associations between traffic violations by the drivers involved in crashes and the adverse pavement condition outcome are less evident and straightforward. The only constant effect across road types, even if small, is the increase in the odds of the outcome associated with speeding drivers involved. The influence of vehicle issues (e.g., mechanical failures) is negligible, except for motorways, where they are associated with a significant decrease in the odds of the outcome. Vehicle and driver age provide in general a similar small effect for all road types: increased odds of the adverse pavement condition outcome for older vehicles and younger drivers involved in the crash, while an opposite tendency was observed for old drivers involved (particularly relevant for motorways: −26%). The driver sex seems practically irrelevant instead. Fatal crashes are associated with a slightly decreased odds of the outcome (statistically insignificant for motorways). Considering hours, all hour ranges other than the omitted morning hours (6 a.m.–9 a.m.) are associated with decreased odds of the outcome when compared with morning hours. The most significant difference is for the afternoon hours from 12 p.m. to 6 p.m., where the odds of the outcome decrease for all road types in the indicative range between −30% and −50%. The seasonal influence is significantly present for all seasons and road types, with very large increases in odds of adverse pavement condition outcome for winter (from about 50% more in the case of motorways to 93% more for state roads) and, mostly, for autumn (between 115% and 140% more for all road types). The inverse effect is noted for summer (a decrease in odds of about 40% for all road types).
3.1.2. Results from the Gradient Boosting Models
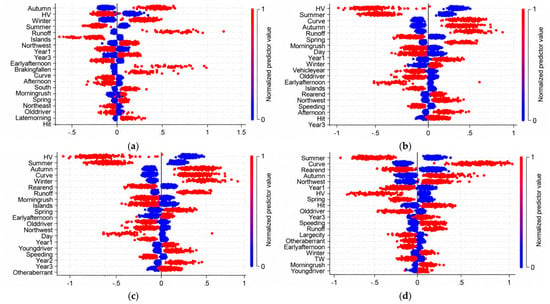
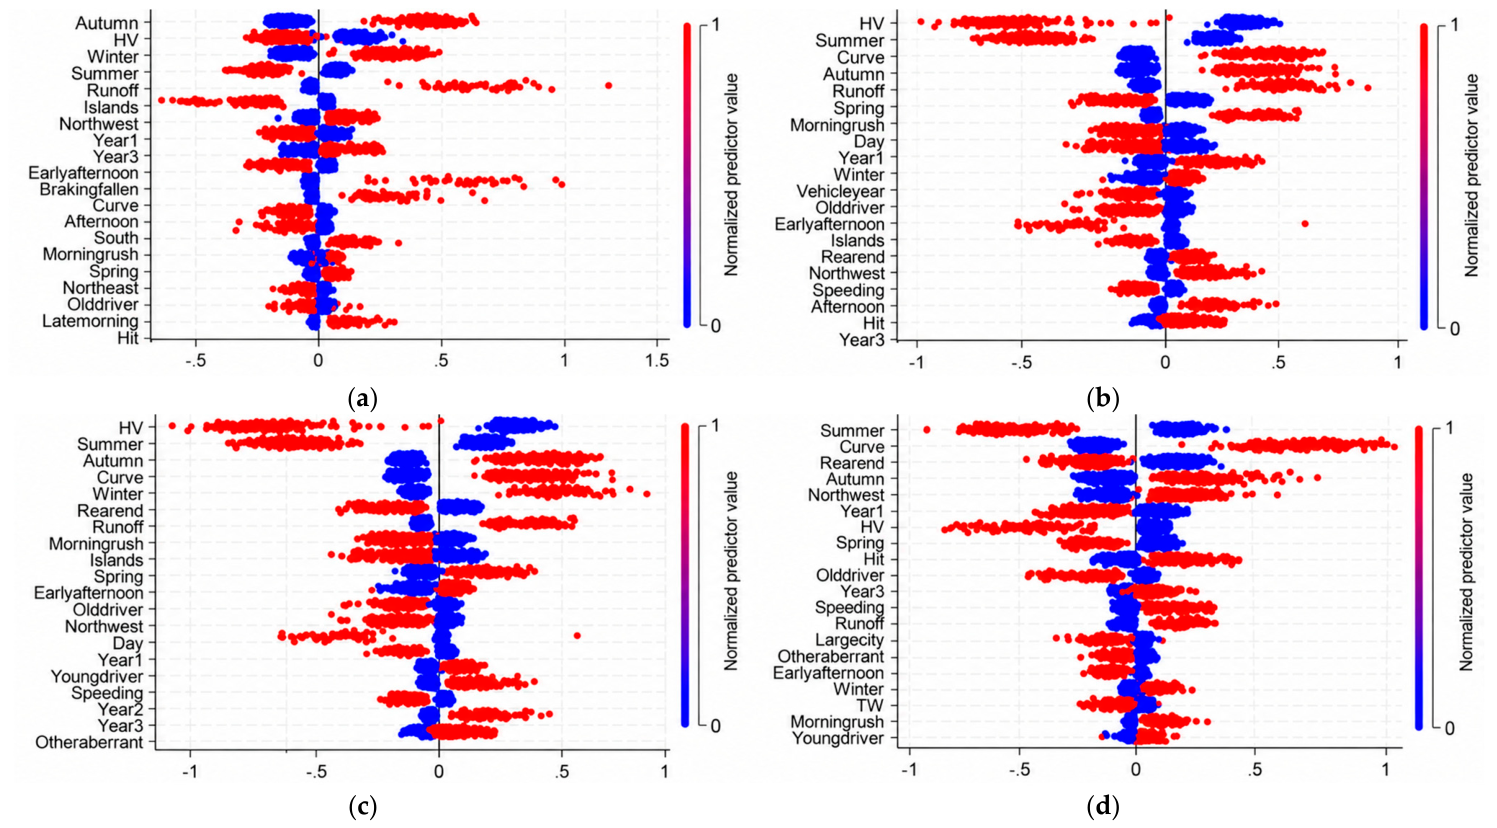
Results from the four Gradient Boosting models, one for each road jurisdiction, built by selecting the pavement conditions as binary classification outcome (0: Dry, 1: Otherwise) are shown in Table 3 and Figure 1 below. In particular, the two metrics used for interpreting model outputs are presented, i.e., the variable importance in Table 3 (in terms of proportion, the ranked top twenty variables are shown) and a graphical summary of the computed SHAP values in Figure 1 (the top twenty variables are shown in this case too).
Table 3.
Results of the Gradient Boosting models for binary classification (outcome variable: pavement conditions, 0 = Dry, 1 = Otherwise) applied to the four jurisdictions. The top twenty predictors are listed according to their proportional importance (ranks are reported from 1 to 20 and proportional importance in bold if ≥5%); other predictors are omitted; model parameters and metrics are at the end.
Figure 1.
Summary of the SHAP values computed for the top twenty predictors of the four GBoost models (SHAP contribution on the x-axis and normalized predictor values from 0 to 1 on the y-axis): (a) town, (b) province, (c) state and (d) motorway.
The coupled analysis of Table 3 and Figure 1 above is useful to highlight the effects of crash-related factors on the outcome, based on the machine learning approach used. In this case, there are no reference categories for the variables considered, so their contribution can be independently assessed. In summary, the most relevant contributions to the adverse pavement condition outcome according to the variable importance metric, which are common to all road jurisdictions, are provided by:
- •
- The presence of curves (especially in the case of motorways, for which this is the most important variable, and state roads, with relative importance values of 21% and 13%, respectively);
- •
- The involvement of heavy vehicles (especially for provincial and state roads, the most important variable for both categories, with relative importance values of 18% and 16%, respectively);
- •
- The autumn season (especially for municipal roads, for which this is the most important variable, with a relative importance value of 16%);
- •
- The summer season (especially for provincial and state roads, with relative importance values of 12% and 10%, respectively).
Some other relevant effects which can be noted for specific jurisdictions are the rear-end and hit crash types for motorways (both with a relative importance of 5%), the run-off crash type for municipal and provincial roads (with a relative importance of 7% in both cases) and the under braking/falling from vehicle type for municipal roads (6%). Moreover, morning rush hours are particularly relevant for provincial roads (with a relative importance of 5%), the winter season for municipal roads (9%) and the spring season for provincial and state roads (at 6% in both cases).
The interpretation of both magnitude and sign of the effect can be obtained by looking at graphs in Figure 1. Positive correlations with the adverse pavement condition outcome are evident for all road types (with different magnitudes) for the autumn season, run-off crash type and road curves. Negative correlations for all road types are evident for (with different magnitudes in this case too) heavy vehicles involved and the summer season. The interpretation of the sign of the effect for other variables specific to some road jurisdictions is generally in line with the results obtained from the logistic regression models.
3.2. Results from the Second Methodological Step
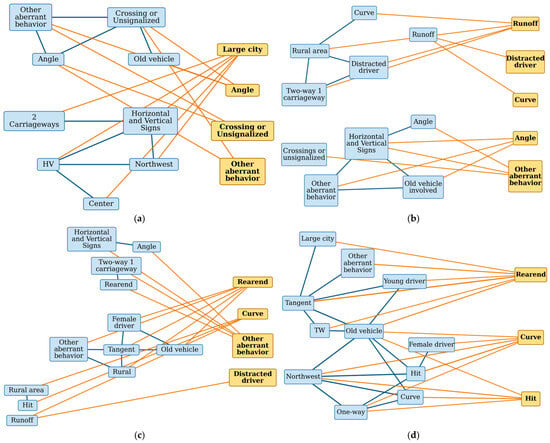
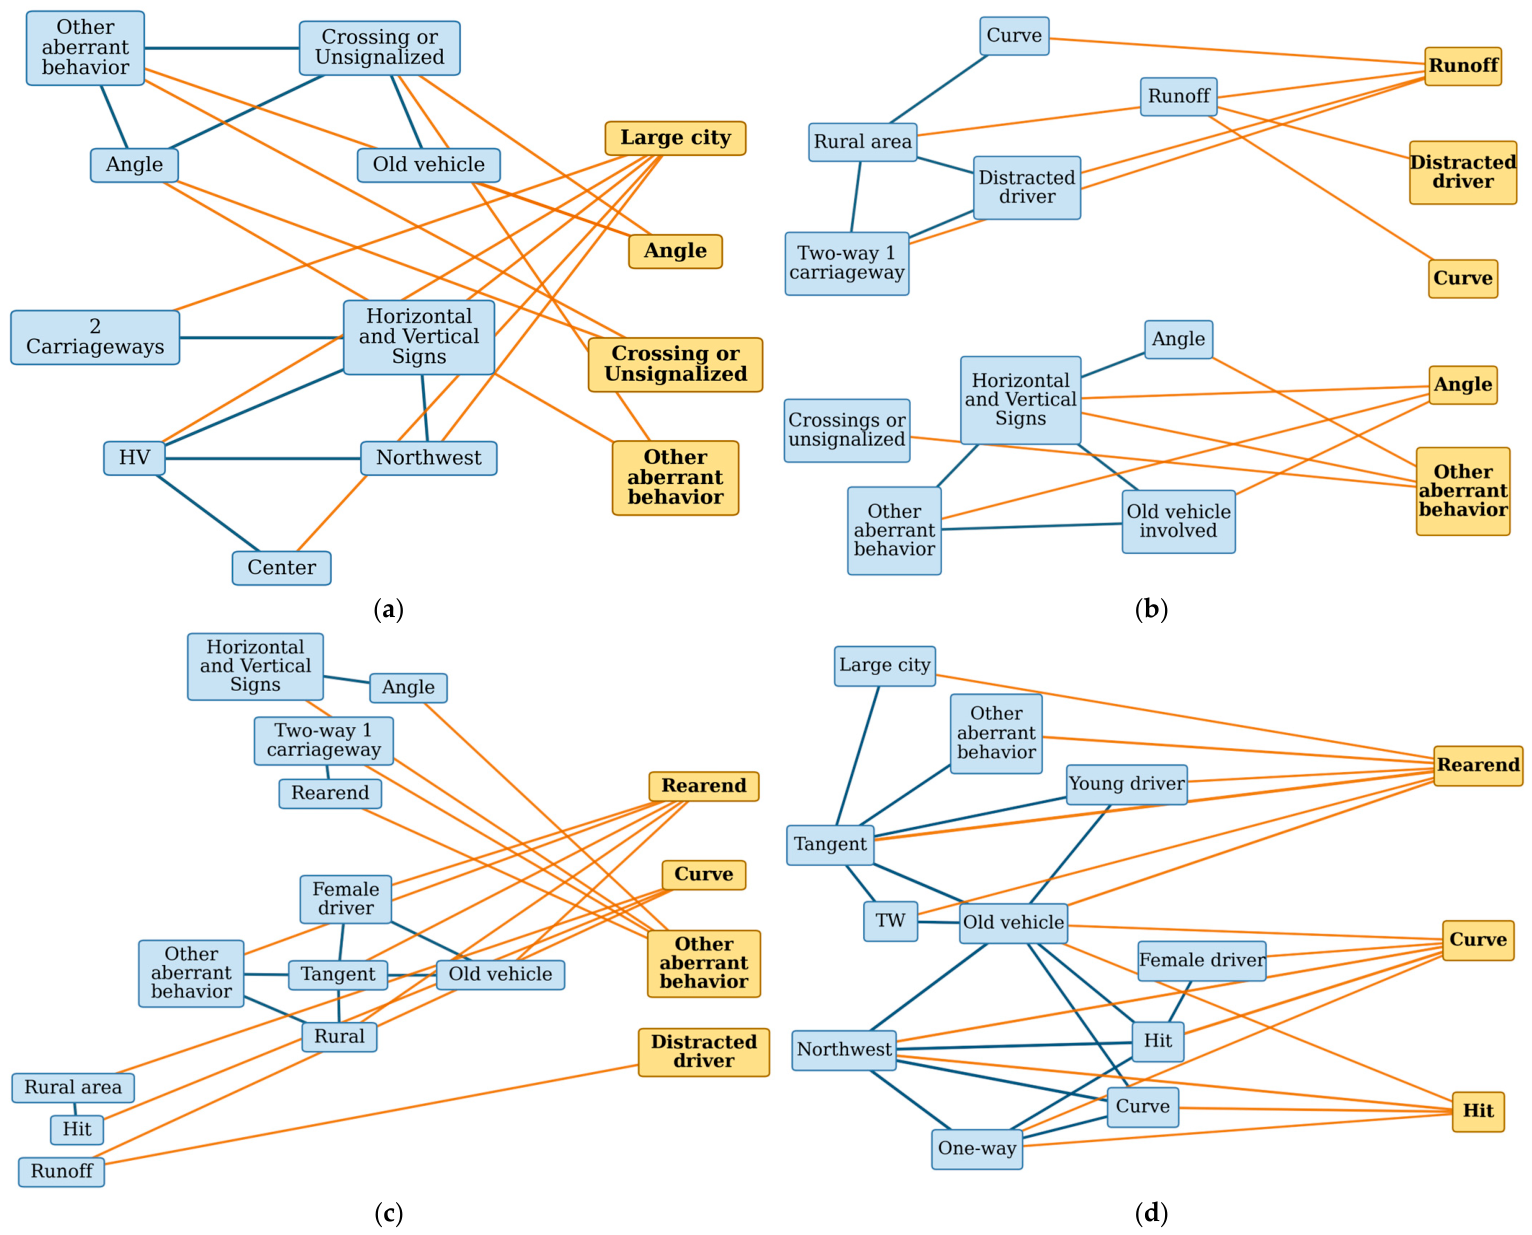
The results from the application of the second methodological step, based on the application of the Association Rule Mining (ARM) technique, are presented as follows in Table 4. It reports the top twenty rules mined from the dataset of crashes on wet pavements, separately analyzed for the four jurisdictions considered (ordered according to decreasing values of the Lift metric). The same rules are graphically condensed in Figure 2 below, in which associations between the antecedents and the consequent item are depicted for the top ten rules only, for the sake of visual clarity.
Table 4.
Rules mined in the dataset of crashes on wet pavements of the four jurisdictions (top twenty rules are shown for each jurisdiction, listed according to Lift decreasing values).
Figure 2.
Graphical depiction of the mined association rules between X and Y itemsets in the dataset of crashes on wet pavements for: (a) municipality roads, (b) provincial roads, (c) state roads, (d) motorways.
The analysis of both Table 4 and Figure 2 is useful to reveal the most frequent associations between factors related to wet pavement crashes for different jurisdictions. In this case, associations between factors vary considerably among different road jurisdictions. Focusing on the top ten rules, as far as municipal roads are concerned, the most relevant associations are between crossings, other aberrant behaviors and angle crashes; large cities and two-carriageway roads (including also road signs in one rule); large cities and heavy vehicles (including also central/northwestern Italy in two rules). For provincial roads, it can be noted that run-off road crashes occur in association with distraction (also coupled with two-way and rural roads) or rural road curves; crossings and angle crashes (also associated with old vehicles) are precursors of other aberrant behaviors of involved drivers; rear-end crashes are associated with tangents. Considering state roads, rear-end crashes are associated with tangents (and also with other aberrant behaviors in two rules, in one case with rural areas, and with female drivers in two other rules, in one case with old vehicles); run-off crashes with distracted drivers; curves with hit crashes (and a rural area in one rule) and run-off crashes; other aberrant behaviors are preceded by the rear-end and angle crashes (with two-way roads also associated with rear-end crashes, and road signs also associated with angle crashes). Finally, for motorways, more complex relationships are highlighted. Rear-end crashes are preceded by tangents, also coupled with other aberrant behaviors, or with a large city, or with old vehicles (in the latter case, associated also with two-wheeled vehicles or young drivers); curves are associated with hit crashes and in most cases with northwestern Italy (in the latter case, also with a one-way carriageway or with old vehicles and, in one rule, with female drivers).
4. Discussion
The multi-step methodology applied in this study was useful in revealing factors associated with crashes occurring on road pavements affected by adverse weather conditions and to further find associations between them for the most frequent case of wet pavement conditions. This analysis was separately conducted for the four main Italian road jurisdictions: municipal roads, provincial roads, state roads and motorways. The methods used for the first part related to the identification of factors related to adverse pavement weather conditions included both traditional and machine learning approaches, and thus, the results are in some cases heterogeneous. However, they are here generally discussed, trying to catch the main common trends and comparing them with previous research. In particular, the results obtained are here discussed by grouping them in light of the Safe System approach, i.e., considering road-, speed-, driver-, and vehicle-related factors. The discussion necessarily considers that, in several cases, results vary according to the different road jurisdictions considered.
4.1. Discussion of Results from the Study Related to Road Factors
Considering the effect of road-related factors on the likelihood of observing crashes on pavements affected by adverse weather conditions, the different road geometric elements seem to be the most influential factors. In particular, the effect of curves is the most evident for all road jurisdictions, particularly for motorways and, to a minor extent, for state and provincial roads. This was largely expected given that adverse pavement conditions are related to reduced friction, which can surely affect skidding risk [2,8,10,43,44]. An increase in the likelihood of observing crashes in adverse pavement conditions also emerges for grades with respect to tangents from the logistic regression model, in this case for roads of lower importance than motorways. Clearly, in this case too, the friction demand may be greater on longitudinal grades [8], similar to curves in their association with rainy weather crashes [11]. However, it is important to note that, in the case of motorways, pavement friction should be higher than that on other minor roads but while grades are not particularly associated with an increased likelihood of crashes under adverse pavement conditions, curves are the most important factor according to the machine learning approach. The use of high-friction surfaces at risky locations such as road curves, with different possible materials (see e.g., [45,46]) is a well-known safety measure to mitigate such crashes in adverse wet conditions. The effect of roundabouts can again be attributed, for essential geometric reasons, to that of horizontal curves. Pavement conditions are indeed among the factors to be considered for roundabout safety [47]. It is important to note that curves are found to be often associated with specific crash types on wet pavements based on rule mining: mostly run-off-road crashes (see also [11]) for provincial and state roads, and collisions with obstacles for state roads and motorways. On the other hand, tangents are associated with rear-end crashes for the major roads, especially motorways, similarly to what was found by Golob and Recker [48] in the case of congested flows. Finally, angle crashes on municipal roads, which are mainly urban, are associated with unsignalized intersections.
Other road-related factors considered are cross-section and signage; both were found to be scarcely relevant in this study. The limited relevance of the cross-section factor (which is usually relevant while considering adverse pavement conditions, see [49]) can be explained by the separate analyses made in this study for different road jurisdictions. This may have absorbed a great part of the cross-sectional variability given that, for example, most municipal and provincial roads are two-way, two-lane rural roads, while all motorway segments (except for ramps) are divided. The same holds for the rural area variable, considering that most municipal roads are urban and vice versa for the other roads. The approach followed in this study could also be compared in future research with multi-level modeling (see, e.g., [50,51]), including jurisdiction as a grouping variable.
Even if they are not directly related to the road infrastructure, several road environment-related factors were considered, such as geographic, day, hour, and seasonal factors. The great influence of seasonal factors was widely expected given the close relationship with weather and precipitation [5,18,24,25,52]. In this study, winter (see also [53]) and especially autumn are more associated with crashes under adverse pavement conditions compared to summer. However, the influence of adverse weather conditions on crashes may also largely vary within the same country [20,53], as found in this study in the difference between northwestern Italy and the other macro-regions. Moreover, it was found that morning rush hours and weekdays are associated with an increased likelihood of crashes in adverse pavement conditions with respect to other hours and weekends. Even if traffic exposure is not considered in this crash dataset-based study, this effect could be explained by increased exposure to risk during rush hours and weekdays.
4.2. Discussion of Results from the Study Related to Speed Factors
The only speed-related factor directly considered in this study is the speeding violation (above the speed limit or too fast for conditions) record associated with a driver involved in the crash on a road pavement affected by adverse conditions. The effect of speeding was positively related to the likelihood of observing those crashes, consistent with previous research (e.g., [44] for rural two-lane highways). However, it was found not to be particularly relevant in this study. In fact, unlike other violations (distraction or other aberrant behaviors), it is not included in the top twenty rules extracted in the case of wet pavement crashes for all road jurisdictions.
However, it is important to state that the classification into road jurisdictions works as a proxy variable for several other measures not derivable from the dataset used in this study. In fact, apart from geometric differences, design and operating speeds drastically increase from municipal roads to motorways. Several of the tendencies found for the different jurisdictions may also be attributed to different speed regimes. This, for example, is reflected in the different crash types and the associations highlighted between crash types and road elements for the different jurisdictions, as discussed in the previous sub-section. Thus, speed management strategies should take into account different road types and the influence of adverse weather conditions [3]. Finally, results concerning the variable fatal crash are also interesting, considering that a fatal crash was associated with a decreased likelihood of an adverse pavement condition crash in the logistic regression model. This relationship can be again mediated by speed, considering the well-known relationship between average speed and fatal crashes [54] and the possibility that drivers could reduce speeds under adverse weather conditions [55].
4.3. Discussion of Results from the Study Related to Driver Factors
Several driver-related factors were directly considered in this study. First, records of traffic violations included in the dataset for drivers involved in crashes were particularly useful to consider relationships between crashes and aberrant behaviors. Second, information about age and sex of drivers was also considered. As far as behavioral aspects are concerned, apart from speeding discussed in the previous sub-section, they were found to be slightly associated with an increased likelihood of crashes under adverse pavement conditions by showing mixed effect signs. In contrast to expectations, for jurisdictions in which the effect was significant (provincial and state roads in the logistic regression models), the involvement of distracted drivers was associated with a decreased likelihood of adverse pavement condition crashes. The effect of other aberrant behaviors is instead mixed, positively related to the outcome for municipal roads and negatively related to the outcome for provincial and state roads. As regards distraction, it is possible that adverse weather conditions lead drivers to be more attentive to the road [13,14,55]. However, by analyzing results from the association rule mining for wet crashes, distraction was specifically related to run-off for both provincial and state roads, a result to be highlighted (see also [56]). In the case of other aberrant behaviors, they are often associated with different crash types, mostly angle on municipal roads and rear-end on other roads.
Considering age variables, a twofold tendency emerges: young drivers are associated with an increased likelihood of an adverse pavement condition crash for all jurisdictions, while older drivers show the opposite tendency (especially for motorways). This could be explained by a lack of experience or by the well-known effects of more aggressive behaviors for young drivers and risk avoidance for older drivers [57], who can also choose not to drive under adverse weather conditions. Interesting patterns emerging for young drivers in the case of wet crashes on motorways are the relationships with tangents (and also old vehicles) preceding rear-end crashes and hit crashes on preceding curves (see also [58] for very young drivers). On the other hand, the effect of sex (captured through the variable female driver involved) is less significant.
4.4. Discussion on Results from the Study Related to Vehicle Factors
The last category of factors considered in this study comprises vehicle-related factors. They are directly captured through the variables heavy or two-wheeled vehicle involved, vehicle age (old vehicle involved) and vehicle with issues involved. The variable heavy vehicle involved was found to be the most influential in classifying crashes into dry/not dry pavement conditions for provincial and state roads, and very influential for the other road types. In this case, the relationship is inverse (a decreased likelihood of adverse pavement condition crashes). This can be again explained by heavy vehicle drivers being particularly prudent under adverse weather conditions. Still, there are some rules including heavy vehicles for municipal roads, which associate them with large northwestern and central Italian cities or tangents. Previous research [59] focused on the relationships between trucks and improper braking at horizontal curves, an association which was not highlighted in this study. Moreover, although less pronounced, the effect of two-wheeled vehicles is opposite to that of heavy vehicles for all jurisdictions. Although, as already mentioned, this aspect may be mediated by speed and friction, the relationship between speed choice and adverse weather conditions for both categories of heavy and two-wheeled vehicles is not straightforward [60,61]. It should be noted that the mined association rules for wet crashes include two-wheeled vehicles in association with motorway tangents preceding rear-end crashes.
Finally, while the influence of vehicle issues is almost negligible, vehicle age is associated with an increased likelihood of an adverse pavement condition crash for all jurisdictions. This can be clearly explained by vehicles manufactured before 2013 having less efficient assistance systems or being devoid of assistance systems, which can be particularly useful while braking (see, e.g., [62]). In fact, the old vehicle factor was consistently included in several of the rules mined for all road jurisdictions.
5. Conclusions
This study used a multi-step methodology based on both a traditional statistical approach and machine learning techniques (gradient boosting) to reveal factors associated with crashes on pavements affected by adverse weather conditions. The associations between factors were studied in detail through an association rule mining approach, applied to the dataset of wet crashes. The dataset covering the most recent three-year period (2022–2024) of fatal + injury crashes occurred in Italy was used for the aims of this study. In both analysis stages, results were differentiated by road jurisdiction, considering four categories: municipal roads, provincial roads, state roads and motorways.
Results obtained from the logistic regression and the gradient boosting models in the first analysis step were coherent and complementary. Several factors were found to be associated with crashes under adverse pavement conditions, in some cases varying across road jurisdictions. Among them, the curve factor was one of the most relevant for all road jurisdictions (but especially for motorways), together with autumn and winter months. The hour factor was significant as well (particularly the effect of morning rush hours). Hit and rear-end crash types were found to be influential mainly for motorways, while run-off crashes were influential for municipal and provincial roads. The involvement of heavy vehicles in crashes was found to have an inverse relationship with crashes under adverse pavement conditions for all road jurisdictions, as well as for the summer season. Several relationships between crash factors were further identified in the second analysis step based on the association rule mining and discussed by covering four fundamental pillars of the Safe System approach: road- (including environment-), speed-, driver-, and vehicle-related factors.
Findings from this study were based on the baseline crash dataset, so they are specific to the Italian context. Nevertheless, several relationships found in this study are coherent with international research, based on the comparison with literature documented in the discussion section. Another limitation deriving from the source used (a crash dataset) is the absence of traffic exposure data or direct information about weather and precipitation data, which could be obtained for further research on the topic. However, it is important to note that the main objective of this study was to highlight associations with/between crash-related factors and not establishing crash frequency models for adverse weather conditions. Moreover, only few information about drivers involved in crashes are included in the publicly available dataset, e.g., with no records about driving under influence or drunk driving. If available, such information can be considered for further research, given its potential relevance.
As a concluding note, this study provides insights for road safety practitioners and researchers. In particular, the classification of results by road jurisdiction provides useful information about aspects which need particular attention to the different road managing agencies. For example, the role of the curved horizontal alignment factor, specifically highlighted for motorways (and for state roads, to a minor extent) should be urgently tackled, as well as the run-off-road crash type for minor roads. Speed management, roadside protection, friction improvement and continuous monitoring through advanced survey systems could be considered as options in this sense.
Author Contributions
Conceptualization, P.I., G.L. and V.R.; methodology, P.I.; software, P.I.; investigation, P.I., G.L. and V.R.; data curation, P.I.; writing—original draft preparation, P.I.; writing—review and editing, P.I., G.L. and V.R.; visualization, P.I.; funding acquisition, P.I. All authors have read and agreed to the published version of the manuscript.
Funding
This research was funded by the Italian Ministry of University and Research (MUR) under the PRIN 2022 (Scorrimento delle graduatorie finali - Advancement of final rankings list) Program, Research Project: “2022J92NBA - Artificial Intelligence for Smart Monitoring and Management in the Digital Transition of Transport Infrastructures - AISMoDiT”, grant number J53C24002890006 (CUP Master), CUP: F53C24000980006.
Data Availability Statement
The original datasets of fatal + injury crashes (2022–2024) used for this study are available from the Italian National Institute of Statistics (ISTAT) at: https://www.istat.it/microdati/rilevazione-degli-incidenti-stradali-con-lesioni-a-persone-3/, accessed on 26 May 2026.
Acknowledgments
During the preparation of this manuscript, the authors used ChatGPT (GPT-6) to help generate the code used for the Apriori algorithm in R and to graphically summarize the mined rules (Figure 2). The authors have reviewed and edited the output and take full responsibility for the content of this publication.
Conflicts of Interest
The authors declare no conflicts of interest.
References
- McGovern, C.M.; Rusch, P.F.; Noyce, D.A. State practices to reduce wet weather skidding crashes; United States Department of Transportation: Washington, DC, USA, 2011.
- Mayora, J.M.P.; Piña, R.J. An assessment of the skid resistance effect on traffic safety under wet-pavement conditions. Accid. Anal. Prev. 2009, 41, 881–886. [Google Scholar] [CrossRef] [Scilit]
- Coropulis, S.; Intini, P.; Introcaso, N.; Ranieri, V. Credible Variable Speed Limits for Improving Road Safety: A Case Study Based on Italian Two-Lane Rural Roads. Sustainability 2025, 17, 4833. [Google Scholar] [CrossRef] [Scilit]
- Park, J.; Abdel-Aty, M.; Lee, J. Use of empirical and full Bayes before–after approaches to estimate the safety effects of roadside barriers with different crash conditions. J. Saf. Res. 2016, 58, 31–40. [Google Scholar] [CrossRef] [Scilit]
- Qiu, L.; Nixon, W.A. Effects of adverse weather on traffic crashes: Systematic review and meta-analysis. Transp. Res. Rec. 2008, 2055, 139–146. [Google Scholar]
- Usman, T.; Fu, L.; Miranda-Moreno, L.F. Quantifying safety benefit of winter road maintenance: Accident frequency modeling. Accid. Anal. Prev. 2010, 42, 1878–1887. [Google Scholar] [CrossRef] [Scilit]
- Fwa, T.F. Skid resistance determination for pavement management and wet-weather road safety. Int. J. Transp. Sci. Technol. 2017, 6, 217–227. [Google Scholar] [CrossRef] [Scilit]
- Colonna, P.; Berloco, N.; Intini, P.; Perruccio, A.; Ranieri, V. Evaluating skidding risk of a road layout for all types of vehicles. Transp. Res. Rec. 2016, 2591, 94–102. [Google Scholar] [CrossRef] [Scilit]
- Colonna, P.; Berloco, N.; Intini, P.; Ranieri, V. The method of the friction diagram: New developments and possible applications. Transp. Infrastruct. Syst. 2017, 8, 309–316. [Google Scholar] [CrossRef] [Scilit]
- Intini, P.; Berloco, N.; Ranieri, V.; Colonna, P. Geometric and operational features of horizontal curves with specific regard to skidding proneness. Infrastructures 2019, 5, 3. [Google Scholar] [CrossRef] [Scilit]
- Das, S.; Dutta, A.; Sun, X. Patterns of rainy weather crashes: Applying rules mining. J. Transp. Saf. Secur. 2020, 12, 1083–1105. [Google Scholar] [CrossRef] [Scilit]
- Kassu, A.; Anderson, M. Analysis of severe and non-severe traffic crashes on wet and dry highways. Transp. Res. Interdiscip. Perspect. 2019, 2, 100043. [Google Scholar] [CrossRef] [Scilit]
- Mondal, P.; Sharma, N.; Kumar, A.; Bhangale, U.D.; Tyagi, D.; Singh, R. Effect of Rainfall and Wet Road Condition on Road Crashes: A Critical Analysis; SAE Technical Paper; International Centre For Automotive Technology: Manesar, India, 2011. [Google Scholar]
- Dell’Acqua, G.; De Luca, M.; Mauro, R.; Russo, F. Motorway crashes in wet weather: The comparative influence of porous and conventional asphalt surfacing. Procedia-Soc. Behav. Sci. 2012, 54, 618–627. [Google Scholar] [CrossRef] [Scilit]
- Tafazzol, S.; Sharif, H.; Gholikhani, M.; Ahsan, M.; Ghebreyesus, D.; Billah, K.; Furl, C. Relative crash risk and road safety during rainfall in Texas from 2006 to 2021. Sci. Rep. 2025, 15, 36749. [Google Scholar] [CrossRef] [Scilit]
- Park, E.S.; Carlson, P.J.; Pike, A. Safety effects of wet-weather pavement markings. Accid. Anal. Prev. 2019, 133, 105271. [Google Scholar] [CrossRef] [Scilit]
- Gorzelanczyk, P. Impact of weather conditions and road type on traffic safety. Eur. Transp. Stud. 2025, 2, 100042. [Google Scholar] [CrossRef] [Scilit]
- Bergel-Hayat, R.; Debbarh, M.; Antoniou, C.; Yannis, G. Explaining the road accident risk: Weather effects. Accid. Anal. Prev. 2013, 60, 456–465. [Google Scholar] [CrossRef] [Scilit]
- Drosu, A.; Cofaru, C.; Popescu, M.V. Fatal injury risk model (FIRM) of the road accidents that occurred in rainy conditions—A probabilistic approach. Int. J. Automot. Technol. 2021, 22, 1415–1426. [Google Scholar] [CrossRef] [Scilit]
- Jaroszweski, D.; McNamara, T. The influence of rainfall on road accidents in urban areas: A weather radar approach. Travel Behav. Soc. 2014, 1, 15–21. [Google Scholar] [CrossRef] [Scilit]
- Lobo, A.; Ferreira, S.; Iglesias, I.; Couto, A. Urban road crashes and weather conditions: Untangling the effects. Sustainability 2019, 11, 3176. [Google Scholar] [CrossRef] [Scilit]
- Becker, N.; Rust, H.W.; Ulbrich, U. Weather impacts on various types of road crashes: A quantitative analysis using generalized additive models. Eur. Transp. Res. Rev. 2022, 14, 37. [Google Scholar] [CrossRef] [Scilit]
- Becker, N.; Rust, H.W.; Ulbrich, U. Predictive modeling of hourly probabilities for weather-related road accidents. Nat. Hazards Earth Syst. Sci. Discuss. 2020, 2020, 1–26. [Google Scholar]
- Omranian, E.; Sharif, H.; Dessouky, S.; Weissmann, J. Exploring rainfall impacts on the crash risk on Texas roadways: A crash-based matched-pairs analysis approach. Accid. Anal. Prev. 2018, 117, 10–20. [Google Scholar] [CrossRef] [Scilit]
- Black, A.W.; Villarini, G.; Mote, T.L. Effects of rainfall on vehicle crashes in six US states. Weather Clim. Soc. 2017, 9, 53–70. [Google Scholar] [CrossRef] [Scilit]
- Larsson, P.; Dekker, S.W.; Tingvall, C. The need for a systems theory approach to road safety. Saf. Sci. 2010, 48, 1167–1174. [Google Scholar] [CrossRef] [Scilit]
- Elvik, R.; Nævestad, T.O. Does empirical evidence support the effectiveness of the Safe System approach to road safety management? Accid. Anal. Prev. 2023, 191, 107227. [Google Scholar] [CrossRef] [Scilit]
- Khan, M.N.; Das, S. Advancing traffic safety through the safe system approach: A systematic review. Accid. Anal. Prev. 2024, 199, 107518. [Google Scholar] [CrossRef] [Scilit]
- Perri, G.; Vaiana, R. Road safety management of uncontrolled access points: Design criteria and insights into risk factors. Appl. Sci. 2022, 12, 12661. [Google Scholar] [CrossRef] [Scilit]
- Intini, P.; Loprencipe, G.; Ranieri, V. Factors related to crashes on wet pavements of rural roads: A taxonomy for different severities and road classes under a safe system approach perspective. Paper Presented at the Road Safety and Simulation 2026—RSS2026 Conference, Napoli, Italy, 23–26 June 2026. [Google Scholar]
- Wang, C.; Serre, T. A hybrid approach to investigating factors associated with crash injury severity: Integrating interpretable machine learning with logit model. Appl. Sci. 2025, 15, 10417. [Google Scholar] [CrossRef] [Scilit]
- Andersson, A.; Chapman, L. The use of a temporal analogue to predict future traffic accidents and winter road conditions in Sweden. Meteorol. Appl. 2011, 18, 125–136. [Google Scholar] [CrossRef] [Scilit]
- Friedman, J.; Hastie, T.; Tibshirani, R. Additive logistic regression: A statistical view of boosting (with discussion and a rejoinder by the authors). Ann. Stat. 2000, 28, 337–407. [Google Scholar] [CrossRef] [Scilit]
- Friedman, J.H. Greedy function approximation: A gradient boosting machine. Ann. Stat. 2001, 29, 1189–1232. [Google Scholar] [CrossRef] [Scilit]
- Intini, P.; Blasi, G.; Fracella, F.; Francone, A.; Vergallo, R.; Perrone, D. Predicting traffic volumes on road infrastructures in the context of multi-risk assessment frameworks. Int. J. Disaster Risk Reduct. 2025, 117, 105139. [Google Scholar] [CrossRef] [Scilit]
- Breiman, L.; Friedman, J.H.; Olshen, R.A.; Stone, C.J. Classification and Regression Trees; Chapman and Hall/CRC: Boca Raton, FL, 1984. [Google Scholar]
- Lundberg, S.M.; Lee, S.I. A unified approach to interpreting model predictions. Adv. Neural Inf. Process. Syst. 2017, 30, 4765–4774. [Google Scholar]
- Montella, A. Identifying crash contributory factors at urban roundabouts and using association rules to explore their relationships to different crash types. Accid. Anal. Prev. 2011, 43, 1451–1463. [Google Scholar] [CrossRef] [Scilit] [PubMed]
- Hong, J.; Tamakloe, R.; Park, D. Discovering insightful rules among truck crash characteristics using apriori algorithm. J. Adv. Transp. 2020, 2020, 4323816. [Google Scholar] [CrossRef] [Scilit]
- Das, S.; Kong, X.; Tsapakis, I. Hit and run crash analysis using association rules mining. J. Transp. Saf. Secur. 2021, 13, 123–142. [Google Scholar] [CrossRef] [Scilit]
- Gu, C.; Xu, J.; Gao, C.; Mu, M.; E, G.; Ma, Y. Multivariate analysis of roadway multi-fatality crashes using association rules mining and rules graph structures: A case study in China. PLoS ONE 2022, 17, e0276817. [Google Scholar] [CrossRef] [Scilit]
- Agrawal, R.; Imieliński, T.; Swami, A. Mining association rules between sets of items in large databases. In Proceedings of the 1993 ACM SIGMOD International Conference on Management of Data, Washington, DC, USA, 26–28 May 1993. [Google Scholar]
- Peng, J.; Chu, L.; Wang, T.; Fwa, T.F. Analysis of vehicle skidding potential on horizontal curves. Accid. Anal. Prev. 2021, 152, 105960. [Google Scholar] [CrossRef] [Scilit]
- Wang, B.; Hallmark, S.; Savolainen, P.; Dong, J. Crashes and near-crashes on horizontal curves along rural two-lane highways: Analysis of naturalistic driving data. J. Saf. Res. 2017, 63, 163–169. [Google Scholar] [CrossRef] [Scilit]
- Woodward, D.; Friel, S. Predicting the wear of high friction surfacing aggregate. Coatings 2017, 7, 71. [Google Scholar] [CrossRef] [Scilit]
- Yang, F.; Guan, B.; Liu, J.; Wu, J.; Liu, J.; Xie, C.; Xiong, R. An investigation of the polishing behavior of calcined bauxite aggregate. Coatings 2019, 9, 760. [Google Scholar] [CrossRef] [Scilit]
- Gkyrtis, K.; Kokkalis, A. An overview of the efficiency of roundabouts: Design aspects and contribution toward safer vehicle movement. Vehicles 2024, 6, 433–449. [Google Scholar] [CrossRef] [Scilit]
- Golob, T.F.; Recker, W.W. A method for relating type of crash to traffic flow characteristics on urban Motorways. Transp. Res. Part A Policy Pract. 2004, 38, 53–80. [Google Scholar] [CrossRef] [Scilit]
- Sadeghi, P.; Goli, A. Investigating the impact of pavement condition and weather characteristics on road accidents. Int. J. Crashworthiness 2024, 29, 973–989. [Google Scholar] [CrossRef] [Scilit]
- Huang, H.; Abdel-Aty, M. Multilevel data and Bayesian analysis in traffic safety. Accid. Anal. Prev. 2010, 42, 1556–1565. [Google Scholar] [CrossRef] [Scilit]
- Intini, P.; Berloco, N.; Coropulis, S.; Fonzone, A.; Ranieri, V. Aberrant behaviors of drivers involved in crashes and related injury severity: Are there variations between the major cities in the same country? J. Saf. Res. 2024, 89, 64–82. [Google Scholar] [CrossRef] [Scilit]
- Faruga, Ł.; Filapek, A.; Kraszewska, M.; Baranowski, J. Dataset for traffic accident analysis in Poland: Integrating weather data and sociodemographic factors. Appl. Sci. 2025, 15, 7362. [Google Scholar] [CrossRef] [Scilit]
- Kuşkapan, E.; Çodur, M.Y.; Sahraei, M.A. Investigation of the effect of slope and road surface conditions on traffic accidents occurring in winter months: Spatial and machine learning approaches. Appl. Sci. 2024, 14, 11629. [Google Scholar] [CrossRef] [Scilit]
- Elvik, R. A re-parameterisation of the Power Model of the relationship between the speed of traffic and the number of accidents and accident victims. Accid. Anal. Prev. 2013, 50, 854–860. [Google Scholar] [CrossRef] [Scilit]
- Hamzeie, R.; Savolainen, P.T.; Gates, T.J. Driver speed selection and crash risk: Insights from the naturalistic driving study. J. Saf. Res. 2017, 63, 187–194. [Google Scholar] [CrossRef] [Scilit]
- Rahman, M.A.; Das, S.; Sun, X. Single-vehicle run-off road crashes because of cellphone distraction: Finding patterns with rule mining. Transp. Res. Rec. 2023, 2677, 1261–1277. [Google Scholar] [CrossRef] [Scilit]
- Summala, H. Accident risk and driver behaviour. Saf. Sci. 1996, 22, 103–117. [Google Scholar] [CrossRef] [Scilit]
- Clarke, D.D.; Ward, P.; Bartle, C.; Truman, W. Young driver accidents in the UK: The influence of age, experience, and time of day. Accid. Anal. Prev. 2006, 38, 871–878. [Google Scholar] [CrossRef] [Scilit]
- Xin, T.; Xu, J. A data-and model-integrated driven method for recommending the maximum safe braking deceleration rates for trucks on horizontal curves. Appl. Sci. 2024, 14, 9357. [Google Scholar] [CrossRef] [Scilit]
- Jägerbrand, A.K.; Sjöbergh, J. Speed responses of trucks to light and weather conditions. Cogent Eng. 2019, 6, 1685365. [Google Scholar] [CrossRef] [Scilit]
- Zhang, Y.; Zhang, G.; Xu, J.; Li, S.; Liu, Y. Which factors influence rider injury severity in powered two-wheeler accidents? A systematic review. Traffic Inj. Prev. 2025, 1–11. [Google Scholar] [CrossRef] [Scilit]
- Neumann, T. Analysis of advanced driver-assistance systems for safe and comfortable driving of motor vehicles. Sensors 2024, 24, 6223. [Google Scholar] [CrossRef] [Scilit]

Disclaimer/Publisher’s Note: The statements, opinions and data contained in all publications are solely those of the individual author(s) and contributor(s) and not of MDPI and/or the editor(s). MDPI and/or the editor(s) disclaim responsibility for any injury to people or property resulting from any ideas, methods, instructions or products referred to in the content. |
© 2026 by the authors. Licensee MDPI, Basel, Switzerland. This article is an open access article distributed under the terms and conditions of the Creative Commons Attribution (CC BY) license.