


Featured Application
A passive heat pipe system without pumps or fans that can be retrofitted to gas fireplace inserts and other local space heaters to preheat the combustion air with heat taken from the upper part of the firebox.
Abstract
Evaporator designs of passive heat pipes for combustion air preheating in local space heaters have not been compared directly. This study compares two complete evaporator designs of a gravity loop heat pipe in a gas fireplace insert: a flat evaporator with a glass-fibre wick and a copper finned-tube evaporator. Two test series at four settings (4.5–9.6 kW) were compared with a reference without the heat pipe. The heat pipe transferred 953–2040 W to the combustion air (point velocity upper estimate; 523–1202 W from the excess air ratio), preheating it to 50–85 °C. The EN 613 efficiency rose by 1.5–5.7 percentage points at the combustion chamber boundary but changed by only −1.1 to +1.2 for the whole insert, as the evaporator also absorbs firebox radiation and preheating heat largely circulates internally. The finned-tube evaporator started up faster (10–29 vs. 33–42 min), but its series differed by up to 25%. At the highest settings, the flat evaporator lowered the flue gas temperature by 14–15 K but raised the glass temperature by 46–59 K. Loop pressures up to 6.6 bar limited operation. The evaporator design thus mainly affected start-up and firebox and flue gas temperatures; whole-appliance efficiency gains require lower flue gas temperatures.
1. Introduction
Buildings are among the largest energy consumers in the European Union [1]. The recast Energy Performance of Buildings Directive (EPBD) (EU) 2024/1275 therefore aims at zero-emission buildings and a gradual decarbonisation of their heating. Space heating accounts for 61.5% of the final energy consumption of households [2], so any increase in the efficiency of a heat source translates directly into lower fuel consumption and emissions. An important group of heat sources are local space heaters, i.e., fireplaces, fireplace inserts and stoves fired with gaseous and solid fuels. Their minimum seasonal efficiency and emissions are regulated by the ecodesign Regulation (EU) 2015/1188 [3].
In well-insulated single-family houses, local space heaters have a further drawback. Their output is often oversized with respect to the low heat loss of the building, and a large share of the heat is emitted by radiation from the firebox. This leads to temperature fluctuations and overheating of the living space. Thermal comfort is therefore addressed by modifying the heat storage properties of the heater [4], by transferring part of the flue gas heat to the ventilation or heating system [5] or by heat pipes. Heat pipes can reduce the radiant output of fireplace inserts by up to 40% or remove up to approximately 3 kW to a storage tank and thus prevent overheating of the living space [6]. Climate change adds a requirement for resilience: heating should remain available during a power outage. Solutions that increase efficiency without pumps and fans are therefore particularly valuable for small heat sources.
The largest loss of a small heat source is the flue gas sensible heat loss. As a rule of thumb for boilers, a 5 K reduction in flue gas temperature increases the efficiency by approximately 1% [7]. The waste heat can be used either to heat water or air in the building or to preheat the combustion air, which returns the heat directly to the combustion process. Combustion air preheating combined with humidification increases boiler efficiency [8], and preheating changes the combustion conditions, including the adiabatic flame temperature [9]. A higher combustion temperature may increase the formation of thermal NOx [10]. However, conventional flue gas–air or flue gas–water heat exchangers in small heat sources require a circulation pump or a fan and hence electrical energy [5,11].
Heat pipes transfer heat by evaporation and condensation of a working fluid in a closed space without moving parts. Their effective thermal conductivity is of the order of 5000–200,000 W·m−1·K−1 [7]. Heat pipe heat exchangers separate the flue gas stream from the heated medium. They are used for waste heat recovery in industry and in boilers [12,13,14,15] as well as in building ventilation and air conditioning [16,17]. As a boiler economiser, a heat pipe heat exchanger achieved a heat transfer rate similar to that of a finned-tube economiser, but 3.24 times higher per unit volume, and an empirical model predicted that one of the same size would increase the boiler efficiency by approximately 1.28% more [18].
When the evaporator is located far from the condenser, as in a fireplace insert with the evaporator in the flue gas stream upstream of the chimney and the condenser in the combustion air supply [11], a suitable design is a loop heat pipe (LHP) with separate vapour and condensate lines [19,20,21,22]. If the condenser is located above the evaporator, the condensate returns by gravity. Such a gravity loop heat pipe then does not require a fine capillary structure throughout the loop [14,20]. The performance of loop heat pipes depends on the heat load, the fill charge, the orientation and the evaporator design [23]. In an earlier gravity loop heat pipe installed in a gas fireplace insert, a charge of more than 0.2 L of water flooded the loop and reduced the efficiency, whereas a charge of 0.1 L allowed it to operate [24]; because a suitable charge depends on the loop volume, the charges used here are also given as filling ratios (Section 2.2).
The evaporator design remains an open question. Flat evaporators with a capillary structure provide a large heat transfer area and a uniform liquid distribution [25]. Their performance is strongly affected by the structure and material of the wick [26,27,28]. A flat evaporator surface also maximises the radiation-absorbing area, which is exploited in flat heat pipe heat exchangers recovering heat mainly by thermal radiation from hot metal above 500 °C [29]. Finned-tube evaporators, on the other hand, build on the well-established technology of finned heat exchangers, in which metallic fins in the exhaust gas duct maximise the heat-absorbing surface [7] and which remain the conventional solution for boiler economisers [18]; thermosyphon heat exchangers with finned tubes on the flue gas side are simple and compact [30], and a heat exchanger of 180 helical-finned heat pipes recovered up to 100 kW of waste heat in the ceramics industry without excess fouling [31]. The flat and the finned-tube evaporator thus represent two distinct ways of coupling the evaporator to the combustion chamber (a continuous wall exposed directly to the flame and its radiation vs. an extended surface swept by the flue gas), which also differ in heat capacity and in the way the liquid is distributed over the heat transfer surface.
Flue gas heat recovery, including heat pipe and thermosyphon exchangers, has been demonstrated mainly in continuously operated industrial installations and boilers of hundreds of kilowatts to megawatts [8,30,31,32], not in intermittently operated appliances of about 10 kW with radiation-dominated heat emission and no flue gas fan; in small stoves, it has been assessed mainly by models and simulations and relies on ventilation fans [5,33]. Loop heat pipes with flat evaporators have been developed mainly for electronics and spacecraft and modelled mostly at steady state with radiation neglected [20,25], and even passive thermosyphon heat recovery units have been tested with electrically heated air [34], i.e., without a flame, combustion products or a start-up from a cold firebox. Previous experiments with a gravity loop heat pipe in a gas fireplace insert showed an increase in the efficiency according to EN 613 [35] of 3.4 percentage points (pp) with a flat evaporator at maximum output [11,36] and of 2.7 pp on average with a copper tubular evaporator [37]. However, each design was tested separately, at a different time and in a different configuration of the test rig. In addition, the test with the flat evaporator was limited to 15 min because the loop pressure reached the set pressure of the safety valve [36]. A direct comparison of both designs under the same conditions and over the whole output range is therefore missing. Also missing is a description of the heat pipe operation (pressure, temperatures of the vapour and condensate lines, transient behaviour) and of the effect of the evaporator on the temperatures in the firebox and on the glazed front, which are related to the radiant heat emission of the insert.
The primary objective of this study is to experimentally compare two evaporator designs of a gravity loop heat pipe (a flat evaporator with a liquid-distributing wick and a finned-tube evaporator) for combustion air preheating in a gas fireplace insert. The two designs, which differ in material, geometry, joints, wick and filling ratio, are compared as complete prototypes rather than as isolated design parameters, with the same condenser and a common reference within a single measurement campaign at four output settings. The novelty of the work lies in a set of 24 tests of up to 60 min evaluated by a uniform methodology, in a balance of the heat transferred to the combustion air supplemented by an uncertainty analysis, and in the evaluation of the heat pipe operating parameters, i.e., the loop pressure and the surface temperatures of the vapour and condensate lines. The study further assesses how both designs affect the flue gas temperature, the excess air, the emissions, the firebox and glass temperatures and, finally, the efficiency according to EN 613. The findings are discussed with respect to the design of passive (pumpless) heat recovery systems for local space heaters in residential buildings.
2. Materials and Methods
2.1. Experimental Setup and Standards
The experiments were carried out on a LUNA 850V Gold gas fireplace (M-Design Benelux BV, Zedelgem, Belgium) insert with a closed combustion chamber and a glazed door, fired with natural gas G20. The insert was installed in the laboratory of the Department of Power Engineering, University of Žilina, and connected to a chimney with an inner diameter of 141 mm. Combustion air is supplied to the firebox through an air intake duct at the rear of the insert. To accommodate the condenser and the supply of preheated air, the combustion air intake channel was widened compared with the original appliance. The modified insert was used in all configurations, including the reference. The main parameters of the appliance are given in Table 1.
Table 1.
Main parameters of the investigated gas fireplace insert.
The efficiency was determined by the indirect method according to EN 613 [35], which applies to independent gas-fired convection heaters with a nominal heat input of up to 20 kW. The standard requires the evaluation to be carried out once the appliance has reached thermal equilibrium, i.e., when the flue gas temperature changes by not more than ±2 K within 10 min. In some tests with the heat pipe, however, the flue gas temperature and the heat pipe output were still changing slowly at the end of the 60 min tests; unless stated otherwise, the results are therefore given as averages over the last 10 min of each test (final 10-min values), which in these tests are not steady-state values (Section 3.1).
2.2. Design of the Gravity Loop Heat Pipe
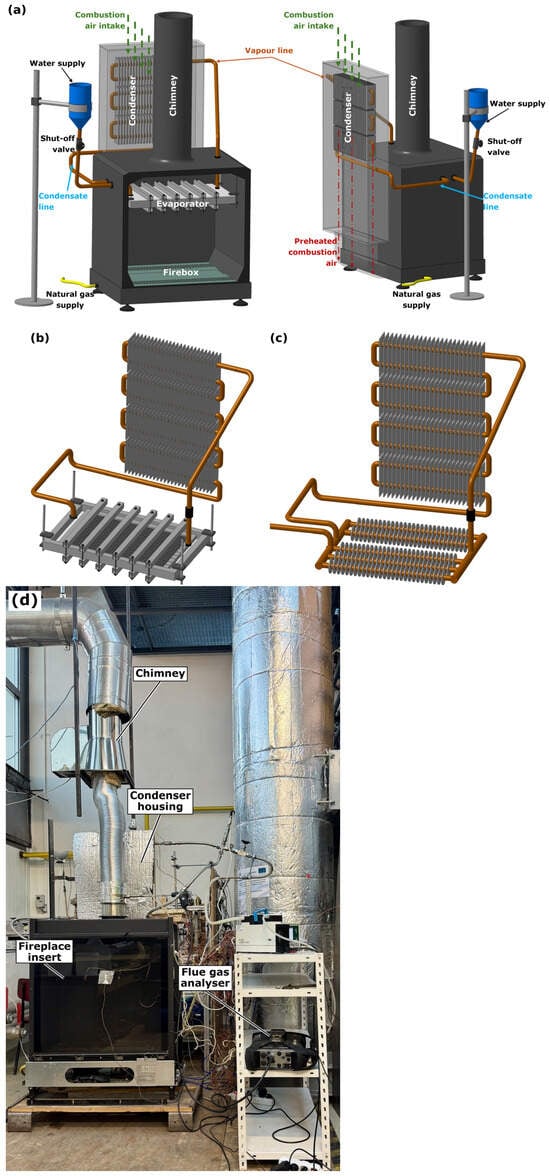
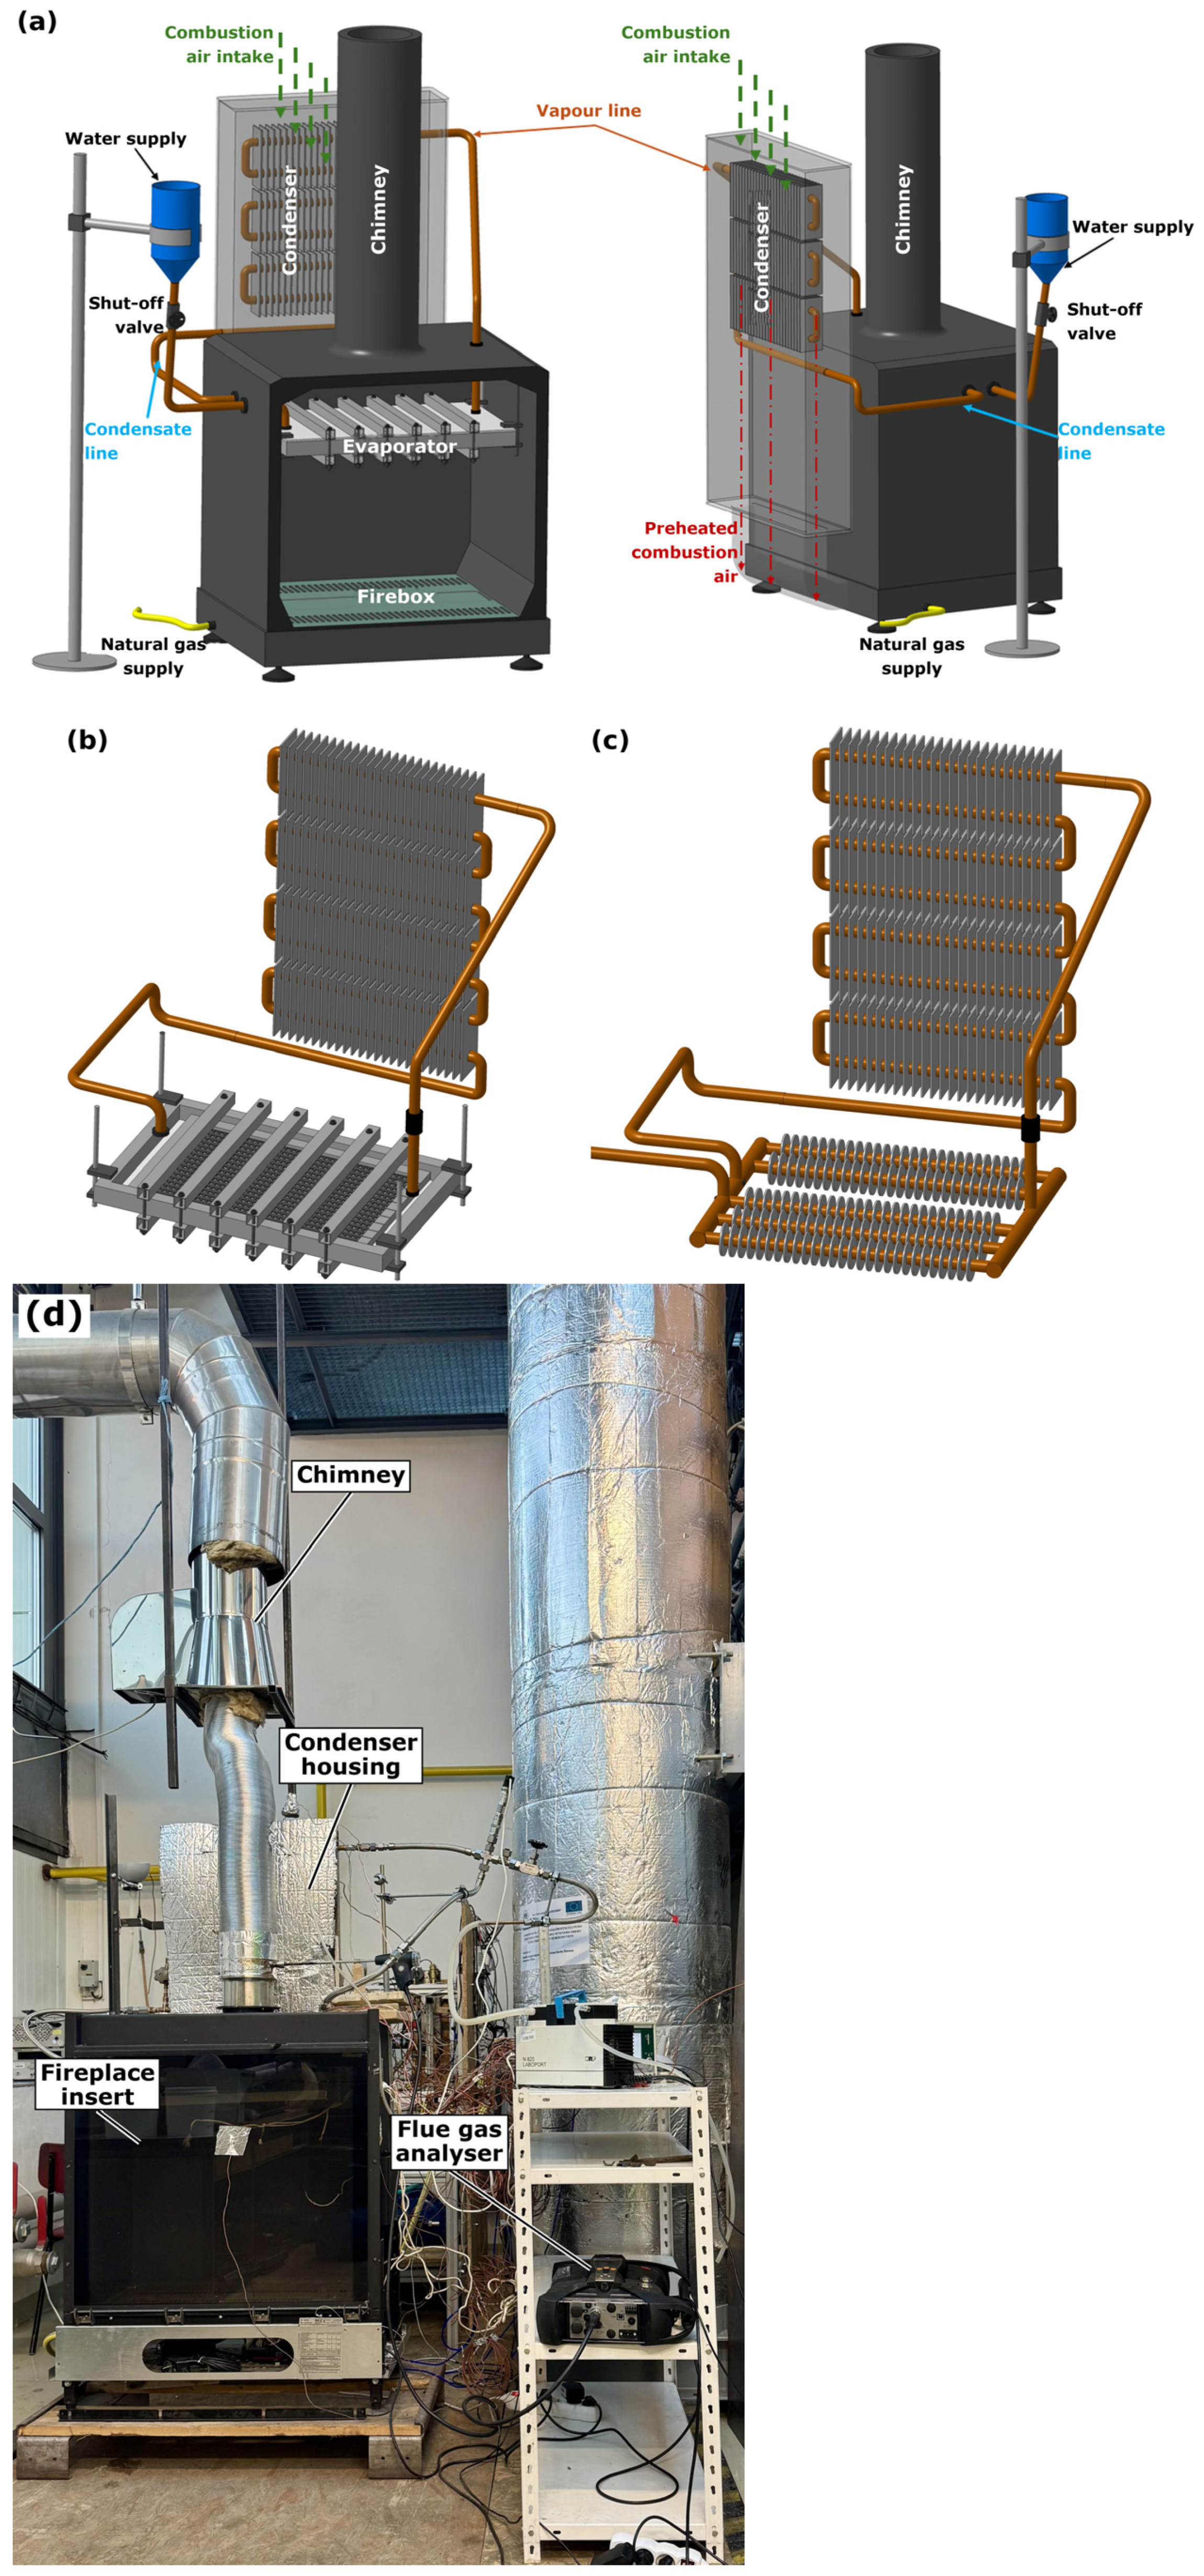
The heat pipe is a closed, pumpless two-phase loop with water as the working fluid, chosen for its high specific heat capacity and because it is non-flammable and non-explosive under test conditions. Its evaporator is located in the upper part of the firebox above the flame, in the flue gas stream upstream of the chimney, and therefore receives heat by convection from the flue gas and by radiation from the flame and the firebox walls; the transferred heat is thus taken from the firebox as a whole, not only from the flue gas leaving the appliance (Section 4.3). The condenser is placed in the combustion air intake duct at the rear of the insert, above the evaporator. The vapour flows through the vapour line to the condenser, where it releases its latent heat to the intake air. The condensate returns by gravity to the evaporator through the condensate line. The loop is therefore a gravity loop heat pipe (loop thermosyphon) [14]. The transferred heat is returned to the combustion process as combustion air preheating, and no electrical energy is needed for its transfer.
Two evaporator designs were compared (Table 2, Figure 1). Variant A is a flat evaporator made of AISI 304 stainless steel, selected because of the high firebox temperatures. Its body, with outer dimensions of 520 × 320 mm, is welded from sheet metal approximately 2 mm thick and has an internal volume of 1.8 L. Inside, a wick made of glass-fibre fabric distributes the liquid over the heated wall.
Table 2.
Comparison of the evaporator design variants.
Figure 1.
Gravity loop heat pipe in the gas fireplace insert: (a) system layout with the evaporator in the firebox, the condenser in the combustion air intake duct, the vapour and condensate lines, and the water reservoir with a shut-off valve for filling the loop; (b) variant A—flat evaporator with the condenser; (c) variant B—copper finned-tube evaporator with aluminium fins and the condenser; (d) photograph of the test rig: fireplace insert with the chimney, insulated condenser housing in the combustion air intake duct and the Testo 350 flue gas analyser.
Variant B is a copper finned-tube evaporator. It consists of five finned sections of DN 18 copper tube with press-fitted aluminium fins with an outer diameter of 37.2 mm and a pitch of 5 mm. The plan dimensions of the evaporator are 495 × 290 mm, and its internal volume is 0.6 L. This variant has no capillary structure.
The condenser is a copper tube heat exchanger with aluminium fins consisting of four sections connected in a serpentine arrangement. Its internal volume together with the vapour and condensate lines is 1.2 L, and the same condenser was used for both variants. Before filling, the loop was evacuated with a KNF N 820 Laboport diaphragm vacuum pump (KNF Neuberger GmbH, Freiburg, Germany) to an absolute pressure of 0.15–0.18 bar and charged with distilled water in an amount equal to the internal volume of the evaporator, i.e., 1.8 L for variant A and 0.6 L for variant B, or 60% and 33% of the total loop volume (Table 2), which had given practically trouble-free operation in preliminary experiments; the vapour space is provided by the vapour line and the condenser above the evaporator.
2.3. Measurement Instrumentation
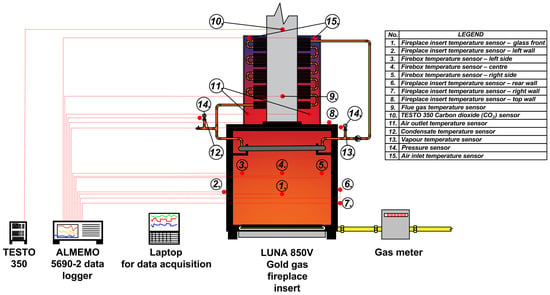
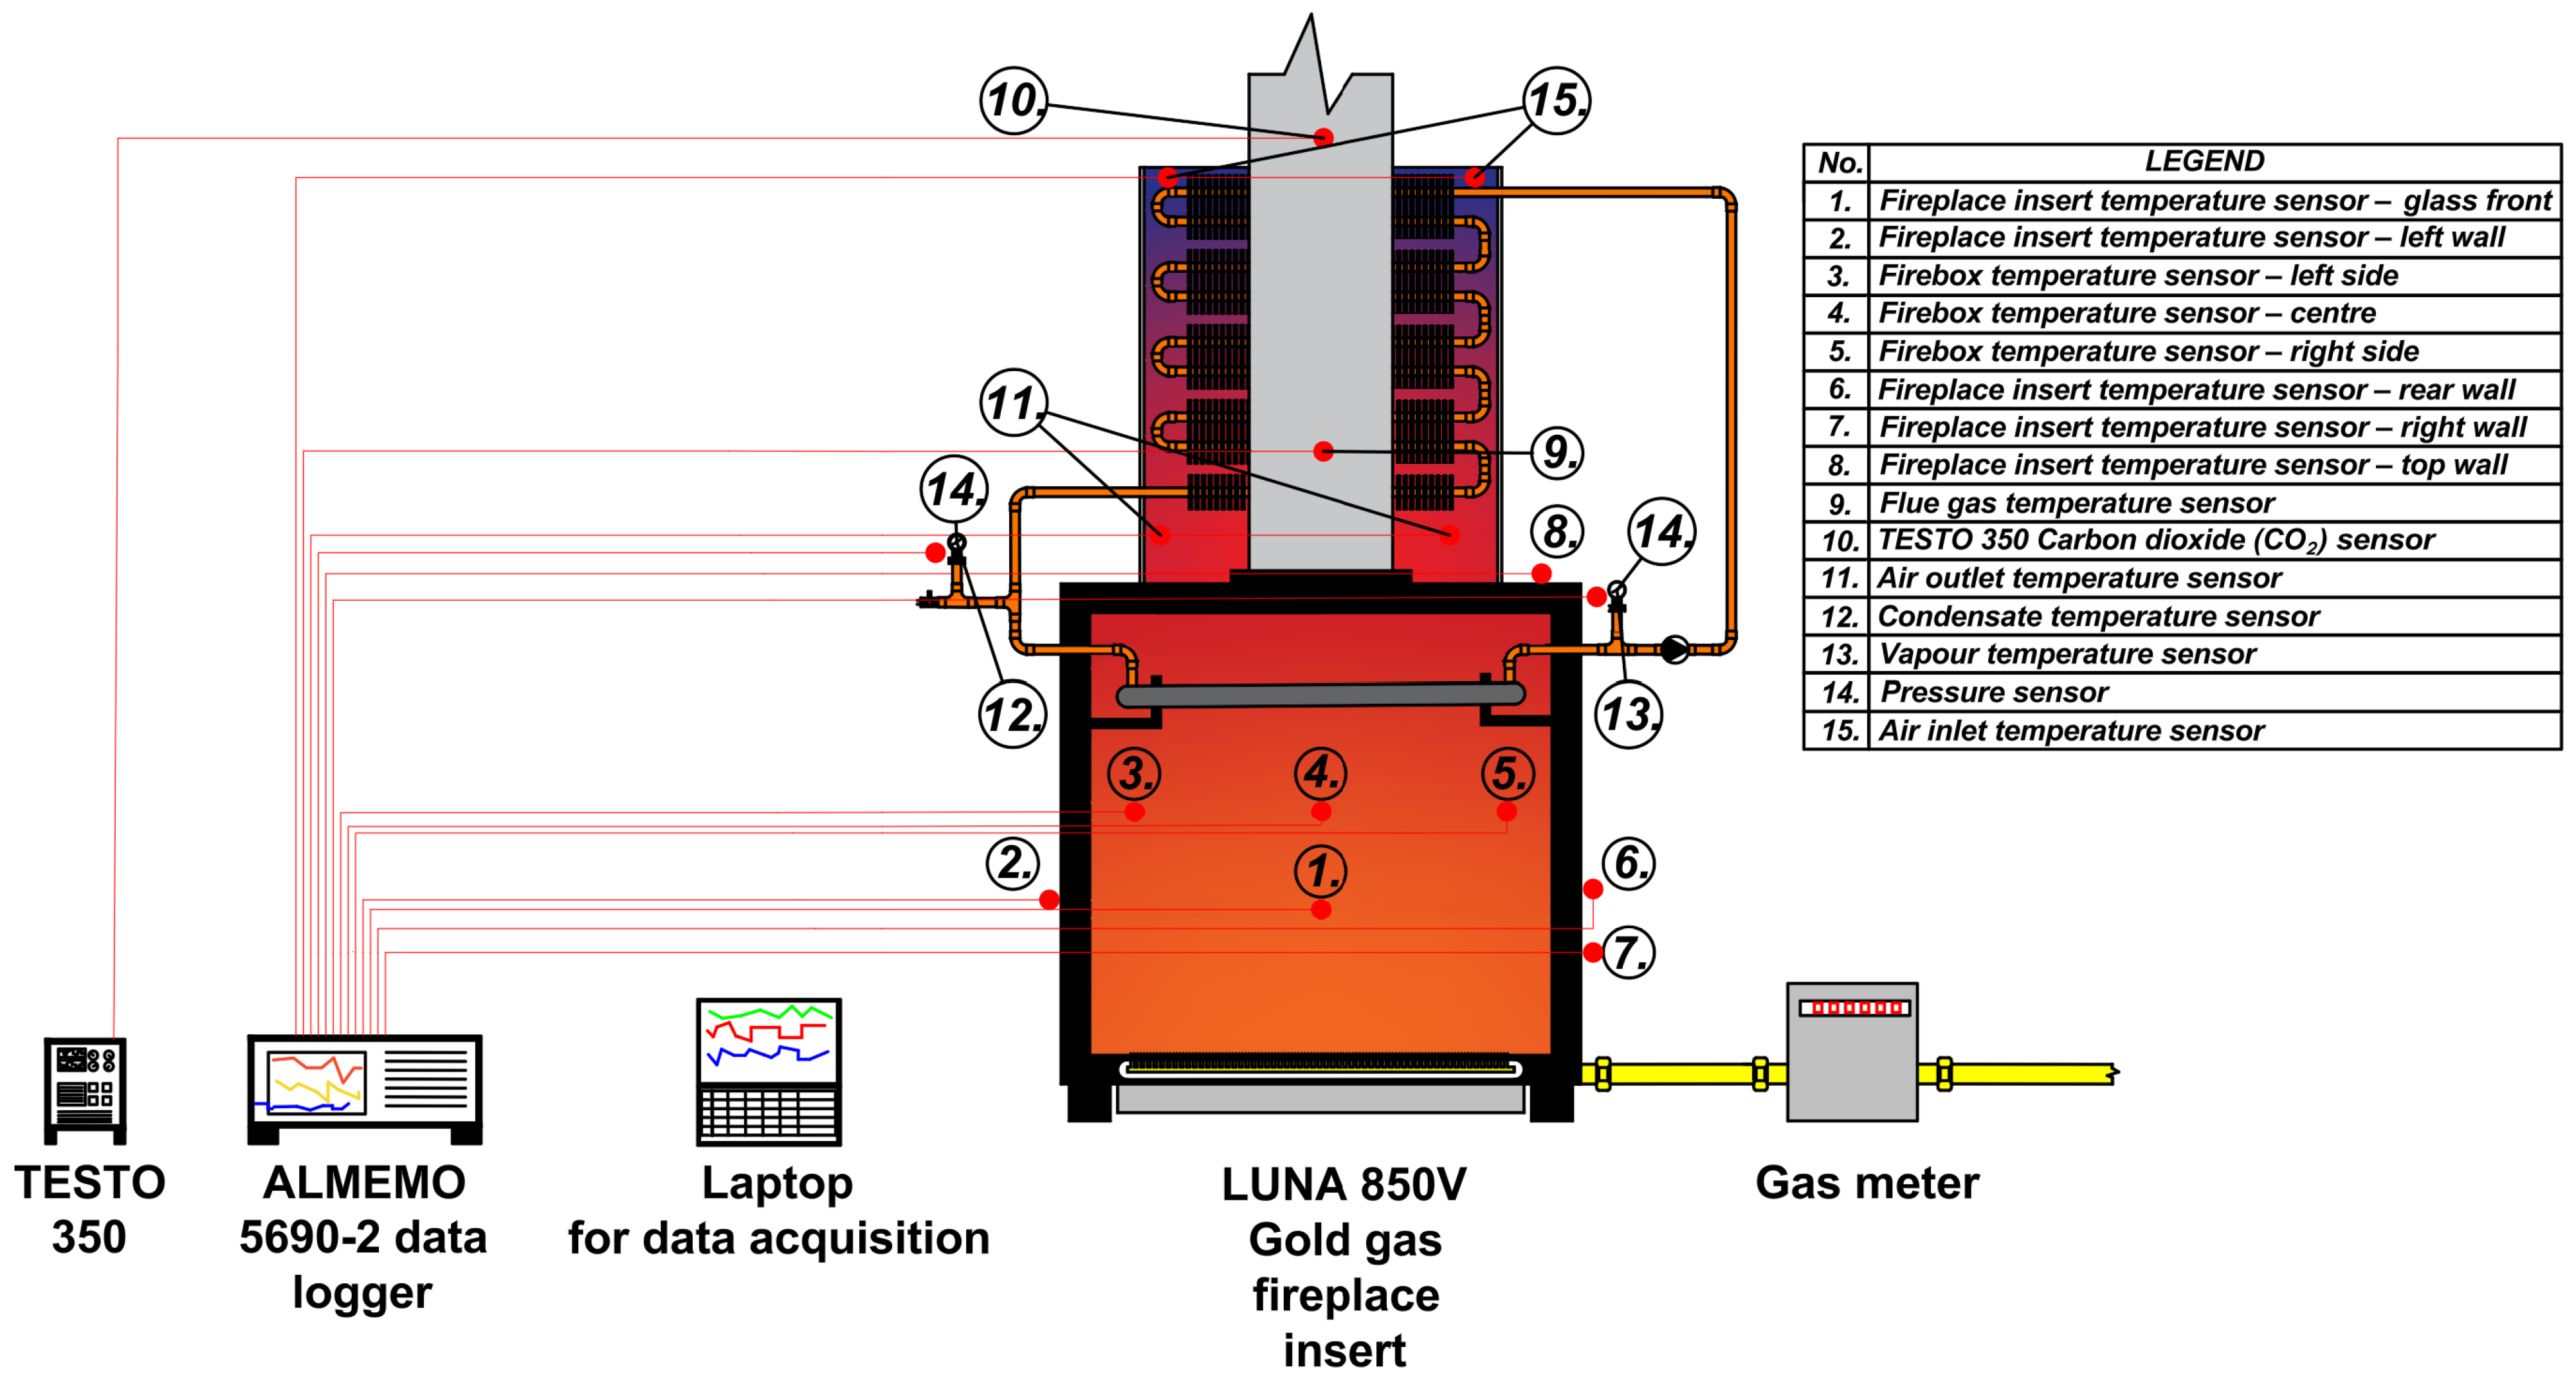
The main measuring points are shown in Figure 2 (photograph of the rig in Figure 1d), and the instruments used are listed in Table 3. Temperatures were measured with type K (NiCr–Ni) thermocouples connected to an Almemo 5690-2 data logger (both Ahlborn, Holzkirchen, Germany) recording at 10 s intervals. The measured quantities were the flue gas temperature in the chimney tch, three firebox temperatures (left, centre, right), whose average gives the firebox temperature tfb, the temperature above the evaporator and the surface temperatures of the glass and of the side, rear and top walls of the insert. On the air side, the intake air temperature upstream of the condenser Tin and the air temperatures downstream of the condenser in three zones of the intake duct (left L, centre C, right R) were measured. In the tests with the heat pipe, the ambient temperature and nine surface temperatures of the condenser were also recorded. The temperatures of the heat pipe lines were measured with thermocouples attached to the outer surface of the vapour line (at the evaporator outlet and at the condenser inlet) and of the condensate line (at the condenser outlet and at the evaporator inlet). These surface temperatures are lower than the temperature of the working fluid and are denoted Tvl and Tcl (averages of the two points on each line).
Figure 2.
Schematic of the test rig with the measuring points (numbering according to the legend in the figure). Sensors 1–9 and 11–15 are connected to the Almemo 5690-2 data logger; point 10 is the sampling probe of the Testo 350 flue gas analyser.
Table 3.
Equipment used for measurements.
The air velocity in the three zones of the duct was measured with vane anemometers, one in the centre of each zone, which indicate the actual flow velocity at the probe location. The absolute pressure in the vapour line of the heat pipe was measured with a pressure transducer. The flue gas composition (O2, CO2, CO, NO, NOx) and the excess air ratio λ were recorded with a Testo 350 flue gas analyser and the chimney draught with the Almemo data logger. The analyser probe was placed in the chimney at a distance of 18 cm from the insert and the flue gas thermocouple at a distance of 56.5 cm. The gas consumption was read from a diaphragm gas meter at the beginning and at the end of each test.
2.4. Test Procedure
The reference configuration without the heat pipe (REF) and two configurations with the heat pipe (A, B) were tested at four regulator settings (5, 8, 10 and 12). At each setting, two tests (series 1.1 and 2.2) lasting 60 min were carried out with data recorded every 10 s (Table 4). The standard does not prescribe a test duration [35]; 60 min was used for all tests to keep them comparable, because the reference insert practically reached thermal equilibrium within this time. The reference tests were carried out on 8 July 2026 in succession from the highest to the lowest setting. For the configurations with the heat pipe, series 1.1 was measured on one day in ascending order of settings (5 → 12) and series 2.2 on another day in descending order (12 → 5). Series 1.1 and 2.2 are therefore not pure repetitions: they differ in the initial thermal state of the insert and of the heat pipe, and their difference thus also includes the effect of the thermal history. The tests of variant B at setting 12 were terminated after 26 min because the heat pipe pressure was rising at approximately 0.1 bar·min−1 and was approaching the safety limit of 7 bar, which was not to be exceeded during the tests. All tests were carried out without a flow restrictor in the chimney and under summer conditions, with an intake air temperature of 22–27 °C.
Table 4.
Test matrix.
2.5. Energy Balance and Efficiency
The heat input of the insert was determined from the volume of gas consumed Vg during the test duration τ as
The heat transferred to the combustion air in the condenser was determined as the sum over the three duct zones i ∈ {L, C, R} with the inner cross-sections AL = AR = 0.0051 m2 (111 × 46 mm) and AC = 0.0086 m2 (186 × 46 mm):
where vi is the measured velocity, Tout,i is the air temperature downstream of the condenser, Tin is the intake air temperature, cp,a = 1010 J·kg−1·K−1, and ρi is the air density at Tout,i and atmospheric pressure (ideal gas), since the anemometers indicate the actual rather than the normalised velocity. Each zone velocity is a single-point value and is applied to the whole zone cross-section. For the tests without the heat pipe, Equation (2) serves as a check value: the air temperature rise in the duct is only 0.6–1.4 K, and the corresponding heat flow is within the measurement uncertainty.
The heat supplied to the evaporator could not be measured directly. Q̇air therefore represents the heat output of the heat pipe delivered to the air, i.e., the evaporator heat load reduced by the heat losses of the lines and by the change in the internal energy of the loop. The heat pipe operation was further characterised by the absolute pressure p and by the surface temperatures Tvl and Tcl.
The efficiency η, based on the net calorific value, was determined by the indirect method according to EN 613, Clause 7.11.2 [35]:
where q1 is the dry flue gas loss and q2 is the water vapour loss, both in % of the heat supplied by the fuel. Further, cp,fg = 1.33·10−3 MJ·m−3·K−1 is the mean specific heat of the dry flue gas, t2 = tch is the flue gas temperature in the chimney, and t1 is the mean temperature of the combustion air entering the combustion chamber [35]. The balance boundary is therefore the combustion chamber; because the air is preheated with heat taken from the firebox of the same insert, η with the heat pipe is not the efficiency of the whole appliance, and its change relative to REF is therefore also given for a boundary around the whole insert (Δηins, with t1 = Tin in all configurations). In the reference insert, the intake air is not preheated; hence, t1 = Tin. In the insert with the heat pipe, the intake air flows through the condenser located in the intake duct and is preheated before entering the combustion chamber; hence, t1 is the mean of the three air temperatures downstream of the condenser.
The widened intake channel (Section 2.1) increased the amount of air passing through the insert (the insert has no draught diverter). The O2 content in the chimney was 17.7–19.8% in all configurations, including REF, whereas in the original insert before the modification, it was 10–12%. To relate the flue gas loss to the combustion conditions of the original appliance, the dry flue gas volume Vp (m3 per m3 of gas) was calculated with the CO2 concentration converted to the reference O2 content O2,ref = 11% (the middle of the original range):
where VCO2 = 1.058 m3·m−3 is the volume of CO2 produced by burning 1 m3 of gas, and CO2 and O2 are the concentrations measured in the dry flue gas. Since the composition of the natural gas, and thus of its combustion products, was practically constant and the analyser determines CO2 from the measured O2 for a given fuel, Vp varied only minimally over time and between the tests (18.4–18.8 m3·m−3, mean 18.5 m3·m−3), which corresponds to an excess air ratio of 2.1. The useful heat output of the insert is Pout = P·η/100.
All quantities were calculated for each 10 s record and averaged (a) over the last 10 min of the test and (b) over the whole test. The first and the last record of each test were excluded. The remaining trends were quantified by the slope of the linear regression of the flue gas temperature and Q̇air in the last 10 min window. The emission data and the efficiency of test REF 8/1.1 were excluded because the analyser data file of this test was corrupted; the temperatures, air velocities and gas consumption of this test, recorded independently by the data logger and the gas meter, were used. The data-processing scripts were written with the assistance of a generative AI tool (see Acknowledgments), and all calculation steps were checked by the authors.
2.6. Measurement Uncertainty
The expanded uncertainty (k = 2) of the derived quantities was determined by the Monte Carlo method according to the GUM [40,41] with 4000 trials. The input quantities were modelled by uniform distributions: temperatures, velocities, O2 and gas volume within the instrument accuracies given in Table 3, duct zone areas ±3%, net calorific value ±1% and the specific heat of the flue gas cp,fg ±2%. For the last 10 min window, the expanded uncertainty of the heat flow Q̇air is ±84–114 W, i.e., 6–9% of the measured value in the tests with the heat pipe. The uncertainty of the heat input is ±3.7%, and that of the efficiency η is ±0.2–0.4 pp. These values do not include the choice of O2,ref, a convention of the evaluation whose effect is given in Section 3.5, nor the systematic deviation of the point velocity measurement (Section 4.5). In the REF tests, Q̇air (27–60 W) is smaller than its uncertainty and thus statistically insignificant. The difference between series 1.1 and 2.2 includes, in addition to the instrument uncertainty, the effect of the different initial state (Section 2.4) and is reported as the spread of the results.
3. Results
3.1. Transient Behaviour
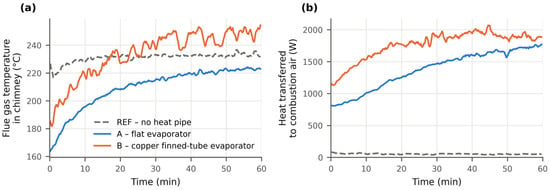
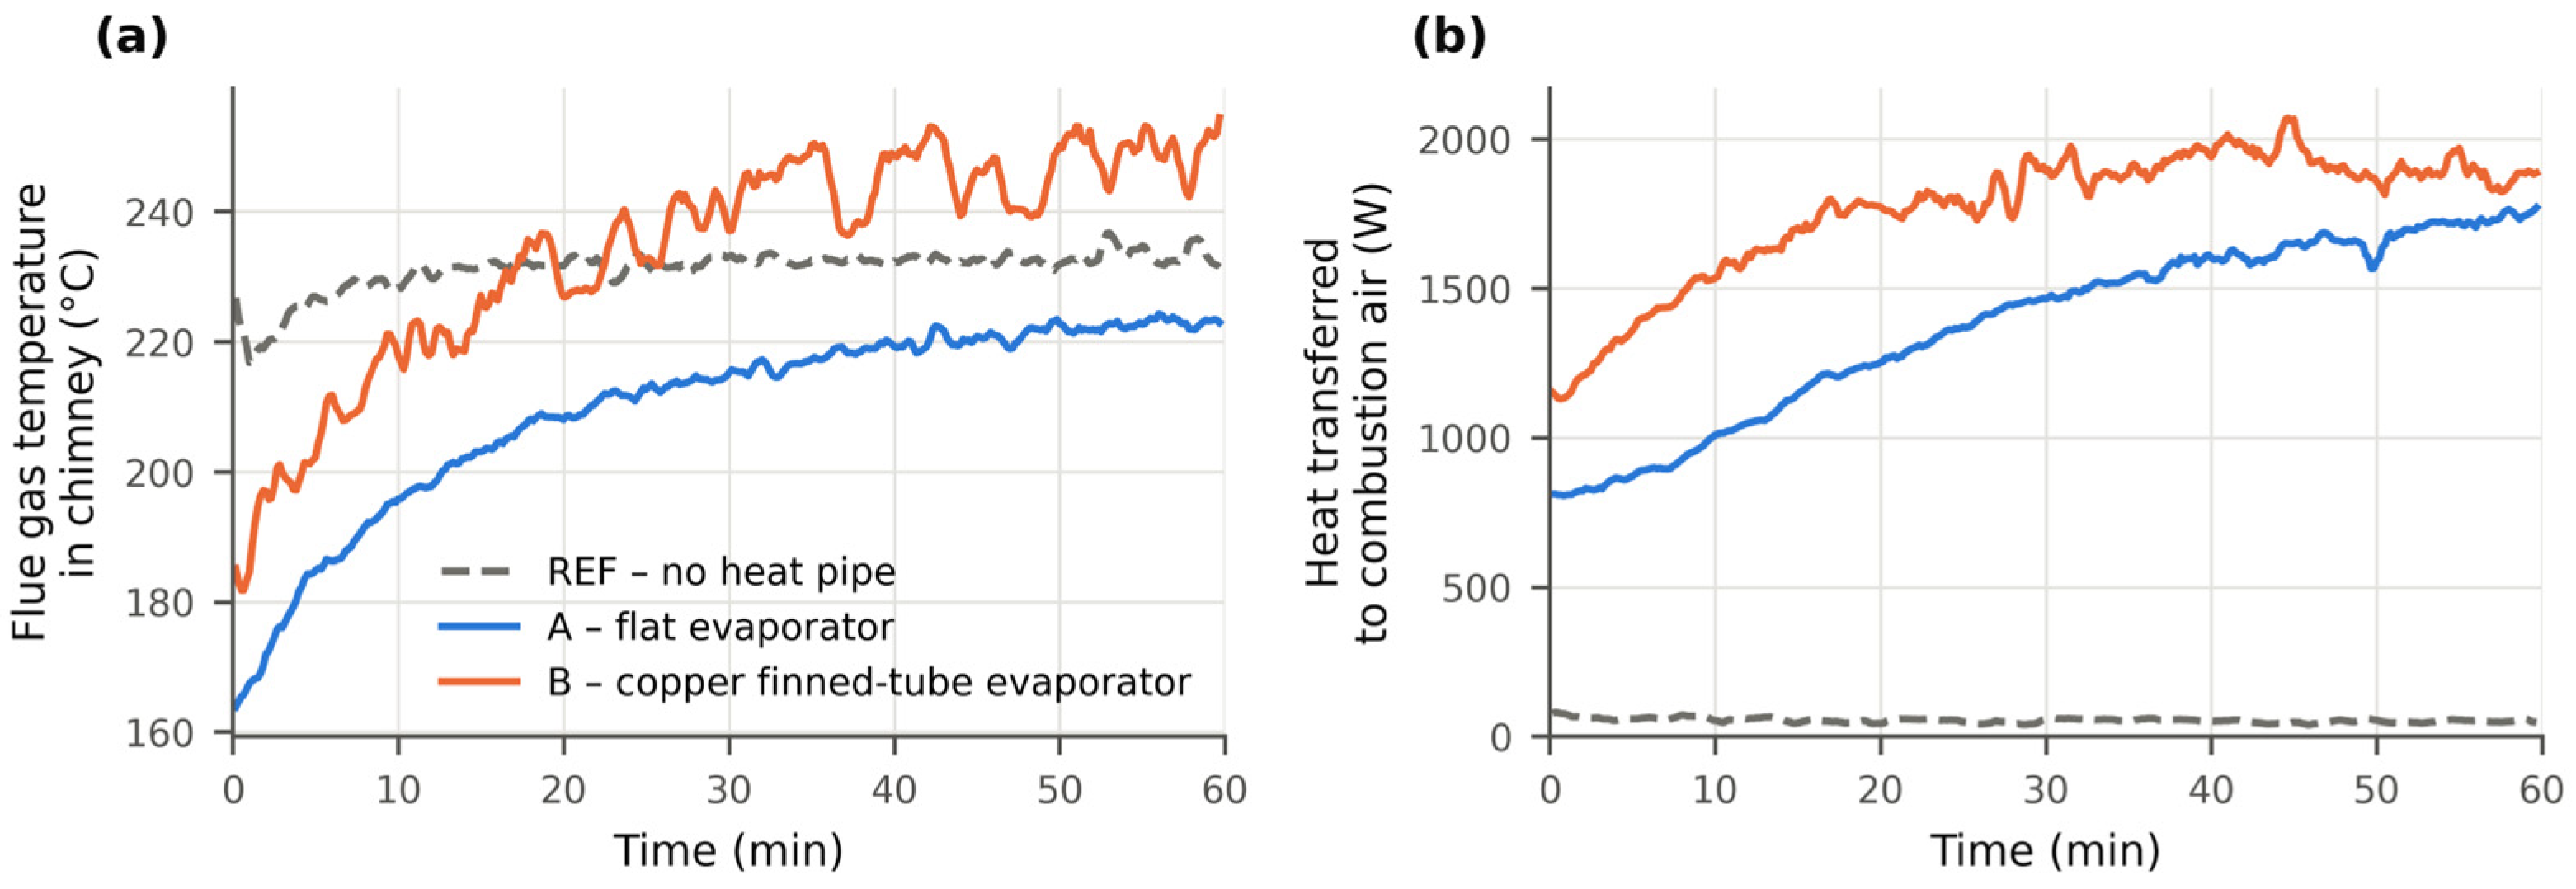
Figure 3 shows the time courses of the flue gas temperature in the chimney and of the heat transferred to the combustion air at regulator setting 10 (series 1.1).
Figure 3.
Time courses at regulator setting 10, series 1.1: (a) flue gas temperature in the chimney; (b) heat transferred to the combustion air in the heat pipe condenser. REF—insert without the heat pipe; A—flat evaporator; B—copper finned-tube evaporator. Values are smoothed by a 60 s moving average.
The insert without the heat pipe stabilised within approximately 10 min. The flue gas temperature then fluctuated around 232 °C, and the air in the intake duct was heated by only 1–2 K. With the heat pipe installed, part of the heat from the firebox is transferred to the intake air, and the heat flow Q̇air increased throughout the test, from approximately 800 W to 1700 W for variant A and from 1200 W to approximately 1900 W for variant B. For variant A, the flue gas temperature rose gradually and remained below the reference for the whole hour, by approximately 10 K at the end. For variant B, it rose faster and exceeded the reference after approximately 20 min.
The difference in the start-up was consistent across the tests. Variant B reached 90% of its final output (the mean of the last 10 min) after 10–29 min, whereas variant A needed 33–42 min (time courses of all tests in Figures S1–S3). Test 5/2.2 of both variants, which started from a warm state, is not included in these ranges, and for variant B at setting 12, the final output refers to the 26 min record. The slower start-up of variant A corresponds to the larger mass and heat capacity of the stainless steel evaporator with the wick. Thermal inertia is evident in all tests with the heat pipe: the average Q̇air over the whole test was up to 26% lower than in the last 10 min. Within the last 10 min, the flue gas temperature changed by not more than 2 K, i.e., within the EN 613 criterion, in 11 of the 16 tests with the heat pipe and by less than 3 K in the others, except test B 8/1.1 (10 K) and variant B at setting 12, at which it was still rising at 0.7–1.0 K·min−1; the heat flow to the air still increased by up to 8% for variant A at settings 5–10 and by 9–14% for variant B at setting 12 (at most 2.3% in the other tests), so the final 10-min values of these tests underestimate the steady-state output by an amount comparable with the differences between the variants (Section 3.2).
3.2. Combustion Air Preheating
Table 5.
Summary of results (last 10 min; mean of series 1.1 and 2.2 ± half of their difference). P—heat input; Q̇air—heat transferred to the combustion air (anemometer-based upper estimate, Section 4.5); Q̇air/P—share of the heat input; Tout—air temperature downstream of the condenser; tch—flue gas temperature in the chimney; η—efficiency according to EN 613 (combustion chamber boundary, O2,ref = 11%); Δηins—change in η relative to REF for the boundary around the whole insert (t1 = Tin).
Figure 4.
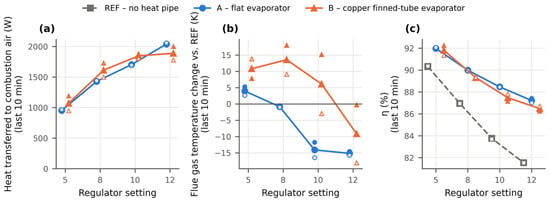
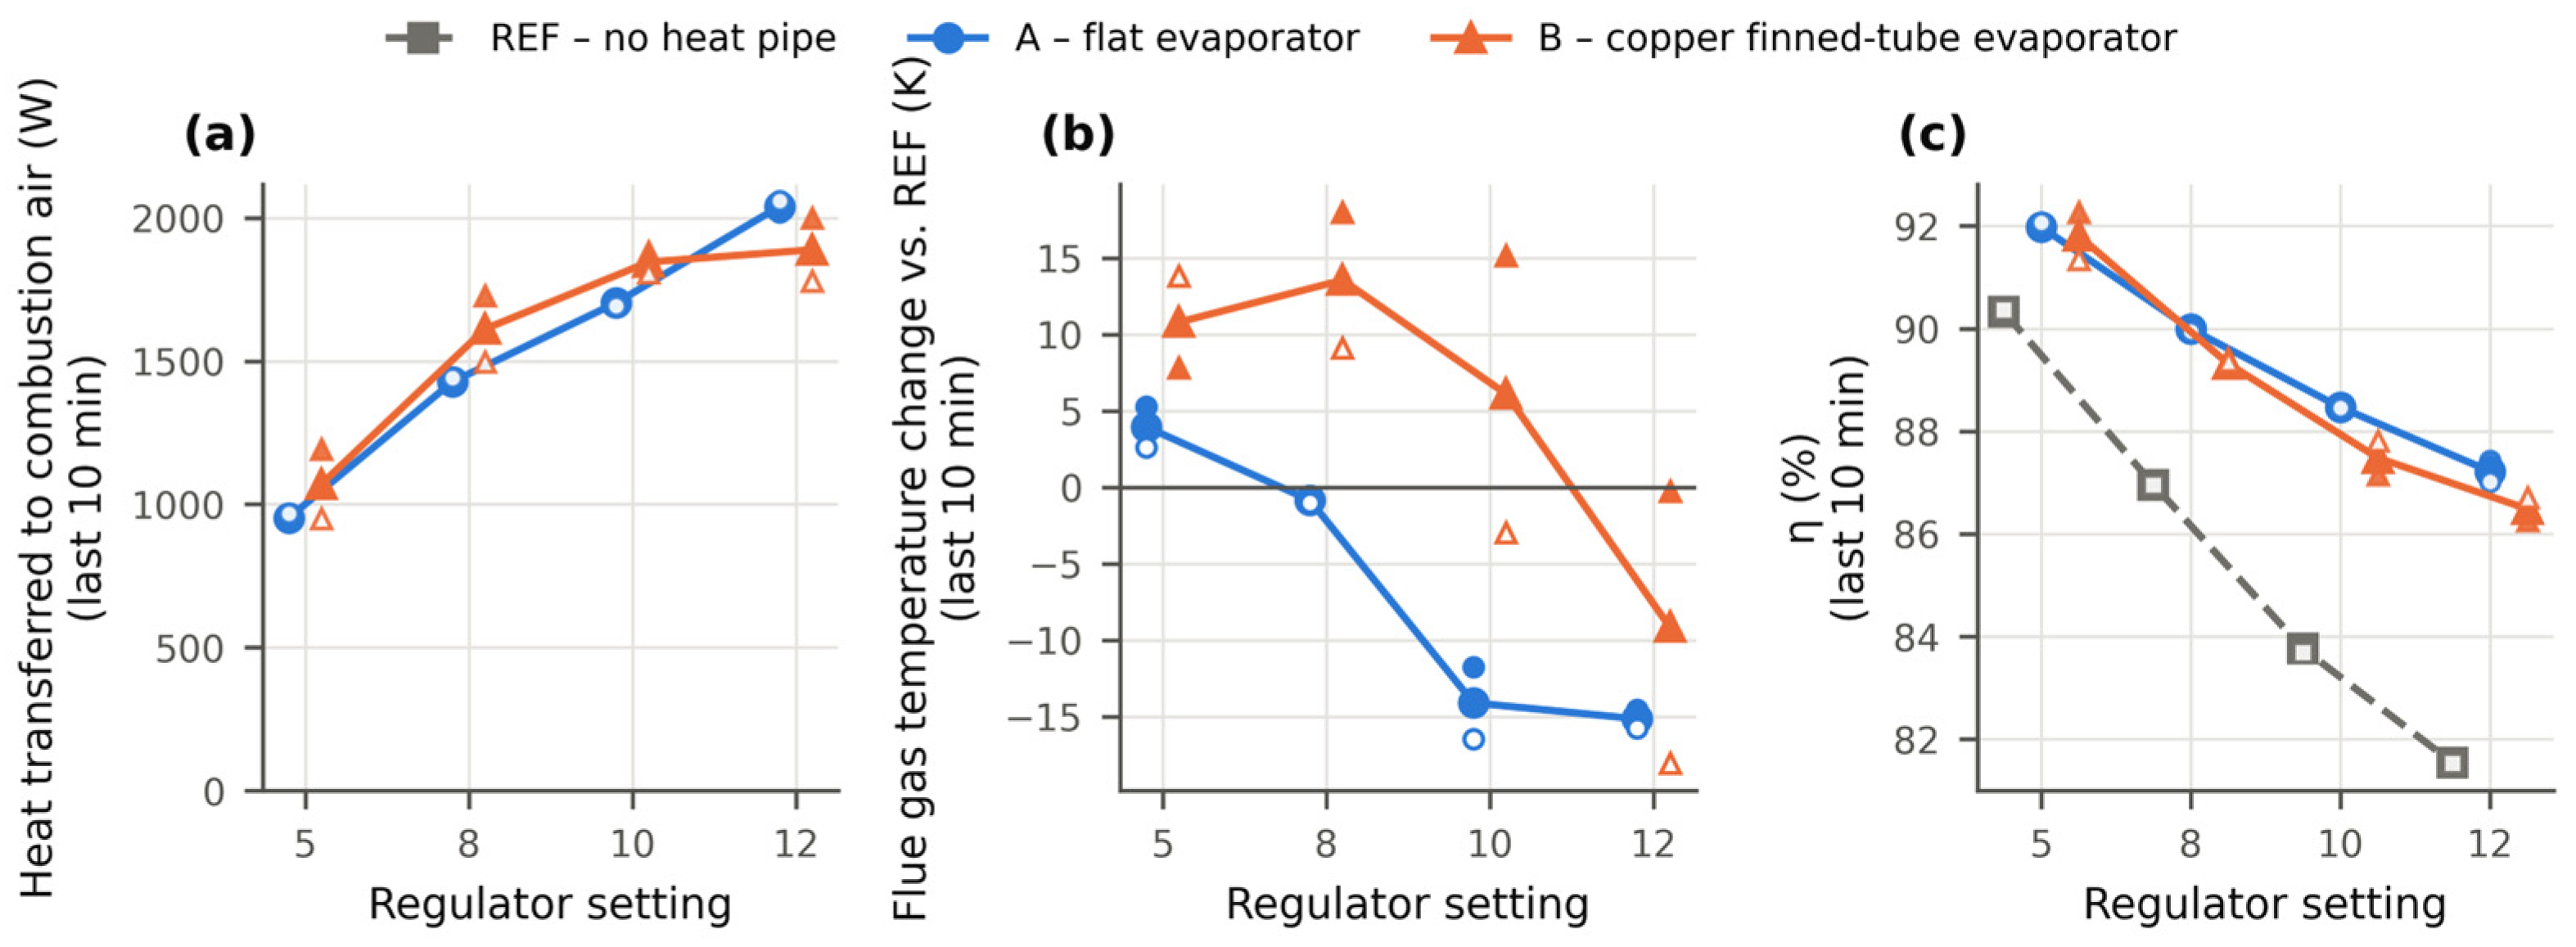
Effect of the regulator setting (last 10 min): (a) heat transferred to the combustion air; (b) change in the chimney flue gas temperature relative to the reference; (c) efficiency according to EN 613. Large markers and lines: mean of the series; small filled markers: series 1.1 (ascending order of settings); small open markers: series 2.2 (descending order).
In the last 10 min of the tests, the heat pipe transferred 953–2040 W to the air for variant A and 1071–1888 W for variant B, which corresponds to 20–25% of the heat input of the insert (an upper estimate; 10–15% with the air flow from λ, Section 4.5). This share hardly changed with the output. The air entering the firebox was heated from 22–27 °C to 50–85 °C, i.e., by 25–61 K. At settings 5–10, the mean Q̇air of variant B was 8–13% higher than that of variant A (1071 vs. 953 W, 1612 vs. 1428 W and 1846 vs. 1703 W), mainly in series 1.1 (series 2.2: −2 to +7%), and at setting 12, the order was reversed (1888 vs. 2040 W, with B still rising after 26 min). These differences are, however, comparable with the spread between the two series of variant B, which reached up to 25% (setting 5: 950 vs. 1192 W) and exceeded the measurement uncertainty (±84–114 W). The two series of variant A differed by at most 3.2%. Within the scatter of the data, the two designs therefore transferred a similar amount of heat to the air. In the reference tests, the air temperature change in the duct corresponded to a heat flow of 27–60 W, i.e., values within the measurement uncertainty.
3.3. Flue Gas Temperature and Firebox Conditions
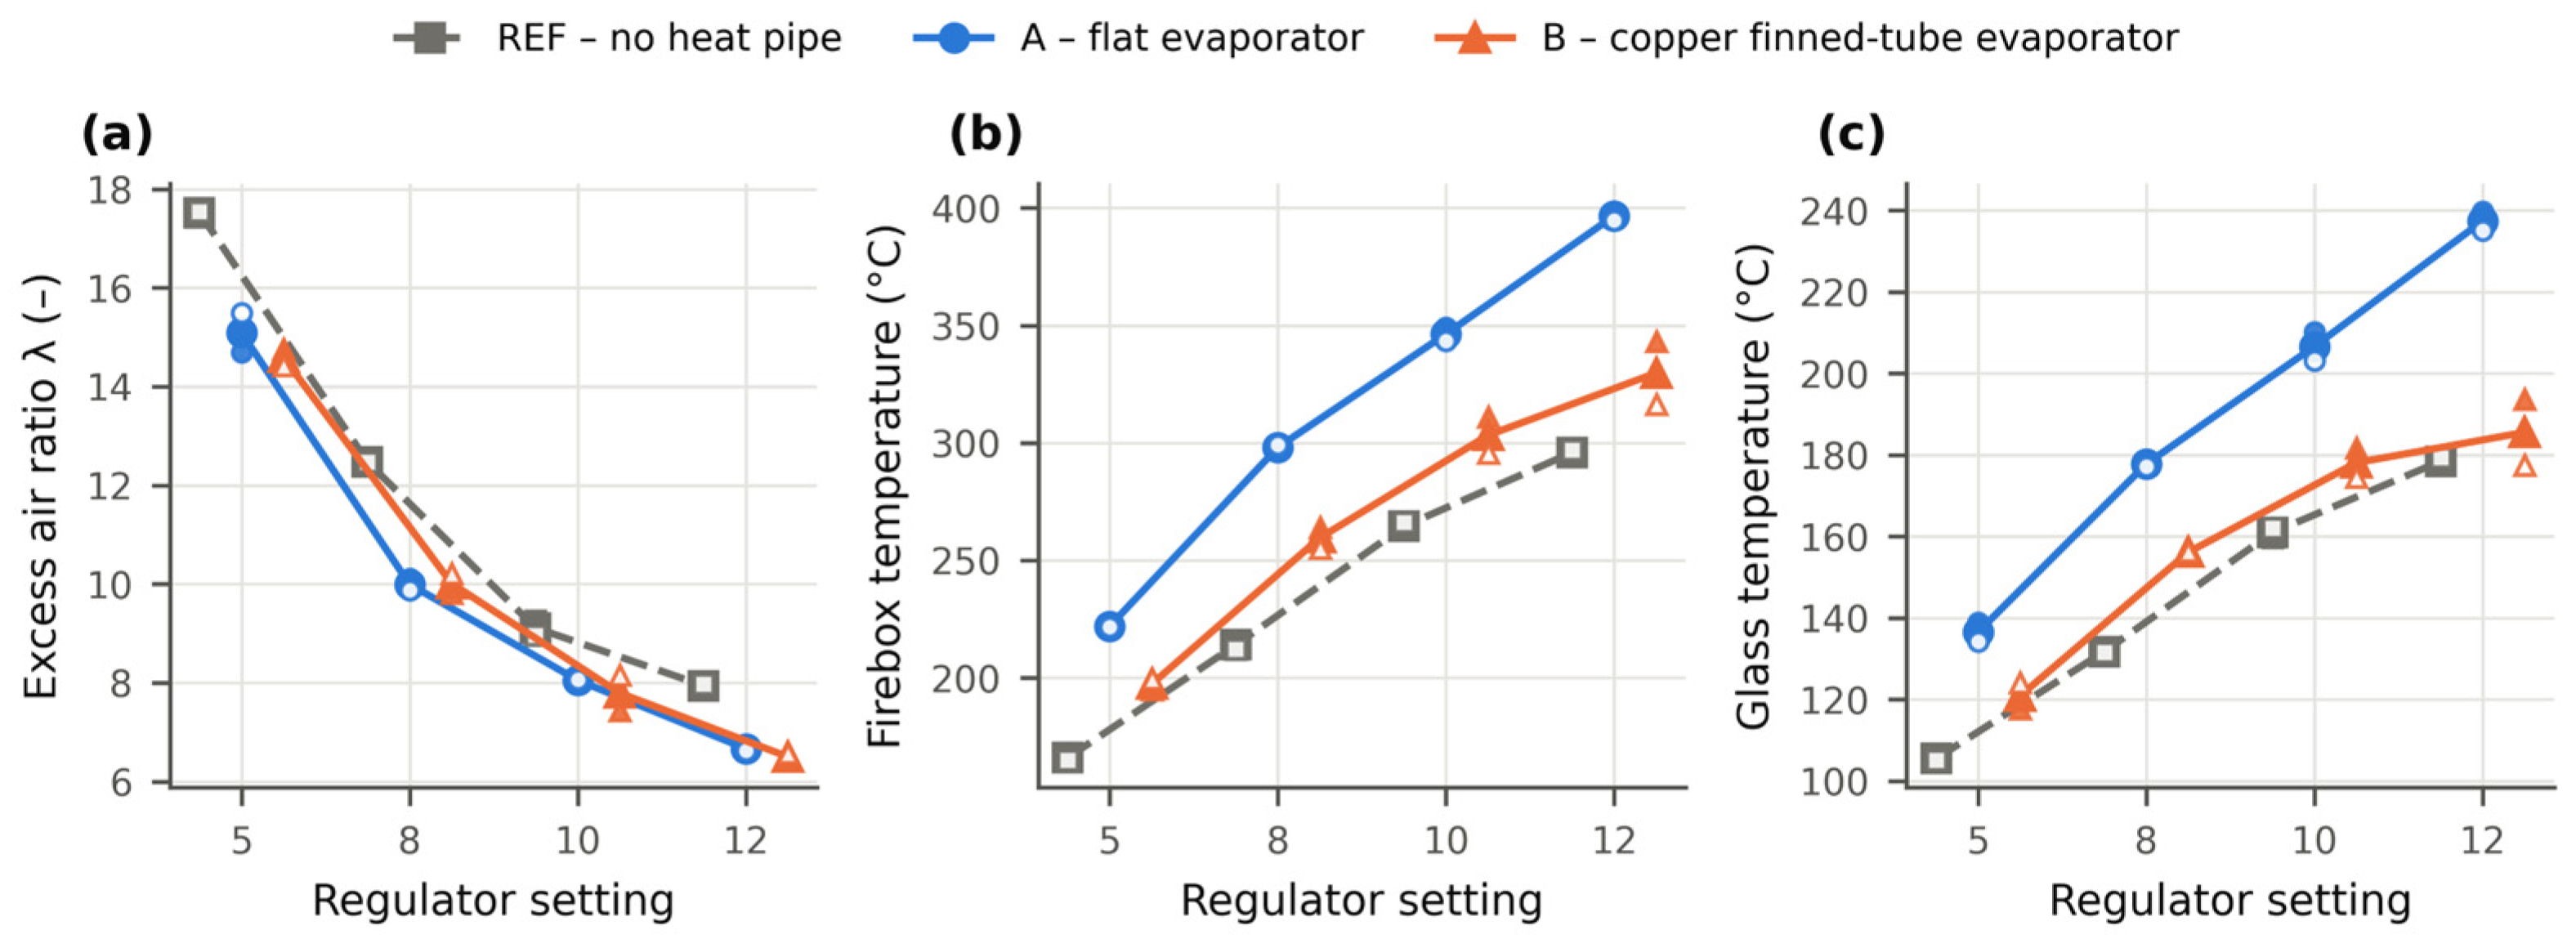
The two evaporator designs affected the flue gas temperature in the chimney differently (Figure 4b). At settings 10 and 12, variant A reduced the flue gas temperature by 14–15 K relative to the reference, whereas at settings 5 and 8, it remained at the reference level (−1 to +4 K). Variant B, by contrast, increased the flue gas temperature on average by 6–14 K at settings 5–10 and reduced it only at setting 12, by 9 K on average, with a large spread between the series (−18 to 0 K). The temperatures in the firebox also differed (Table 6 ). Variant A increased the mean firebox temperature by 56–101 K and the glass temperature by 31–59 K relative to the reference, whereas variant B increased the firebox temperature by 31–46 K and the glass temperature by 7–24 K.
Table 6.
Heat pipe operating parameters and firebox temperatures (last 10 min; mean of series 1.1 and 2.2). Tvl—vapour line surface temperature; Tcl—condensate line surface temperature; p—measured absolute pressure in the vapour line; tfb—mean firebox temperature; tgl—glass temperature.
The flat evaporator, which forms a continuous surface above the flame, was thus associated with considerably higher firebox and glass temperatures than the finned-tube evaporator, through which the flue gas flows between the fins. The mechanism, for example, a change in the flue gas flow pattern or radiation from the evaporator surface, was not measured directly.
3.4. Heat Pipe Operation
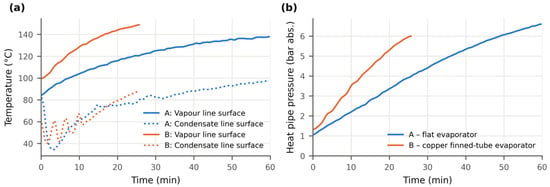
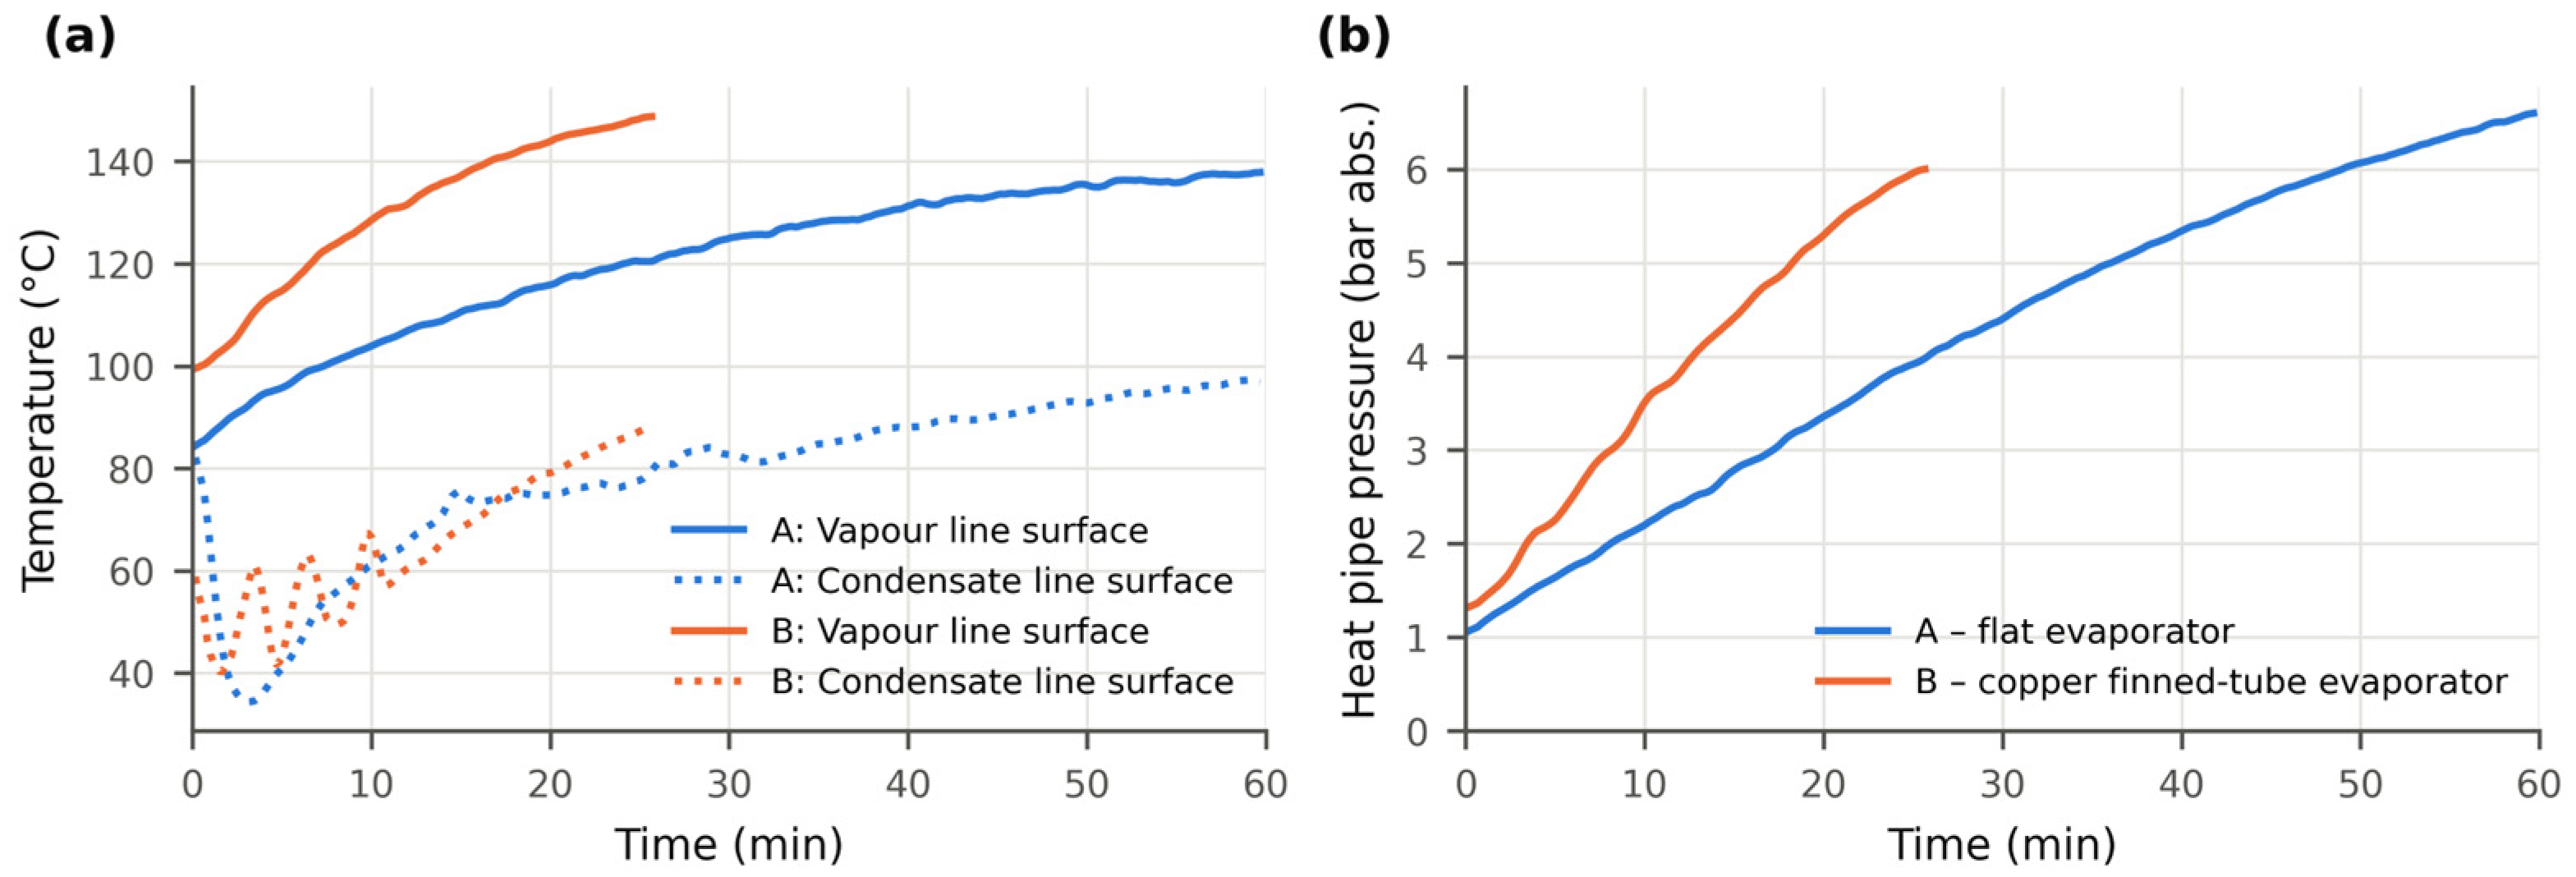
The operating parameters of the heat pipe are given in Table 6 and Figure 5. The loop pressure increased with the output to 1.0–6.2 bar for variant A and 1.4–5.5 bar for variant B. The maximum values of 6.6 bar (A) and 6.1 bar (B) were measured at setting 12, at which the pressure kept rising until the end of the test (Figure 5b), finally at a rate of 0.05–0.06 bar·min−1 for variant A and 0.09–0.12 bar·min−1 for variant B. The surface temperature of the vapour line reached 87–137 °C for variant A and 99–144 °C for variant B, and the surface temperature of the condensate line was on average 25–41 K lower.
Figure 5.
Heat pipe operation at setting 12, series 2.2 (test B terminated after 26 min): (a) surface temperatures of the vapour and condensate lines; (b) measured absolute pressure in the heat pipe.
The saturation temperature of water corresponding to the measured pressure, 98–161 °C, was 13–25 K (A) and 8–12 K (B) higher than the vapour line surface temperature. Because the thermocouples were attached to the outer surface of the lines, they indicate a lower temperature than that of the working fluid owing to the thermal contact resistance and the heat loss from the pipe surface; other possible contributions to this difference cannot be quantified with the present instrumentation. The measured pressure is therefore regarded as the primary indicator of the loop state, and the surface temperatures Tvl and Tcl, which do not enter Equations (2)–(6) and thus do not affect the heat flow and efficiency results, are used only to describe the transient behaviour; since their deviation from the saturation temperature differs between the variants, they are unsuitable for a quantitative comparison of the fluid temperatures.
3.5. Efficiency and Combustion
The efficiency of the reference insert according to EN 613 decreased with increasing output from 90.3% at setting 5 to 81.5% at setting 12 (Figure 4c), which is consistent with the efficiency of 80.0–87.1% declared by the manufacturer (Table 1). With the heat pipe, the efficiency was higher at all settings: at settings 5, 8, 10 and 12 by 1.7, 3.0, 4.7 and 5.7 pp for variant A and by 1.5, 2.4, 3.7 and 4.9 pp for variant B. These differences are considerably larger than the uncertainty of η (±0.2–0.4 pp). They include the preheating of the combustion air with heat taken from the firebox; for the whole insert, the change Δηins was only −1.1 to +1.2 pp (Table 5, Section 4.3). At settings 8–12, the efficiency of variant A was 0.7–1.0 pp higher than that of variant B, and the ranges of the series did not overlap; at setting 5, the difference (0.2 pp) was within the spread of the series. A change of the reference O2 content by ±1 percentage point (10% or 12% instead of 11%) shifts the efficiency of the reference insert by 0.8–1.8 pp and the gains by at most 0.6 pp, without changing the order of the configurations. The comparison is based on η rather than on the useful heat output Pout, because the heat input at the same setting differed between the configurations by up to 0.12 kW.
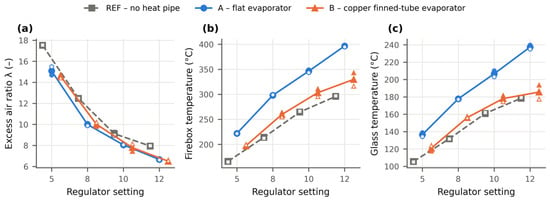
The installation of the heat pipe also affected the combustion and the firebox temperatures (Figure 6). The excess air ratio in the chimney decreased from 17.5 to 14.6–15.1 at setting 5 and from 7.9 to 6.5–6.7 at setting 12. The additional pressure drop of the condenser in the intake duct and the lower density of the preheated air may contribute to this decrease, but the chimney draught also varied between the tests (Section 4.5). The CO concentration in the flue gas was lower with the heat pipe (10–24 ppm compared with 18–33 ppm for the reference, i.e., a difference of the order of the analyser accuracy of ±10 ppm). The NOx concentrations increased with the output in all configurations, from 1–3 ppm at setting 5 to 10–12 ppm at setting 12, and were close to the reference at the same setting, except for variant A at setting 12 (12.1 compared with 9.9 ppm), which coincided with the highest firebox temperature. The concentrations are values measured in the chimney and were not converted to a reference O2 content, because at 17.7–19.8% O2 the conversion to 0% O2 multiplies them by approximately λ (6.5–17.5) and amplifies their errors (±0.2 vol.% O2 alone changes the result by 6–20%); only the measured concentrations are therefore compared, and no conclusion on total emissions is drawn, although with the lower λ a conversion would only increase the CO difference.
Figure 6.
Effect of the heat pipe on combustion and insert temperatures (last 10 min, mean of the series; small markers—individual series): (a) excess air ratio in the chimney; (b) mean firebox temperature; (c) temperature of the front door glass.
4. Discussion
4.1. Comparison of the Evaporator Designs
Both evaporator designs transferred a similar share of the heat input to the combustion air, 20–25% (an upper estimate), and this share hardly changed with the output (Table 5). Within the scatter of the data, the two designs cannot be distinguished by the amount of heat delivered to the air. They differ, however, in their dynamics, in the agreement between the two series and in their effect on the temperatures in the firebox and in the chimney.
Both evaporators operate on the same principle of a gravity-driven two-phase loop; the wick of A does not drive the circulation as in a capillary-pumped loop but only distributes the liquid evenly over the heated wall, so the differences below reflect the combined effect of the wall material and heat capacity, the geometry and joints, the wick and the filling ratio rather than of any single feature. Evaporator B, made of copper tubes with aluminium fins, has a lower heat capacity and no wick that may add a thermal resistance between the wall and the boiling liquid. Consistently with this, it reached 90% of its final output after 10–29 min, compared with 33–42 min for evaporator A. However, the difference between series 1.1 and 2.2 reached up to 25%. The cause of this difference could not be identified from the recorded data; it indicates that the operation of the finned-tube evaporator is sensitive to the initial state of the loop. The flat evaporator A had a considerably larger thermal inertia, but the results of its two series differed by at most 3.2%, which is consistent with the function of the wick in distributing the liquid over the heated wall [25,27].
The designs differed most in their effect on the flue gas and the firebox. At settings 10 and 12, the flat evaporator reduced the flue gas temperature in the chimney by 14–15 K, but at the same time increased the firebox temperature by 82–101 K and the glass temperature by 46–59 K. The finned-tube evaporator changed the firebox and glass temperatures less, but at settings 5–10 it increased the flue gas temperature in the chimney on average by 6–14 K. Possible explanations include a higher flame temperature with the preheated combustion air [9] and the lower excess air ratio, which means less dilution of the flue gas; neither effect was quantified in this study. These differences show that an evaporator located in the firebox should be assessed not only by the heat it delivers to the air but also by its effect on the flue gas temperature and on the temperatures of the firebox and the glazed front.
4.2. Operating Limits of the Heat Pipe
The loop pressure increased with the output and reached 6.1–6.6 bar at the highest setting. For variant B, the pressure was still rising at approximately 0.1 bar·min−1 at the end of the test, which was therefore terminated after 26 min so as not to exceed the safety limit of 7 bar. The pressure is thus the main operating limitation of the current prototypes, similarly to the previous study with a flat evaporator, in which it limited the duration of the test with the heat pipe to 15 min [36]. Operation over the whole output range of the insert will require the loop to be designed for a higher operating pressure or the heat flux to the evaporator to be limited at the highest outputs.
The temperatures of the vapour and condensate lines were measured on the outer pipe surface and are lower than the saturation temperature corresponding to the measured pressure (Section 3.4). They therefore cannot be used to determine the condensate subcooling or the thermal resistance of the individual components of the loop. Identifying the component that limits the heat transfer, whether the evaporator, the condenser or the lines, would require fluid temperatures measured inside the loop.
4.3. Efficiency and Balance Boundary
With the combustion chamber as the balance boundary, the efficiency gain according to EN 613 was 1.5–5.7 pp and increased with the output of the insert. The gain was largest at settings 10 and 12, at which the flue gas temperature of the reference insert exceeded 230 °C. The choice of the boundary is essential for the interpretation of this value. At the combustion chamber boundary, t1 is the temperature of the preheated air, so the efficiency gain includes both the lower flue gas temperature and the higher temperature of the combustion air. The heat transferred to the air (10–25% of the heat input, depending on how the air flow is determined; Section 4.5) was comparable with the whole flue gas loss of the reference insert (q1 + q2 = 10–18%). The evaporator, located above the flame, therefore receives heat not only from the flue gas but also by radiation in the firebox. Part of the transferred heat is thus circulated within the appliance rather than recovered from the flue gas. With the boundary drawn around the whole insert including the heat pipe (t1 = Tin), only the change in the flue gas temperature counts, and the efficiency changed by only −1.1 to +1.2 pp (Δηins, Table 5), positive only for variant A at settings 10 and 12 and for variant B at setting 12; for variant A at setting 12, for example, the gain of 5.7 pp at the combustion chamber boundary consists of 1.2 pp from the lower flue gas temperature and 4.5 pp from the air preheating. The gains of 1.5–5.7 pp therefore do not represent an improvement in the efficiency of the whole appliance, which would require the evaporator to lower the flue gas temperature, e.g., by taking heat from the flue gas downstream of the firebox rather than from the firebox itself.
Previous measurements on the same appliance reported an efficiency increase of 3.4 pp with a flat evaporator at maximum output [11,36] and of 2.7 pp on average with a tubular evaporator [37]. These studies did not convert the flue gas volume to the reference O2 content used here, the temperature of the intake air upstream of the condenser was used as t1 [11], and the duration of the heat pipe operation in the test with the flat evaporator was only 15 min [36]. Because of the different evaluation conventions and test procedures, the values are not directly comparable with the present results.
4.4. Implications for Residential Heating
The heat pipe transferred 20–25% of the heat input to the combustion air without any auxiliary energy, i.e., approximately 200–250 W per kilowatt of heat input or 1.7–2.0 kW for an insert with a heat input of 8–10 kW (upper estimates for the tested insert and condenser; Section 4.5), with the air preheated by 25–61 K. Since the heat pipe itself requires no electrical energy, it does not add a dependence on the power supply, and it can be retrofitted to existing appliances. At the same time, the excess air ratio and the measured CO concentration in the flue gas decreased (the latter by an amount of the order of the analyser accuracy).
The higher glass and firebox temperatures with the flat evaporator indicate a higher radiant heat emission from the front of the insert. The radiant and convective heat outputs were not measured, so the effect of the evaporator design on thermal comfort in the room cannot be quantified from the present data. In well-insulated houses, where the radiant output of local space heaters is associated with the risk of local overheating [4,6], this effect should be assessed by direct measurement before an evaporator design is selected.
4.5. Limitations of the Study
The results should be interpreted with several limitations in mind. The tests were carried out on a single appliance in the summer and with one condenser, in a laboratory at a stable temperature; freezing of the water and the start-up after freezing were not investigated, so an installation in an unheated space would require frost protection or a working fluid with a lower freezing point, whose different thermophysical properties would change the heat transfer. Since the variants are complete designs, the effects of material, geometry, joints, wick and filling ratio cannot be separated, which would require variants differing in a single parameter. The chimney draught (10 ± 1 Pa, mean ± standard deviation) varied between and during the tests due to the outdoor weather, which may have affected the excess air. Where the trends persisted, in particular for variant B at setting 12 (26 min), the final 10-min values underestimate the steady-state output (Section 3.1). Series 1.1 and 2.2 are not independent repetitions, as they differ in the order of settings and in the initial thermal state, so their difference expresses reproducibility under changed conditions rather than repeatability in the sense of the GUM [40]; it was at most 3.2% in Q̇air and 0.4 pp in η for variant A (REF: 0.15 pp) but up to 25% and 0.9 pp for variant B, while the efficiency gains, the higher η of A than of B at settings 8–12 and the larger increase in the firebox and glass temperatures with A were found in each series individually. The effects of the draught and of the initial state were reduced by evaluating the last 10 min of each test, by averaging the ascending and descending series, by using the measured air temperatures of each test in Equations (2)–(5) and by normalising the efficiency to O2,ref, which removes the effect of the draught on the excess air; a residual effect on the flue gas temperature and on the heat pipe output cannot be excluded.
The air mass flow from one point velocity measurement per duct zone was 1.63–1.92 times the combustion air flow calculated from the excess air ratio and the gas consumption in all configurations including REF, so Q̇air may be overestimated, but the deviation is systematic and does not affect the comparison of the evaporators. With the air flow from λ, the heat transferred to the air would be 523–1202 W (10–15% of the heat input), so the anemometer and λ-based values are regarded as the upper and lower estimates of the heat pipe output, for which the air-side balance is the only measured indicator. The efficiency is not affected, because it is determined from the flue gas side. The heat removed in the evaporator and the useful heat output of the insert (convective and radiant) were not measured directly. The heat pipe line temperatures are surface values (Section 3.4).
The efficiency refers to the combustion chamber boundary and to the reference O2 content of 11%, which is based on earlier measurements of the original insert, not on measurements in this campaign; the effects of both choices are quantified in Section 3.5 and Section 4.3. The gas volume was not converted to reference conditions, and the accuracies of the thermocouples and of the gas meter in the uncertainty analysis are assumed. The flue gas temperature was measured 38.5 cm downstream of the flue gas sampling point, so t2 is slightly lower than at the sampling point, and η may be slightly overestimated. This effect has the same direction in all configurations and therefore affects the differences Δη less than the absolute values. Of these limitations, the air flow determination changes only the absolute value of Q̇air, equally for both variants, the choice of O2,ref and of the balance boundary changes the absolute efficiencies and gains but not the order of the configurations (Section 3.5 and Section 4.3), and the surface line temperatures, the flue gas thermocouple position and the assumed instrument accuracies do not affect the comparison, whereas the non-steady final values and the different initial states cause deviations comparable with the differences between the variants in Q̇air. The conclusions on the faster start-up of B, the closer agreement of the series of A, the effect of A on the flue gas, firebox and glass temperatures and the loop pressure as the operating limit are therefore not affected, whereas a similar heat transfer to the air can be stated only within the scatter of the data and the efficiency gains only for the combustion chamber boundary. These limitations will be addressed in a further measurement campaign during the heating season, with direct measurement of the useful heat output and with a loop designed for a higher operating pressure.
5. Conclusions
This study experimentally compared two evaporator designs of a gravity loop heat pipe for combustion air preheating in a gas fireplace insert: a flat AISI 304 evaporator with a glass-fibre wick and a copper finned-tube evaporator with aluminium fins. Both were compared with a common reference at four output settings (heat input 4.5–9.6 kW), with two tests at each setting. The main findings are as follows:
- The heat pipe transferred heat from the firebox to the combustion air without auxiliary energy, in the last 10 min of the tests 20–25% of the heat input based on point velocity measurements (953–2040 W with the flat and 1071–1888 W with the finned-tube evaporator) and 10–15% (523–1202 W) with the air flow from the excess air ratio, and preheated it from 22–27 °C to 50–85 °C.
- With the combustion chamber as the balance boundary and CO2 converted to the O2 content of the original insert, the efficiency according to EN 613 increased by 1.5–5.7 pp compared with the reference, and the gain increased with the output. With a boundary around the whole insert including the heat pipe, the change was only −1.1 to +1.2 pp, because most of the gain results from preheating the air with heat taken from the firebox, partly by radiation; the efficiency of the whole appliance improved only where the flue gas temperature decreased (flat evaporator at settings 10 and 12, finned-tube evaporator at setting 12).
- Within the scatter of the data, both designs transferred a similar amount of heat to the air. The finned-tube evaporator reached its final output sooner (10–29 vs. 33–42 min), but its two series differed by up to 25%, whereas those of the flat evaporator differed by at most 3.2% under the tested conditions.
- At settings 10 and 12, the flat evaporator reduced the flue gas temperature in the chimney by 14–15 K and increased the firebox temperature by 82–101 K and the glass temperature by 46–59 K. The finned-tube evaporator changed the firebox and glass temperatures less, but at settings 5–10, it increased the flue gas temperature on average by 6–14 K.
- The loop pressure increased with the output and reached 6.1–6.6 bar at the highest setting. With the finned-tube evaporator, the test at this setting was therefore terminated after 26 min so as not to exceed the safety limit of 7 bar. The pressure is the main operating limitation of the current prototypes.
- With the heat pipe, the excess air ratio decreased by 1.1–2.9, and the measured CO concentration in the flue gas also decreased, by an amount comparable with the analyser accuracy (±10 ppm).
The two designs differed mainly in their dynamics, reproducibility and effect on the firebox, glass and flue gas temperatures rather than in the heat delivered to the air; since the heat taken from the firebox is largely circulated within the insert, an efficiency gain of the whole appliance requires an evaporator that lowers the flue gas temperature, e.g., one placed in the flue gas downstream of the firebox. The effect of the evaporator design on the radiant output of the insert should be measured directly.
Future research will focus on a more pressure-resistant loop design, on the evaporator position in the flue gas path, on the condenser, on direct measurement of the useful heat output of the insert, including its radiant and convective components, and on long-term measurements under heating season conditions.
Supplementary Materials
The following supporting information can be downloaded at https://www.mdpi.com/article/10.3390/app162110995/s1, Figure S1: Time courses of all tests of the reference configuration (REF, insert without the heat pipe); Figure S2: Time courses of all tests of variant A (flat evaporator); Figure S3: Time courses of all tests of variant B (copper finned-tube evaporator).
Author Contributions
Conceptualization, Ľ.N.; methodology, Ľ.N., P.N., J.J. and M.M.; investigation, Ľ.N., P.N., J.J., M.M., A.K. and I.M.; formal analysis, Ľ.N., P.N., J.J., M.M., A.K. and I.M.; data curation, Ľ.N., A.K. and I.M.; writing—original draft preparation, Ľ.N.; writing—review and editing, Ľ.N., P.N., J.J. and M.M.; visualization, Ľ.N.; supervision, P.N., J.J. and M.M. Ľ.N. is the main author of the article. P.N., J.J. and M.M. supported the research, the guidance of the work, and the evaluation and processing of the results. A.K. and I.M. supported the laboratory preparation of the experimental part and the processing of the results. All authors have read and agreed to the published version of the manuscript.
Funding
This research was funded by the VEGA agency, grant number VEGA 1/0680/23, by the KEGA agency, grant number KEGA 023ŽU-4/2024, and by the University of Žilina under the UNIZA Grant System, grant number 21157.
Institutional Review Board Statement
Not applicable.
Informed Consent Statement
Not applicable.
Data Availability Statement
The data presented in this study and the processing scripts are available on reasonable request from the corresponding author.
Acknowledgments
The authors acknowledge the support of the VEGA agency [Research of loop heat pipe transfer properties by increasing the thermal efficiency of heat sources with waste heat usage from flue gases—grant number VEGA 1/0680/23], of the KEGA agency [Regulation and management of heating and ventilation systems—grant number KEGA 023ŽU-4/2024] and of the UNIZA Grant System of the University of Žilina [Innovative heat transfer method based on a heat pipe in a small heat source—grant number 21157]. During the preparation of this manuscript, the authors used Claude Opus 5.5 (Anthropic, San Francisco, CA, USA) for writing data-processing scripts, drafting and language editing. The authors have reviewed and edited the output and take full responsibility for the content of this publication.
Conflicts of Interest
The authors declare no conflicts of interest. The funders had no role in the design of the study; in the collection, analyses, or interpretation of data; in the writing of the manuscript; or in the decision to publish the results.
Nomenclature
The following symbols and abbreviations are used in this manuscript:
| Symbol | Meaning | Unit |
| Ai | area of duct zone i | m2 |
| cp,a | specific heat of air | J·kg−1·K−1 |
| cp,fg | mean volumetric specific heat of dry flue gas | MJ·m−3·K−1 |
| CO2, CO2,ref | measured CO2 concentration and CO2 concentration converted to O2,ref | vol.% |
| Hi, Hs | net and gross calorific value of the gas | MJ·m−3 |
| O2, O2,ref | measured O2 concentration and reference O2 content (11%) | vol.% |
| p | measured absolute pressure in the heat pipe | bar |
| P, Pout | heat input, useful heat output | W |
| q1, q2 | dry flue gas loss, water vapour loss | % |
| Q̇air | heat transferred to the combustion air | W |
| t1, t2 | combustion air temperature and flue gas temperature in Equations (4) and (5) | °C |
| tch | flue gas temperature in the chimney, tch = t2 | °C |
| tfb | mean firebox temperature | °C |
| tgl | glass door temperature | °C |
| Tin, Tout, Tout,i | air temperature upstream of the condenser, downstream of the condenser (flow-weighted) and in zone i | °C |
| Tvl, Tcl | surface temperature of the vapour line and of the condensate line | °C |
| vi | air velocity in zone i | m·s−1 |
| VCO2 | CO2 volume produced per m3 of gas | m3·m−3 |
| Vp | dry flue gas volume per m3 of gas | m3·m−3 |
| Vg | volume of natural gas consumed | m3 |
| η | efficiency | % |
| Δη | efficiency gain relative to REF (combustion chamber boundary) | pp |
| Δηins | efficiency change relative to REF for the boundary around the whole insert | pp |
| λ | excess air ratio | – |
| ρ | air density | kg·m−3 |
| τ | test duration | s |
| EPBD | Energy Performance of Buildings Directive | |
| GUM | Guide to the Expression of Uncertainty in Measurement | |
| LHP | loop heat pipe | |
| pp | percentage point | |
| REF | reference configuration without the heat pipe | |
References
- European Union. Directive (EU) 2024/1275 of the European Parliament and of the Council of 24 April 2024 on the Energy Performance of Buildings (Recast). Off. J. Eur. Union 2024, L, 2024/1275. [Google Scholar]
- Eurostat. Energy Consumption in Households. Available online: https://ec.europa.eu/eurostat/statistics-explained/index.php?title=Energy_consumption_in_households (accessed on 28 September 2026).
- European Union. Commission Regulation (EU) 2015/1188 of 28 April 2015 Implementing Directive 2009/125/EC of the European Parliament and of the Council with Regard to Ecodesign Requirements for Local Space Heaters. Off. J. Eur. Union 2015, L 193, 76–99. [Google Scholar]
- Skreiberg, Ø.; Georges, L. Wood stove material configurations for increased thermal comfort. Energy Procedia 2017, 142, 488–494. [Google Scholar] [CrossRef] [Scilit]
- Cablé, A.; Georges, L.; Peigné, P.; Skreiberg, Ø.; Druette, L. Evaluation of a new system combining wood-burning stove, flue gas heat exchanger and mechanical ventilation with heat recovery in highly-insulated houses. Appl. Therm. Eng. 2019, 157, 113693. [Google Scholar] [CrossRef] [Scilit]
- Malcho, M.; Jandačka, J.; Lenhard, R.; Kaduchová, K.; Nemec, P. Applications of Heat Pipes in Thermal Management. Energies 2025, 18, 5282. [Google Scholar] [CrossRef] [Scilit]
- Jouhara, H.; Khordehgah, N.; Almahmoud, S.; Delpech, B.; Chauhan, A.; Tassou, S.A. Waste heat recovery technologies and applications. Therm. Sci. Eng. Prog. 2018, 6, 268–289. [Google Scholar] [CrossRef] [Scilit]
- Zeiza-Seleznova, A.; Bogdanovičs, R.; Zajacs, A. Preheating and Humidification of the Combustion Air to Increase the Hot Water Boiler Efficiency. J. Sustain. Archit. Civ. Eng. 2023, 33, 83–95. [Google Scholar] [CrossRef] [Scilit]
- Bani-Hani, E.H.; Al-Khatib, F.; El Haj Assad, M.; Alshabi, M.; Castellanos, H.G.; Aryanfar, Y.; Deifalla, A.; Ragab, A.E. Optimization of adiabatic flame temperature of natural gas combustion under different conditions. Environ. Prog. Sustain. Energy 2024, 43, e14356. [Google Scholar] [CrossRef] [Scilit]
- Skalska, K.; Miller, J.S.; Ledakowicz, S. Trends in NOx abatement: A review. Sci. Total Environ. 2010, 408, 3976–3989. [Google Scholar] [CrossRef] [Scilit]
- Nová, Ľ.; Nemec, P.; Jandačka, J.; Malcho, M. Effective Heat Transfer-Making Use of Waste Heat to Boost Thermal Efficiency of Small Heat Source. Transp. Res. Procedia 2026, 93, 542–548. [Google Scholar] [CrossRef] [Scilit]
- Vasiliev, L.L. Heat pipes in modern heat exchangers. Appl. Therm. Eng. 2005, 25, 1–19. [Google Scholar] [CrossRef] [Scilit]
- Chaudhry, H.N.; Hughes, B.R.; Ghani, S.A. A review of heat pipe systems for heat recovery and renewable energy applications. Renew. Sustain. Energy Rev. 2012, 16, 2249–2259. [Google Scholar] [CrossRef] [Scilit]
- Srimuang, W.; Amatachaya, P. A review of the applications of heat pipe heat exchangers for heat recovery. Renew. Sustain. Energy Rev. 2012, 16, 4303–4315. [Google Scholar] [CrossRef] [Scilit]
- Ding, Y.; Guo, Q.; Guo, W.; Chu, W.; Wang, Q. Review of Recent Applications of Heat Pipe Heat Exchanger Use for Waste Heat Recovery. Energies 2024, 17, 2504. [Google Scholar] [CrossRef] [Scilit]
- Xue, L.; Ma, G.; Zhou, F.; Wang, L. Operation characteristics of air–air heat pipe inserted plate heat exchanger for heat recovery. Energy Build. 2019, 185, 66–75. [Google Scholar] [CrossRef] [Scilit]
- Yuan, T.; Liu, Z.; Zhang, L.; Dong, S.; Zhang, J. The Review of the Application of the Heat Pipe on Enhancing Performance of the Air-Conditioning System in Buildings. Processes 2023, 11, 3081. [Google Scholar] [CrossRef] [Scilit]
- Kang, S.; Seo, J.; Lim, J.B.; Lee, J. Effective Waste Heat Recovery of Boiler Flue Gas Using a Heat Pipe Heat Exchanger: A Performance Comparison With Finned-Tube Economizer. Int. J. Energy Res. 2025, 2025, 8781810. [Google Scholar] [CrossRef] [Scilit]
- Maydanik, Y.F. Loop heat pipes. Appl. Therm. Eng. 2005, 25, 635–657. [Google Scholar] [CrossRef] [Scilit]
- Ambirajan, A.; Adoni, A.A.; Vaidya, J.S.; Rajendran, A.A.; Kumar, D.; Dutta, P. Loop Heat Pipes: A Review of Fundamentals, Operation, and Design. Heat Transf. Eng. 2012, 33, 387–405. [Google Scholar] [CrossRef] [Scilit]
- Faghri, A. Review and Advances in Heat Pipe Science and Technology. J. Heat Transf. 2012, 134, 123001. [Google Scholar] [CrossRef] [Scilit]
- Jose, J.; Kumar Hotta, T. A comprehensive review of heat pipe: Its types, incorporation techniques, methods of analysis and applications. Therm. Sci. Eng. Prog. 2023, 42, 101860. [Google Scholar] [CrossRef] [Scilit]
- Launay, S.; Sartre, V.; Bonjour, J. Parametric analysis of loop heat pipe operation: A literature review. Int. J. Therm. Sci. 2007, 46, 621–636. [Google Scholar] [CrossRef] [Scilit]
- Martvoňová, L.; Malcho, M.; Jandačka, J.; Ďurčanský, P.; Holubčík, M.; Drozda, J.; Adamička, M. Enhancing Small Heat Source Performance through Gravitational Loop Heat Pipes. Machines 2023, 11, 813. [Google Scholar] [CrossRef] [Scilit]
- Maydanik, Y.F.; Chernysheva, M.A.; Pastukhov, V.G. Review: Loop heat pipes with flat evaporators. Appl. Therm. Eng. 2014, 67, 294–307. [Google Scholar] [CrossRef] [Scilit]
- Chien, L.H.; Shih, Y.C. An Experimental Study of Mesh Type Flat Heat Pipes. J. Mech. 2011, 27, 167–176. [Google Scholar] [CrossRef] [Scilit]
- Hassan, H.; Harmand, S. An Experimental and Numerical Study on the Effects of the Flat Heat Pipe Wick Structure on Its Thermal Performance. Heat Transf. Eng. 2015, 36, 278–289. [Google Scholar] [CrossRef] [Scilit]
- Huang, S.; Wan, Z.; Zhang, X.; Yang, X.; Tang, Y. Evaluation of capillary performance of a stainless steel fiber–powder composite wick for stainless steel heat pipe. Appl. Therm. Eng. 2019, 148, 1224–1232. [Google Scholar] [CrossRef] [Scilit]
- Jouhara, H.; Almahmoud, S.; Chauhan, A.; Delpech, B.; Bianchi, G.; Tassou, S.A.; Llera, R.; Lago, F.; Arribas, J.J. Experimental and theoretical investigation of a flat heat pipe heat exchanger for waste heat recovery in the steel industry. Energy 2017, 141, 1928–1939. [Google Scholar] [CrossRef] [Scilit]
- Iliev, I.K.; Uzuneanu, K.; Kamburova, V.; Voutev, V. Study of integral characteristics and efficiency of a heat exchanger of thermosyphon type with finned tubes. Therm. Sci. 2016, 20, S1227–S1235. [Google Scholar] [CrossRef] [Scilit]
- Jouhara, H.; Delpech, B.; Axcell, B.; Montorsi, L.; Venturelli, M.; Almahmoud, S.; Milani, M.; Ahmad, L.; Chauhan, A. Investigation on a full-scale heat pipe heat exchanger in the ceramics industry for waste heat recovery. Energy 2021, 223, 120037. [Google Scholar] [CrossRef] [Scilit]
- Tian, E.; He, Y.-L.; Tao, W.-Q. Research on a new type waste heat recovery gravity heat pipe exchanger. Appl. Energy 2017, 188, 586–594. [Google Scholar] [CrossRef] [Scilit]
- Peigné, P.; Inard, C.; Druette, L. Ventilation Heat Recovery from Wood-Burning Domestic Flues. A Theoretical Analysis Based on a Triple Concentric Tube Heat Exchanger. Energies 2013, 6, 351–373. [Google Scholar] [CrossRef] [Scilit]
- Fachini, L.V.G.; Machado, P.L.O.; Ismail, K.A.R.; Biglia, F.M.; Vaz, A.J.C.; Szmoski, R.M.; Alves, T.A. Experimental Assessment of a Passive Waste Heat Recovery System Using Thermosyphons and Thermoelectric Generators for Integration into District Heating Applications. Energies 2025, 18, 5090. [Google Scholar] [CrossRef] [Scilit]
- EN 613:2000; Independent Gas-Fired Convection Heaters; Slovak version: STN EN 613:2003. CEN: Brussels, Belgium, 2000.
- Jandačka, J.; Malcho, M.; Nemec, P.; Nová, Ľ. Increasing the Efficiency of a Small Heat Source by Reusing its Waste Heat. Waste Forum 2025, 4, 273–281. [Google Scholar]
- Nová, Ľ.; Nemec, P.; Jandačka, J.; Kordoš, A. Improvement of Combustion Air Preheating in Combustion Equipment Using a Heat Pipe. MATEC Web Conf. 2025, 412, 01004. [Google Scholar] [CrossRef] [Scilit]
- Standard’s IEC 60584-1:2013; Thermocouples—Part 1: EMF Specifications and Tolerances. International Electrotechnical Commission (IEC): Geneva, Switzerland, 2013.
- Standard’s EN 1359:2017; Gas Meters—Diaphragm Gas Meters. European Committee for Standardization (CEN): Brussels, Belgium, 2017.
- JCGM 100:2008; Evaluation of Measurement Data—Guide to the Expression of Uncertainty in Measurement. BIPM: Sèvres, France, 2008.
- JCGM 101:2008; Evaluation of Measurement Data—Supplement 1 to the “Guide to the Expression of Uncertainty in Measurement”—Propagation of Distributions Using a Monte Carlo Method. BIPM: Sèvres, France, 2008.

Disclaimer/Publisher’s Note: The statements, opinions and data contained in all publications are solely those of the individual author(s) and contributor(s) and not of MDPI and/or the editor(s). MDPI and/or the editor(s) disclaim responsibility for any injury to people or property resulting from any ideas, methods, instructions or products referred to in the content. |
© 2026 by the authors. Licensee MDPI, Basel, Switzerland. This article is an open access article distributed under the terms and conditions of the Creative Commons Attribution (CC BY) license.