


Featured Application
The results support the selection of an intermediate format for converting CAD-based mine maps into GIS-ready data in mining enterprises: uncompressed GeoPackage as the working format, with a separate compressed copy used for network transport.
Abstract
Integrating CAD-based mine maps with GIS through ETL tools requires an intermediate spatial data format suitable for a range of applications. This industrial case study compares GeoJSON, GeoPackage and GML, each uncompressed and in ZIP archives, using production mine workings maps of three underground copper mines of KGHM Polska Miedź S.A. (1,179,967 vector features). The comparison was undertaken to support the enterprise’s internal mine map data integration needs. Eleven operations were timed in FME, GDAL/OGR and QGIS, covering local and network reading and writing as well as interactive display. Uncompressed GeoPackage was the fastest in nine of the eleven operations; in local reading in FME, it required 7.0 s, compared with 48.2 s for GeoJSON and 191.6 s for GML, and it was 24.76% and 39.94% smaller, respectively. ZIP compression reduced file sizes by 90.75–94.68%, with GeoJSON producing the smallest archive. Compression shortened network reading of GeoPackage and network writing of the text-based formats in FME (GeoJSON: from 991 to 172 s), but it slowed local reading and, for GeoPackage, zooming in QGIS (from 9 to 388 s). Working, transport and archival formats should therefore be selected against separate criteria, and format efficiency must be combined with change detection, concurrency control and limited disk operations in the ETL process.
Keywords:
geoinformatics; GeoPackage; GeoJSON; GML; ZIP compression; mine maps; ETL; interoperability; performance benchmarking 1. Introduction
1.1. Spatial Data Integration in a Mining Enterprise
Spatial data link the documentation of the state of a mine with production planning, the management of production infrastructure and the assessment of the environmental impact of mining. From the perspective of mining geomatics, data acquisition is part of a broader process of organising, processing and using information [1]. Geographic information systems (GISs) are increasingly used to manage mining geodata, and their applications in mining cover planning, operation and environmental management [2]. Reviews of mining digitalisation emphasise the complementary roles of data visualisation and analytics in supporting data-driven decisions [3]. In Chinese intelligent coal mines, GIS-based spatial information services and 4D geological information form part of the mine technology system, while limited interconnection and data sharing between production systems remain a recognised problem [4]. The usefulness of mining geodata resources therefore also depends on whether the data can be made available to other systems in an appropriate structure and at the right time, and on whether a new form of the data creates further barriers to access.
In Polish underground mining, the primary carrier of this information remains the mine workings map, maintained as a document with a defined formal status and increasingly in electronic form [5]. Reviews of mining visualisation trace a similar path, from hand-drawn maps through Computer-Aided Design (CAD)-based 2D and 3D models to GIS-integrated representations and digital twins, and identify data-format compatibility and interoperability as persistent challenges [6]. The development of mining geoinformation faces both technological and organisational barriers; therefore, emphasis has been placed on the need to enrich the definitions of map objects and to base the map on spatial database technology [5], including file-based databases built on SQLite [7]. The problems in processing large-scale spatial datasets in Polish mining enterprises have been analysed in [8].
In enterprises that maintain mine maps in CAD, graphical documentation is separated from the data needed for automated analysis [9]. The expansion of the IT environment led to the creation of successive mechanisms for importing and interpreting data. The maintenance of many such mechanisms increased the complexity of the solution and the risk of discrepancies between copies of information. This separation reflects the different assumptions of the two classes of systems: CAD is orientated towards geometry and drawing, whereas GIS is orientated towards objects described by attributes, spatial relationships, and analysis [10]. Similar limitations of AutoCAD-based mine maps, namely a limited capacity for attribute data and the lack of topological relationships, motivated the development of unified spatial databases based on GIS for mine maps in China [11]. Integration of the two environments has been developed both at the level of file exchange and at the level of a shared database system [12,13], and practical CAD-to-GIS conversion procedures rely on restructuring layers and mapping the classes of graphical elements between the two systems [14]. Earlier work on AutoCAD–GIS integration likewise linked conversion methods to the analysis of data structures and the preservation of geometric and attribute information [15].
1.2. Intermediate Format and Interoperability
The choice of an integration architecture and the agreement on how systems should cooperate are separate design issues [16]. However, the intermediate format is an important technical component of both. In a simplified model of full direct exchange between N formats, converters are required. A common intermediate representation, corresponding to the canonical data model pattern [17], reduces their number to at most : one reader and one writer for each source or target format. This model describes the number of interfaces; it does not cover the cost of reconciling geometry, identifiers, attributes, and data semantics. In the mining domain, Wu and Xu [18] coupled data from heterogeneous systems that differed in source, format, representation, and dimension through dedicated interface engines, which illustrates the practical cost of such a multiplicity of interfaces.
This last layer has long been identified as the main barrier to GIS interoperability: syntactic and format compatibility does not ensure semantic compatibility [19,20]. Compatibility between data representations should also be distinguished from the accuracy of source data, which requires separate verification [21]. Noardo [22] considers the integration of multi-source data with respect to specific applications, which justifies evaluating data representations from the perspective of the process that is to use them. The mining industry takes a similar view, linking interoperability with the exchange of information in a context that allows systems to respond to changes in data sources [23]. In the conversion of mine maps, both bulk input and output operations and the interactive viewing of results by GIS users are relevant.
1.3. Open Vector Formats Included in the Comparison
The comparison covers three open formats which, at the time the converter was designed, had stable specifications and were supported by FME (Feature Manipulation Engine), GDAL/OGR (Geospatial Data Abstraction Library) and QGIS. This selection reflected the requirements of the intended CAD–GIS workflow and the aim of limiting compatibility-related implementation risks. GML is an XML-based encoding defined by the Open Geospatial Consortium (OGC) and corresponding to ISO 19136 [24]. GeoJSON stores the geometry and properties of features in JSON in accordance with RFC 7946 [25]. GeoPackage is a container based on an SQLite database file, comprising metadata tables and an optional R-tree spatial index [26]. SQLite itself is a portable single-file database engine designed to be integrated in applications [7].
A further means of reducing the volume of a file in a given format is to compress it into a ZIP archive. Some formats are distributed in a ZIP variant. This is not a separate data model, but only a different way of storing the original format. In this study, standard ZIP archives with the default Deflate compression method were used. The GDAL library provides access to the content of such archives through a virtual file system, without prior extraction to disk; fast random access to compressed content is provided by the indexed Seek-Optimized ZIP (SOZip) variant, supported from version 3.7 onwards [27].
1.4. Format Performance and Compression in Previous Studies
Research on the performance of spatial data covers different levels of the software stack. Sveen [28] analyses the storage of heterogeneous data in spatial databases, and Bartoszewski et al. [29] compare data processing in PostGIS and MongoDB. Cheng et al. [30] compared the relational (PostgreSQL) and document-oriented (GeoJSON documents in MongoDB) management of geochemical vector data; storage was about three times faster in the relational approach, whereas retrieval was faster in the document-oriented one. Zhang et al. [31] present an engine for the parallel conversion of large datasets, highlighting the importance of how the processing workflow is organised. The results of comparisons of database systems and processing architectures cannot, however, be transferred directly to a ranking of stand-alone files.
The OGC CDB vector data interoperability experiment, which compared the sizes and reading times of datasets stored in Shapefile, GeoPackage, GeoJSON and GML, relates directly to file formats [32]. It showed a considerable fixed overhead of GeoPackage for very small datasets and favourable read scalability for larger volumes, while GML proved to be the most voluminous format. Mooney and Minghini [33] described the conversion of a dataset of about 1.9 million point features from GeoPackage to GeoJSON: the resulting file was more than twice the size of the source file, and the conversion itself took 327 s on average. Wachs and Tzirita Zacharatou [34] compared the loading of data stored in various formats by various libraries and found the highest throughput for GeoParquet in their test set. The usefulness of GeoPackage as a portable resource has, in turn, been shown in mobile applications with limited connectivity [35].
Khandelwal and Rajan [36] noted that GML documents consist predominantly of coordinate data and proposed a structure-aware lossless compression model; they reported better compression ratios than ZIP, but at a lower speed, because ZIP does not exploit the structure of the data. Wei et al. [37] proposed a compression method specialised for GML documents. For 3D city models, the JSON-based CityJSON encoding produced files on average about six times smaller than the corresponding XML-based CityGML files [38]. However, these studies mainly concern the compression ratio or the size of the encoding, rather than the effect of an archive on the running time of GIS tools.
Formats optimised for cloud and analytical access, such as FlatGeobuf and GeoParquet, developed largely after the period in which the implementation decision described here was made; the GeoParquet specification reached version 1.1 in 2024 [39].
The studies reviewed above address selected aspects of spatial data storage and processing, but their findings do not directly establish the suitability of individual data structures for CAD–GIS integration. Comparisons of file size, loading speed or compression ratio alone do not capture the full range of operations involving these structures. It is therefore important to examine how data derived from the same mine map resource, represented using different structures, are handled during reading, writing and visualisation in the tools used in the integration workflow. The findings may inform the selection of spatial data structures in other enterprises with comparable CAD–GIS workflows. In the enterprise studied, this assessment was motivated by the need to process map data from three mines efficiently.
1.5. Research Gap, Aim and Research Questions
Previous studies provide valuable evidence on format performance, but differences in datasets, implementations and operations limit the direct transfer of their findings to a specific CAD–GIS workflow. This study compares the same mine map datasets across an ETL tool, a programming library and a GIS application, with local and network access and ZIP compression. Its purpose is to support the selection of a suitable spatial data structure for the integration workflow examined, rather than to isolate the causal contribution of individual system components.
The aim of this article is to determine how the choice of format and compression affected the processing time and size of real mine map data, and to identify the conditions under which these results can be used in CAD–GIS integration. The analysis addresses three questions:
- Which of the variants studied provided the shortest time for reading, writing, and displaying data in the tools used?
- How did ZIP compression change file volume and the performance of local, network, and interactive access?
- Which implementation requirements, not visible in a file-level comparison, were revealed by the operation of a converter based on the selected format?
The measurements were carried out as part of research and implementation work at KGHM Polska Miedź S.A. that preceded the selection of an intermediate format for the mine map data converter [9].
The contribution of this study is a comparison of eleven operations for six storage variants of the same mine map datasets in FME, GDAL/OGR and QGIS, considering local and network access. Linking the results to production deployment in a large mining enterprise allows the suitability of the formats to be assessed within a specific CAD–GIS integration workflow rather than for an individual operation alone. The comparison design can also serve as a reference for planning similar tests using an organisation’s own datasets and software, with operations selected to reflect its integration requirements.
2. Materials and Methods
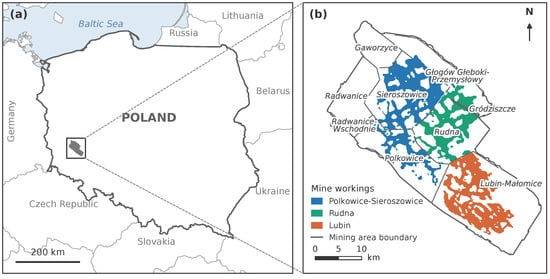
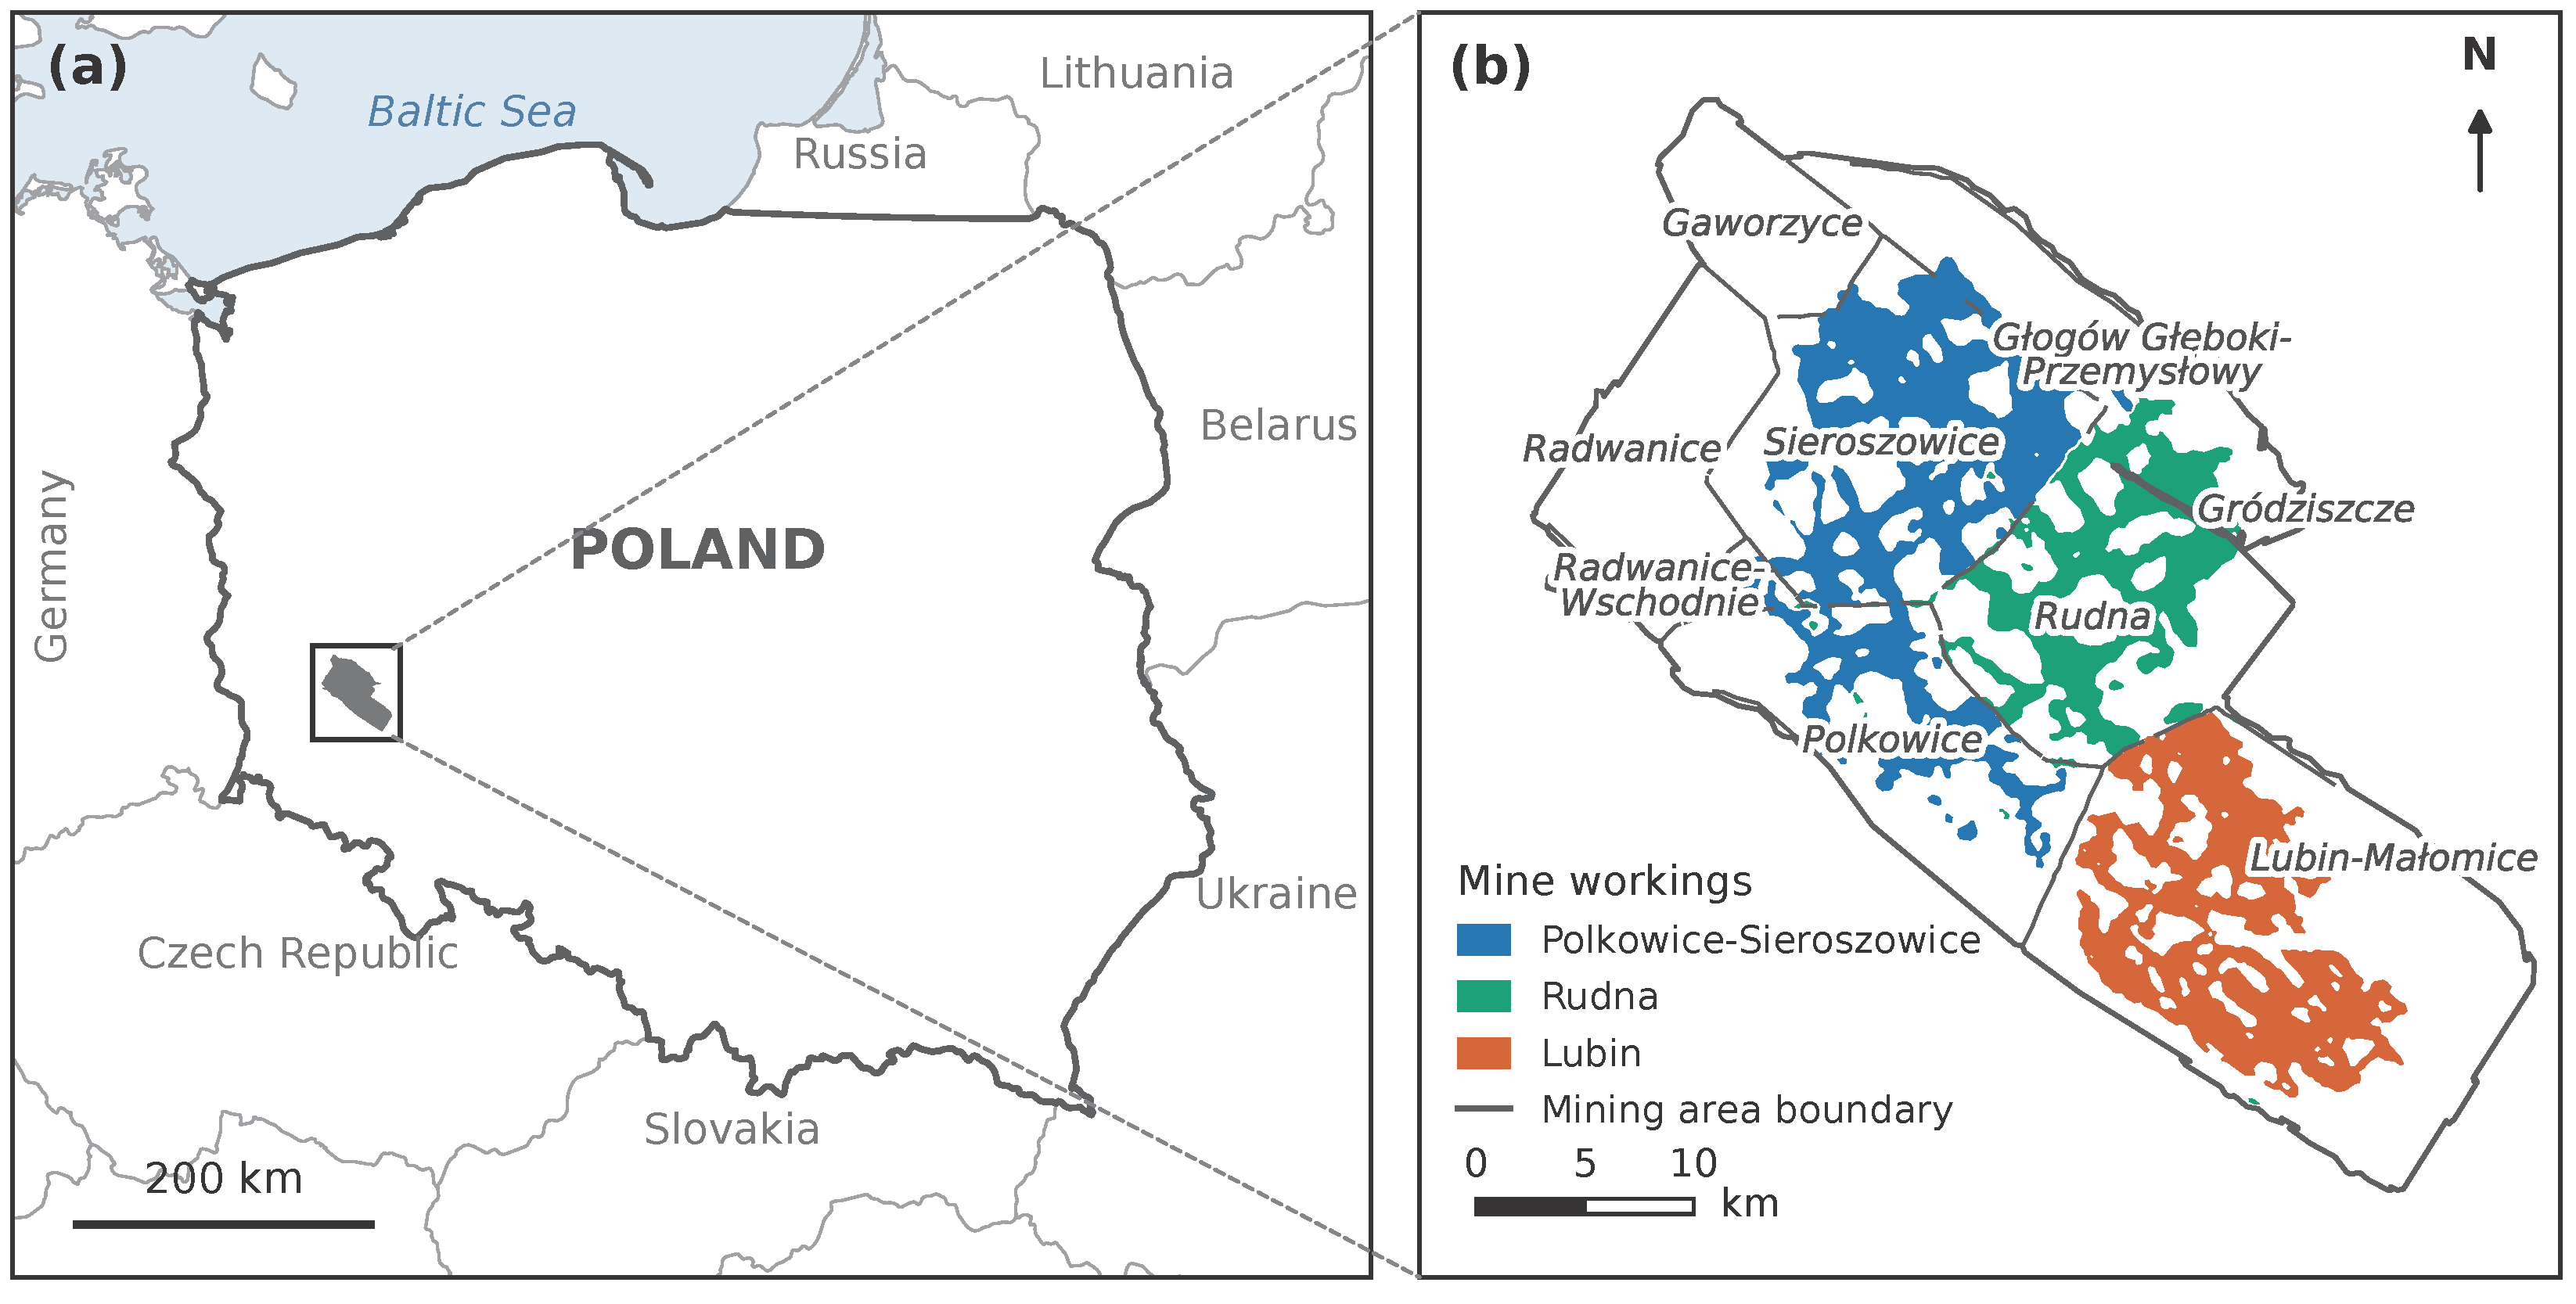
This study covered all three underground mines included in the planned deployment of the selected data format at KGHM Polska Miedź S.A.: Lubin (KL), Polkowice-Sieroszowice (KP) and Rudna (KR). These mines were not a sample selected from a larger group but constituted the full scope of the planned deployment. The datasets represented the sidewalls of mine workings in the Legnica–Głogów Copper District. The total number of features was 1,179,967 (Table 1). Their spatial distribution is shown in Figure 1. The feature counts refer to vector geometry features on the mine workings map, not to the number of geometry vertices or to LiDAR point cloud points.
Table 1.
Source datasets used in the format comparison.
Figure 1.
Location of the study area: (a) position of the Legnica–Głogów Copper District in Poland; (b) extent of the workings of the Polkowice-Sieroszowice, Rudna and Lubin mines against the boundaries of the mining areas. The extent of the workings and the mining area boundaries are shown in generalised form. Coordinate system: PL-1992 (EPSG:2180); national boundaries after Natural Earth (https://www.naturalearthdata.com).
All three of KGHM’s mines record surveying data relating to the geometry of their underground workings in the Central Spatial Data Repository (CZDP). This shared platform provides tools for maintaining digital mine maps and enables users to store, share and archive them. Mine surveyors prepare base maps, whilst other technical departments add thematic layers relating to geology, ventilation and other areas.
The files originated from the Mine Workings Map system and were converted from the source DGN (MicroStation Design File) format into the three test formats. In the source system, non-spatial attributes were grouped by purpose and stored in several long text fields encoded in JSON. A broader description of the system also indicates the presence of feature identifiers, metadata, audit data and descriptive attributes. The dataset studied therefore represented real application data rather than isolated synthetic geometry. About 98% of the features were lines and about 2% were points. The workload thus consisted of many simple geometries rather than a small number of complex features.
2.1. Environment and Experimental Design
The experiment was run under 64-bit Windows 7 on a workstation with an AMD Ryzen 7 3800X processor, 8 GB of RAM, an SSD and a 1 Gb/s network interface card. FME 2020, GDAL/OGR 3.2 and QGIS 3.16 were used. These versions reflect the state of the software at the time of the experiment.
The experiment used the following three software tools for processing and inspecting spatial data:
- FME 2020 is a data integration platform for building workflows that extract, transform, and load spatial and non-spatial data. Its graphical interface allows users to configure and reuse workflows without writing code.
- GDAL/OGR 3.2 is an open-source library and set of command-line tools for converting and processing raster and vector geospatial data. The command-line tools can be called from scripts to automate tasks such as format conversion and coordinate transformation.
- QGIS 3.16 is an open-source desktop geographic information system for visualizing, editing, and analyzing spatial data. It allows users to display multiple datasets as map layers and inspect the geometry and attributes of individual features.
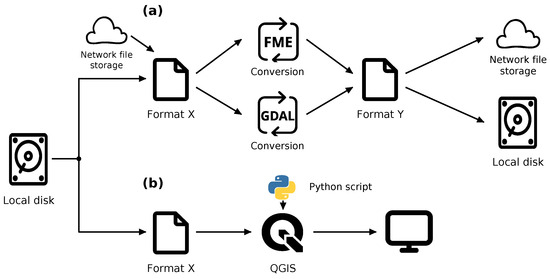
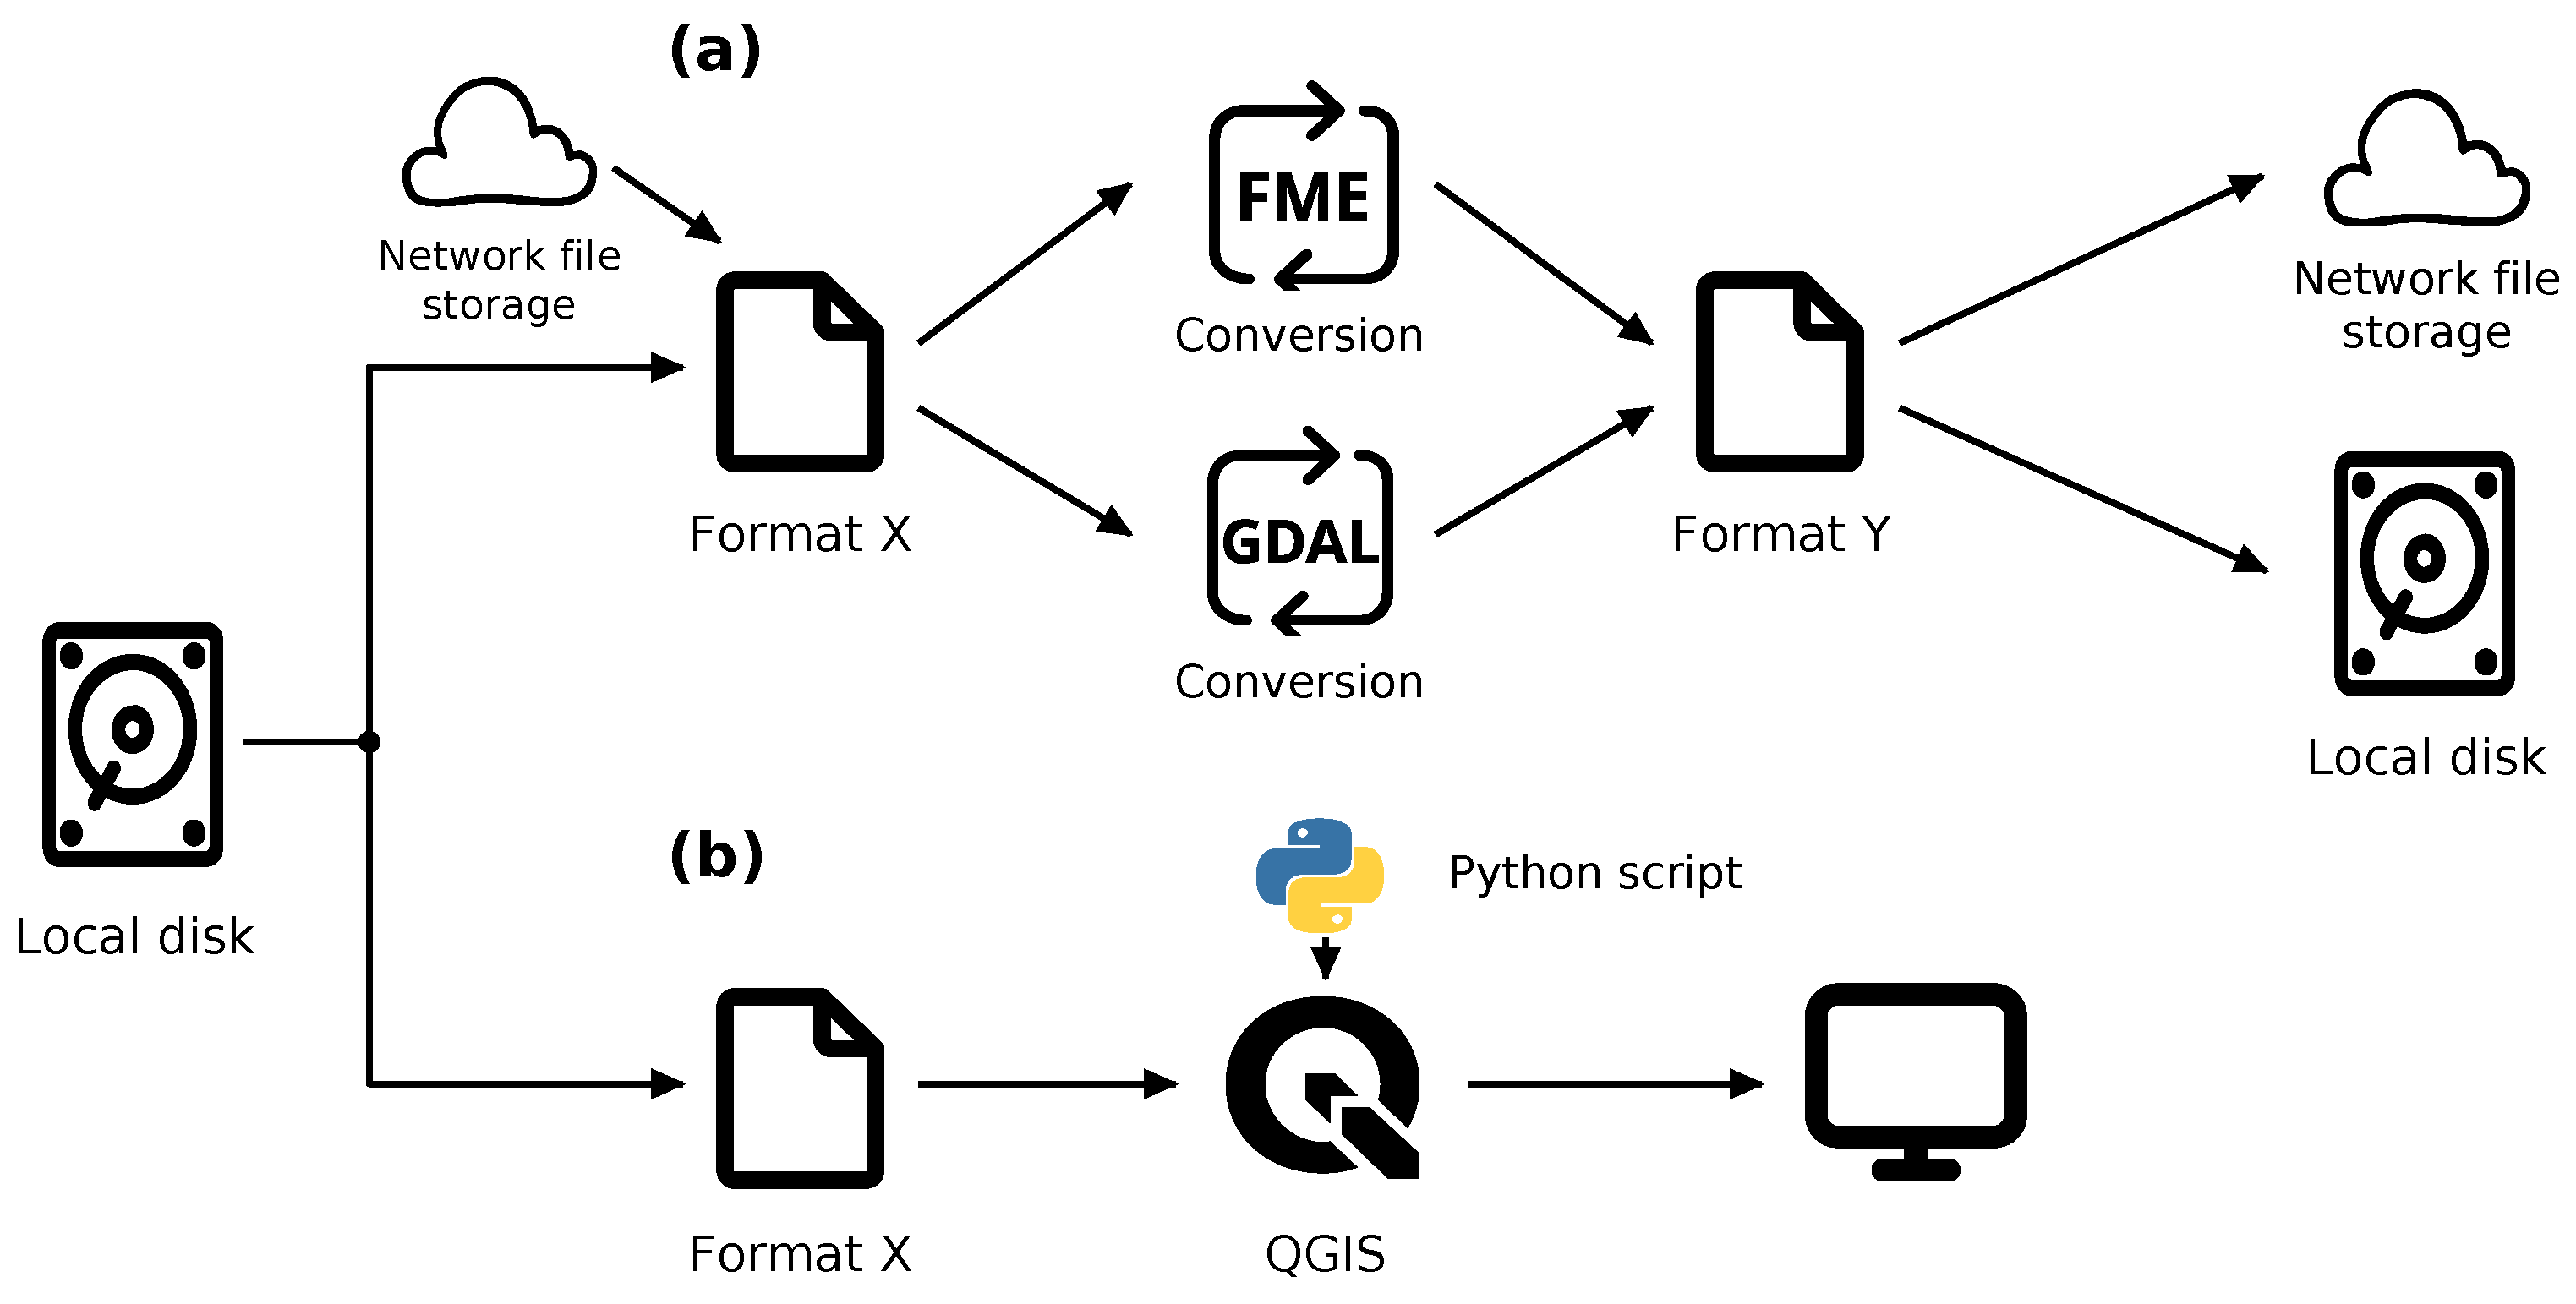
The datasets were stored either on a local disk or on a network share; the parameters of the file server and the detailed configuration of the network protocol were not recorded. Six representation variants were compared: three uncompressed formats and their counterparts stored in ZIP archives with the default Deflate method. The design comprised four FME operations (reading and writing, each locally and over the network), the analogous four GDAL operations and three QGIS operations: opening a dataset with display, zooming in on a part of the map and displaying the full extent. The source workflow is shown in Figure 2. The labels OPEN DATASET, ZOOM IN and ZOOM ALL are retained in the tables in the original wording of the script steps.
Figure 2.
Experimental workflows: (a) reading and writing in FME and GDAL; (b) reading and visualisation in QGIS controlled by a Python 3.7 version script.
Each combination of operation, data variant and mine was planned to be repeated five times. Two GeoPackage+ZIP write operations in GDAL were not performed because the GDAL version used did not support writing this variant. The design therefore corresponds to 64 supported combinations of operation and variant and, taking into account the three mines and five repetitions, to 960 runs. This number follows from the described design; it has not been independently confirmed from a complete set of logs.
FME times were taken from the standard program logs. GDAL and QGIS measurements came from logs produced by Python scripts. Execution times from five repetitions were recorded in logs and processed by scripts to calculate and store the mean values. The computer was restarted after each series. This procedure does not allow every measurement to be regarded as a cold-cache measurement; the order of the variants and the way the cache was controlled between operations were not documented.
In the write tests, the input data were read from the format identified as the most efficient in the read tests. The measured time therefore covered the entire sequence of reading, conversion and writing. It should not be interpreted as the isolated running time of the driver that writes the file.
2.2. Principles of Format Comparison
For operation o, variant f, mine m and repetition r, the execution time is denoted by . The sum of the mean execution times across the three mines is denoted by and is calculated as follows:
Equation (1) combines averaging over repeated measurements with summing times across separate mine datasets. For each operation and format variant, the mean of five repetitions is calculated for each mine, and the three means are then summed. The result represents the cumulative processing time for the datasets of all mines covered by the deployment, rather than the average time per mine; it is therefore not divided by the number of mines. This is an aggregate measure derived from separate measurements, not a measured processing time for a single merged file.
The relative time index of a given operation was defined as
where denotes the set of variants supported in operation o. A value of 1 denotes the shortest time, and values greater than 1 denote its multiples.
The recorded results have two levels of precision: for local reading in FME, all series and their means are available, whereas the remaining operations were reported in whole seconds together with separately determined relative indices. These indices cannot always be reproduced exactly by dividing the rounded seconds. The article therefore retains the times (Table 2) and the indices (Figure 3) separately, without artificially increasing their precision. The full set of repetitions is available only for local reading in FME; no new measures of dispersion were calculated for the other operations.
Table 2.
Mean operation times for the three mines combined [s]. Values are rounded to whole seconds.
Figure 3.
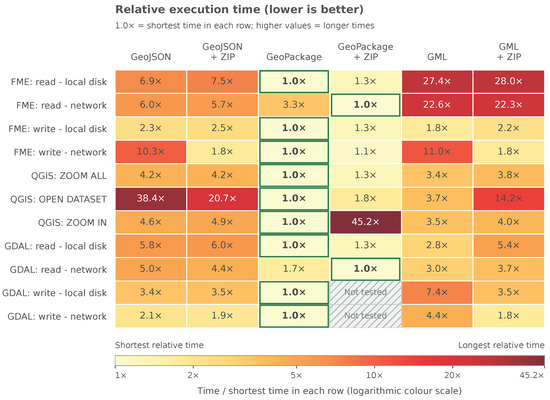
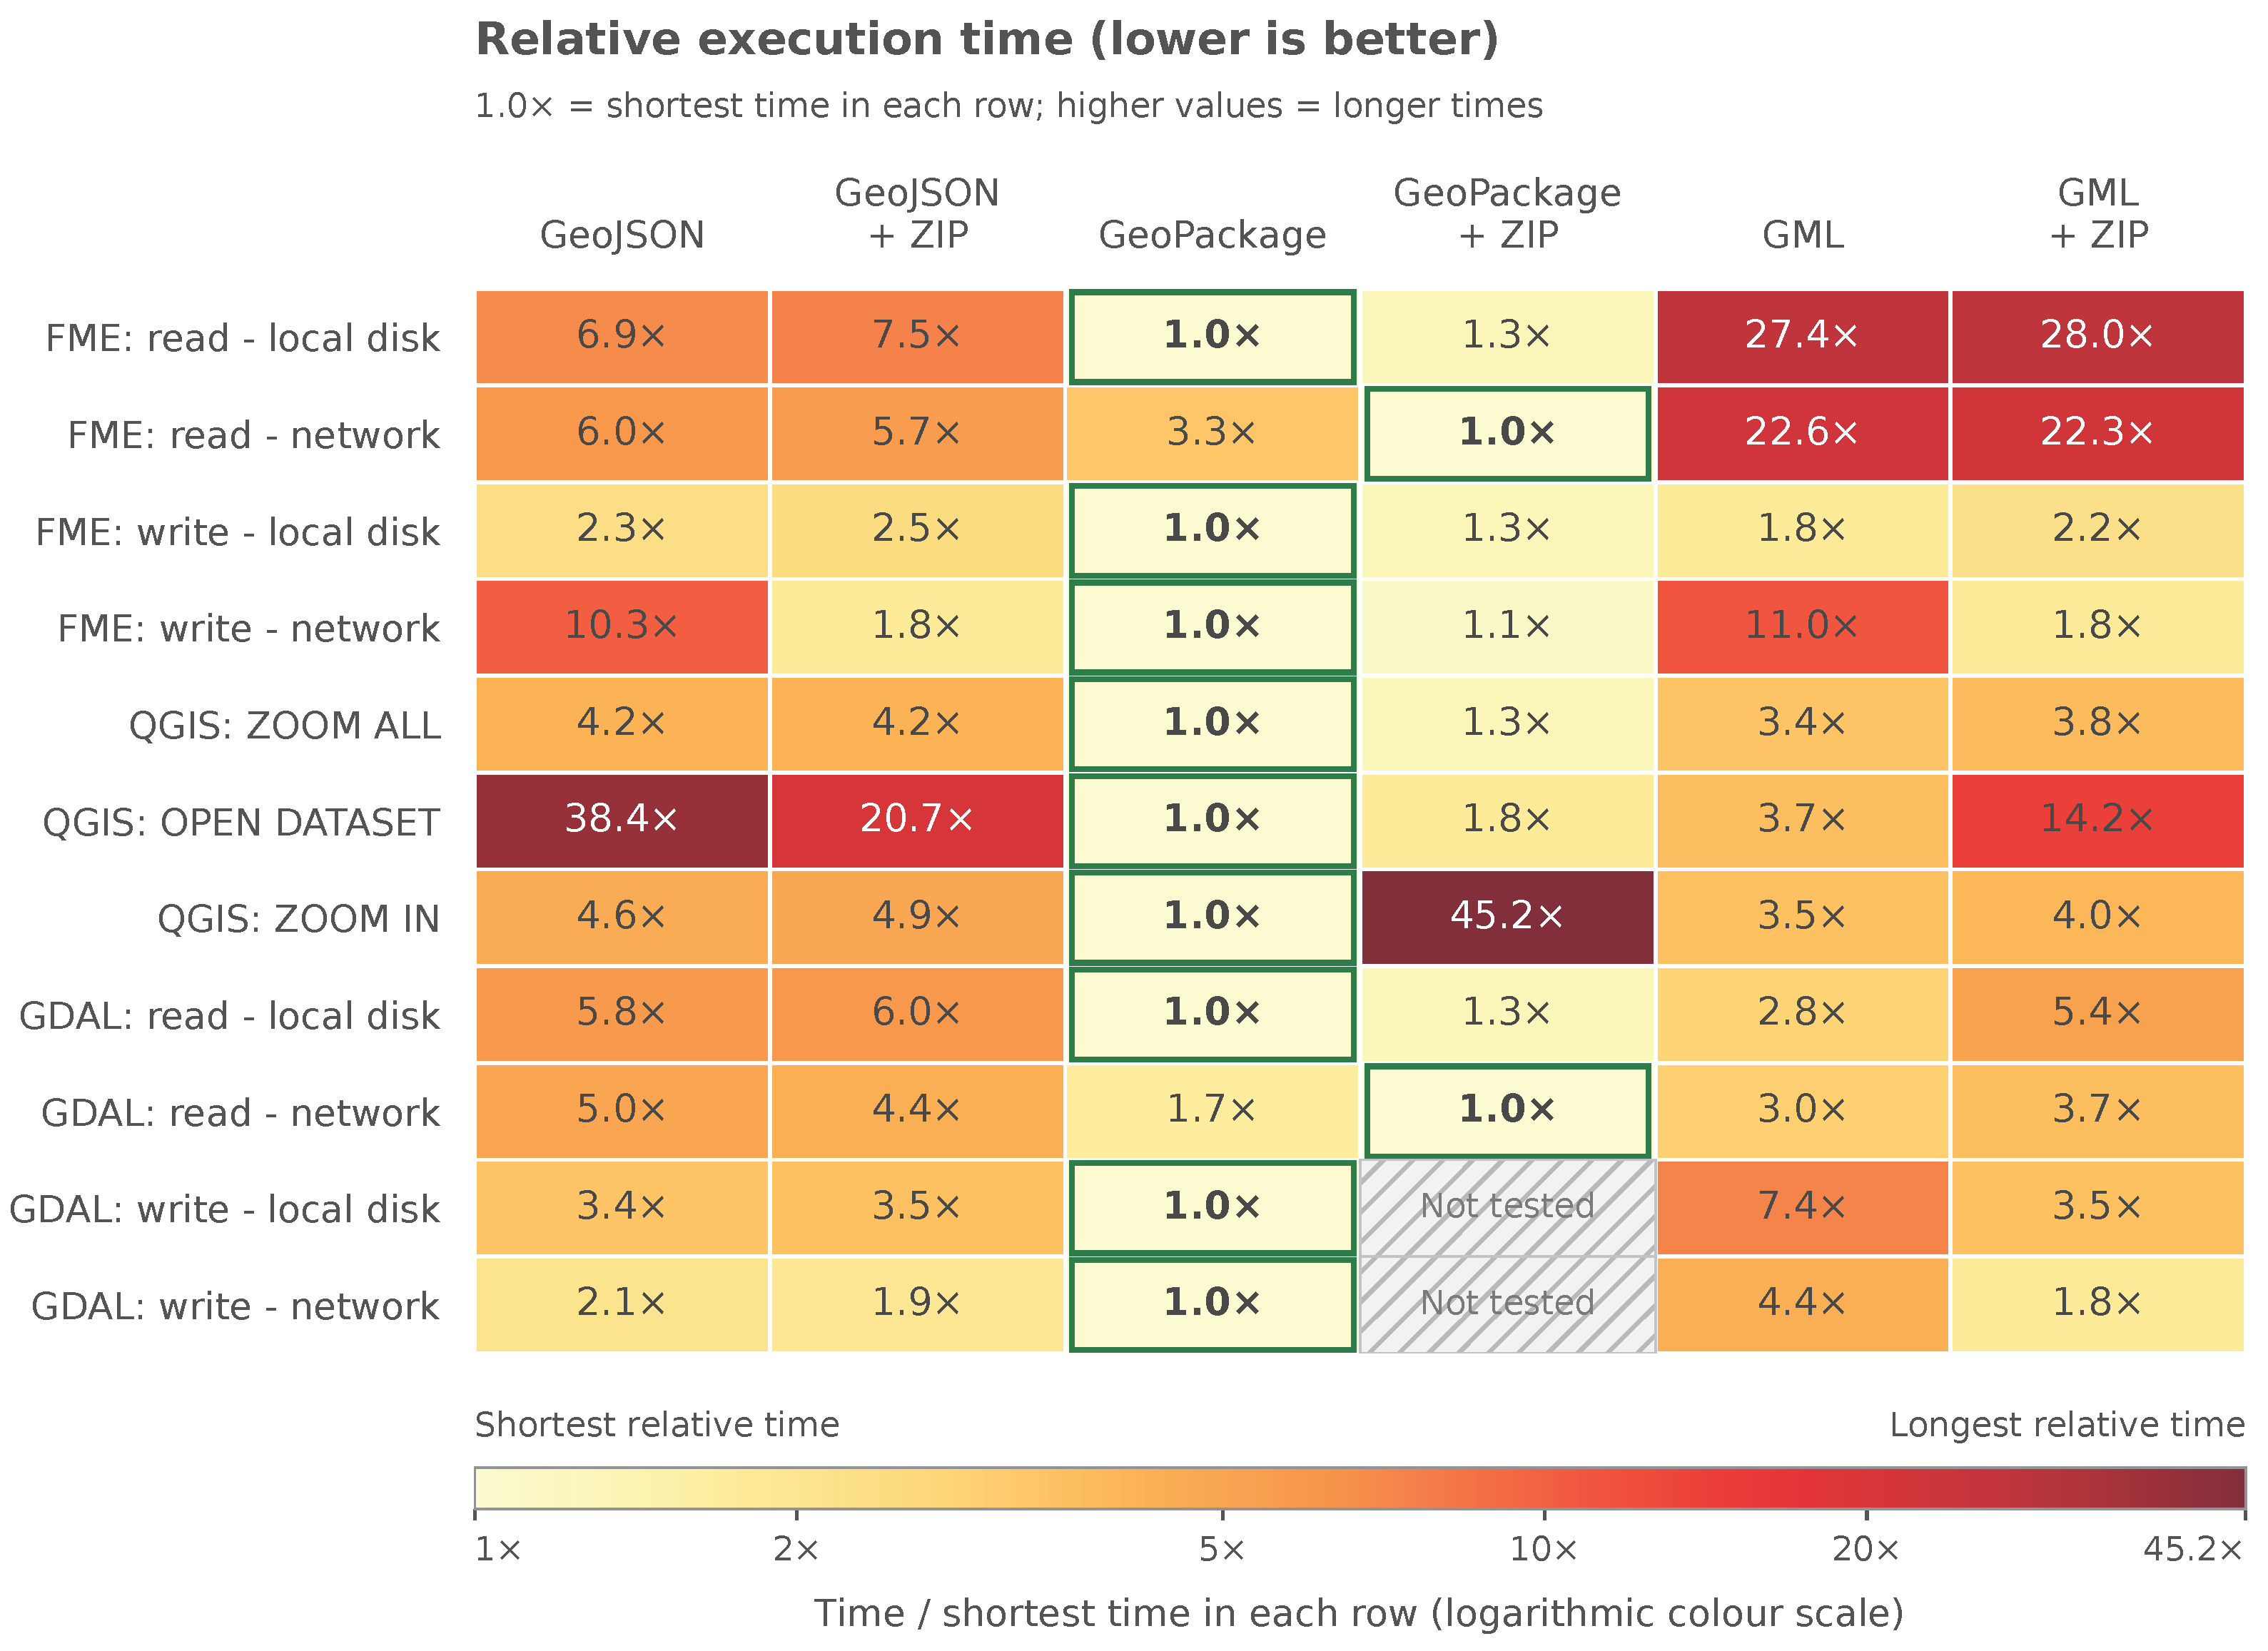
Relative execution times of the operations. The colour scale is logarithmic. Hatched cells denote variants that were not performed. The indices were not recalculated from the rounded times in Table 2.
The size reduction after compression was calculated as , where B and are the sums of the byte counts for the three mines. In addition, the sums of the times of the nine operations supported in all variants were compared. Omitting the two GDAL write operations from this summary ensures an equal scope of comparison, but the sum itself is meaningful only for a notional scenario in which each of the nine operations is performed once.
ZIP-compressed variants were included because observations preceding this study suggested potential performance benefits under network access that required systematic evaluation. ZIP-compressed and uncompressed variants were compared for the same source data, format, tool and operation; reading and writing were also compared under local and network access. These comparisons capture the combined effect of changing the configuration but do not separate transfer, decompression and data interpretation times. Changing the format also changes the file size and the way the software handles it. The effect of dataset size was not investigated independently by increasing the number of features in a controlled manner.
3. Results
3.1. Ranking of Formats by Operation
Uncompressed GeoPackage achieved the shortest time in nine of the eleven operations. In the remaining two, namely network reading in FME and in GDAL, GeoPackage+ZIP performed best. The times are listed in Table 2, and the relative indices are shown in Figure 3. Of the nine operations in which all variants were available, uncompressed GeoPackage ranked first in seven; its two remaining first places were in GDAL writing, where the GeoPackage+ZIP variant was not tested.
The differences between formats depended on the tool. In local reading in FME, the relative time of GML was 27.4 compared with GeoPackage, whereas in local reading in GDAL it was 2.8. This result indicates that the ranking of formats is not an intrinsic property of the encoding alone but also depends on the reader implementation. There is no basis for transferring a multiple observed in one program to another tool.
3.2. Local Reading and Variability Across Five Series
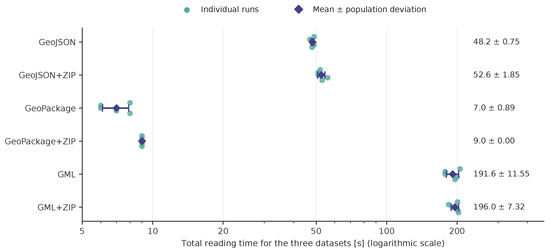
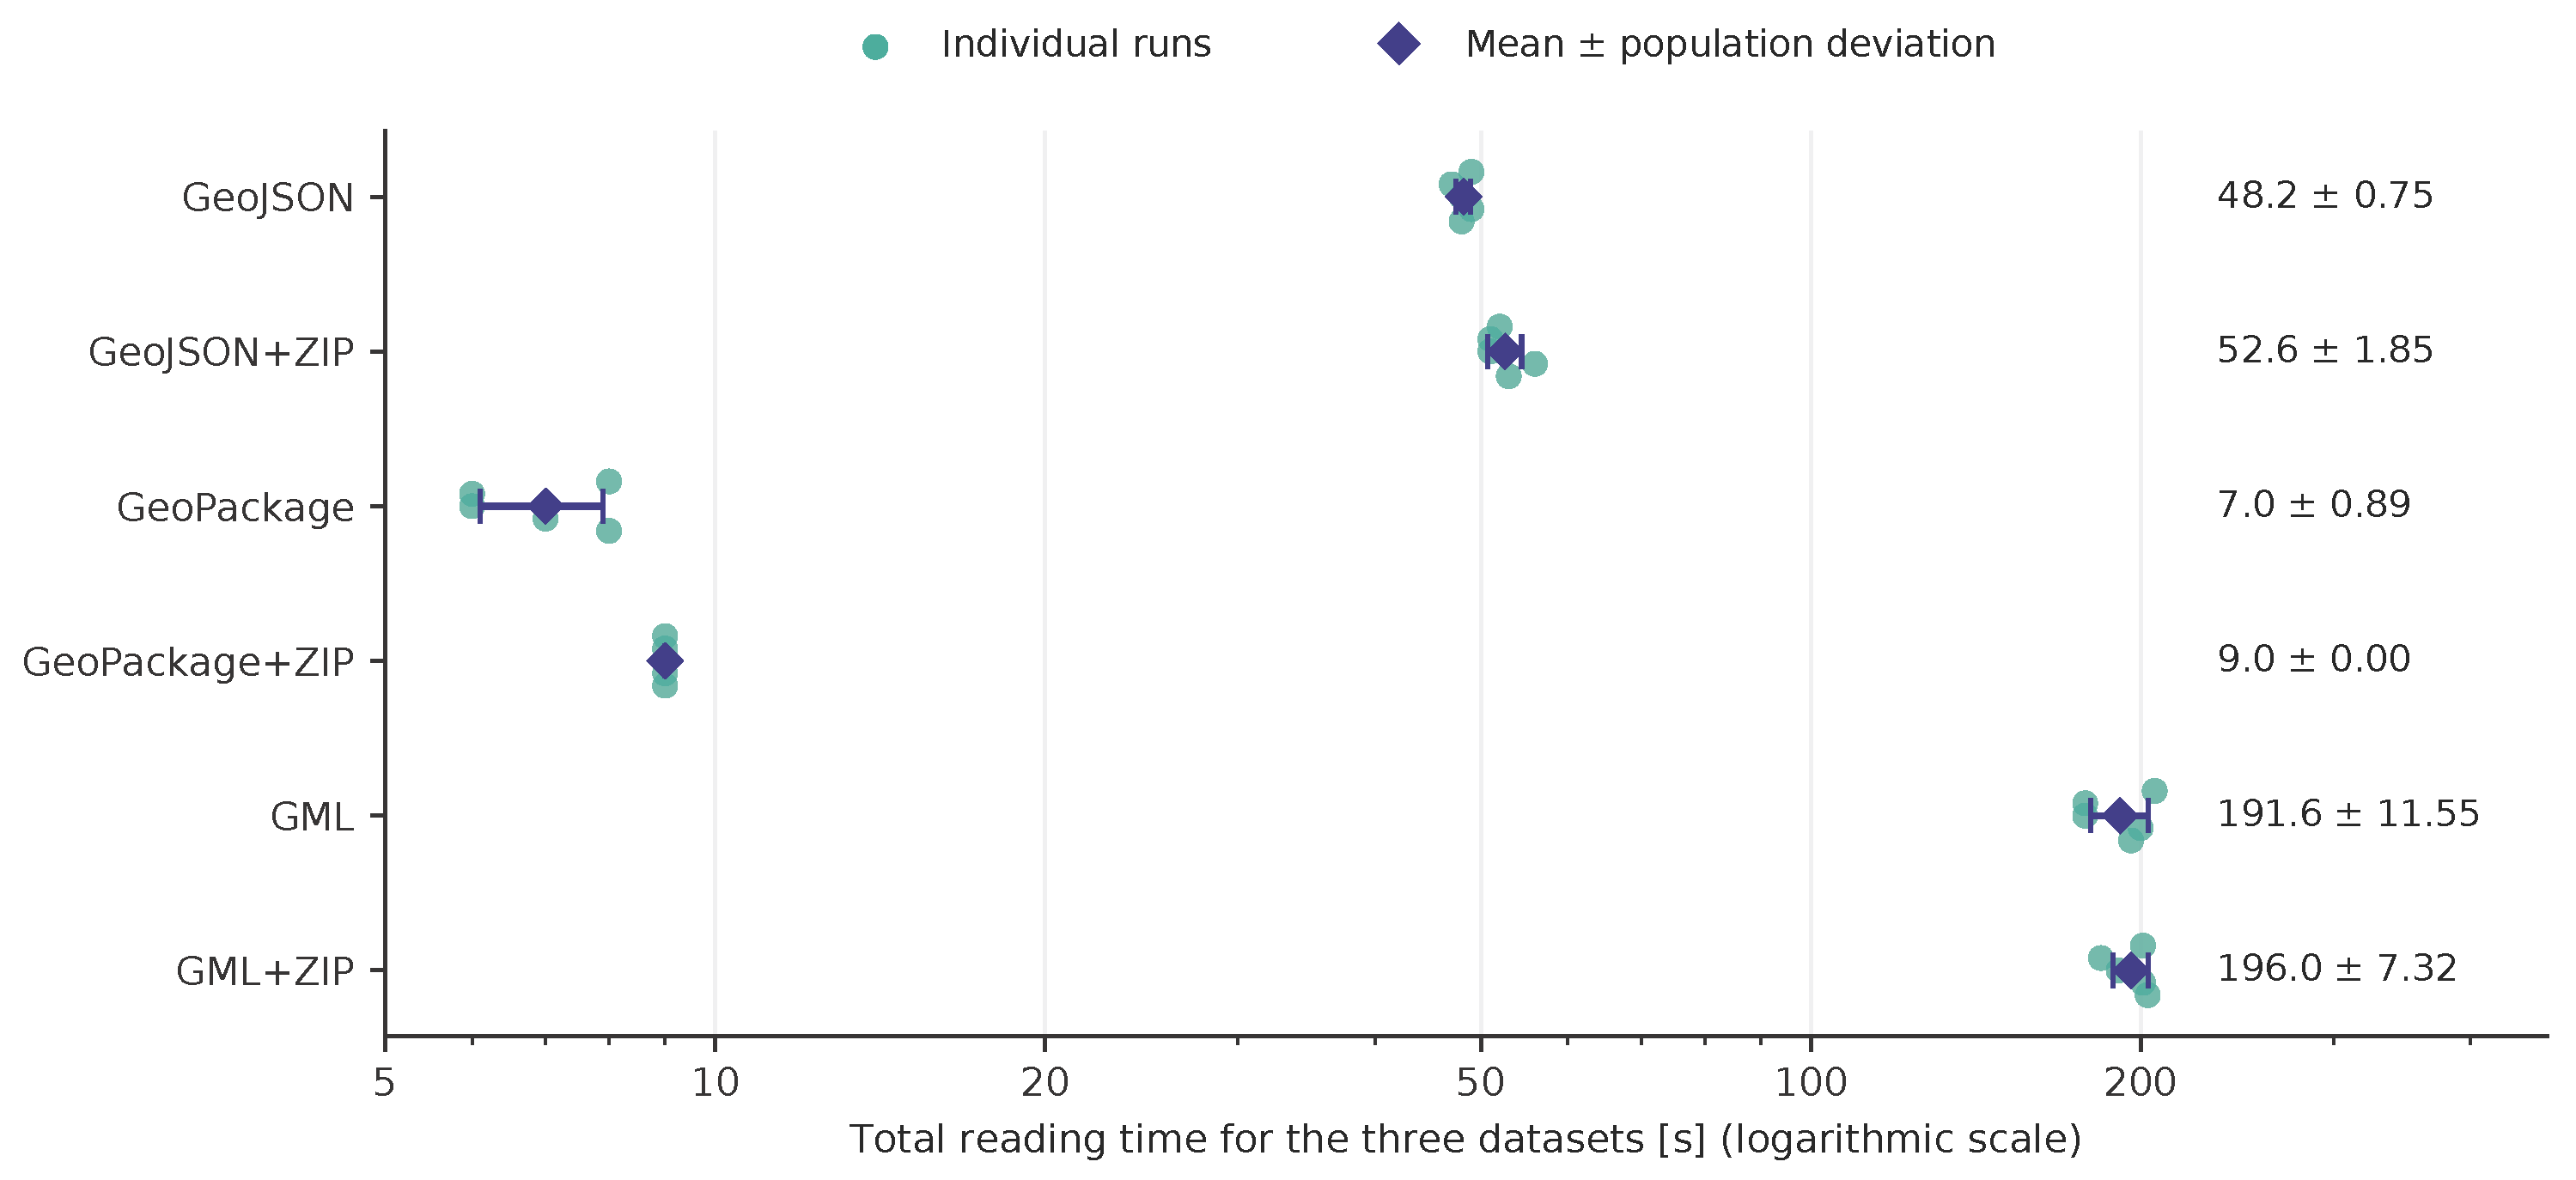
The most detailed data concern local reading in FME (Table 3). Figure 4 shows the individual results from the five series for each format.The total mean time was 7.0 s for GeoPackage, 9.0 s for GeoPackage+ZIP, 48.2 s for GeoJSON, 52.6 s for GeoJSON+ZIP, 191.6 s for GML and 196.0 s for GML+ZIP. The ratio of the GeoJSON time to the GeoPackage time was 6.89, and that of GML to GeoPackage was 27.37. GeoPackage achieved the shortest time in all five series. However, the ranking of GML and GML+ZIP was not consistent: the compressed variant was faster in the first series, whereas the uncompressed variant was faster in the remaining four.
Table 3.
Local reading in FME: sums of the times for the three mines in five series, with descriptive statistics.
Figure 4.
Five series of local reading in FME after summing the times for the three mines. Dots show individual series, the diamond shows the mean and the bar shows the population standard deviation with denominator 5, consistent with Table 3. The vertical offset of the dots serves only to distinguish them.
The difference between 48.2 s for GeoJSON and 7.0 s for GeoPackage should be interpreted as the combined effect of the spatial data representation and its handling by FME. Potential sources of this difference include the organisation of geometry and attribute storage, the volume of data read and the cost of interpreting them in the respective reader implementation. This study was designed to assess performance within the intended CAD–GIS workflow rather than to isolate these contributions. As the components were not measured separately, the results do not establish their individual effects or identify a single mechanism responsible for the observed advantage.
The total times ranged from 6 to 8 s for GeoPackage, from 47 to 49 s for GeoJSON and from 178 to 206 s for GML. The differences between these formats were larger than the spread observed within the five series. At the same time, reporting the times of individual runs in whole seconds limits the interpretation of short operations. The constant value of 9 s for GeoPackage+ZIP does not imply the absence of variability at the sub-second level. The analysis was restricted to descriptive statistics. For local reading in FME, variability was characterised using the five recorded series; for the other operations, only mean values were available, so dispersion and confidence intervals were not calculated. No tests of statistical significance were performed.
3.3. Compression, Network Access and Visualisation
For network reading in FME, GeoPackage+ZIP required 11 s, compared with 36 s for uncompressed GeoPackage; in GDAL, the corresponding times were 18 and 30 s. This comparison does not isolate the effects of the volume of transferred data, file access patterns and archive handling by the tool. A different reading mechanism is a possible explanation, rather than a finding established by the measurements. The available logs do not allow transfer, decompression and data interpretation times to be separated, or establish whether extraction took place in memory or into a temporary file. By contrast, for local reading in FME, each of the three formats required more time in its ZIP-compressed variant than in its uncompressed form.
The effect of ZIP was particularly pronounced for network writing in FME: the GeoJSON time decreased from 991 to 172 s and the GML time from 1060 to 177 s. For GeoPackage, it was 96 s without ZIP and 103 s with ZIP. Compression was therefore not a universal way of speeding up writing, even in the same network environment. The results indicate different balances between the costs of writing, encoding, and transferring data.
The greatest contrast between the GeoPackage variants occurred during ZOOM IN in QGIS. The recorded times were 9 s for the uncompressed file and 388 s for GeoPackage+ZIP; in the relative table, the corresponding values are 1.0 and 45.2. The 388/9 ratio differs from 45.2 because the times in the summary table were rounded. Opening the dataset in QGIS took 18 s for GeoPackage and 32 s for GeoPackage+ZIP, while GeoJSON required 698 s. The data show that the favourable network reading result of the compressed container did not translate into favourable results for all interactive operations.
3.4. File Sizes and Summary of Common Operations
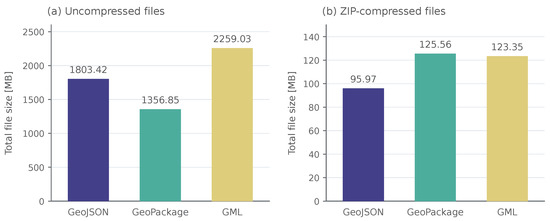
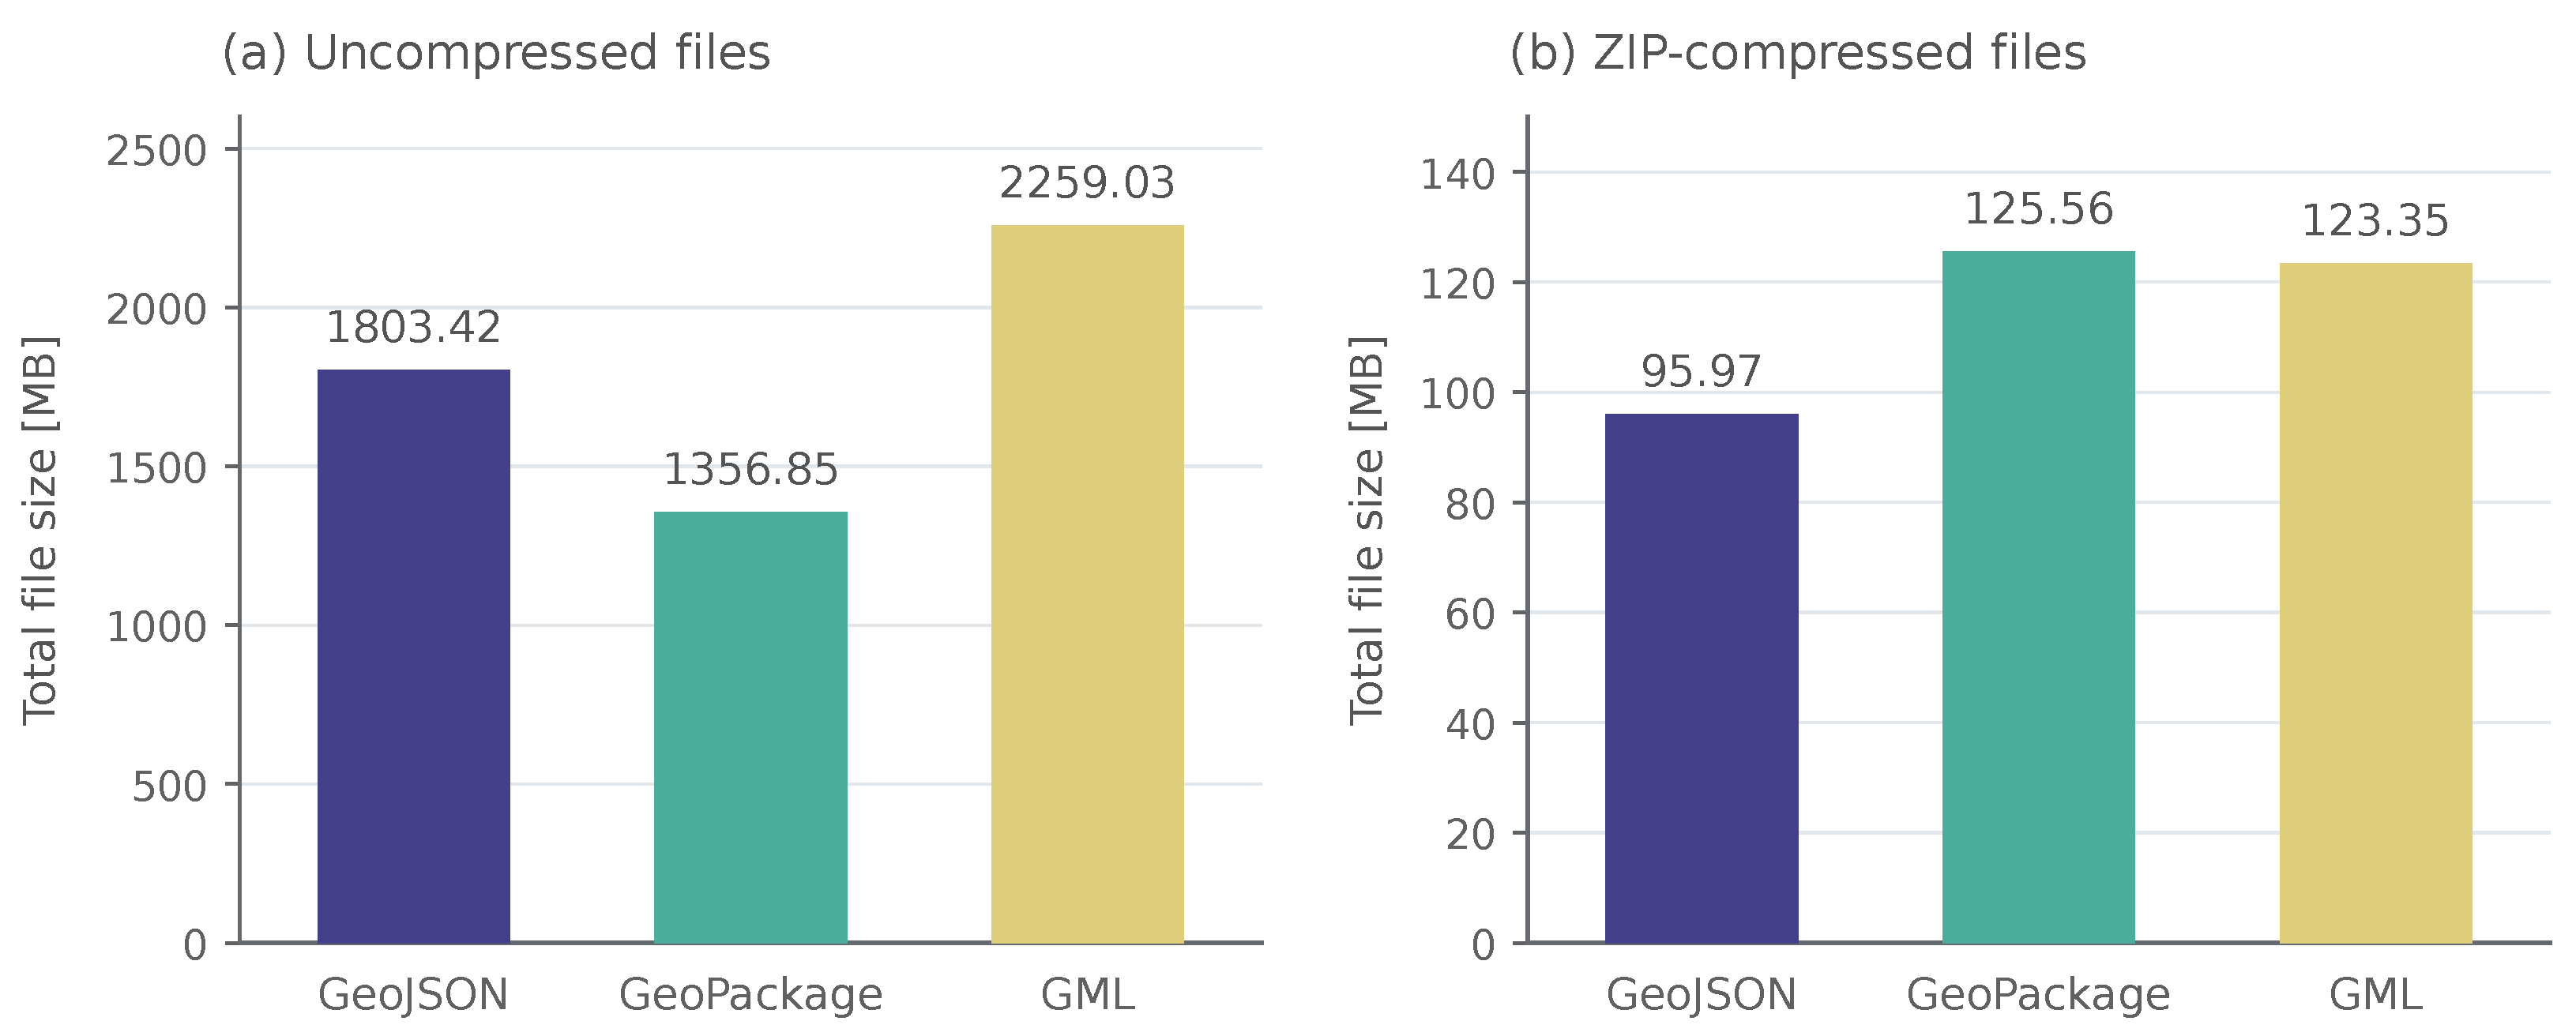
The total size of the uncompressed GeoPackage was 1,356,848,166 B, that of GeoJSON 1,803,420,395 B and that of GML 2,259,031,090 B. GeoPackage was therefore 24.76% smaller than GeoJSON and 39.94% smaller than GML (Table 4). The values were calculated directly from the byte counts.
Table 4.
Dataset sizes and the effect of compression. Calculations based on byte counts; 1 MB = B.
After compression, the ranking changed: GeoJSON+ZIP was the smallest, followed by GML+ZIP and GeoPackage+ZIP. The size reduction was 94.68%, 94.54%, and 90.75%, respectively. For the dataset studied, the more favourable working size of GeoPackage did not therefore imply the smallest archive. The two forms are compared in Figure 5.
Figure 5.
Total file sizes for the three mines: (a) uncompressed; (b) after ZIP compression. The panels have different, explicitly labelled vertical-axis scales; 1 MB = B.
The sum of the nine operations common to all variants, calculated from the rounded table of times, was 260 s for GeoPackage, 646 s for GeoPackage+ZIP, 1003 s for GeoJSON+ZIP, 1174 s for GML+ZIP, 1795 s for GML and 2138 s for GeoJSON. The summary confirms the favourable result of GeoPackage for this notional set of operations. However, it is neither an independent experiment nor a universal performance index. The frequency with which individual operations are performed in practice may differ and the high cost of a single operation may dominate the sum.
4. Discussion
4.1. Working Format, Transport Format and In-Memory Representation
The results support the choice of uncompressed GeoPackage as the working format in the process studied. The same file provided favourable reading, writing, and display times and was smaller than the uncompressed text-based formats. For system integration, it is precisely the ability to use the data in several tools without creating a different output representation each time that matters. The advantage applies to a specific combination of data, drivers, and operations; it does not imply superiority over all existing formats.
A compressed copy can reduce the volume of data transferred over the network, whereas the working format should support efficient reading, writing, and visualisation of spatial data. ZIP compression changes how a dataset is stored but does not replace the spatial data model of the underlying format. A smaller file therefore does not necessarily mean that data become available to the application sooner, because archive handling and interpretation of the stored data structure also matter. In the tests considered, GeoJSON+ZIP produced the smallest archive, but GeoPackage+ZIP provided the shortest network reading time. Minimising the volume of the transferred file and minimising the time needed to use it are therefore not equivalent criteria. A practical proposal arising from the comparison is to store the active working resource and its compressed transport copy separately. However, a possible workflow for downloading, extracting, and continuing work on a local copy would require an additional measurement: such a complete procedure was not tested.
The high compressibility of GML and GeoJSON is consistent with the presence of repetitive elements in text-based encodings. Conversely, the different access times to GeoPackage in FME, GDAL and QGIS suggest that the way reading is implemented matters. The time can be decomposed, for illustrative purposes, into the sum of the costs of file access, extraction, data interpretation, and application operation. The experiment measured their combined result; the delay cannot be quantitatively attributed to any one of these components. In particular, the influence of random access, indexes, and ZIP handling on the ZOOM IN result remains a technical hypothesis that requires separate tests.
SOZip is a potential means of reducing access overhead for compressed datasets, as it supplements a ZIP archive with an index enabling access to independently decompressible chunks of data. Its theoretical advantage over standard ZIP with Deflate compression primarily concerns more efficient random access, rather than a smaller file size [27]. SOZip was not included in the present tests; its effect on reading and interactive visualisation of mine maps therefore requires a separate comparison.
In work on point cloud processing in the same enterprise, the GeoJSON representation was found useful for operations on very large numbers of simple geometries performed without writing intermediate results to disk. This observation concerned a different workload and processing method; no analogous matrix of times was presented for it. It does not contradict the results of the file benchmark. However, it does indicate that the persistent exchange format, the archive format, and the in-memory representation of features need not be identical.
The suitability of the tested variants depended on the operation. GeoPackage+ZIP provided the shortest network reading time, but zooming in on the map in QGIS required 388 s, compared with 9 s for uncompressed GeoPackage. Opening uncompressed GeoJSON in QGIS took 698 s, while network writing in FME required 991 s for GeoJSON and 1060 s for GML. In addition, the tested GDAL configuration did not support writing GeoPackage+ZIP. These examples indicate that format selection for another deployment should account for specific operations and supported variants, rather than only the overall performance ranking.
4.2. Results in the Context of Other Studies
The OGC CDB report [32] includes tests of data organisation, reading and visualisation, whereas Wachs and Tzirita Zacharatou [34] examine data-loading performance across different libraries. The present study complements these works by assessing production mine map data within a CAD–GIS workflow that includes automated ETL processing in FME, GDAL/OGR operations and interactive use in QGIS, with ZIP compression evaluated alongside uncompressed representations. The results indicate that the smallest file does not necessarily provide the fastest access and that the benefits of compression depend on how the data are used. These findings may inform similar deployments, but the observed ranking of formats remains specific to the tested environment.
The contribution of this case study lies in linking the comparison of spatial data structures to the requirements of a specific, real-world CAD–GIS deployment. The same map datasets from three mines were evaluated across eleven operations in FME, GDAL/OGR and QGIS, considering local and network access and compression. Its distinctive feature is therefore the combined assessment of the suitability of data representations at several stages of the workflow and the interpretation of the results in light of deployment experience, rather than the introduction of a new format or a demonstration of its universal superiority.
Table 5 compares the scope of selected studies and a review of newer formats, highlighting differences relevant to interpreting the results of this case study.
Table 5.
Comparison of selected studies on spatial data formats with the present case study.
4.3. Implications for ETL Architecture and Models of Workings
The usefulness of the selected format was further evaluated during the development of the Generic Converter. GeoPackage and the converter reached full production deployment in 2021 [9]. The converter detected changes in source files, created snapshots, extracted attribute data, and published the results. GeoPackage files made it possible to separate access to DGN from further analyses and use libraries independent of the source CAD platform.
However, the use of an efficient format alone was not sufficient to obtain stable execution times for the entire process. In subsequent versions of the converter, problems with concurrent processing, the need for file locking, and unstable performance of the server environment were observed. In the final solution, the role of FME was limited to process management and DGN reading, the remaining tasks were transferred to GDAL/OGR, and some disk operations were reduced.
The most recent research cycle described the processing of 45,478 files with a total volume of about 136 GB, requiring about 246 h of FME Server operation. The Pearson correlation coefficient between the number of features and the conversion time was 0.996. This dataset comprised current and archival data that were used to extend the sample. It is a separate body of material from the 1,179,967 features of the format benchmark. The high correlation indicates a strong linear relationship in the observed sample, but it does not prove a deterministic time bound for all future files. Changes in converter performance cannot be attributed solely to the format either, as the implementation and the organisation of processing were modified at the same time.
Work on 3D modelling shows a further use of the data provided by the converter: they were used to build surface and volumetric models, which corresponds to the later stages of the geomatics workflow beyond data acquisition [42]. Integration of specialist mining software with CAD and GIS is also discussed as a means of supporting three-dimensional geological mapping and visualisation [43]. In LiDAR processing, in turn, the point cloud in LAS was separated from the segment boundaries stored in GeoPackage. This justifies matching the representation with the type of data, in line with reviews that identify 2D-to-3D conversion and data-format compatibility as persistent challenges in mining visualisation [6]. The sidewall benchmark did not examine the full interoperability of solids, meshes, and point clouds; the favourable result of GeoPackage for vector features does not settle how all 3D modelling products should be exchanged.
4.4. Limitations and Conditions for Transferring the Results
The first limitation stems from the nature of the material: the three datasets represent a single organisation, a similar class of features, and a specific method of attribute encoding. The effects of the number of features, geometric complexity, and text field length were not separated. The common schema facilitates comparison between mines but reduces the diversity of workloads. The results should not be transferred, without additional measurements, to rasters, point clouds, complex building models, or other data schemas.
The second limitation concerns the reproducibility of the configuration. The exact driver settings, spatial indexes, transactions, file server parameters, and a description of the area zoomed into in QGIS are not available. The GDAL version used internally by the QGIS installation was also not unambiguously recorded. It cannot be assumed that it was the same installation as the version 3.2 library tested separately. For this reason, the comparison describes user configurations rather than an experiment isolating the effect of the format alone.
The third limitation is the consistency of the data after conversion. Identical feature counts were recorded for all variants, but no full test of the equivalence of geometry and attributes, coordinate precision, or the preservation of identifiers was performed. The GeoJSON specification RFC 7946 requires coordinates to be referenced to WGS 84 [25]. Since neither the GeoJSON variant nor any coordinate transformation was described, the conformance of the files with RFC 7946 cannot be confirmed from the times alone. The distinction between technical conformance and performance is important for the exchange of mining data.
The fourth limitation is the scope of the reported measurements. Five complete series were made available for only one operation; the others were reported as means. Memory usage, processor load, the number of input and output operations and network throughput were not reported. The analysis allows the observed times to be compared but does not unambiguously identify the causes of the differences. Likewise, the lack of support for writing GeoPackage+ZIP relates to the version and procedure used, not to a proven property of all later versions of the library.
Lack of support for an operation must be distinguished from data errors arising during conversion: the reported results do not document loss of geometry or attributes, but neither do they establish full data equivalence after conversion. Transferring the solution to another environment therefore requires both checking support for the necessary operations and validating geometry, attributes, identifiers and the coordinate reference system.
A repetition of this study should therefore cover current versions of the tools, new formats, clearly defined caching scenarios and a separate validation of data correctness. In particular, future comparisons should include GeoParquet and FlatGeobuf, using the same mine map datasets and the same range of reading, writing and visualisation operations, under both local and network access conditions. This would allow the suitability of these spatial data structures to be assessed within the CAD–GIS integration workflow considered, rather than limiting the comparison to file size or a single reading operation. For implementation purposes, it would be particularly useful to weight the operations by the actual frequency with which they are performed. An extension designed in this way would make it possible to move from a historical user-level benchmark to a comparison that supports a current technology decision.
5. Conclusions
This case study supported the selection of uncompressed GeoPackage as the intermediate format in the mine map integration workflow examined. Based on these findings, a decision was made to deploy this format in the system for publishing mine map data within KGHM Polska Miedź S.A. The deployment enabled widespread access to the published data through the free QGIS platform, reducing the need to use the commercial MicroStation CAD platform for this purpose.
The suitability of a spatial data structure should be assessed in relation to its intended use, because reducing dataset size does not necessarily improve access or interactive performance. Working, transport and archival representations should therefore be selected against separate criteria, taking into account the benefits and costs of compression in each application.
Deployment experience indicates that format selection should be combined with appropriate organisation of the ETL process, including detecting changes in source data, handling concurrency and limiting unnecessary disk operations. Processing performance does not replace the validation of geometry, semantics and identifiers or the assessment of the stability of the production environment.
These conclusions apply to the mine map datasets examined and the formats, tools and access conditions compared. They provide a reference point for similar deployments and further comparisons, rather than a universal ranking of spatial data formats.
Author Contributions
Conceptualisation, A.K.; methodology, A.K. and P.K.; software, P.K.; validation, A.K. and P.K.; formal analysis, A.K.; investigation, A.K. and P.K.; resources and data curation, P.K.; writing—original draft preparation, A.K.; writing—review and editing, A.K. and P.K.; visualisation, A.K. and P.K.; supervision, A.K.; project administration, A.K.; funding acquisition, A.K. All authors have read and agreed to the published version of the manuscript.
Funding
This research was funded by the programme “Excellence Initiative—Research University” at AGH University of Krakow, grant number IDUB Action 21 no. 18188.
Institutional Review Board Statement
Not applicable.
Informed Consent Statement
Not applicable.
Data Availability Statement
The timing and file-size results supporting the findings of this study are presented within the article (Table 2, Table 3 and Table 4 and Figure 3, Figure 4 and Figure 5). The source mine workings map data are owned by KGHM Polska Miedź S.A., the employer of one of the authors, and were processed within the company’s IT environment. They contain confidential operational information on the underground infrastructure of an active mining enterprise and are subject to restrictions imposed by the data owner; therefore, they are not publicly available and cannot be shared by the authors.
Acknowledgments
The original version of the manuscript was prepared in Polish. During the preparation of the English-language version, the authors used Perplexity AI with automatic model selection (“Best” mode) to translate selected parts of the text from Polish into English. AI-assisted language editing tools available in Overleaf were also used for selected linguistic corrections and to improve consistency with British English conventions. The authors reviewed and edited all AI-assisted output and take full responsibility for the content of this publication.
Conflicts of Interest
Paweł Kosydor is an employee of KGHM Polska Miedź S.A., the owner of the data used in this study. The company had no role in the analysis or interpretation of the results, in the writing of the manuscript or in the decision to publish. The other author declares no conflicts of interest. The funders had no role in the design of this study; in the collection, analyses, or interpretation of data; in the writing of this manuscript; or in the decision to publish the results.
Abbreviations
The following abbreviations are used in this manuscript:
| CAD | Computer-Aided Design |
| DGN | MicroStation design file format |
| ETL | Extract, Transform, Load |
| FME | Feature Manipulation Engine |
| GDAL/OGR | Geospatial Data Abstraction Library/OGR Simple Features Library |
| GIS | Geographic information system |
| GML | Geography Markup Language |
| GPKG | GeoPackage |
| INSPIRE | Infrastructure for Spatial Information in the European Community |
| JSON | JavaScript Object Notation |
| LAS | LASer file format for point cloud data |
| LiDAR | Light Detection And Ranging |
| OGC | Open Geospatial Consortium |
| QGIS | Quantum GIS (open-source GIS application) |
| SOZip | Seek-optimized ZIP |
| SSD | Solid-state drive |
| XML | Extensible Markup Language |
References
- Krawczyk, A. Mining Geomatics. ISPRS Int. J. Geo-Inf. 2023, 12, 278. [Google Scholar] [CrossRef] [Scilit]
- Choi, Y.; Baek, J.; Park, S. Review of GIS-based applications for mining: Planning, operation, and environmental management. Appl. Sci. 2020, 10, 2266. [Google Scholar] [CrossRef] [Scilit]
- Liang, R.; Huang, C.; Zhang, C.; Li, B.; Saydam, S.; Canbulat, I. Exploring the Fusion Potentials of Data Visualization and Data Analytics in the Process of Mining Digitalization. IEEE Access 2023, 11, 40608–40628. [Google Scholar] [CrossRef] [Scilit]
- Wang, G.; Ren, H.; Zhao, G.; Zhang, D.; Wen, Z.; Meng, L.; Gong, S. Research and practice of intelligent coal mine technology systems in China. Int. J. Coal Sci. Technol. 2022, 9, 24. [Google Scholar] [CrossRef] [Scilit]
- Krawczyk, A. A concept for the modernization of underground mining master maps based on the enrichment of data definitions and spatial database technology. E3S Web Conf. 2018, 26, 00010. [Google Scholar] [CrossRef] [Scilit]
- Liang, R.; Zhang, C.; Li, B.; Saydam, S.; Canbulat, I. Evolution of visualisation and digital twin technologies in mining. Int. J. Coal Sci. Technol. 2026, 13, 53. [Google Scholar] [CrossRef] [Scilit]
- Gaffney, K.P.; Prammer, M.; Brasfield, L.; Hipp, D.R.; Kennedy, D.; Patel, J.M. SQLite: Past, Present, and Future. Proc. VLDB Endow. 2022, 15, 3535–3547. [Google Scholar] [CrossRef] [Scilit]
- Kosydor, P.; Warchala, E.; Krawczyk, A.; Piórkowski, A. Determinants of large-scale spatial data processing in Polish mining. AIP Conf. Proc. 2020, 2209, 040007. [Google Scholar] [CrossRef] [Scilit]
- Kosydor, P. Management of Very Large Spatial Datasets in a Mining Enterprise (Original Title: Zarządzanie Bardzo Dużymi Zbiorami Danych Przestrzennych w Przedsiębiorstwie Górniczym). Doctoral Dissertation, Akademia Górniczo-Hutnicza im. Stanisława Staszica w Krakowie, Kraków, Poland, 2023. (In Polish) [Google Scholar]
- Cowen, D.J. GIS versus CAD versus DBMS: What Are the Differences? In Introductory Readings in Geographic Information Systems; Peuquet, D.J., Marble, D.F., Eds.; Taylor & Francis: London, UK, 1990; pp. 52–61. [Google Scholar]
- Mao, S. Development of coal geological information technologies in China. Int. J. Coal Sci. Technol. 2020, 7, 320–328. [Google Scholar] [CrossRef] [Scilit]
- Isikdag, U.; Zlatanova, S. Towards Defining a Framework for Automatic Generation of Buildings in CityGML Using Building Information Models. In 3D Geo-Information Sciences; Lecture Notes in Geoinformation and Cartography; Lee, J., Zlatanova, S., Eds.; Springer: Berlin/Heidelberg, Germany, 2009; pp. 79–96. [Google Scholar] [CrossRef] [Scilit]
- Breunig, M.; Zlatanova, S. 3D geo-database research: Retrospective and future directions. Comput. Geosci. 2011, 37, 791–803. [Google Scholar] [CrossRef] [Scilit]
- Xie, Q.; Wei, B.; Zhang, K.; Wang, Z. Format conversion between CAD data and GIS data based on ArcGIS. In Proceedings of the International Conference on Intelligent Earth Observing and Applications 2015; SPIE: Bellingham, WA, USA, 2015; Volume 9808, pp. 355–363. [Google Scholar] [CrossRef] [Scilit]
- Ye, H.; Li, Y.; Wang, C.; Li, L. A new data integration approach for AutoCAD and GIS. In Proceedings of the Geoinformatics 2006: GNSS and Integrated Geospatial Applications; Li, D., Xia, L., Eds.; SPIE: Bellingham, WA, USA, 2006; Volume 6418, p. 641808. [Google Scholar] [CrossRef] [Scilit]
- Chen, D.; Doumeingts, G.; Vernadat, F. Architectures for enterprise integration and interoperability: Past, present and future. Comput. Ind. 2008, 59, 647–659. [Google Scholar] [CrossRef] [Scilit]
- Hohpe, G.; Woolf, B. Enterprise Integration Patterns: Designing, Building, and Deploying Messaging Solutions; Addison-Wesley: Boston, MA, USA, 2003. [Google Scholar]
- Wu, Q.; Xu, H. Three-dimensional geological modeling and its application in digital mine. Sci. China Earth Sci. 2014, 57, 491–502. [Google Scholar] [CrossRef] [Scilit]
- Bishr, Y. Overcoming the semantic and other barriers to GIS interoperability. Int. J. Geogr. Inf. Sci. 1998, 12, 299–314. [Google Scholar] [CrossRef] [Scilit]
- Harvey, F.; Kuhn, W.; Pundt, H.; Bishr, Y.; Riedemann, C. Semantic interoperability: A central issue for sharing geographic information. Ann. Reg. Sci. 1999, 33, 213–232. [Google Scholar] [CrossRef] [Scilit]
- Chwedczuk, K.; Cienkosz, D.; Apollo, M.; Borowski, L.; Lewinska, P.; Santos, C.A.G.; Eborka, K.; Kulshreshtha, S.; Romero-Andrade, R.; Sedeek, A.; et al. Challenges Related to the Determination of Altitudes of Mountain Peaks Presented on Cartographic Sources. Geod. Vestn. 2022, 66, 49–59. [Google Scholar] [CrossRef] [Scilit]
- Noardo, F. Multisource spatial data integration for use cases applications. Trans. GIS 2022, 26, 2874–2913. [Google Scholar] [CrossRef] [Scilit]
- Global Mining Guidelines Group. Interoperability Definition and Guiding Principles for the Mining Industry. Technical Report, Global Mining Guidelines Group, Montreal, QC, Canada. 2021. Available online: https://gmggroup.org/wp-content/uploads/2024/01/2021-08-27-Interoperability-Definition-and-Principles-Report.pdf (accessed on 13 October 2026).
- Open Geospatial Consortium. OpenGIS Geography Markup Language (GML) Encoding Standard, Version 3.2.1. OGC Implementation Standard OGC 07-036, Open Geospatial Consortium, 2007. Equivalent to ISO 19136:2007. Available online: https://portal.ogc.org/files/?artifact_id=20509 (accessed on 13 October 2026).
- Butler, H.; Daly, M.; Doyle, A.; Gillies, S.; Hagen, S.; Schaub, T. The GeoJSON Format. Request for Comments RFC 7946; Internet Engineering Task Force (IETF): Wilmington, DE, USA, 2016. [Google Scholar] [CrossRef] [Scilit]
- Open Geospatial Consortium. OGC GeoPackage Encoding Standard, Version 1.4. OGC Implementation Standard OGC 12-128r19, Open Geospatial Consortium, 2024. Available online: https://www.geopackage.org/spec140/ (accessed on 13 October 2026).
- GDAL/OG. GDAL Virtual File Systems (/vsizip/, /vsicurl/ and Others). 2024. Available online: https://gdal.org/en/stable/user/virtual_file_systems.html (accessed on 4 October 2026).
- Sveen, A.F. Efficient storage of heterogeneous geospatial data in spatial databases. J. Big Data 2019, 6, 102. [Google Scholar] [CrossRef] [Scilit]
- Bartoszewski, D.; Piorkowski, A.; Lupa, M. The Comparison of Processing Efficiency of Spatial Data for PostGIS and MongoDB Databases. In Beyond Databases, Architectures and Structures. Paving the Road to Smart Data Processing and Analysis; Springer International Publishing: Cham, Switzerland, 2019; pp. 291–302. [Google Scholar] [CrossRef] [Scilit]
- Cheng, Y.; Zhou, K.; Wang, J.; De Maeyer, P.; Van de Voorde, T.; Yan, J.; Cui, S. A Comprehensive Study of Geochemical Data Storage Performance Based on Different Management Methods. Remote Sens. 2021, 13, 3208. [Google Scholar] [CrossRef] [Scilit]
- Zhang, S.; Li, M.; Chen, Z.; Huang, T.; Li, S.; Li, W.; Chen, Y. Parallel Spatial-Data Conversion Engine: Enabling Fast Sharing of Massive Geospatial Data. Symmetry 2020, 12, 501. [Google Scholar] [CrossRef] [Scilit]
- Open Geospatial Consortium. OGC CDB Vector Data in GeoPackage Interoperability Experiment; Open Geospatial Consortium: Arlington, VA, USA, 2019; Available online: https://docs.ogc.org/per/19-007.html (accessed on 13 October 2026).
- Mooney, P.; Minghini, M. Geospatial data exchange using binary data serialization approaches. Int. Arch. Photogramm. Remote Sens. Spat. Inf. Sci. 2022, XLVIII-4/W1-2022, 307–313. [Google Scholar] [CrossRef] [Scilit]
- Wachs, A.; Tzirita Zacharatou, E. Analysis of Geospatial Data Loading. In Proceedings of the Tenth International Workshop on 616 Testing Database Systems. ACM, 2024, SIGMOD/PODS ’24; Association for Computing Machinery: New York, NY, USA, 2024; pp. 36–42. [Google Scholar] [CrossRef] [Scilit]
- Rashidan, M.H.; Musliman, I.A.; Rahman, A.A. Geopackage data format for collaborative mapping of geospatial data in limited network environments. Int. Arch. Photogramm. Remote Sens. Spat. Inf. Sci. 2016, XLII-4/W1, 15–21. [Google Scholar] [CrossRef] [Scilit]
- Khandelwal, A.; Rajan, K.S. GMZ: A GML Compression Model for WebGIS. ISPRS Ann. Photogramm. Remote Sens. Spat. Inf. Sci. 2017, IV-2/W4, 9–13. [Google Scholar] [CrossRef] [Scilit]
- Wei, Q.; Guan, J.; Zhou, S.; Wang, X. A New and Effective Approach to GML Documents Compression. Comput. J. 2014, 57, 1723–1740. [Google Scholar] [CrossRef] [Scilit]
- Ledoux, H.; Arroyo Ohori, K.; Kumar, K.; Dukai, B.; Labetski, A.; Vitalis, S. CityJSON: A compact and easy-to-use encoding of the CityGML data model. Open Geospat. Data Softw. Stand. 2019, 4, 4. [Google Scholar] [CrossRef] [Scilit]
- GeoParque. GeoParquet Specification, Version 1.1.0. 2024. Available online: https://geoparquet.org/releases/v1.1.0/ (accessed on 4 October 2026).
- Mete, M.O. Geospatial Big Data Analytics for Sustainable Smart Cities. Int. Arch. Photogramm. Remote Sens. Spat. Inf. Sci. 2023, XLVIII-4/W7-2023, 141–146. [Google Scholar] [CrossRef] [Scilit]
- Cichociński, P. W poszukiwaniu optymalnego formatu danych dla trójwymiarowych modeli miast. Rocz. Geomatyki 2025, XXIII, 7–16. (In Polish) [Google Scholar]
- Estacio, I.; Lim, C.; Onitsuka, K.; Hoshino, S. Predicting the future through observations of the past: Concretizing the role of Geosimulation for holistic geospatial knowledge. Geomatica 2024, 76, 100012. [Google Scholar] [CrossRef] [Scilit]
- Saganiak, K.; Buketov, V. Integrating mining software, CAD, and GIS technologies for enhanced 3D geological mapping and visualization. E3S Web Conf. 2024, 567, 01021. [Google Scholar] [CrossRef] [Scilit]

Disclaimer/Publisher’s Note: The statements, opinions and data contained in all publications are solely those of the individual author(s) and contributor(s) and not of MDPI and/or the editor(s). MDPI and/or the editor(s) disclaim responsibility for any injury to people or property resulting from any ideas, methods, instructions or products referred to in the content. |
© 2026 by the authors. Licensee MDPI, Basel, Switzerland. This article is an open access article distributed under the terms and conditions of the Creative Commons Attribution (CC BY) license.