


Abstract
Sign language production (SLP) plays a significant role in facilitating communication with the deaf community. Significant advancements have been made in modeling the manual aspects of sign language (SL), while non-manual features like facial expressions, particularly through the explicit representation of facial action units (FAUs), remain insufficiently explored. We therefore propose SignFAU, an SLP framework that integrates the 18 FAUs directly into pose representation, together with the body, hand, and facial landmarks. We also introduce PHOENIX14T-FAU, an extension of the PHOENIX14T dataset including FAUs extracted from each video frame, and an improved Sign-VQ model that exploits this richer representation. In a controlled comparison, using the same training configurations and three random seeds, between two versions of the improved Sign-VQ model, one with FAUs and one without, the results show that adding the FAUs raised the BLEU-4 test score from 8.37 to 10.91 when each model was evaluated by the sign language transformer (SLT) evaluator trained on its own dataset. When both models were evaluated by the same landmarks-only SLT evaluator, the gains in BLEU-1 (26.95 to 28.60) and ROUGE (28.13 to 29.32) were statistically significant, whereas the BLEU-4 gain (8.37 to 8.85) was not. Under this evaluator, SignFAU also outperformed the state-of-the-art SLP models, i.e., Sign-VQ baseline and Progressive Transformer, achieving a BLEU-4 score of 8.85 versus 4.11 and 6.76, respectively.
1. Introduction
Sign languages (SLs) serve as the main means of communication for deaf and hard-of-hearing communities [1]; they empower people to communicate effectively, express thoughts and emotions, improve learning and access to information, and enhance social integration.
Like spoken languages, SLs have their own grammar, including syntax rules and they can be defined as visual languages that use manual (hand and body posture) and non-manual (mouthing and facial expressions) motions, postures and positions to deliver meaning [2,3].
The World Health Organization reports that over 5% of the world’s population live with disabling hearing loss, i.e., around 430 million people. By 2050, this number is expected to increase to 700 million people [4]. There is, therefore, an urgent need to develop effective communication solutions to improve social inclusion for deaf and hard of hearing people in various domains such as education and employment, and in society overall.
Various automated systems have been proposed to bridge the gap between spoken and sign languages. For example, Camgoz et al. [5] proposed the first end-to-end framework for translating SL into spoken language using an attention-based encoder–decoder architecture. For the Sign2Text task, this framework achieved a BLEU-4 score of 9.58 on the PHOENIX14T dataset [5].
An improvement was introduced in [6] with a transformer-based approach in an end-to-end manner, raising the BLEU-4 score to 20.17 on the same dataset and task. Similar improvements were proposed in [7,8,9] to enhance recognition and translation accuracy. Although these studies achieved promising results, they mostly focus on translating SL into spoken language and ignore the reverse operation, i.e., translating spoken language into SL. This process is known as sign language production (SLP) [10].
SLP is essential as it helps deaf and hard-of-hearing individuals to receive information in their native visual language. This is especially important since learning how to read a spoken language is challenging for many deaf and hard-of-hearing students. In the United States, it was found that by the end of high school, deaf and hard-of-hearing students had a median reading comprehension level equivalent to that of a fourth-grader [11].
SLP remains challenging as non-manual movements and expressions are complex, and the resulting poses must be realistic and meaningful [3]. Many SLP approaches have been developed to address such challenges. For example, to simplify SL generation, some studies [12,13,14,15,16,17,18,19] use glosses rather than natural text as model inputs. However, this approach requires considerable time and effort to annotate the glosses, and the resulting gloss-based representation oversimplifies some linguistic complexities and loses important information essential for accurate interpretation [20]. Moreover, many SLP approaches [12,13,14,15,16,17,21,22,23,24,25,26] consider only manual features like hands and body and exclude non-manual features, such as facial landmarks and expressions. This may lead to the loss of important information [27], resulting in the generation of ambiguous or less expressive signs.
To improve SLP accuracy, some studies [2,3,10,18,19,27,28,29,30,31,32,33,34] have integrate non-manual features, i.e., facial landmark features, facial expressions and mouthing, along with the manual features. However, many types of non-manual features remain insufficiently explored, and combining them into SLP models could potentially improve both accuracy and quality. Among such non-manual features that might be incorporated are facial action units (FAUs), which represent facial muscle movements and are already known to be important in several fields such as pain detection [35], mental health [36,37], and deepfake detection [38], due to their ability to represent the subtle movements of facial muscles. FAUs were first introduced in the Facial Action Coding System (FACS) [39] to quantify facial movements based on muscular activity, without relying on the emotional interpretation of expressions.
To the best of our knowledge, only a few works have used FAUs in SLP, notably [34,40]. Neither study, however, integrated FAUs into a learned pose representation; instead, both treated them as a predictive target. Specifically, Viegas et al. [40] used FAUs as an additional output alongside facial landmark features, and performance decreased when the non-manual features, including the FAUs, were added (i.e., from 8.19 to 5.76 for BLEU-4). This may be because FAUs were used during training as additional regression targets rather than to learn a pose representation, hence increasing task complexity without providing useful linguistic information to the model. Kanakanti et al. [34] used FAUs only as an auxiliary prediction task, not to construct or represent the generated poses.
We propose a new SLP framework, SignFAU, that embeds continuous FAU intensities into the pose representation to strengthen the model’s capacity to interpret non-manual signs and to improve the quality of sign generation. To achieve our aim, we adopt and enhance the data-driven vector quantization (VQ) approach proposed in [33], which represents continuous sign poses as discrete motion tokens. In particular, we adapt the capacity of the baseline translation model described in [33] by increasing the number of transformer layers, attention heads, embedding and hidden dimensions, and the feedforward dimension, and by changing the learning-rate scheduler. In addition, for our pose codebook model, we use the configuration provided in the official GitHub repository [41] rather than the one in the original paper [33].
All configuration choices were made on the development split, keeping the test split for the final evaluation to avoid test-split leakage and obtain an unbiased estimate of generalization.
Our framework extracts 18 FAUs and integrates them with the body, hands, and facial landmarks of the preprocessed PHOENIX14T dataset [42] to form a unified input representation. This integration allows the model to utilize both manual and non-manual cues in conjunction with the subtle facial movements that have typically been overlooked in previous SLP studies. To separate the effect of FAUs from the improvements we made to the Sign-VQ model, we performed a controlled comparison between two versions of our improved Sign-VQ model: one with FAUs and one without FAUs (called the landmarks-only control model). Both versions used the same configurations; the only difference was whether they integrated FAUs into the pose representation. We replicated the experiments with three random seeds, and the results show that adding FAUs increased the BLEU-4 test score from 8.37 to 10.91 (+30.4%) when each model was evaluated using the sign language transformer (SLT) evaluator trained on its own dataset. When both models were evaluated by the same landmarks-only SLT evaluator, the improvement in BLEU-4 on the test split was not statistically significant (from 8.37 to 8.85), unlike the improvements in BLEU-1 (from 26.95 to 28.60) and ROUGE (from 28.13 to 29.32).
The contributions of this paper can be summarized as follows:
- We propose SignFAU, a novel SLP framework that integrates the continuous values of 18 FAUs directly into the pose representation alongside body, hand, and facial landmarks. Unlike previous works [34,40], which predict FAUs as an additional output or auxiliary task, our framework uses FAUs as part of the pose representation. This integration enables the model to use the linguistic and semantic information conveyed by facial movements to improve SLP accuracy. Our framework builds on Sign-VQ [33].
- We construct PHOENIX14T-FAU, an extension of the landmarks-only PHOENIX14T [42] dataset, by integrating FAUs with each video frame, with interpolation of missing detections, temporal smoothing, and scale matching to the landmarks, providing a richer representation of non-manual features.
- We conducted extensive experiments to evaluate the contributions of FAU integration and the improvements made to the Sign-VQ model to the overall SignFAU framework performance. These experiments included a controlled comparison between the improved Sign-VQ and the landmarks-only control to evaluate FAU integration into pose representation, an analysis of whether FAUs can replace facial landmarks or only complement them, a comparison of different configurations for both the pose codebook and translation models to determine the best-performing setup, an evaluation of the generated face quality, and a comparison of our framework with existing approaches. The results show that FAUs increased the test BLEU-4 score from 8.37 to 10.91 when each model was evaluated using its own SLT evaluator. SignFAU also outperformed the Sign-VQ baseline [33] and the Progressive Transformer [24], achieving a BLEU-4 score of 8.85 versus 4.11 and 6.76, respectively, when all the models were evaluated using the same landmarks-only SLT evaluator.
2. Related Work
This section considers existing work in two parts: studies that relied solely on manual and body features without facial features and expressions versus studies that combined manual and non-manual features to achieve a more comprehensive representation of SL gestures. This division facilitates comparison of the impact of including non-manual features on improving SLP quality, thus clarifying the research gap that this work addresses.
2.1. SLP Using Manual and Body Features Only
2.1.1. Text-Based Approaches
Stoll et al. [22] proposed the first textual deep learning-based SLP approach, called Text2Sign, for translating spoken language text into continuous SL videos, in which generative adversarial network (GAN), neural machine translation (NMT), and motion generation techniques are combined to overcome the limitations of traditional avatar-based methods (which produce unnatural and poorly expressive SL). Texts are used as input to a text-to-gloss (T2G) NMT network which outputs gloss sequences. A gloss-to-pose (G2P) generator, based on a motion graph (MG), then generates 2D pose sequences. A GAN model receives the generated pose sequences and produces photo-realistic SL videos. On the PHOENIX14T’s test dataset, Text2Sign achieved a BLEU-4 score of 15.26 for the NMT-based T2G translator and delivered highly realistic images with mean structural similarity index measure (SSIM) values near 1 for multi-signer generation. Natarajan et al. [23] presented H-DNA, a multi-tasking end-to-end framework, to support real-time sign language recognition (SLR), sign language translation (SLT), and SLP. For SLR and text generation, the H-DNA system uses the MediaPipe library to extract posture details and a hybrid convolutional neural network and bidirectional long short-term memory (CNN-Bi-LSTM) to process spatio-temporal information from SL videos. For video generation, it uses NMT-MediaPipe-DynamicGAN models to generate high-quality, photorealistic sign-gesture videos. Across various multilingual datasets, i.e., PHOENIX14T, ISL-CSLTR, and How2Sign, the system achieved an average BLEU score of 38.06, an average SSIM of 0.921, and over 95% correct sign classification. Although both [22] and [23] achieved high BLEU scores they described only the T2G stage, which tackles a relatively simpler task than producing the final poses or gestures. Therefore, high BLEU scores do not necessarily reflect the overall system quality in producing SL.
Conversely, other studies have focused on producing pose sequences directly from textual expressions. This allows a more direct and comprehensive assessment of the model’s ability to generate gesture sequences. Ref. [24], proposed a novel end-to-end text-to-pose (T2P) approach, Progressive Transformers, to directly convert spoken language sentences into continuous 3D sign postures instead of following T2G with G2P. This is done using a novel counter-decoding technique that allows continuous, variable-length sign pose sequences to be generated without an explicit end-of-sequence token. For a fair evaluation, the authors compared the model under two configurations: one that converts text to gloss and then to poses (T2G2P), and another that converts text directly to poses (T2P). On the PHOENIX14T dataset, the T2P configuration performed better than the T2G2P configuration (BLEU-4 scores of 10.51 and 9.68 for T2P and T2G2P, respectively). Similarly, in [26] a SignNet model was introduced to directly generate SL from text input using a metric embedding learning mechanism. This mechanism aims to preserve metric relationships between sign representations and to ensure that the generated poses are as close as possible to ground-truth signs while remaining distinct from other signs, thereby enhancing generation accuracy and sign discrimination. The experimental results showed that on the PHOENIX14T dataset SignNet improved on the Progressive Transformer in G2P translation, raising the BLEU-1 score from 31 to 39 and the BLEU-4 score from 10.43 to 11.84.
For more accurate and natural gesture generation, SLP research has recently shifted toward using large language models (LLMs). For example, Fang et al. [25] proposed SignLLM, a multilingual SLP model with a novel dual-mode architecture: the multi-language switching framework (MLSF) mode, in which SL can be generated from query text, and Prompt2LangGloss mode, which generates from a question-style prompt. To evaluate SignLLM’s performance, the authors built a comprehensive multilingual SL dataset, named PROMPT2SIGN, by combining eight public datasets representing eight different languages. While each language was considered separately, achieving BLEU-4 scores of 15.03 for American Sign Language (ASL) and 23.25 for German Sign Language (GSL), the results represent separate performances and do not allow an assessment of the accuracy on the combined multilingual dataset.
Although these approaches offer rich representation, they make the task more complex, and they make it more difficult to capture the structure and semantics of input sentences and, hence, to generate a correct and coherent sequence of corresponding SL movements.
2.1.2. Gloss-Based Approaches
To overcome the challenges associated with text-based approaches, some studies have used glosses as direct input to models. This is because glosses provide a simpler and more structured representation that is easier to process computationally.
In [12], a G2P discrete diffusion model (DDM) framework was proposed to generate sign poses from gloss sequences iteratively and non-autoregressively. First, each sign skeleton is segmented into three patches (i.e., body, right hand, and left hand), which are then quantized using three different codebooks to enhance the reconstruction quality. Such pose tokens are iteratively refined by employing a DDM with a mask-and-replace strategy.
Finally, a fully transformer-based network captures the spatial–temporal relationships, and a sequential kNN method predicts the length of the pose sequence needed for each gloss. On the PHOENIX14T dataset, G2P-DDM demonstrated significant improvements over NAT-EA, boosting the BLEU-4 score from 6.66 to 7.50. Another gloss-based framework was proposed in [15], called GEN-OBT, which uses a transformer to generate poses while preserving semantic information. A learnable token in the gloss encoder captures the overall context of the input sequence and guides the autoregressive decoder as it predicts each pose in turn. A CTC-based reverse gloss decoder reverts the predicted poses to glosses during training, and it encourages semantic consistency with the original glosses via mean absolute error (MAE), connectionist temporal classification (CTC), and DTW losses. On the PHOENIX14T test split, GEN-OBT achieved BLEU-4 and DTW-P scores of 8.01 and 10.07, respectively. However, its reliance on gloss annotations limits scalability, and the direct regression of continuous pose sequences can produce overly smooth and under-articulated poses.
A different prescriptive approach to solving the SLP problem using diffusion modeling was introduced by Tang et al. [17], called Sign-IDD. It improves skeletal accuracy by modeling relationships between joints rather than relying only on absolute coordinates. The iconicity disentanglement (ID) module of the proposed approach encodes each pose in the form of a 4D bone, which describes the directional relationships and lengths between adjacent joints. The attribute controllable diffusion module uses these bone attributes along with gloss embeddings as guidance information for pose generation from Gaussian noise while preserving joint and bone losses. Sign-IDD achieved a BLEU-4 score of 9.08, which was 1.58 higher than that achieved by G2P-DDM. However, since the constraints of 4D bones are calculated based on the same joint estimates used for control, minor errors, especially at the fingers, can mislead the diffusion process, reducing hand-generation accuracy. Furthermore, Shen et al. [16] proposed Sign-MExD, a G2P diffusion model which uses a sparse mixture-of-experts (MoE) mechanism to reduce computational cost. A CLIP-based encoder represents the glosses, and cross-attention uses this representation to guide pose generation. Then, an expert-choice routing directs each pose token to an expert submodel suited to its linguistic and motion complexity. Joint and bone losses help to maintain accurate joint positions and bone orientations. Sign-MExD achieved BLEU-4 scores of 4.96 on PHOENIX14T and 6.65 on How2Sign. However, the model does not directly account for pose transitions, and thus it may result in less natural and less smooth motions.
The above studies share a common limitation: they rely exclusively on manual and body features, ignoring the facial landmarks essential to natural, accurate SL gestures.
2.2. SLP Using Manual and Non-Manual Features
Several SLP studies have combined manual features with non-manual features such as facial landmarks, facial expressions, and head movements. In broad terms, integrating complementary information sources has proven beneficial in related vision–language tasks, such as fusing region-specific features with global features [43] or jointly training image enhancement with caption generation [44]. Similarly, non-manual features add facial information to the manual features that describe body and hand movements. In this section, the studies are grouped according to how they represent non-manual information: through facial landmarks, emotion information, or FAUs. Unless otherwise specified, the term “non-manual” refers to facial landmarks.
2.2.1. Facial Landmark-Based Approaches
Hwang et al. [28] proposed NSLP-G, a non-autoregressive two-stage approach that generates variable-length pose sequences from text or gloss inputs, using manual features and facial landmarks. A variational autoencoder (VAE) is used to encode poses in a Gaussian pose space, and a transformer network is used to predict pose distributions. On the PHOENIX14T dataset, the achieved BLEU-4 score for the G2P task was 9.39, and for the T2P task it was 11.07.
Saunders et al. [29] extended the Progressive Transformer with a CNN-based conditional discriminator that distinguishes generated sign pose sequences from ground-truth sequences, conditioned on the source text or gloss sequence. They also incorporated non-manual features through 2D facial landmarks extracted using OpenPose, representing head movements, eyebrow motion, and mouthing patterns. On PHOENIX14T, their manual-only G2P model achieved a BLEU-4 score of 11.70, compared with 10.43 for the regression-based baseline. Combining manual and non-manual features increased the G2P score to 12.16, while generating non-manual features alone achieved 7.12. For direct T2P, the model achieved a BLEU-4 score of 10.81.
Saunders et al. [32] improved upon the method proposed in [29] in three ways: the 3D multi-channel continuous model was made fully end-to-end, the decoding process was modified to handle shorter, variable-length predictions with counter decoding, and, finally, future prediction, noise injection, mixture density networks (MDNs), and adversarial learning were used to reduce prediction lag and under-articulation. The MDN and adversarial approaches achieved BLEU-4 scores of 11.94 and 12.76 for G2P on PHOENIX14T. For T2P, direct prediction scored 11.68, while T2G2P attained 13.64. Autoregressive decoding, however, generates frames sequentially and may accumulate prediction errors.
Walsh et al. [33] framed SLP as a discrete sequence-generation problem and used an improved noise substitution vector quantization (NSVQ) model. Their pose representation incorporates extracted facial landmarks alongside body and hand landmarks. The method uses a codebook of short motions, whose tokens are predicted from spoken language text by a transformer encoder–decoder. This way, the generation does not require gloss annotations. For PHOENIX14T, the approach achieved a BLEU-4 score of 9.20 for T2P and 8.17 for G2P. On mDGS, the score was only 0.39.
Feng et al. [30] also explored direct text-to-pose generation through Text2SignDiff, a gloss-free latent diffusion model. SignVAE is applied to encode body, hand, and facial landmarks in the latent space, and a contrastive aligner module is used to align these features with the Sentence-BERT embeddings of the input text, which are used as conditions. The model achieved a BLEU-4 score of 11.23 on PHOENIX14T and 5.68 on How2Sign. The model’s pose sequence outputs are limited to 256 frames.
Saunders et al. [27] used a different generation pipeline, translating text into glosses before generating poses and rendering photo-realistic SL videos. Their model employs a transformer to predict glosses, which are used to retrieve the corresponding poses from a sign dictionary. FS-NET learns temporal alignment using DTW supervision, and SIGNGAN renders the resulting pose sequences into videos. On PHOENIX14T, FS-NET achieved BLEU-4 18.78 in the G2P task, whereas the entire T2P procedure scored 21.10. This approach is dependent on gloss annotations, the sign dictionary, and the quality of text-to-gloss translation.
Tang et al. [19] introduced GCDM, a conditional diffusion model that takes gloss sequences directly as input for sign pose generation. A cross-attention mechanism is employed that enables an encoder to condition the pose denoiser on gloss features. In the inference stage, several pose hypotheses are generated and averaged to improve the quality of the results. On PHOENIX14T, GCDM achieved a BLEU-4 score of 7.91, but it requires multiple denoising steps.
2.2.2. Emotion-Aware Approaches
Zhao et al. [31] developed an approach called EASL, which decodes both semantic and emotional information from the input text and uses both for pose estimation. A decoder is also used to predict a score for each of the seven emotions at every frame. EASL achieved a BLEU-4 score of 13.27 on PHOENIX14T and 19.76 on Prompt2Sign. The framework depends on CLIP-generated emotion annotations rather than manually verified affective labels.
2.2.3. FAU-Based Approaches
Although facial landmarks and emotion prediction have shown promising results in SLP, they do not explicitly represent facial muscle activation intensities. FAUs provide this complementary information.
Viegas et al. [40] proposed TG2S, which predicts 17 FAU intensities alongside 118 landmarks through autoregressive decoding, without incorporating FAUs into a pose representation used to learn a motion codebook. On PHOENIX14T, BLEU-4 scores decreased from 8.19 with manual features to 5.76 with non-manual features and FAUs. The authors suggested facial-expression variability as a possible explanation for the lower scores. However, different back-translation evaluators were used, so the decrease could not be clearly attributed to the use of FAUs.
Kanakanti et al. [34] proposed MultiFacet, which combines BERT text embeddings with speech and prosody features to synthesize 85 3D pose landmarks. FAUs are also used in the prediction as an auxiliary task, wherein weak labels are derived from ME-GraphAU, thresholded by confidence, linearly interpolated, and smoothed. On the Indian Sign Language test split, the full model combining text, prosody, and FAUs reduced the DTW score from 14.08 to 13.23 and raised the percentage of correct keypoints (PCK) from 78% to 81% compared with the Speech2Sign baseline. Although the combined configuration improved the reported metrics, the binary formulation treats weak and strong activations alike, leaving differences in facial expression intensity unrepresented.
Overall, these studies used FAUs within autoregressive decoding or as auxiliary supervision: neither approach integrates FAU intensities with the landmarks into a single pose representation. The contribution of FAUs to SLP accuracy through direct integration into the pose representation remains, therefore, to be assessed through controlled comparisons with matched model configurations and a shared back-translation evaluator.
3. SignFAU Framework
In this section, we discuss our proposed framework in detail, beginning with an introduction to the dataset used in this study, the landmarks-only PHOENIX14T dataset proposed in [42]. Next, we explain the FAUs extraction and preprocessing process, then we discuss integrating FAUs with the landmarks-only PHOENIX14T dataset. We also briefly present the Sign-VQ baseline [33] and specify all the changes we made to the model architecture. Finally, we present and discuss the back-translation model used. Figure 1 provides a detailed explanation of the overall SignFAU framework. It consists of three main components:
Figure 1.
Overview of the SignFAU framework. The framework has three main components: FAU extraction and preprocessing, the improved Sign-VQ (pose codebook model and translation model), and back-translation and evaluation. Values in red mark the changes made to the original Sign-VQ translation model [33]; the pose codebook model uses the GitHub repository configuration [41].
- FAUs extraction and preprocessing: This component creates and preprocesses the PHOENIX14T-FAU dataset by extracting FAUs from the video frames and integrating them into the landmarks of the landmarks-only PHOENIX14T dataset [42], giving the pose sequences .
- Improved Sign-VQ: This is the main component. It converts the input text into a sequence of predicted poses using two models: the pose codebookmodel [41], which learns a codebook of short motion tokens from the pose sequences , and our modified translation model (based on [33]), which maps the text to codebook tokens that the pose codebook model decodes into poses. Compared with the original Sign-VQ [33], our translation model is deeper and has a greater capacity to exploit additional facial information.
- Back translation and evaluation: This component uses two SLT models [6]: the pretrained model released with the Sign-VQ baseline model [33], trained on the landmarks-only PHOENIX14T dataset, and a model that we trained on the PHOENIX14T-FAU dataset. Given the sequence of predicted poses from the second component, the models convert it back into spoken-language text, which is then evaluated against the ground-truth text using the BLEU and ROUGE metrics.
More details are provided in the following sections.
3.1. Dataset
We used the preprocessed version of the popular PHOENIX14T benchmark dataset [5] released by [42]. It is a German Sign Language (DGS) benchmark dataset collected from weather forecast broadcasts. It was originally designed for SL recognition and translation and provides continuous SL videos together with gloss annotations and spoken German translations. The videos were performed by nine signers, and the dataset included a sign vocabulary of 1066 glosses and a German vocabulary of 2887 words [5]. This release [42] contained 7060 training sequences, 515 development sequences, and 641 test sequences. Each frame contained 178 3D landmarks (534 values per frame): 21 for each hand, 128 for the face, and 8 for the body [42]. To enrich the representation of non-manual features as needed for our aim, we extended this dataset by adding 18 different FAUs per frame as described in Section 3.2.
3.2. FAUs Extraction and Preprocessing
We automatically extracted FAUs from each PHOENIX14T video frame using OpenFace 2.0 [45]. OpenFace 2.0 is an open-source toolkit that enables head-pose estimation, eye-gaze estimation, facial landmark detection, and FAU recognition. It extends the original OpenFace toolkit [46] with a multi-task convolutional neural network (MTCNN) for face detection and a convolutional experts-constrained local model (CE-CLM) for more accurate facial landmark detection [45]. We estimated FAU activation defined within FACS, a standardized, anatomically based system for coding facial movements into FAUs. Each FAU described an observable facial movement associated with one or more facial muscles [47,48]. As demonstrated in Figure 1, this process consists of six components: face detection, FAU extraction, missing frame interpolation, temporal smoothing, normalization, and FAU integration. These components are explained in detail in Section 3.2.1, Section 3.2.2, Section 3.2.3, Section 3.2.4, Section 3.2.5 and Section 3.2.6.
3.2.1. Face Detection
The FAU extraction began by detecting the signer’s face in each frame of a video of one signed sentence, where U was the number of frames, H and W were the height and width of a frame, respectively, and 3 was the number of color channels (RGB). The face was detected using OpenFace’s MTCNN detector [49]. We enabled multiview detection to compensate for possible variations in head orientation, and we set a confidence threshold of 0.5 to ensure sufficient detection coverage while maintaining a good level of reliability. The detected face was then cropped from every frame, yielding face crops , where contained the face crops of all U frames, and and were the height and width of a face crop, respectively. These face crops were then passed to the FAU extraction step.
3.2.2. FAU Extraction
Using OpenFace’s FeatureExtraction tool [45], facial landmarks were extracted and then passed to FAU recognition (an internal stage within the FAU extraction step). In the FAU recognition stage, two linear-kernel support vector machine (SVM) models [45] were used: one detected FAU presence and the other estimated FAU intensity. The final output was a set of 18 FAU values per frame, denoted , which was zero in frames where the face was not detected. Of the 18 extracted FAUs, 17 represented FAU intensity, ranging from 0 to 5, where 0 indicated no FAU was detected and values greater than zero indicated its presence at varying intensity levels. The remaining FAU (AU28) indicated FAU presence and had a binary value: 0 for no FAU present and 1 for its presence [45]. Table 1 lists the full names of the extracted FAUs, while Figure 2 shows the extracted FAUs and their facial regions in a sample frame.
Table 1.
The full names of the FAUs [45].
Figure 2.
Example of FAU extraction from a PHOENIX14T frame: (a) the input frame with the detection box, (b) the detected face, and (c) all 18 FAUs extracted by OpenFace’s FeatureExtraction tool, colored by facial region.
Although every frame contained the signer’s face, the detector failed on some frames, mostly when hands occluded the face or moved close to it. Figure 3 shows examples of successful and failed detections. Overall the failure rates were only 9.7%, 9.1%, and 9.6% across the training, development, and test splits, respectively, as shown in Figure 4. Those frames where the signer’s face could not be detected were handled by linear interpolation, as described in Section 3.2.3.
Figure 3.
Examples of face detection results: (a) successful face detections, where the green box marks the face detected by OpenFace, and (b) failed face detections.
Figure 4.
Overall success and failure rates of face detection across frames in each PHOENIX14T split.
3.2.3. Missing Frame Interpolation
When no face was detected, the frames were treated as missing measurements. Assigning a fixed value was unsuitable, since numerical values indicate FAU activation levels. For example, assigning zero would have made it difficult to distinguish a detection failure from the actual absence of facial activity, as in the case of a neutral face. Instead, each missing FAU value was estimated by linear interpolation between the nearest preceding and subsequent frames in which the face was successfully detected. We let be the set of frames with a detected face, and we let be the nearest detected frames after and before a missing frame t, respectively. The value of FAU j at frame t was then calculated as follows [50]:
When detection failed in frames at the beginning or end of the video, we compensated for missing FAU values using the nearest detected frame, as the detections were available on one side only, which was insufficient for linear interpolation.
Linear interpolation is more reliable when gaps between detected frames are short, since facial expressions typically change gradually over short intervals. To check this, we measured the lengths of the missing-frame gaps in the PHOENIX14T dataset [42] and found that most gaps were short, i.e., 37.1% of the missing frames lay in gaps of at most three frames, 46.2% lay in gaps of four-to-ten frames, and only 16.7% lay in longer gaps, where the interpolated values may have approximated the expression less closely. However, the impact of these gaps on feature quality was expected to be limited, since most were relatively short (83.3% fell within gaps of no more than ten frames), allowing us to exploit the temporal continuity of facial movements to estimate missing values using linear interpolation without significantly altering the original movement patterns.
Therefore, with linear interpolation, every frame had a complete set of 18 FAU values. We denoted the interpolated sequence by .
3.2.4. Temporal Smoothing
Because the FAUs were estimated independently in each frame, the interpolated sequences contained frame-to-frame jitter from the detector. To reduce this jitter, each FAU sequence was smoothed over time using a Gaussian filter with a standard deviation of one frame, which preserved the onset and offset of each facial expression of the 18 FAUs, using the following equation [51]:
where was the smoothed intensity of FAU at frame t; where was the interpolated intensity of FAU j at frame ; and where represented the temporal offset relative to the current frame t, such that meant the current frame, meant the previous frame, and meant the next frame. Here, ranged from to 4, so the smoothing used the current frame, the four previous frames, and the next four frames (totaling nine frames). The Gaussian weight determined how much each frame contributed to the smoothed value. The current frame had the largest weight, and frames farther away had smaller weights. In the denominator, was used to sum the weights of all nine frames. Dividing by this sum ensured that the normalized weights added up to one. The standard deviation controlled how quickly the weights decreased with distance from the current frame. At the sequence boundaries, missing neighboring values were replaced with the value of the first or last frame, respectively. The smoothed values were then clipped to the OpenFace intensity range , producing the matrix .
3.2.5. Normalization
The smoothed FAU values were normalized to match the scale of the preprocessed PHOENIX14T landmarks [42]. The FAU values ranged from 0 to 5, whereas the landmark coordinates generally remained below 1 in magnitude, as shown in Figure 5. Without normalization, the larger FAU values could therefore dominate the landmarks during training [52,53]. Consequently, the normalization performed consisted of three steps: each FAU value was first divided by 5 to re-scale it to ; its mean over the training split was then subtracted so that the average of each FAU was close to zero, since inputs with an average close to zero led to faster convergence during training [52]. Finally, all the FAUs were multiplied by a single common factor s, defined in Equation (3) as the ratio of the average standard deviation of the landmark coordinates to the average standard deviation of the 18 FAUs over the training split. This brought the spread of the FAUs to about that of the landmarks, so that the network learned from both at a similar speed and neither dominated the training [52], as follows:
where was the normalized value of FAU j at frame t, and was the mean of the scaled FAU values (i.e., ) across all the training frames. In s, and were the average standard deviation of the landmark coordinates and the standard deviation of the scaled FAU values, respectively, across all the training frames. Based on the dataset used in this study, and . All of these values were computed on the training split only. The normalized values of all the frames formed the matrix , where each row represented one frame, and each column represented one FAU. As shown in Figure 5, the normalized FAU values lay within the range of the landmark coordinates. Next, we integrated the normalized FAUs with the landmarks-only PHOENIX14T dataset [42], as described in Section 3.2.6.
Figure 5.
Value distributions on a shared logarithmic axis: (top) raw FAU intensities estimated using OpenFace, (middle) FAUs after preprocessing, and (bottom) 3D pose-landmark coordinates. The shaded areas mark the feature value range.
3.2.6. FAU Integration
We integrated the extracted FAUs with the preprocessed PHOENIX14T dataset [42], keeping the same data structure as [33]. Each dataset sample comprised a sequence of consecutive frames representing one signed sentence in German. As a preprocessing step, each sample was stored as a record containing five different attributes: name, text, gloss, poses_3d, and speaker. The poses_3d field stored each landmark as 3D coordinates in the format . To encode the 18 normalized FAUs in the model’s input structure, we divided them into six groups of three and stored them as six pseudo-joints. These groups occupied the positions in the tensor and represented FAU values rather than spatial coordinates.
Formally, we let denote the 3D landmarks (128 landmarks for face, 21 for each hand, and 8 for the body) of frame t; and we let denote the preprocessed FAUs of frame t (processed using Equation (3)), ordered as in Table 1. Then, the FAU vector was reshaped into six pseudo-joints as follows:
where was the resultant matrix of the six FAU pseudo-joints of frame t. The FAU matrix was then appended to the landmark matrix of the same frame t:
where was the fused matrix, containing the original 178 landmarks followed by the six FAU pseudo-joints (i.e., rows).
Each fused matrix was then flattened row by row into the model input vector as follows:
where was the flattened input vector of frame t ( values), and P was the input sequence of all U frames.
Equations (5) and (6) show that the fusion process performed early feature-level concatenation to produce the resulting input vector , where the first 534 dimensions represented landmark coordinates, and the last 18 dimensions represented FAU intensities. The grouping into triples was merely a storage convention that fitted the input format of Sign-VQ; no operation treated a pseudo-joint as a 3D point. Because the spatial embedding (Equation (7)) was a linear layer applied to the whole frame vector, any other grouping of the FAUs into triples would only have reordered the columns of and would have given an equivalent model; different groupings were therefore not tested.
3.3. Improved Sign-VQ
The Sign-VQ Transformer [33] was chosen as the baseline model for our proposed framework due to its data-driven representation that can be extended to include FAUs. Its VQ model learns a codebook of short motion patterns that represent continuous sign sequences as discrete tokens.
The aim of this approach is to convert a source spoken language sentence that contains words with , where denotes the number of words in the sentence and denotes a single word i () in the pose sequence (Equation (6)), where U is usually larger than . Each pose contains 178 3D landmarks, extended with the 18 FAUs (using Equation (6)). The approach has two main components: the pose codebook model and the translation model.
3.3.1. Pose Codebook Model
The pose codebook has three main components: an encoder, NSVQ, and a decoder. Each fused frame (see Equation (6)) is first mapped to the model dimension by the spatial embedding; then a linear layer is applied to the whole frame vector, followed by adding positional encoding to the resulting representation as follows [33]:
where is the output of the spatial embedding for frame t; is the weight matrix of the linear layer learned during training, with rows and 552 columns (one column for each of the 552 input values of a frame, i.e., 534 landmark coordinates and 18 FAUs); is the bias vector of the linear layer, also learned during training; and is a vector that encodes the position of frame t in the sequence.
Each FAU is therefore multiplied by its own learned column of , in the same way as each landmark coordinate, so that the model learns the contribution of each FAU separately, regardless of how the FAUs are grouped into pseudo-joints. The embeddings are then processed in short windows as follows. First, the sequence is subsampled by a factor of 2, i.e., one frame is kept and the next is dropped (frames ), halving the number of frames. The subsampled sequence is then split into non-overlapping windows, each containing frames. We number the windows with the index i. The embeddings of the frames of window i are passed together to the transformer encoder. The encoder output for window i is a matrix , with one row of size for each of the w frames of the window. This matrix is flattened, i.e., its rows are placed one after another, into a single vector . NSVQ then replaces with the most similar entry of the codebook, a set of learned vectors, each representing a typical short motion; we denote the position (index) of this entry in the codebook by , and the entry itself by . Let denote the number of windows in a sequence. The encoder therefore produces one vector per window . Since the sequence is subsampled by a factor of 2 and each window has four frames, , so each codebook entry represents only a short part of a complete sequence.
The second component is NSVQ [54], which performs the codebook replacement described above. Because selecting the nearest entry is not differentiable, NSVQ approximates it during training by adding noise to :
where is the vector used in place of during training; denotes the Euclidean norm, so that is the distance between and ; and is a random vector drawn from the standard normal distribution , with zero mean and identity covariance matrix . Dividing by its norm and scaling it by yields a random noise vector of exactly that length. This keeps the size of the quantization error while allowing the training error to reach the encoder; when poses are generated, itself is decoded. Codebook entries that are rarely selected are periodically replaced by encoder outputs.
The final component is the decoder, which reconstructs each window from its selected codebook entry. To reconstruct window i, the decoder receives together with a frame position that increases linearly from 0 to 1 across the window. For each frame t of the window, the decoder outputs a vector, which we denote by . A linear output layer, with learned weight matrix and bias vector , then maps back to the 552 values of a fused vector, giving the reconstructed vector . The codebook model is trained by minimizing the following loss [33]:
where is the total training loss, is the weight of the reconstruction term, and N is the number of frames in a batch. The term squares the difference between each of the 552 values of the original vector and the corresponding value of the reconstructed vector , adds these squared differences over all N frames, and divides the total by , giving the mean squared reconstruction error; is the weight of the counter term, and is the mean squared error between the predicted and the true frame counter. Because the reconstruction error is computed over all 552 values, every codebook entry must encode both the landmarks and the FAUs motion of its window.
To choose the pose codebook configuration with the best performance, we compared two available configurations of the Sign-VQ pose codebook: the one reported in the Sign-VQ paper [33] and the one published in the Sign-VQ-Transformer GitHub repository [41]. The comparison was made on the development split (see Section 4.4.2), and the experimental results showed that the GitHub configuration performed better; we therefore used it for all the models, with and without FAUs. The two configurations differ as follows: the GitHub configuration uses a larger transformer in both the encoder and decoder, i.e., the hidden size is increased from 128 to 512, the feed-forward size from 128 to 1024, and the number of attention heads from 4 to 8, while the number of layers remains 2. It also uses a temporal subsampling factor of 2 instead of 3 and a lower learning rate of instead of . Moreover, its learning-rate scheduler uses a reduction factor of 0.8 with a patience of 3 epochs, compared with 0.9 and 5 epochs in [33]. Both configurations use a codebook of 4000 tokens, but the GitHub configuration continues codebook replacement until epoch 1300, whereas the Sign-VQ paper stops after epoch 150.
3.3.2. Modified Translation Model
The second main component of the improved Sign-VQ model is the translation model, which maps a spoken-language sentence to a sequence of codebook indices , where is the index of the codebook entry predicted at position m and M is the number of predicted indices. The translation model is an autoregressive transformer, i.e., it predicts the indices one at a time for each index , depending on the sentence Y and the indices previously predicted, . The probability of the whole index sequence is therefore modeled as:
where is the probability that the index at position m is , given the sentence and the previously predicted indices. To generate poses, each predicted index is replaced by the corresponding codebook entry , and then the decoder of the pose codebook model (Section 3.3.1) turns each entry into a short window of poses. Consecutive windows are then joined by transition frames, obtained by linear interpolation between the last frame of one window and the first frame of the next, giving the predicted pose sequence , which consists of frames.
Our translation model differs from [33] in terms of model capacity and settings used. Specifically, we increased the number of transformer layers from 1 to 4 and the number of attention heads from 4 to 8. The embedding and hidden dimensions were increased from 512 to 1024, and the feed-forward dimension from 1024 to 2048. We also changed the learning-rate scheduler mode from min to max, since BLEU-1 is a higher-is-better metric. The learning rate (), dropout (0.1) and beam search (beam size 5 and length penalty ) were kept unchanged. All the modifications and setting choices were based on the experiments conducted on the development split (see Section 4.4.4). This was to avoid test-set leakage.
During the training of the modified translation model, the development BLEU-1 score, computed by the corresponding SLT evaluator, was also used to select the final model: the checkpoint with the highest development BLEU-1 score. Finally, the landmarks-only control was trained using the same modified translation model and identical settings, so that the controlled comparison experiment (discussed in Section 4.4.4) could successfully isolate the contribution of the FAUs from the effects of these model modifications.
3.4. Back-Translation and Evaluation
For quantitative evaluation, we used two back-translation models based on the SLT architecture introduced by [6], which were used only for evaluation and were not part of our generation framework. We called these two back-translation models the landmarks-only SLT evaluator and the FAU-enhanced SLT evaluator. Each model performed the sign-to-text task, which was later used to translate the generated pose sequences into spoken language sentences. The SLT architecture jointly learned SLR and SLT through an SLRT encoder supervised by a CTC loss over gloss sequences and an autoregressive SLTT decoder that predicted the corresponding text [6]. For evaluation, the generated poses were passed to one of those two trained SLT models, and the translated sentences were compared with the reference texts using the metrics described in Section 4.3. To ensure input compatibility, the landmarks-only SLT evaluator, which was the pretrained model released by the Sign-VQ baseline [33], and which was trained on the landmarks-only PHOENIX14T dataset, served as a common evaluator for all the models, while the FAU-enhanced SLT evaluator was trained by us on the PHOENIX14T-FAU dataset so that it could also exploit the facial information (i.e., FAUs) in the generated poses.
4. Experiments
This section presents an empirical evaluation of our proposed SignFAU framework. We begin by outlining the experimental design, ablation study, and evaluation metrics. We then present our evaluation of the reliability of the landmarks-only and FAU-enhanced SLT evaluators, the impact of pose codebook and translation model configurations, and the FAUs’ contribution to performance improvement. We also present our evaluation of the quality of the generated facial expressions and our comparison of the improved Sign-VQ model with existing SLP models. Finally, we provide qualitative examples of the results.
4.1. Experimental Design and Ablation Study
All our experiments followed the same protocol: the models were trained using the training split, and all configuration decisions were made using only the development split. The test split was not used for any decision; test scores of intermediate models are reported for completeness only. The experiments were conducted in eight stages as follows:
- SLT Evaluators: All generated poses were evaluated by back-translating them into text with the two SLT evaluators described in Section 3.4: the landmarks-only SLT evaluator and the FAU-enhanced SLT evaluator. Before using them, we tested each evaluator on ground-truth poses to find their upper-bound performance. To investigate the impact of FAUs on the FAU-enhanced SLT evaluator, we removed FAUs from its inputs and compared its performance before and after removal.
- Pose Codebook Configurations: Since the original Sign-VQ paper [33] and its GitHub repository [41] provide different pose codebook configurations (Section 3.3), we compared their pose reconstruction quality and final translation performance on the PHOENIX14T-FAU dataset to select the better-performing configuration (Section 4.4.2).
- Translation Model Configurations: After selecting the best-performing pose codebook configuration, we used the Sign-VQ baseline’s translation model configuration [33] as the initial configuration for our experiments. Settings not specified in the paper [33] were obtained from the associated GitHub repository [41].To isolate each setting’s effect on the translation performance, we changed one setting in each experiment while keeping all the others fixed. The settings examined included the number of layers, hidden and embedding sizes, feed-forward size, number of attention heads, dropout rate, and the metric monitored by the learning-rate scheduler together with its corresponding mode (min or max). For each comparison, we retained the setting that yielded the highest development BLEU-4 score (Section 4.4.3).
- Controlled Comparison: We next trained the improved Sign-VQ model on both the landmarks-only PHOENIX14T dataset and the PHOENIX14T-FAU dataset using the same architecture and training settings, and we evaluated their performance. Comparing them allowed us to measure the real contribution of the FAUs while keeping the model capacity identical for both datasets. We trained each model with three commonly used random seeds (42, 0, and 1234), and we report the mean ± standard deviation. Since the BLEU score differences between the improved Sign-VQ and the landmarks-only control may have changed when different samples of development and test sentences were used for evaluation, we tested whether the differences were statistically significant using paired bootstrap resampling over the sentences of each split [55], which is a standard significance test for comparing machine translation (MT) systems evaluated on the same sentences (Section 4.4.4).
- Effect of FAUs without Facial Landmarks: To examine the effect of the FAUs’ impact more deeply, we tested whether they could replace facial landmarks or provide useful information only when combined with them, thus improving SLP performance. To do so, we separated the FAUs from the facial landmarks by removing the facial landmarks and keeping the FAUs with the body and hand landmarks. Then, on those data, we retrained the three models: the back-translation model, the pose codebook model, and the translation model, once with the FAUs and once without them (body and hand landmarks only), and we evaluated the generated poses of each version with its own SLT evaluator, i.e., the body-and-hands-FAUs SLT evaluator and the body-and-hands SLT evaluator, respectively. Moreover, we evaluated the generated poses of both versions with a common evaluator, i.e., the body-and-hands SLT evaluator (Section 4.4.5).
- Facial Expression Quality: We tested whether the generated faces matched the real faces of the same sentence, using (i) the facial-motion ratio, which measured how much the generated facial landmarks moved compared with the real face, and (ii) the per-AU DTW distance between the generated and real FAU values (Section 4.4.6).
- Comparison with State-of-the-Art: To compare the improved Sign-VQ with existing SLP models under the same conditions, we trained the Progressive Transformer [24] and the Sign-VQ baseline [33] on the PHOENIX14T-FAU dataset. We then evaluated them with the same SLT evaluators (the landmarks-only SLT evaluator and the FAU-enhanced SLT evaluator) as our improved Sign-VQ model. Since all these models use the same data and evaluators, differences between their scores reflect differences among models themselves, not differences in evaluation conditions (see Section 4.4.7).
- Qualitative Examples: We also conducted a qualitative comparison using selected examples from the generated outputs to demonstrate visual differences between the models (i.e., the Sign-VQ baseline and two versions of the improved Sign-VQ, one trained on the landmarks-only PHOENIX14T dataset and the other on the PHOENIX14T-FAU dataset), and we assessed the impact of incorporating FAUs on the quality of the generated facial expressions (Section 4.4.8).
4.2. Experimental Details
We ran all our experiments on the Vast.ai cloud platform (Vast.ai, Los Angeles, CA, USA) using a single NVIDIA Quadro RTX 8000 GPU (NVIDIA Corporation, Santa Clara, CA, USA). The experiments used the landmarks-only PHOENIX14T dataset released in [42] and the PHOENIX14T-FAU dataset proposed in this work. As described in Section 3.1, each dataset contained 7060 training, 515 development, and 641 test sequences. In the landmarks-only PHOENIX14T dataset, each frame was represented by 534 landmark values, corresponding to 178 3D points. In the PHOENIX14T-FAU dataset, 18 FAU values were added to these landmark values, giving 552 values per frame. The FAUs extraction and preprocessing steps are described in Section 3.2.
Our improved Sign-VQ framework uses three models: the pose codebook model, the translation model, and the back-translation SLT model (SLT evaluator). In the following paragraphs, we specify the main differences between the baseline Sign-VQ [33] and our improved Sign-VQ.
For the pose codebook model, we used the configuration provided in the GitHub repository [41] rather than the one reported in its original paper [33], since it achieved lower reconstruction errors and higher translation scores on the development split (Section 4.4.2). The configuration in [41] differs from that in [33] in terms of both architecture and training settings. In terms of architecture, its encoder and decoder each have two layers, with a hidden size of 512 instead of 128, a feed-forward size of 1024 instead of 128, and 8 attention heads instead of 4, and its codebook contains 4000 entries, each representing a window of four frames. In terms of training settings, the model [41] was trained with the Adam optimizer, a learning rate of , a batch size of 128, a dropout of 0.1, and a frame subsampling factor of 2, for up to 1500 epochs. The learning rate was reduced by a factor of 0.8 when the development pose MSE did not improve for three epochs, with a minimum learning rate of , and the checkpoint with the lowest development pose MSE was kept. To separate the effect of the FAUs on our framework performance from the configuration changes we trained two versions of this pose codebook model, one on the landmarks-only PHOENIX14T dataset, and one on our PHOENIX14T-FAU dataset. See Section 4.4.2.
For the translation model, we improved the model reported in the paper [33]. In terms of architecture, it has 4 layers instead of 1, hidden and embedding sizes of 1024 instead of 512, a feed-forward size of 2048 instead of 1024, and 8 attention heads instead of 4. In terms of training, the model was trained with the Adam optimizer, a learning rate of , a batch size of 256, a dropout of 0.1, and gradient clipping at 0.1, for up to 500 epochs. The learning rate was reduced by a factor of 0.9 when the development BLEU-1 score did not improve for five epochs (scheduler in max mode instead of min), with a minimum learning rate of , and beam search with a beam size of 5 and a length penalty of was used for decoding. Similar to the pose codebook model, two versions of this model were trained: one on the PHOENIX14T-FAU dataset and one on the landmarks-only PHOENIX14T dataset. Each version was trained with three random seeds (42, 0, and 1234), and for each seed the checkpoint with the highest development BLEU-1 score was selected; these checkpoints occurred at epochs 191, 250, and 142 for the version trained on the PHOENIX14T-FAU dataset, and at epochs 168, 196, and 38 for the version trained on the landmarks-only PHOENIX14T dataset, respectively. Together with the pose codebook model trained on the same dataset, the models trained on the PHOENIX14T-FAU dataset formed our improved Sign-VQ, and those trained on the landmarks-only PHOENIX14T dataset formed the landmarks-only control.
For the back-translation SLT model, two evaluators with the SLT architecture [6] were used (Section 3.4). The landmarks-only SLT evaluator is the pretrained model released by the Sign-VQ baseline authors [33], which we used as released. The FAU-enhanced SLT evaluator was trained by us on the PHOENIX14T-FAU dataset. In terms of architecture, it had 3 layers, a hidden size of 512, a feed-forward size of 1024, and 8 attention heads. In terms of training, it was trained with the Adam optimizer, a learning rate of , a weight decay of , a batch size of 32, a dropout of 0.1, label smoothing of 0.1, and a frame subsampling factor of 2, for up to 3000 epochs. The learning rate was reduced by a factor of 0.7 when the development BLEU-4 score did not improve for ten epochs, with a minimum learning rate of , the checkpoint with the highest development BLEU-4 score was kept, and beam search with a beam size of 3 and no length penalty was used for decoding. Table 2 summarizes the final configurations of the three models.
Table 2.
Final configurations of the three models used in this work: the pose codebook model [41], the improved translation model, and the FAU-enhanced SLT evaluator that was trained on the PHOENIX14T-FAU dataset.
4.3. Evaluation Metrics
Two types of evaluation were applied: quantitative and qualitative. For the qualitative evaluation, samples of the poses generated by the improved Sign-VQ were compared with those of the landmarks-only control, the Sign-VQ baseline, and the ground truth. For the quantitative evaluation, the evaluation metrics used were as follows:
Mean Squared Error (MSE). The MSE measured the average squared difference between the reference and predicted values [56]. A lower MSE indicated that the predictions were closer to the reference values. Following [33], we used two MSE-based metrics to evaluate the pose codebook model: pose MSE and counter MSE.
The pose MSE measured the difference between the original and reconstructed poses across all values and frames as follows:
where and were the original and reconstructed pose vectors for frame t (Equation (6)), was the number of values per frame (534 for the landmarks-only PHOENIX14T dataset and 552 for the PHOENIX14T-FAU dataset), and N was the number of evaluated frames.
The counter MSE measured how accurately the model predicted the position of each frame within its window of w frames:
where was the position of frame t within its window. The target counter increased linearly from 0 at the first frame to 1 at the last frame of each window, while was the predicted counter.
For the translation model, the generated poses were translated back into German text by the SLT evaluators (Section 3.4). We compared the resulting sentences with the reference sentences using BLEU and ROUGE, two metrics commonly used in SLP.
Bilingual Evaluation Understudy (BLEU). BLEU compared translated sentences with reference sentences using n-grams of lengths 1 to 4. It used modified n-gram precision, which clipped each n-gram count to its maximum count in the reference so that repeated words were not counted excessively. BLEU also applied a brevity penalty (BP) to avoid rewarding very short outputs; it was calculated as follows [57]:
where was the maximum n-gram length, was the modified precision for n-grams of length g, and and were the total lengths of the translated and reference sentences, respectively. We computed BLEU at the corpus level using lowercased text without additional tokenization, as implemented in the SacreBLEU tool (version 1.4.2) [58], which we used in this work, and we report the scores on a scale from 0 to 100.
Recall-Oriented Understudy for Gisting Evaluation (ROUGE). ROUGE was developed to evaluate automatic summarization. We used the ROUGE-L variant, referred to simply as ROUGE in the rest of the paper, which compared a reference sentence with its corresponding translated sentence based on their longest common subsequence (LCS); it was calculated as follows [59]:
where was the length of the longest common subsequence of a reference sentence and the translated sentence , and were the lengths of and , respectively, (recall) was the fraction of reference words that were in the LCS, (precision) was the fraction of translated words that were in the LCS, , the ROUGE score, was a weighted average of and , and was the weight of recall relative to precision ( weights them equally); we used , which gave recall slightly more weight [41]. We computed ROUGE for each sentence, average the scores over the evaluation set, and we report them on a scale from 0 to 100.
Paired Bootstrap Resampling. Paired bootstrap resampling was used to test whether the differences between the improved Sign-VQ and the landmarks-only control were statistically significant. The test was applied separately to the development and test splits. For each split, we built random sets of sentences. Each set had the same number of sentences as its split (i.e., 515 for the development split and 641 for the test split) and was formed by randomly picking sentences from the split, so some sentences would appear more than once and others not at all. Both models were then scored on each set b. The p-value was the proportion of resampled sets in which the improved Sign-VQ did not outperform the landmarks-only control [55]:
where and were the scores of the improved Sign-VQ and the landmarks-only control on resampled set b, and was the indicator function. The 95% confidence interval for the difference was calculated from the 2.5th and 97.5th percentiles of the B differences. We applied the test to BLEU-1, BLEU-4, and ROUGE. Since each model was trained with three seeds, all the seeds were scored on the same resampled sets, and and were the mean scores across the three seeds for each resampled set. Thus, the test checked whether the difference held across different sentence samples, but not across different training seeds. Variation across seeds is reported separately as the standard deviation in Section 4.4.4. The same test was used for Section 4.4.1 to compare the FAU-enhanced SLT evaluator with and without the FAU channels.
Facial-Motion Ratio (FMR). FMR measured the movement of the generated face relative to the real face. For a sequence of facial landmarks , where was the number of facial landmarks, we first removed the head position by subtracting the mean of the facial landmarks in each frame, . We then calculated facial motion as the temporal standard deviation averaged over all landmarks and coordinates:
where and were the generated and ground-truth facial landmarks of a sentence, respectively. The ratio was computed on the full sequences of each test sentence without alignment, and the results were summarized by the median across the test sentences, which was less sensitive to outlier sentences than the mean. An of 1 meant that the generated face moved exactly as the real face, and the lower the value became, the less the generated face moved compared to the real face, where 0 indicated a completely static generated face.
Per-AU Dynamic Time Warping Distance. Per-AU dynamic time warping distance measured how closely the generated FAU intensities matched the ground truth when each action unit (AU) was allowed its own temporal alignment. It was based on dynamic time warping (DTW) [60], which compares two sequences that differ in length and timing by finding the frame alignment with the lowest total cost. Given a generated sequence and a ground-truth sequence , the alignment path started at , ended at , and advanced by at most one frame in each sequence at each step. The DTW distance was the average cost per aligned pair, described as follows [61]:
where was the number of aligned pairs. We computed it with the FastDTW approximation [62] (fastdtw Python package, version 0.3.4). For each AU j, Equation (17) was applied to the generated and ground-truth intensity curves of each test sentence, after converting the normalized values back to the OpenFace intensity scale from 0 to 5 using , i.e., the inverse of the normalization operation defined in Equation (3). The results were then averaged over the test sentences and expressed as a percentage of the intensity range as follows:
where was the set of test sentences, and and were the generated and ground-truth intensity curves of AU j in sentence n. Lower values indicated closer FAU intensities.
4.4. Experimental Results
The results are presented in the same order as the evaluation protocol described in Section 4.1.
4.4.1. SLT Evaluators
Since the generated poses were evaluated by back-translating them into text using the SLT evaluators, their evaluation scores depended on how well the SLT evaluator itself translated the original ground-truth poses. Therefore, we first evaluated each SLT evaluator using the ground-truth poses of the dataset it was trained on: the FAU-enhanced SLT evaluator was evaluated using the PHOENIX14T-FAU dataset, and the landmarks-only SLT evaluator (released with the Sign-VQ baseline [33]) was evaluated using the landmarks-only PHOENIX14T dataset. Then, in order to examine whether the FAU-enhanced SLT evaluator actually benefited from the 18 FAU channels, we zeroed all 18 FAUs in the development and test splits of the ground-truth poses and compared the resulting scores with those obtained with the true FAU values. A drop in the scores shows that the evaluator relied on the FAUs during the back-translation process.
Table 3 shows that the FAU-enhanced SLT evaluator achieved a slightly higher upper bound than the landmarks-only SLT evaluator on both splits: the BLEU-4 score was 14.06 vs. 13.38 on the development split and 13.73 vs. 12.78 on the test split.
Table 3.
Upper bound of the back-translation evaluators, each measured on the ground-truth poses of its own dataset.
Table 4 shows that zeroing the FAU channels during evaluation caused only small changes in the FAU-enhanced SLT evaluator results. On the test split, all BLEU and ROUGE scores decreased slightly (BLEU-4 from 13.73 to 13.43), whereas on the development split the scores were nearly unchanged (BLEU-4 from 14.06 to 14.04). Even with the FAU channels removed, the FAU-enhanced SLT evaluator achieved higher scores than the landmarks-only SLT evaluator across all the reported metrics on both splits. These results suggest that its higher scores cannot be explained solely by using FAU inputs during evaluation. One possible explanation is that including FAUs during training helped the model learn better representations of the landmarks, benefiting its performance even when the FAU inputs were subsequently zeroed.
Table 4.
Effect of zeroing the FAU channels on the FAU-enhanced SLT evaluator, measured on the ground-truth poses of the PHOENIX14T-FAU dataset: = .
4.4.2. Pose Codebook Configurations
To select the best-performing configuration, we trained the pose codebook model on the PHOENIX14T-FAU dataset, with two configurations: the configuration reported in the Sign-VQ paper [33] and the configuration provided in its official GitHub repository [41] (see Section 3.3). We compared the pose and counter reconstruction errors of both configurations using Equations (11) and (12). As shown in Table 5, the GitHub configuration achieved lower MSE values on both the development and test splits. On the development split, it reduced the pose MSE by 9.1% and the counter MSE by 32.2%. This meant that the GitHub configuration reconstructed the poses more accurately and better predicted the position of each frame within its window than the Sign-VQ paper configuration.
Table 5.
Reconstruction errors of the two pose codebook configurations on the PHOENIX14T-FAU dataset.
We also investigated how different pose codebook configurations affected the translation model’s performance. For each pose codebook configuration, we trained the Sign-VQ baseline translation model and used the FAU-enhanced SLT evaluator to back-translate the generated poses. As shown in Table 6, the model using the GitHub pose codebook achieved higher scores across all metrics on both splits. On the development split, the BLEU-4 score increased from 5.24 to 7.52 and the ROUGE score increased from 23.99 to 26.73. Based on the development split results, the GitHub pose codebook [41] was selected and used in all subsequent experiments.
Table 6.
Performance of the Sign-VQ baseline translation model trained on each pose codebook, evaluated with the FAU-enhanced SLT evaluator on the PHOENIX14T-FAU dataset.
4.4.3. Translation Model Configurations
Before changing any settings of the translation model, we tested whether adding the FAUs improved the results of the Sign-VQ baseline translation model [33]. For each pose codebook configuration, the model was trained on the landmarks-only PHOENIX14T dataset and on the PHOENIX14T-FAU dataset; then the generated poses were back-translated using the landmarks-only SLT evaluator and the FAU-enhanced SLT evaluator, respectively.
Table 7 shows the effect of the FAUs on the Sign-VQ baseline translation model when predicting tokens from pose codebooks trained using the configuration reported in the original paper [33], by comparing the model trained on the landmarks-only PHOENIX14T dataset with the one trained on the PHOENIX14T-FAU dataset. The results show that the model trained on the PHOENIX14T-FAU dataset achieved slightly higher BLEU-1 scores on both splits and a higher test ROUGE score, but lower BLEU-2 to BLEU-4 scores; on the development split, the BLEU-4 score decreased from 6.47 to 5.24. We believe that this decrease was due to the limited capacity of both the paper codebook configuration and the baseline translation model [33], which may not have been sufficient to exploit the 18 additional FAU channels.
Table 7.
Comparison of the Sign-VQ baseline translation model [33] with and without FAUs, using the pose codebook trained with the paper configuration [33]; each model was evaluated using its own SLT evaluator.
Table 8 shows the same comparison, but this time with the GitHub codebook configuration [41]. Here, the model trained on the landmarks-only PHOENIX14T dataset achieved higher scores on all metrics except test ROUGE, with a development BLEU-4 of 8.02 compared with 7.52 for the model trained on the PHOENIX14T-FAU dataset. Although using the GitHub codebook improved the evaluation results on the PHOENIX14T-FAU dataset compared with the paper codebook (the development BLEU-4 score rose from 5.24 to 7.52), they remained lower than those on the landmarks-only PHOENIX14T dataset. This suggested that the one-layer baseline translation model might lack sufficient capacity to exploit the additional FAU channels. We therefore adjusted the translation model one setting at a time, as described below.
Table 8.
Comparison of the Sign-VQ baseline translation model [33] with and without FAUs, using the pose codebook trained with the GitHub configuration [41]; each model was evaluated using its own SLT evaluator.
To provide the translation model with sufficient capacity to exploit additional facial information, we tuned its configuration to effectively process the PHOENIX14T-FAU dataset. Starting from the Sign-VQ baseline translation model [33] with the selected GitHub pose codebook, we changed one setting at a time while keeping all the other settings fixed, and we carried the setting with the highest development BLEU-4 into the next step. All the runs used seed 42 and were evaluated on the development split with the FAU-enhanced SLT evaluator. Table 9 reports the results of each step.
Table 9.
Translation model configuration on the PHOENIX14T-FAU dataset (development split). Each step changed one setting and carried the selected setting (✓) into the next step.
We first varied the number of layers from one to four, assuming that a deeper model would better capture the more complex relationships introduced by the 18 FAU values added to each frame. Four layers raised the BLEU-4 score from 7.52 to 8.23, although the two-layer model achieved the highest BLEU-1 and ROUGE scores. We then increased the hidden and embedding sizes from 512 to 1024 to give the model a larger representation space for the expanded pose input; this improved all the metrics, reflected in a BLEU-4 score of 8.97. Because the original model kept a 1:2 ratio between the hidden and feed-forward sizes (512:1024) we next increased the feed-forward size from 1024 to 2048 to retain this ratio, which gave a further small gain to 9.05. We then increased the number of attention heads from four to eight, anticipating that dividing the 1024-dimensional representation among more heads would allow the model to capture more varied relationships in the input sequences. Eight heads raised the BLEU-4 score to 9.29 but slightly decreased the other metrics.
Next, we examined the learning-rate scheduler, which reduces the learning rate when the tracked development metric stops improving. The original configuration tracked the development BLEU-1 score in min mode, treating a decreasing score as an improvement, although BLEU is a higher-is-better metric. We assumed that matching the mode to the direction of the metric would reduce the learning rate at the right time, and we also tested tracking the BLEU-4 score, the main evaluation metric in this work. Switching to max mode while tracking BLEU-1 gave the largest single gain, raising the BLEU-4 score from 9.29 to 10.20, whereas tracking BLEU-4 gave scores of 10.04 in max mode and 9.01 in min mode. Finally, since the larger model might be more prone to overfitting, we tested dropout rates of 0.2 and 0.3. Both lowered the BLEU-4 score to 9.33 and 9.24, respectively, so the original rate of 0.1 was kept.
Overall, the selected configuration increased the development BLEU-4 from 7.52 to 10.20 (+35.6%) compared with the Sign-VQ baseline translation model. This configuration was used for the improved Sign-VQ model in all subsequent experiments.
4.4.4. Controlled Comparison
This experiment measured the contribution of the FAUs to model performance improvement by comparing the improved Sign-VQ with the landmarks-only control, which used the same improved Sign-VQ configurations and differed only in the input data (534 vs. 552). The improved Sign-VQ (trained on the PHOENIX14T-FAU dataset) and the landmarks-only control (trained on the landmarks-only PHOENIX14T dataset) were each trained with three random seeds (42, 0, and 1234). The two models were compared using two evaluation methods. First, each model was evaluated independently using the SLT evaluator trained on its own dataset, i.e., the landmarks-only SLT evaluator for the landmarks-only control and the FAU-enhanced SLT evaluator for the improved Sign-VQ model. Second, both models were evaluated using the same SLT evaluator (i.e., the landmarks-only SLT evaluator) to provide a common basis for a fair performance comparison.
Evaluation with each model’s own SLT evaluator. Table 10 shows the results for each seed when the landmarks-only control was evaluated with the landmarks-only SLT evaluator and the improved Sign-VQ with the FAU-enhanced SLT evaluator. Across all three random seeds, the improved Sign-VQ outperformed the landmarks-only control on all metrics and on both development and test splits. On average, adding the FAUs raised the BLEU-4 score from 8.37 to 10.91 on the test split (+30.4%) and from 7.37 to 9.75 (+32.3%) on the development split. These gains (about 2.5 BLEU-4) exceeded the 0.7–1.0 BLEU-4 gap between the upper bounds of the two evaluators (Section 4.4.1). This indicates that the gain was not solely due to the stronger evaluator but also reflected improvements in the generated poses. The improved Sign-VQ was also more stable across seeds (test BLEU-4 standard deviation of 0.19 vs. 0.81). This suggests that the FAUs may have improved the translation quality of the generated poses and made the results more stable across the three seeds. However, since the two models were evaluated by different SLT evaluators, we also evaluated both models with the same landmarks-only SLT evaluator to examine the FAUs’ contribution under the same evaluation settings, as described below.
Table 10.
Results per seed, with each model evaluated by the SLT evaluator of its own dataset.
Evaluation with the same landmarks-only SLT evaluator. To check that the improvements did not come only from the FAU-enhanced SLT evaluator, both models were also evaluated with the landmarks-only SLT evaluator, which read only the landmark part of the improved Sign-VQ outputs and ignored the FAU channels. Table 11 shows the per-seed results of the improved Sign-VQ and the landmarks-only control with this common evaluator on the development and test splits. On the test split, the improved Sign-VQ model still outperformed the landmarks-only control on all metrics and across all seeds; on average, the BLEU-4 scores increased from 8.37 to 8.85, BLEU-1 from 26.95 to 28.60, and ROUGE from 28.13 to 29.32. On the development split, compared with the landmarks-only control, the improved Sign-VQ was slightly higher in BLEU-1, BLEU-2 and ROUGE, and slightly lower in BLEU-3 and BLEU-4 (e.g., 7.21 vs. 7.37 BLEU-4). Hence, even when the FAU channels were ignored, training with the FAUs improved the generated landmarks on the test split, with statistically significant gains in BLEU-1 () and ROUGE () but not for BLEU-4 (). On the development split, no difference was statistically significant (Table 11).
Table 11.
Results per seed, with both models evaluated by the landmarks-only SLT evaluator. The landmarks-only control rows are the same as in Table 10, since this was its own evaluator.
Statistical significance. Table 12 summarizes the differences between the two models under both evaluators. For each metric and split, the difference was the mean score of the improved Sign-VQ minus that of the landmarks-only control. The p-value, computed for BLEU-1, BLEU-4 and ROUGE with paired bootstrap resampling (Section 4.3), was the proportion of resampled sets in which the improved Sign-VQ achieved a score equal to or lower than that of the landmarks-only control (Equation (15)). A difference was considered statistically significant when . With each model’s own evaluator, all the differences were statistically significant (), and the improved Sign-VQ model won on BLEU-4 with all three seeds on the development and test splits. With the landmarks-only SLT evaluator, on the test split, the differences in BLEU-1 (+1.65, ) and ROUGE (+1.18, ) were statistically significant, whereas the difference in BLEU-4 (+0.48, ) was not, and the improved Sign-VQ won on BLEU-4 with all three seeds. On the development split, no difference was significant, and the improved Sign-VQ won on BLEU-4 with two of the three seeds (42 and 1234). Overall, these results show that the FAUs significantly improved the results when each model was evaluated by its own SLT evaluator. Moreover, even with the landmarks-only SLT evaluator, which could not read the FAU channels, the improved Sign-VQ still achieved significant gains in test BLEU-1 and ROUGE. This suggests that training with the FAUs also improved the generated landmarks themselves. However, the gains of the improved Sign-VQ over the landmarks-only control were smaller with the landmarks-only SLT evaluator than with each model’s own evaluator (e.g., test BLEU-4: +0.48 vs. +2.54), and less consistent (significant only for test BLEU-1 and ROUGE, compared with all metrics on both splits), indicating that the largest benefit of the FAUs appears when the evaluator can also read the FAU channels.
Table 12.
Summary of the FAU effect: = , for each metric and split, averaged over three seeds; p = p-value of the paired bootstrap test with 1000 resamples of the sentences of each split ( indicates statistical significance). Seeds won = number of seeds (out of three) in which the improved Sign-VQ achieved the higher BLEU-4 score on that split.
4.4.5. Effect of FAUs Without Facial Landmarks
To examine the effect of including FAUs more deeply, this experiment tested whether the FAUs alone, which described facial expressions with only 18 values per frame compared with 384 values for the facial landmarks, carried enough facial information to replace the landmarks, or whether they were useful only when combined with them. The 128 facial landmarks were removed from the PHOENIX14T-FAU dataset, and two versions of the remaining data were prepared: the first included only body and hand features (50 joints, totaling 150 values per frame), and the second combined body and hand features with 18 FAUs, totaling 168 values per frame. For each version, we trained a pose codebook model, an SLT evaluator and an improved Sign-VQ translation model with the final configuration (shown in Table 2) and seed 42. We refer to the two evaluators as the body-and-hands SLT evaluator and the body-and-hands-FAUs SLT evaluator.
Upper bound of the evaluators. Table 13 shows the scores of the two evaluators on the ground-truth poses of their own data. The body-and-hands SLT evaluator achieved a higher upper bound on all metrics and both splits, with a BLEU-4 score of 12.35 compared with 11.26 for the body-and-hands-FAUs SLT evaluator. Unlike the evaluators trained on the full landmarks, the evaluator that added the FAUs to the body and hand landmarks achieved a lower upper bound. A possible reason was that, without the facial landmarks, the FAUs lost the geometric facial context (position and shape) that the landmarks provide, and the evaluator had to rely only on the automatically extracted FAU values for facial information, although these values may have contained detection and interpolation errors. However, this result did not contradict our aim. Our aim was to use the FAUs to complement the facial landmarks, not to replace them, and when the FAUs were combined with the full landmarks, they improved the results (Section 4.4.4).
Table 13.
Upper bound of the evaluators without facial landmarks, each measured on the ground-truth poses of its own data.
Results of the generated poses. Table 14 compares the poses generated from text by the two improved Sign-VQ models trained without the facial landmarks: one trained on the body and hand landmarks only, and one trained on the body and hand landmarks and the FAUs. With each model evaluated by its own SLT evaluator, the model trained without the FAUs scored higher on all metrics and both splits; the BLEU-4 score was 10.87 compared with 8.26. A part of this difference between the two models may have come from the weaker body-and-hands-FAUs SLT evaluator (Table 13), so both models were also evaluated with the same body-and-hands SLT evaluator, which ignored the FAU channels. In this case, the two models performed closely on the development split (BLEU-4 of 10.11 vs. 10.04), but the model trained without the FAUs remained better on the test split, with a BLEU-4 score of 10.87 compared with 9.81. Paired bootstrap resampling (1000 resamples) on BLEU-1, BLEU-4 and ROUGE showed that the model trained with the FAUs was not significantly better in any comparison (). Therefore, without the facial landmarks, the FAUs did not improve the generated poses. A possible reason was that without the facial landmarks the FAU values lacked the geometric context of the face, which made them harder for the models to exploit. In contrast, when the FAUs were combined with the full landmarks (Section 4.4.4) the improved Sign-VQ significantly outperformed the landmarks-only control, raising the BLEU-4 score from 8.37 to 10.91 with each model’s own evaluator, and significantly improving the BLEU-1 and ROUGE scores even with the common landmarks-only SLT evaluator. Taken together, the two experiments (Table 12 and Table 14) indicate that the FAUs cannot replace the facial landmarks, and that their benefit appears when they are combined with them as complementary facial information.
Table 14.
Results of the improved Sign-VQ trained without facial landmarks (seed 42), with and without the FAUs. The model without the FAUs is listed in both blocks for comparison.
4.4.6. Facial Expression Quality
Since previous experiments relied on BLEU and ROUGE scores to assess output via back-translation, their results reflected the preservation of the sentence’s linguistic content but did not directly evaluate the accuracy of the generated facial expressions. Therefore, we conducted another experiment to directly assess facial expressions, independent of translation quality, by comparing the generated face with the real face of the same sentence using two metrics: the facial-motion ratio for the facial landmarks and the per-AU DTW distance for the FAU values. These metrics measured the amount of facial movement and how similar the generated FAU values were to the real ones; they did not measure whether the generated expressions looked natural or conveyed the intended linguistic meaning. All the results are reported on the test split as the mean ± standard deviation over the three random seeds (42, 0, and 1234).
Facial landmarks evaluation. Table 15 compares the improved Sign-VQ model with the landmarks-only control in terms of the amount of motion generated across the 128 facial landmarks, relative to the ground-truth motion, using the facial-motion ratio metric. For each frame in a sentence, the face center was computed as the mean position of the 128 facial landmarks and subtracted from all the facial landmarks of that frame to remove the effect of changes in head position. We then measured how much the facial landmarks varied around their average positions during the sentence, and we divided the generated variation by the real variation. A ratio of 1 meant the same amount of facial movement as the real signer, and lower values meant a more static face. For each seed, we used the median ratio across the test sentences. The improved Sign-VQ generated more facial movement than the landmarks-only control, with a ratio of 0.664 compared with 0.563. This meant that the faces generated by the improved Sign-VQ showed 66.4% of the facial movement seen in real faces, compared with 56.3% for the landmarks-only control. Adding FAUs therefore produced about 18% more facial movement than the control. The improved Sign-VQ also gave more consistent results across seeds, with a standard deviation of ±0.002 compared with ±0.024 for the landmarks-only control. Both models still produced less facial movement than real signers. This is a limitation of the current framework that will be addressed in future work.
Table 15.
Facial-motion ratio of the generated facial landmarks on the test split (mean ± standard deviation over three seeds). A value of 1 means the same amount of facial movement as the real face.
FAU values. Table 16 compares the 18 FAU values generated by the improved Sign-VQ with the real FAU values of the same sentence using the per-AU DTW distance. The values were first converted back to the OpenFace intensity scale from 0 to 5. For each sentence, the generated curve of each AU was aligned with its real curve using DTW, and the average difference between the aligned values was computed and expressed as a percentage of the 0–5 range. As a reference, we included an average face in which each AU took its average value over all frames of the training split. This value was used during evaluation in the test split. Thus, each AU had a constant value across all frames in all the test split samples. A model that captures facial expressions should achieve a lower distance than this constant face.
Table 16.
Per-AU DTW distance (%) between the generated and real FAU values on the test split. The values of the improved Sign-VQ were averaged over three seeds. Lower value was better.
Averaged over all the AUs, the generated FAUs were much closer to the real values than the average face (3.81% vs. 6.08%), and they were closer for every one of the 18 AUs. The largest differences were found for the AUs with the largest changes in intensity, such as jaw drop (AU26; 7.42% vs. 13.42%), chin raiser (AU17; 7.44% vs. 13.28%), lips part (AU25; 6.73% vs. 11.20%), lip corner depressor (AU15; 5.77% vs. 10.03%) and brow lowerer (AU4; 6.54% vs. 10.23%). AU4, which represented furrowed eyebrows, marked content WH questions in DGS [63]. Overall, these results show that the improved Sign-VQ generated varying FAU values that were closer to the real FAU values than those of the average face, which remained constant throughout the whole sentence. However, DTW compares the shape of each generated AU curve with the curve of the real AU, even if the two curves do not occur at the same time. As a result, this measure showed whether similar facial movements were generated, but not whether they occurred at the right moments of the sentence. Checking the timing would require a perceptual evaluation with DGS signers, which is left for future work.
4.4.7. Comparison with State-of-the-Art
To compare the improved Sign-VQ with existing methods under the same conditions, we retrained the Progressive Transformer [24], a widely used text-to-pose model with publicly available code, on the PHOENIX14T-FAU dataset. Its best checkpoint was selected on the development split (step 20,000, development DTW of 10.92). We also trained the Sign-VQ baseline [33] with its original configuration on the PHOENIX14T-FAU dataset. All the models were evaluated with both SLT evaluators. Since the landmarks-only SLT evaluator was trained on poses without FAUs (534 values per frame), the 18 FAU channels of the generated poses were removed before evaluating them with this evaluator, so that its input matched the data it was trained on, as we did for the improved Sign-VQ in the controlled comparison (Section 4.4.4). Table 17 compares the improved Sign-VQ with the Progressive Transformer and the Sign-VQ baseline under both SLT evaluators.
Table 17.
Comparison with the Progressive Transformer and the Sign-VQ baseline under the same SLT evaluators. All models were trained on the PHOENIX14T-FAU dataset. The improved Sign-VQ is reported as the mean ± standard deviation over three seeds; the Progressive Transformer and the Sign-VQ baseline were trained once. Best values per evaluator are in bold.
With the landmarks-only SLT evaluator, the improved Sign-VQ achieved a higher test BLEU-4 score of 8.85 compared with 6.76 for the Progressive Transformer and 4.11 for the Sign-VQ baseline. With the FAU-enhanced SLT evaluator, it also achieved a higher test BLEU-4 score of 10.91 compared with 6.86 for the Progressive Transformer and 5.56 for the Sign-VQ baseline.
4.4.8. Qualitative Examples
Figure 6 shows seven frames from a test sentence generated by the improved Sign-VQ, the landmarks-only control, and the Sign-VQ baseline, together with the ground-truth poses. The seven ground-truth frames were selected at equal intervals across the sentence. Because the generated sequences differed in length from the ground truth, each generated frame shown is aligned with the corresponding ground-truth frame via DTW on the body and hand landmarks. Under each row, we provide the corresponding German sentence: the reference sentence for the ground truth and the back-translation by each model’s SLT evaluator for the generated poses.
Figure 6.
Ground-truth poses and the poses generated by the improved Sign-VQ model, the landmarks-only control, and the Sign-VQ baseline for the test sentence 29October_2009_Thursday_tagesschau-1024. Under each row, the reference sentence or the back-translation of the model is given.
The Sign-VQ baseline model produced nearly static poses with far less movement than the ground truth: its hands stayed in front of its chest, and from the fourth frame onward it repeated almost the same pose. As a result, its poses were translated into a short, generic sentence, die aussichten (“the outlook’’). In contrast, the improved Sign-VQ model reproduced the ground-truth manual movements more closely than both other models. This is clearest in the sixth frame, where the ground truth shows the signer raising both open hands, with spread fingers beside the head.
The improved Sign-VQ model generated a similar movement, raising both hands with spread fingers close to head level, whereas the landmarks-only control raised its hands only to shoulder level with the fingers bunched together, and the Sign-VQ baseline kept its hands in front of the chest. Similarly, in the third frame, the signer raised one hand to the face while the other stayed at the lower torso; only the improved Sign-VQ model reproduced this, while the other two models kept their hands at chest level or below. In the last frame, the improved Sign-VQ model also placed one hand in front of the chest and the other near the shoulder, as in the ground truth, whereas the landmarks-only control placed both hands symmetrically in front of the chest. The faces generated by all three models changed less than the real face, which opened its mouth in the third and sixth frames; this agrees with the facial-motion ratios below 1 reported in Section 4.4.6. The back-translations show a clearer difference between the improved Sign-VQ model and the landmarks-only control, the two models that shared the improved configuration and differed only in including FAUs. To compare them with the reference sentence, we used the sentence-level ROUGE score, which measured how many words of the reference appeared, in the same order, in the back-translated sentence; it ranged from 0 to 100, where a higher score meant a closer match to the reference and 100 meant an identical sentence. The poses of the landmarks-only control were translated into am donnerstag ist es im bergland zum teil freundlich (“on Thursday it is partly sunny in the mountains”), a fluent weather-forecast sentence but with a different meaning from the reference, which resulted in a low sentence-level ROUGE score of 11.34. In contrast, the poses of the improved Sign-VQ model were translated into die neue woche beginnt wechselhaft und wieder kühler (“the new week begins changeable and cooler again”), which differs from the reference die neue woche beginnt wechselhaft und kühler (“the new week begins changeable and cooler”) only by the additional word wieder (“again”), and resulted in a high sentence-level ROUGE score of 95.13. This sentence was selected to illustrate the differences between the models and is not representative of every output. Over all 641 test sentences, the improved Sign-VQ model obtained a higher sentence-level ROUGE score than the landmarks-only control in 352 sentences, a lower one in 240, and the same in 49. Thus, the improved Sign-VQ model produced translations closer to the reference in more sentences than the landmarks-only control, which agrees with the quantitative results in Section 4.4.4.
4.5. Discussion
The results are discussed in four parts: the contribution of the FAUs, the effect of the translation model configuration, the comparison of the end-to-end framework with the state of the art, and the limitations and future work.
4.5.1. Contribution of the FAUs
Overall, the results show that integrating the FAUs into the pose representation brought clear benefits at most stages of our framework. The first benefit appeared in the back-translation evaluators. The FAU-enhanced SLT evaluator (trained on the PHOENIX14T-FAU dataset) translated the ground-truth poses better than the landmarks-only SLT evaluator released with the Sign-VQ baseline [33] (see Table 3), and it remained better even when its FAU channels were set to zero (see Table 4). This suggests that the FAUs, used during training, helped the evaluator learn a better representation of the landmarks. When the FAUs were first added to the Sign-VQ baseline [33] they did not improve the translation results with the pose codebook models from either the paper [33] or from GitHub [41] (see Table 7 and Table 8). With the paper codebook [33], the development BLEU-4 score was 5.24 with the PHOENIX14T-FAU dataset and 6.47 with the landmarks-only PHOENIX14T dataset, and with the GitHub codebook [41] it was 7.52 with the PHOENIX14T-FAU dataset and 8.02 with the landmarks-only PHOENIX14T dataset. We believe that this was due to the limited capacity of the baseline translation model, which may not have been sufficient to exploit the 18 additional FAU channels. However, once the capacity of the translation model was increased in the improved Sign-VQ, adding the FAUs improved the results. In the controlled comparison, in which the improved Sign-VQ and the landmarks-only control used identical configurations, differing only in the inclusion of FAUs in the input, adding the FAUs raised the BLEU-4 score by about 30% when each model was evaluated by its own evaluator (see Table 10); and across all the seeds, the improved Sign-VQ achieved higher scores on all metrics and on both development and test splits, with statistically significant gains and more stable results (see Table 12). This BLEU-4 gain of about 2.4–2.5 was much larger than the difference between the upper bounds of the two SLT evaluators, i.e., 0.7–1.0 on BLEU-4, on the ground-truth poses (see Table 3), which suggests that the gain was not solely due to the stronger evaluator but also reflected improvements in the generated poses. Moreover, even under the common landmarks-only SLT evaluator, which could not read the FAUs, the improved Sign-VQ still achieved statistically significant gains in BLEU-1 and ROUGE (see Table 11). However, under the landmarks-only SLT evaluator, BLEU-4 increased from 8.37 to 8.85 but the improvement was not statistically significant (). These findings suggest that FAU integration during training contributed to improving the landmarks generation, while the largest gains were observed when the evaluator also used the FAU channels. The experiment without facial landmarks clarified the role of the FAUs. Without the facial landmarks, the FAUs did not improve the results (see Table 13 and Table 14), whereas using the landmarks and FAUs together brought the clear gains described in the controlled comparison (see Table 12). Therefore, the FAUs can act as complementary facial information: the landmarks provide the geometry of the face, while the FAUs add explicit information about facial expressions. This would be consistent with the role of facial expressions in SL, where they can carry linguistic meaning; in DGS, for example, raised eyebrows mark yes/no questions and conditional clauses, and furrowed eyebrows mark content WH questions [63].
Finally, the direct facial evaluation shows that this benefit is visible in the generated faces. The improved Sign-VQ generated noticeably more facial movement than the model without FAUs (see Table 15), and its generated FAUs were closer to the real ones than a constant face for all 18 AUs (see Table 16), especially for the most active AUs such as the brow lowerer (AU4), which marks content WH questions in DGS [63]. These findings suggest that incorporating FAUs increased facial movement in the generated sequences and brought the generated FAU values closer to the corresponding ground-truth values. However, these measures do not establish whether the generated expressions appear natural to signers or convey the intended linguistic meaning (see Section 4.4.6).
4.5.2. Effect of the Translation Model Configuration
The FAUs added 18 channels to each frame, and the original Sign-VQ baseline translation model was not able to benefit from them. With the baseline one-layer translation model, using the PHOENIX14T-FAU dataset did not improve the results with either pose codebook model (see Table 7 and Table 8). With the GitHub pose codebook model [41], for example, the development BLEU-4 score was 7.52 with the FAUs and 8.02 without them. Increasing the capacity of the translation model, i.e., the number of layers, the hidden, embedding and feed-forward sizes, and the number of attention heads, raised the development BLEU-4 score on the PHOENIX14T-FAU dataset from 7.52 to 9.29, and changing the mode of the learning-rate scheduler (from min to max) further raised it to 10.20 (see Table 9). This indicates that a larger translation model was needed to exploit additional facial information and its relations with the manual features. Thus, the two contributions were complementary: the configuration changes gave the model the capacity to use the extended representation, and the FAUs provided the additional facial information that, even under the same configuration, improved the results over the landmarks-only control.
4.5.3. Comparison with the State of the Art
Under the same data and evaluators, the improved Sign-VQ outperformed the retrained Progressive Transformer and the Sign-VQ baseline on all metrics on the development and test splits (Table 17). With the landmarks-only SLT evaluator, it achieved a higher test BLEU-4 score of 8.85 compared with 6.76 for the Progressive Transformer and 4.11 for the Sign-VQ baseline. With the FAU-enhanced SLT evaluator, it achieved a higher BLEU-4 score of 10.91 compared with 6.86 and 5.56, respectively. The qualitative example in Figure 6 agrees with these results. The Sign-VQ baseline produced almost static poses, whereas the improved Sign-VQ reproduced the manual movements of the ground truth more closely than both other models, and its back-translation preserved the meaning of the reference sentence better than those of the other models. Across all test sentences, the improved Sign-VQ obtained a higher sentence-level ROUGE score than the landmarks-only control in 352 of the 641 sentences, compared with 240 in which it was lower.
Our framework also differs from that of [40], which predicted continuous AU intensities as part of each generated frame of a Progressive Transformer. In their results, adding the facial features lowered the back-translation scores. In contrast, our framework integrates the preprocessed FAUs into the pose representation of a gloss-free model with a pose codebook of short motion tokens, from which the generated poses are selected. Moreover, the controlled comparison showed a statistically significant improvement when the FAUs were included and each model was evaluated by its own SLT evaluator.
4.5.4. Limitations and Future Work
The study has several limitations. The experiments were limited to PHOENIX14T, and the FAUs were extracted automatically using OpenFace, so hand occlusion and detection errors may have affected the extracted values. Missing detections (as shown in Figure 4) were interpolated (using Equation (1)), which may have failed to capture rapid changes in facial activity. Also, the translation results relied on back-translation, where an SLT model translates the generated poses back into text. Therefore, the scores depended partly on the performance of the SLT evaluator itself, and they measured the meaning conveyed by the generated poses only indirectly, through the text produced by this model. In addition, the generated faces still moved less than the real faces (see Table 15), and the per-AU DTW distance compared the shape of each generated AU curve with the real one, even if the two did not occur at the same time. Hence, it showed whether similar facial movements were generated, but not whether they occurred at the right moments of the sentence. Consequently, the metrics used in this study, i.e., BLEU, ROUGE, the facial-motion ratio, and the per-AU DTW distance, did not establish how natural the generated facial expressions appear to signers or whether they convey the intended linguistic meaning. In addition, each model was trained with only three random seeds, and this small number of independent training runs limited the statistical analysis. Future work will evaluate the approach on other datasets and SLP frameworks, explore more robust FAU extraction methods, and conduct signer-based studies with DGS signers to assess the perceived expressiveness and linguistic accuracy of the generated signs.
5. Conclusions
Facial expressions are essential to SL, as they carry linguistic and semantic information. However, most existing SLP studies focus on manual features alone, and the few that include facial features do not explicitly integrate facial muscle movements (i.e., FAUs) into the pose representation nor show a clear benefit from them. This study proposes SignFAU, an SLP framework that integrates the intensities of 18 FAUs into the pose representation to improve the quality of sign generation. To achieve this, we built the PHOENIX14T-FAU dataset by extracting the FAUs from the PHOENIX14T videos and integrating them with the landmarks of the preprocessed PHOENIX14T dataset [42] after interpolation, smoothing and normalization. We also adapted the Sign-VQ framework [33] to this extended representation by increasing the capacity of its translation model.
Adding the FAUs improved the translation quality of the generated poses, raising the test BLEU-4 score from 8.37 to 10.91 (+30.4%) compared with the same model trained without FAUs when each model was evaluated by its own SLT evaluator. Under the common landmarks-only SLT evaluator, the BLEU-4 improvement was not statistically significant (from 8.37 to 8.85), unlike the improvements in BLEU-1 (from 26.95 to 28.60) and ROUGE (from 28.13 to 29.32). The improved Sign-VQ also generated about 18% more facial movement than the landmarks-only control (facial-motion ratio of 0.664 vs. 0.563), and it produced FAU values that were closer to the real FAU values (per-AU DTW distance of 3.81% compared with 6.08% for a constant average face). However, the naturalness and linguistic correctness of the generated facial expressions have not yet been evaluated by DGS signers, and this evaluation is left for future work. Moreover, the improved Sign-VQ outperformed the state-of-the-art Progressive Transformer and the Sign-VQ baseline trained on the same data, achieving a test BLEU-4 score of 8.85 (vs. 6.76 and 4.11, respectively) under the landmarks-only SLT evaluator and 10.91 (vs. 6.86 and 5.56, respectively) under the FAU-enhanced SLT evaluator.
This study was limited to PHOENIX14T, used automatically extracted FAUs, and relied on back-translation and automatic facial measures. Future work will evaluate the approach on other SL datasets and SLP frameworks, explore more robust FAU extraction methods, and conduct studies with DGS signers to assess the linguistic accuracy and naturalness of the generated facial expressions.
Author Contributions
Conceptualization, A.A., H.S. and L.A.-H.; methodology, A.A.; validation, A.A.; formal analysis, A.A.; investigation, A.A.; resources, A.A.; data curation, A.A.; writing—original draft preparation, A.A.; writing—review and editing, H.S. and L.A.-H.; visualization, A.A.; supervision, H.S. and L.A.-H.; project administration, H.S. and L.A.-H. All authors have read and agreed to the published version of the manuscript.
Funding
This research was funded by the Deanship of Scientific Research (DSR) at King Abdulaziz University, Jeddah, Saudi Arabia, under grant No. (IPP: 1143-612-2026).
Data Availability Statement
The PHOENIX14T dataset and its preprocessed landmarks used in this study are publicly available [5,42]. The PHOENIX14T-FAU dataset generated in this study is available from the corresponding author upon reasonable request.
Acknowledgments
The authors gratefully acknowledge the Deanship of Scientific Research (DSR) at King Abdulaziz University, Jeddah, Saudi Arabia, for funding this project under grant No. (IPP: 1143-612-2026) and for providing technical support.
Conflicts of Interest
The authors declare no conflicts of interest.
References
- Wang, X.; Tang, S.; Cheng, L.; Li, F.; Wang, S.; Hong, R. SignAligner: Harmonizing Complementary Pose Modalities for Coherent Sign Language Generation. arXiv 2025, arXiv:2506.11621. [Google Scholar] [CrossRef] [Scilit]
- Saunders, B.; Camgoz, N.C.; Bowden, R. Mixed SIGNals: Sign Language Production via a Mixture of Motion Primitives. In Proceedings of the IEEE/CVF International Conference on Computer Vision (ICCV), Montreal, QC, Canada, 10–17 October 2021; pp. 1899–1909. [Google Scholar] [CrossRef] [Scilit]
- Baltatzis, V.; Potamias, R.A.; Ververas, E.; Sun, G.; Deng, J.; Zafeiriou, S. Neural Sign Actors: A Diffusion Model for 3D Sign Language Production from Text. In Proceedings of the IEEE/CVF Conference on Computer Vision and Pattern Recognition (CVPR), Seattle, WA, USA, 16–22 June 2024; pp. 1985–1995. [Google Scholar] [CrossRef] [Scilit]
- World Health Organization. Deafness and Hearing Loss. 2025. Available online: https://www.who.int/news-room/fact-sheets/detail/deafness-and-hearing-loss (accessed on 1 October 2026).
- Camgoz, N.C.; Hadfield, S.; Koller, O.; Ney, H.; Bowden, R. Neural Sign Language Translation. In Proceedings of the IEEE/CVF Conference on Computer Vision and Pattern Recognition (CVPR), Salt Lake City, UT, USA, 18–22 June 2018; pp. 7784–7793. [Google Scholar] [CrossRef] [Scilit]
- Camgoz, N.C.; Koller, O.; Hadfield, S.; Bowden, R. Sign Language Transformers: Joint End-to-End Sign Language Recognition and Translation. In Proceedings of the IEEE/CVF Conference on Computer Vision and Pattern Recognition (CVPR), Seattle, WA, USA, 13–19 June 2020; pp. 10020–10030. [Google Scholar] [CrossRef] [Scilit]
- Hu, L.; Gao, L.; Liu, Z.; Feng, W. Continuous Sign Language Recognition with Correlation Network. In Proceedings of the IEEE/CVF Conference on Computer Vision and Pattern Recognition (CVPR), Vancouver, BC, Canada, 18–22 June 2023; pp. 2529–2539. [Google Scholar] [CrossRef] [Scilit]
- Wu, K.; Li, Z.; Zhao, W.; Hu, H.; Zhou, W.; Li, H. Cross-Modal Consistency Learning for Sign Language Recognition. In Proceedings of the IEEE/CVF Conference on Computer Vision and Pattern Recognition Workshops (CVPRW), Nashville, TN, USA, 11–15 June 2025; pp. 4078–4087. [Google Scholar] [CrossRef] [Scilit]
- Jang, Y.; Raajesh, H.; Momeni, L.; Varol, G.; Zisserman, A. Lost in Translation, Found in Context: Sign Language Translation with Contextual Cues. In Proceedings of the IEEE/CVF Conference on Computer Vision and Pattern Recognition (CVPR), Nashville, TN, USA, 11–15 June 2025; pp. 8742–8752. [Google Scholar] [CrossRef] [Scilit]
- Arkushin, R.S.; Moryossef, A.; Fried, O. Ham2Pose: Animating Sign Language Notation into Pose Sequences. In Proceedings of the IEEE/CVF Conference on Computer Vision and Pattern Recognition (CVPR), Vancouver, BC, Canada, 18–22 June 2023; pp. 21046–21056. [Google Scholar] [CrossRef] [Scilit]
- Traxler, C.B. The Stanford Achievement Test, 9th Edition: National Norming and Performance Standards for Deaf and Hard-of-Hearing Students. J. Deaf Stud. Deaf Educ. 2000, 5, 337–348. [Google Scholar] [CrossRef] [Scilit]
- Xie, P.; Zhang, Q.; Taiying, P.; Tang, H.; Du, Y.; Li, Z. G2P-DDM: Generating Sign Pose Sequence from Gloss Sequence with Discrete Diffusion Model. In Proceedings of the AAAI Conference on Artificial Intelligence, Vancouver, BC, Canada, 20–27 February 2024; Volume 38, pp. 6234–6242. [Google Scholar] [CrossRef] [Scilit]
- Wang, X.; Tang, S.; Song, P.; Wang, S.; Guo, D.; Hong, R. Linguistics-Vision Monotonic Consistent Network for Sign Language Production. In Proceedings of the ICASSP 2025—2025 IEEE International Conference on Acoustics, Speech and Signal Processing (ICASSP), Hyderabad, India, 6–11 April 2025; pp. 1–5. [Google Scholar] [CrossRef] [Scilit]
- İnan, M.; Zhong, Y.; Hassan, S.; Quandt, L.; Alikhani, M. Modeling Intensification for Sign Language Generation: A Computational Approach. In Proceedings of the Findings of the Association for Computational Linguistics: ACL 2022, Dublin, Ireland, 22–27 May 2022; pp. 2897–2911. [Google Scholar] [CrossRef] [Scilit]
- Tang, S.; Hong, R.; Guo, D.; Wang, M. Gloss Semantic-Enhanced Network with Online Back-Translation for Sign Language Production. In Proceedings of the 30th ACM International Conference on Multimedia (MM ’22), Lisbon, Portugal, 10–14 October 2022; pp. 5630–5638. [Google Scholar] [CrossRef] [Scilit]
- Shen, J.; Stefanov, K.; Chong, V.Y.; Soon, L.K.; Wong, K. Sign-MExD: An Expert-Infused Diffusion Model for Sign Language Production. In Proceedings of the 2025 Asia Pacific Signal and Information Processing Association Annual Summit and Conference (APSIPA ASC), Singapore, 22–24 October 2025; pp. 1200–1205. [Google Scholar] [CrossRef] [Scilit]
- Tang, S.; He, J.; Guo, D.; Wei, Y.; Li, F.; Hong, R. Sign-IDD: Iconicity Disentangled Diffusion for Sign Language Production. In Proceedings of the AAAI Conference on Artificial Intelligence, Philadelphia, PA, USA, 25 February–4 March 2025; Volume 39, pp. 7266–7274. [Google Scholar] [CrossRef] [Scilit]
- Stoll, S.; Hadfield, S.; Bowden, R. SignSynth: Data-Driven Sign Language Video Generation. In Proceedings of the Computer Vision—ECCV 2020 Workshops, Glasgow, UK, 23–28 August 2020; pp. 353–370. [Google Scholar] [CrossRef] [Scilit]
- Tang, S.; Xue, F.; Wu, J.; Wang, S.; Hong, R. Gloss-Driven Conditional Diffusion Models for Sign Language Production. ACM Trans. Multimed. Comput. Commun. Appl. 2025, 21, 1–17. [Google Scholar] [CrossRef] [Scilit]
- Hwang, E.J.; Cho, S.; Lee, H.; Yoon, Y.; Park, J.C. A Spatio-Temporal Representation Learning as an Alternative to Traditional Glosses in Sign Language Translation and Production. In Proceedings of the 2025 IEEE/CVF Winter Conference on Applications of Computer Vision (WACV), Tucson, AZ, USA, 26 February–6 March 2025; pp. 3352–3362. [Google Scholar] [CrossRef] [Scilit]
- Zelinka, J.; Kanis, J. Neural Sign Language Synthesis: Words Are Our Glosses. In Proceedings of the IEEE/CVF Winter Conference on Applications of Computer Vision (WACV), Snowmass Village, CO, USA, 1–5 March 2020; pp. 3384–3392. [Google Scholar] [CrossRef] [Scilit]
- Stoll, S.; Camgöz, N.C.; Hadfield, S.; Bowden, R. Text2Sign: Towards Sign Language Production Using Neural Machine Translation and Generative Adversarial Networks. Int. J. Comput. Vis. 2020, 128, 891–908. [Google Scholar] [CrossRef] [Scilit]
- Natarajan, B.; Rajalakshmi, E.; Elakkiya, R.; Kotecha, K.; Abraham, A.; Gabralla, L.A.; Subramaniyaswamy, V. Development of an End-to-End Deep Learning Framework for Sign Language Recognition, Translation, and Video Generation. IEEE Access 2022, 10, 104358–104374. [Google Scholar] [CrossRef] [Scilit]
- Saunders, B.; Camgoz, N.C.; Bowden, R. Progressive Transformers for End-to-End Sign Language Production. In Proceedings of the Computer Vision—ECCV 2020, Glasgow, UK, 23–28 August 2020; Volume 12356, Lecture Notes in Computer Science. pp. 687–705. [Google Scholar] [CrossRef] [Scilit]
- Fang, S.; Chen, C.; Wang, L.; Zheng, C.; Sui, C.; Tian, Y. SignLLM: Sign Language Production Large Language Models. In Proceedings of the 2025 IEEE/CVF International Conference on Computer Vision Workshops (ICCVW), Honolulu, HI, USA, 19–20 October 2025; pp. 6681–6693. [Google Scholar] [CrossRef] [Scilit]
- Ananthanarayana, T.; Chaudhary, L.; Nwogu, I. SignNet: Single Channel Sign Generation Using Metric Embedded Learning. In Proceedings of the 2023 IEEE 17th International Conference on Automatic Face and Gesture Recognition (FG), Waikoloa Beach, HI, USA, 5–8 January 2023; pp. 1–7. [Google Scholar] [CrossRef] [Scilit]
- Saunders, B.; Camgoz, N.C.; Bowden, R. Signing at Scale: Learning to Co-Articulate Signs for Large-Scale Photo-Realistic Sign Language Production. In Proceedings of the IEEE/CVF Conference on Computer Vision and Pattern Recognition (CVPR), New Orleans, LA, USA, 18–24 June 2022; pp. 5131–5141. [Google Scholar] [CrossRef] [Scilit]
- Hwang, E.; Kim, J.H.; Park, J.C. Non-Autoregressive Sign Language Production with Gaussian Space. In Proceedings of the British Machine Vision Conference 2021, Online, 22–25 November 2021. [Google Scholar] [CrossRef] [Scilit]
- Saunders, B.; Camgöz, N.C.; Bowden, R. Adversarial Training for Multi-Channel Sign Language Production. In Proceedings of the British Machine Vision Conference 2020, Online, 7–10 September 2020. [Google Scholar] [CrossRef] [Scilit]
- Feng, L.; Wang, L.; Hu, K.; Kong, D.; Wang, Z. Text2Sign Diffusion: A Generative Approach for Gloss-Free Sign Language Production. In Proceedings of the 2025 International Conference on Digital Image Computing: Techniques and Applications (DICTA), Adelaide, Australia, 3–5 December 2025; pp. 1–8. [Google Scholar] [CrossRef] [Scilit]
- Zhao, Y.; Zhu, J.; Liu, Y.; Chen, W.; Yang, Y.; Peng, K. EASL: Multi-Emotion Guided Semantic Disentanglement for Expressive Sign Language Generation. arXiv 2025, arXiv:2511.22135. [Google Scholar] [CrossRef] [Scilit]
- Saunders, B.; Camgoz, N.C.; Bowden, R. Continuous 3D Multi-Channel Sign Language Production via Progressive Transformers and Mixture Density Networks. Int. J. Comput. Vis. 2021, 129, 2113–2135. [Google Scholar] [CrossRef] [Scilit]
- Walsh, H.; Ravanshad, A.; Rahmani, M.; Bowden, R. A Data-Driven Representation for Sign Language Production. In Proceedings of the 2024 IEEE 18th International Conference on Automatic Face and Gesture Recognition (FG), Istanbul, Türkiye, 27–31 May 2024; pp. 1–10. [Google Scholar] [CrossRef] [Scilit]
- Kanakanti, M.; Singh, S.; Shrivastava, M. MultiFacet: A Multi-Tasking Framework for Speech-to-Sign Language Generation. In Proceedings of the Companion Publication of the 25th International Conference on Multimodal Interaction (ICMI ’23), Paris, France, 9–13 October 2023; pp. 205–213. [Google Scholar] [CrossRef] [Scilit]
- Bouazizi, M.; Feghoul, K.; Wang, S.; Yin, Y.; Ohtsuki, T. A Non-Invasive Approach for Facial Action Unit Extraction and Its Application in Pain Detection. Bioengineering 2025, 12, 195. [Google Scholar] [CrossRef] [Scilit]
- Fu, C.; Qian, F.; Su, Y.; Su, K.; Song, S.; Niu, M.; Shi, J.; Liu, Z.; Liu, C.; Ishi, C.T.; et al. Facial Action Units Guided Graph Representation Learning for Multimodal Depression Detection. Neurocomputing 2025, 619, 129106. [Google Scholar] [CrossRef] [Scilit]
- Sharma, D.; Singh, J.; Sehra, S.S.; Sehra, S.K. Demystifying Mental Health by Decoding Facial Action Unit Sequences. Big Data Cogn. Comput. 2024, 8, 78. [Google Scholar] [CrossRef] [Scilit]
- Wang, J.; Wu, B.; Liu, L.; Liu, Q. FauForensics: Boosting Audio-Visual Deepfake Detection with Facial Action Units. IEEE Trans. Inf. Forensics Secur. 2026, 21, 3353–3365. [Google Scholar] [CrossRef] [Scilit]
- Ekman, P.; Friesen, W.V. Facial Action Coding System; Consulting Psychologists Press: Palo Alto, CA, USA, 1978. [Google Scholar]
- Viegas, C.; Inan, M.; Quandt, L.; Alikhani, M. Including Facial Expressions in Contextual Embeddings for Sign Language Generation. In Proceedings of the 12th Joint Conference on Lexical and Computational Semantics (*SEM 2023), Toronto, ON, Canada, 13–14 July 2023; pp. 1–10. [Google Scholar] [CrossRef] [Scilit]
- Walsh, H. Sign-VQ-Transformer: Two-Stage Pipeline for Sign Language Production. GitHub Repository. 2024. Available online: https://github.com/walsharry/Sign-VQ-Transformer (accessed on 10 October 2026).
- Walsh, H.; Fish, E.; Sincan, O.M.; Lakhal, M.I.; Bowden, R.; Fox, N.; Woll, B.; Wu, K.; Li, Z.; Zhao, W.; et al. SLRTP2025 Sign Language Production Challenge: Methodology, Results and Future Work. In Proceedings of the Computer Vision and Pattern Recognition Conference (CVPR) Workshops, Nashville, TN, USA, 11–12 June 2025; pp. 4109–4119. [Google Scholar] [CrossRef] [Scilit]
- Li, H.; Li, L.; Wang, H.; Zhang, W.; Ren, P. Large Foundation Model Empowered Region-Aware Underwater Image Captioning. Int. J. Comput. Vis. 2026, 134, 66. [Google Scholar] [CrossRef] [Scilit]
- Li, H.; Li, L.; Wang, H.; Zhang, W.; Liu, J.; Ren, P. Joint Underwater Image Enhancement and Captioning Through Multisupervised Chained Task Learning. IEEE Trans. Geosci. Remote Sens. 2026, 64, 4209622. [Google Scholar] [CrossRef] [Scilit]
- Baltrušaitis, T.; Zadeh, A.; Lim, Y.C.; Morency, L.P. OpenFace 2.0: Facial Behavior Analysis Toolkit. In Proceedings of the 2018 13th IEEE International Conference on Automatic Face & Gesture Recognition (FG 2018), Xi’an, China, 15–19 May 2018; pp. 59–66. [Google Scholar] [CrossRef] [Scilit]
- Baltrušaitis, T.; Robinson, P.; Morency, L.P. OpenFace: An Open Source Facial Behavior Analysis Toolkit. In Proceedings of the 2016 IEEE Winter Conference on Applications of Computer Vision (WACV), Lake Placid, NY, USA, 7–10 March 2016; pp. 1–10. [Google Scholar] [CrossRef] [Scilit]
- Jacob, G.M.; Stenger, B. Facial Action Unit Detection with Transformers. In Proceedings of the IEEE/CVF Conference on Computer Vision and Pattern Recognition (CVPR), Nashville, TN, USA, 20–25 June 2021; pp. 7676–7685. [Google Scholar] [CrossRef] [Scilit]
- Cheong, J.H.; Jolly, E.; Xie, T.; Byrne, S.; Kenney, M.; Chang, L.J. Py-Feat: Python Facial Expression Analysis Toolbox. Affect. Sci. 2023, 4, 781–796. [Google Scholar] [CrossRef] [Scilit]
- Zhang, K.; Zhang, Z.; Li, Z.; Qiao, Y. Joint Face Detection and Alignment Using Multitask Cascaded Convolutional Networks. IEEE Signal Process. Lett. 2016, 23, 1499–1503. [Google Scholar] [CrossRef] [Scilit]
- Burden, R.L.; Faires, J.D. Numerical Analysis, 9th ed.; Brooks/Cole, Cengage Learning: Boston, MA, USA, 2011. [Google Scholar]
- Szeliski, R. Computer Vision: Algorithms and Applications; Springer: London, UK, 2011. [Google Scholar] [CrossRef] [Scilit]
- LeCun, Y.; Bottou, L.; Orr, G.B.; M“uller, K.R. Efficient BackProp. In Neural Networks: Tricks of the Trade; Orr, G.B., Müller, K.R., Eds.; Springer: Berlin/Heidelberg, Germany, 1998; Volume 1524, Lecture Notes in Computer Science; pp. 9–50. [Google Scholar] [CrossRef] [Scilit]
- Wiesler, S.; Ney, H. A Convergence Analysis of Log-Linear Training. In Proceedings of the Advances in Neural Information Processing Systems 24 (NIPS 2011), Granada, Spain, 12–14 December 2011; pp. 657–665. [Google Scholar]
- Vali, M.H.; Bäckström, T. NSVQ: Noise Substitution in Vector Quantization for Machine Learning. IEEE Access 2022, 10, 13598–13610. [Google Scholar] [CrossRef] [Scilit]
- Koehn, P. Statistical Significance Tests for Machine Translation Evaluation. In Proceedings of the 2004 Conference on Empirical Methods in Natural Language Processing, Barcelona, Spain, 25–26 July 2004; pp. 388–395. [Google Scholar]
- Wang, Z.; Bovik, A.C. Mean Squared Error: Love It or Leave It? A New Look at Signal Fidelity Measures. IEEE Signal Process. Mag. 2009, 26, 98–117. [Google Scholar] [CrossRef] [Scilit]
- Papineni, K.; Roukos, S.; Ward, T.; Zhu, W.J. BLEU: A Method for Automatic Evaluation of Machine Translation. In Proceedings of the 40th Annual Meeting of the Association for Computational Linguistics, Philadelphia, PA, USA, 7–12 July 2002; pp. 311–318. [Google Scholar] [CrossRef] [Scilit]
- Post, M. A Call for Clarity in Reporting BLEU Scores. In Proceedings of the Third Conference on Machine Translation: Research Papers, Brussels, Belgium, 31 October–1 November 2018; pp. 186–191. [Google Scholar] [CrossRef] [Scilit]
- Lin, C.Y. ROUGE: A Package for Automatic Evaluation of Summaries. In Proceedings of the Text Summarization Branches Out, Barcelona, Spain, 25–26 July 2004; pp. 74–81. [Google Scholar]
- Berndt, D.J.; Clifford, J. Using Dynamic Time Warping to Find Patterns in Time Series. In Proceedings of the AAAI Workshop on Knowledge Discovery in Databases (KDD-94), Seattle, WA, USA, 31 July–1 August 1994; Number WS-94-03 in AAAI Technical Report. pp. 359–370. [Google Scholar]
- Sakoe, H.; Chiba, S. Dynamic Programming Algorithm Optimization for Spoken Word Recognition. IEEE Trans. Acoust. Speech Signal Process. 1978, 26, 43–49. [Google Scholar] [CrossRef] [Scilit]
- Salvador, S.; Chan, P. Toward Accurate Dynamic Time Warping in Linear Time and Space. Intell. Data Anal. 2007, 11, 561–580. [Google Scholar] [CrossRef] [Scilit]
- Proske, S.; Nuhbalaoglu, D.; Herrmann, A.; Hosemann, J.; Steinbach, M. (Eds.) A Grammar of German Sign Language (DGS), 1st ed.; SIGN-HUB Sign Language Grammars; SIGN-HUB: Barcelona, Spain, 2020. [Google Scholar] [CrossRef]
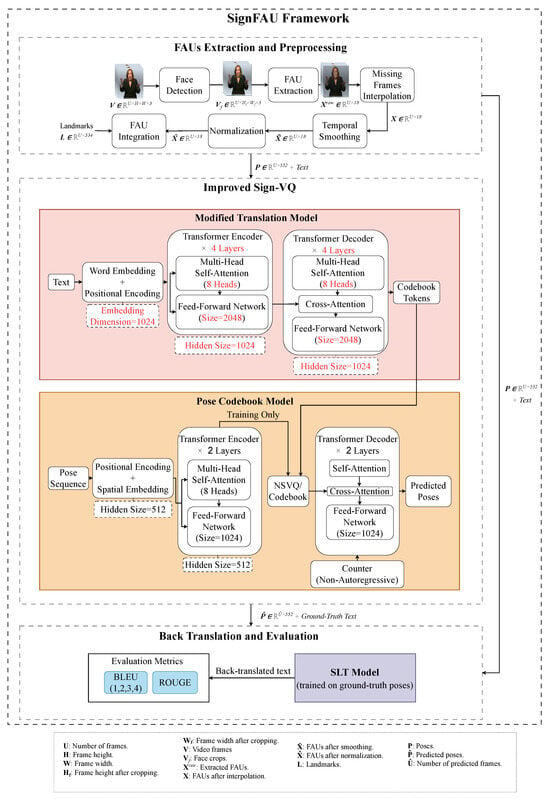
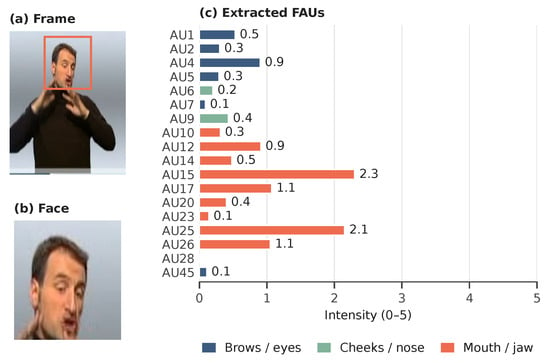
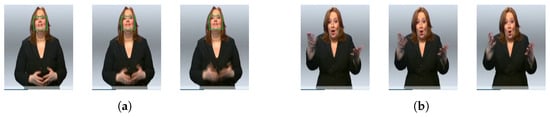
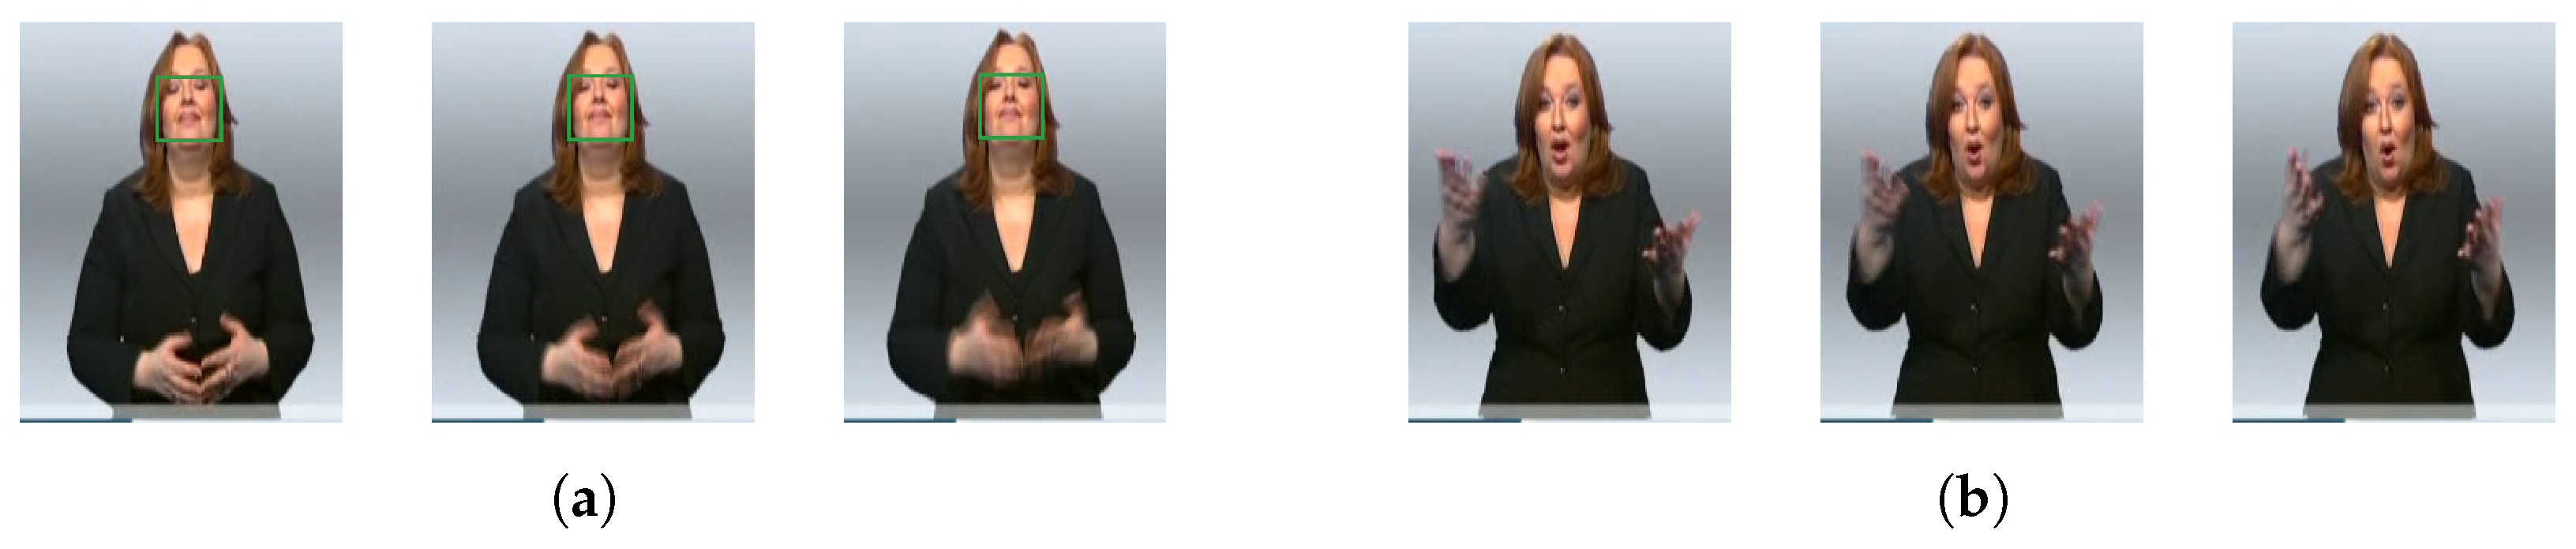
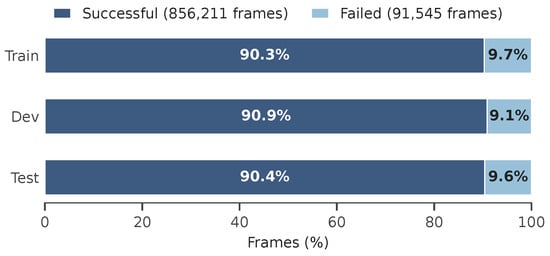
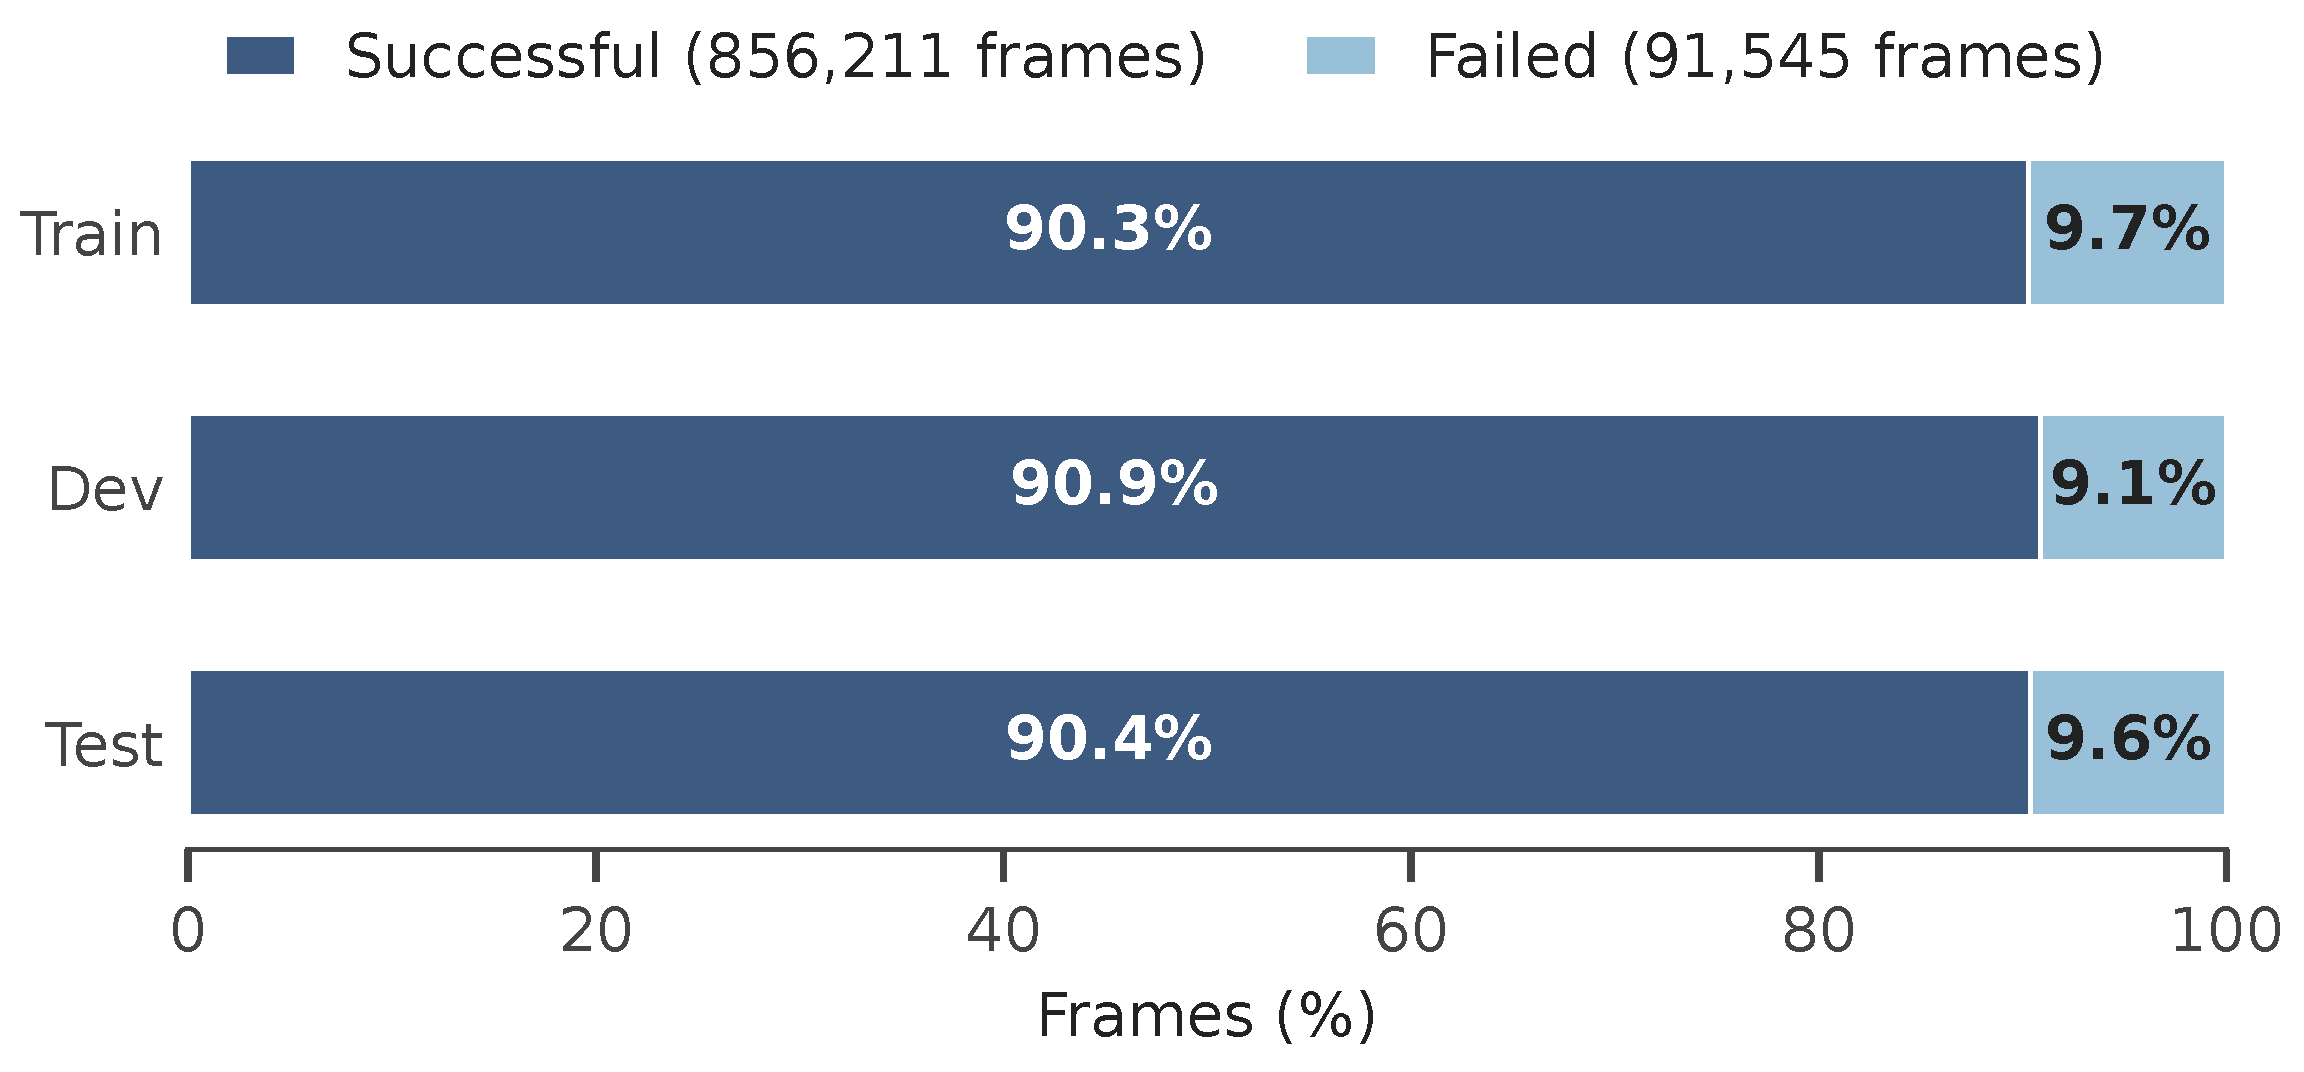
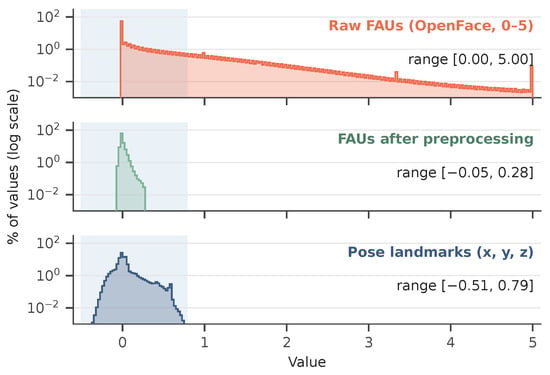
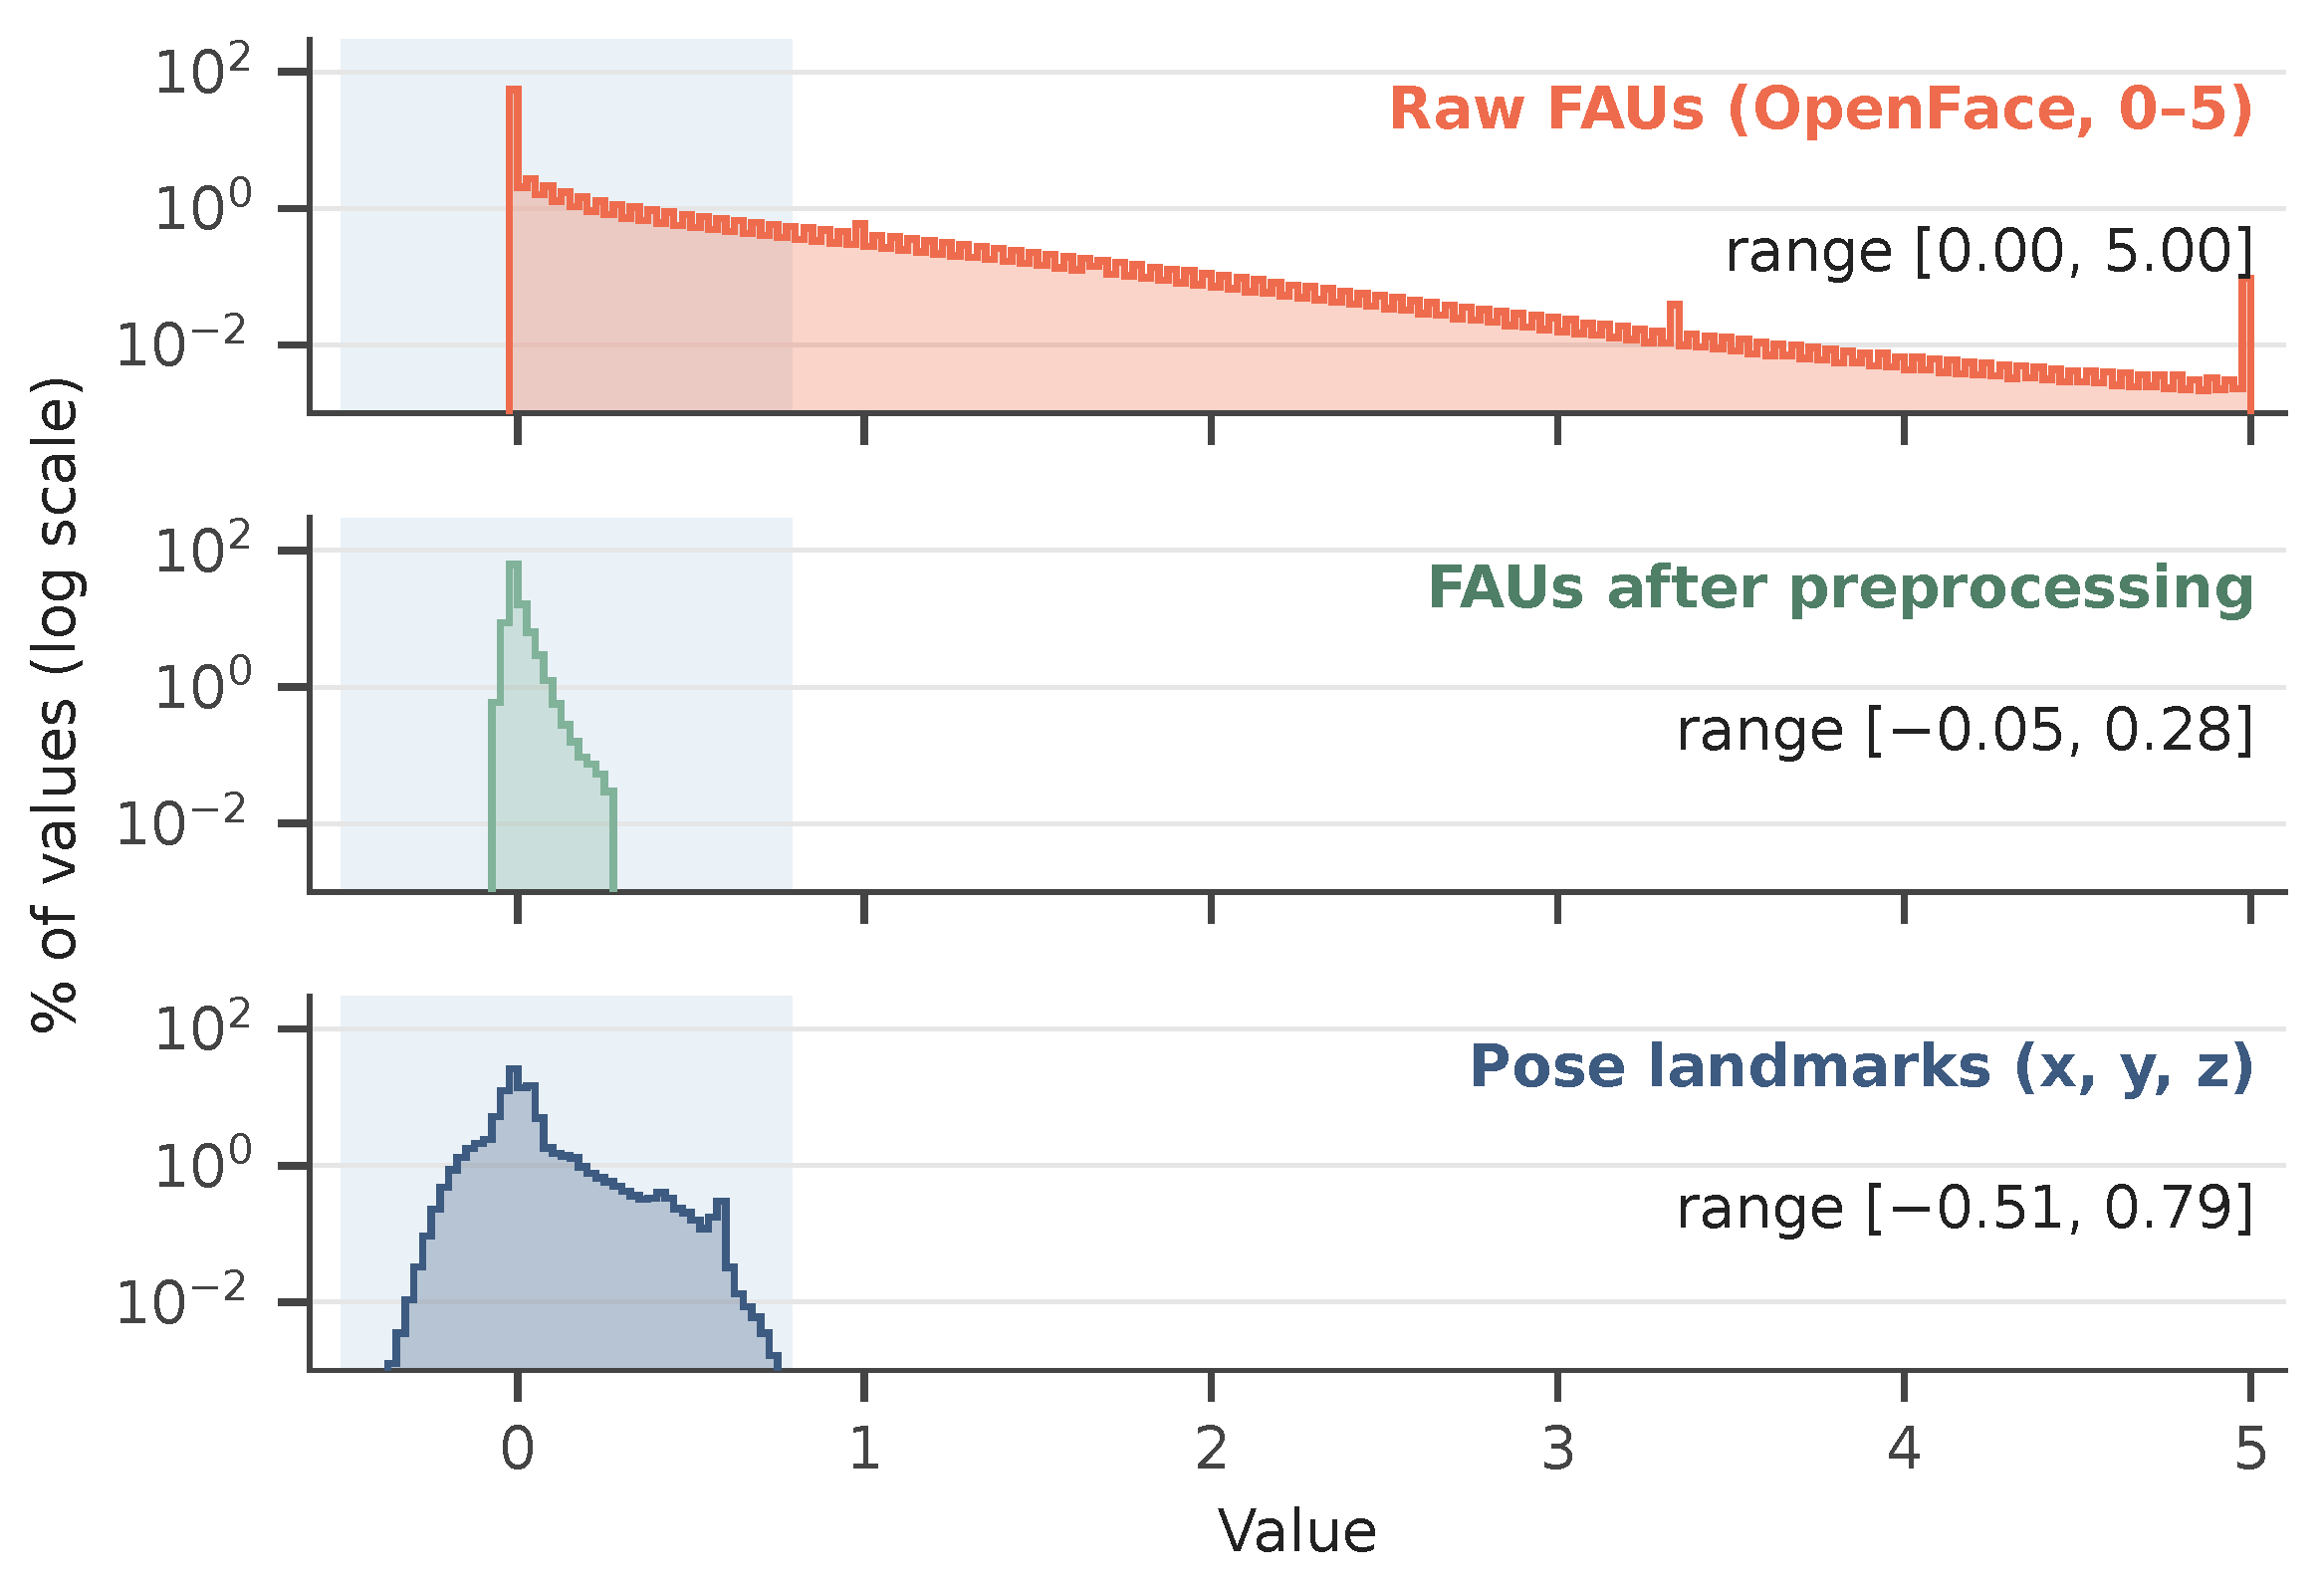
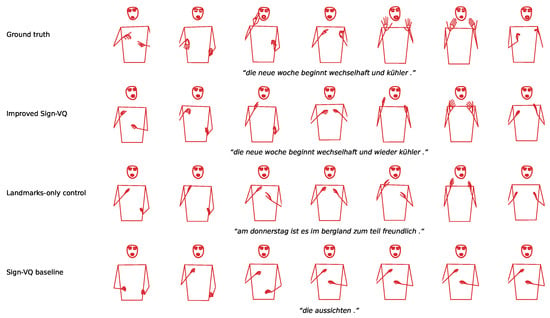
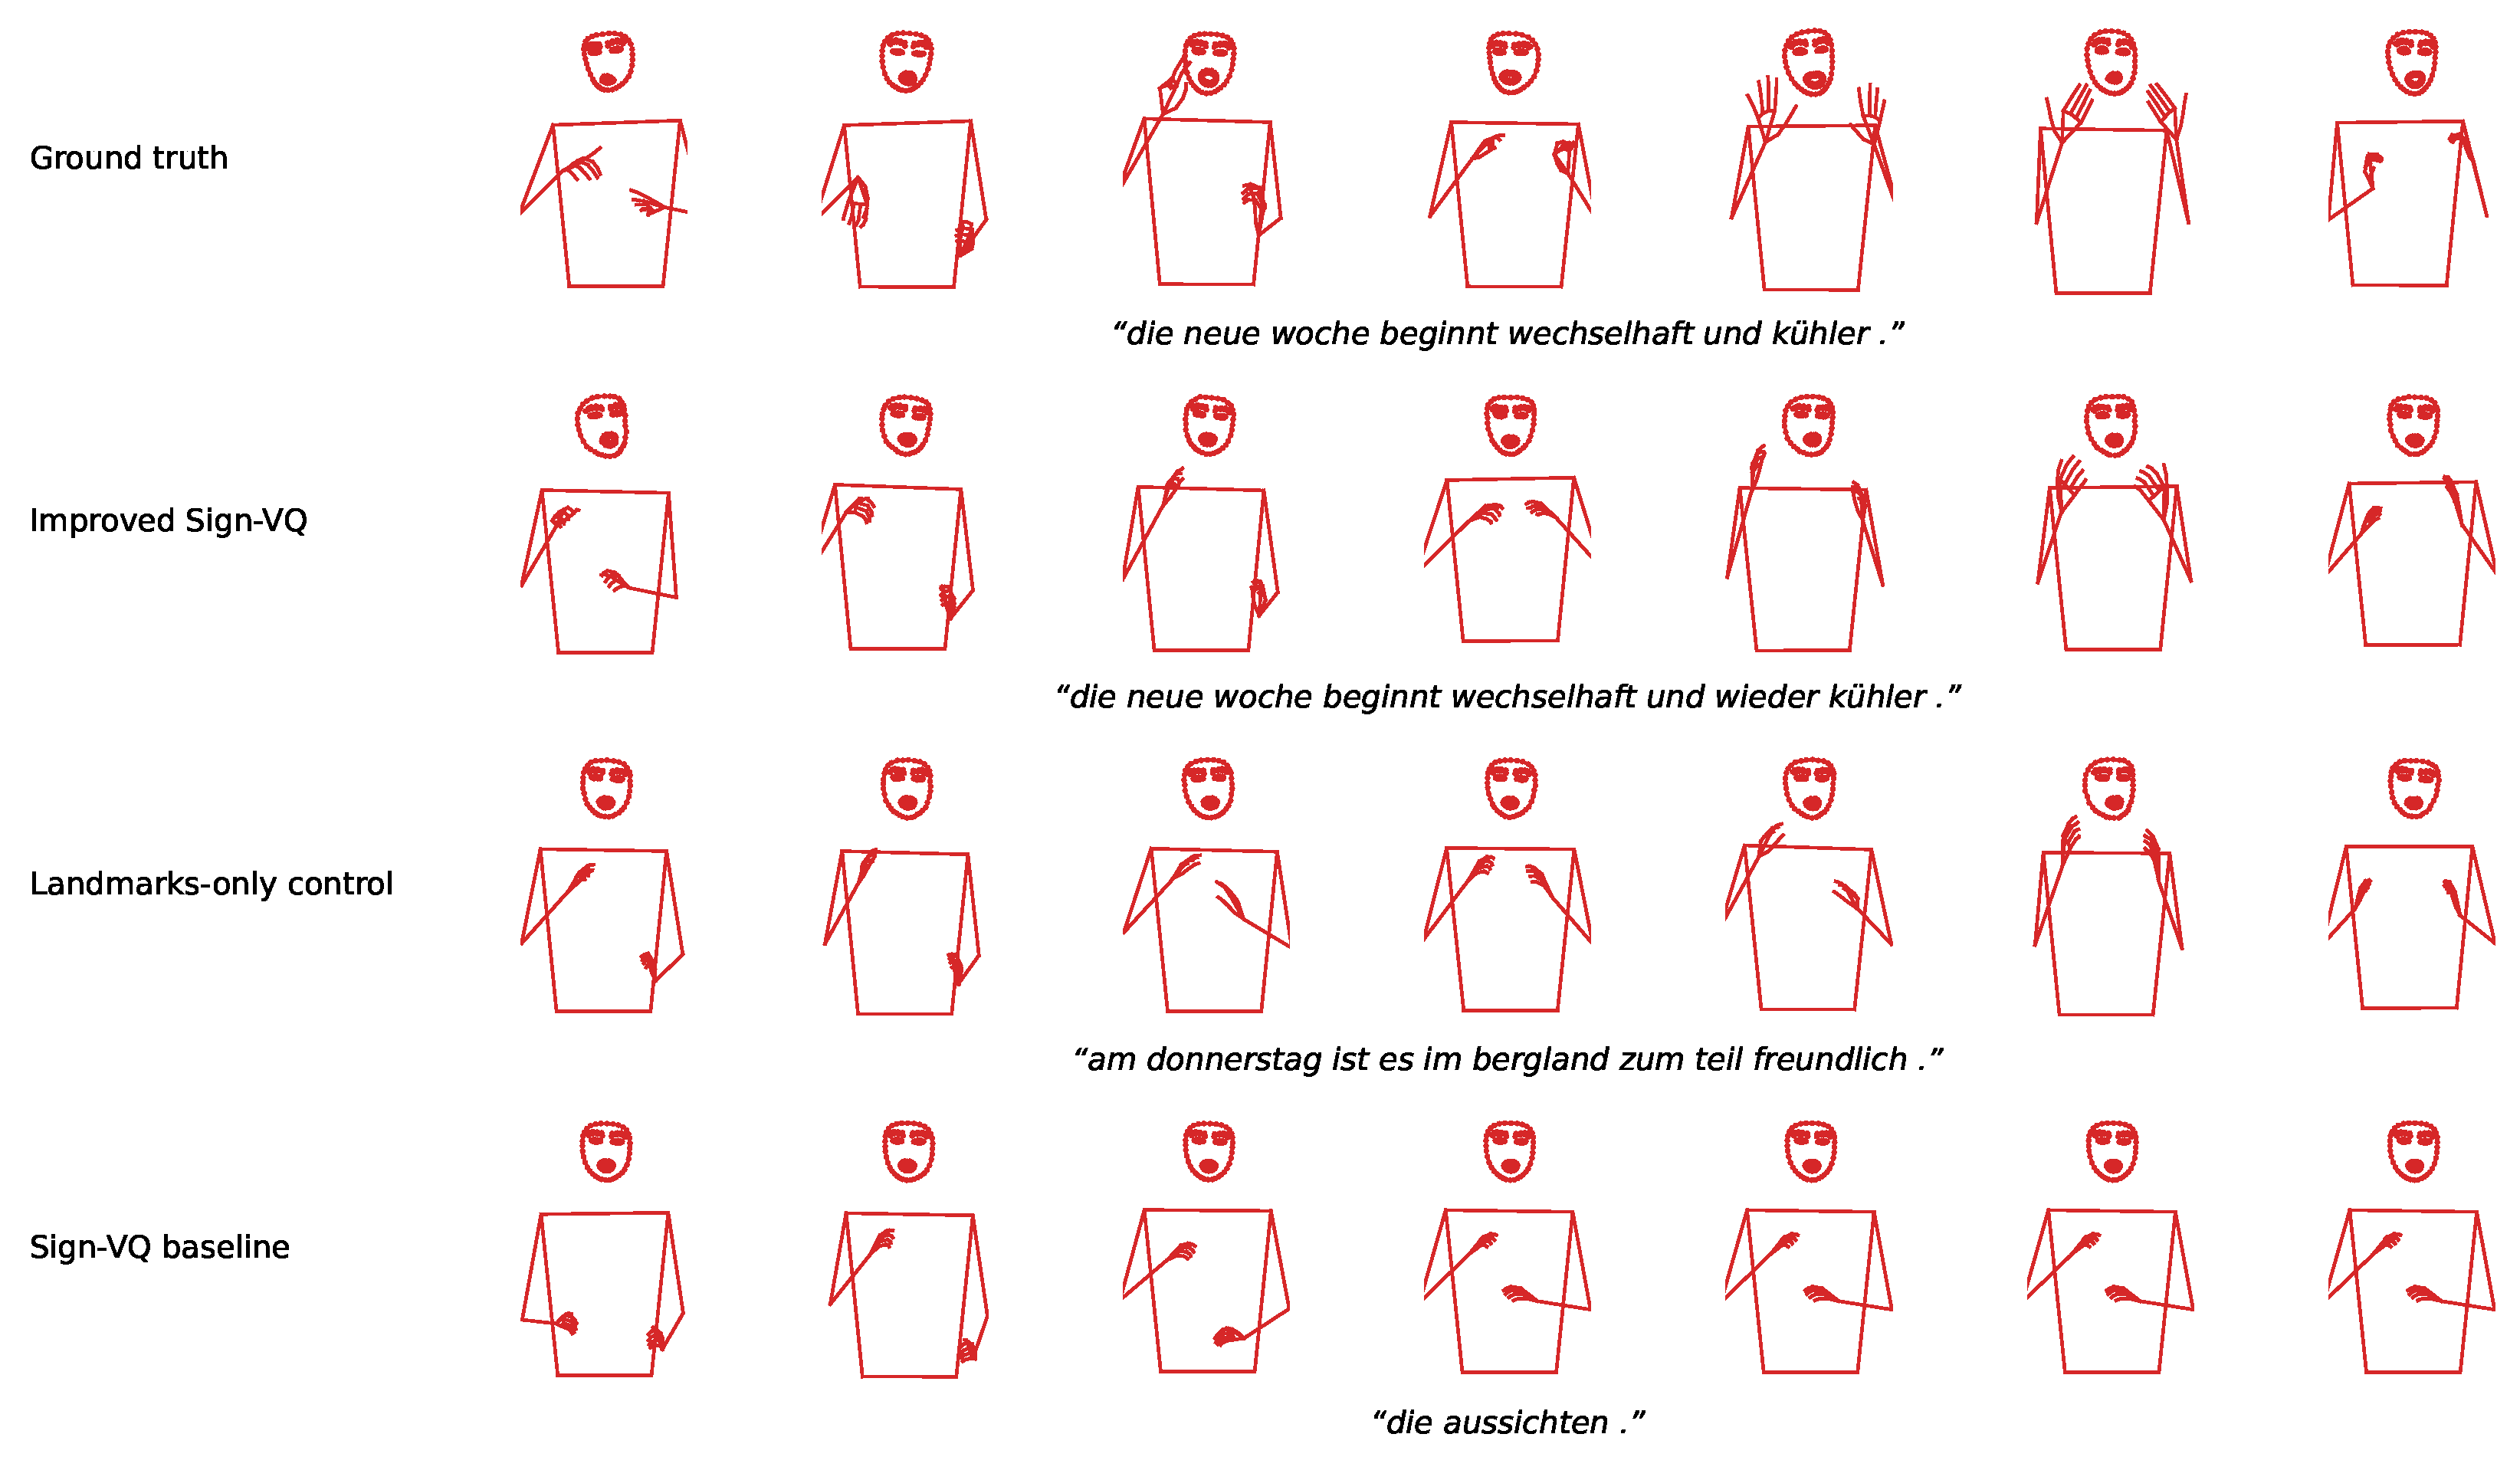

Disclaimer/Publisher’s Note: The statements, opinions and data contained in all publications are solely those of the individual author(s) and contributor(s) and not of MDPI and/or the editor(s). MDPI and/or the editor(s) disclaim responsibility for any injury to people or property resulting from any ideas, methods, instructions or products referred to in the content. |
© 2026 by the authors. Licensee MDPI, Basel, Switzerland. This article is an open access article distributed under the terms and conditions of the Creative Commons Attribution (CC BY) license.