


Abstract
The accurate assessment of water inrush risks is crucial for tunnel safety in water-rich karst areas. This study introduces a risk assessment method based on a two-dimensional cloud model to address the associated uncertainties. A comprehensive risk indicator system is established, covering five principal factors: stratigraphic lithology, geological structure, topography, natural geography, and construction activities. The weights of these indicators are determined using an integrated Fuzzy Analytic Hierarchy Process and Entropy Weight Method. A two-dimensional cloud model is constructed, incorporating the dual dimensions of risk probability and loss severity. The risk level is then determined by analyzing the distribution of synthesized cloud droplets across predefined risk zones. Applied to the Andangnong Tunnel project, this methodology evaluates the water inrush risk as greater risk (Level II), a result consistent with the project’s dedicated safety assessment. Following the targeted treatment of key karst caves (Y5-2 and Y2-2), the risk level was successfully reduced to low risk (Level IV). This approach provides a scientific basis for risk management in similar geotechnical engineering contexts.
1. Introduction
The advancement of the Western Development and Belt and Road initiatives has led to a significant increase in tunnel construction within geologically complex western mountainous regions and water-rich karst areas. These regions are characterized by intricate geological conditions and well-developed karst landscapes, posing escalating challenges related to water inrush disasters during tunnel excavation. Statistics from the first decade of the 21st century indicate that geological hazards induced by water and mud inrushes accounted for 77% of safety incidents of tunnel engineering [1], resulting not only in severe casualties and economic losses but also significantly impacting project schedules and the environment. In water-rich dissolution strata, the development of karst features exhibits pronounced concealment and randomness, making the identification of water inrush channels particularly challenging. Traditional investigation methods struggle to accurately delineate their spatial distribution, substantially increasing the difficulty and uncertainty of risk assessment. Therefore, conducting scientific risk assessment for tunnel construction and formulating corresponding risk mitigation strategies is of paramount importance for enhancing safety in karst tunnel construction and for safeguarding societal stability, life, and property.
To scientifically and rationally assess the risk of tunnel water inrush disasters, numerous researchers have conducted a series of valuable studies, which can be broadly categorized into theoretical research, numerical simulation, and evaluation analysis methods [2]. In theoretical research, Chen et al. [3] and Zhang et al. [4] explored the mechanism underlying water inrush disaster induced by stratum collapse based on catastrophe theory, providing a theoretical foundation for risk assessment. Wang et al. [5] conducted physical information monitoring using their self-developed tunnel water surge testing system, providing theoretical reference for disaster prediction and prevention. Li et al. [6] employed rock mass and fracture mechanics theories to analyze the water–rock interaction mechanism in drill-and-blast tunnels, establishing a method for calculating safe thickness. Nie et al. [7] proposed a Full-decay Induced Polarization (FDIP) inversion method constrained by physical laws, enabling precise identification and assessment of tunnel water inrush risks. Han et al. [8] developed a physics-inspired dynamic boosting framework to accurately and efficiently capture the evolution characteristics of water inrush within fault fracture zones of tunnels. However, while theoretical research based on physical and mathematical models can predict water inrush mechanisms [9], these theories and models often rely on idealized assumptions, making it difficult to fully and comprehensively assess the overall risk during tunnel construction. In numerical simulation, Zhu et al. [10] established a mass-fluid coupling model using 3DEC to investigate the evolution of water inrush in weakly cemented redbed tunnels with abundant water. Li et al. [11] employed a general particle dynamics (NGPD) framework to simulate the water outburst process, providing a numerical analysis tool for disaster prevention and control. Xie et al. [12] conducted a comprehensive study to investigate the dynamic evolution of water inrushes within tunnels that intersect water-rich fault zones, through the combined FDM-DEM method. Lan et al. [13] analyzed prevention and control measures under different construction scenarios through numerical simulation. Fan et al. [14] simulated water inrush disasters in tunnels through faults under different thicknesses of water-resistant rock masses using DDA-SPH, offering theoretical support for tunnel water inrush prevention. However, numerical simulation methods often simplify the actual environmental factors of the tunnel, which can affect the accuracy of risk assessment. In evaluation analysis, Wu et al. [15] performed an accurate evaluation of the risk levels associated with water inrush using an enhanced cloud model, combined with evidence reasoning and a risk assessment method based on Monte Carlo simulation. Kong et al. [16] presented an innovative FAHP-I-TOPSIS for risk assessment, aiming to obtain more precise evaluations. However, most methods for evaluating risk assessment rely on a singular dimension [17] or are predominantly subjective, depending on the expertise of the assessors [18]. This reliance on expert experience, coupled with the absence of objective analysis, complicates the comprehensive and objective evaluation of the risks associated with tunnel water inrush disasters. More recently, several studies have introduced cloud models and combined weighting techniques to address uncertainty. For instance, Duan et al. [19] proposed an enhanced weighted cloud model for water and mud inrush evaluation. Sun et al. [20] developed an improved two-dimensional cloud model for shield tunnel risk assessment in karst areas. Nevertheless, the combined weighting methods are often oversimplified and the determination of risk level boundaries often relies on empirical or fixed intervals. Additionally, most current methods assess the risk only at a single construction stage and do not validate the model’s applicability through post-treatment re-assessment, which limits their value for practical risk control and decision making.
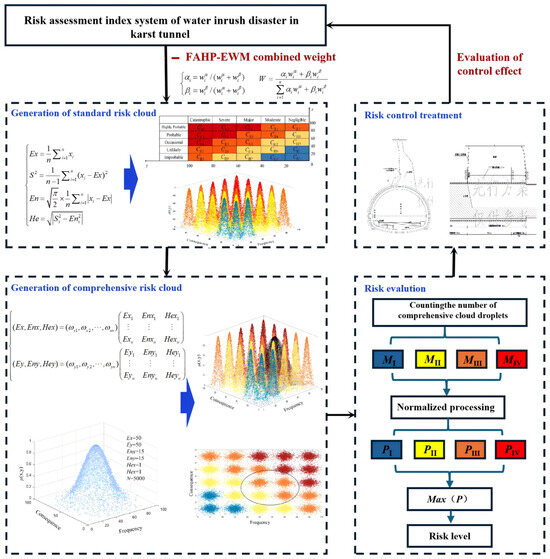
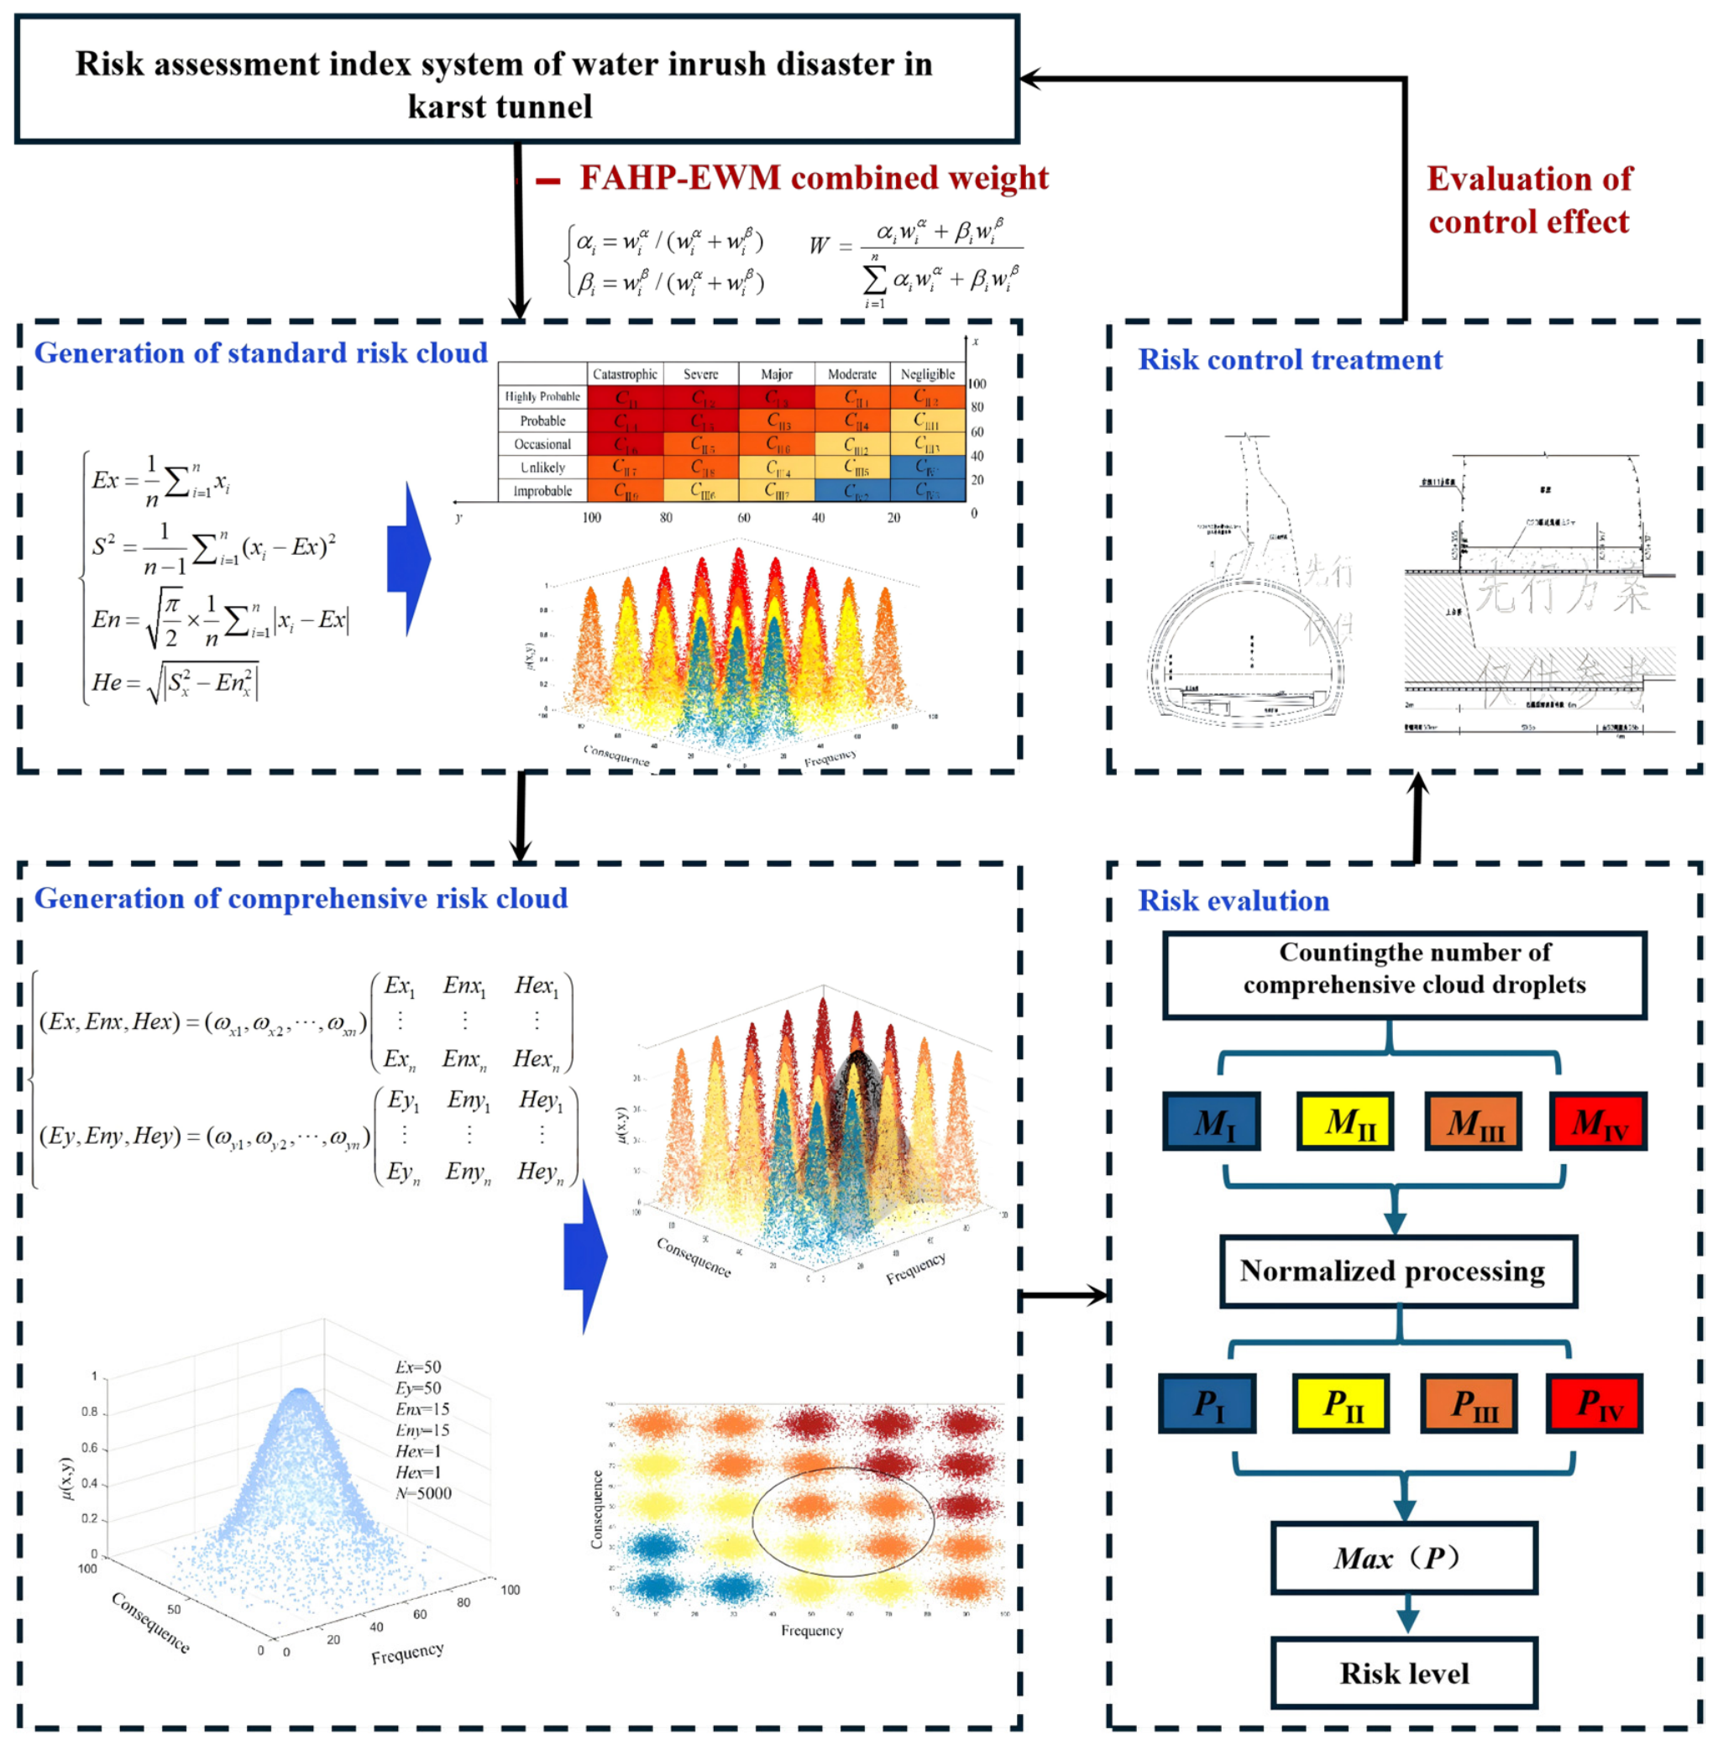
To address these limitations and facilitate a more scientific and accurate assessment of tunnel water inrush risk, this study adopted a combined weighting-improved two-dimensional cloud model method. This approach transforms and quantifies the uncertainty and complexity associated with tunnel construction by considering five critical risk factors, including stratigraphic lithology, geological structure, topography, natural geographical conditions, and human construction activities. Firstly, the initial assessment of the subjective weights for the risk indicators is determined using the Fuzzy Analytic Hierarchy Process (FAHP), while the objective weights are evaluated through the Entropy Weight Method (EWM). Subsequently, a matrix method is employed for combined weighting, integrating both subjective judgment and objective information to enhance the comprehensiveness and accuracy of the risk assessment. Then, the assessing algorithm associated with the 2D cloud model facilitates a quantitative assessment of risk uncertainty, successfully illustrating the risk levels linked to water inrush disasters in tunnels. Ultimately, the assessing algorithm is adopted to evaluate the risk of water inrush disaster in the Andangnong Tunnel of the Congjiang–Rongan–Lipu Highway before and after treatment. The flowchart is shown in Figure 1.
Figure 1.
Water inrush risk assessment process of karst tunnel (Red indicates high risk, orange indicates medium risk, yellow indicates general risk, and blue indicates low risk).
2. Materials and Methods
2.1. Engineering Study Object
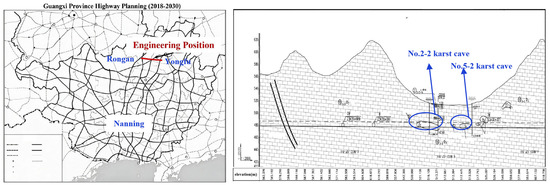
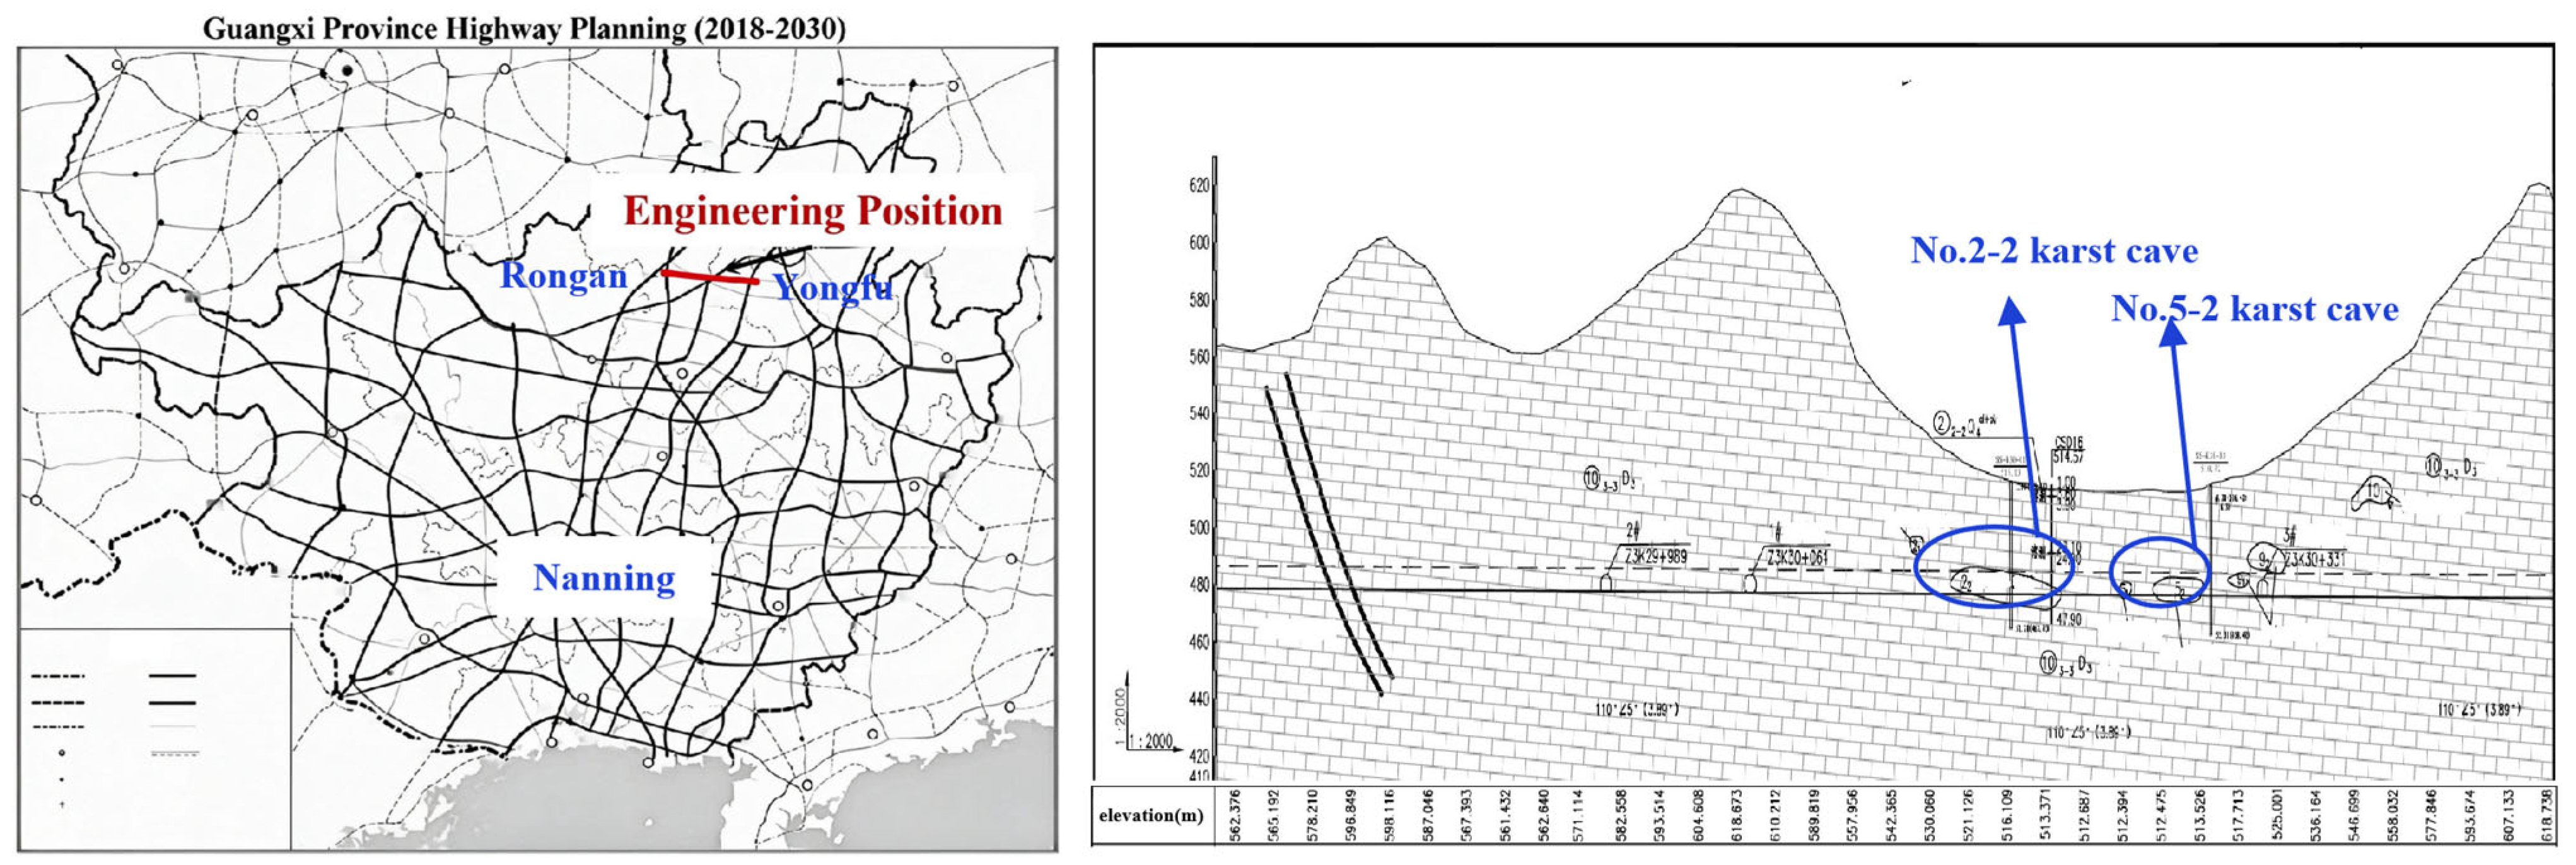
Notably, a statistical database of 160 karst tunnels in China reveals that approximately 45% of water and mud inrush disasters occur in limestone strata with well-developed karst features, while over 70% of tunnel projects in Southwest China pass through carbonate rock areas. The Andangnong Tunnel, situated in the Upper Devonian limestone of the Nanling karst belt, shares these dominant geological characteristics, joint fissure development, karst cave distribution, and significant groundwater, making it broadly representative of karst tunnels in southwestern China. This study focuses on the Andangnong Tunnel, part of the Congjiang–Rongan–Lipu Highway, specifically the section from Rongan through Yongfu to Yangshuo. The tunnel spans approximately 1305 m and is characterized by complex engineering geological conditions and significant regional geological features. The primary strata encountered include Quaternary residual-slope deposits of silty clay and Upper Devonian limestone. The limestone exhibits well-developed joint fissures and is significantly affected by karstification, with numerous locations containing karst caves, dissolution fissures, and fracture zones. Among them, the 2-2 karst fissure zone in the Y2 karst area is predominantly distributed in the tunnel body section, with partial encroachment into the tunnel crown and invert. This karst cave has dimensions of approximately 34–57 m (length) × 48 m (width) × 8–11 m (height). The 5-2 karst fissure zone in the Y5 karst area has dimensions of approximately 20–26 m (length) × 57 m (width) × 7 m (height), primarily located in the tunnel body section and base. The forementioned areas are susceptible to water inrush, mud inrush, and collapse disasters during tunnel excavation. Hydrogeological surveys reveal that surface water is minimally developed, predominantly consisting of gully catchment water during the rainy season. Groundwater is primarily karst water, which is both well-developed and abundant. Relevant specific engineering background information is illustrated in Figure 2.
Figure 2.
Background information of Andangnong tunnel project.
2.2. Construction of Water Inrush Risk Assessment Indicator System
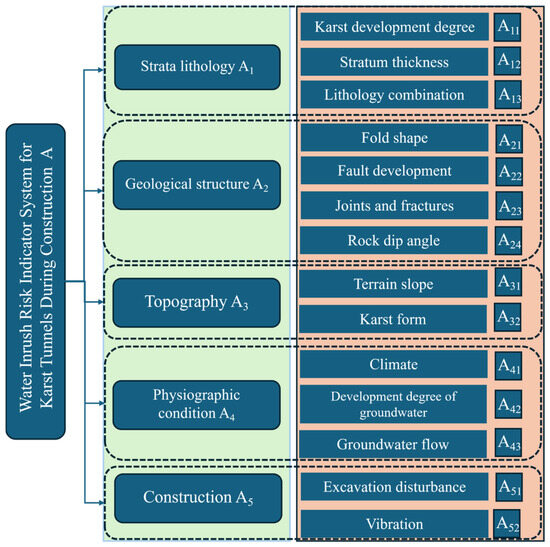
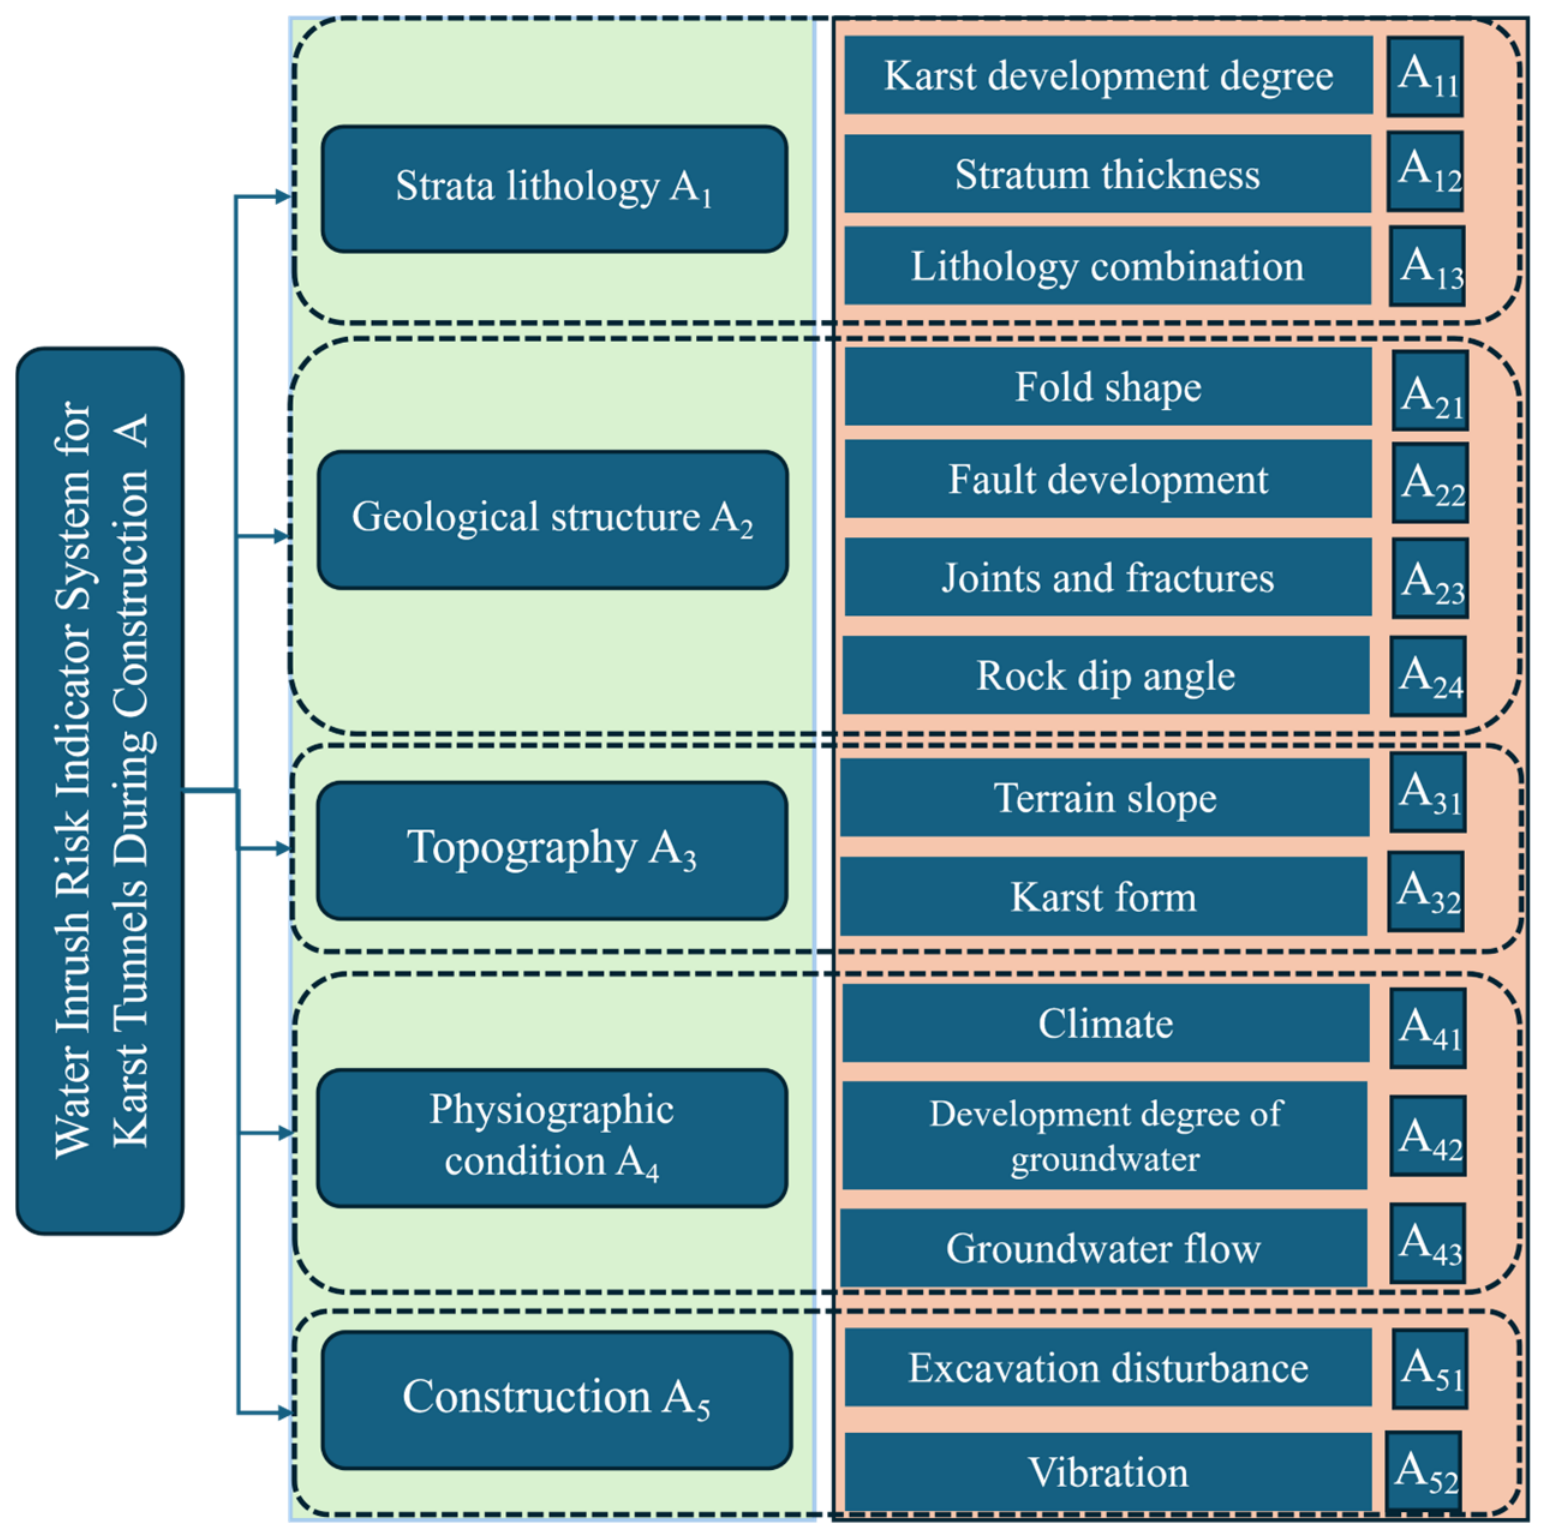
The initial phase in evaluating the potential risk of water inrush incidents in tunnels is the establishment of a comprehensive risk indicator system. This system serves as the foundation and prerequisite for accurately identifying risks and systematically advancing the assessment. Based on the existing relevant literature, as well as technical standards and specifications for highway tunnels and the actual conditions of the Congjiang–Rongan–Lipu Highway tunnel project (specifically the Rongan through Yongfu to Yangshuo section), a system of evaluation indicators has been developed to assess water inrush disasters that occur during tunnel construction. This system assesses the potential risks associated with water inrush events in karst tunnels by considering five essential factors, including strata lithology, geological structure, topography, physiographic conditions, and human construction activities. The safety risk assessment system for karst tunnel water inrush disasters comprises a total of 15 secondary indicators. The quantitative analysis indicators primarily include rock layer thickness, rock layer dip angle, terrain slope, catchment area, groundwater development degree, and groundwater flow rate. On the other hand, the qualitative analysis indicators encompass karst development degree, lithological combination, fold morphology, fault development, joint fissures, karst morphology, climate, excavation disturbance, and vibration effects. Through a comprehensive assessment of these indicators, a more accurate quantification of the risk associated with karst tunnel water inrush disasters can be achieved. This provides a scientific basis for the safety management of tunnel construction, as illustrated in Figure 3.
Figure 3.
Safety risk assessment index system of water inrush disaster in karst tunnel.
2.3. FAHP-EWM Combined Weight Calculation Method
A single weighting method often overlooks the logical relationships between indicators and is susceptible to human interference, lacking an objective basis. To enhance the accuracy of the weights assigned to various risk indicators, this study adopts a combined weighting method that incorporates both the Fuzzy Analytic Hierarchy Process and the Entropy Weight Method (FAHP-EWM). By merging experience from experts and knowledge with objective data, this method effectively overcomes the disadvantages associated with depending exclusively on a single method. Subjective weights are established using the Fuzzy Analytic Hierarchy Process (FAHP), ensuring a more robust and comprehensive analysis. Compared to the traditional Analytic Hierarchy Process (AHP) that employs a 1–9 scale method, the present study adopts the 0.1–0.9 scale method. This approach accounts for the inherent fuzziness of human judgment and provides a more comprehensively representation of the differences among the considered factors. Additionally, objective weights are established using the Entropy Weight Method. This method determines the weight of each indicator based on the impact of changes in the indicator values on the overall assessment. Through the calculation of entropy values, it eliminates deviations caused by subjective assignments, thereby, avoiding interference from subjective factors and improving the objectivity and precision of the assessment results. The matrix is adopted to calculate the importance coefficients αi, βi for the subjective and objective weights, as shown below.
where , are the subjective weight and objective weight of the i-th indicator respectively, and the combined weight W is obtained through calculations as shown in Equation (2):
2.4. Two-Dimensional Cloud Model Theory and Cloud Generator
Tunnel water inrush disasters are inherently concealed and complex phenomena, characterized by multi-scale and multi-field interactions within intricate environments. These factors contribute to the ambiguity and uncertainty associated with assessing tunnel water inrush events. The cloud model is a mathematical framework designed to manage uncertain information, enabling the transformation of qualitative concepts into quantitative descriptions. It finds extensive applications in various fields, including uncertainty transformation, data mining, and decision analysis.
In a two-dimensional universe of discourse U{U1, U2}, the two-dimensional cloud model representing a qualitative concept C comprises all randomly generated two-dimensional cloud droplets (x, y). The certainty degree of each cloud droplet to C is represented as a random number that follows a stable trend, adhering to the two-dimensional membership function relationship as illustrated in Equation (3):
where (Ennx, Ennᵧ) represent random numbers that follow a normal distribution characterized by their expectation values (Enx, Enᵧ) and variance (Hex2, Heᵧ2). Conversely, (xi, yi) denote random numbers also following a normal distribution, with expectation parameters (Ex, Ey) and respective variance (Ennx2, Ennᵧ2).
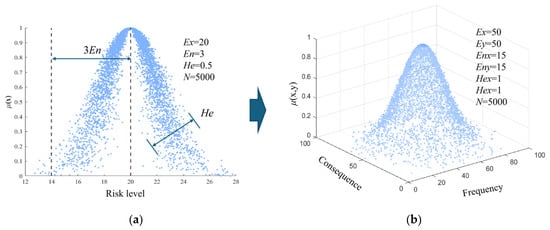
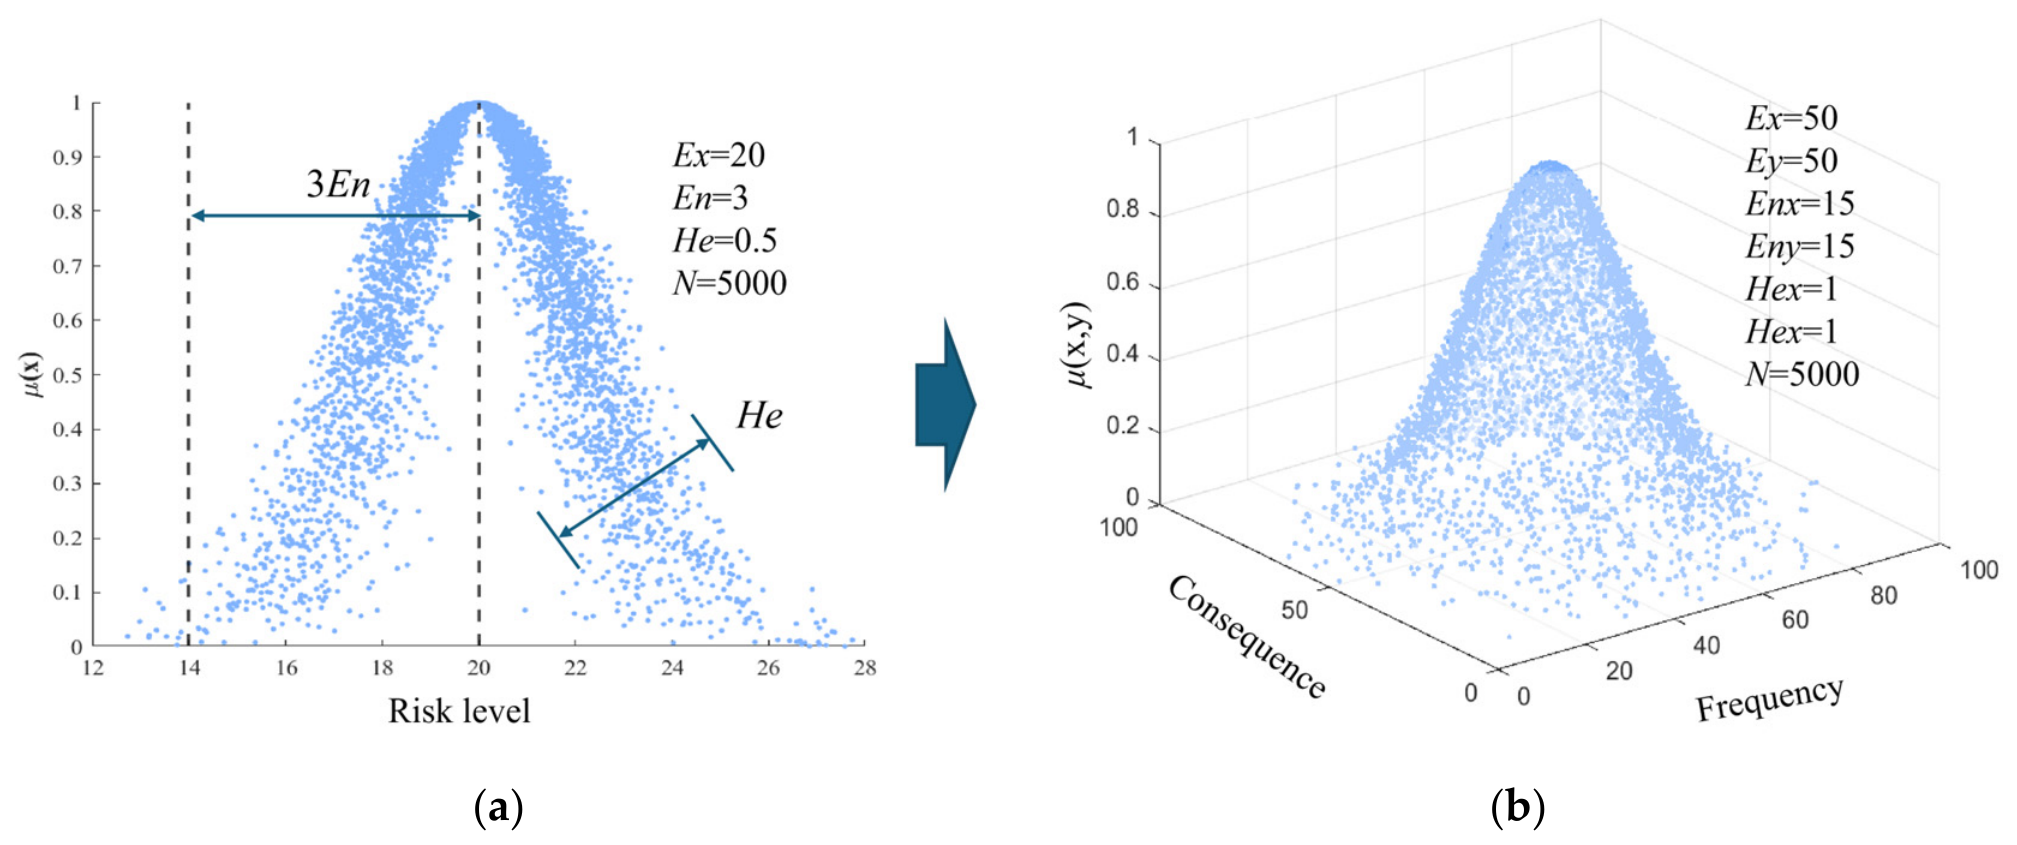
The distribution of quantitative values (x, y) within a two-dimensional space is referred to as a cloud, while an individual pair of (x, y) values is termed a cloud droplet. The digital characteristics of the cloud consist of the expected Ex, entropy En, and hyper-entropy He. The expectation Ex represents the central position of the cloud in the two-dimensional space. The entropy En indicates the dispersion degree of the cloud in the two-dimensional space, reflecting the fuzziness and randomness of the concept. The hyper-entropy He denotes the uncertainty associated with the entropy, which can be understood as the “thickness” of the cloud, indicating the cohesion degree of the cloud droplets. Schematic diagrams of the characteristics and cloud droplet distribution for both 1D and 2D cloud models are shown in Figure 4.
Figure 4.
Cloud model: (a) one-dimensional cloud model and (b) two-dimensional cloud model.
From a probability distribution perspective, the majority of cloud droplets are located within the outer envelope surface, the function of which is described by Equation (4).
Combined with the 3σ principle in statistics, which states that approximately 99.46% of data falls within the mean ± 3σ interval, the 2D cloud model introduces the 3En principle. The principle posits that the outer envelope surface of cloud droplet distribution adheres to this statistical framework, with around 99.46% of cloud droplets located within the rectangular region defined by [Ex − 3Enx, Ex + 3Enx] × [Ey − 3Enᵧ, Ey + 3Enᵧ]. By utilizing the quantitative boundaries of this rectangular region, the two-dimensional cloud model can address uncertain problems with greater precision.
The cloud generator facilitates bidirectional uncertain mapping between qualitative concepts and quantitative data. Based on its functionality, cloud generators can be categorized into two types, forward cloud generators and backward cloud generators. The backward cloud generator employs a parameter algorithm that inversely derives the digital characteristics (Ex, Ey, Enx, Enᵧ, Hex, Heᵧ) of qualitative concepts from quantitative data points (cloud droplets). Ex and Ey are the expected coordinates in the probability and consequence dimensions, respectively. Enx and Eny are the entropies along the probability and consequence dimensions, quantifying the fuzziness and randomness of expert judgments regarding the likelihood and severity of water inrush. Hex and Hey are the corresponding hyper-entropies, representing the uncertainty of Enx and Eny, respectively. A smaller Hex or Hey indicates a thinner cloud and a higher degree of consensus among experts in the corresponding dimension. The final risk level is not determined directly by Ex or Ey, but by counting the proportion of comprehensive cloud droplets falling into each predefined risk zone. The previously mentioned He/En ratio of approximately 0.25 refers to the average value of the secondary indicators, with a range of 0.18–0.31. For the post-treatment comprehensive cloud, the calculated ratios are Hex/Enx = 0.309 and Hey/Eny = 0.303. This process effectively converts quantitative data into qualitative concepts, as illustrated in Equation (5).
where n represents the count of experts, xi denotes the score assigned by the i-th expert, and S2 represents the sample variance.
Utilizing the membership function (Equation (3)), the process of generating cloud droplets through the digital attributes (Ex, Ey, Enx, Enᵧ, Hex, Heᵧ) is designated as the forward cloud generator. This generator transforms the represented qualitative concept into quantitative data through the digital characteristics of the two-dimensional standard cloud, resulting in the creation of two-dimensional cloud droplets. The calculation process is illustrated in Equation (6).
where i denotes the risk level, and j corresponds to the j-th standard cloud associated with the i-th level. , , , are the boundary values of the qualitative concept universe, illustrating the maximum and minimum values of the risk event along the x-axis (risk probability) and y-axis (risk loss). The hyper-entropy He is used to describe the fuzziness of the risk. In this paper, the hyper-entropy of the standard cloud is taken as 1 [20].
2.5. Establishment of Standard Cloud and Comprehensive Cloud
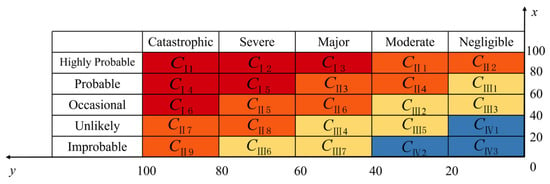
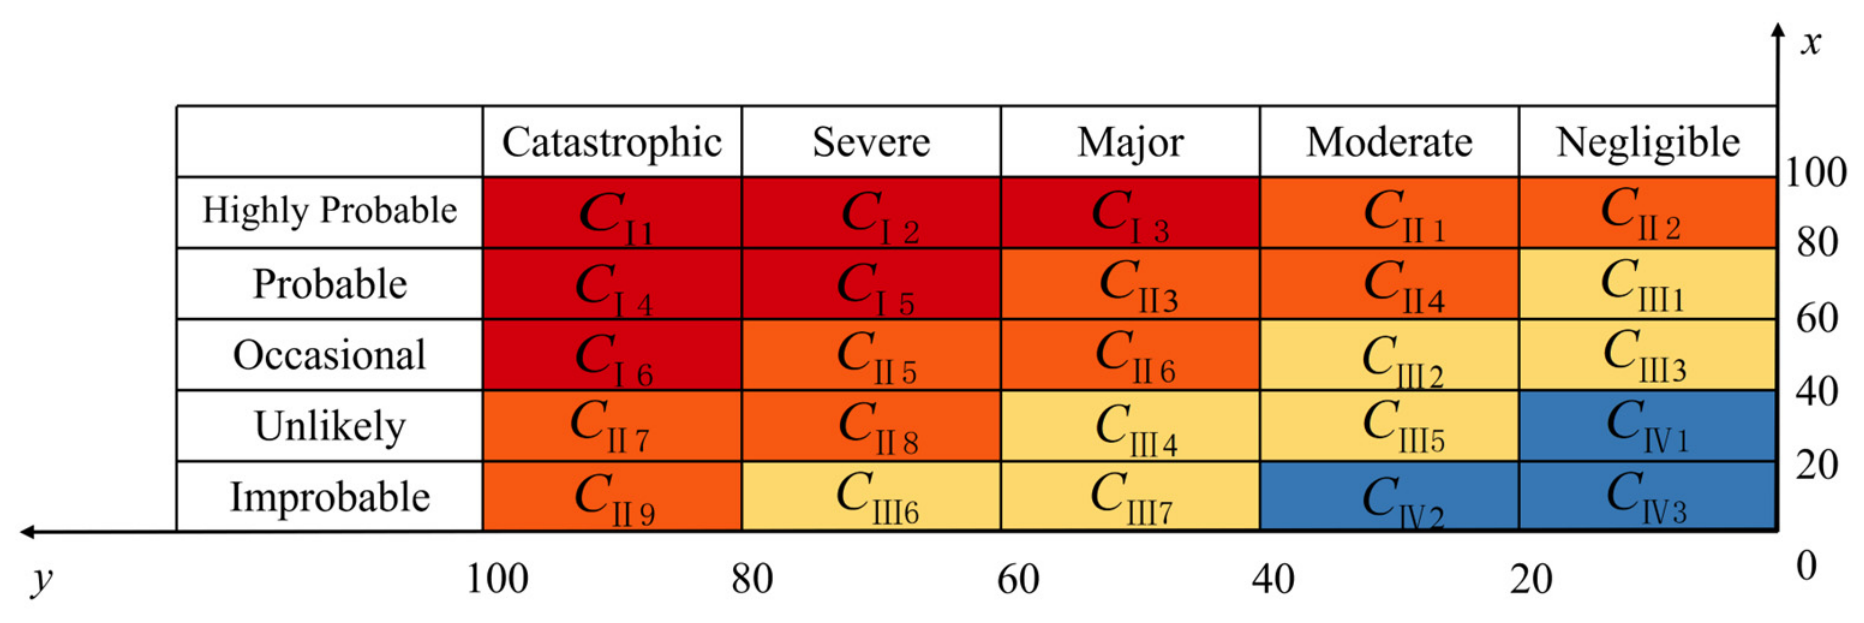
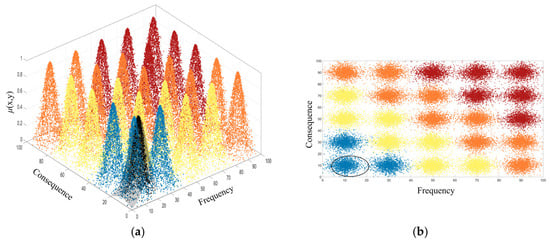
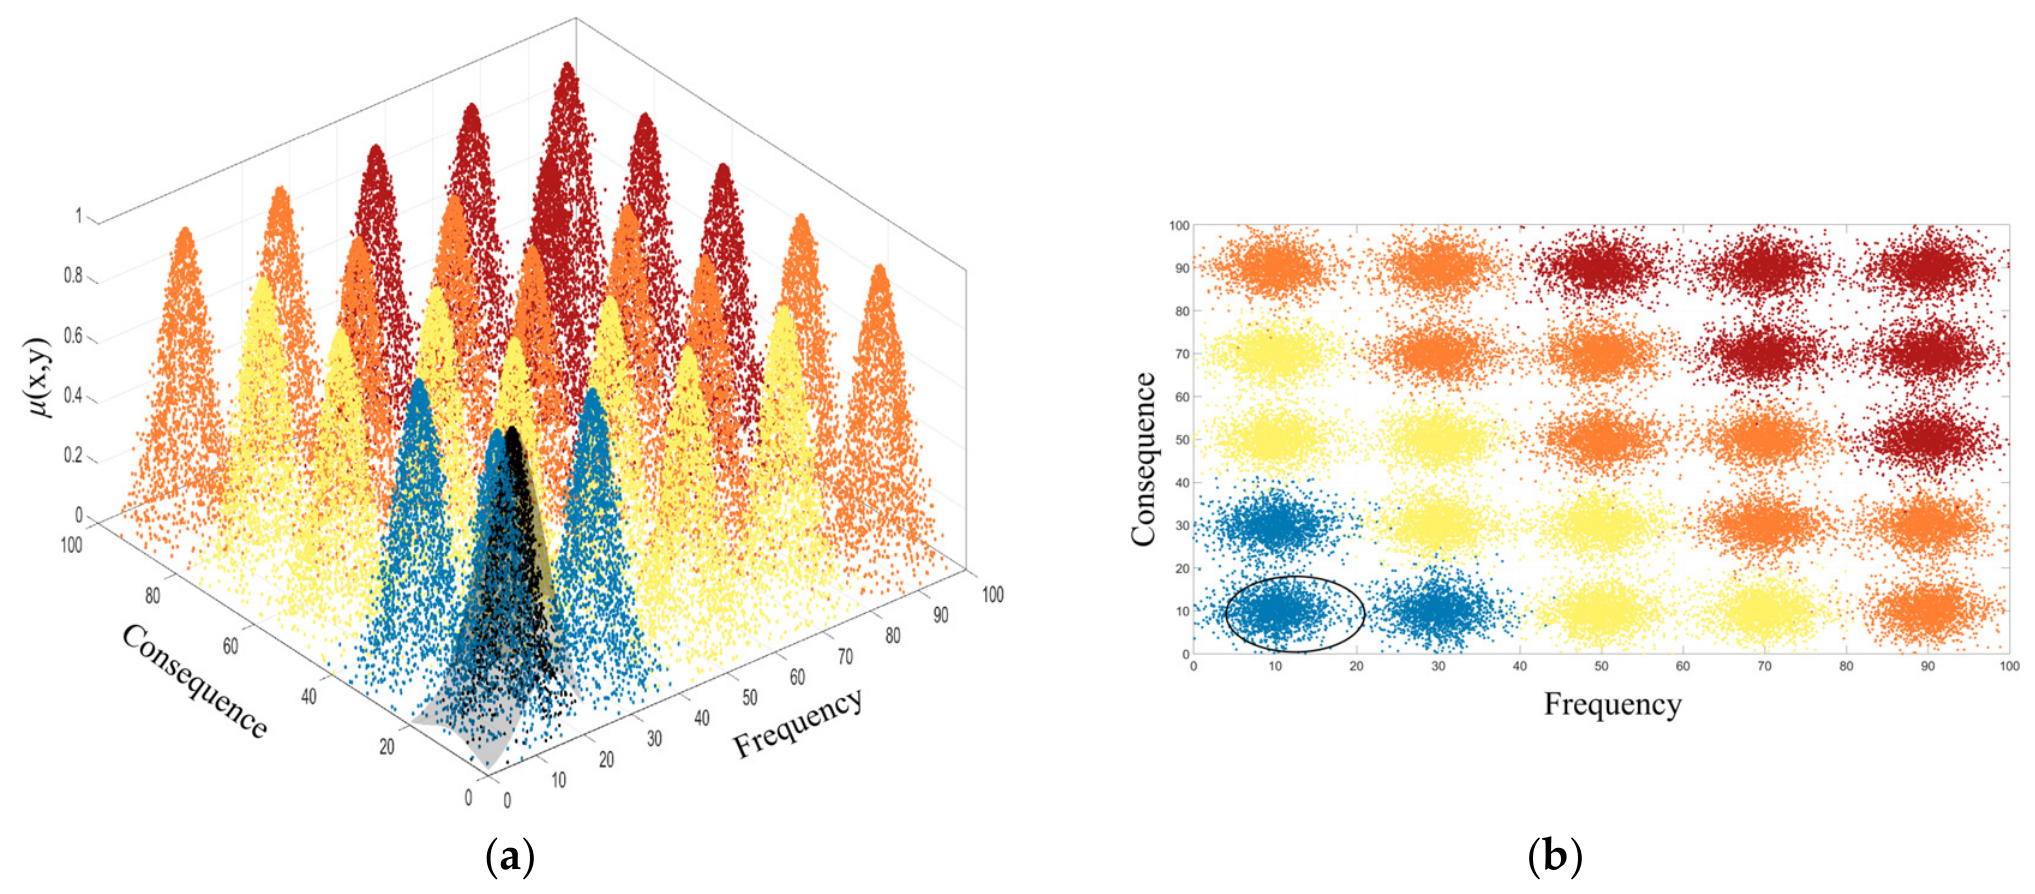
The initial edition of guidelines for managing risk was released by the International Tunnelling Association in 2004. Eskesén et al. [21] categorized both probability of risk events and the potential losses into five distinct levels. The probability dimension is classified as Highly Probable, Probable, Occasional, Unlikely, and Improbable. Meanwhile, the loss dimension is categorized as Catastrophic, Severe, Major, Moderate, and Negligible. To further refine the risk assessment, a normal distribution membership function is adopted to quantitatively transform each cell of the risk matrix, converting the risk events into values ranging from 0 to 100, as illustrated in Figure 5. This approach facilitates a quantitative assessment based on the severity and likelihood of risks. The risks are categorized into four levels, including I (major risk), II (greater risk), III (general risk), and IV (low risk). Finally, the two-dimensional standard cloud model is generated using MATLAB codes.
Figure 5.
Risk level matrix(Red indicates high risk, orange indicates medium risk, yellow indicates general risk, and blue indicates low risk).
Experts score the risk events according to the scoring criteria in Table 1 and Table 2. The six experts’ qualifications and their anonymized scoring matrices (6 × 15 indicators) are provided in Appendix A Table A1, with the coefficient of variation (CV) for each indicator ranging from 5.1% to 22.7% (Krippendorff’s α = 0.84). Notably, while the EWM derives weights from the variability among expert scores and thus reduces individual bias, these weights are ultimately judgment-derived rather than purely objective. The scoring results are substituted into Equation (5) to obtain the cloud digital characteristic values (Ex, Ey, Enx, Enᵧ, Hex, Heᵧ) describing the risk event. Based on this, the cloud digital characteristic matrix for the secondary indicators is obtained. This matrix is weighted and summed with the obtained combined weights, ultimately yielding the cloud digital characteristic values for the primary indicators and the comprehensive cloud in both the frequency dimension and the consequence loss dimension, as illustrated in Equation (7):
Table 1.
Risk event probability grading standard.
Table 2.
Risk event consequence loss grading standard.
In the research process of level assessment utilizing the 2D cloud model, both the comprehensive and standard cloud generate thousands of cloud droplets. Superimposing these droplets in three-dimensional space can easily lead to subjective differences in judgment. To derive a more accurate and objective risk assessment level, the distribution of comprehensive cloud droplets across various risk areas is counted. Subsequently, the quantity of comprehensive cloud droplets across various areas is normalized, as calculated in Equation (8), to represent the probability of varying risk levels.
where Mi is the number of cloud drops in risk area i.
2.6. Risk Classification and Control Standard
The two-dimensional cloud model risk assessment results indicate that the risk level for water inrush disaster in the Andangnong Tunnel is greater risk (Level II). To effectively manage the risk of water inrush in tunnels, it is essential to introduce a tiered system of control measures presented in Table 3. According to the risk prevention and control measures specified in the relevant standards shown in Table 3, the control measures related to Level II includes daily oversight and continuous monitoring, which are critical for maintaining awareness of potential risks. Additionally, establishing an early warning mechanism is crucial for providing timely alerts about any changes in conditions that could signal a water influx. Special treatment strategies must also be developed to address specific vulnerabilities within the tunnel environment. Furthermore, preparing comprehensive emergency plans will ensure that swift and organized responses can be executed in the event of a water emergency. By implementing these measures, the overall risk of water inrush can be mitigated to an acceptable and manageable level, thereby enhancing the safety and reliability of tunnel operations.
Table 3.
Risk prevention and control measures.
2.7. Special Treatment Technology for Karst Caves
The prevention and control of karst disasters during the construction phase is crucial for mitigating geological hazards in tunnels. The Andangnong Tunnel is situated in a limestone region characterized by well-developed karst formations, rendering it susceptible to water inrush disasters during excavation. Adhering to the principle of prevention is essential during construction, several specific measures should be adopted. First of all, geophysical prospecting techniques, such as ground-penetrating radar and the transient electromagnetic method, are adopted for medium- and short-distance detection. These techniques are complemented by advanced drilling in karst development sections, fault fracture zones, karst depressions above the tunnel, and significant geophysical anomaly areas. This approach reveals karst morphology and facilitates the identification of the distribution location, scale, filling condition, and the state of karst water development state of karst features, thereby, providing a foundation for precise prevention and control measures.
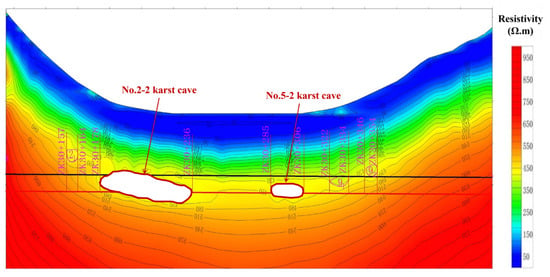
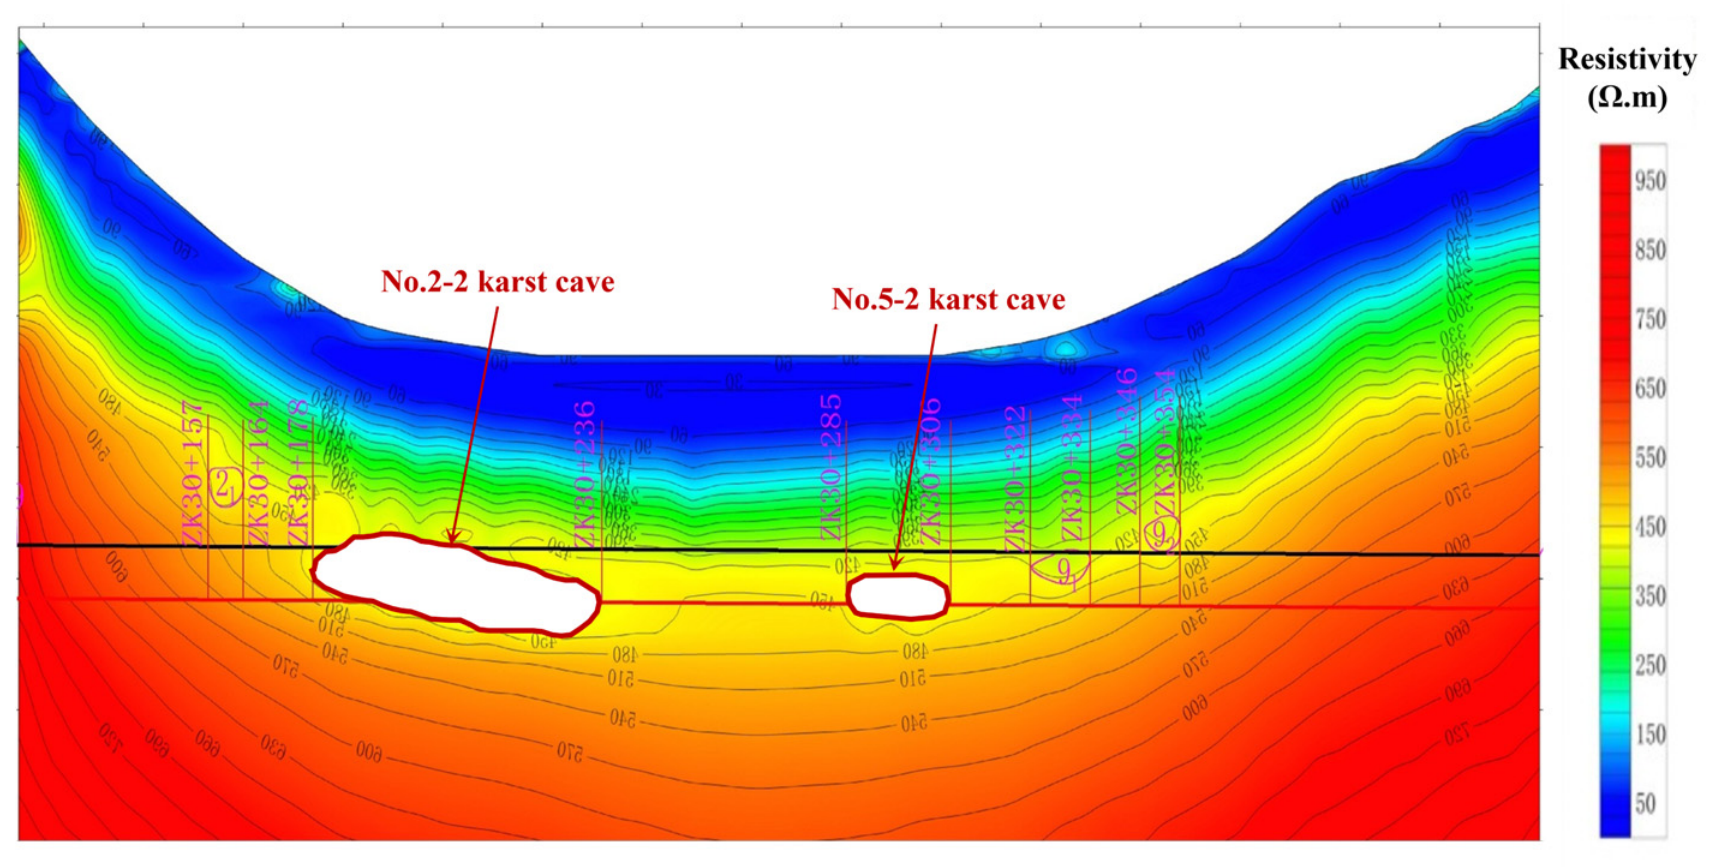
According to the geophysical prospecting diagram (Figure 6), the resistivity contour lines in areas 2-2 and 5-2 exhibit a low-resistance depression, suggesting the presence of highly developed karst formations. These formations significantly impact the tunnel, as excavation in these areas is likely to trigger water and mud inrushes, necessitating reinforced support.
Figure 6.
Geophysical prospecting result map showing resistivity contours in the Y2-2 and Y5-2 areas.
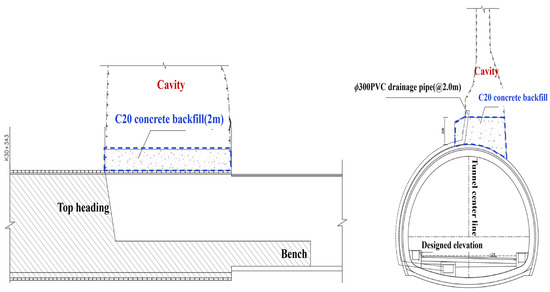
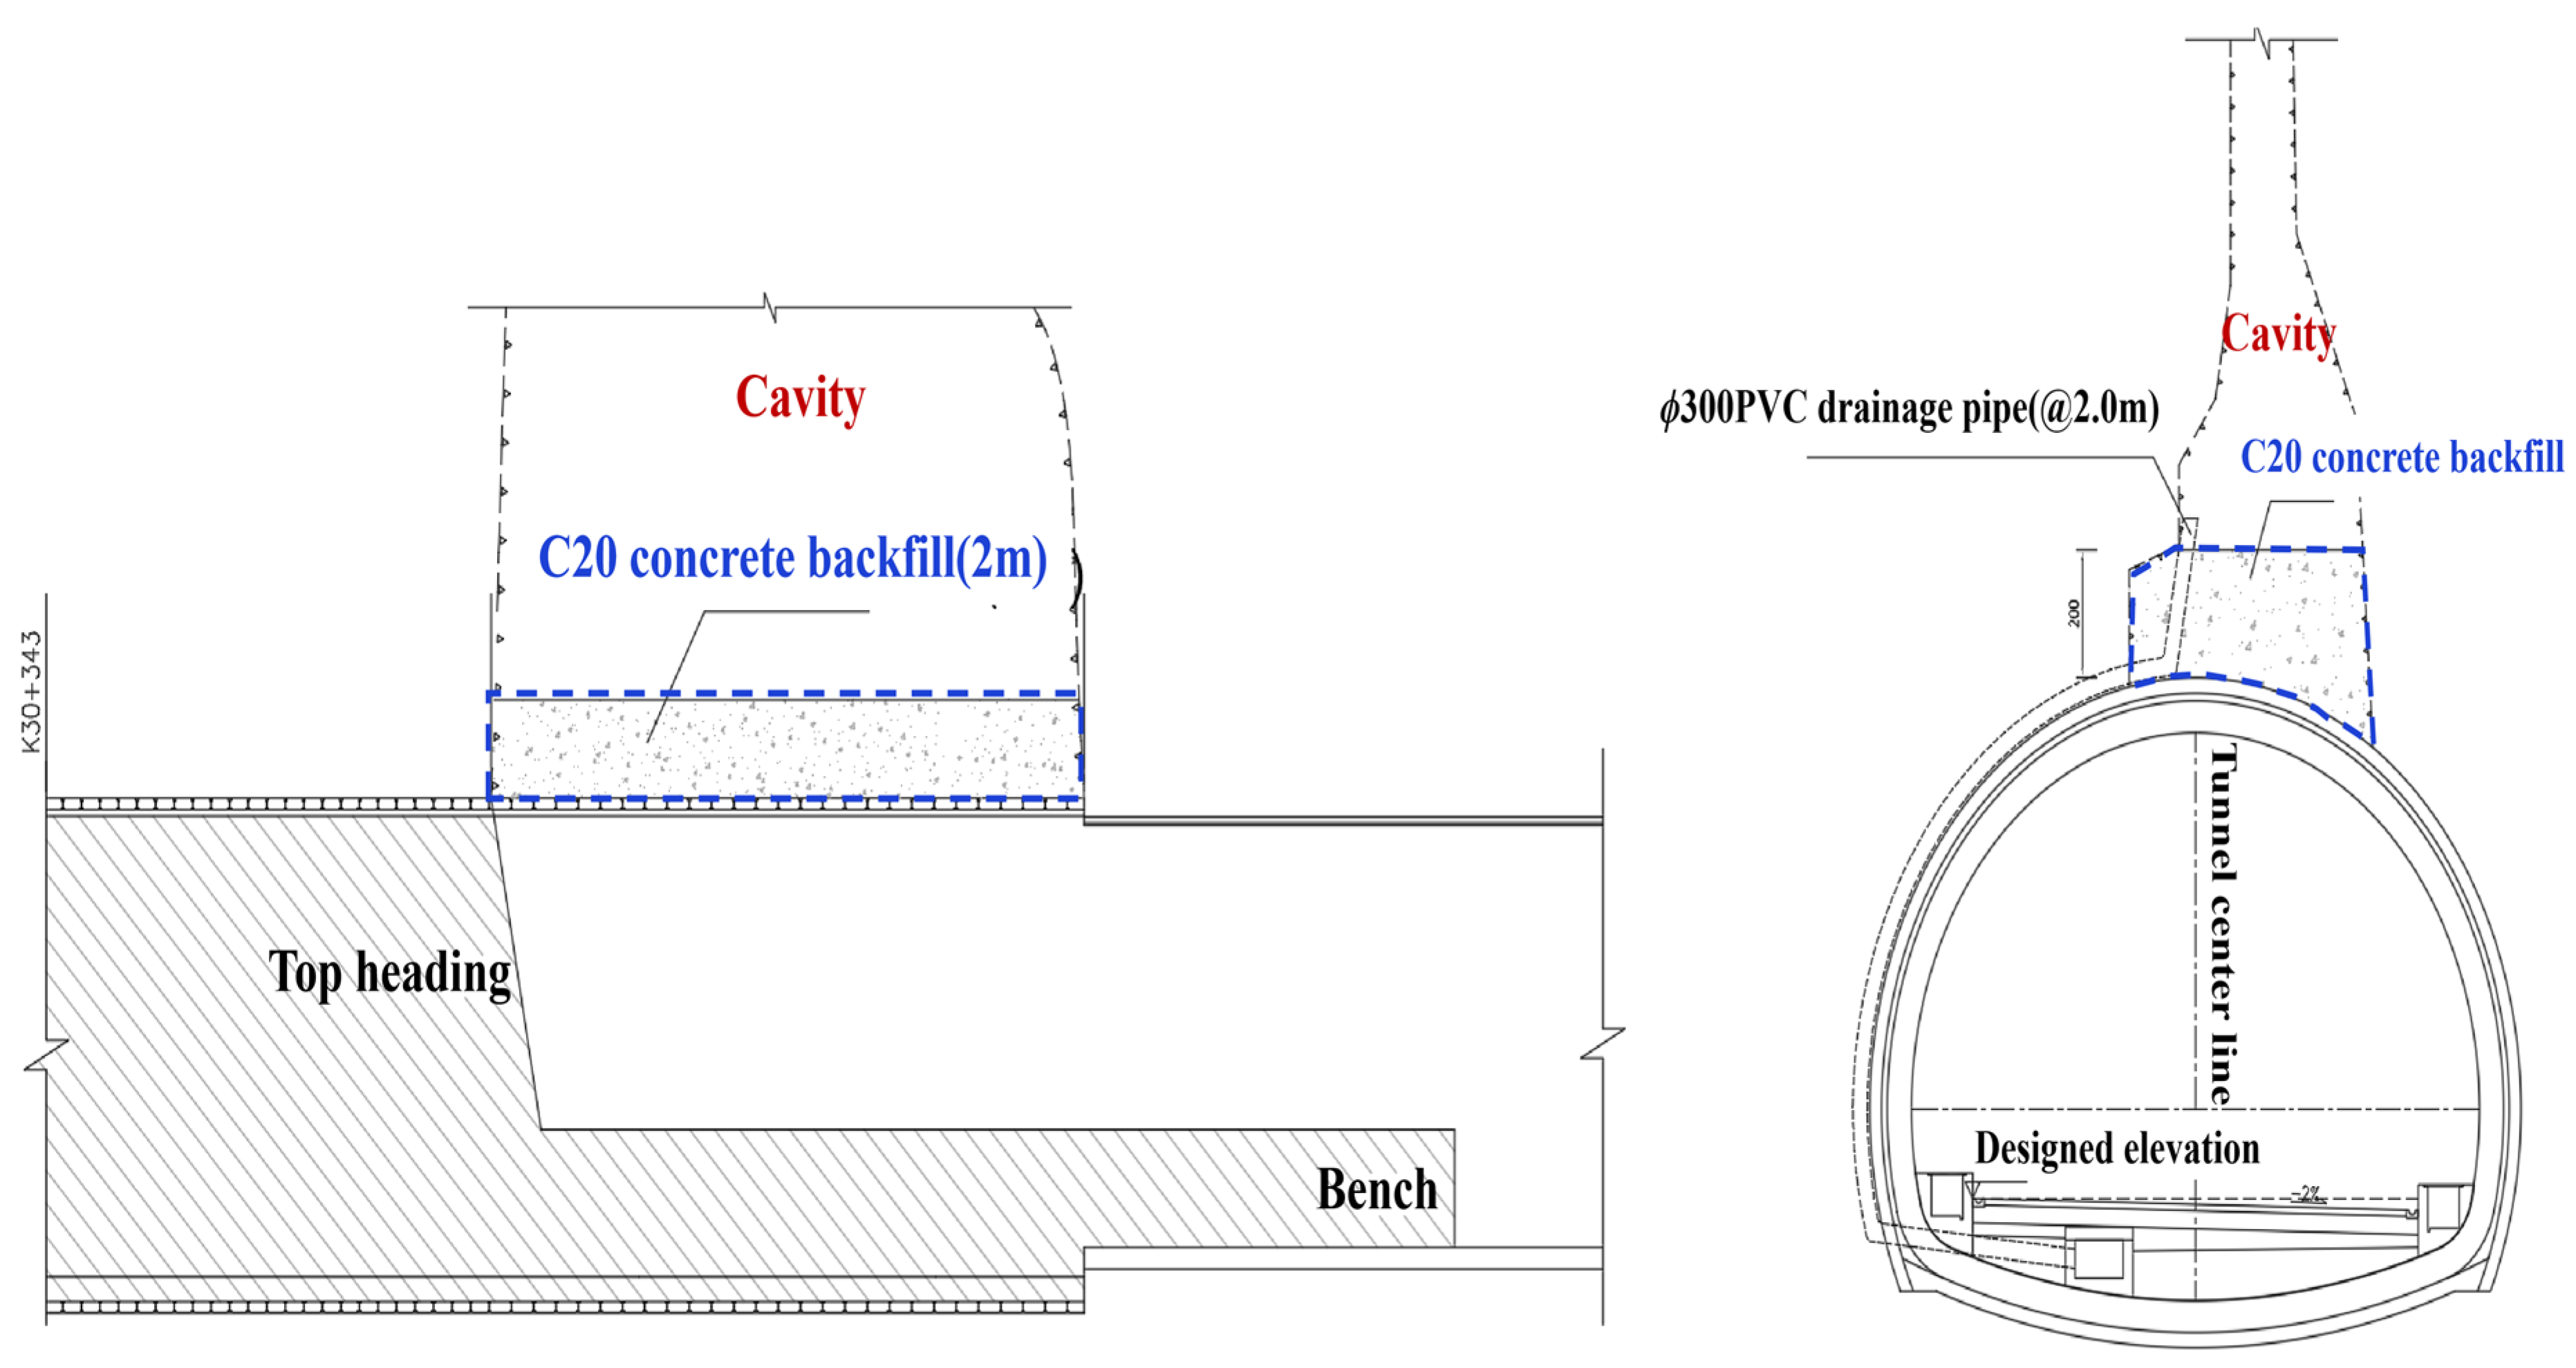
The development of karst cave has led to a deterioration in the structural stability of the surrounding rock within the Andangnong Tunnel, resulting in deformation of the original support and a significant increase in the inrush disaster risk. Notably, the karst caves in the Y2 and Y5 areas are highly developed. As shown in Figure 7, the specific treatment measures implemented include: the use of curtain grouting to block key seepage channels, with grouting pressure maintained between 1.5 and 3.0 MPa, ensuring that the rock mass permeability after treatment is less than 1 Lu. Meanwhile, drainage tunnels with a cross-sectional size of 2 m × 2.5 m were set up and combined with drainage ditches, culverts, and other drainage facilities to divert water, which can effectively intercept water flow paths. During construction, a benched excavation method was employed, with initial support deformation controlled to ensure that the deformation rate of the initial support remained below 0.5 mm/d. Additionally, impact-resistant reinforced concrete secondary lining was utilized to enhance structural safety. Real-time monitoring and early warning systems were implemented throughout the process, allowing for dynamic adjustments to construction strategies. This approach adheres to the principle of “prevention first, combining drainage and blocking, comprehensive treatment,” which effectively controls disaster risks and ensures the safety of tunnel construction. The grouting pressure (1.5–3.0 MPa) and deformation control limit (0.5 mm/d) were determined in accordance with the Chinese Railway Tunnel Design Code (TB 10003-2016) [22], while the permeability target (<1 Lu) follows the conventional standard for terminating anti-seepage grouting in rock mass engineering (ISRM, 2015). The drainage tunnel dimensions (2 m × 2.5 m) were selected based on the hydraulic capacity and maintenance access requirements specified in the Chinese Highway Tunnel Design Guidelines (JTG/T D70-2010) [23].
Figure 7.
Control treatments.
3. Results
3.1. Pre-Treatment Risk Calculation and Assessment Results
Based on the geological overview and relevant regulations, a total of 15 risk factors labeled A1 to A5 were selected as evaluation indicators. Then, the subjective weights for both the main and secondary indicators were derived through the FAHP, and this was subsequently accompanied by consistency checks to confirm reliability. Concurrently, the Entropy Weight Method (EWM) was utilized to calculate the objective weights of the primary and secondary indicators. Equations (1) and (2) facilitated the combined weighting of the subjective and objective weights, ultimately resulting in the combined weights for the primary and secondary indicators, as shown in Table 4 and Table 5.
Table 4.
First index combination weight.
Table 5.
Combination weights of secondary index.
A panel of six experts, specializing in the fields of karst, hydrology, and engineering geology, was convened to assess the construction risk indicators associated with the Andangnong Tunnel. This assessment was carried out with a focus on the specific conditions present in the project. The risk probability score of evaluation index is shown in Table A1 in Appendix A. To quantify their evaluations, the experts utilized a percentage scoring system, allowing for a systematic and objective analysis of the various risk factors involved in the construction process. The scores were then substituted into Equation (5) to calculate the cloud digital characteristic values for each indicator. Following a weighted summation using the combined weights, as presented in Equation (7), the comprehensive cloud characteristic values were obtained as (58.288, 42.154, 7.823, 8.892, 2.043, 1.929). The weights and cloud digital characteristic values for the other primary and secondary indicators are shown in Table 6.
Table 6.
Risk cloud digital characteristics and weight of tunnel water inrush risk evaluation index.
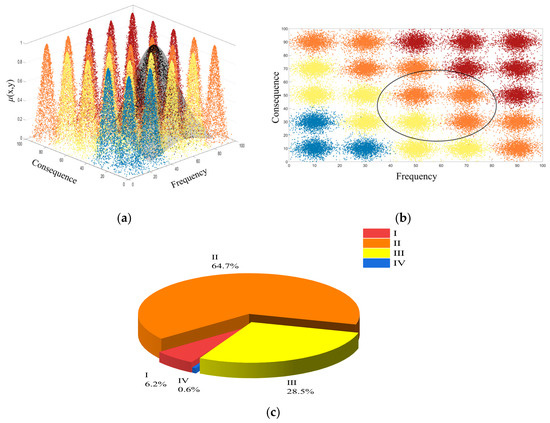
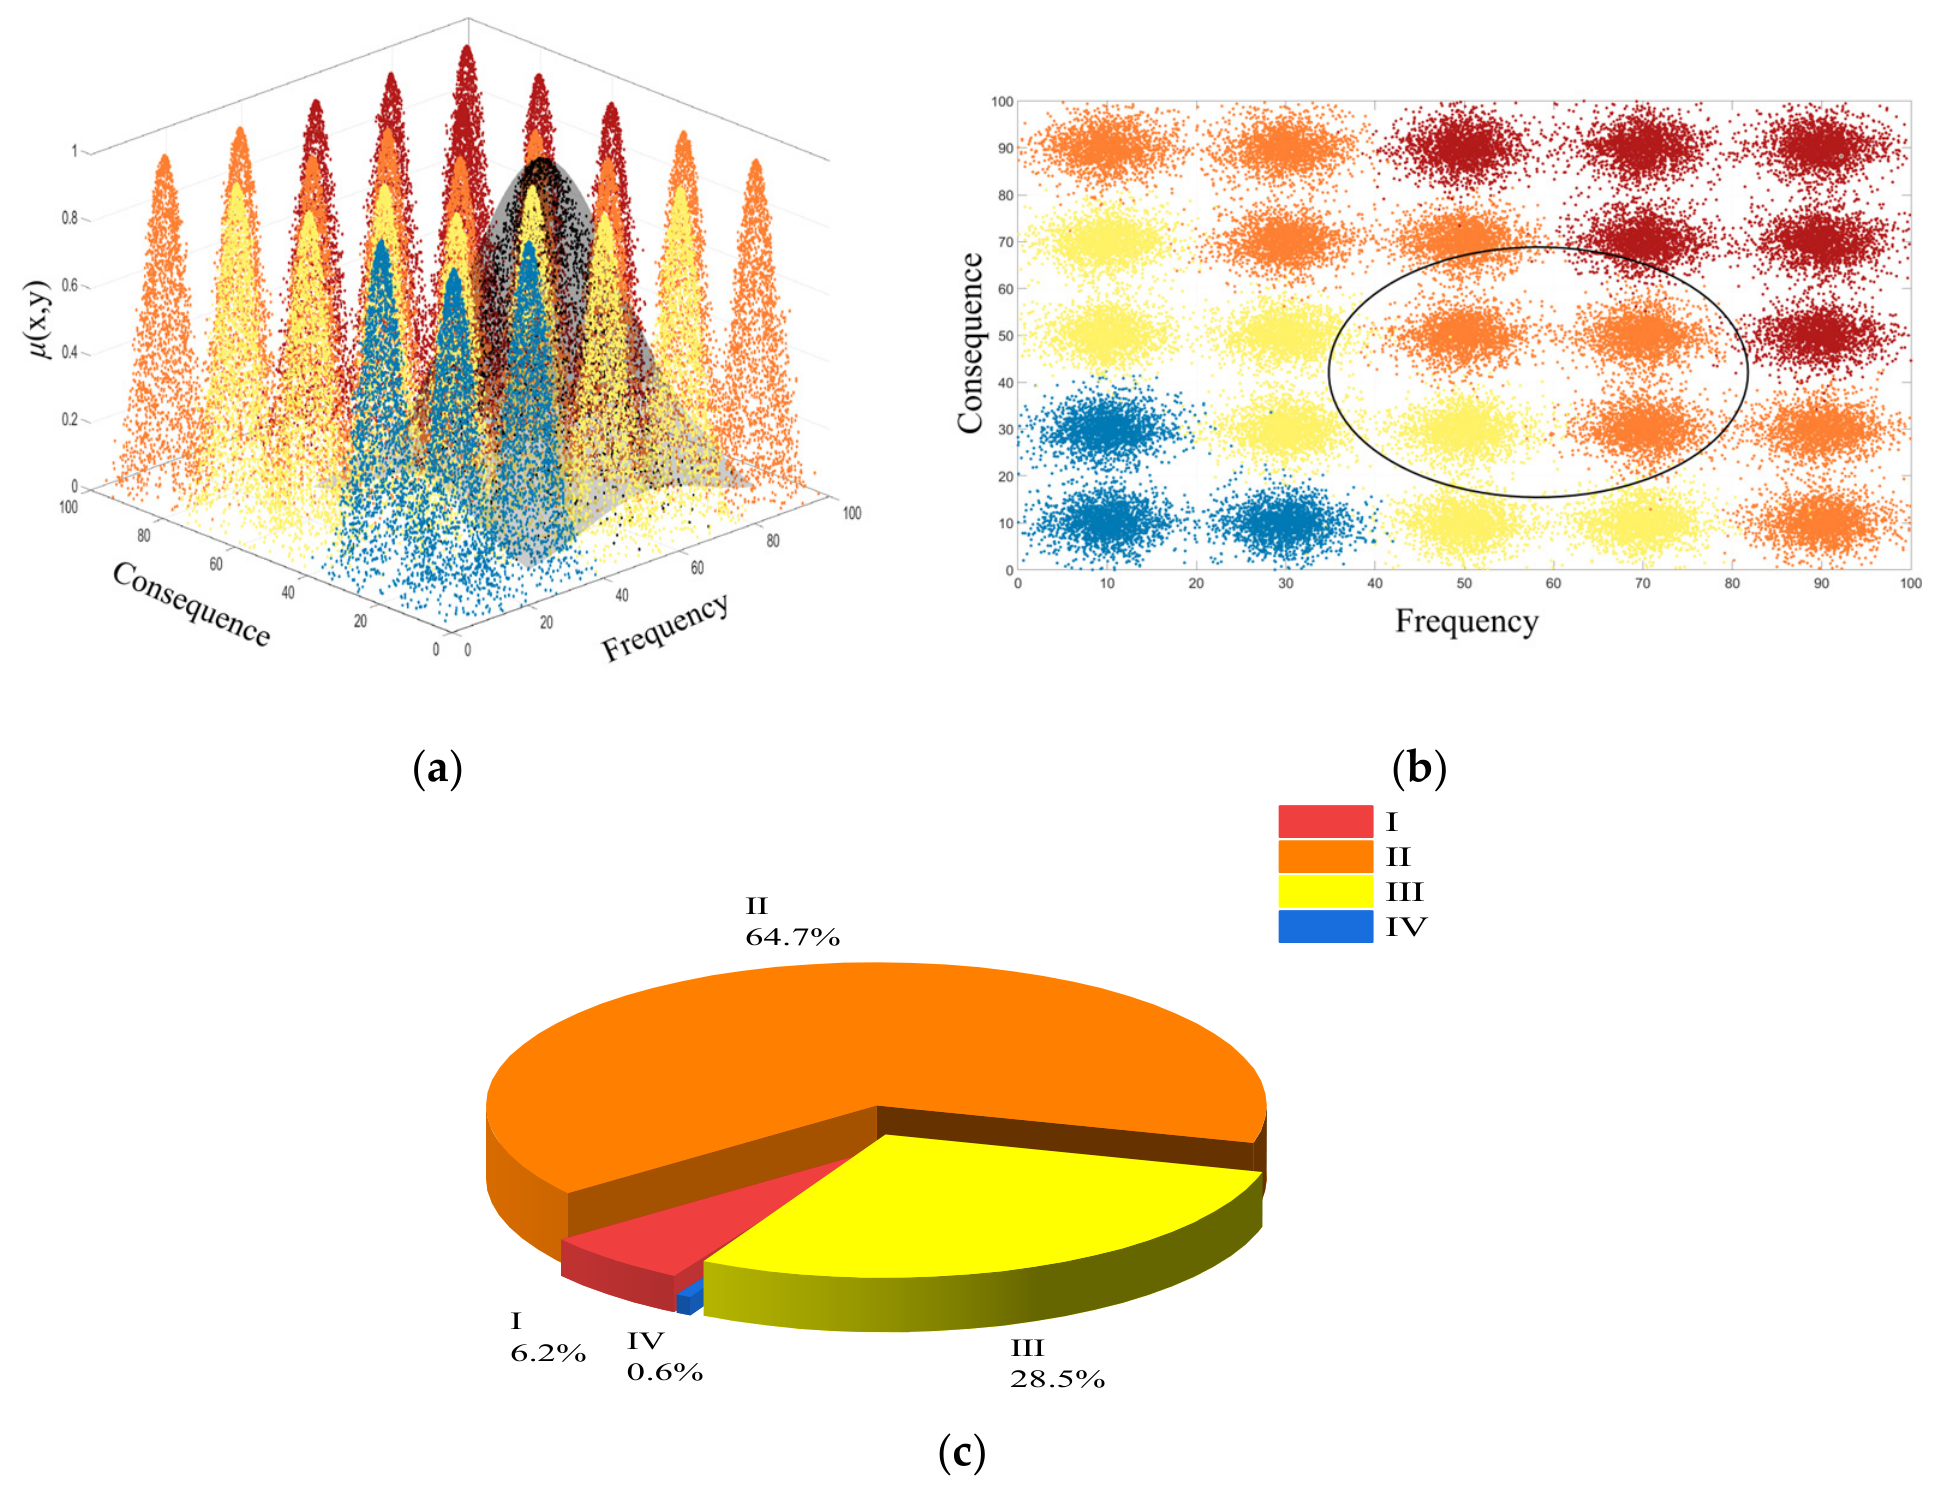
Based on the calculated characteristic values of the comprehensive cloud for the tunnel water inrush disaster, a forward cloud generator was adopted to generate a comprehensive cloud diagram comprising N = 2000 cloud droplets, as illustrated in Figure 8a. The comprehensive cloud can be represented as an ellipse in a two-dimensional space following the 3En principle, which facilitates a more intuitive visualization of the comprehensive cloud across various levels of the standard cloud (Figure 8b).
Figure 8.
Evaluation results of Andangnong Tunnel: (a) 3D schematic diagram of risk assessment; (b) risk assessment plan; (c) risk zoning map(Red indicates high risk, orange indicates medium risk, yellow indicates general risk, and blue indicates low risk).
As illustrated in the tested three-dimensional comprehensive cloud diagram and the comprehensive cloud-standard cloud plan schematic diagram (Figure 8), the comprehensive cloud is predominantly distributed in areas classified as risk levels II and III. To enhance the accuracy and scientific validity of the risk assessment, the test results underwent 100 cycle tests utilizing MATLAB (R2025b) codes, with the average of these tests serving as the foundation for the risk level assessment. The results are presented in Table 7 and Figure 8c. The results indicate that PII > PIII > PI > PIV, revealing that the probability of the comprehensive cloud droplets being in the risk level II area is the highest, with a value of PII = 0.647. Consequently, based on the maximum risk probability, the risk assessment for the potential water inrush disaster in the Andangnong Tunnel is categorized as Greater risk (Level II).
Table 7.
Statistical probability values of 100 cycle results.
3.2. Field Verification of On-Site Water–Mud Inrush Disasters
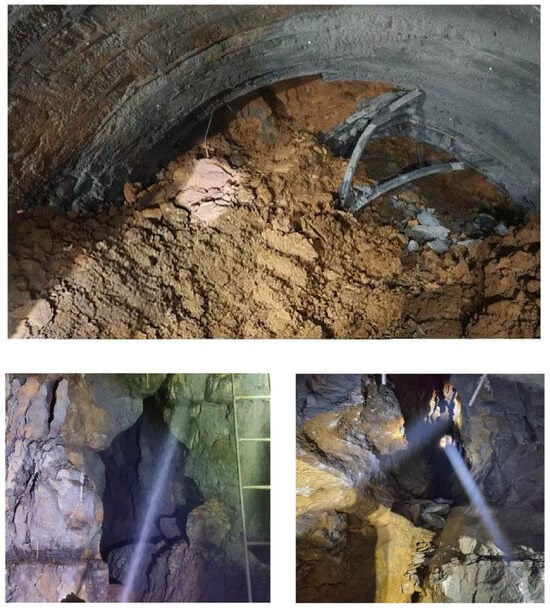
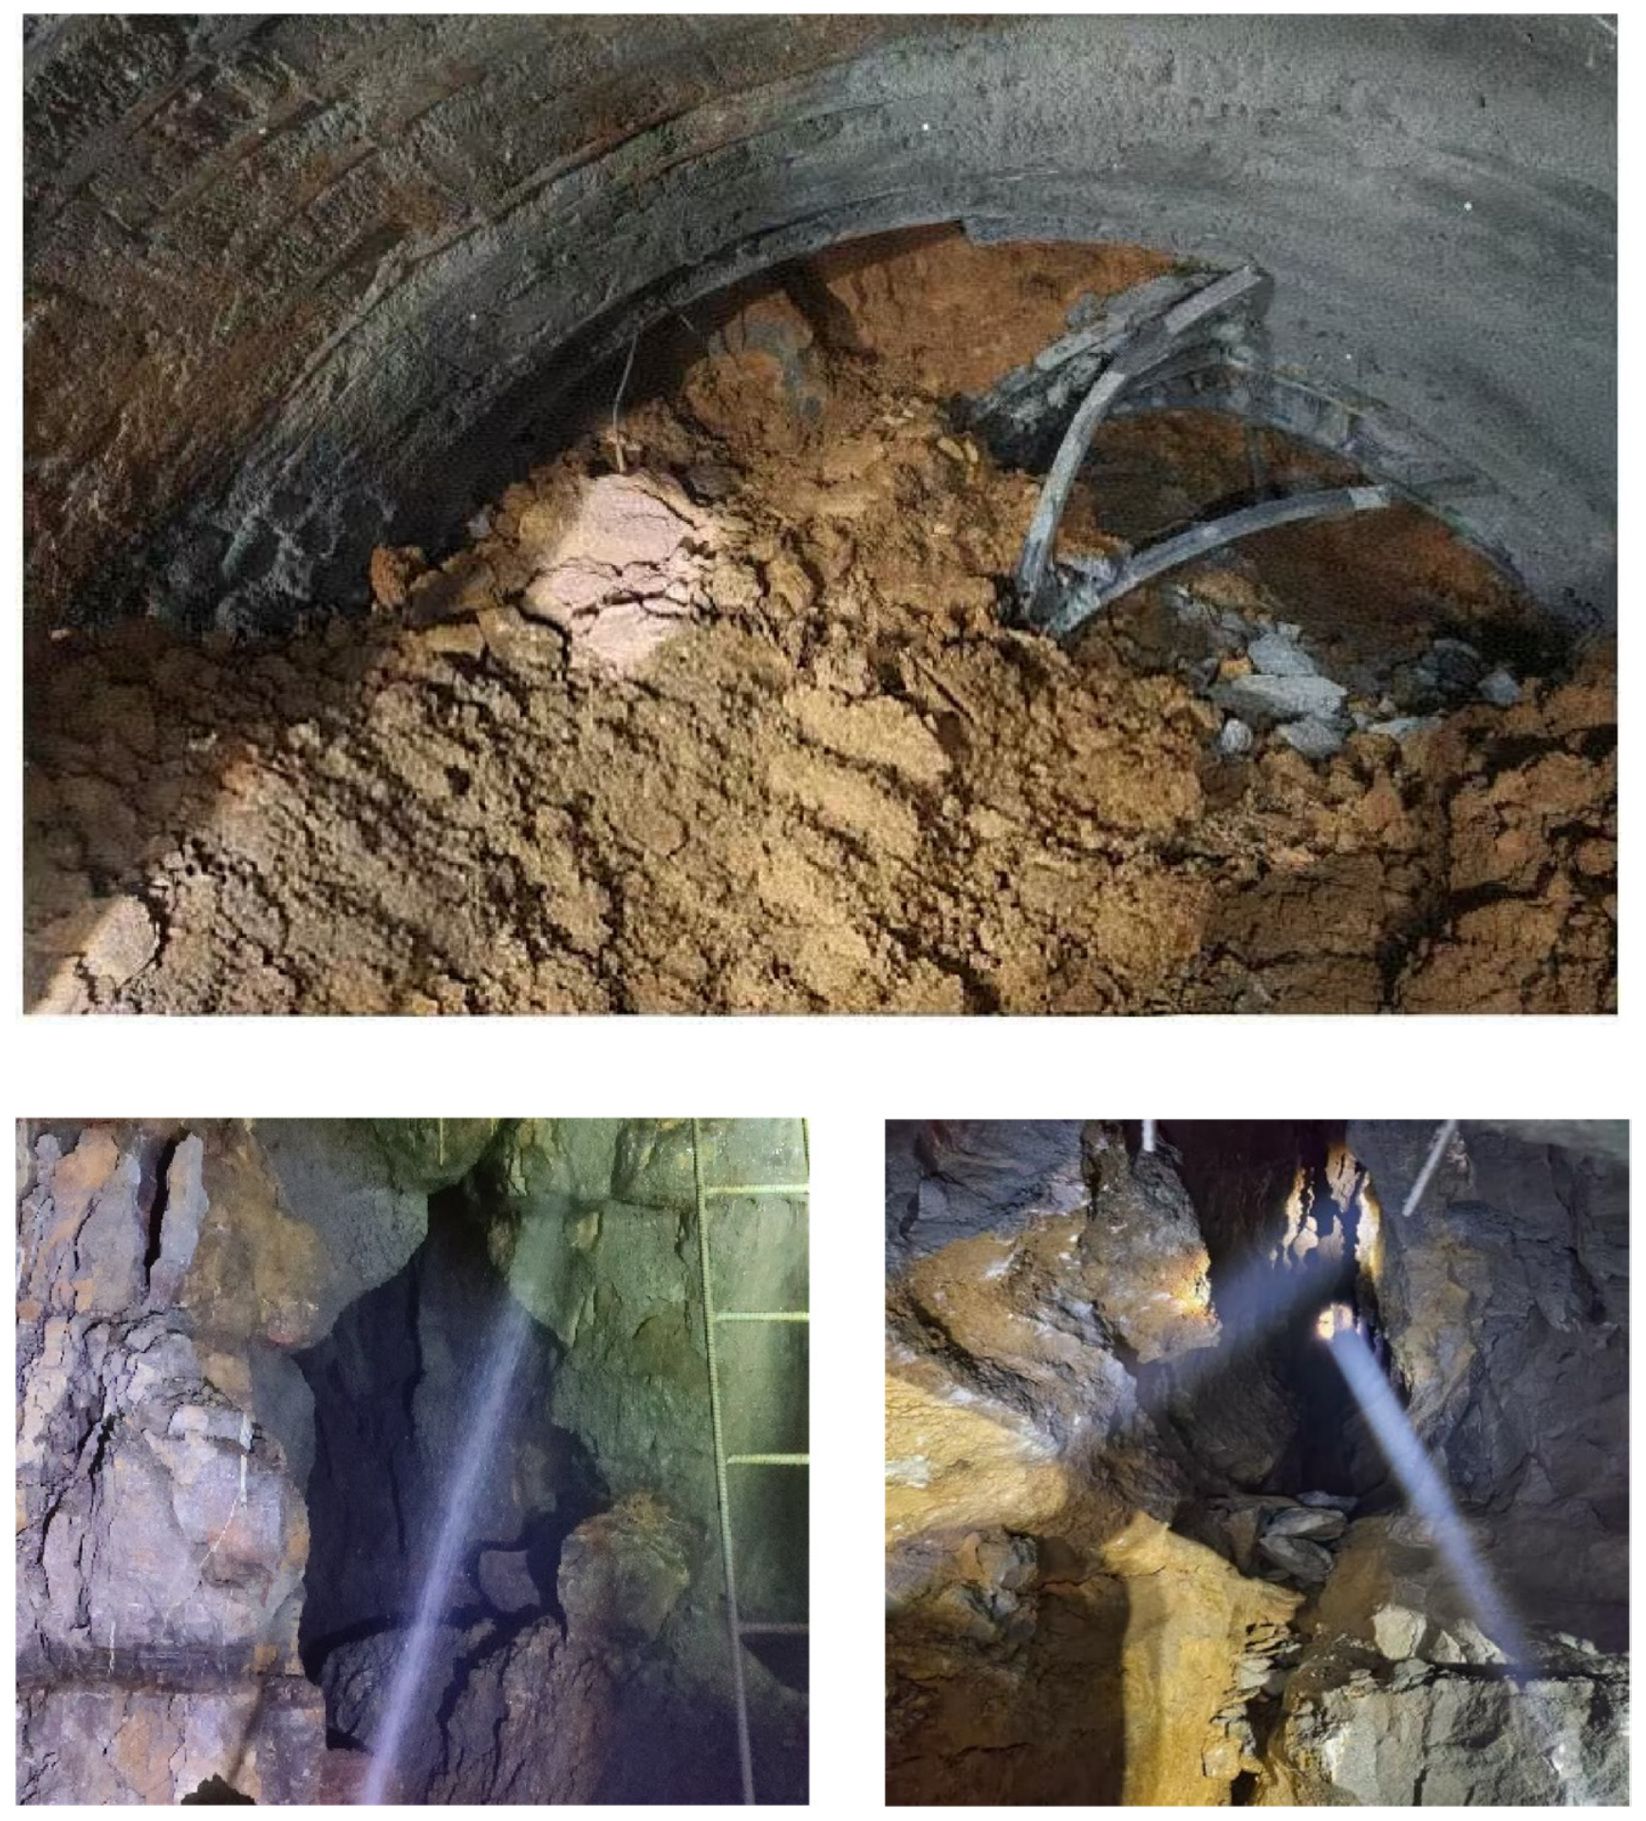
To guarantee the validity and precision of the assessment results, comprehensive site investigations and thorough analyses were conducted focused on the actual incidents of water and mud inrush that occurred within the Andangnong Tunnel (shown in Figure 9). The investigations uncovered the presence of a substantial karst cave located on the left arch side of the working face during the construction of the No. Y2-2 karst cave segment of the tunnel. This karst cave is located ahead of the tunnel face and consists of a fully filled cavity with argillaceous fillings, predominantly yellow clay mixed with gravel. Currently, a small amount of fissure water is present within the cavity. During the exposure process, a mud inrush occurred on-site, extending approximately 20 m along the tunnel. The measured flow rate was approximately 150 m3/h, with groundwater head approximately 85 m above the tunnel invert. The investigation results suggest that the Andangnong Tunnel has a greater risk of water and mud inrush disaster. This finding aligns with the outcomes derived from the evaluation using the cloud model. Such consistency serves to reinforce the credibility and dependability of the risk assessment conducted for water and mud inrush scenarios, particularly when utilizing the combined weight cloud model as the framework for analysis.
Figure 9.
On-site water and mud inrush disaster at the Y2-2 karst zone (Chainage K18+280, upper bench excavation, August 2023).
3.3. Risk Characteristics and Assessment Results After Karst Cave Treatment
Experts were invited to evaluate the special treatment plan. Following the abovementioned steps, the digital cloud characteristics of the comprehensive cloud were determined as (12.486, 9.229, 2.829, 2.938, 0.874, 0.889), as illustrated in Figure 10. After conducting the statistical analyses on 100 cycle tests, the probability distribution of the risk levels post-treatment was obtained. Results show that the risk level of the treated tunnel is Level IV with the average probability of 0.9268 (PI = 0.0018, PII = 0.0024, PIII = 0.0691, PIV = 0.9267), indicating a low risk. A comparison of the average probabilities of various risk levels before and after treatment reveals that the risk levels are more favorable post-treatment. Consequently, it is concluded that the karst water treatment effect has met the anticipated expectations.
Figure 10.
Evaluation results after treatment: (a) 3D schematic diagram of risk assessment; (b) risk assessment plan (Red indicates high risk, orange indicates medium risk, yellow indicates general risk, and blue indicates low risk).
In addition, to isolate the effect of each treatment measure, a controlled factor analysis was conducted by re-assessing the risk with only a subset of measures applied. The analysis used the same FAHP-EWM framework with adjusted indicator scores reflecting the specific effect of each measure (shown in Table 8). First, curtain grouting, which directly targets the karst development (A11) and groundwater development (A42) indicators, reduced the effective permeability from 3~5 Lu to below 1 Lu, thereby improving the corresponding expert score from 63.3 to 28.5 (on a 0~100 scale, where lower values denote safer conditions). This hydrological confinement lowered the probability expectation Ex from 58.3 to 47.2, and correspondingly reduced the probability of Level II classification (PII) from 64.7% to 48.3%. Second, the dedicated drainage system (2 × 2.5 m tunnel plus ancillary ditches) diverted the predicted peak inflow from 150 m3/h to below 20 m3/h entering the main tunnel, directly improving the groundwater flow indicator (A43) and reducing the consequence expectation Ey from 42.2 to 33.1 (a 21.6% improvement in the consequence dimension). Then, the impact-resistant reinforced concrete lining (50 cm thickness versus the standard 35 cm) enhanced structural resilience against dynamic water–mud impacts, further lowering the consequence severity by reducing the probability of tunnel collapse following an inrush event. The impact-resistant reinforced concrete lining alone reduced the consequence expectation Ey from 42.2 to 35.8, lowering the probability of Level II classification and slightly increasing p (Level IV) from 0.6% to 5.4%. Finally, the real-time monitoring and early-warning system improved the vibration effects indicator (A52) from 61.3 to 29.7 by enabling rapid hazard detection and timely personnel evacuation, thereby compressing the residual uncertainty band. Collectively, while no single measure sufficed to achieve Level IV, the stepwise integration of these four interventions—progressing from source sealing (grouting), to water diversion (drainage), to structural reinforcement (lining), and finally to intelligent surveillance (monitoring)—synergistically reduced the overall risk classification from Level II to Level IV, underscoring the necessity of a multi-tiered rather than a single-pronged treatment strategy. The analysis reveals that no single measure is sufficient to achieve Level IV, and the risk reduction results from synergistic effects. The combination of grouting and drainage accounts for approximately 29.9% of the total risk reduction. The ‘prevention first, combining drainage and blocking’ strategy proves essential, the isolation of water sources (grouting) and diversion of remaining water (drainage) together are more effective than any single approach.
Table 8.
Quantitative assessment of the contribution of each treatment measure.
4. Discussion
To demonstrate the practical advantages of the proposed method, three representative methods (FAHP-Single Cloud, EWM-Single Cloud, and AHP-2D Cloud) were adopted to predict the risk of the Andangnong Tunnel pre-treatment conditions. As shown in Table 9, notable differences emerge beyond the simple classification. The FAHP-Single Cloud and traditional AHP-Cloud methods, lacking the consequence dimension, cannot distinguish whether the risk is primarily probability-driven or consequence-driven, a distinction critical for treatment prioritization. The EWM-Single Cloud method, relying solely on objective data variability, produced a Level III classification (underestimating risk), demonstrating the necessity of integrating expert knowledge when geological data are incomplete. The AHP-2D Cloud captured both dimensions but retained the subjective bias of the 1–9 AHP scale without objective calibration.
Table 9.
Comparison of several risk assessment method.
The proposed FAHP-EWM-2D cloud model provides a systematic framework for water inrush risk assessment in karst tunnels. The application to the Andangnong Tunnel demonstrates several practical features, including the combined weighting balances subjective expert knowledge with data-driven variability, the two-dimensional cloud captures both risk probability and consequence severity, and the pre-/post-treatment reassessment enables quantitative evaluation of risk mitigation effectiveness. The pre-treatment Level II classification was validated by the subsequent No. 2-2 mud-inrush event, while the post-treatment Level IV reduction was corroborated by monitoring data (inflow < 20 m3/h; deformation < 0.2 mm/d). Compared to existing methods [18,19,20], our approach achieves improved expert consistency (CR reduced from 0.12 to 0.045) and provides a more comprehensive risk representation through the dual probability-consequence dimensions. However, the methodological distinction is incremental rather than transformative, and the core contribution lies in the systematic integration of FAHP-EWM combined weighting with a two-dimensional cloud model in a pre-/post-treatment assessment framework.
Several limitations should be acknowledged. The method depends on expert judgment; while Krippendorff’s α = 0.84 confirms acceptable inter-rater reliability, the accuracy ultimately relies on panel quality. For projects with limited expert availability, performance would likely degrade. The post-treatment Level IV result is primarily a model-based reassessment; although corroborated by monitoring data, independent validation through additional case studies is needed to establish generalizability. The EWM inputs are judgment-derived rather than purely objective field measurements. Sensitivity analysis confirms that the Level II classification remains stable across 100 stochastic simulations (SD = 3.5%) and varying He (0.5–2.0: PII = 63.5–66.2%). For transferability to other tunnels, indicators should be adapted to local geology, and a minimum panel of 4 experts is recommended. Future research should focus on continuous updating using real-time monitoring data, multi-hazard coupling, and reducing expert dependence through field measurement protocols or machine learning.
5. Conclusions
An integrated framework was constructed for water inrush risk assessment, designed to address the inherent uncertainties in karst strata through the synthesis of expert judgment and objective data analysis. This framework utilizes an innovative integration of the Fuzzy Analytic Hierarchy Process (FAHP) and the Entropy Weight Method (EWM) to determine comprehensive indicator weights, effectively mitigating the biases associated with singular weighting approaches.
The combined weights are subsequently integrated into a 2D cloud model, facilitating a mathematically rigorous representation of both the fuzziness and randomness inherent in water inrush disasters. This combined methodology establishes a more robust, quantitative foundation for risk evaluation in complex geological settings where conventional methods prove insufficient.
The FAHP-EWM combined weights based 2D cloud model was adopted to assess the risk of water inrush disaster in the Andangnong Tunnel of the Congjiang–Rongan–Lipu Highway before and after treatment. The assessment results indicate its risk level before the treatment is greater risk (Level II), which is consistent with the conclusion of the project’s special construction safety risk assessment, verifying the feasibility and effectiveness of this method. Furthermore, corresponding treatment measures were taken for the significantly influential Karst Caves Y5-2 and Y2-2, reducing its risk to low risk (Level IV), providing a theoretical basis for risk management and control in karst tunnel construction.
This study achieves visualized level assessment of tunnel water inrush risk, providing an analysis tool and decision-making basis for construction safety in tunnels through water-rich dissolution strata.
Author Contributions
Conceptualization, Y.Z.; methodology, Y.Z. and P.L.; investigation, Y.Z., P.Y. and G.H.; validation, G.H. and X.L.; data curation, P.Y. and P.L.; writing—original draft preparation, Y.Z. and P.Y.; supervision, B.L.; funding acquisition, Y.Z., B.L. and X.L. All authors have read and agreed to the published version of the manuscript.
Funding
This research was funded by National Natural Science Foundation of China, 42302316, Yuan Zhou; National Natural Science Foundation of China, U22A20234, Bin Liu; National Natural Science Foundation of China, 12572462, Xuewei Liu; National Natural Science Foundation of China, 42677234, Yuan Zhou; Hubei Provincial Science and Technology Innovation Talent Program, Grant No. 2026DJA076, Yuan Zhou.
Data Availability Statement
The raw engineering geological data involved in this research are not publicly available due to the confidentiality requirements of the construction project. The processed data supporting the findings of this study are available from the corresponding author upon reasonable request.
Conflicts of Interest
Author Guangliang He was employed by the company Shandong Tietou Energy Investment Group Co., Ltd. Author Peng Li was employed by the company The First Construction Engineering Company Ltd. of China Construction Second Engineering Bureau. The remaining authors declare that the research was conducted in the absence of any commercial or financial relationships that could be construed as a potential conflict of interest.
Appendix A
Table A1.
Risk probability score of evaluation index.
Table A2.
Entropy value (ej), difference degree (dj), and objective weight (wo) derived from the risk-probability scoring data.
Table A3.
Calculation of first-level combined weights using the matrix method (Equations (1) and (2)) with fully traceable independent expert scoring.
References
- Li, S.; Bu, L.; Shi, S.; Li, L.; Zhou, Z. Prediction for Water Inrush Disaster Source and CFD-Based Design of Evacuation Routes in Karst Tunnel. Int. J. Geomech. 2022, 22, 05022001. [Google Scholar] [CrossRef] [Scilit]
- Guo, D.-S.; Meng, F.-Y.; Wu, H.-N.; Yang, X.-X.; Liu, Z. Risk assessment of shield tunneling crossing building based on variable weight theory and cloud model. Tunn. Undergr. Space Technol. 2024, 145, 105593. [Google Scholar] [CrossRef] [Scilit]
- Chen, J.; Zhang, D.; Su, M.; Liu, X.; Mi, X. Analysis of tunnel water inrush accidents induced by stratum collapse models. Deep. Resour. Eng. 2025, 2, 29–40. [Google Scholar] [CrossRef] [Scilit]
- Zhang, T.; Qiu, H.; Zheng, G.; Cheng, H.; Chen, Z.; Diao, Y. Mechanism and countermeasures of water and soil inrush in shield tunnel. Acta Geotech. 2025, 21, 3023–3102. [Google Scholar] [CrossRef] [Scilit]
- Wang, J.G.; Ma, Z.; Cong, Y.R.; Yang, S. Acoustic behavior and time prediction method for water inrush of tunnel floor under osmotic water pressure. Results Eng. 2025, 26, 105547. [Google Scholar] [CrossRef] [Scilit]
- Li, L.; Jin, H.; Tu, W.; Zhou, Z. Study on the minimum safe thickness of water inrush prevention in karst tunnel under the coupling effect of blasting power and water pressure. Tunn. Undergr. Space Technol. 2024, 153, 105994. [Google Scholar] [CrossRef] [Scilit]
- Nie, L.; Jia, S.; Zhou, W.; Li, Z.; Jing, P.; Zhang, S. Assessment of water inrush hazards in tunnels using the inversion method of full-decay induced polarization with physical law constraints. Eng. Geol. 2025, 354, 108115. [Google Scholar] [CrossRef] [Scilit]
- Han, G.; Sheng, J.; Han, R.; Wang, H. Physics-inspired dynamic boosting framework for capturing water and mud inrush evolution in tunnel fault fracture zones. Tunn. Undergr. Space Technol. 2025, 166, 106973. [Google Scholar] [CrossRef] [Scilit]
- Banerjee, A.; Pasupuleti, S.; Singh, M.K.; Dutta, S.C.; Kumar, G.N.P. Modelling of Flow Through Porous Media over the Complete Flow Regime. Transp. Porous Media 2019, 129, 1–23. [Google Scholar] [CrossRef] [Scilit]
- Zhu, X.; Zhang, Z.; Yu, H.; Ge, H. Water inrush disasters behavior in weakly cemented red-bed tunnels using 3DEC-Flow coupled model. Tunn. Undergr. Space Technol. 2026, 170, 107380. [Google Scholar] [CrossRef] [Scilit]
- Li, Y.-L.; Zhou, X.-P. Numerical modeling of tunnel water inrush in a unified nonlocal general particle dynamics framework. Eng. Geol. 2025, 358, 108399. [Google Scholar] [CrossRef] [Scilit]
- Xie, J.; Yin, P.; Yang, X.; Yan, C.; Li, H.; Yan, D.; Fu, H. Study on the damage mechanism of water and mud inrush in a tunnel with water-rich fault zones based on experiment and numerical modeling. Tunn. Undergr. Space Technol. 2025, 161, 106575. [Google Scholar] [CrossRef] [Scilit]
- Lan, Q.; Zhang, Z.; Xu, P. Research on disaster-causing characteristics of water and mud inrush and combined prevention-control measures in water-rich sandstone and slate interbedded strata tunnel. Tunn. Undergr. Space Technol. 2025, 156, 106250. [Google Scholar] [CrossRef] [Scilit]
- Fan, H.; Li, L.; Chen, G.; Liu, H.; Gao, J.; Li, C.; Peng, X.; Zhou, S. Analysis method of the water inrush and collapse in jointed rock mass tunnels: A case study. Eng. Anal. Bound. Elem. 2023, 146, 838–850. [Google Scholar] [CrossRef] [Scilit]
- Wu, X.; Feng, Z.; Yang, S.; Qin, Y.; Chen, H.; Liu, Y. Safety risk perception and control of water inrush during tunnel excavation in karst areas: An improved uncertain information fusion method. Autom. Constr. 2024, 163, 105421. [Google Scholar] [CrossRef] [Scilit]
- Kong, H.-Q.; Zhang, N. Risk assessment of water inrush accident during tunnel construction based on FAHP-I-TOPSIS. J. Clean. Prod. 2024, 449, 141744. [Google Scholar] [CrossRef] [Scilit]
- Shi, S.; Xie, X.; Bu, L.; Li, L.; Zhou, Z. Hazard-based evaluation model of water inrush disaster sources in karst tunnels and its engineering application. Environ. Earth Sci. 2018, 77, 141. [Google Scholar] [CrossRef] [Scilit]
- Peng, Y.; Wu, L.; Zuo, Q.; Chen, C.; Hao, Y. Risk assessment of water inrush in tunnel through water-rich fault based on AHP-Cloud model. Geomat. Nat. Hazards Risk 2020, 11, 301–317. [Google Scholar] [CrossRef] [Scilit]
- Duan, B.; Chu, A.; Bu, L.; Li, Z.; Long, K. Safety Risk Evaluation of Water and Mud Inrush in Karst Tunnel Based on an Improved Weighted Cloud Model. Sustainability 2025, 17, 9328. [Google Scholar] [CrossRef] [Scilit]
- Sun, H.; Rui, Y.; Lu, Y.; Dai, Y.; Wang, X.; Li, X. Construction risk probability assessment of shield tunneling projects in karst areas based on improved two-dimensional cloud model. Tunn. Undergr. Space Technol. 2024, 154, 106086. [Google Scholar] [CrossRef] [Scilit]
- Eskesen, S.D.; Tengborg, P.; Kampmann, J.; Veicherts, T.H. Guidelines for tunnelling risk management: International Tunnelling Association, Working Group No. 2. Tunn. Undergr. Space Technol. 2004, 19, 217–237. [Google Scholar] [CrossRef] [Scilit]
- TB 10003-2016[S]; Code for Design of Railway Tunnel. China Railway Publishing House: Beijing, China, 2017.
- JTG/T D70-2010; Guidelines for Design of Highway Tunnel. China Communications Press: Beijing, China, 2010.

Disclaimer/Publisher’s Note: The statements, opinions and data contained in all publications are solely those of the individual author(s) and contributor(s) and not of MDPI and/or the editor(s). MDPI and/or the editor(s) disclaim responsibility for any injury to people or property resulting from any ideas, methods, instructions or products referred to in the content. |
© 2026 by the authors. Licensee MDPI, Basel, Switzerland. This article is an open access article distributed under the terms and conditions of the Creative Commons Attribution (CC BY) license.