


Abstract
Long-term water immersion can substantially alter the hydro-mechanical behavior of water-sensitive geomaterials used in highway subgrades. This study investigated the responses of highly weathered phyllite (HWP) and 2% cement-improved HWP (CIHWP) using a full-scale subgrade model subjected to prolonged water immersion and intermittent static surcharge loading. The degree of compaction, California bearing ratio (CBR), and dynamic deformation modulus () were measured during construction. After construction, earth pressure, pore water pressure, volumetric water content, and layered settlement were monitored. Both materials met the required compaction criteria. However, CIHWP exhibited better compactability and higher CBR and values. Following long-term immersion, water content increased across approximately 88% of the HWP profile, while the saturated area accounted for approximately 28% of the profile. Progressive wetting induced aggregate softening, stress redistribution, and increased deformation, with the final surface settlement reaching 9.3 mm under the applied static surcharge. In contrast, only approximately 12% of the CIHWP profile showed moisture changes, and its final settlement was 6.5 mm. These findings provide full-scale experimental evidence for understanding and improving the hydro-mechanical performance of water-sensitive geomaterials in transportation infrastructure, with direct implications for applied geotechnical engineering and subgrade stabilization.
1. Introduction
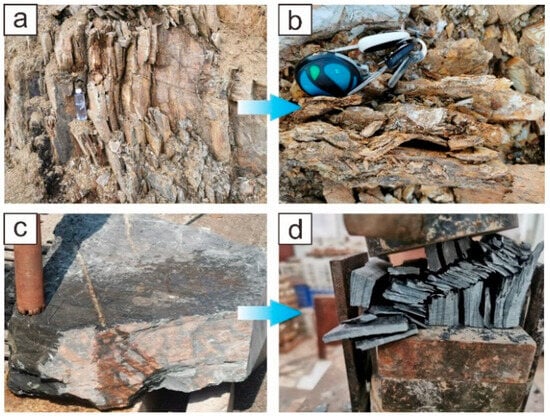
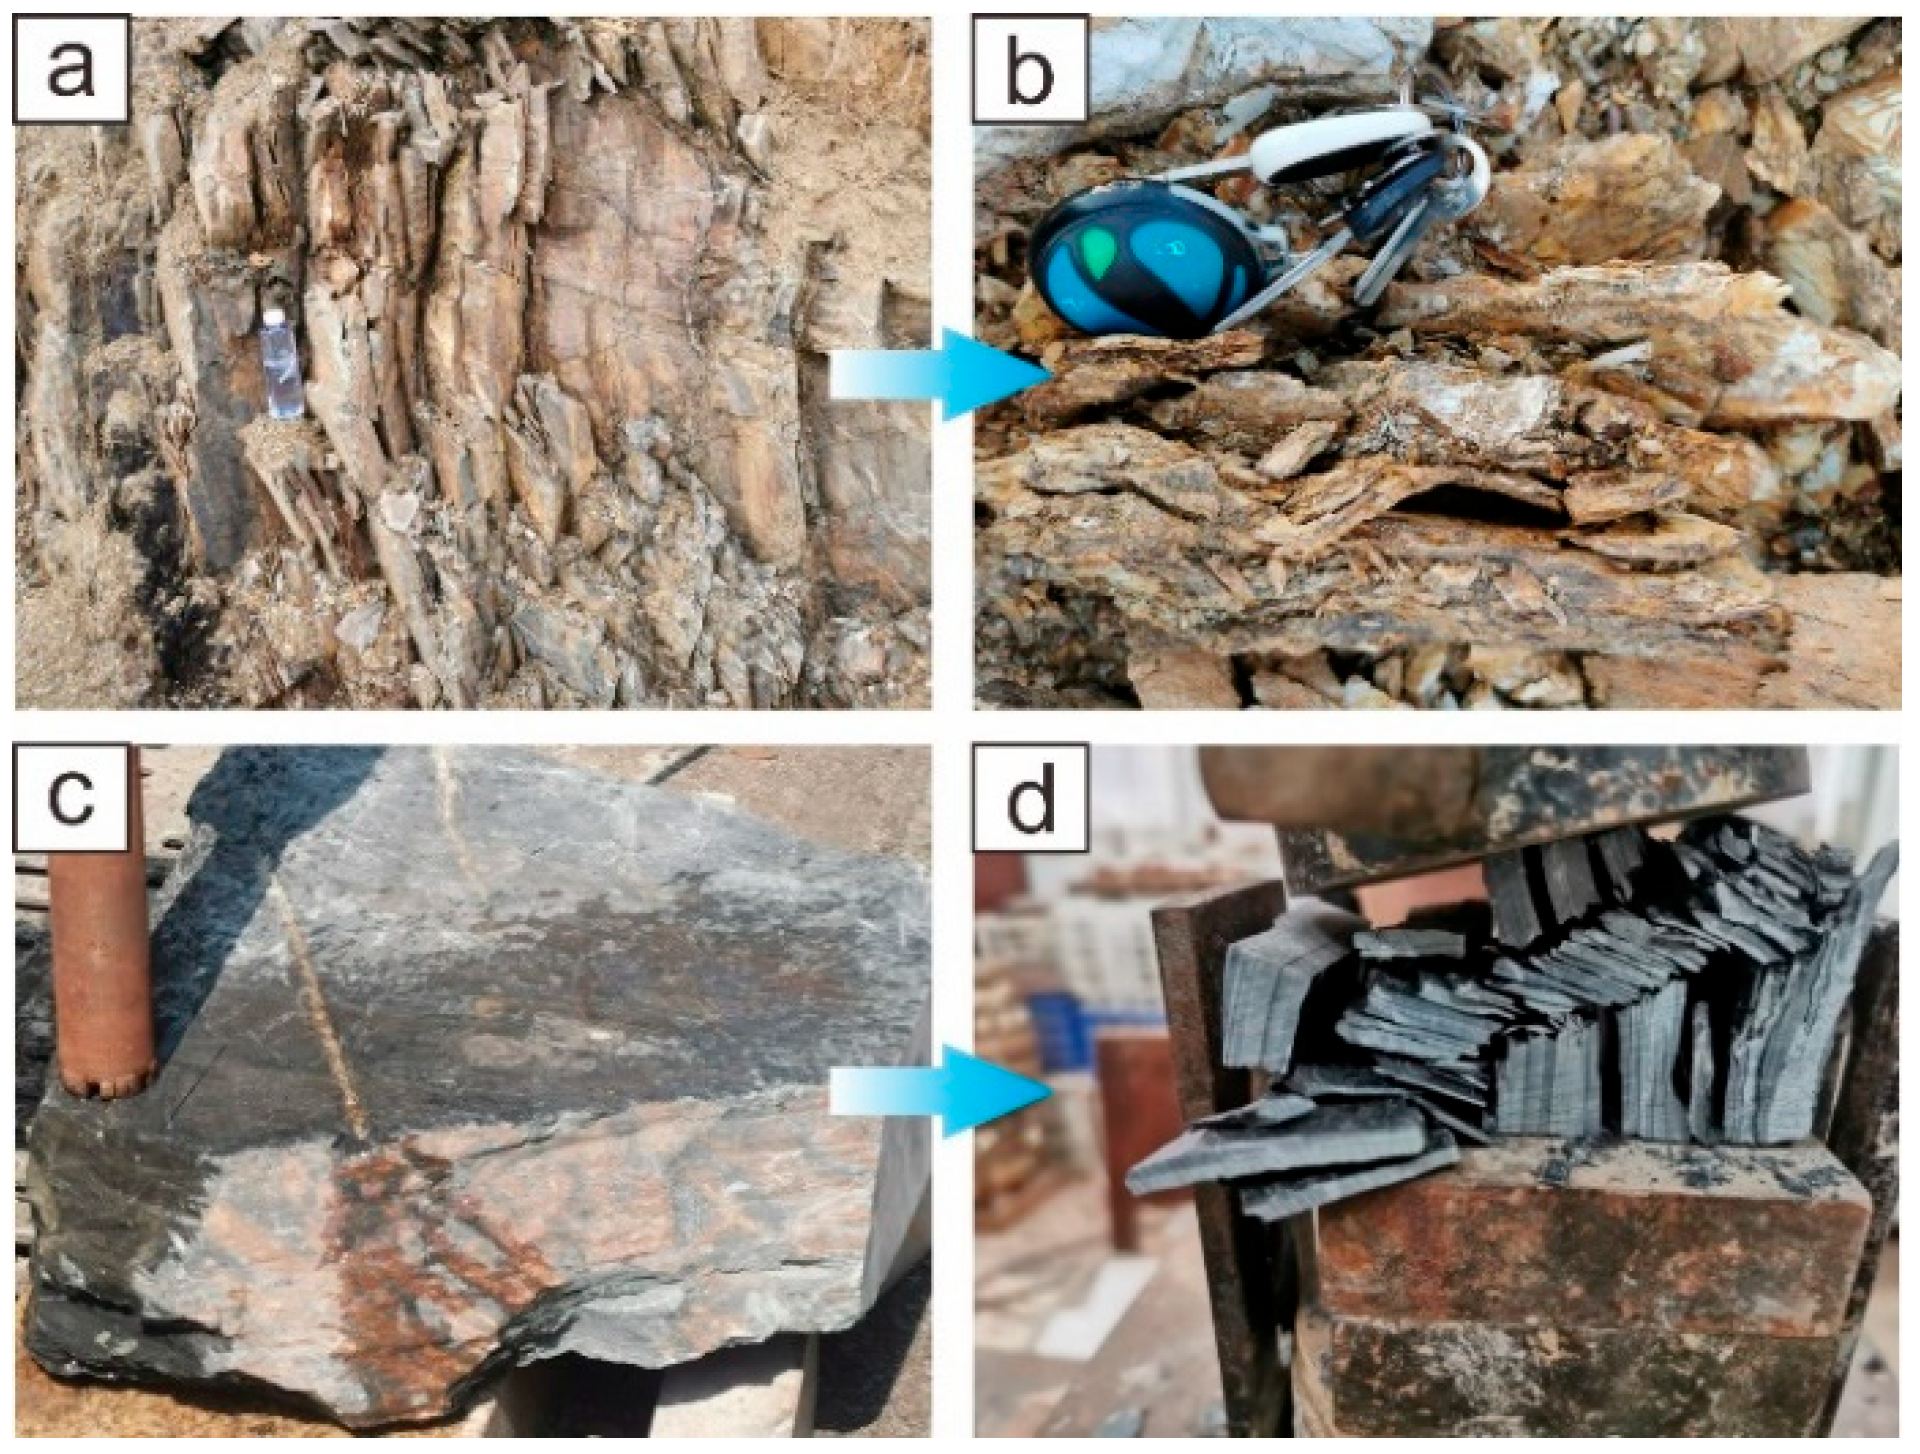
Phyllites are low-grade metamorphic rocks derived from clay-rich materials and are widely distributed in mountainous regions worldwide [1,2,3,4]. They contain abundant fine-grained phyllosilicates, which give them a smooth feel, while their well-developed cleavage allows them to split readily into thin slabs [5,6,7]. According to their degree of weathering, phyllites can be classified into highly weathered phyllites (HWP) and moderately weathered phyllites (MWP) (Figure 1). HWP is characterized by a higher degree of fragmentation and a lighter color, whereas MWP generally retains a more intact blocky structure and clearer preferential cleavage. Owing to its good compaction properties and low permeability, HWP has been used for various engineering purposes [2,6], although its application in earth structures such as road subgrades is limited by its pronounced water sensitivity [7].
Figure 1.
Highly weathered phyllites (HWP) and moderately weathered phyllites (MWP). (a) HWP outcrops; (b) preferential cleavage in HWP; (c) lumpy MWP; (d) MWP broken along the preferential cleavage.
Phyllites are widely distributed in the mountainous regions of China [8,9] and are considered potentially economical subgrade materials [4,10,11,12,13]. Several engineering projects have explored their use as subgrade aggregates [10,14,15,16,17], but the suitability of HWP remains debated. For example, HWP used as subgrade aggregate at a service area on the Guangyuan–Gansu Expressway in northwestern Sichuan initially met the applicable strength requirements (JTG D30-2015 [18]; JTG/T 3610-2019 [19]). However, after two rainy seasons, uneven settlement developed in the subgrade, producing undulations in the pavement surface, with a maximum settlement of 50 cm [16]. In contrast, considerable quantities of local HWP have been used in the subgrade of the Shiyan–Tianshui Expressway since 2010, with no serious problems reported to date [10]. These cases raise three questions for engineers:
- (1)
- Why and how do problems occur in HWP subgrade?
- (2)
- Can HWP be used as subgrade aggregates?
- (3)
- Is it necessary to improve HWP by adding some cementing agents?
The physical and geotechnical properties of HWP are key factors in determining whether it can be used directly as a subgrade material. Table 1 gives the unconfined compressive strength (UCS) and California bearing ratio (CBR) of HWP in different regions reported in some literature. Overall, the strength of HWP varies considerably among regions, reflecting differences in geological origin and weathering characteristics [20,21]. Accordingly, strength values reported for HWP from one region may not be directly transferable to materials from another geological setting. Mao et al. [10] stated that HWP can be directly used as subgrade aggregates once their strength meets the requirement (CBR > 3%). However, considering the water sensitivity of HWP and the aforementioned engineering cases, some researchers and engineers still hold that the improvement of HWP is necessary. Cement is considered a suitable stabilizer because of its accessibility, economy, and effectiveness in improving the engineering performance and water resistance of problematic soils used as subgrade materials. Researchers have also investigated the optimal cement content through laboratory tests [7,22,23,24] and field test sections [4,10,11]. Most of their results showed that the increase in cement content significantly strengthened the bearing capacity of HWP and the optimal cement content was in the range of 3–5%. Among them, Mao et al. [4] conducted pit-soaking tests to investigate the wetting deformation of cement-improved HWP. They found that adding 3% cement limited subgrade deformation to less than 0.5 mm after 24 h of immersion.
Previous efforts provided valuable references for utilizing HWP as subgrade aggregates, but the in situ applications need further study. One reason is that the initial strength of HWP measured in the laboratory and test section may not be decisive because of the possible strength decay after long-term wetting in nature [9,25]. Moreover, spatially nonuniform wetting and softening may induce differential deformation within the subgrade, thereby increasing the potential for localized cracking and progressive structural deterioration. The other important reason is that current field applications of HWP in test sections are mostly under normal working conditions or under well-designed protection, which are good for road safety but count against the scientific research for investigating the failure mechanism of HWP subgrade under extreme boundary conditions, such as long-term immersion and continuous heavy rainfall. Compared to the laboratory and test section experiments, physical model tests enable the control of the filler properties and boundary conditions, and also facilitate the monitoring of the internal physical field [26,27]; therefore, this is an effective method to evaluate the performance of HWP subgrade and to investigate the realistic failure mechanisms involved.
Al-Shaer et al. [28], Zhan and Jiang [29] and Ishikawa et al. [30] conducted reduced-scale laboratory model tests to study the dynamic responses of the high-speed railway subgrade under moving loads. However, reduced-scale model tests are problematic because of the scale effects [31,32] and thus are difficult to reproduce the correct stress field of subgrade in the laboratory [33,34]. Full-scale model tests can solve the issues above but are labor- and time-consuming to perform. Recent full-scale subgrade model tests mainly focused on the dynamic responses of high-speed railways [32,35,36,37,38,39]. Among them, Jiang et al. [38] investigated the dynamic performance of high-speed railways under rising water levels using a full-scale physical model and found that the dynamic responses developed faster and became larger due to the water level rising. Li et al. [39] conducted an in situ full-scale model test to investigate the dynamic response of water-softened subgrade under vibrating loads and found that the dynamic parameters appeared to decrease under water-immersion conditions. These physical model tests are highly significant for studying the failure process in the railway subgrade and its underlying mechanisms. However, physical model tests concerning the adaptability of subgrade materials in expressways under extreme conditions remain very scarce.
This study aims to evaluate the suitability of highly weathered phyllite (HWP) as an expressway subgrade material and to clarify its performance under long-term water immersion and intermittent static surcharge loading. A full-scale physical model consisting of untreated HWP and 2% cement-improved HWP (CIHWP) sections was constructed following Chinese expressway design and construction practice. During construction, the degree of compaction, dynamic deformation modulus (), and California bearing ratio (CBR) were measured to assess compaction quality. After construction, earth pressure, pore water pressure, volumetric water content, and vertical deformation were continuously monitored to characterize the hydraulic and mechanical responses of the two subgrades. By comparing the construction performance, water infiltration, stress redistribution, and deformation behavior of HWP and CIHWP, this study provides full-scale evidence for assessing the engineering applicability of HWP and for identifying conditions under which stabilization and water-control measures are required.
Table 1.
Summary of main road strength indexes of phyllites in different regions.
2. Full-Scale Model Test Program
2.1. Design of Model Test System
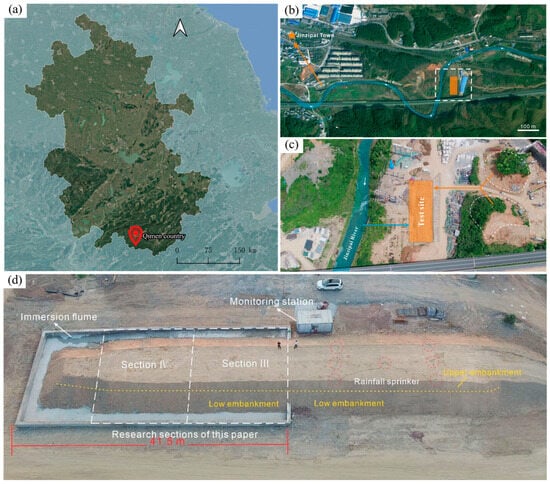
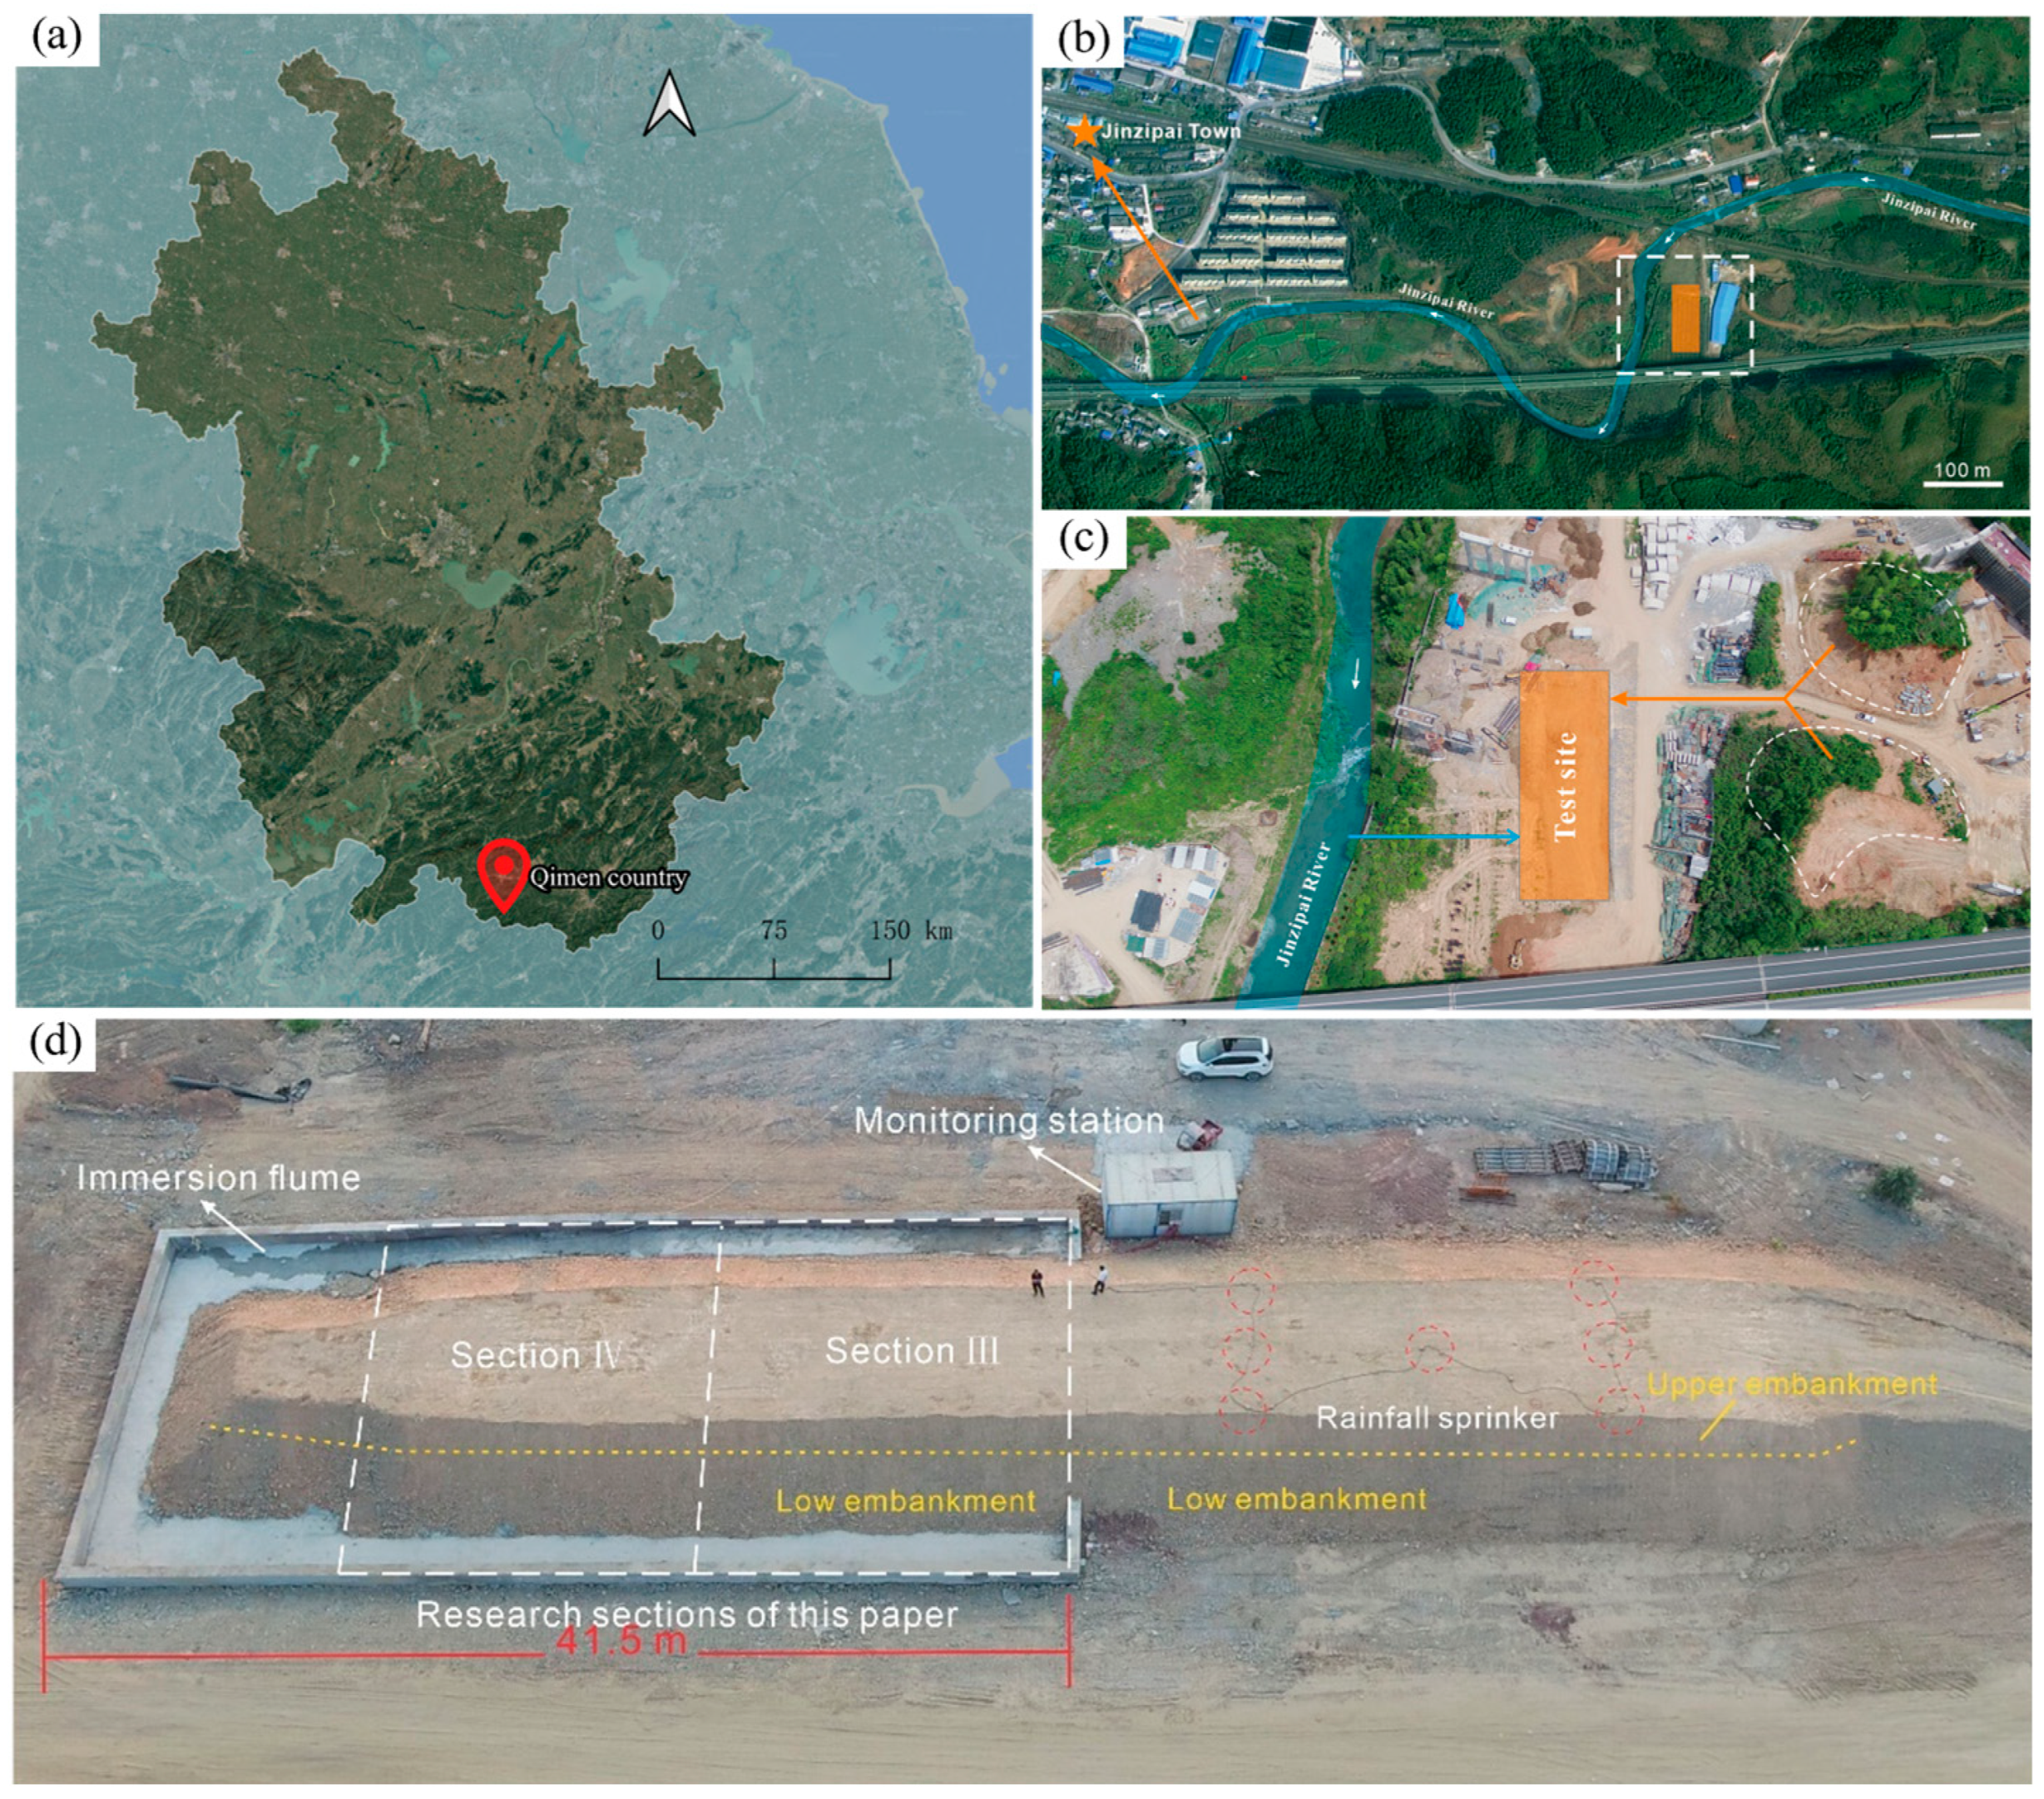
HWP spreads widely in mountainous regions of Southern Anhui, China, which significantly restricts the progress and cost savings of local expressway construction. To evaluate the suitability of HWP as an expressway subgrade material, a full-scale subgrade model was developed in accordance with the relevant Chinese design codes. The full-scale model tests were conducted in Qimen County, Huangshan City, Anhui Province, China in the summer of 2021 (Figure 2a). The test site was 80 m long and 30 m wide, providing sufficient space to carry out full-scale tests to achieve the same effect as the realistic construction situation. Several cutting slopes composed of HWP near the test site ensured an adequate source of subgrade materials. Meanwhile, on the western side of the test site lies the Jinzipai River, which can provide a sufficient water source for the tests (Figure 2b). Figure 2c shows the established physical model test system, consisting of a subgrade model, a water table control system, an artificial precipitation simulator and a monitoring station.
Figure 2.
Location and aerial views of the HWP subgrade model. (a) Geographic location of Qimen County; (b) Location of the test site in Jinzipai Town; (c) Detailed layout of the test site; (d) Top view of the immersion flume test platform, including research sections (Section III and Section IV), monitoring station, rainfall sprinkers, low embankment and upper embankment. (Map sources: Google Maps (satellite imagery; https://www.google.com/maps/ (accessed on 12 October 2026)) and Tianditu (administrative boundary data; National Platform for Common Geospatial Information Services of China, https://www.tianditu.gov.cn/, accessed on 12 October 2026). The map was prepared using QGIS 3.40.4-Bratislava).
In plan view, the subgrade model was 70 m long, 15.5 m wide at the base, and 6.5 m wide at the top. It comprised five sections for comparison (Table 2). In cross-section, the model was 3.0 m high, with a slope ratio of 1:1.5, and consisted of a lower embankment (2.1 m high) and an upper embankment (0.9 m high), as shown in Figure 2d. In this paper, sections III and IV were selected to study the performance of the CIHWP and HWP subgrades under immersion conditions.
Table 2.
Section division and corresponding boundary conditions of the subgrade model.
The water table control system consisted of a high-power pump, a water pipe and concrete retaining walls. The concrete retaining walls were 120 m long, 0.5 m wide and 1.6 m high, with 0.5 m buried in the ground. Geomembranes and cement were used to cover the surface of the subsoil to avoid water leaking from the immersion flume. The extended geomembrane (length of 3 m) in the longitudinal direction of the subgrade model was folded vertically along the interface between section-II and section-III, which acted as an impervious barrier. The above measures can maintain the impoundment level of the flume at 1 m. In addition, the impoundment level can be reduced by opening the drainage outlet at the bottom of the retaining wall or supplying water for the artificial precipitation simulator.
The artificial precipitation simulator was used to apply different rainfall conditions by changing the supply water pressure of the pump. It could provide a sufficient rainfall area covering the whole subgrade of section-I and section-II and a range of rainfall intensities between 10 mm/h and 50 mm/h.
The monitoring station was located on the western side of the subgrade model; it collected data measured by the sensors within the subgrade model and images from the high-definition cameras.
2.2. Materials
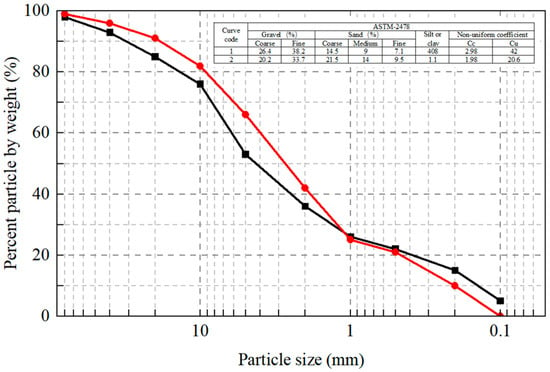
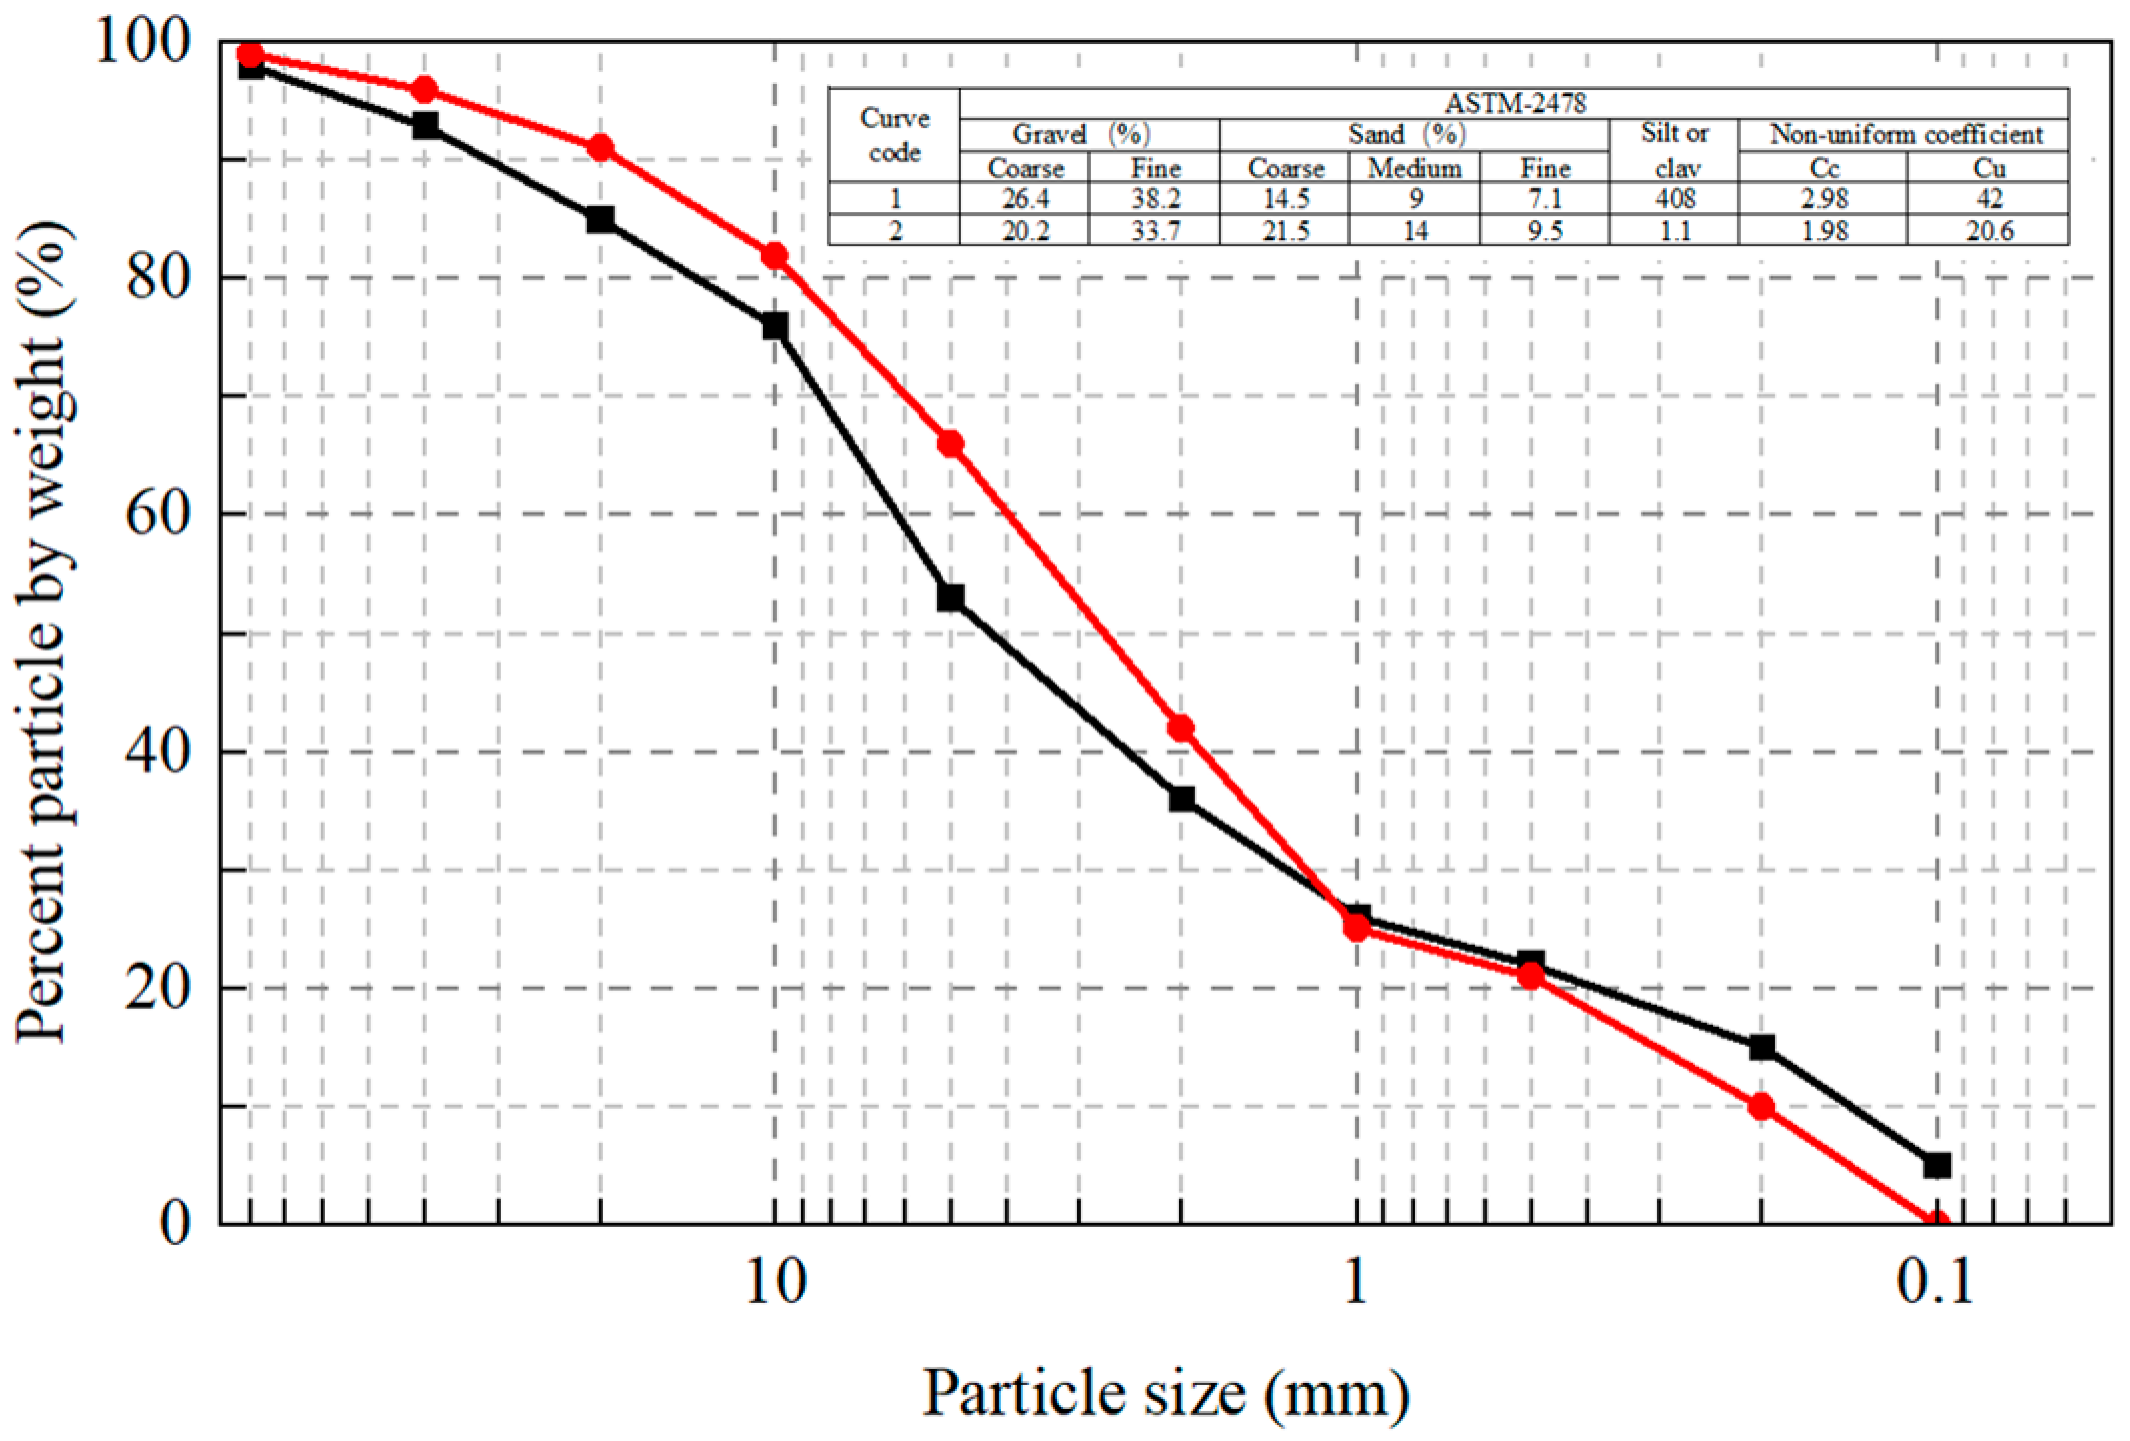
The HWP used in this study was collected from two cut slopes located approximately 100 m east of the test site. Its particle-size distribution is shown in Figure 3. The material consists mainly of gravel and sand and is classified according to ASTM D2487-11. The physical and mechanical properties of HWP are shown in Table 3. A point load instrument measured the UCS of the HWP under dry and saturated conditions. The results show that the saturated UCS of the HWP is much less than 30 MPa and the softening coefficient is 0.64. According to JTG/T 3610-2019, the HWP is classified as a typical softening rock and exhibits pronounced water sensitivity. The CBR values of HWP are 3.1%, 4.2%, 4.5% and 5.2% when the degrees of compaction are 93%, 94%, 96% and 99%, respectively. According to JTG/T 3610-2019, the HWP meets the critical strength requirements of the embankment (3% in the 93% compaction zone and 4% in the 94% compaction zone) and has the potential to be applied in the expressway subgrade. However, considering its significant water sensitivity, suitable treatment measures were suggested to improve its mechanical properties and long-term stability under harsh engineering geological conditions.
Figure 3.
Grain-size distributions of HWP used in the model test.
Table 3.
Physical and mechanical properties of the HWP.
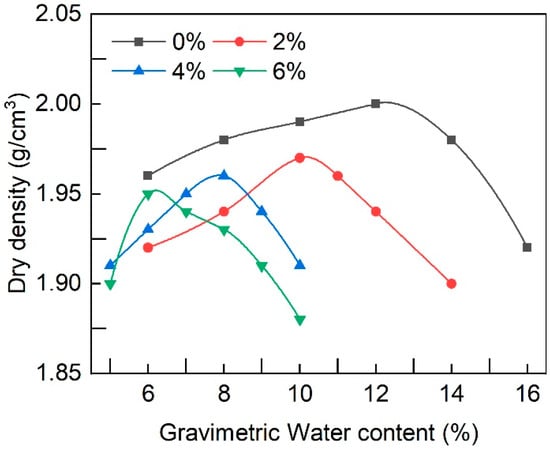
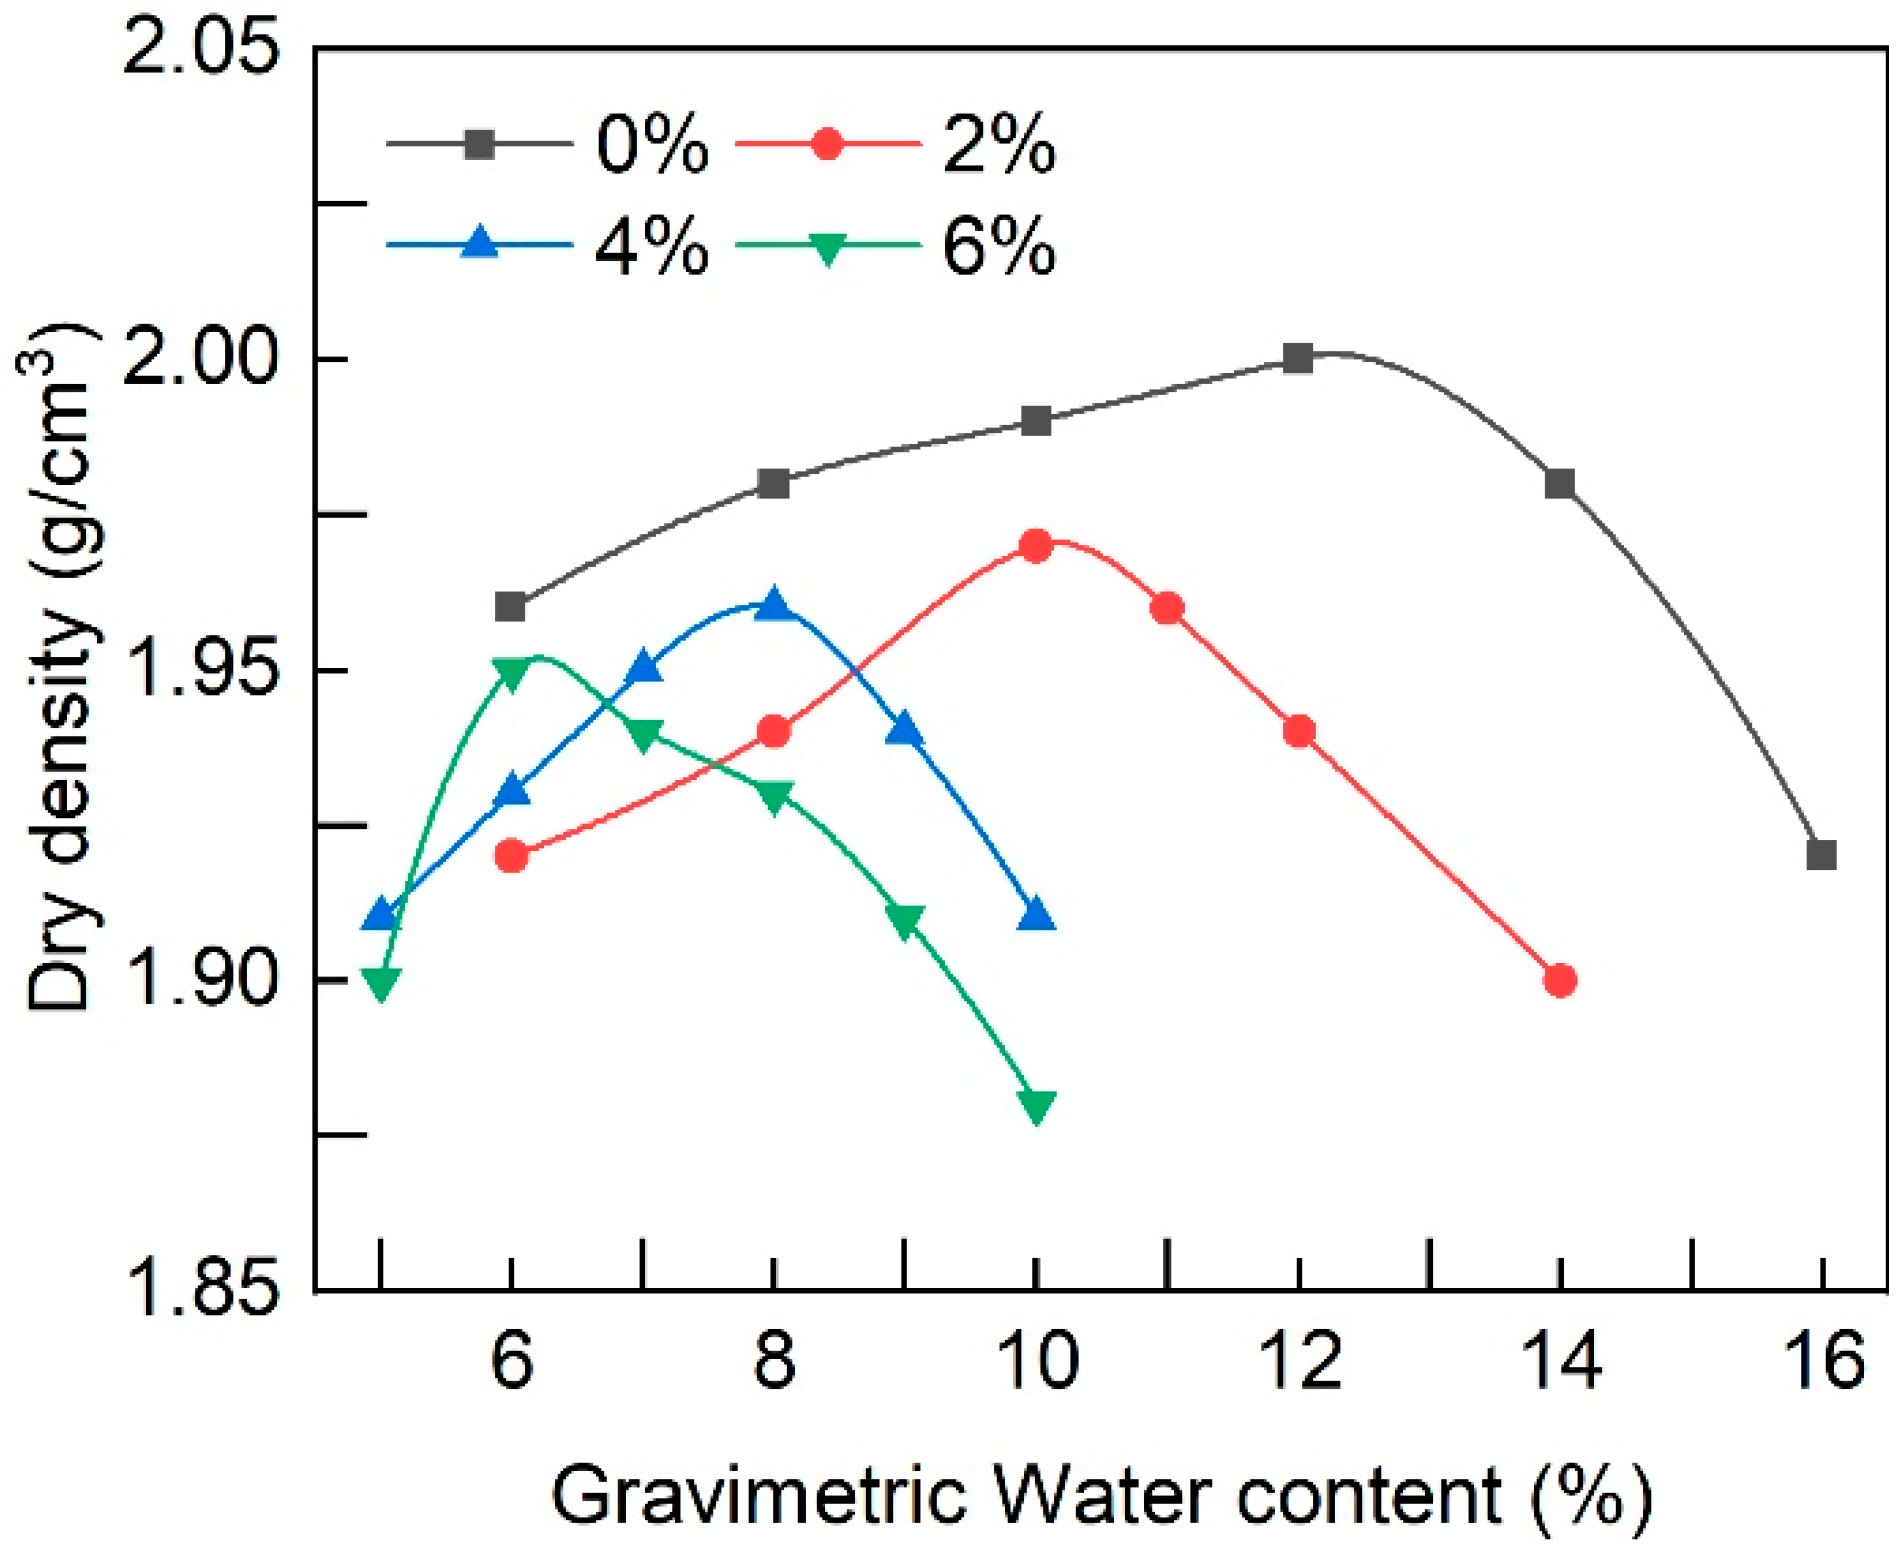
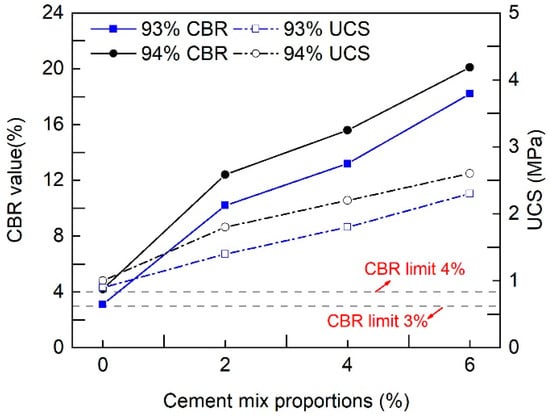
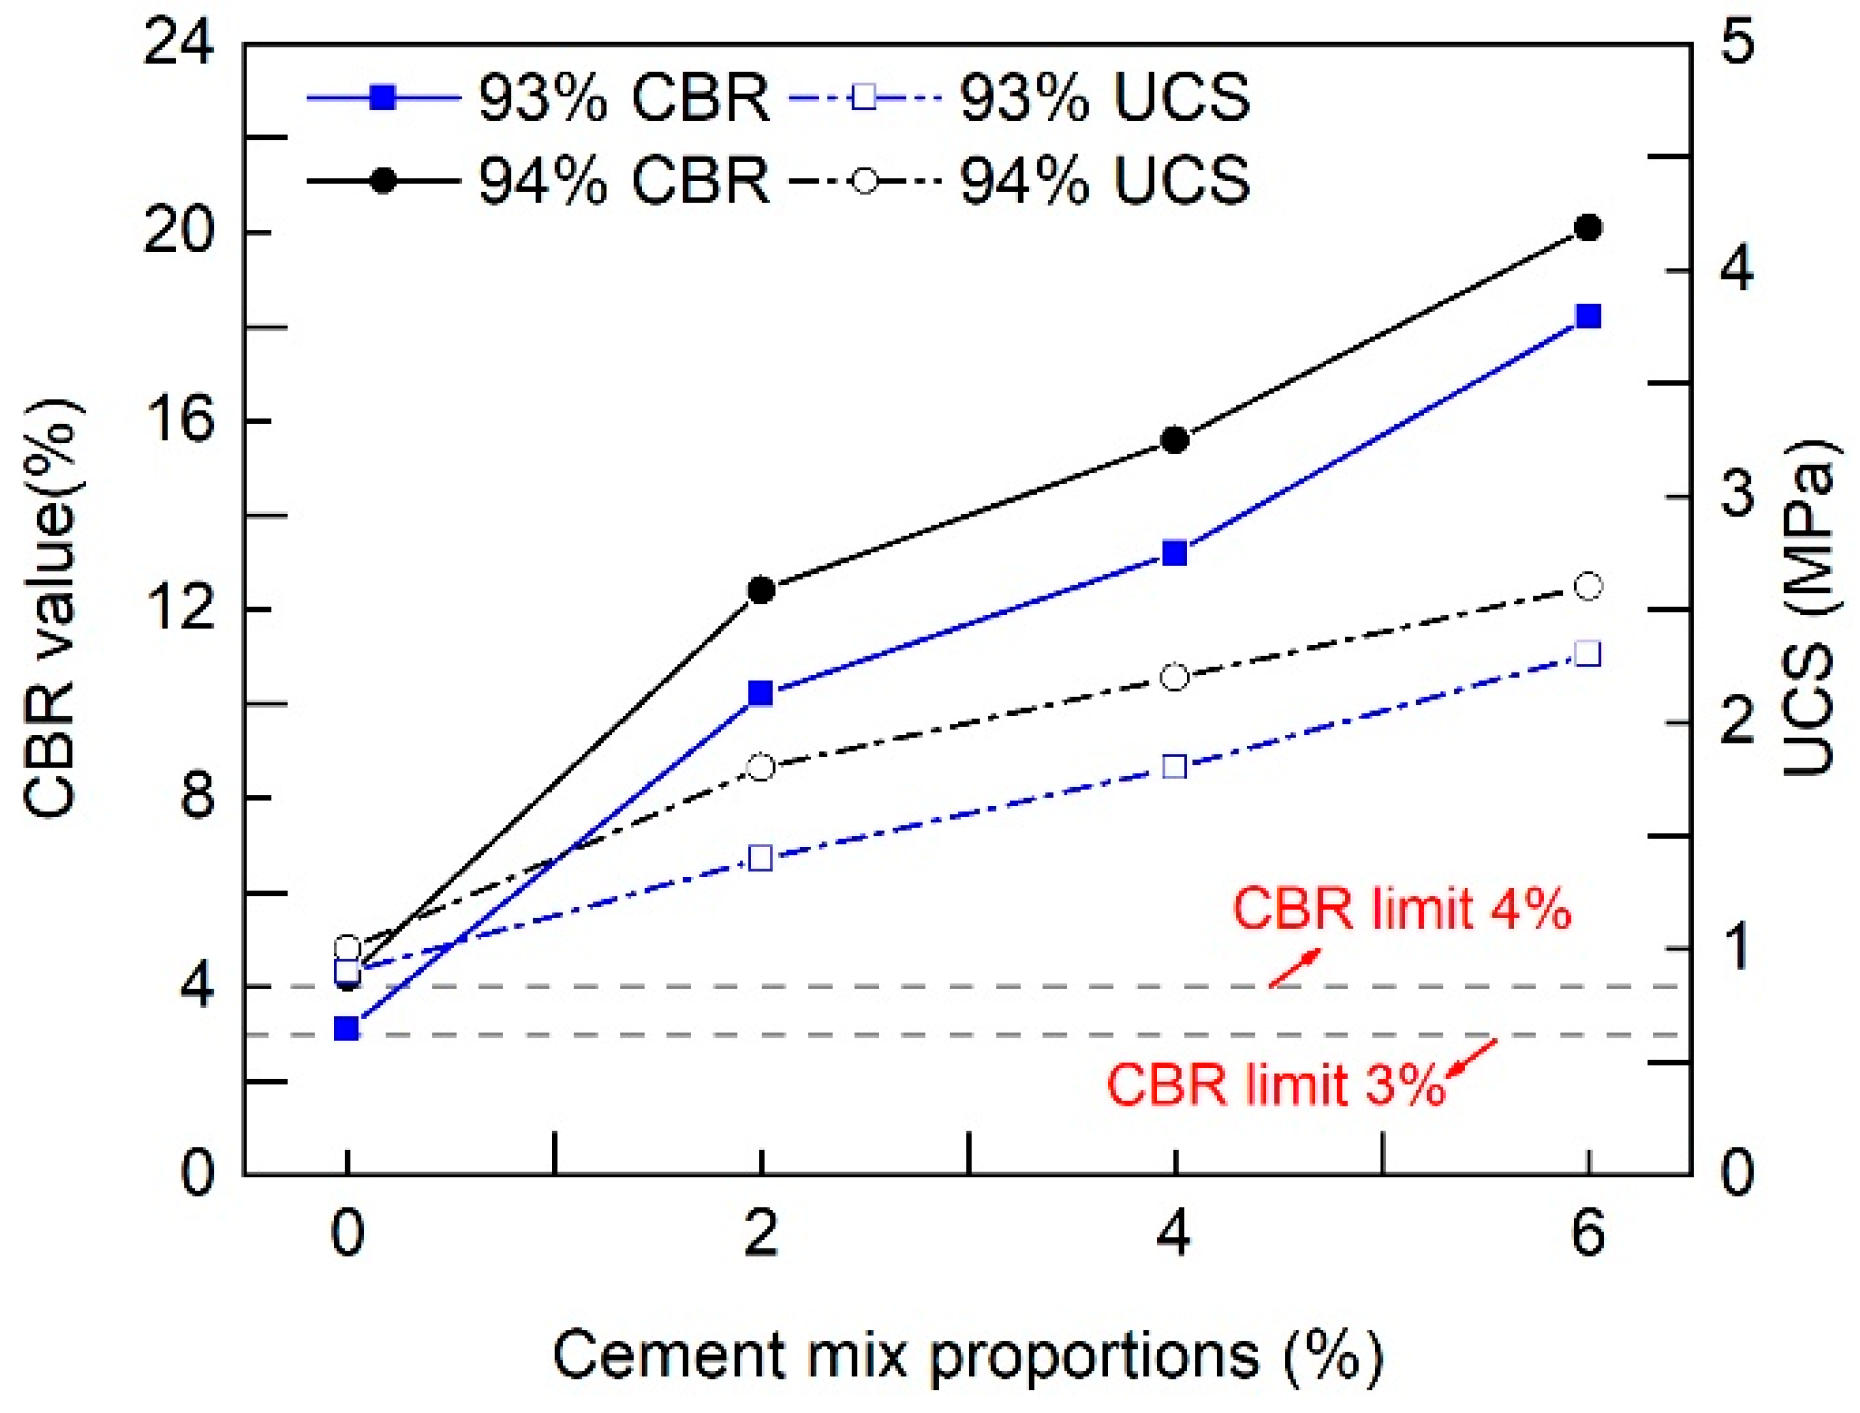
In this paper, the 425# cement was selected to improve the mechanical properties of the HWP. Figure 4 shows the standard compaction curve of the CIHWP with cement content of 0%, 2%, 4% and 6%. The maximum dry density and optimum moisture content decreased as the cement content increased. Figure 5 presents the UCS and CBR values reported by Mao et al. [4] for HWP treated with cement contents of 0%, 2%, 4%, and 6% after 7 days of curing (data reported by Mao et al. [4]). Overall, both the UCS and CBR show a significant linear improvement with the increase in cement content. Most importantly, the CBR value of each specimen under 93% and 94% degrees of compaction is much higher than the critical strength requirements for the embankment. Considering that 2% cement already provided CBR values satisfying the design requirements for the 93% and 94% compaction zones, this dosage was adopted for the full-scale CIHWP section to balance engineering performance and material consumption. The physical and mechanical properties of the CIHWP are listed in Table 4.
Figure 4.
Compaction curves of different cement content.
Figure 5.
Variations in CBR and UCS improved by different cement content after 7 days of curing.
Table 4.
Physical and mechanical properties of the CIHWP with the mix proportion of 2%.
2.3. Construction Program
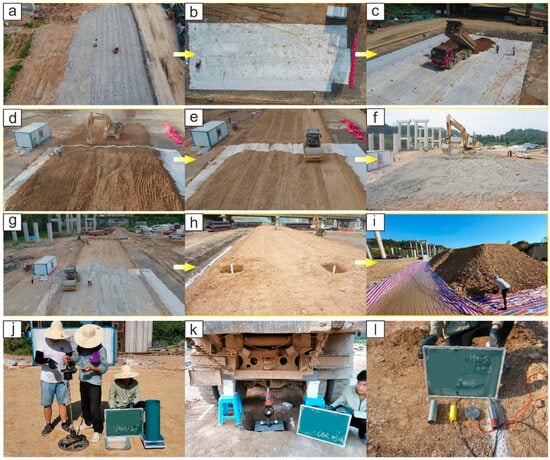
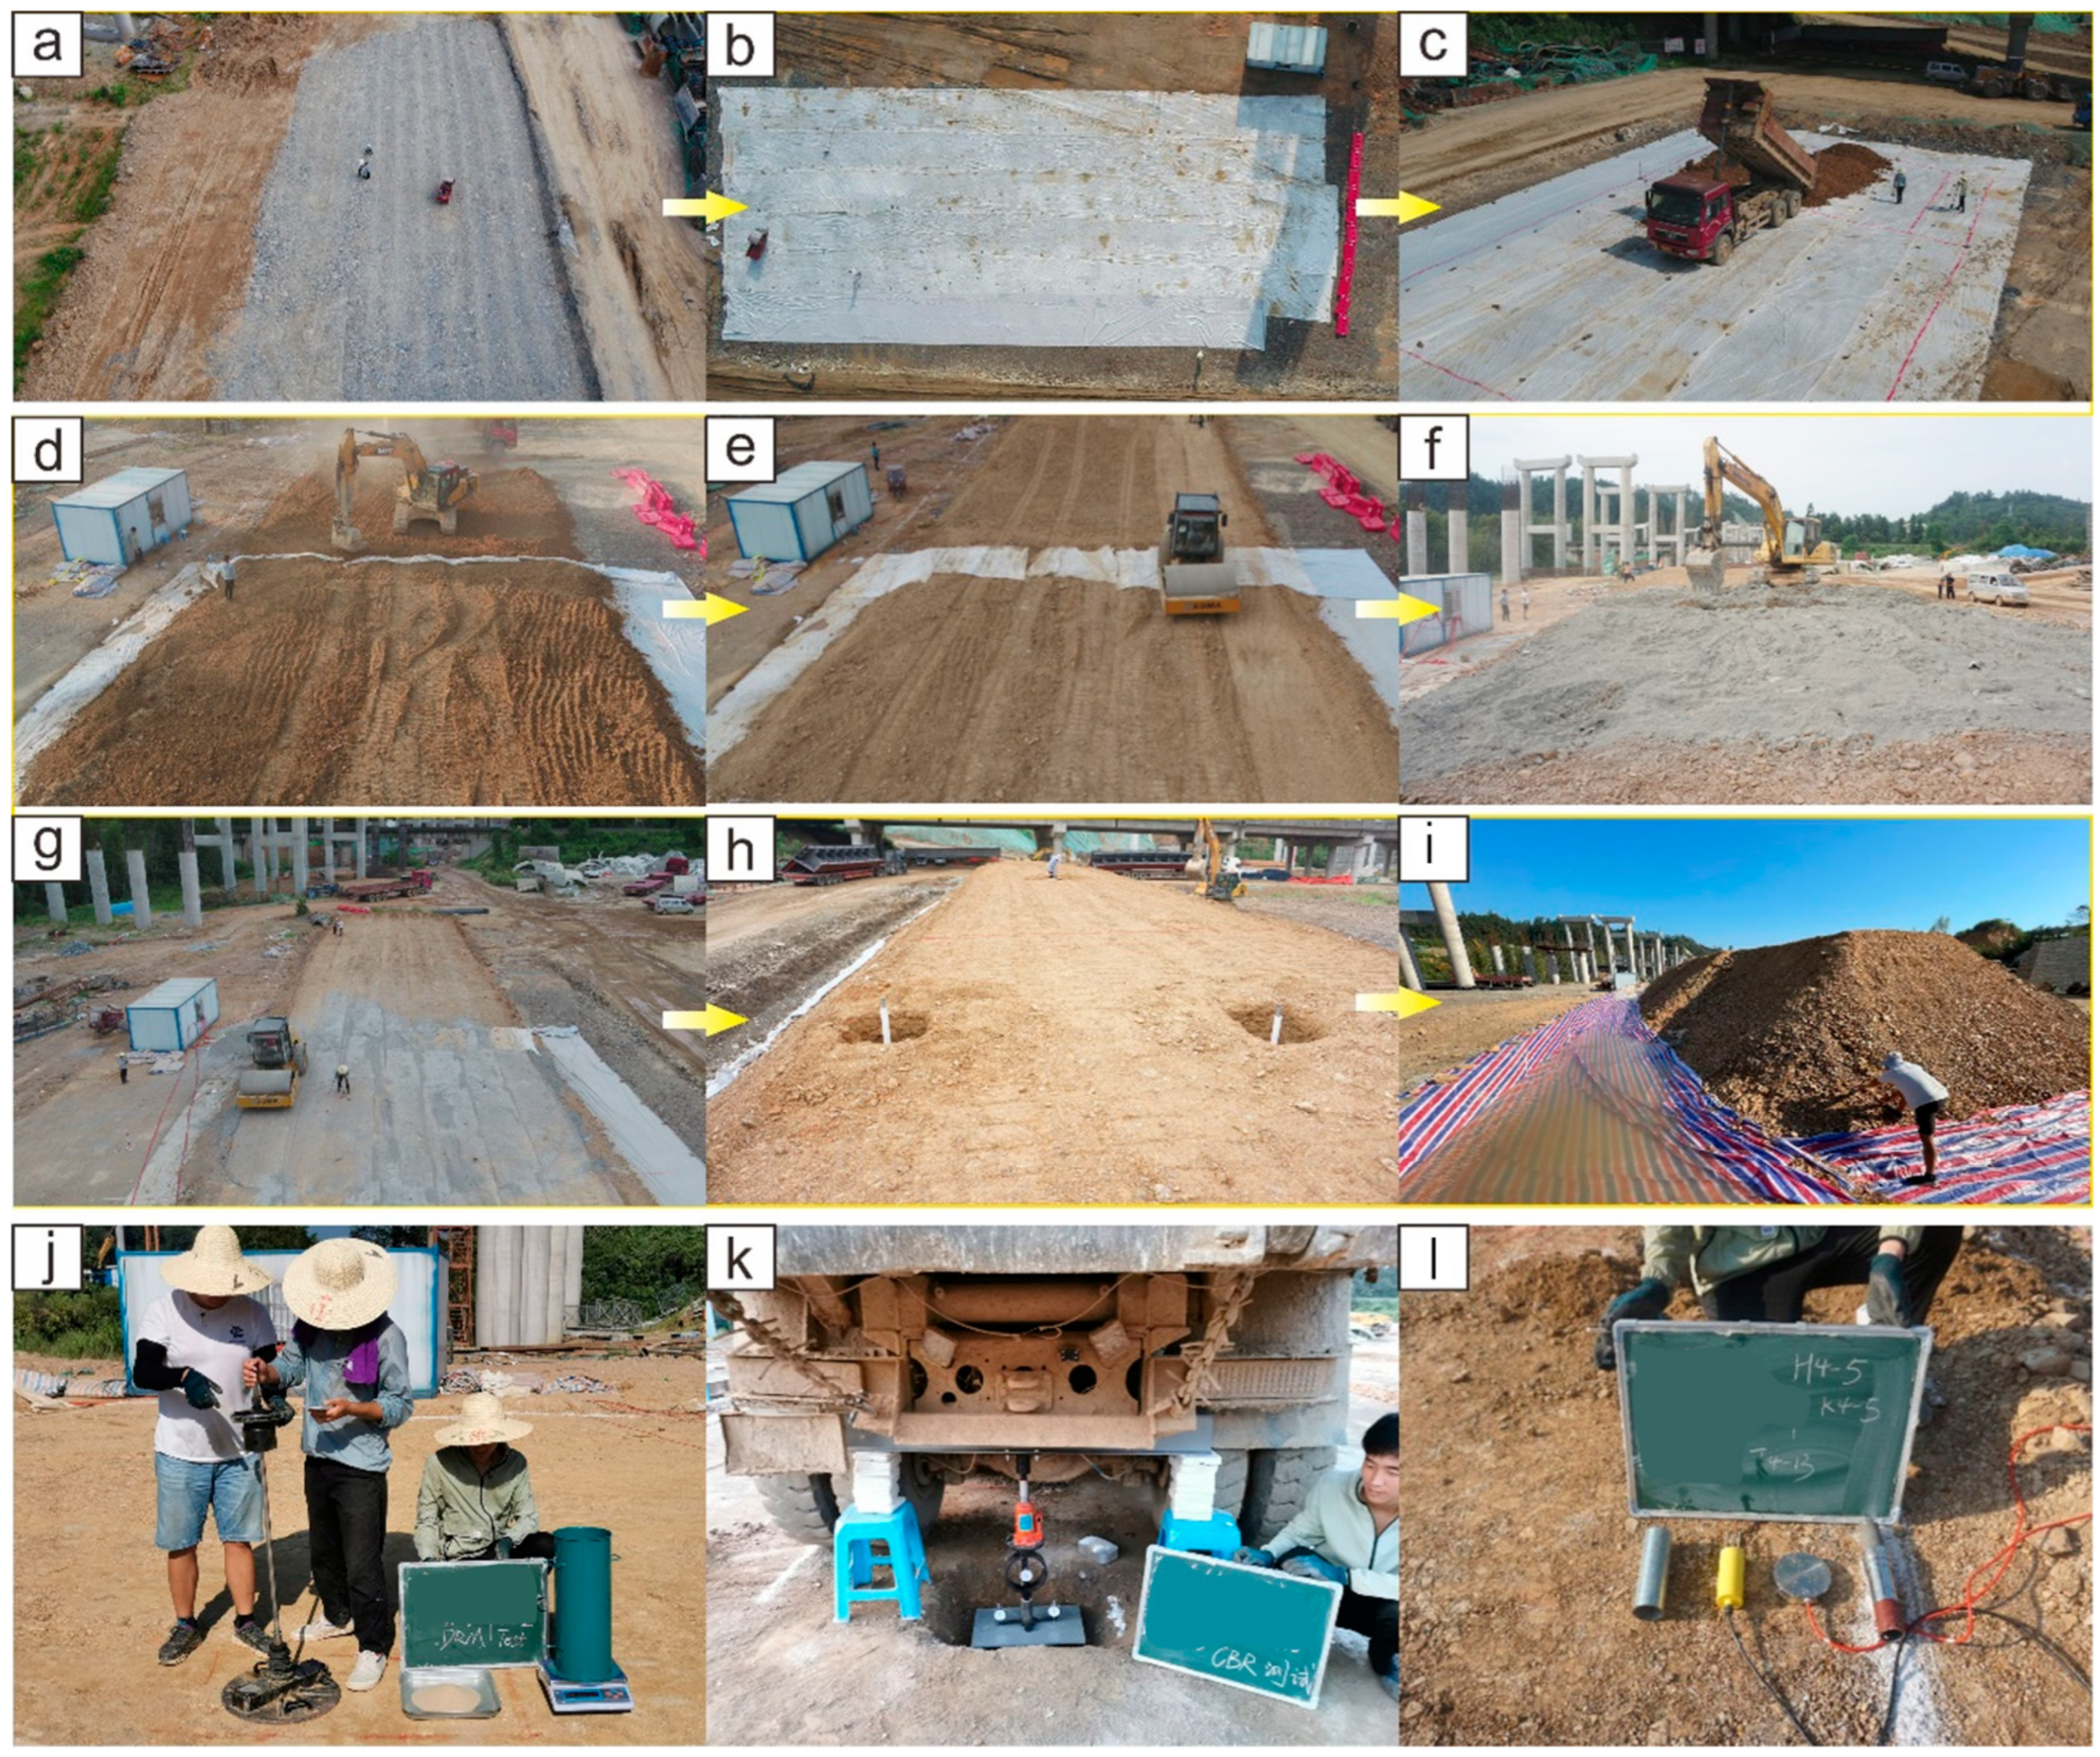
Figure 6 shows the main stages of construction of the subgrade model in accordance with JTG/T 3610-2019. The construction process is summarized as follows:
Figure 6.
Flow charts of the main process of subgrade construction: (a) foundation replacement with crushed broken stone; (b) covering geomembranes on the subsoil surface; (c) unloading sieved HWP in the grid; (d) leveling the HWP aggregates; (e) subgrade compaction and folded geomembranes along the longitudinal direction; (f) cement mixing; (g) compaction and quality examination of the CIHWP subgrade; (h) construction of retaining walls; (i) water storage; (j) test of degree of compaction and dynamic deformation modulus; (k) CBR test; (l) sensor installation.
- (1)
- The humus soil, topsoil, and turf to a depth of 0.5 m were removed and replaced with crushed stone within the test site. The backfill was leveled and compacted, making the bearing capacity satisfy the design requirements. Then, five geomembranes (50 m long and 4 m wide) were used to cover the surface of the backfill (Figure 6a,b).
- (2)
- The unloading range was characterized by white ash and red paint on the subgrade surface. HWP from the nearby cutting slopes was passed through a 150 mm sieve and unloaded into the grid from both sides to the central location. Then, the fillers were leveled according to the designed loose paving thickness (40 cm) and surface gradient (1% in this paper) of the subgrade (Figure 6c–e).
- (3)
- Before compaction, the moisture content of the HWP was adjusted to approach the either by spraying water or by exposing the material to sunlight. Then, the required quantity of cement (4.5 tons in a single layer) was mixed with the HWP aggregates at section-III using an excavator (Figure 6f,g). Cement-mixing uniformity was checked at six locations using the EDTA method, and the variation in the measured cement content was required to remain within 0.2 percentage points.
- (4)
- A vibratory roller (XG-626MH), weighing 26 tons, with an excitation force of 420/280 kN, a vibration frequency of 28/32 Hz and a vibration amplitude of 1.0–2.0 mm, was used to compact the subgrade model. Compaction was performed from the road shoulders toward the centerline, with an overlap of 100–150 cm between adjacent passes. The compaction sequence consisted of one initial static compaction (without vibration), one weak compaction (280 kN/32 Hz), three to eight cycles of strong compaction (420 kN/28 Hz, determined by whether the degree of compaction met the technical requirements) and one final static compaction. The roller speed was kept at 2–4 km/h throughout the compaction process. To reduce construction-induced variability between the HWP and CIHWP sections, both sections were constructed using the same HWP source area, screening procedure, layer thickness, moisture-conditioning procedure, roller type, compaction route, vibration conditions, and roller speed. For the CIHWP section, cement-mixing uniformity was checked at six locations using the EDTA method, and the difference in measured cement dosage was controlled within 0.2%.
2.4. Evaluation of Compaction Quality
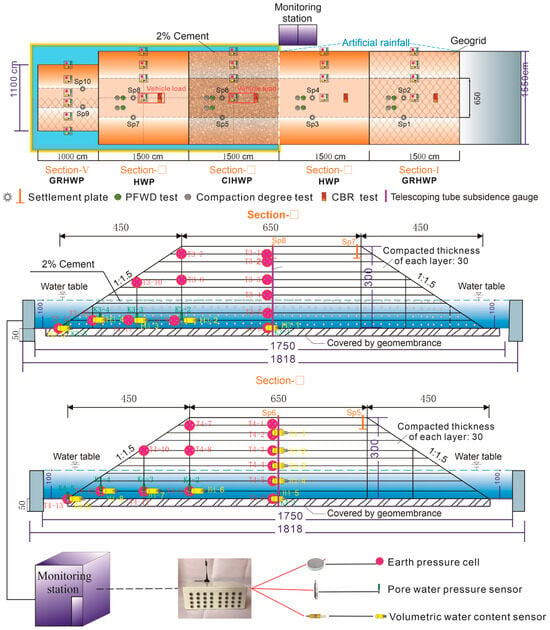
The subgrade model was constructed in 10 layers, each with a compacted thickness of 30 cm. During compaction, the degree of compaction, dynamic deformation modulus Evd and CBR value were measured to evaluate the compaction quality. The process and detailed layouts of test points in sections III and IV are shown in Figure 7.
Figure 7.
Schematic design of the locations of test points and sensors in the plane and vertical view.
The degree of compaction was measured using the sand-cone method (Figure 6j) in accordance with JTG/T 3610-2019. Compactness values were measured in the first two layers following each vibrated compaction cycle (regardless of static compaction). Then, the determined cycles of compaction for 93 and 94% compaction zones were applied in the remaining layers and the degree of compaction was measured only once in each layer. Meanwhile, the variation in particle gradation of the HWP aggregates was also investigated by using samples from the degree of compaction tests.
A portable falling weight deflectometer (PFWD; Figure 6j) was used to measure Evd at the same locations as the degree-of-compaction tests. The PFWD consists of a chassis, a drop hammer, a steel rod, and a data recorder and is widely used for rapid, nondestructive modulus estimation. In this paper, the weight and falling height of the hammer were 15 kg and 85 cm, respectively, and the diameter of the loading plate was 450 mm.
A field CBR test apparatus (LCB-2) was adopted to measure the CBR value on the surfaces of the 93 and 94% compaction zones. The apparatus was composed of a steel beam, a jack, a proving ring, a penetration rod and three dial gauges. The jack can provide a maximum pressure of 60 kN, which is also the maximum range of the proving ring. The detailed experiment process can be found in Field Test Methods of Highway Subgrade and Pavement JTG 3450-2019.
2.5. Layout of Monitoring Instrumentation
Figure 7 illustrates the locations of the monitoring instruments in sections III and IV, including 25 earth pressure cells (EPCs; JYTYJ-210; measurement range: 0–400 kPa; accuracy: 0.03%); 10 pore-water-pressure sensors (PWPs; JYKYJ-3036; measurement range: 0–100 kPa; accuracy: 0.08%); 14 volumetric-water-content sensors (VWCs; TDR-6A; measurement range: 0–50%; accuracy: ±2%); two telescoping-tube settlement gauges (CS-CJJ20; measurement range: 0–350 mm; accuracy: 0.1 mm); and four settlement plates (50 cm × 50 cm, 60 cm high; accuracy: 1 mm). Under the central line of the subgrade model, the EPCs were installed horizontally to measure the vertical stress along depth. Other EPCs deviating from the central line were installed vertically to measure the lateral earth pressure towards the outside of the slope. The PWPs and VWCs installed below the water table were to monitor the process of water infiltration and discharge. VWCs installed above the water table were to investigate the coverage of capillary water. Note that the VWCs were sheathed within a steel tube to avoid possible damage during compaction. Two telescopic settlement gauges were installed at the central subgrade of sections III and IV, respectively, to measure the layered settlement every 60 cm in depth. The settlement plates were installed in the 8th layer to monitor the vertical displacement that occurred at the central subgrade and subgrade slope.
2.6. Pattern of Boundary Conditions
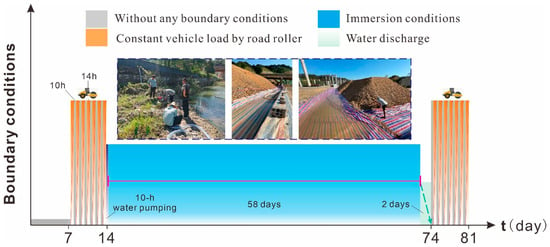
To evaluate the performance of the HWP and CIHWP subgrades, static surcharge loading and water-immersion conditions were applied alternately. The specific scheme of the boundary conditions after subgrade construction is shown in Figure 8 and can be summarized as follows:
Figure 8.
Variation in the boundary conditions applied to the subgrade model.
- (1)
- The subgrade model was left undisturbed for 30 days before the loading and immersion stages began.
- (2)
- To apply a controlled static surcharge to the subgrade, two 26-ton vibratory rollers (XG-626MH) were parked along the centerlines of sections III and IV from 18:00 to 8:00 on the following day for seven consecutive days. In this study, this vehicle-loading condition represents an intermittent sustained static surcharge applied by parked rollers and is not intended to reproduce repeated moving wheel loads under actual highway traffic. This loading condition was designed to evaluate the deformation and stress responses of the subgrade under an intermittent sustained surcharge.
- (3)
- Approximately 300 m3 of water was pumped into the flume over 10 h, and the water level was then maintained for 58 days to immerse the subgrade. To ensure the simultaneous immersion of the subgrade, the surface of the flume and the slope toe were covered with impervious membranes in advance. After water storage, the membranes at the slope toe were lifted.
- (4)
- To avoid excessive subsidence induced by rapid water drainage, water in the flume was drained in 2 days.
- (5)
- Repeat step 2.
3. Experimental Results
3.1. Compaction Quality During Construction
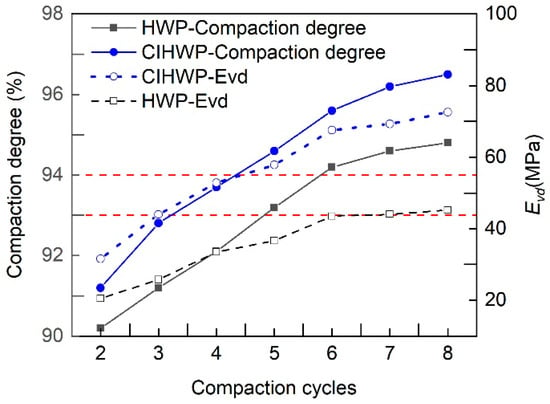
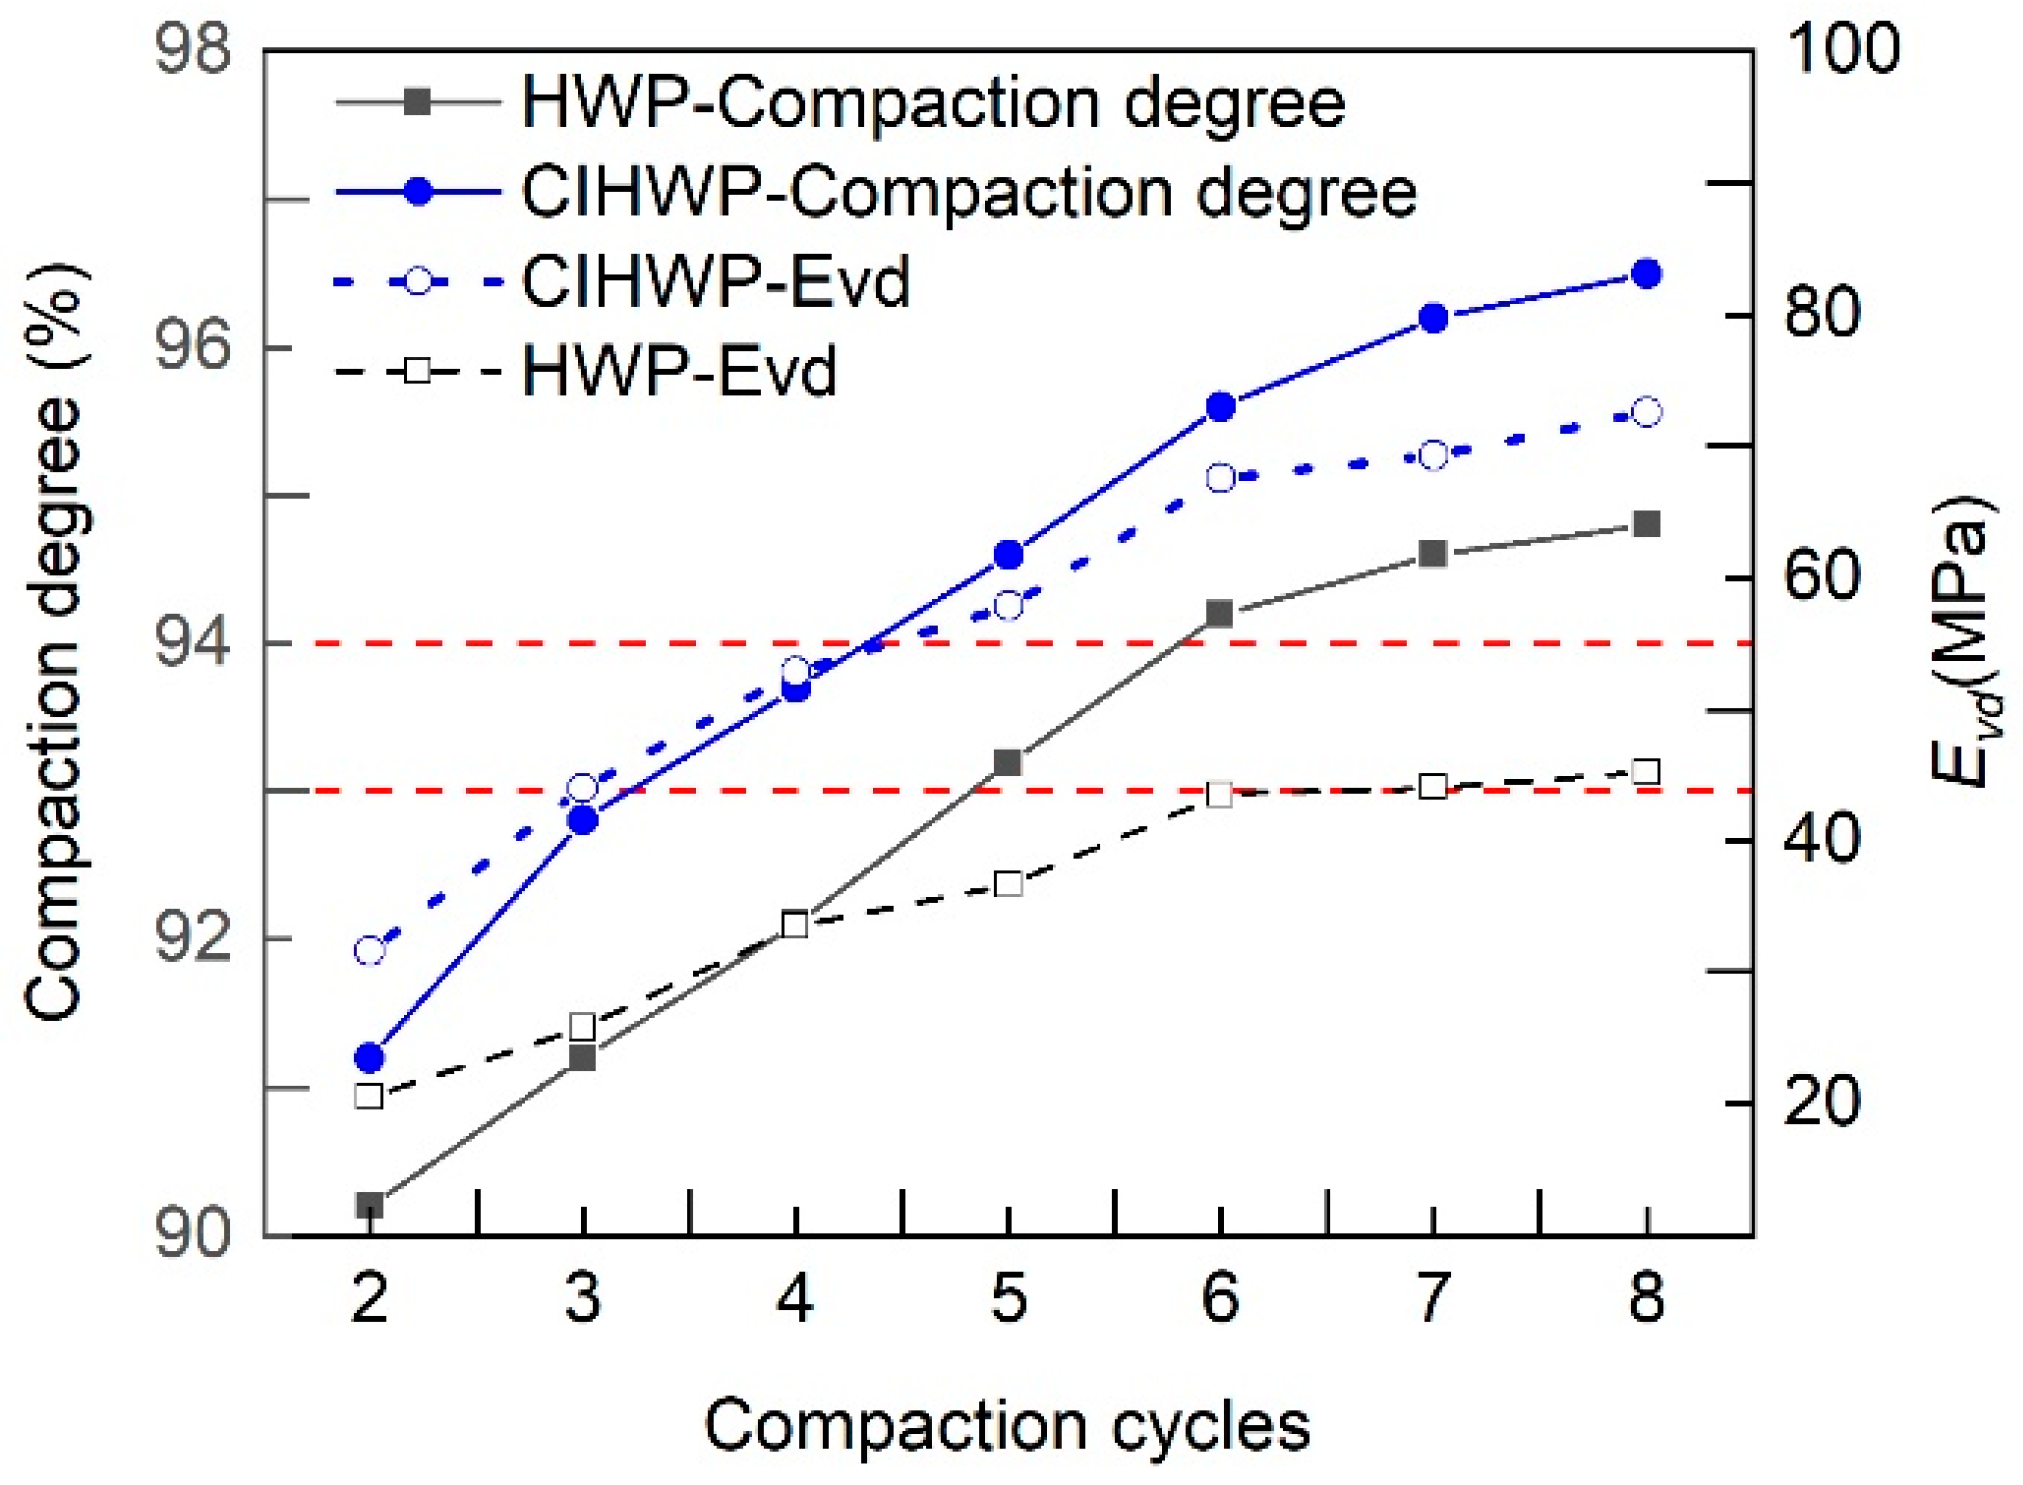
Figure 9 shows the degree of compaction and Evd measured in the HWP and CIHWP subgrades. Under the same number of vibratory passes, the degree of compaction was higher in the CIHWP section than in the HWP section. In both sections, the degree of compaction increased with the number of passes and changed little after seven passes. The Evd values increased rapidly up to seven passes and more gradually thereafter, consistent with the trend in the degree of compaction. The final Evd values of the HWP and CIHWP subgrades were 45.2 MPa and 72.6 MPa, respectively, after the specified compaction sequence. The CBR in the HWP subgrade was measured to be 6.2% and 7.8% at the 93% compaction zone (low embankment) and 94% compaction zone (upper embankment), respectively, while in the CIHWP subgrade, greater CBR values of 13.4% and 19.6% were measured at the 93 and 94% compaction zones, respectively.
Figure 9.
Variation curves of degree of compaction and dynamic deformation modulus under different compaction cycles.
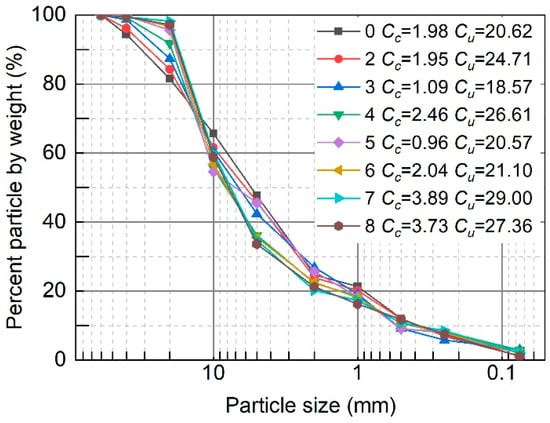
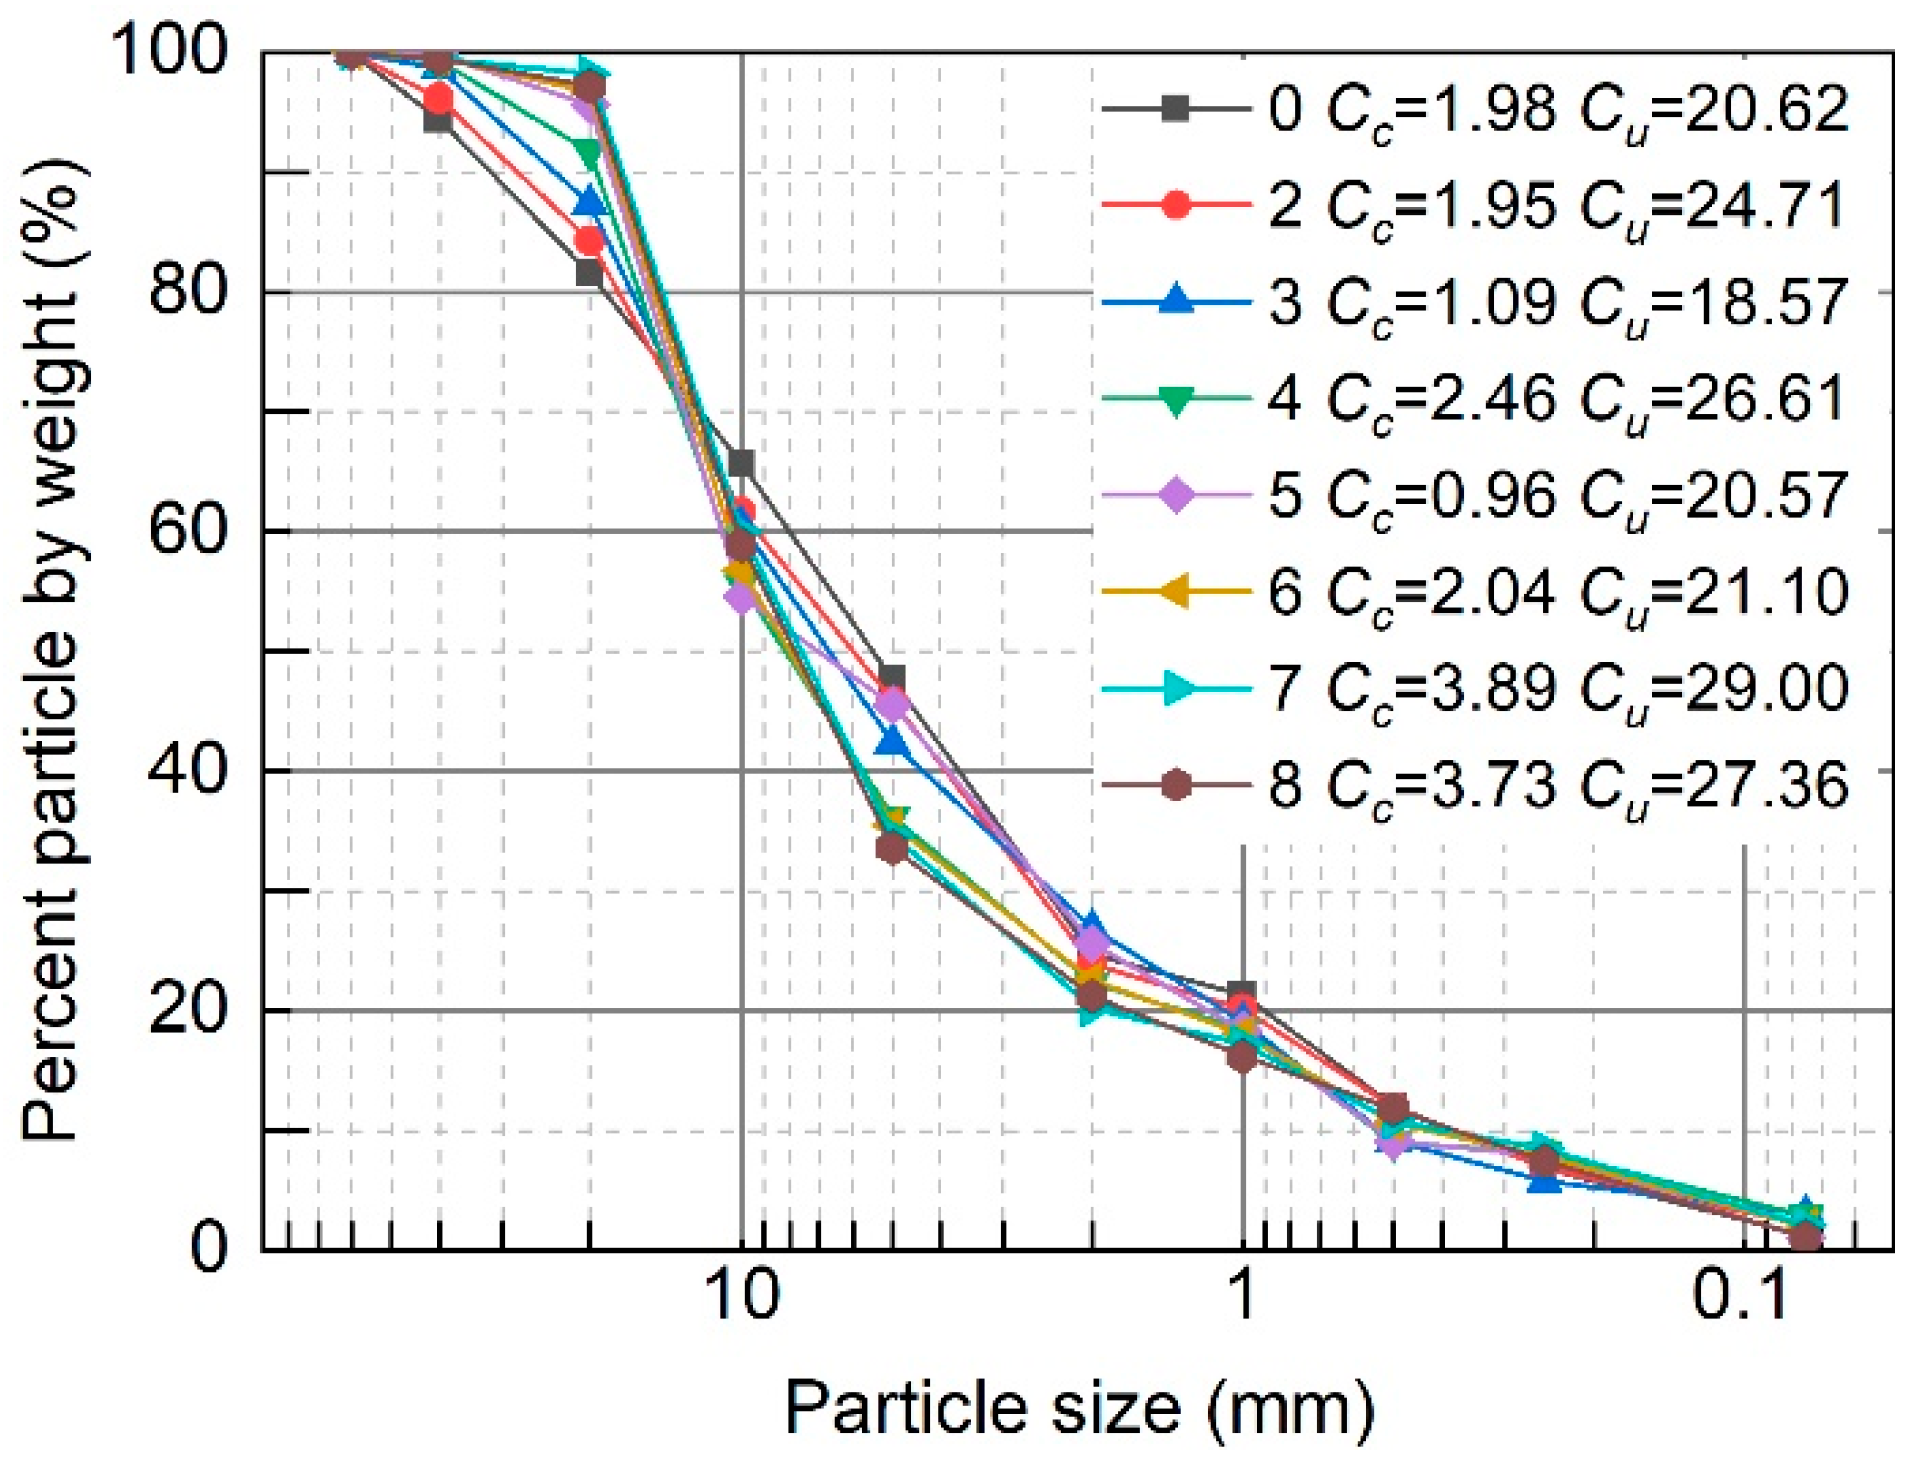
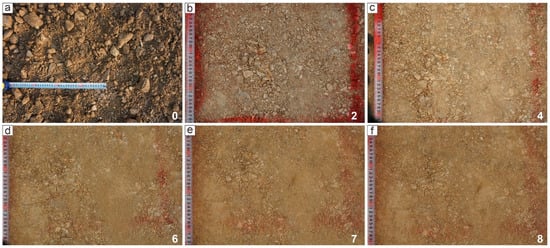
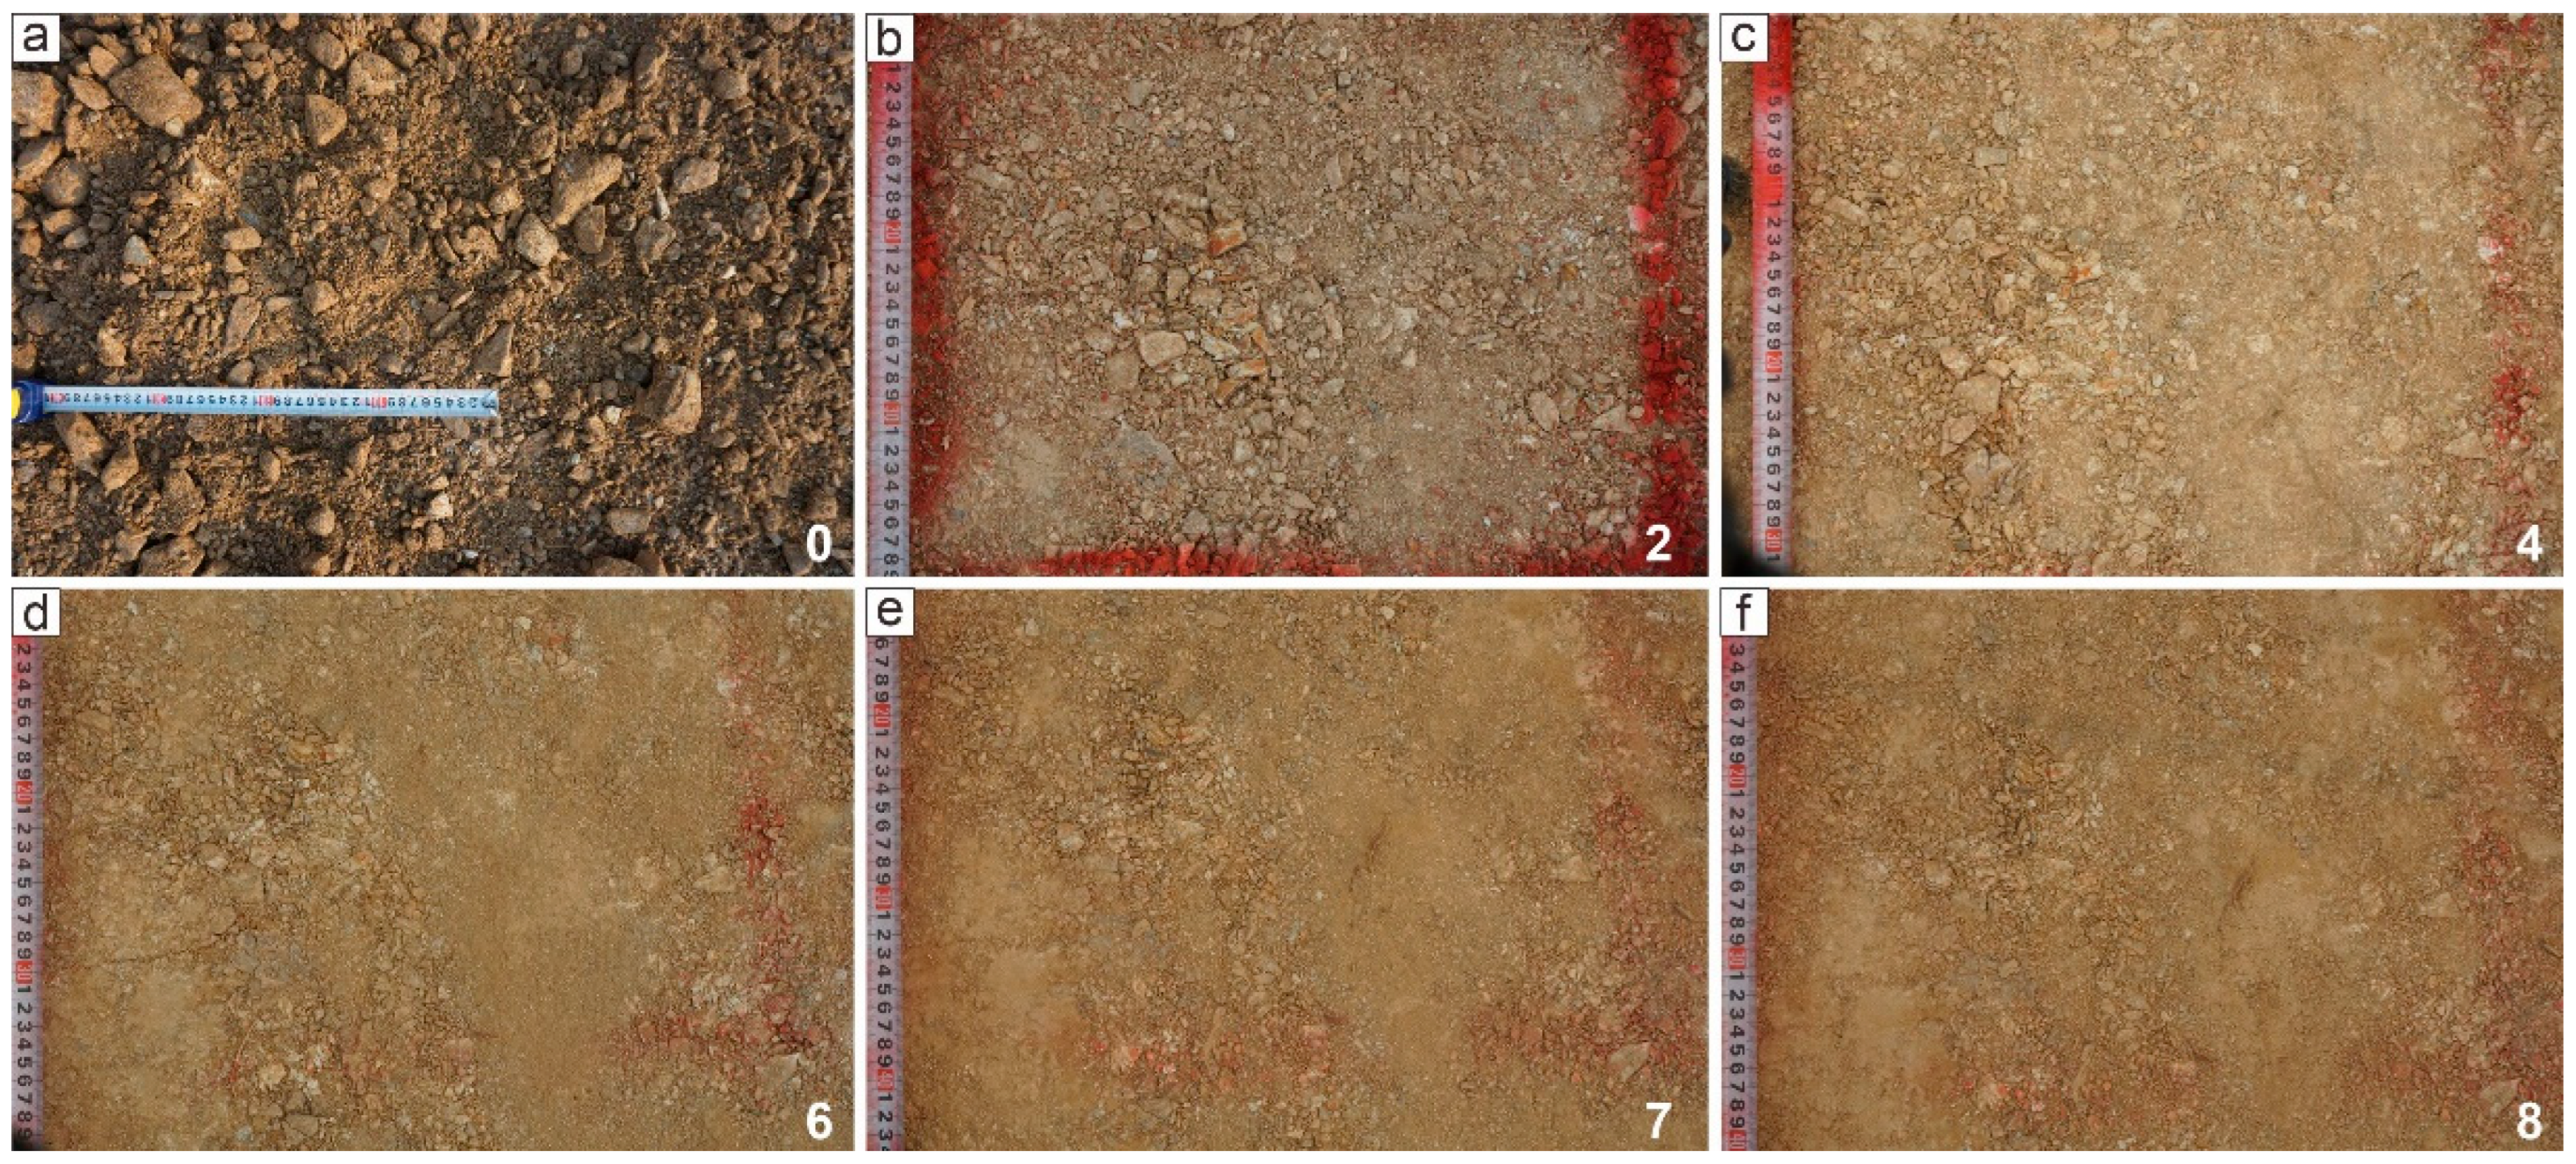
Figure 10 and Figure 11 show changes in the particle-size distribution and photographs of the HWP aggregates, respectively, after different compaction cycles. Overall, with the increase in compaction cycles, the group content of 60–20 mm particles decreased and its ultimate reduction rate was 15.6%, while the group content of 20–5 mm particles increased gradually by 14.1% in the process. The HWP aggregates became poorly graded from the seventh compaction cycle onward.
Figure 10.
Variation in HWP particle gradation under different compaction cycles.
Figure 11.
Photos of HWP aggregates after different compaction cycles: (a) 0 cycle; (b) 2 cycles; (c) 4 cycles; (d) 6 cycles; (e) 7 cycles; and (f) 8 cycles.
3.2. Response of Earth Pressure
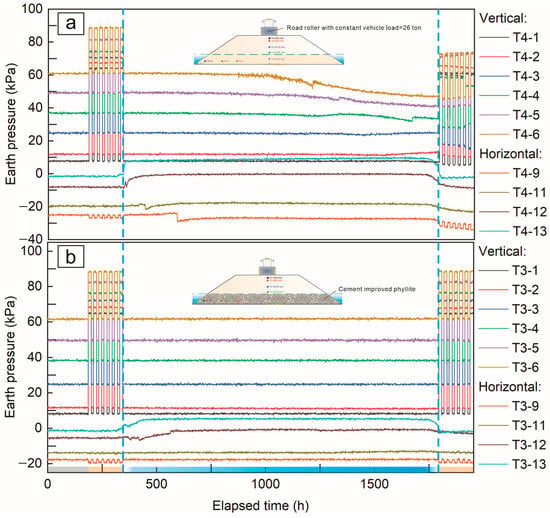
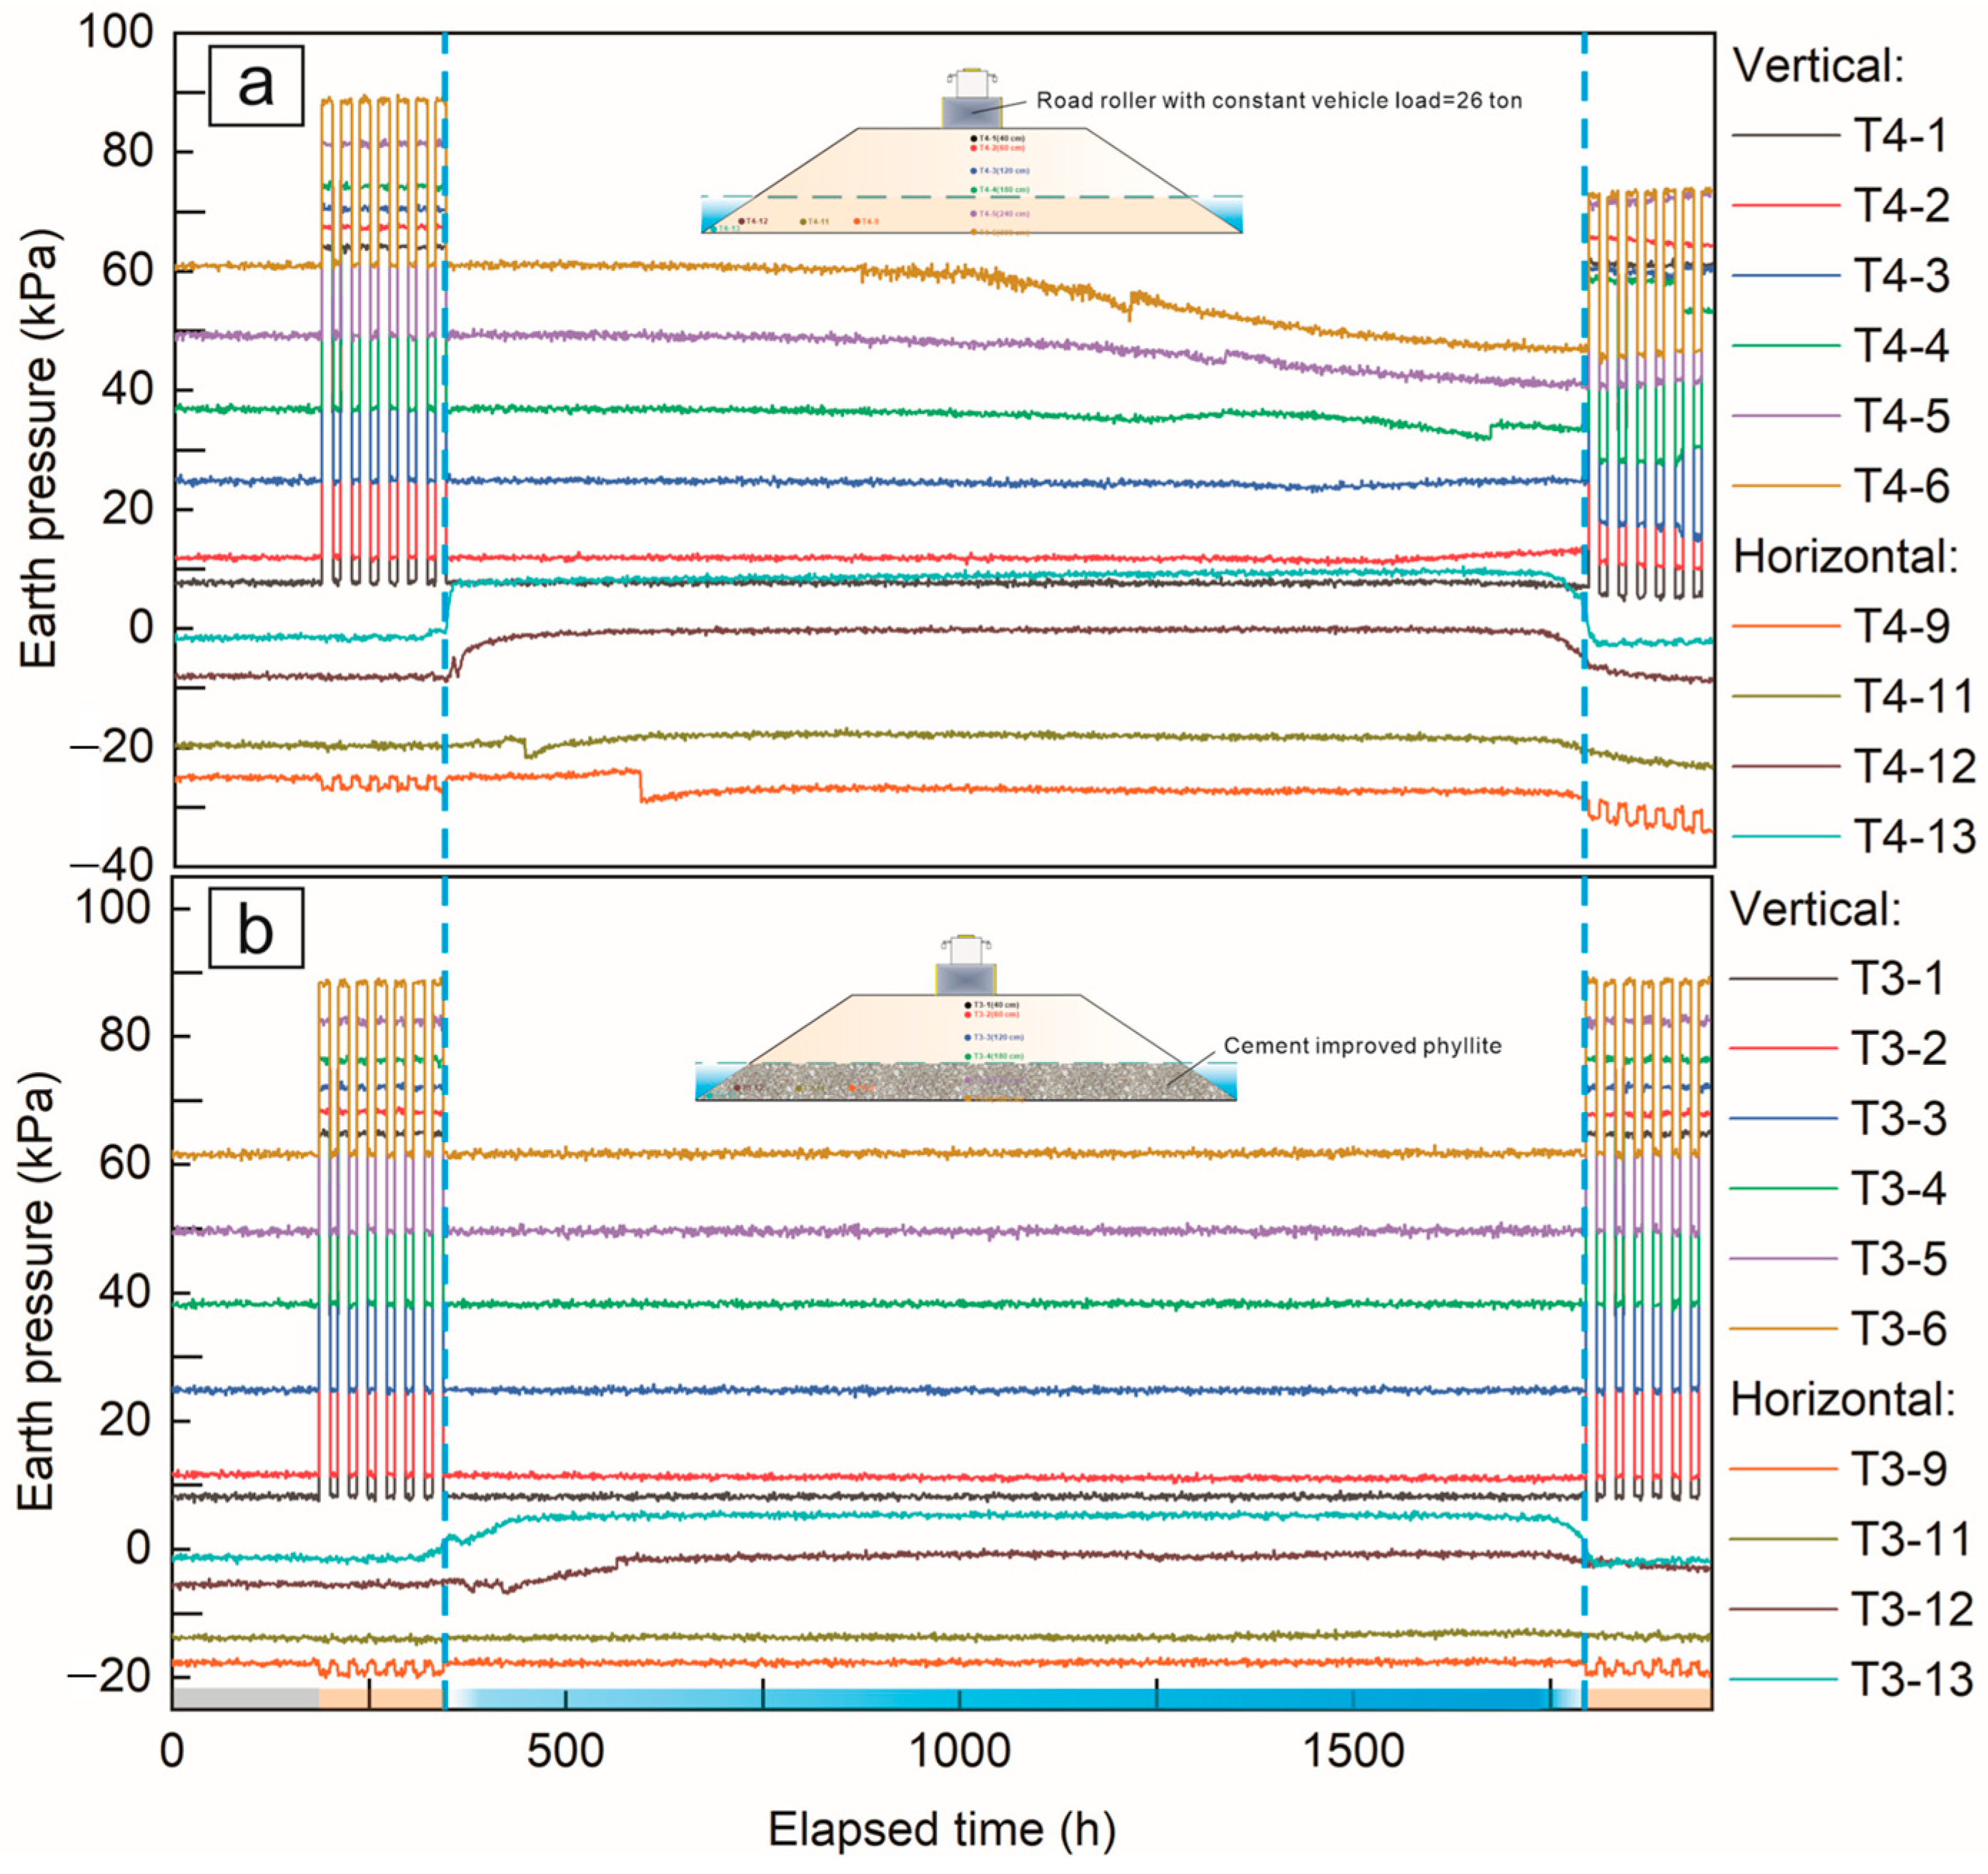
Figure 12 presents the variations in vertical and horizontal earth pressures in the HWP and CIHWP subgrades. Negative values indicate that the dominant direction of horizontal earth pressure is toward the outside of the subgrade slope. Overall, earth pressures fluctuated more markedly in the HWP subgrade than in the CIHWP subgrade. Before water immersion, earth pressure at each measuring point increased from the outer boundary toward the interior of the subgrade. The increase was greater at locations closer to the applied surcharge.
Figure 12.
Variation in vertical and horizontal earth pressures at different positions in HWP (a) and CIHWP (b) subgrades.
In the vertical direction of the HWP subgrade (Figure 12a), fluctuating decreases in earth pressure at depths of 180, 240, and 300 cm became evident after approximately 710 h (30 days) of immersion. These decreases became progressively more pronounced. In contrast, slight increases in earth pressure at depths of 120, 60, and 40 cm occurred after approximately 1098 h (46 days) of immersion. After drainage, earth pressure at all depths decreased to varying degrees, both with and without the applied surcharge.
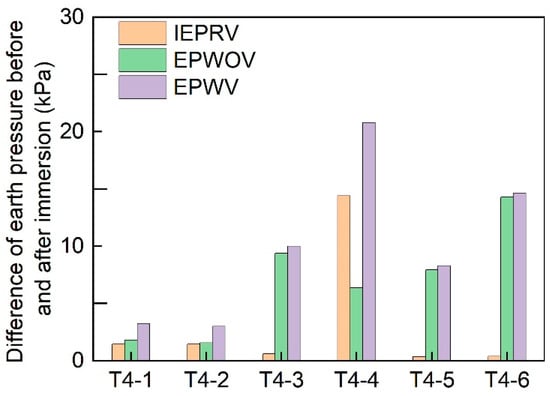
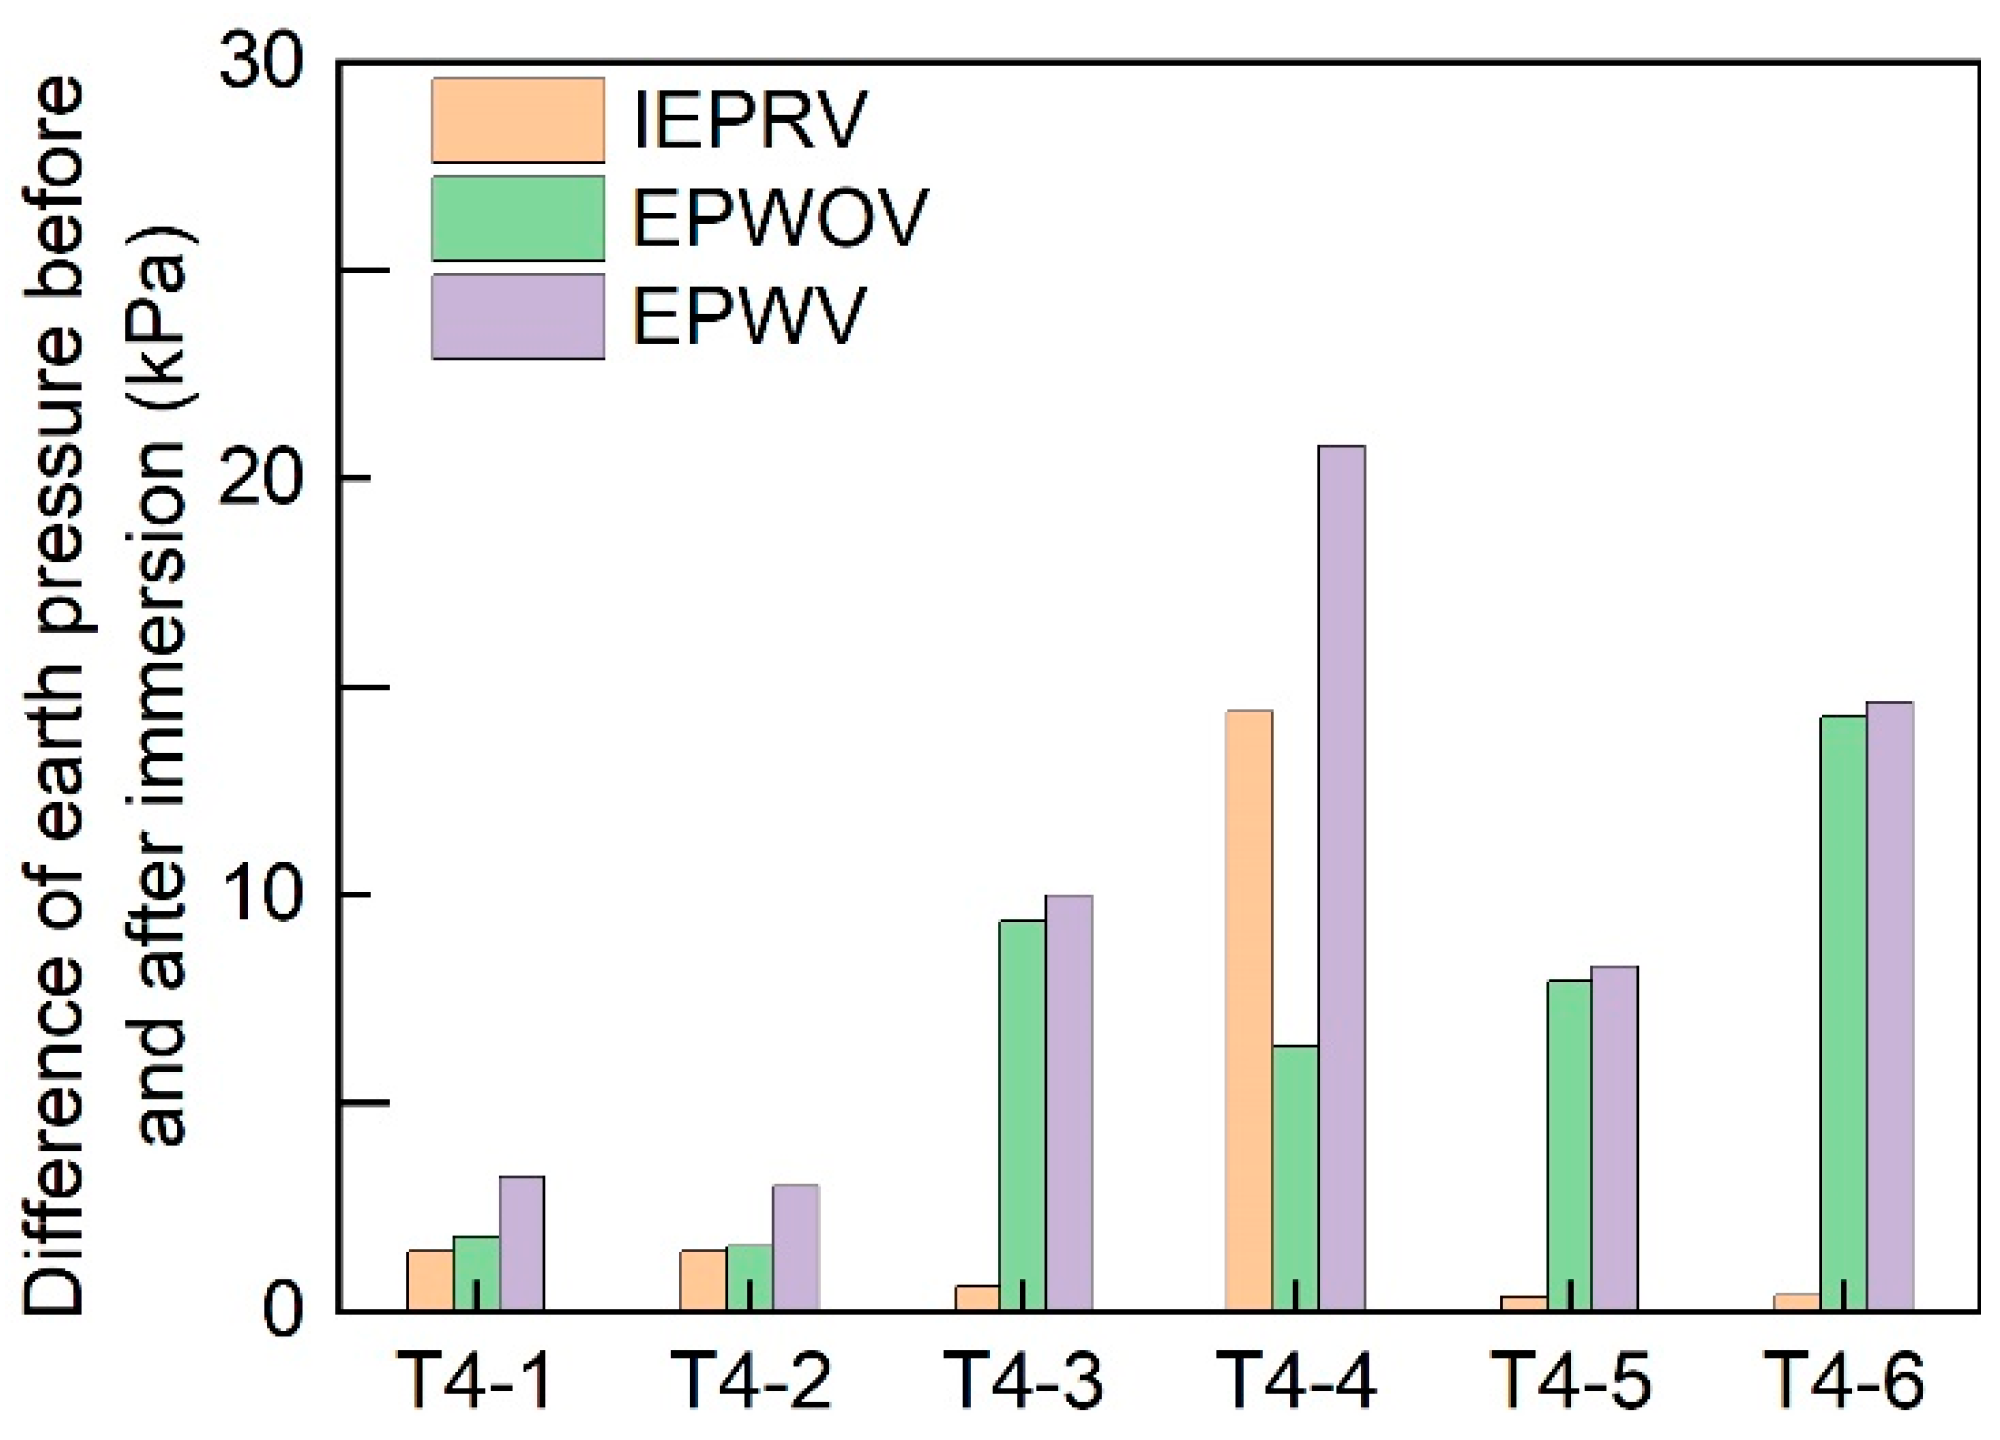
Figure 13 shows the differences in vertical earth pressure between the pre-immersion stage and the end of the experiment. At most measuring points, the increment in earth pressure associated with the applied surcharge remained nearly unchanged. T4-4 was the main exception, with a maximum difference of 14.4 kPa. Under the applied surcharge, T4-4 showed the largest difference in earth pressure, followed by T4-6 and T4-3. Without the applied surcharge, the largest difference was 14.6 kPa at T4-6, followed by T4-3 and T4-5. In the CIHWP subgrade (Figure 12b), vertical earth pressures at all depths remained nearly unchanged. They also showed a repeatable response to the intermittent static surcharge.
Figure 13.
Statistics of difference involving vertical earth pressures before immersion and at the end of the experiment. IEPRV: increment of earth pressure responding to applied static surcharge; EPWOV: earth pressure without applied static surcharge; EPWV: earth pressure with applied static surcharge.
In the horizontal direction of the HWP subgrade (Figure 12a), earth pressures at T4-12 and T4-13 responded sensitively to water immersion. Their absolute values decreased rapidly after water storage began and increased rapidly after drainage began. In contrast, T4-11 and T4-9 showed only slight fluctuations after approximately 95 h (4 days) and 145 h (6 days) of immersion, respectively. At the end of the experiment, horizontal earth pressures at T4-9, T4-11, T4-12, and T4-13 were all higher than their pre-immersion values.
In the CIHWP subgrade (Figure 12b), earth pressures near the slope toe (T3-12 and T3-13) showed similar responses to those in the HWP subgrade, but the rates and magnitudes of change were smaller. T3-9 and T3-11 showed no response throughout the experiment.
3.3. Response of Hydraulic Sensors
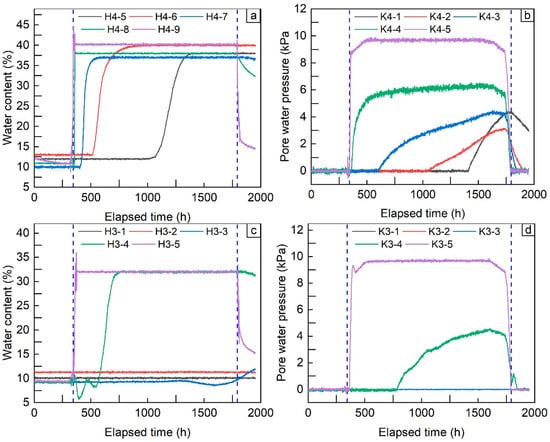
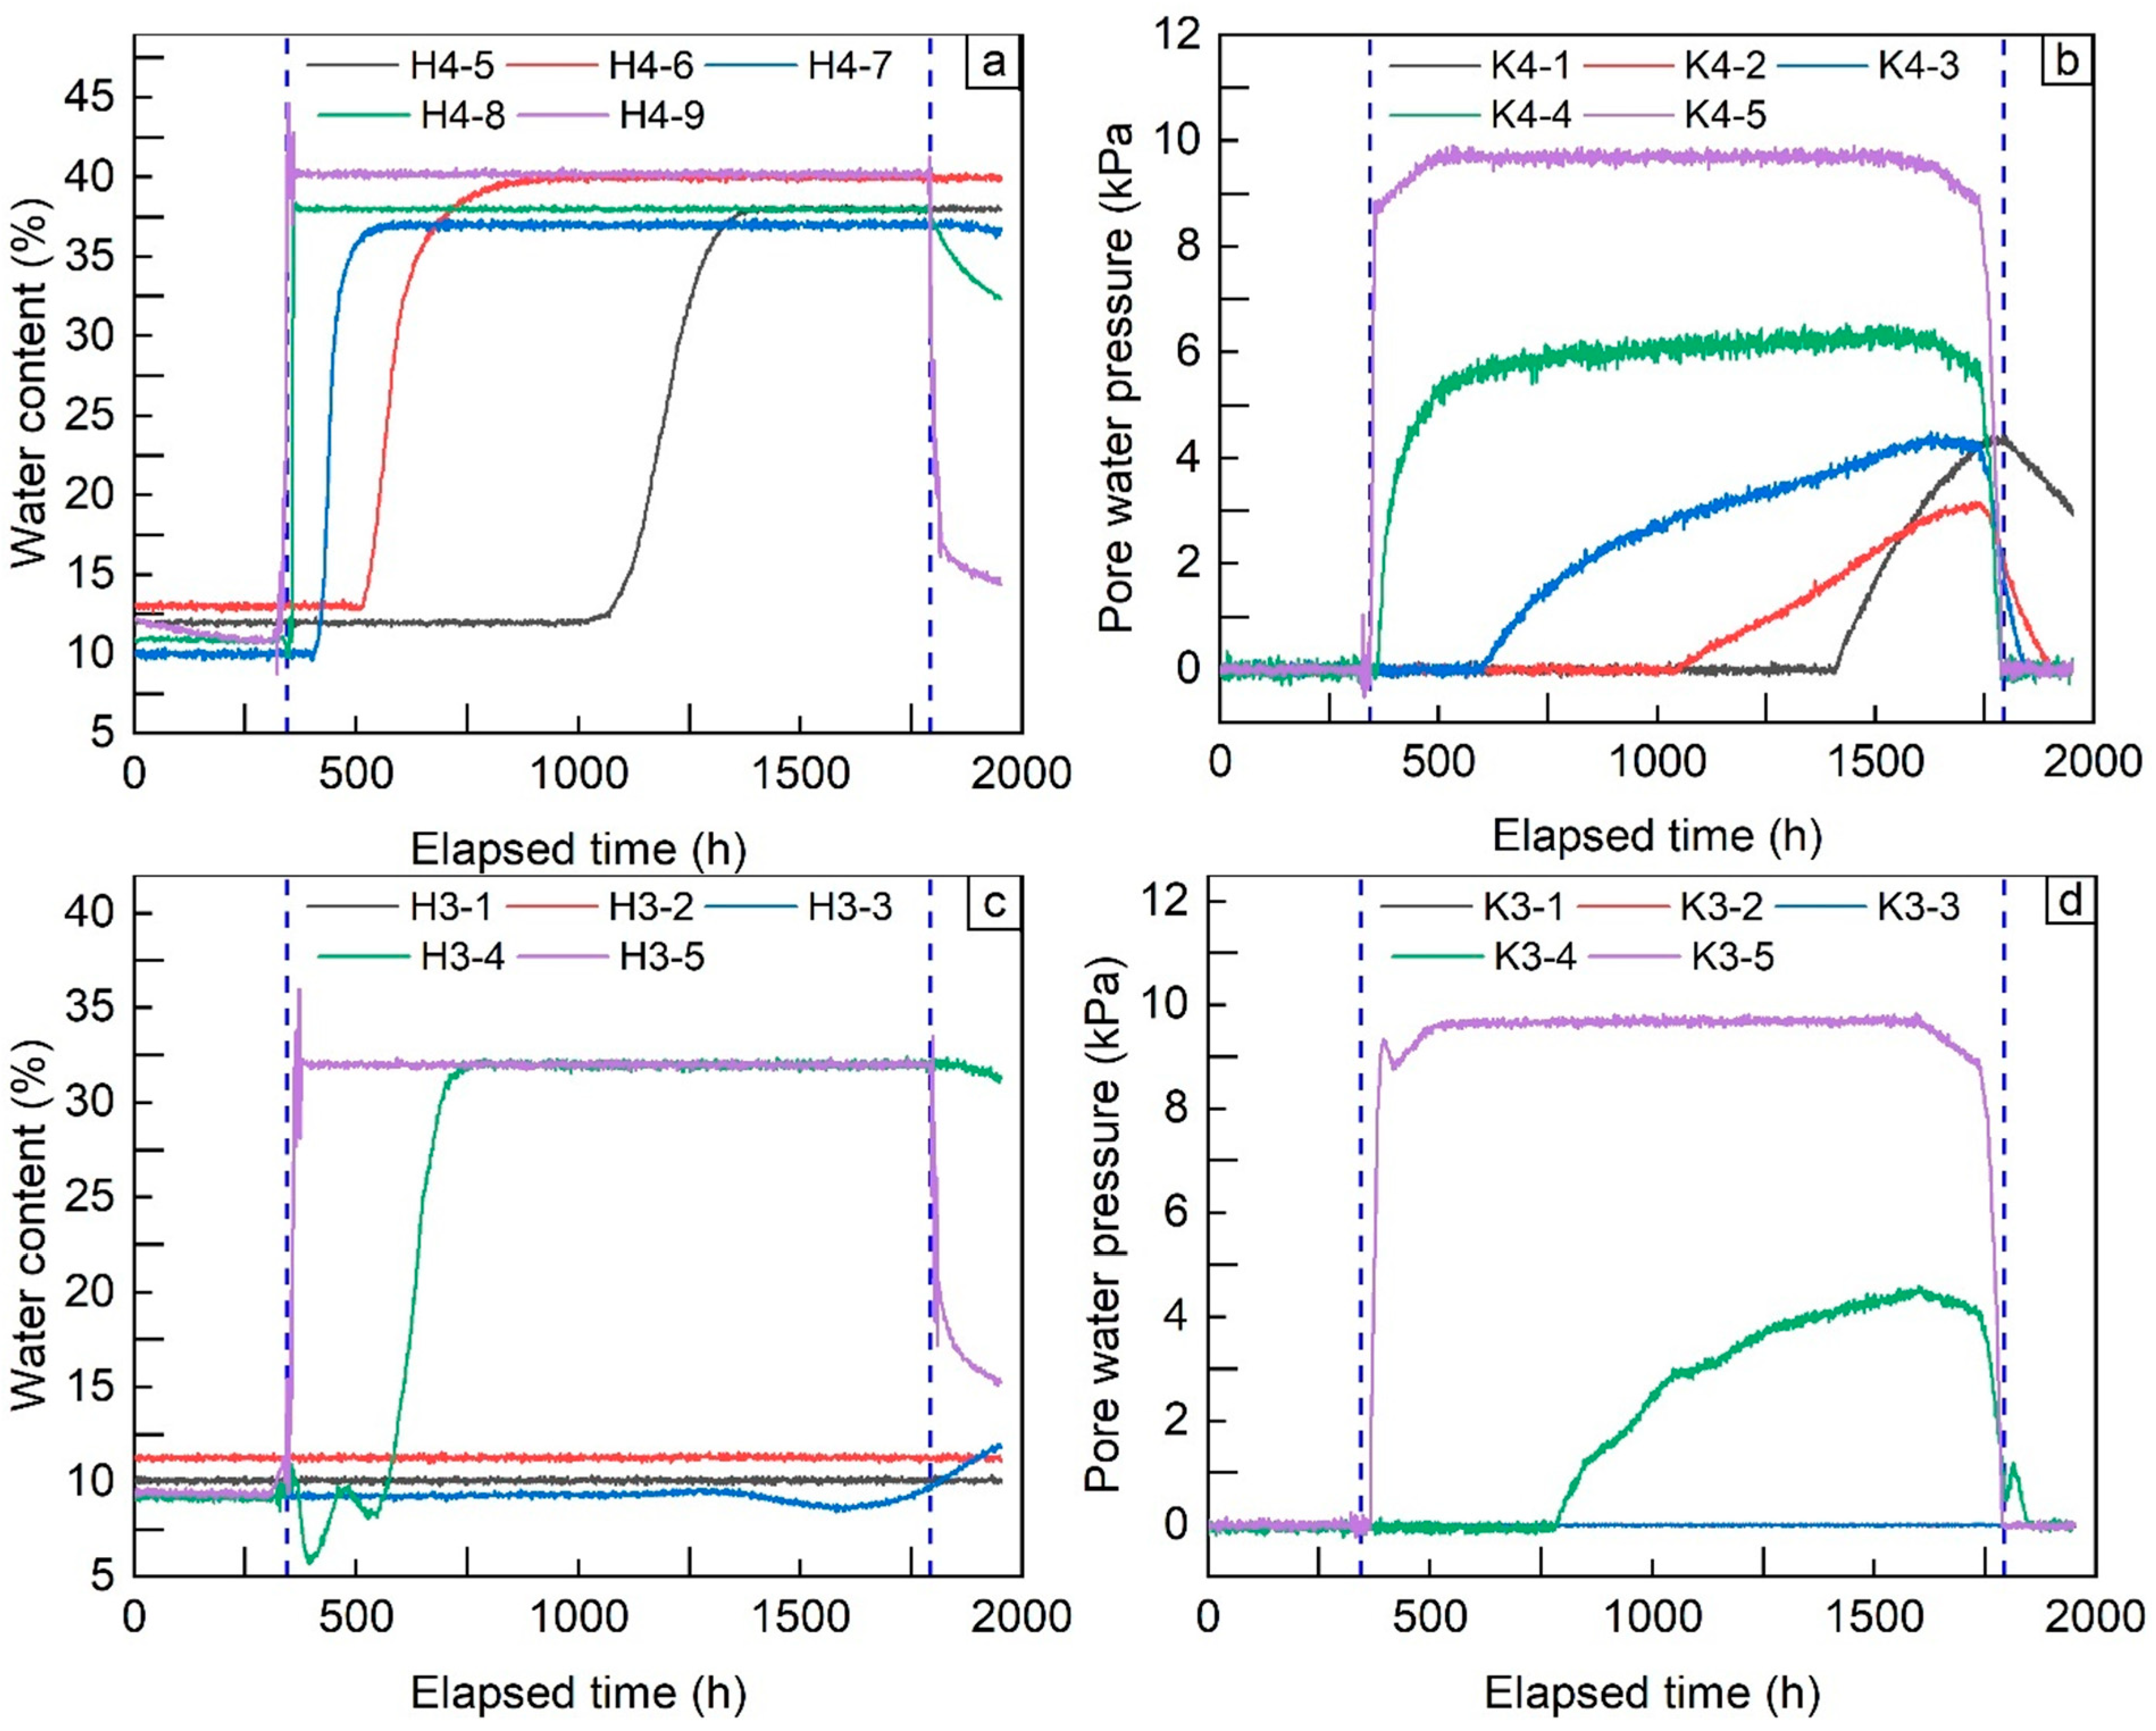
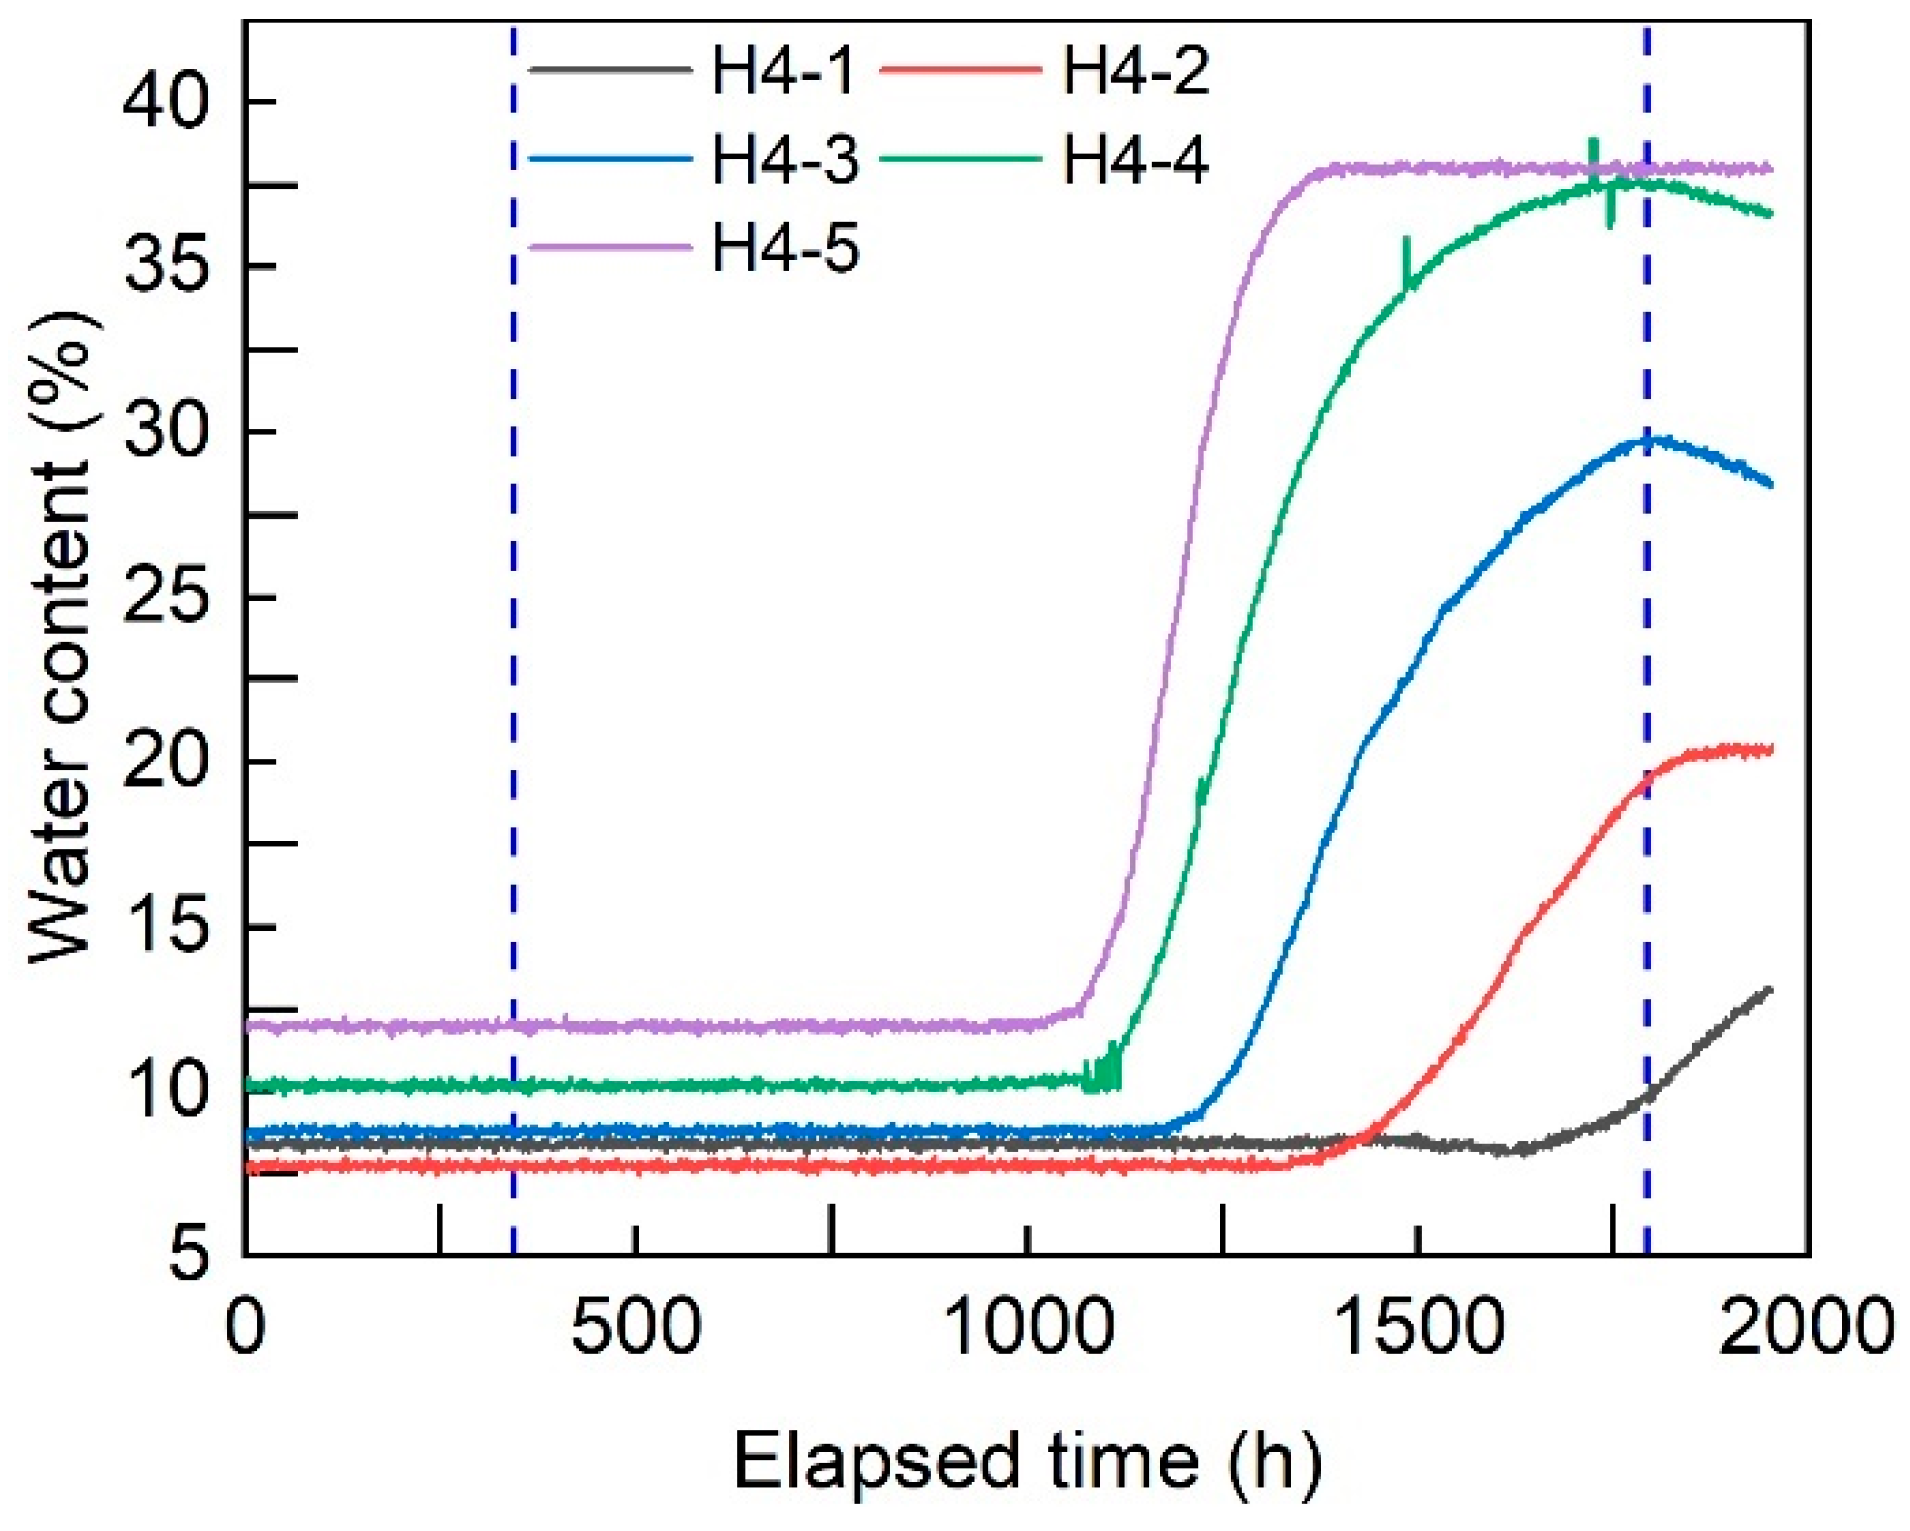
Figure 14 shows the responses of volumetric water content and pore-water pressure below the immersion water level in the HWP and CIHWP subgrades. Overall, more hydraulic sensors responded in the HWP section than at comparable positions in the CIHWP section.
Figure 14.
Responses of volumetric water content and pore-water pressure in the HWP (a,b) and CIHWP (c,d) subgrades.
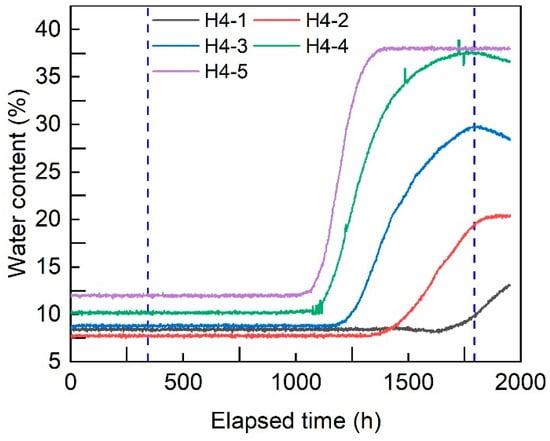
In the HWP subgrade, the VWCs responded sequentially from the slope toe toward the subgrade center. All sensors reached their maximum readings during water immersion. After drainage began, the readings at H4-9 and H4-8 decreased rapidly, whereas those at the other VWC sensors remained near their maximum values. All PWPs recorded increasing positive pressures during water immersion. Their maximum readings, from the slope toe toward the subgrade center, were 9.7, 6.3, 4.4, 3.1, and 4.4 kPa, respectively. After drainage began, the pressures at K4-9 and K4-8 rapidly decreased to 0 kPa. The other PWPs continued to record positive pressures for 53–159 h. In the CIHWP subgrade, only three VWC sensors and two PWP sensors responded during water immersion. Among the VWC sensors, H3-3 showed only a slight increase after 1304 h (54 days) of immersion. This response occurred approximately 50 days later than that at the corresponding location (H4-7) in the HWP subgrade. Only H3-5, located at the slope toe, responded clearly to drainage. The maximum pore-water pressure recorded at K3-4 was 2 kPa lower than that recorded at K4-4.
Figure 15 shows the variation in volumetric water content along the centerline of the HWP subgrade. The VWC sensors responded sequentially from the bottom toward the top of the subgrade. The highest detected response occurred at the 60 cm measurement level.
Figure 15.
Responses of volumetric water content along the centerline of the HWP subgrade.
3.4. Deformation
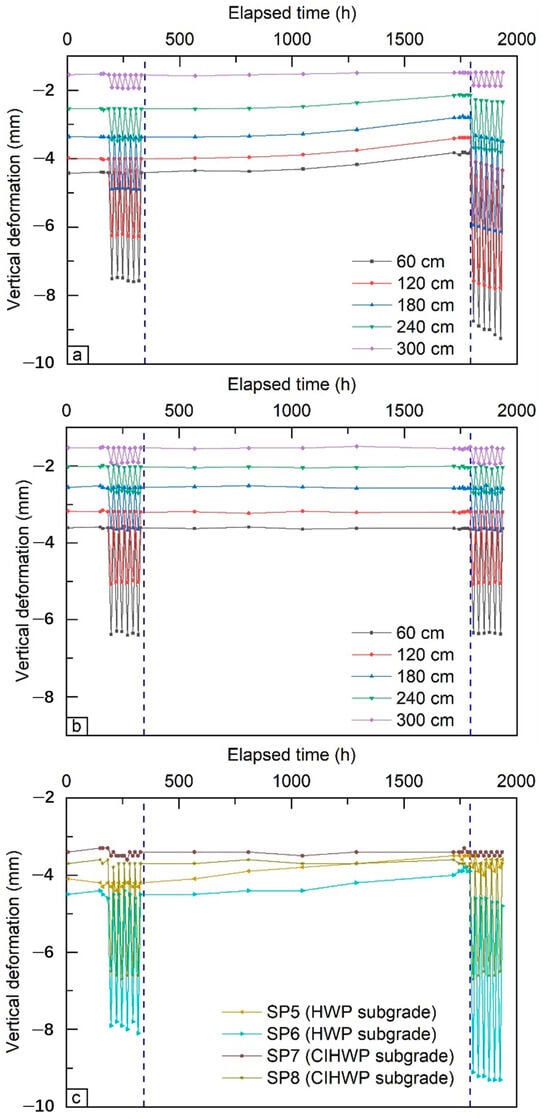
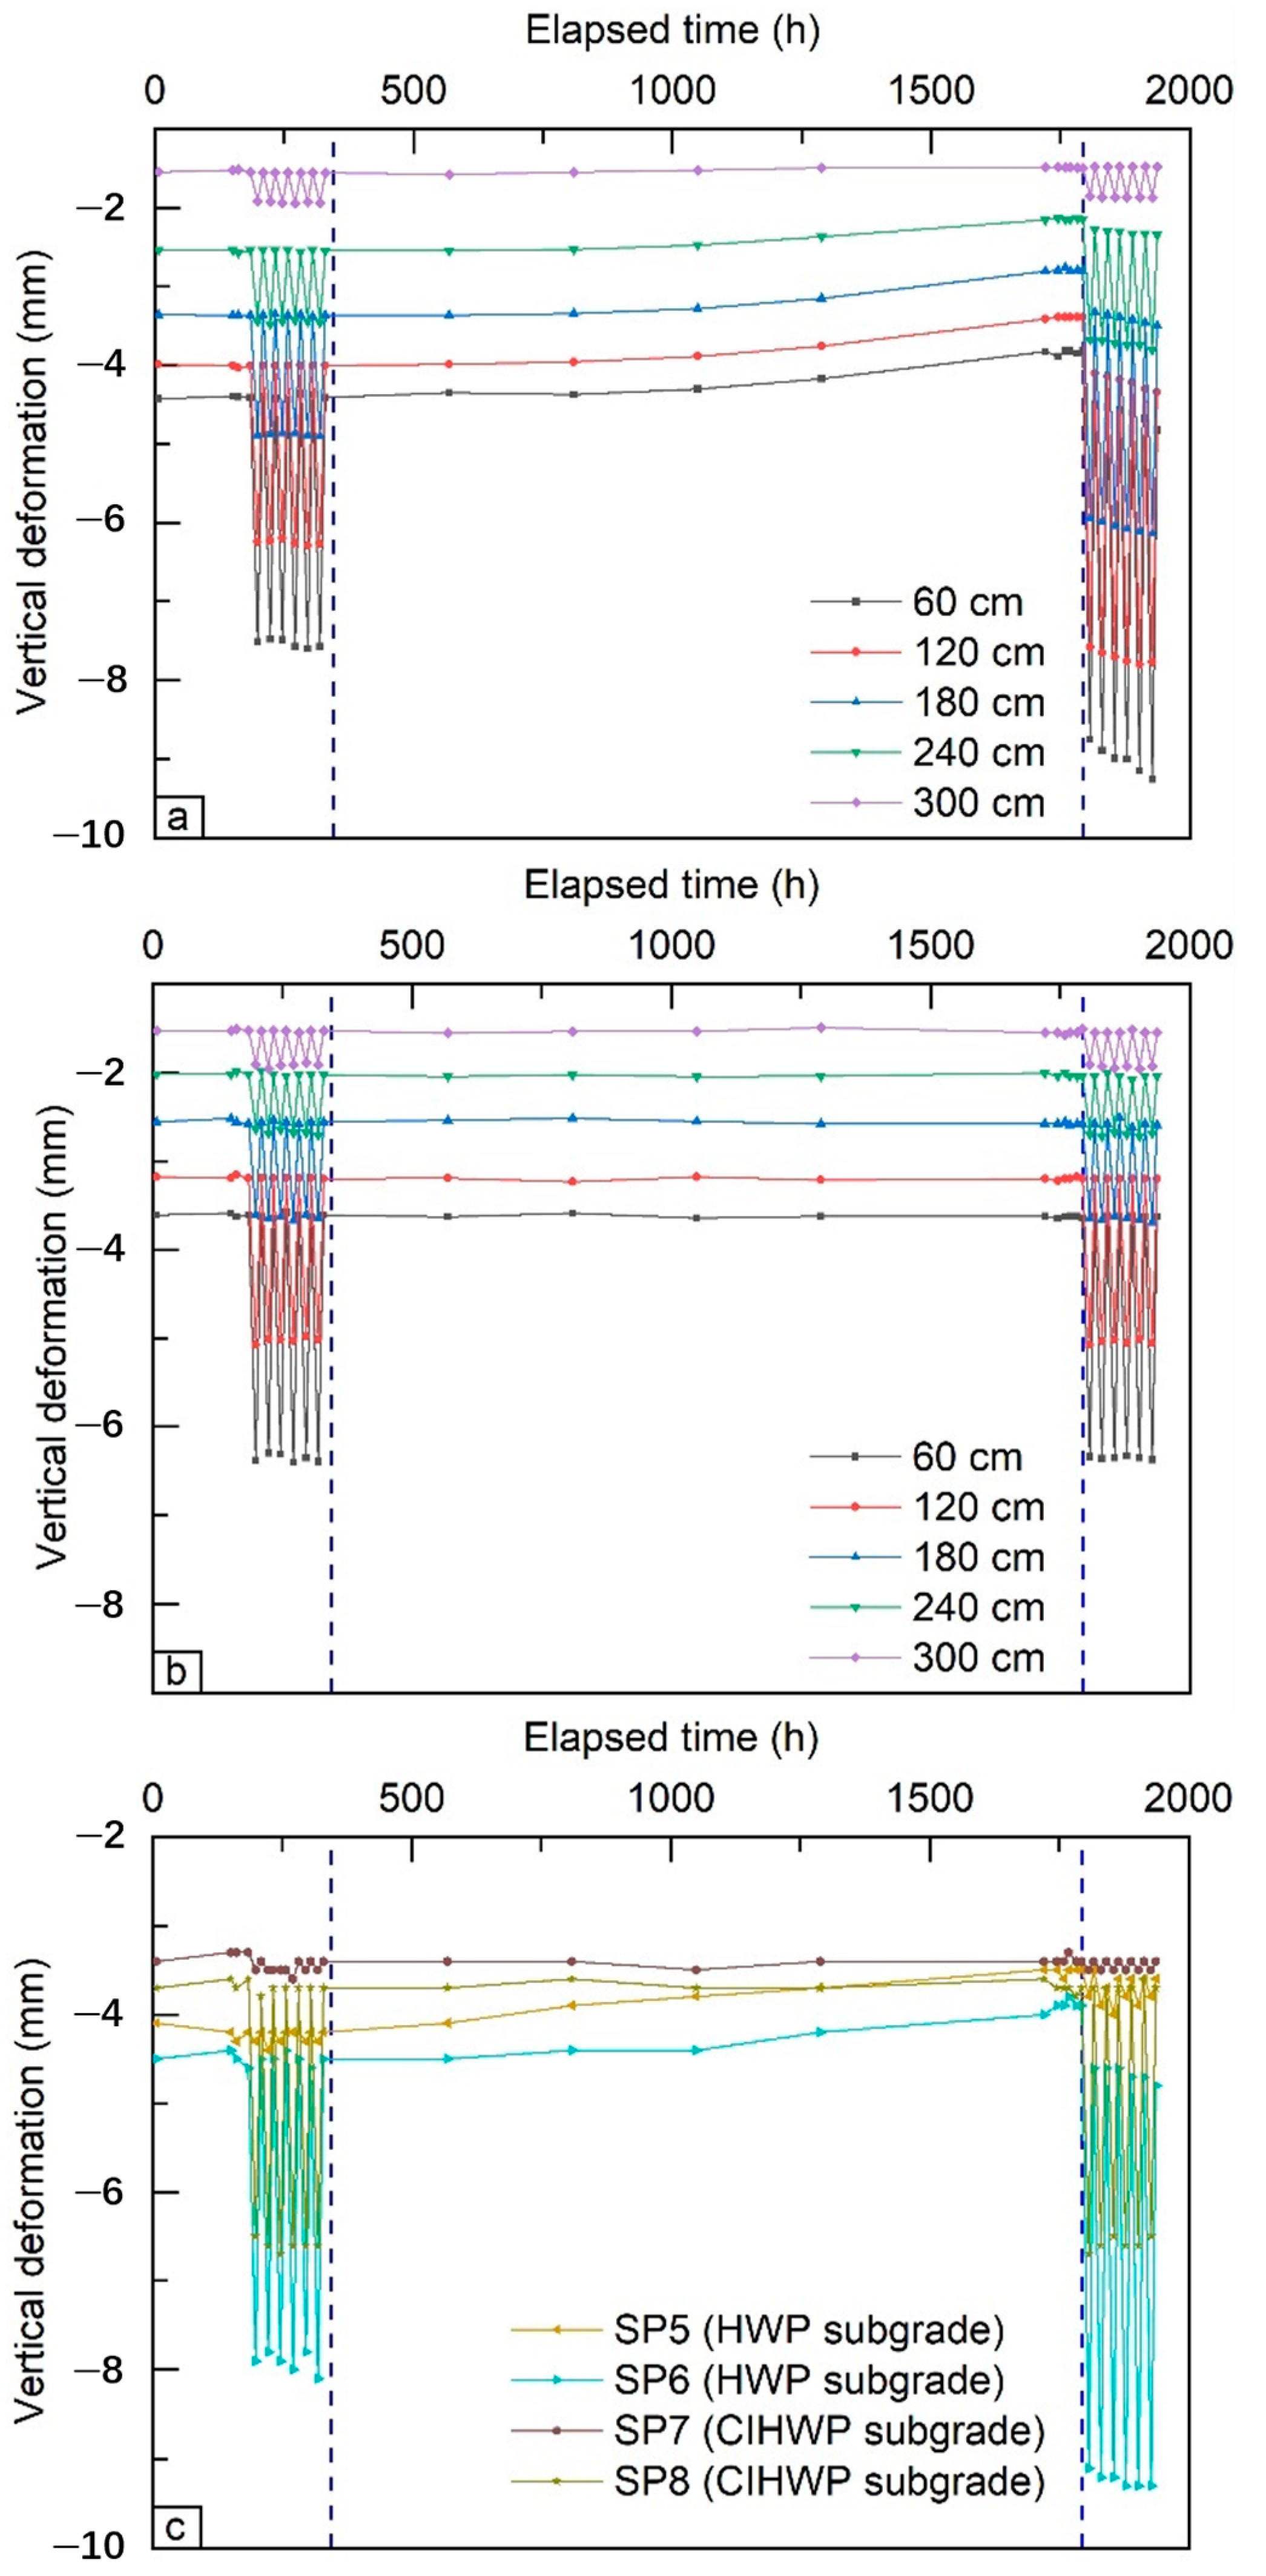
Figure 16 shows the vertical deformation of the HWP and CIHWP subgrades. Both sections exhibited some settlement during the initial 30-day standing period. Overall, settlement decreased with depth and was strongly affected by the applied static surcharge. Settlement at the slope shoulder was much smaller than that at the subgrade center. As expected, the HWP section exhibited greater deformation and larger fluctuations than the CIHWP section.
Figure 16.
Vertical deformation measured in the HWP and CIHWP subgrades: (a,b) layered settlement measured using telescopic settlement gauges; (c) settlement measured using settlement plates.
In the HWP subgrade, settlement dominated the vertical deformation before water immersion and after drainage. Uplift occurred during water immersion. The maximum uplift at depths of 45–240 cm ranged from 0.6 to 1.0 mm. The largest value was recorded at SP5, at a depth of 45 cm near the slope shoulder. After drainage, settlement under the applied static surcharge increased significantly compared with the pre-immersion values. From the bottom to the top of the subgrade, the increases in settlement were 0.4 mm at 240 cm, 1.3 mm at 180 cm, 1.6 mm at 120 cm, and 1.8 mm at both 60 and 45 cm. Without the applied surcharge, settlement at depths shallower than 120 cm also exceeded the pre-immersion values. In contrast, settlement at each measured depth in the CIHWP subgrade changed little between the pre- and post-immersion stages.
4. Discussion and Conclusions
4.1. Compaction Quality
The compaction behavior of subgrade aggregates is mainly governed by particle crushing, migration, and rearrangement [41,42]. A well-graded particle-size distribution is essential for satisfactory compaction. However, repeated compaction may progressively alter the particle-size distribution of breakage-prone aggregates. Initially well-graded materials may become poorly graded, thereby limiting further improvement in compaction. In the present test, the HWP aggregates remained well graded during the first six compaction cycles but became poorly graded after the seventh cycle. This change may explain why the degree of compaction and of HWP increased only slightly after approximately six cycles. In contrast, interparticle cementation in CIHWP likely reduced the effects of particle breakage and facilitated compaction. Consequently, CIHWP exhibited higher CBR and values than HWP at the same degree of compaction. The maximum degree of compaction achieved by untreated HWP remained below 96%. This suggests that its direct use in the 96% compaction zone may be limited. Nevertheless, both HWP and CIHWP met the design requirements for the 93% and 94% compaction zones after appropriate compaction.
4.2. Effects of Water Immersion on HWP Subgrades
Water immersion had a pronounced influence on the hydro-mechanical response of the HWP subgrade. During the initial stage of immersion, water infiltrated from the slope toe and increased pore-water pressure and buoyancy in the lower part of the subgrade. These changes coincided with a reduction in vertical earth pressure and localized uplift. Because wetting began at the slope toe, uplift near the slope shoulder was greater than that at the subgrade center. After drainage, pore-water pressure gradually dissipated. The additional earth-pressure changes and uplift associated with saturation also diminished.
Comparing the hydraulic and mechanical responses over time helps characterize the evolution of the HWP subgrade during immersion. Horizontal earth-pressure changes at T4-11 and T4-9 appeared after approximately 95 h and 145 h of immersion, respectively. The response at T4-9 occurred approximately 453 h before the pore-water-pressure response at K4-2. With continued immersion, vertical earth pressure at depths of 180–300 cm began to decrease after approximately 710 h. In contrast, slight increases at shallower depths occurred after approximately 1098 h. During this period, volumetric water-content measurements indicated progressive water migration from the slope toe toward the subgrade interior and from the bottom upward. Uplift deformation was also observed during immersion. After drainage, pore-water pressure gradually dissipated, while settlement under the applied static surcharge increased relative to the pre-immersion level. This temporal sequence is consistent with progressive wetting and possible stiffness degradation in water-sensitive HWP, followed by stress redistribution and deformation. However, the hydraulic and mechanical sensors were installed at different spatial locations. Therefore, the observations demonstrate temporal consistency rather than a direct point-by-point quantitative correlation.
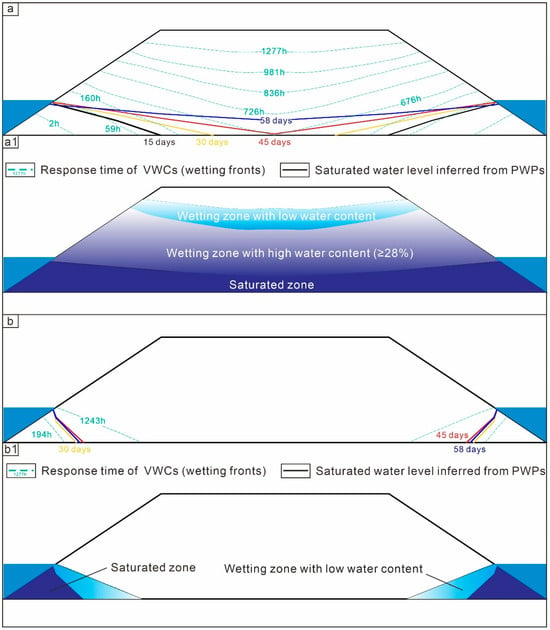
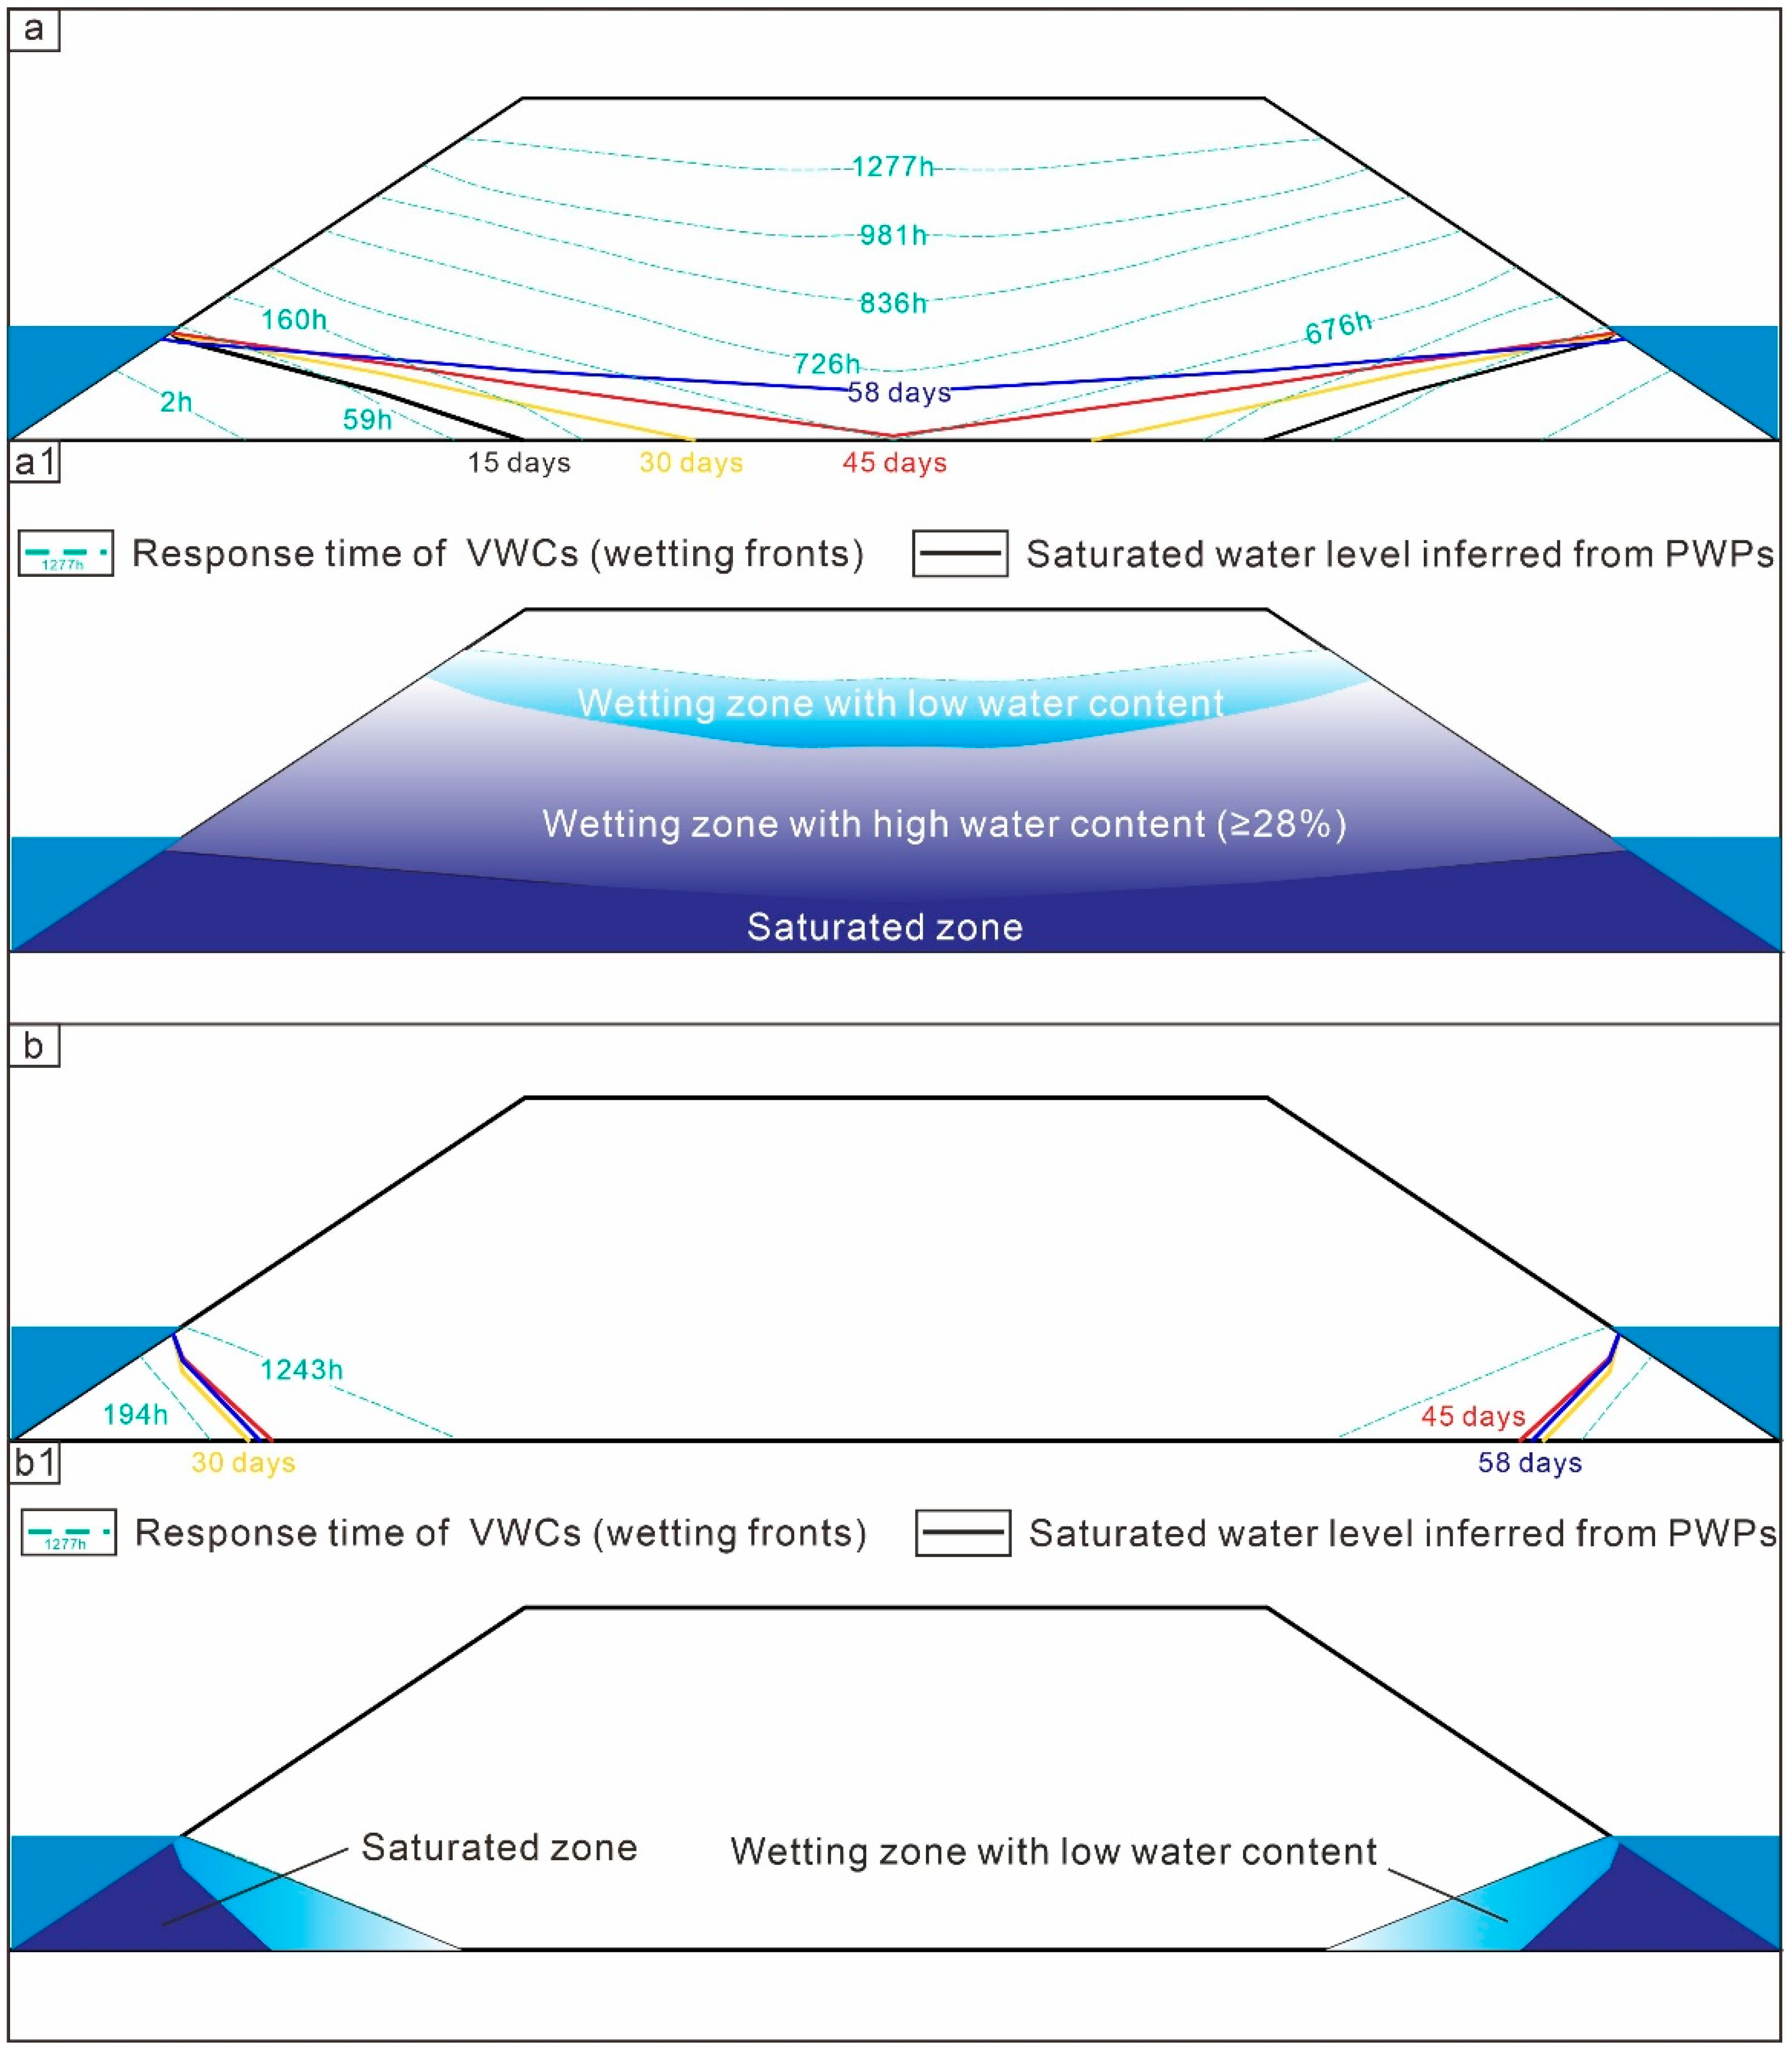
Based on the monitoring results, the estimated distributions of wetted and saturated areas in the HWP and CIHWP subgrades are presented in Figure 17. In the HWP subgrade, the infiltration rate ranged from 0.63 to 3.1 cm/h. Water migrated laterally toward the subgrade center and vertically to approximately 140 cm above the immersion level, possibly through capillary action. The wetted and saturated areas accounted for approximately 88% and 28% of the HWP profile, respectively. In comparison, the infiltration rate in the CIHWP subgrade was approximately 0.16 cm/h. The wetted and saturated areas accounted for approximately 12% and 6% of the profile, respectively. Based on the response time of T4-9 and its corresponding water content, a volumetric water content of approximately 28% was tentatively adopted as the threshold for significant softening. Using this threshold, the estimated softening area in the HWP subgrade was approximately 76%. These results suggest that cement stabilization limited water migration and reduced the spatial extent of wetting and softening. The reduced moisture penetration in CIHWP may be associated with cement-induced bonding and changes in water-conducting pathways within the compacted material. However, the maximum dry density of CIHWP containing 2% cement was not higher than that of untreated HWP. Therefore, the lower infiltration rate cannot be attributed solely to a higher compacted density. Instead, cementation may have improved the stability of the particle framework and reduced the continuity of preferential flow paths. Nevertheless, permeability and pore-size distribution were not measured directly. Their respective contributions, together with the contribution of cementation, cannot therefore be quantitatively distinguished in the present study.
Figure 17.
Possible moisture distributions inferred from sensor measurements: (a) wetting-front progression and saturated water level in the HWP subgrade; (a1) final moisture distribution; (b) wetting-front progression and saturated water level in the CIHWP subgrade; (b1) final moisture distribution.
The spatial heterogeneity in wetting and softening may also affect cracking in HWP subgrades. Water progressively migrated from the slope toe toward the interior and upper parts of the subgrade. This may have produced spatial variations in stiffness and differential deformation between regions. Under subsequent loading, such nonuniform deformation may increase the susceptibility to localized cracking. However, cracking was not directly monitored in the present test. Therefore, this potential deterioration mechanism should be considered when HWP is used in water-sensitive road sections.
4.3. Suggestions for the Use of HWP as a Subgrade Material
Based on the present full-scale test, the HWP investigated in this study showed potential for use as a subgrade material under appropriate environmental and construction conditions. The following engineering recommendations apply to conditions comparable to those investigated in this study:
- (1)
- Excessive compaction should be avoided to improve construction efficiency and reduce cost and energy consumption. Further vibration provided limited improvement in compaction quality and may aggravate particle crushing. For the 26-ton vibratory roller used in this study, the number of compaction cycles for HWP is recommended to be limited to five in the 93% compaction zone and six in the 94% compaction zone. Table 5 summarizes the recommended compaction patterns for HWP and CIHWP.Table 5. Recommended compaction patterns for HWP and CIHWP using a 26-ton roller.
- (2)
- HWP may be used without cement stabilization in road sections with low groundwater levels and no long-term water immersion, provided that effective waterproofing and drainage measures are implemented. These measures can restrict water infiltration into the subgrade. They may also reduce spatially nonuniform wetting and differential deformation, thereby limiting the potential for localized cracking.
- (3)
- Untreated HWP is not recommended for road sections subjected to long-term water immersion or high groundwater levels. If HWP must be used under these conditions, stabilization measures should be considered. In the present full-scale test, 2% cement provided satisfactory stabilization performance under the conditions investigated. This dosage may therefore be considered as a low-cement-content treatment option for comparable conditions. Waterproofing and drainage measures remain necessary after stabilization. In particular, an impermeable geomembrane or another suitable low-permeability barrier should be installed near the expected immersion level. This measure may limit upward water migration and reduce the risk of softening in the upper subgrade.
Overall, the suitability of HWP as a subgrade material depends on its material characteristics and the hydrogeological conditions of the road section. Under conditions comparable to those investigated in this study, untreated HWP may be suitable for well-drained sections. Where prolonged wetting is expected, stabilization and water-control measures should be considered. These findings provide practical guidance for material selection, compaction control, stabilization design, and water management in HWP subgrade construction.
It should be noted that this study included one full-scale HWP section and one CIHWP section. The experiment was designed as a controlled engineering comparison rather than a statistically replicated study. Although material sourcing and construction procedures were controlled, natural material variability and differences between the two sections could not be quantified. Sensors installed at different locations captured spatial responses rather than providing statistical replicates. In addition, the parked rollers applied an intermittent, sustained static surcharge. This loading condition did not reproduce moving or cyclic traffic loads. Therefore, the findings should be interpreted within the specific material source, model geometry, construction procedure, immersion duration, and hydraulic and loading boundary conditions examined in this study. Further replicated full-scale tests involving different HWP sources and repeated traffic loading are needed. Such tests would help quantify uncertainty and assess the broader applicability of the findings.
Author Contributions
Conceptualization, Z.Z., Y.L. and J.Z.; methodology, Y.S., Z.Z. and Y.L.; software, Y.S., T.Z. and C.Y.; validation, S.M., K.L., Y.L., T.Z. and J.L.; formal analysis, Y.S. and Y.L.; investigation, Y.S., S.M., K.L., T.Z., C.Y. and J.L.; resources, S.M. and K.L.; data curation, Y.L., T.Z., C.Y. and J.L.; writing—original draft preparation, Y.S. and Y.L.; writing—review and editing, Z.Z., Y.L. and J.Z.; visualization, T.Z., C.Y. and J.L.; supervision, Z.Z. and J.Z.; project administration, S.M., K.L. and J.Z.; funding acquisition, Z.Z. and J.Z. All authors have read and agreed to the published version of the manuscript.
Funding
This work was financially supported by the Natural Science Foundation of the Hubei Province (2025AFC045).
Data Availability Statement
The original data supporting the findings of this study are included in the article. The satellite imagery used in Figure 2 was obtained from Google Maps (https://www.google.com/maps/, accessed on 12 October 2026), and the administrative boundary data were obtained from the National Platform for Common Geospatial Information Services of China (Tianditu; https://www.tianditu.gov.cn/, accessed on 12 October 2026). Further inquiries regarding the original experimental data may be directed to the corresponding author.
Acknowledgments
The authors would like to thank the editor and anonymous reviewers for their valuable comments and suggestions, which helped improve this manuscript. The authors also appreciate the assistance provided during the experimental work.
Conflicts of Interest
The authors declare no conflict of interest. Sisheng Mo is employed at CCCC Second Highway Engineering Bureau Co., Ltd., Xi’an, China and Kai Liu is employed at Central Southern China Electric Power Design Institute Co., Ltd. of China Power Engineering Consulting Group, Wuhan, China. However, their employment did not influence the design, execution, data collection, analysis, or interpretation of this research.
References
- Vázquez, J.; Garzón, E.; Romerosa, A.; Serrano-Ruíz, M.; Sánchez-Soto, P.; Galera, M. South Spain soils containing phyllites improved by using cement and lime. In Concrete for a Sustainable Agriculture; Universidad Politécnica de Madrid: Madrid, Spain, 2005; pp. 299–304. [Google Scholar]
- Garzón, E.; Sánchez-Soto, P.J.; Romero, E. Physical and geotechnical properties of clay phyllites. Appl. Clay Sci. 2010, 48, 307–318. [Google Scholar] [CrossRef] [Scilit]
- de Oliveira, T.F.; Beck, M.H.; Escosteguy, P.V.; Bortoluzzi, E.C.; Modolo, M.L. The effect of the substitution of hydrated lime with phyllite on mortar quality. Appl. Clay Sci. 2015, 105–106, 113–117. [Google Scholar] [CrossRef] [Scilit]
- Mao, X.S.; Miller, C.J.; Liu, L.Q. Cement improved highly weathered phyllite for highway subgrades: A case study in Shaanxi province. J. Traffic Transp. Eng. (Engl. Ed.) 2017, 04, 403–411. [Google Scholar] [CrossRef] [Scilit]
- Valera, T.S.; Ribeiro, A.P.; Valenzuela-Díaz, F.R.; Yoshiga, A.; Ormanji, W.; Toffoll, S.M. The effect of phyllite as a filler for PVC plastisols. In Proceedings of the 60th Annual Technical Conference, Society of Plastics Engineers (ANTEC 2002), San Francisco, CA, USA, 5–9 May 2002; Volume 3, pp. 3949–3953. [Google Scholar]
- Garzón, E.; García-Rodríguez, I.G.; Ruiz-Conde, A.; Sánchez-Soto, P.J. Phyllites used as waterproofing layer materials for greenhouses crops in Spain: Multivariate statistical analysis applied to their classification based on X-ray fluorescence analysis. X-Ray Spectrom. 2009, 38, 429–438. [Google Scholar] [CrossRef] [Scilit]
- Garzón, E.; Cano, M.; O’Kelly, B.C.; Sánchez-Soto, P.J. Phyllite clay–cement composites having improved engineering properties and material applications. Appl. Clay Sci. 2015, 114, 229–233. [Google Scholar] [CrossRef] [Scilit]
- Chen, Z.Q.; He, C.; Xu, G.W.; Ma, G.Y.; Yang, W.B. Supporting mechanism and mechanical behavior of a double primary support method for tunnels in broken phyllite under high geo-stress: A case study. Bull. Eng. Geol. Environ. 2019, 78, 5253–5267. [Google Scholar] [CrossRef] [Scilit]
- Chen, Z.Q.; He, C.; Xu, G.W.; Ma, G.Y.; Wu, D. A Case Study on the Asymmetric Deformation Characteristics and Mechanical Behavior of Deep-Buried Tunnel in Phyllite. Rock Mech. Rock Eng. 2019, 52, 4527–4545. [Google Scholar] [CrossRef] [Scilit]
- Mao, X.S.; Zheng, X.Z.; Ma, B.; Liang, J.; Zhou, L.G. Field experimental analysis of wetting deformation of filled subgrade with weathered phyllite. Rock Soil Mech. 2011, 08, 2300–2306. (In Chinese) [Google Scholar] [CrossRef]
- Mao, X.S.; Zhou, L.G.; Ma, B.; Zheng, X.-Z.; Zhao, W.-Y. Research on improvement technology of filling subgrade with highly weathered phyllite. China J. Highw. Transp. 2012, 25, 20–26. [Google Scholar] [CrossRef]
- Liu, F.F.; Mao, X.S.; Zhang, H.J.; Liu, L.Q.; Wu, Q. Investigating the Deformation Property of Weathered Phyllite Filling Subgrade. J. Test. Eval. 2019, 48, 3643–3657. [Google Scholar] [CrossRef] [Scilit]
- Liu, F.F.; Mao, X.S.; Fan, Y.S.; Wu, L.P.; Liu, W.V. Effects of initial particle gradation and rock content on crushing behaviors of weathered phyllite fills-A case of eastern Ankang section of Shiyan-Tianshui highway, China. J. Rock Mech. Geotech. Eng. 2020, 12, 269–278. [Google Scholar] [CrossRef] [Scilit]
- Dan, H.C.; Li, L.; Hu, P.; Zhao, L.D. Interior experimental study on compaction engineering characteristics of weathered-soft-rock subgrade filling materials. J. China Railw. Soc. 2009, 31, 75–82. [Google Scholar]
- Yang, Y.; Yan, Z.L. Phyllite roadbed filling technique on Wenchuan-Maerkang Highway. Technol. Highw. Transp. 2009, 06, 14–20. [Google Scholar] [CrossRef]
- Yang, S.; Zeng, Z. Application of phyllite excavation waste material in filling engineering of Guanggan road embankment. Xinan Gonglu 2013, 20–22. (In Chinese) [Google Scholar]
- Lei, Y.Z.; Wang, J.F.; Wang, K.Y.; Ji, X.P.; Niu, Z.H. Research on Compaction and Strength Characteristics of Phyllite Subgrade Filler. Highway 2019, 64, 41–46. (In Chinese) [Google Scholar]
- JTG D30-2015; Specifications for Design of Highway Subgrades. People’s Communications Press Co., Ltd.: Beijing, China, 2015.
- JTG/T 3610-2019; Technical Specifications for Construction of Highway Subgrades. People’s Communications Press Co., Ltd.: Beijing, China, 2019.
- Arce, C.; Garzón, E.; Sánchez-Soto, P.J. Phyllite clays as raw materials replacing cement in mortars: Properties of new impermeabilizing mortars. Constr. Build. Mater. 2019, 224, 348–358. [Google Scholar] [CrossRef] [Scilit]
- Ansari, T.; Kainthola, A.; Singh, K.H.; Sazid, M. Geotechnical and micro-structural characteristics of phyllite derived soil; implications for slope stability, Lesser Himalaya, Uttarakhand, India. Catena 2021, 196, 104906. [Google Scholar] [CrossRef] [Scilit]
- Li, X.P.; Lu, Y.; Wu, X.H. Interior Experimental Study on Engineering Properties of the Modified Tonhaltig Phyllite. Adv. Mater. Res. 2011, 243–249, 2586–2590. [Google Scholar] [CrossRef] [Scilit]
- Chen, Y.Q.; Zhang, H.J.; Wang, T.Q. Different Gradations Cement Improved Phyllite Test Analysis. Adv. Mater. Res. 2014, 919–921, 1894–1898. [Google Scholar] [CrossRef] [Scilit]
- Zhang, Y.J.; Wang, X.; Yin, Y.X.; Zhao, L. Experimental study on railway subgrade filling material of phyllite spoil improved with cement. J. China Railw. Soc. 2014, 36, 81–86. [Google Scholar]
- Xu, G.W.; He, C.; Chen, Z.Q.; Yang, Q.H. Transversely isotropic creep behavior of phyllite and its influence on the long-term safety of the secondary lining of tunnels. Eng. Geol. 2020, 278, 105834. [Google Scholar] [CrossRef] [Scilit]
- Zhang, J.M.; Luo, Y.; Zhou, Z.; Chong, L.; Victor, C.; Zhang, Y.F. Effects of preferential flow induced by desiccation cracks on slope stability. Eng. Geol. 2021, 288, 106164. [Google Scholar] [CrossRef] [Scilit]
- Luo, Y.; Zhang, J.M.; Zhou, Z.; Shen, Z.J.; Chong, L.; Victor, C. Investigation and prediction of water infiltration process in cracked soils based on a full-scale model test. Geoderma 2021, 400, 115111. [Google Scholar] [CrossRef] [Scilit]
- Al-Shaer, A.; Duhamel, D.; Sabet, K.; Foret, G.; Schmitt, L. Experimental subsidence and dynamic behavior of a portion of ballasted railway track under high-speed trains. J. Sound Vib. 2008, 316, 211–233. [Google Scholar] [CrossRef] [Scilit]
- Zhan, Y.; Jiang, G. Study of dynamic characteristics of soil subgrade bed for ballastless track. Rock Soil Mech. 2010, 31, 392–396. (In Chinese) [Google Scholar] [CrossRef]
- Ishikawa, T.; Sekine, E.; Miura, S. Cyclic deformation of granular material subjected to moving-wheel loads. Can. Geotech. J. 2011, 48, 691–703. [Google Scholar] [CrossRef] [Scilit]
- Moriwaki, H.; Inokuchi, T.; Hattanji, T.; Sassa, K.; Ochiai, H.; Wang, G. Failure processes in a full-scale landslide experiment using a rainfall simulator. Landslide 2004, 01, 277–288. [Google Scholar] [CrossRef] [Scilit]
- Chen, R.R.; Zhao, X.; Wang, Z.Z.; Jiang, H.G.; Bian, X.C. Experimental study on dynamic load magnification factor for ballastless track-subgrade of high-speed railway. J. Rock Mech. Geotech. Eng. 2013, 05, 306–311. [Google Scholar] [CrossRef] [Scilit]
- Jia, G.W.; Zhan, L.T.; Chen, Y.M.; Fredlund, D.G. Performance of a large-scale slope model subjected to rising and lowering water levels. Eng. Geol. 2009, 106, 92–103. [Google Scholar] [CrossRef] [Scilit]
- Pei, P.; Zhao, Y.; Ni, P.; Mei, G. A protective measure for expansive soil slopes based on moisture content control. Eng. Geol. 2020, 269, 105527. [Google Scholar] [CrossRef] [Scilit]
- Muramoto, K.; Sekine, E.; Nakamura, T. Roadbed Degradation Mechanism under Ballastless Track and its Countermeasures. Q. Rep. RTRI 2006, 47, 222–227. [Google Scholar] [CrossRef] [Scilit]
- Bian, X.; Jiang, H.; Cheng, C.; Chen, Y.; Chen, R.; Jiang, J. Full-scale model testing on a ballastless high-speed railway under simulated train moving loads. Soil Dyn. Earthq. Eng. 2014, 66, 368–384. [Google Scholar] [CrossRef] [Scilit]
- Bian, X.; Jiang, H.; Chen, Y.; Han, J. Development of a full-scale physical model test for investigating performance of ballastless high-speed railways. Proc. Inst. Mech. Eng. F 2016, 230, 554–571. [Google Scholar] [CrossRef] [Scilit]
- Jiang, H.J.; Bian, X.C.; Jiang, J.Q.; Chen, Y.M. Dynamic performance of high-speed railway formation with the rise of water table. Eng. Geol. 2016, 206, 18–32. [Google Scholar] [CrossRef] [Scilit]
- Li, J.; Chen, S.X.; Yu, F.; Dai, Z.J.; Ojekunle, O.V. In situ model tests to investigate the dynamic response of water-softened subgrade under vibrating loads. Soil Dyn. Earthq. Eng. 2020, 138, 106336. [Google Scholar] [CrossRef] [Scilit]
- Garzón, E.; Cano, M.; O’Kelly, B.C.; Sánchez-Soto, P.J. Effect of lime on stabilization of phylllite clays. Appl. Clay Sci. 2016, 123, 329–334. [Google Scholar] [CrossRef] [Scilit]
- Sousa, J.B.; Harvey, J.; Painter, L.; Deacon, J.A.; Monismith, C.L. Evaluation of Laboratory Procedures for Compacting Asphalt-Aggregate Mixtures. 1991. Available online: http://onlinepubs.trb.org/onlinepubs/shrp/SHRP-91-523.pdf (accessed on 12 October 2026).
- Huang, J.Y.; Pei, J.Z.; Li, Y.; Yang, H.Y.; Li, R.; Zhang, J.P.; Wen, Y. Investigation on aggregate particles migration characteristics of porous asphalt concrete (PAC) during vibration compaction process. Constr. Build. Mater. 2020, 243, 118153. [Google Scholar] [CrossRef] [Scilit]



Disclaimer/Publisher’s Note: The statements, opinions and data contained in all publications are solely those of the individual author(s) and contributor(s) and not of MDPI and/or the editor(s). MDPI and/or the editor(s) disclaim responsibility for any injury to people or property resulting from any ideas, methods, instructions or products referred to in the content. |
© 2026 by the authors. Licensee MDPI, Basel, Switzerland. This article is an open access article distributed under the terms and conditions of the Creative Commons Attribution (CC BY) license.