


Featured Application
The expert-informed requirements presented in this study can guide the development and evaluation of practical leak-detection systems for underground water-pipe networks. Although derived for distributed soil-moisture sensing along plastic pipes, they can also inform alternative detection and localisation technologies, subject to renewed stakeholder confirmation and technology-specific verification, addressing utility expectations for sensitivity, reliability, cost, maintenance, sampling frequency, and long-term operation.
Abstract
Leak detection in underground drinking-water networks is especially difficult in plastic pipes because leak-generated acoustic and vibration signals attenuate strongly. This study investigates the concept of distributed soil-moisture monitoring as a potential complementary early-warning approach and derives stakeholder requirements for future system development. An expert questionnaire was distributed by email to 90 water-supply utilities in the Swiss cantons of Thurgau, Zurich, and Aargau. Fifty-five submissions were received (61.1% relative to invitations), of which 52 included consent for research use and were analysed (57.8% of invitations). Item-specific denominators, Wilson 95% confidence intervals, and exploratory exact and non-parametric subgroup tests were used. Current practice was dominated by acoustic methods (48/52) and baseline-consumption monitoring (41/52). Among valid quantitative answers, 29/47 respondents expected detection at or below 20 L/h (61.7%, 95% CI 47.4–74.2%), 44/46 preferred at least daily sampling (95.7%, 85.5–98.8%), 41/45 selected a price at or below EUR 20/m (91.1%, 79.3–96.5%), 36/46 specified a false-alarm tolerance of no more than one per year (78.3%, 64.4–87.7%), and 39/44 specified a missed-leak tolerance of no more than 5% (88.6%, 76.0–95.0%). These cumulative proportions include more demanding response categories and do not establish acceptance of performance exactly at each boundary. Experience-group comparisons yielded no statistically significant differences after Holm correction. The contribution is a traceable, uncertainty-aware requirement specification linked to engineering relationships and verification planning for power, spacing, latency, cost, false alarms, and missed detections. Limited precision, regional recruitment, and unfamiliarity with the monitoring approach constrain interpretation. The requirements are provisional design inputs; technical feasibility and final acceptance criteria require laboratory, field, and stakeholder validation.
1. Introduction
Water loss in drinking-water distribution systems is a persistent technical, economic, and environmental problem. Non-revenue water includes physical leakage as well as apparent losses and authorised unbilled consumption; it should therefore not be treated as synonymous with leakage. Global estimates nevertheless show the scale of the problem, while ISO 24528 provides a structured framework for water-balance-based loss investigation and management [1,2]. Earlier identification and localisation of physical leaks can reduce avoidable water loss, secondary damage, and reactive repair effort [3,4].
Current leak-detection practice combines system-level indicators and local investigation. Water balances and minimum-night-flow analysis support network or district screening [3,4]. Pressure-based approaches include passive monitoring of pressure variations without deliberate excitation and active transient test-based techniques (TTBTs). The latter generate controlled hydraulic pressure waves and analyse the resulting pressure response to detect and locate existing leaks [3,5]. Mobile acoustic surveys, correlators and fixed noise loggers exploit leak-generated sound [3,6]. Tracer-gas surveys detect escaping gas, whereas infrared imaging and ground-penetrating radar (GPR) identify thermal or subsurface electromagnetic anomalies [3,7]. Other approaches include in-pipe inspection and distributed fibre-optic sensing, while hydraulic models, statistical methods and machine learning support interpretation of the measurements [3,8]. The suitability of these methods depends on leak size, pressure, pipe material, burial conditions, sensor access, background noise, and whether the task is screening, detection or precise localisation. Recent reviews therefore emphasise complementary sensing and staged confirmation [3,4].
For acoustic methods, pipe material is particularly relevant. Leak signals in PVC and polyethylene pipes are strongly attenuated, narrow-band, and concentrated at low frequencies [9,10,11,12]. The Swiss SVGW W4 guidance likewise distinguishes practical leak-location conditions according to pipe material and diameter [13]. Recent controlled comparisons confirm that sensor type and coupling materially influence detection performance on PVC pipes [14]. These findings do not imply that acoustic detection is ineffective in plastic networks; they imply shorter practical ranges and greater dependence on measurement conditions.
Plastic pipes are also a material part of contemporary water-main inventories, although prevalence and diameter distributions vary by country and utility. A North American utility survey conducted in 2022 and reported in 2023 found that PVC represented approximately 29% of reported in-service main length. In the detailed diameter data, more than 75% of PVC main length was in the 3–8 inch range (approximately 76–203 mm) [15]. These figures are not estimates for Switzerland, but they show that plastic assets in smaller distribution-main diameters are operationally important in a large modern utility dataset. A material-dependent sensing limitation can therefore create denser measurement requirements and higher survey effort.
A complementary strategy is to sense the subsurface consequence of leakage rather than leak noise. A buried leak produces a wetting plume whose magnitude and travel time depend on leak rate, soil texture and structure, antecedent water content, pressure, pipe depth, preferential flow, groundwater, and weather [16,17,18]. Prototype studies have classified leak-related soil-moisture patterns in controlled settings [19], and recent microwave imaging work has estimated moisture near a buried dripping pipe [20]. A pipe-embeddable impedance sensor has also detected released water around a PVC pipe in laboratory tests [21]. Low-cost capacitance-based probes are one possible implementation [22,23], but this requirements study does not select or validate a particular transducer technology. Irrespective of the sensing principle, soil properties, temperature, sensor-to-sensor variability, ageing, installation contact, and the conversion of sensor output to a moisture quantity can affect interpretation [22,23,24]. Long-term soil-moisture records further demonstrate substantial seasonal and depth-dependent variability [25].
Recent work on wireless underground sensor networks and the Internet of Underground Things (IoUT) demonstrates relevant building blocks, including buried low-power sensing, soil-dependent radio propagation, multi-hop LoRa links, aerial gateways, and long-duration deployments [24,26,27,28,29,30,31,32]. These studies establish technical possibilities but do not jointly provide the utility-specific evidence and interpretation rules used here to derive sensitivity, sampling, reliability, cost, and maintenance requirements. Recent small-leak reviews organise available technologies [4]. The gap addressed by this study is the connection between practitioner expectations and a traceable set of application requirements for local soil-wetting surveillance along plastic pipes.
Agricultural and rural monitoring provides adjacent evidence. UAV-based thermal and RGB observations have been used to identify leak areas in vineyard irrigation systems [33], while agricultural field studies demonstrate underground soil monitoring and communication [28,29,31,32]. Irrigation schedules, surface conditions, burial geometry, and hydraulic operation differ from those of buried drinking-water mains. These studies inform the sensing context and environmental confounders, but their results cannot directly validate the leak-rate and reliability requirements elicited here.
This study presents a traceable specification of practitioners’ requirements to guide the development and evaluation of distributed soil-moisture leak monitoring. The specification takes account of the regional recruitment strategy, respondents’ familiarity with the monitoring technology, and the precision of the survey estimates. The presented set of requirements provides the basis for technology design, while laboratory and field studies are the subsequent steps for assessing whether a particular implementation meets them. Confidence intervals and exploratory subgroup comparisons make statistical uncertainty in terms of requirement gathering visible, without implying equivalence between experience groups. Section 4.5 discusses these considerations in detail.
This study makes four contributions:
- (i)
- A plastic-pipe-specific problem framing supported by recent leak-detection, pipe-inventory, soil-moisture, and underground-IoT literature;
- (ii)
- A traceable set of stakeholder requirements derived from 52 consented responses, with explicit recoding rules, item-specific denominators, and uncertainty intervals;
- (iii)
- Secondary exploratory subgroup analyses that describe possible experience-related heterogeneity and the limits of comparisons supported by the available sample; and
- (iv)
- Engineering relationships and verification planning that identify the inputs needed to assess sampling energy, spacing and detection latency, installed cost, and reliability.
The academic contribution is thus an uncertainty-aware and verification-oriented requirements baseline, rather than novelty in the questionnaire technique or in the individual sensor. ISO/IEC/IEEE 29148 informed the use of uniquely identified, measurable requirements and traceability from stakeholder evidence to proposed verification [34]. Requirements concerning leak sensitivity, false alarms, missed detections, sampling, cost, maintenance, and long-term reliability may also serve as benchmarks for other distributed monitoring approaches; sensor-specific calibration and hydrological confounding remain important when the monitored variable is soil moisture. Accordingly, the study objective is to elicit application requirements; selecting or validating a sensor technology is outside its scope.
2. Materials and Methods
2.1. Study Design
This study combines a focused narrative literature update, a structured expert questionnaire, uncertainty-aware statistical analysis, requirements derivation, and engineering relationships and verification planning. The literature defines the system boundary and evidence gap; the questionnaire elicits practitioner needs and threshold expectations; the analysis quantifies uncertainty and explores experience-related heterogeneity; and the engineering relationships identify dependencies and proposed verification conditions for later engineering work. No laboratory or field performance data are presented.
2.2. Literature Study and Positioning
The literature component is a targeted narrative review rather than a systematic review. The update used combinations of the concepts plastic/PVC/PE pipe, leak detection/localisation, subsurface small leak, hydraulic monitoring, transient test-based leak detection, soil moisture sensing, underground wireless sensor network, IoUT, LoRa, calibration, and long-term monitoring. Selection prioritised peer-reviewed work from 2021 onward, relevant experimental studies, authoritative standards, and older foundational papers needed to explain acoustic propagation and soil-moisture variability. Sources were retained when they informed the problem definition, conceptual monitoring approach, environmental confounders, engineering dependencies, or requirements methodology.
2.3. Conceptual Monitoring Approach Used for Requirement Elicitation
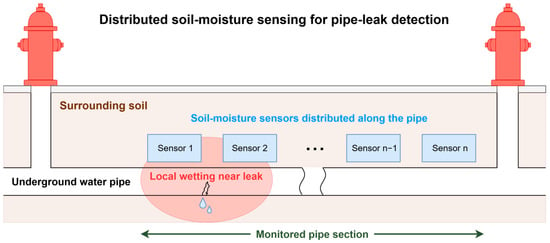
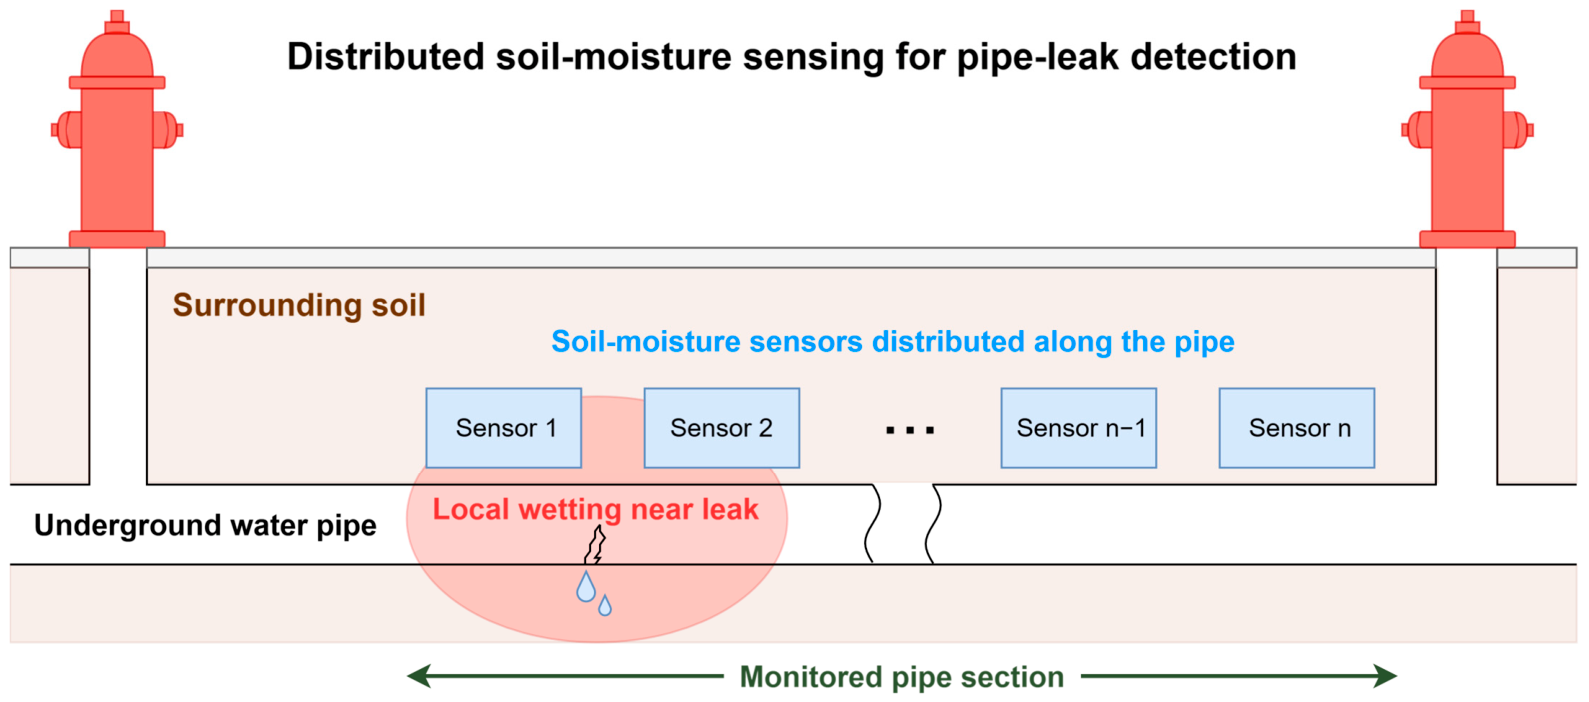
The system-of-interest is a distributed soil-moisture monitoring layer installed close to an underground water pipe, with primary relevance to new construction, renewal, or rehabilitation where trench access exists. As illustrated in Figure 1, it is intended to monitor a pipe segment on an ongoing basis and trigger confirmation by established localisation methods. It does not estimate water balance, replace network hydraulic monitoring, or claim centimetre-scale localisation. The following architecture is included only to provide functional context for requirement elicitation; it is neither a prescribed implementation nor an object whose performance is evaluated in this study.
Figure 1.
Conceptual overview of distributed soil-moisture sensing for pipe-leak detection. Soil-moisture sensors are placed along an underground water pipe to monitor a pipe section for local wetting caused by leakage.
In the assumed deployment, soil-moisture sensors are distributed along the buried pipe so that local changes in the surrounding soil-moisture condition can be observed at pipe-segment level. The sensing technology is deliberately left open. A leak candidate would be indicated by a persistent local increase relative to baseline and neighbouring locations, while rainfall, groundwater variation, irrigation, seasonal dynamics, and sensor drift would need to be considered [16,17,18,22,23,24,25]. The exact sensor technology, signal representation, and detection algorithm are outside the scope of this requirements study.
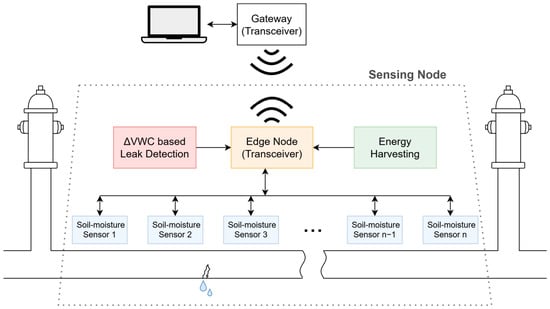
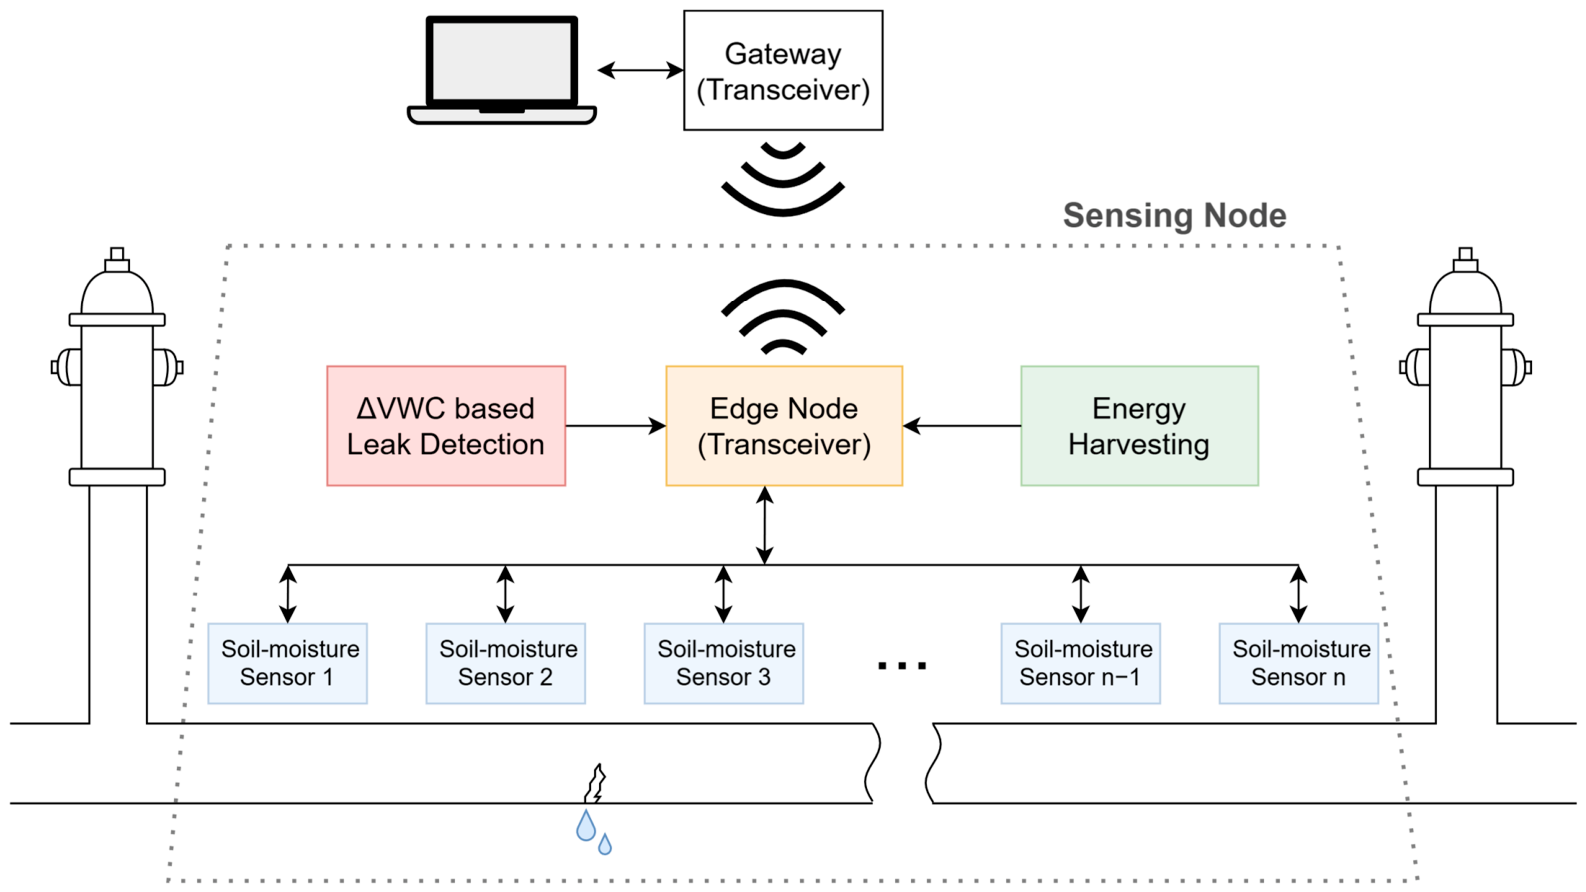
For context, Figure 2 illustrates one possible system architecture in which multiple soil-moisture sensors are connected to an edge node incorporating communication and optional energy harvesting. At the edge node, changes in volumetric water content (∆VWC) measured by the distributed sensors may be processed to identify spatial and temporal anomalies indicative of a leak and to support its localisation. The figure is intended solely to clarify the monitoring concept discussed in this article; it does not represent a selected or experimentally evaluated system design. Accordingly, the requirements derived below are formulated at the application level and remain independent of any particular soil-moisture sensing principle.
Figure 2.
Conceptual system context used to frame the requirements study. Multiple soil-moisture sensors are connected to an edge node with communication and optional energy harvesting. The architecture is illustrative and does not prescribe or validate a particular sensor technology or detection algorithm.
Sensor spacing, sensor depth and offset, encapsulation, power supply, communication topology, persistence duration, and alarm thresholds remain design variables. Later experiments must declare the selected sensor principle, soil class, compaction, salinity, antecedent water content, burial geometry, leak orientation and pressure, weather/groundwater conditions, and calibration procedure.
2.4. Expert Survey Using a Structured Questionnaire
The questionnaire was designed as a structured requirements-elicitation instrument. Its objective was to translate practitioner experience, acceptance criteria, and operational constraints into preliminary stakeholder requirements for the system-of-interest. The target population was Swiss water-supply practitioners; this was a purposive/convenience sample and was not designed to estimate national prevalence.
The questionnaire was implemented in Microsoft Forms and distributed in German through an anonymous link. Ninety standardised email invitations were sent to water-supply companies in the Swiss cantons of Thurgau, Zurich, and Aargau. Fifty-five survey submissions were received, giving a submission-to-invitation ratio of 61.1%. Three respondents did not consent to anonymous research publication; the 52 consented responses therefore represent 57.8% of all invitations and 94.5% of submitted questionnaires. These ratios describe submissions relative to invitations; the anonymous responses were not linked to individual invited utilities. The consent item terminated the survey when anonymous research use was declined. No names, contact details, IP addresses, utility size, respondent-level regional identifier, or pipe-material portfolio were collected. The analytical export was dated 31 March 2026 and the first response was received on 4 November 2025. The study was reviewed under Zurich University of Applied Sciences procedures and approved by the Ethical Review Board of Eindhoven University of Technology (TU/e; ERB-470, 28 October 2025), as reported in the Institutional Review Board Statement.
The 15-item questionnaire was intentionally short and predominantly closed-ended, following general principles for concise practitioner surveys [35]. Its blocks covered consent (Q1), role and experience (Q2–Q3), current methods and infrastructure context (Q4–Q7), awareness, promise, and barriers (Q8–Q10), and expected leak sensitivity, sampling, price per metre, false alarms, and missed detections (Q11–Q15). The instrument included single-choice, multiple-response, matrix-rating, and 5-point ordinal items plus optional free text. Utility size and material share were not included, which limits the subgroup analyses requested during review.
The questionnaire elicited expectations for a future monitoring concept. The aim was to capture desired operational outcomes, such as the leak rates utilities would like to detect, which practitioners could consider in light of their existing methods and infrastructure constraints. Q8 asked whether respondents had previously heard of or worked with soil-moisture sensing along water pipelines; its binary response does not distinguish awareness from hands-on use. Q11–Q12 explicitly referred to a soil-moisture-based system, whereas Q13–Q15 elicited price and alarm-performance expectations within the same questionnaire sequence. These items asked what a future system should achieve or what respondents considered acceptable, rather than what an existing implementation had demonstrated. The resulting values are operational expectations expressed in the context of this concept, independent of a selected transducer principle but not necessarily independent of the technology framing. Q7 concerned expected pipe service life, not a required sensor lifetime.
Items were mapped to requirement dimensions: Q2–Q3 to expertise; Q4–Q7 to current practice and infrastructure horizon; Q8–Q10 to concept familiarity and adoption constraints; and Q11–Q15 to quantitative expectations. Each numerical requirement receives a unique identifier, its exact survey evidence, and a feasibility status; proposed verification methods are discussed separately in Section 4.2. This structure follows the traceability and testability principles of ISO/IEC/IEEE 29148 [34].
Supplementary Spreadsheet S1 contains the original questionnaire wording and translation, the 52 consented response records with precise timestamps omitted, a documented recoding dictionary, processed variables, item-specific distributions, confidence intervals, subgroup-test outputs, and native spreadsheet figures. Keeping the raw and processed layers separate makes all exclusions and recodings auditable.
2.5. Data Analysis and Requirement Derivation
The analysis of the 52 consented questionnaire records was carried out in three steps. First, closed-ended responses were summarised descriptively using counts and percentages, with item-specific valid denominators reported because not all respondents provided a quantifiable answer to every question. Free-text responses were recoded only when their quantitative meaning was unambiguous; all recoding decisions are documented in Supplementary File S1, and non-quantifiable responses were excluded from the relevant denominator. For Q10, one blank answer and one answer stating only “no experience” were excluded, leaving 50 substantive barrier responses. Post hoc themes were coded using the definitions and response-ID mappings in S1; multiple codes were allowed and no independent double-coding was performed. Two-sided Wilson 95% confidence intervals were calculated for individual category and cumulative expectation proportions. These are marginal binomial-model precision summaries, not simultaneous intervals or evidence that the convenience sample is population-representative.
Second, the response patterns were interpreted according to the question mapping described above: contextual items defined the practitioner baseline, barrier items identified adoption constraints, and threshold items defined candidate engineering targets. To explore potential differences by professional experience, ordinal outcomes were compared across four experience groups (0–5, 6–10, 11–20, and >20 years) using tie-corrected Kruskal–Wallis tests with chi-square p-values (3 degrees of freedom). Effect sizes were calculated as η2H = max [0, (H − k + 1)/(n − k)], where k = 4 and n is the complete-case sample size; negative estimates were reported as zero. Selection of each predefined barrier was compared between respondents with ≤10 and ≥11 years of experience using two-sided Fisher’s exact tests, odds ratios, and signed phi coefficients. Odds ratios and phi were oriented as more-experienced versus early-career respondents. Holm adjustment was applied separately within the six ordinal-outcome tests and the five barrier-selection tests, with α = 0.05. These analyses were added during revision and treated as exploratory because the sample was purposive and practice-oriented rather than randomly selected. A multivariable logistic regression was not fitted because the questionnaire did not collect utility size or pipe-material share, while professional role and prior awareness were highly imbalanced; the proposed infrastructure-based model was not adequately supported by these data.
The subgroup analyses were secondary checks for observable heterogeneity within the responding sample. They did not determine requirement thresholds or test equivalence. Pooled response patterns describe the sample as recruited; their use is not justified by a non-significant subgroup test.
Third, the candidate targets were translated into preliminary system requirements by selecting values that reflected the dominant or cumulative response pattern. For example, 29 of 47 respondents expected detection at 20 L/h or below, and 42 of 47 expected detection at 50 L/h or below. These findings informed a preferred target of ≤20 L/h and an initial benchmark of ≤50 L/h. A cumulative proportion includes respondents selecting more demanding categories; it does not establish that all counted respondents would accept a system performing exactly at the stated boundary. The interpretation levels in Section 3.5 are author-defined descriptive rules, and the proposed requirements require further stakeholder confirmation. The complete statistical calculations, confidence intervals, subgroup analyses, and recoding details are provided in Supplementary File S1.
2.6. Engineering Relationships and Verification Planning
The survey thresholds are treated as candidate stakeholder requirements. The following relationships identify engineering dependencies and the measurements needed for later assessment; they do not establish technical feasibility. Equations (1)–(3) express energy accounting, sensor geometry and conditional sampling delay, and cost normalisation, respectively. Appendix A derives these relationships and states their assumptions.
The daily energy demand of a sensing node is obtained by adding the energy used for its different activities. Here, the accounting boundary includes the edge-node electronics and the soil-moisture sensors it serves. A duty-cycled implementation uses a low-power state between active periods for waking, sensing, processing, and transmitting data. Each active period adds energy above the sleep baseline. Counting sampling and transmission events separately and adding their incremental energies to the baseline consumption over one day gives:
Eday = Nsamp(Ewake + nsEsensor + Eprocess) + NtxEtx + 86,400Psleep
Here Nsamp and Ntx are the daily sampling-cycle and transmission counts, ns is the number of sensors served by one node, and Psleep is the node’s baseline sleep power in watts. The factor 86,400 is the number of seconds in one day, so the result is in joules per day. Ewake, Esensor, Eprocess, and Etx are incremental event energies in joules above that baseline. If total event energies are used instead, the sleep term must use actual sleep time to avoid double counting. Sensor warm-up, receiving, retransmissions, and other active operations must be included in the measured event budget. Sampling may be more frequent than radio transmission. All energy terms must refer to the same electrical boundary, including conversion losses once. The per-sensor term assumes equal event energies; otherwise, the individual sensor energies must be summed.
Sensor spacing and sampling frequency affect how quickly a leak-related change can be observed. For regularly spaced sensors with coverage at the segment ends, the largest axial distance to the nearest sensor is half the spacing. If a sufficiently persistent, detectable wetting signal reaches a sensor, the detection delay comprises the wetting time, the wait for the next measurement, and any additional persistence period. With uniformly distributed signal-arrival timing between measurements, the mean sampling wait is half the sampling interval. These relationships give:
For uniform one-dimensional sensor spacing s with coverage at the segment ends, dax,max = s/2 is the maximum axial separation from a leak to the nearest sensor. It is not the three-dimensional wetting path: with a fixed perpendicular offset r, the maximum straight-line separation to the nearest sensor is sqrt[(s/2)2 + r2]. The latency relationship is conditional on a detectable wetting signal becoming available at a monitored sensor and remaining sufficient for the decision rule. Here twet,avg is the mean time to that signal under the declared conditions, and tpersist is a fixed persistence delay after the first qualifying observation. A mean sampling delay of ∆t/2 follows if signal availability has uniform phase relative to regular sampling at interval ∆t; the sampling wait is bounded by ∆t. Processing and communication delays must be added for a utility-received alert. Wetting may bypass a sensor or remain below its detection threshold. Equation (2) therefore cannot establish leak sensitivity, detection probability, or a suitable spacing; these require measurements under declared soil and hydraulic conditions.
An engineering assessment of affordability requires cost to be expressed per metre of monitored pipe. The installed-cost boundary used here adds sensors and their protection, cables, shared nodes or gateways, and installation and commissioning. Dividing this total by the monitored pipe length gives:
In Equation (3), L > 0 is monitored pipe length in metres; Lcable is the actual installed cable length in metres, which need not equal L; Nsens is the total number of installed sensors; Csensor and Cprotect are costs in EUR per sensor; ccable,m is cable cost in EUR/m; and Cshared,total and Cinstall,total are total shared-node/gateway and installation/commissioning costs in EUR. The total cost in the numerator divided by L gives installed cost per monitored metre. The questionnaire elicited price per metre without specifying which of these components respondents included; this installed-cost boundary is an author-defined translation for later assessment. Operation, maintenance, and replacement require a separate lifecycle horizon and cost model. Reliability verification also requires adequate exposure. Under a homogeneous Poisson model, zero false alarms over exposure T gives a one-sided 95% upper rate bound of −ln(0.05)/T = 2.996/T. If T is measured in consistently defined segment-years, three segment-years give an upper bound of 0.999 false alarms per segment-year. The questionnaire did not define a segment length, so that normalisation remains to be agreed with utilities. For zero misses in n independent, qualifying leak trials with a common miss probability, the one-sided exact binomial upper bound is 1 − 0.05(1/n); 59 trials give 4.95% and 60 give 4.87%. These one-sided validation-planning bounds differ from the two-sided Wilson intervals used for survey proportions and do not establish achieved performance.
3. Results
3.1. Respondent Profile and Current Practice
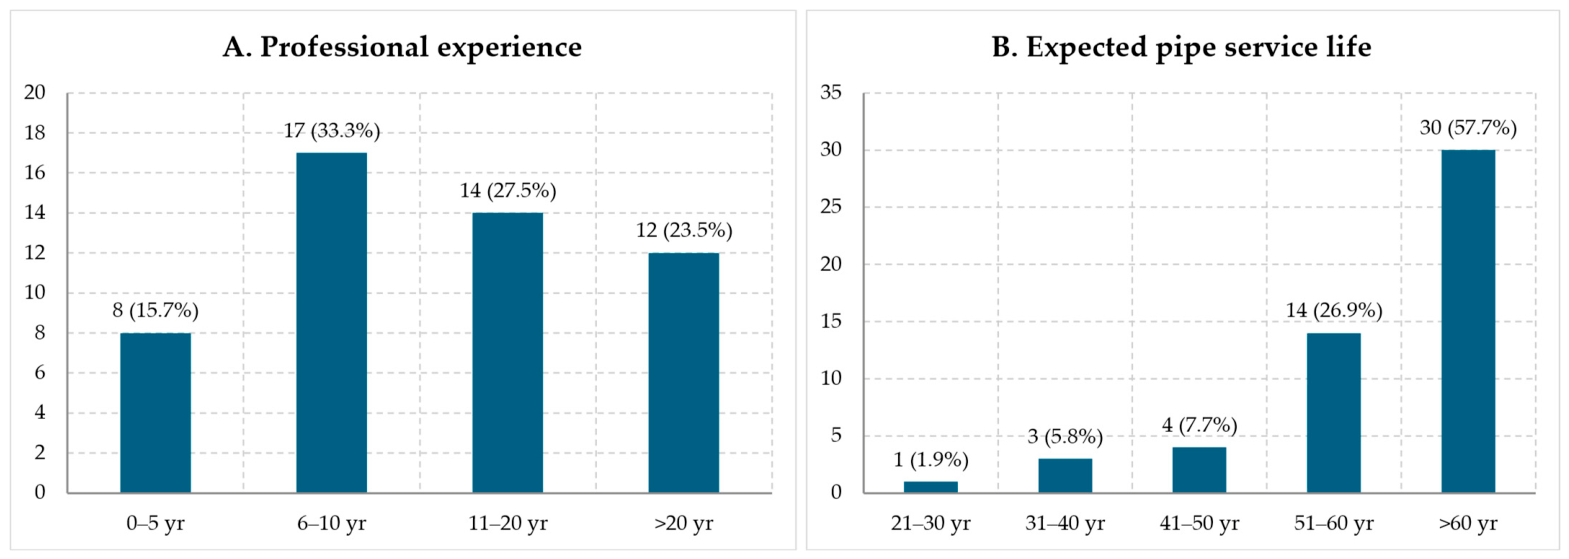
Of the 90 invited water-supply companies, 55 survey submissions were received (61.1%). Fifty-two included consent and were analysed (57.8% of invitations; 94.5% of submissions). Forty-eight respondents identified as water-utility operators or employees and four held other water-sector roles. Experience was reported by 51 respondents: 8 had 0–5 years, 17 had 6–10 years, 14 had 11–20 years, and 12 had more than 20 years. Expected pipe service life was long: 44/52 (84.6%, 95% CI 72.5–92.0) selected at least 51 years. Figure 3 shows both respondent experience and expected pipe lifetime.
Figure 3.
Respondent experience (n = 51) and expected lifetime of underground water pipes (n = 52).
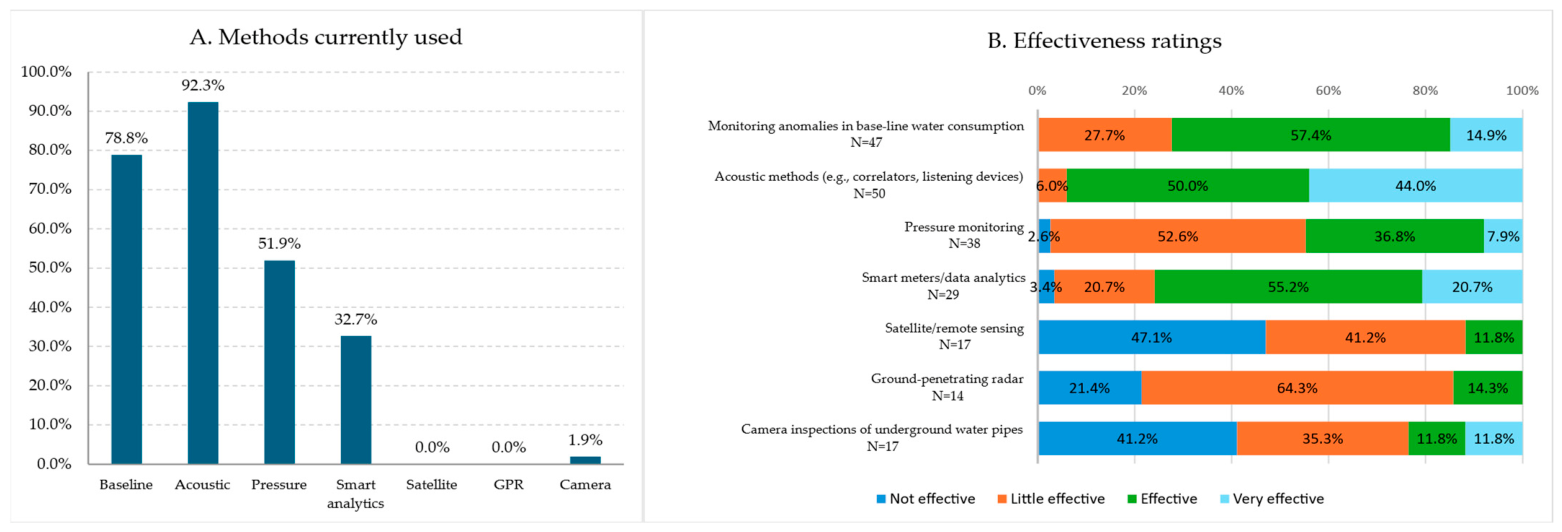
Current practice was dominated by acoustic methods (48/52), baseline-consumption anomaly monitoring (41/52), pressure monitoring (27/52), and smart meters/data analytics (17/52). Satellite/remote sensing and GPR were not selected as methods currently used, and camera inspection was selected once. Among those providing effectiveness ratings, acoustic methods had a median of 3 (IQR 3–4) on the four-level scale; baseline-consumption monitoring had a median of 3 (IQR 2–3); pressure monitoring had a median of 2 (IQR 2–3); and smart meters/data analytics had a median of 3 (IQR 3–3). Figure 4 distinguishes prevalence from effectiveness and displays method-specific denominators.
Figure 4.
Current leak-detection methods selected by respondents (multiple response; n = 52) and effectiveness ratings among respondents who rated each method. The effectiveness-panel denominator therefore varies by method. Percentages are rounded to one decimal place and may not sum to 100% due to rounding.
3.2. Perceived Promise and Adoption Barriers
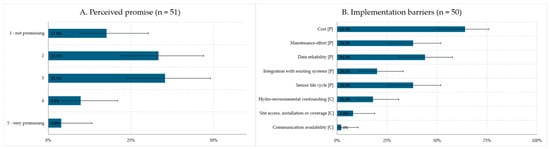
Four of 52 respondents answered yes when asked whether they had previously heard of or worked with distributed soil-moisture sensing along pipes; 48 answered no. Because Q8 combined awareness and use, the number with hands-on experience cannot be determined. The promise item had 51 valid responses, a median of 2 (IQR 2–3), and a mean of 2.49 on the 1–5 scale. The distribution indicates a cautious-to-moderate initial appraisal; it does not establish technical feasibility or willingness to adopt a specified implementation.
Among 50 substantive barrier responses, the predefined selections were cost (32; 64.0%), data reliability (22; 44.0%), maintenance effort (19; 38.0%), sensor life cycle (19; 38.0%), and integration with existing systems (10; 20.0%). Post hoc coding of free-text answers additionally identified hydrological/environmental confounding (9; 18.0%), site access/installation/coverage (4; 8.0%), and communication availability (1; 2.0%). These coded themes supplement the predefined categories; their spontaneous mention rates are not directly comparable with prompted checkbox selection rates. Figure 5 reports the perceived-promise distribution and barrier proportions with Wilson 95% confidence intervals.
Figure 5.
Perceived promise of distributed soil-moisture sensing ((A); n = 51; 1 = not promising, 5 = very promising) and implementation barriers ((B); multiple response; valid n = 50). Bars show observed proportions and capped whiskers show two-sided Wilson 95% confidence intervals. [P] denotes predefined options and [C] denotes post hoc coded open-text themes. Intervals describe the precision of each category proportion under a binomial model; they are not simultaneous intervals and do not establish population representativeness.
3.3. Performance Expectations
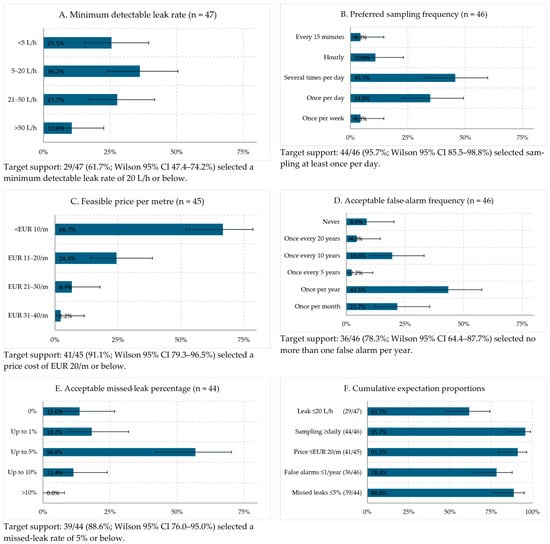
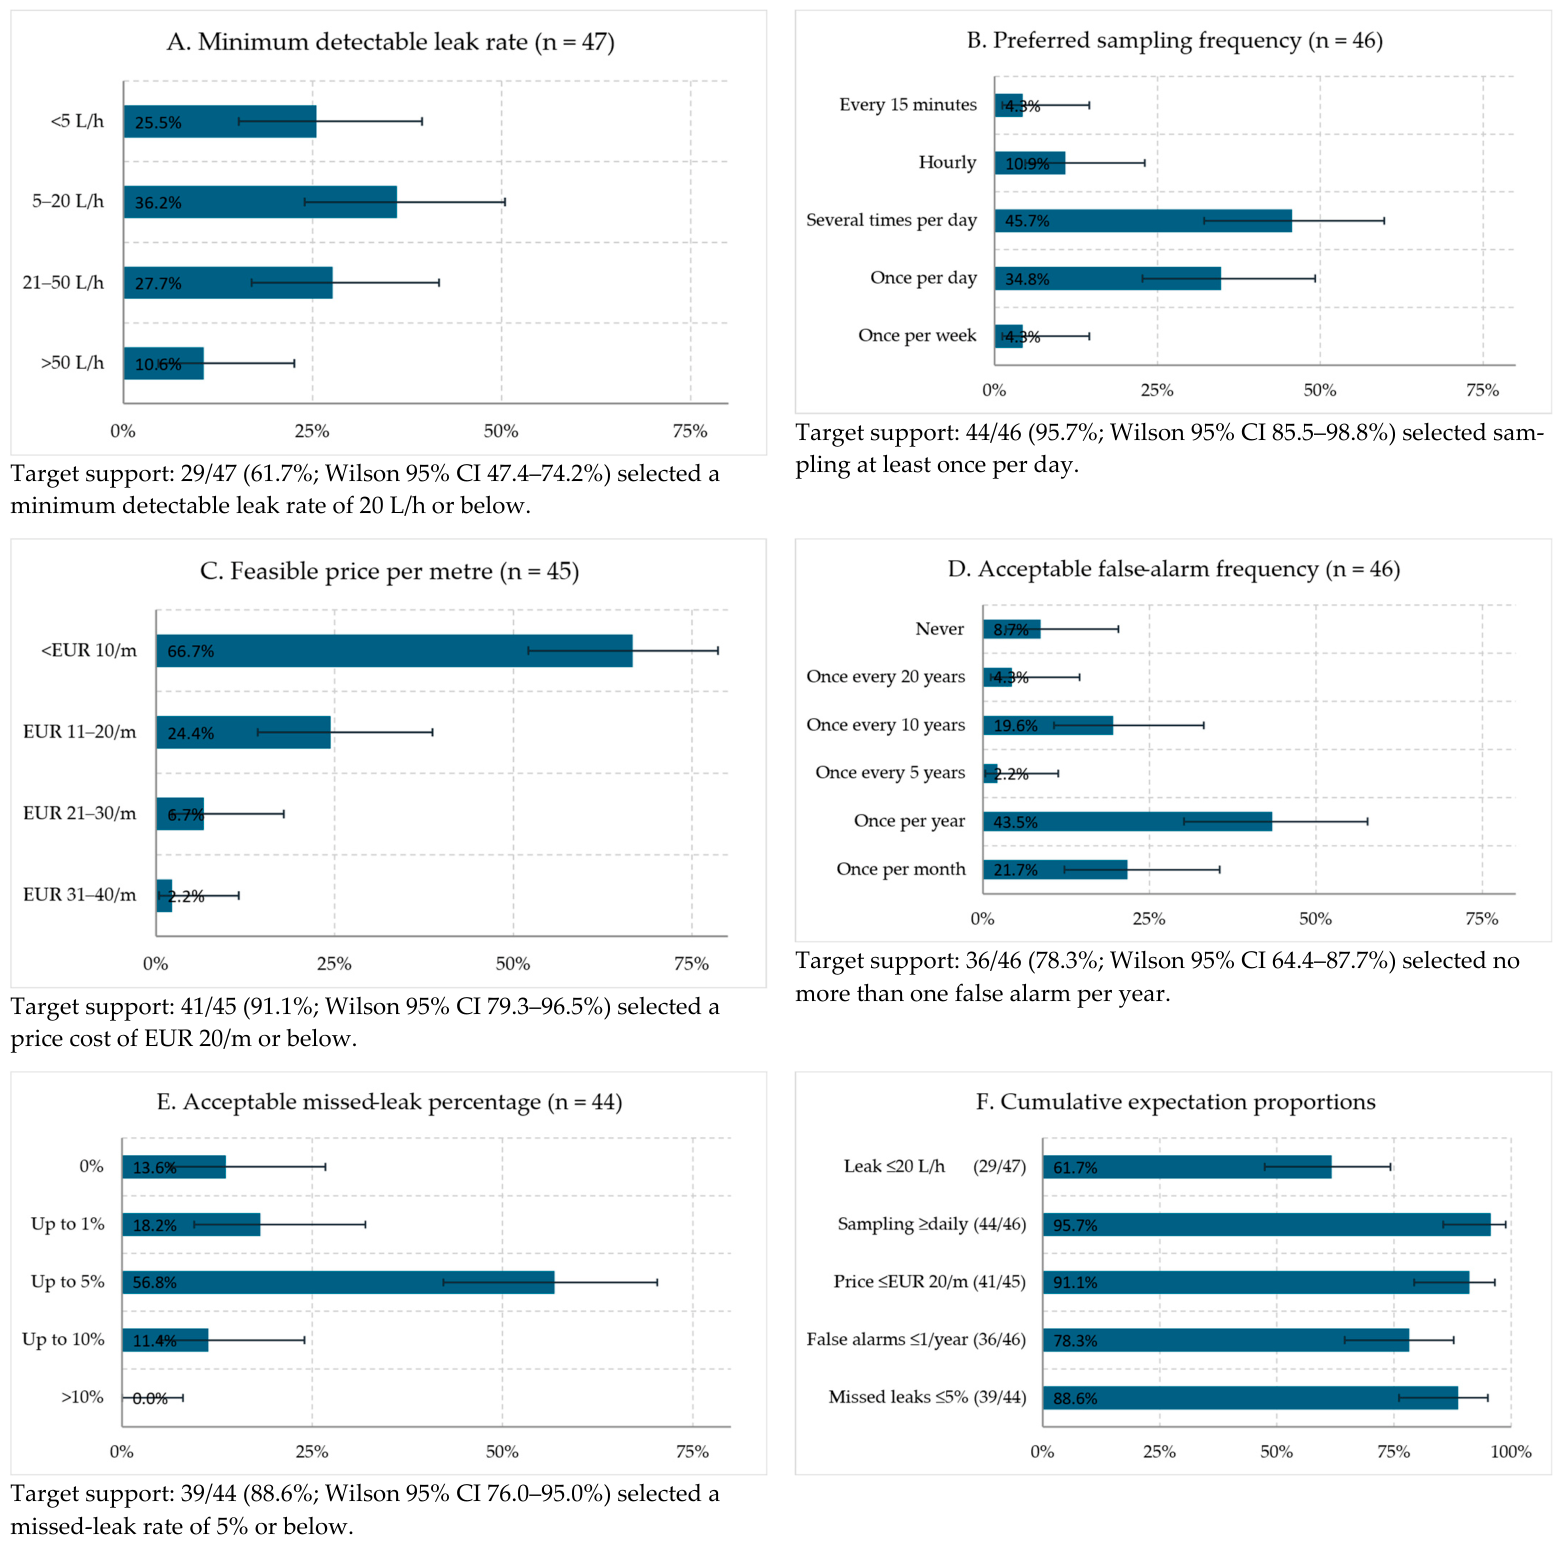
Figure 6 presents the complete valid-response distributions for the five quantitative expectation items and their cumulative proportions.
Figure 6.
Distributions of the five survey items used to derive provisional performance and price requirements: (A) minimum detectable leak rate (valid n = 47); (B) preferred sampling frequency (n = 46); (C) feasible price per metre (n = 45); (D) acceptable false-alarm frequency (n = 46); and (E) acceptable missed-leak percentage (n = 44). Bars show observed proportions and capped whiskers show two-sided Wilson 95% confidence intervals for the individual proportions. Panel (F) summarises the corresponding cumulative expectation proportions, including responses in more demanding categories; it does not show acceptance of a system operating exactly at each boundary.
For leak sensitivity, 29/47 respondents selected 20 L/h or below (61.7%, 95% CI 47.4–74.2%), and 42/47 selected 50 L/h or below (89.4%, 77.4–95.4%). These nested proportions motivated the preferred ≤20 L/h target and the initial ≤50 L/h benchmark; neither proportion establishes acceptance of performance exactly at its boundary.
At least daily sampling was selected by 44/46 respondents (95.7%, 95% CI 85.5–98.8%); 28/46 selected more than one measurement per day (60.9%, 46.5–73.6%). This preference informs the duty cycle through Equation (1), although local acquisition and radio transmission can be decoupled. A daily measurement interval does not by itself imply detection within 24 h.
Price per metre had 45 quantifiable responses: 30 selected <EUR 10/m, 11 selected EUR 11–20/m, 3 selected EUR 21–30/m, and 1 selected EUR 31–40/m. Thus, 41/45 selected ≤EUR 20/m (91.1%, 95% CI 79.3–96.5%); 30/45 selected <EUR 10/m (66.7%, 52.1–78.6%). The questionnaire did not define an installed- or lifecycle-cost boundary. For false alarms, 36/46 specified no more than one per year (78.3%, 64.4–87.7%), without a stated monitoring-length denominator. For missed leaks, 39/44 specified ≤5% (88.6%, 76.0–95.0%); this included 14/44 specifying ≤1% (31.8%, 20.0–46.6%). Figure 6 consolidates the distributions and cumulative expectation proportions. The differing denominators reflect missing or non-quantifiable answers and are retained rather than replaced by the total sample size.
3.4. Exploratory Subgroup Analyses
No experience-group association was detected for any of the six ordinal outcomes after Holm adjustment (Table 1). The largest observed experience-group effect was for sampling frequency (H = 5.47, adjusted p = 0.841, η2H = 0.060), but the study was not powered to rule out practically relevant subgroup differences. Fisher’s exact tests likewise found no adjusted association between experience (≤10 versus ≥11 years) and any predefined barrier (all adjusted p ≥ 0.438; complete-case n = 49). The largest unadjusted contrast was for data reliability, selected by 14/24 more-experienced and 8/25 early-career respondents (odds ratio 2.98, signed φ = 0.265, raw p = 0.088, adjusted p = 0.438). These findings indicate no detected association after adjustment and do not establish equivalence. Role, utility-size, and material-portfolio comparisons were not defensible because the first was sparse and the latter two variables were not collected.
Table 1.
Exploratory Kruskal–Wallis comparisons across four respondent-experience groups.
3.5. Survey-Derived System Requirements
The survey findings were translated into two groups of provisional requirements. The first group, summarised in Table 2, contains measurable performance and economic targets that can be evaluated in later laboratory or field studies. The second group, summarised in Table 3, contains operational and contextual constraints that should guide later architecture decisions but cannot be reduced to a single survey-derived threshold.
Table 2.
Provisional system requirements derived from the expert questionnaire. Cumulative expectation proportions include stricter response categories.
Table 3.
Operational and contextual constraints derived from the expert questionnaire. Barrier denominators are 50 substantive responses; operational implications are unverified author interpretations.
Requirement derivation used two author-defined interpretation levels: a cumulative expectation proportion above 50% was classified as majority support within the responding sample, and a proportion of at least 80% as broad support within that sample. These labels are descriptive decision rules, not inferential cut-offs or direct endorsements of performance at a boundary. Classification used the observed point proportion; two-sided Wilson 95% confidence intervals describe binomial-model precision and were not used to reclassify requirements. Because the sample was purposive, the intervals do not establish population-representative coverage or account for selection and non-response bias. Each requirement is assigned a unique identifier and linked to the exact response counts. The proposed shall/should statements are provisional author translations that require further stakeholder confirmation, including the installed-cost boundary and the monitoring unit for false alarms. Because no hardware or system performance was evaluated experimentally, every requirement remains unverified. Proposed verification routes are discussed in Section 4.2 and Table 4.
Table 4.
Proposed verification routes for future work. These recommendations are not experimental results of this study.
4. Discussion
4.1. Academic Contribution and Interpretation
The study’s novelty lies in the integration and traceability of evidence, not in using a questionnaire or inventing a new moisture sensor. It links a plastic-pipe-specific monitoring gap to an explicit system boundary, quantifies practitioner expectations and uncertainty, explores experience-related heterogeneity, and identifies engineering dependencies and proposed verification conditions. Existing standards provide general water-loss and requirements-engineering processes [2,34], while the reviewed prototypes investigate particular sensing or communication functions [7,8,19,20,21,24,26,27,28,29,30,31,32]. This study contributes a utility-informed requirement baseline with explicit interpretation rules for distributed soil-wetting surveillance. The individual thresholds are not claimed as new sensing capabilities or as universally accepted requirements.
4.2. Analytical Trade-Offs and Proposed Verifications
Whether the requested sampling frequency can be sustained depends on measured node energy demand and the available energy supply. Recent buried-sensor studies demonstrate operation under particular hardware and communication conditions [26,27,28,29,32]; they do not validate this architecture or its sampling/transmission schedule. Equation (1) should be populated with measured event energies, including retransmissions and sensor warm-up. Energy autonomy additionally depends on storage capacity, cold-temperature derating, conversion losses, peak demand, and seasonal or intermittent energy supply; an average daily demand alone cannot establish autonomy.
The ≤20 L/h sensitivity target cannot be judged independently of sensor spacing and wetting-front travel. Equation (2) separates nearest-sensor geometry and sampling/persistence delays from the unknown wetting response; the mean wetting time and the probability of obtaining a detectable signal must be estimated experimentally for declared soil, leak, pressure, depth, and antecedent conditions. A defensible design process should select spacing from response-time and detection-probability surfaces, not assume that a wetter sensor necessarily means a nearer or larger leak.
Future spacing studies could combine measured wetting responses with a parameterised soil-water transport model, such as a Richards-equation implementation [36]. This would require soil hydraulic properties, initial moisture, leak geometry, and boundary conditions, followed by comparison with independent observations. A simulated wetting plume alone would not establish the sensitivity or false-alarm performance of a sensing system.
The cost and reliability targets require more than a prototype bill of materials or a short demonstration. Equation (3) defines an installed-cost boundary covering sensors, cable, protection, shared nodes/gateways, and installation/commissioning; later lifecycle analysis must add operation, maintenance, and replacement over a stated horizon. This boundary was not specified in Q13 and must be confirmed with utilities. Similarly, the monitoring length and alarm-aggregation rule for ≤1 false alarm/year require agreement before the value is used as a per-segment criterion. Reliability trials require prespecified qualifying-event and alert definitions, representative hydrological seasons, and independent leak trials. The one-sided bounds in Section 2.6 translate these assumptions into validation-planning quantities.
Feasibility therefore remains unverified in Table 2. The present evidence supports relevance and test planning, not readiness for procurement. Deployment is most credible during new installation, pipe renewal, or major rehabilitation, when trench access reduces marginal installation cost and permits controlled placement. A retrofit claim for all legacy networks would not be supported by the survey or the technical evidence. Table 4 proposes verification routes for future work; these routes are author recommendations and are not results of experimental testing in this study.
Candidate mitigation logic should be tested against environmental confounders: a local rise relative to a temporal baseline and neighbouring or reference locations could be required to persist before an alert, with rainfall and groundwater information used to interpret spatially widespread wetting. Hysteresis could limit repeated alerts near a threshold, while sensor-health and communication flags could distinguish missing or implausible data from a leak indication. These are proposed options, not a selected algorithm. Their effect on both false-alarm and missed-leak rates must be tested in wet/dry, rainfall, groundwater, and drift scenarios.
4.3. Complementary Role in Utility Workflows
Distributed soil-moisture sensing should be positioned as continuous early warning for a bounded pipe segment. An alert would direct follow-up inspection; established acoustic, tracer, hydraulic, or excavation methods would still confirm and localise the leak. This division of labour matches the survey’s moderate promise rating and the dominance of acoustic and consumption-based methods. The present study does not prescribe an algorithm; it requires only that a future detection method should be evaluated against the candidate false-alarm and missed-leak criteria after their definitions are confirmed with utilities, and should provide sufficient evidence for utility interpretation.
4.4. Transferability and Research Agenda
Leak-rate sensitivity, response frequency, installed cost, false-alarm burden, missed-detection rate, maintainability, and workflow integration are application-level benchmarks that may inform assessment of alternative distributed sensing technologies, subject to renewed stakeholder confirmation and technology-specific verification. Sensor calibration and signal conditioning are technology-specific, whereas wetting-front dynamics and rainfall/groundwater interference arise from the soil-moisture monitoring concept more generally. Transfer therefore requires retaining the stakeholder-level outcome while adapting the sensing-specific verification conditions.
The immediate research sequence is: (i) comparative evaluation and soil-specific characterisation of candidate sensor technologies, including sensor-to-sensor variability and drift; (ii) factorial soil-box leak tests across soil, depth, pressure, antecedent moisture, and spacing; (iii) measured energy, underground-link, encapsulation, and installed-cost tests; (iv) blinded outdoor trials including rainfall and groundwater confounders; and (v) multi-season utility pilots sized to estimate false-alarm and miss rates. Each stage should update the requirement status and preserve traceability.
4.5. Boundary Conditions, Limitations and External Validity
This study provides evidence of practitioner expectations and user requirements and consequently translates them into documented engineering requirements. The following assessment elaborates further on the boundary conditions and limitations of the study.
4.5.1. Requirements Evidence and System Validation
The sensitivity, sampling, cost, and reliability targets provide design objectives and priorities for technical evaluation. Laboratory and field testing of an implemented system lies beyond the scope of this requirements study. Such testing is needed to determine which targets can be achieved together and under which operating conditions. For example, the moisture response associated with a leak rate of ≤20 L/h depends on soil properties, antecedent moisture, hydraulic conditions, installation geometry, sensor response, and the detection rule. Water-flow paths and environmental changes such as rainfall or groundwater variation also influence detectability. Evidence from adjacent applications supports investigating the approach, while the soil-box tests, blinded outdoor trials, and multi-season utility pilots outlined in Section 4.2 and Section 4.4 provide a route to assess detection probability, response time, localisation accuracy, and long-term drift against the elicited requirements.
4.5.2. Application of the Engineering Relationships
Equations (1)–(3) express energy accounting, sensor geometry and conditional timing, and installed-cost allocation, with their derivations and assumptions stated in Appendix A. Their role is to identify the quantities and trade-offs that a design assessment must consider. Applying them numerically requires implementation-specific inputs and examination of the stated assumptions. For Equation (1), this includes measured activity energies, event counts, and complete allocation of loads and losses. Autonomy assessment additionally requires storage capacity, supply variability, and peak demand to be considered alongside average daily energy demand. Equation (2) describes axial separation and mean observation delay conditional on a detectable wetting signal reaching a sensor. Soil-water transport, signal detectability, and leaks that do not produce a qualifying signal require separate assessment; the relationship does not assign a detection delay to those leaks. Equation (3) uses component quantities, prices, labour, and shared-equipment allocations within a declared installed-cost boundary. Lifecycle costs can be included through an extended cost model.
4.5.3. Recruitment and Transferability
The purposive/convenience recruitment strategy targeted practitioners at 90 water-supply companies in Thurgau, Zurich, and Aargau through a German-language questionnaire. The 55 submissions and 52 consented records correspond to 61.1% and 57.8% of invitations, respectively. These ratios describe participation relative to outreach; because anonymous responses were not linked to invited organisations, they should not be interpreted as verified proportions of distinct utilities represented. The same anonymity prevents assessment of possible within-utility dependence. Self-selection and non-response may affect the perspectives represented, although their extent is not quantifiable from the available records. Utility size, network length, pipe-material share, and respondent-level region were not collected, so their influence and the correspondence with a wider utility population could not be examined. With 48 utility operators/employees and four respondents in other roles, the evidence chiefly reflects operational staff. The findings are consequently relevant as requirements evidence from this practitioner group; transfer to other utility types, roles, or geographic settings calls for comparison with their local conditions and priorities.
4.5.4. Concept Familiarity and Questionnaire Interpretation
The expertise relevant to this survey is having experience with water-supply operations, existing leak-detection methods, and infrastructure constraints. Such experience provides a basis for expressing desired sensitivity, affordability, and acceptable alarm burden without requiring prior use of the proposed monitoring approach. In Q8, 48/52 respondents reported no prior awareness or use of the approach; because the item combined awareness and experience, hands-on familiarity cannot be distinguished separately. The responses are therefore interpreted as expectations informed by operational practice and the questionnaire’s concept description. Q11–Q12 explicitly referred to soil-moisture monitoring, and the price and alarm questions followed within that context. The possible influence of this framing, question order, and offered categories was not separately assessed. Preferred sampling frequency expresses an operational preference; the acquisition rate needed for reliable detection must also account for the sensing and decision process. Demonstrations and discussion of performance, cost, and maintenance trade-offs would help translate these expectations into acceptance criteria for a particular implementation.
Item-specific denominators of 44–47 for the five main quantitative items make the extent of missing or non-quantifiable responses explicit. The analysis describes valid answers without assuming that excluded answers would follow the same distribution; systematic differences remain possible. Documented free-text mappings and recoding rules support auditability, although independent double-coding was not performed.
4.5.5. Statistical Precision and Exploratory Comparisons
The Wilson intervals make the precision of each estimated category or cumulative proportion explicit under a binomial model with independent responses and a common probability. For the ≤20 L/h threshold, the observed proportion is 29/47 (61.7%), with a 95% interval of 47.4–74.2%. Classification as majority support describes the observed sample under the stated derivation rule; the model-based interval includes proportions below 50%. Because recruitment was non-random, these model-based intervals are not measures of representativeness and do not account for selection bias, non-response, or possible clustering. The intervals in Figure 5 and Figure 6 provide marginal coverage for separately estimated proportions, rather than simultaneous coverage or pairwise significance tests. Interval width describes uncertainty in a proportion, whereas the distribution of answers across categories describes variation in practitioners’ expectations.
The experience-group comparisons provide an exploratory view of variation within the sample and complement the descriptive analysis. The four experience groups contained 8, 17, 14, and 12 respondents before item-specific exclusions. These group sizes, ordinal response categories, tied ranks, and missing answers limit sensitivity; the Kruskal–Wallis chi-square approximation can also be less accurate with small samples and ties. Non-significant adjusted results indicate that differences were not detected by these analyses; they do not demonstrate equivalence or exclude practically relevant differences. Requirement derivation used the documented response patterns and decision rules independently of these tests.
4.5.6. Interpretation and Confirmation of Requirements
The >50% majority and ≥80% broad-support levels make the authors’ interpretation of response patterns explicit and reproducible. They are descriptive decision rules rather than formal consensus criteria. Cumulative proportions include respondents selecting more demanding categories and describe the distribution of expectations; acceptance of performance exactly at a proposed boundary should therefore be confirmed with utilities. The requirements in Table 2 and Table 3 provide evidence-informed design inputs whose operational definitions can be refined with utilities. In particular, Q13 did not specify an installed- or lifecycle-cost boundary, Q14 did not define a monitored length or alert-aggregation unit, and missed-leak tolerance requires agreed qualifying events and an observation window. Expected pipe service life provides infrastructure context rather than a direct sensor-lifetime requirement. Joint trade-offs among sensitivity, sampling, energy demand, cost, and reliability were not elicited and should be considered when agreeing acceptance criteria for an implementation.
5. Conclusions
This study provides a traceable stakeholder-requirements baseline for distributed soil-moisture sensing as a complementary early-warning method for leaks near plastic water pipes. The item-specific analysis shows that 29/47 respondents expected detection at ≤20 L/h, 44/46 preferred at least daily sampling, 41/45 selected a price ≤EUR 20/m, 36/46 specified false-alarm tolerance ≤1/year, and 39/44 specified missed-leak tolerance ≤5%. These cumulative proportions include stricter categories and inform provisional requirements; they do not establish that performance exactly at each boundary would satisfy every counted respondent. The expected ≥51-year pipe service life provides infrastructure context and is not a required sensor lifetime. Wilson intervals expose limited precision under a binomial model. The exploratory subgroup analyses were not designed to establish equivalence and leave potentially important experience-related differences unresolved. The contribution is the connection between practitioner evidence, a monitoring concept independent of a selected soil-moisture transducer, measurable application requirements, and engineering relationships and verification planning. No particular soil-moisture sensor or detection algorithm is selected and none of the thresholds is demonstrated performance. The next step is stakeholder confirmation and staged laboratory and field validation addressing sensitivity, spacing and response time, energy and communication, installed cost, hydrological false alarms, missed detections, drift, and maintainability.
Supplementary Materials
The following supporting information can be downloaded at: https://www.mdpi.com/article/10.3390/app162110697/s1, Spreadsheet S1: original and translated questionnaire material, anonymised response-level data, recoding dictionary, processed analysis dataset, descriptive distributions, Wilson confidence intervals, exploratory subgroup tests, and the figures used in this manuscript.
Author Contributions
Conceptualisation, B.J.M., N.M. and M.L.M.; methodology, B.J.M.; formal analysis, B.J.M.; investigation, B.J.M.; writing—original draft preparation, B.J.M.; writing—review and editing, N.M. and M.L.M.; supervision, N.M. and M.L.M. All authors have read and agreed to the published version of the manuscript.
Funding
This research received no external funding.
Institutional Review Board Statement
The study was conducted in accordance with the Declaration of Helsinki and was reviewed and approved by the Ethical Review Board of Eindhoven University of Technology (TU/e) (ERB-470, 28 October 2025). Ethical approval was obtained prior to the commencement of data collection.
Informed Consent Statement
Informed consent was obtained from all respondents whose data were included in the analysis and public Supplementary Materials. Participants were informed about the purpose of the study, the anonymous treatment of their responses, and the use of aggregated results for research and publication. Consent was provided electronically through the online survey.
Data Availability Statement
The data presented in this study are available in the article and Supplementary Materials. Further inquiries can be directed to the corresponding author.
Acknowledgments
The authors thank the participating experts from the water infrastructure sector for providing survey responses and feedback relevant to the practical framing of this work.
Conflicts of Interest
The authors declare no conflicts of interest.
Appendix A. Derivation and Assumptions of the Engineering Relationships
The relationships in Section 2.6 organise engineering inputs for future assessment. Their derivation does not establish that a particular soil-moisture monitoring system meets the elicited requirements.
Appendix A.1. Energy Accounting
At a declared electrical boundary, daily demand is the integral of power over Tday = 86,400 s. Write power as a constant sleep baseline plus incremental contributions from active operations. Integrating the baseline gives Tday Psleep; integrating each active contribution gives its event energy. For representative event energies and a complete allocation of all loads:
When each of the ns sensors has the same incremental sensing energy, Σj Esensor,j = ns Esensor, yielding Equation (A1). The individual event energies include their allocated warm-up, conversion, and shared overhead. Baseline consumption must not be counted again in these incremental terms. Receiving, retries, and other operations must be included explicitly or within the defined event terms. Equal representative event energies are a simplification; variable operations can instead be summed individually. Every term is energy accumulated during one day. At fixed event energies and transmission schedule, increasing sampling from once to 24 times per day adds 23 Ecycle, where Ecycle = Ewake + Σj Esensor,j + Eprocess; it does not multiply the complete daily demand by 24. Measured demand, storage, and time-varying supply are still required to assess autonomy.
Appendix A.2. Geometry and Conditional Observation Delay
For a leak at axial position x between sensors at 0 and s, the nearest axial distance is min(x, s − x). Its maximum over 0 ≤ x ≤ s is s/2, attained at the midpoint. This geometric result assumes coverage at the monitored segment ends and says nothing about the actual water-flow path or whether a sensor receives a detectable signal.
Conditional on a detectable signal becoming available and remaining sufficient for the decision rule, let U be the time until the next regular observation. If signal availability has uniform phase within a sampling interval ∆t, U is uniform on [0, ∆t) and:
Adding the conditional mean time to signal availability, twet,avg, and a fixed persistence delay tpersist after the first qualifying observation gives Equation (A2). For a rule requiring k consecutive qualifying samples without resets, tpersist = (k − 1)∆t. Other decision rules require their own delay accounting. No independence between the wetting time and other delays is needed for addition of their means, but the stated sampling-phase distribution and persistence assumptions must hold. Missed leaks are not assigned a finite latency by this relationship. Detection probability and utility-received alert delay therefore require separate assessment.
Appendix A.3. Installed-Cost Normalisation
Define Ctotal as the sum of sensor and protection costs, cable cost, allocated shared equipment, and installation/commissioning costs for a monitored length L > 0. The actual cable quantity is Lcable, so its cost is Lcable ccable,m. The finite installed sensor count is Nsens; it is not replaced by an approximation based only on spacing. By definition:
Substituting the stated components of Ctotal gives Equation (A3). The numerator is in EUR and the denominator is monitored metres. Component quantities, unit prices, allocation of shared equipment, and labour must come from a defined implementation. This is an accounting boundary, not a calibrated cost prediction. Q13 did not define installed-cost scope, which therefore requires stakeholder confirmation. Operation, maintenance, and replacement remain outside this boundary unless added through a separate lifecycle analysis.
References
- Liemberger, R.; Wyatt, A. Quantifying the global non-revenue water problem. Water Supply 2019, 19, 831–837. [Google Scholar] [CrossRef] [Scilit]
- ISO 24528:2021; Service Activities Relating to Drinking Water Supply, Wastewater and Stormwater Systems—Guideline for a Water Loss Investigation of Drinking Water Distribution Networks. International Organization for Standardization: Geneva, Switzerland, 2021.
- Farah, E.; Shahrour, I. Water Leak Detection: A Comprehensive Review of Methods, Challenges, and Future Directions. Water 2024, 16, 2975. [Google Scholar] [CrossRef] [Scilit]
- Qi, R.; Cao, M.; Yntema, D.R. Recent Developments of Subsurface Small-Leak Detection Techniques in Water Distribution Networks: A Review. IEEE Robot. Autom. Mag. 2024, 31, 108–118. [Google Scholar] [CrossRef] [Scilit]
- Brunone, B.; Maietta, F.; Capponi, C.; Keramat, A.; Meniconi, S. A review of physical experiments for leak detection in water pipes through transient tests for addressing future research. J. Hydraul. Res. 2022, 60, 894–906. [Google Scholar] [CrossRef] [Scilit]
- Fan, H.; Tariq, S.; Zayed, T. Acoustic leak detection approaches for water pipelines. Autom. Constr. 2022, 138, 104226. [Google Scholar] [CrossRef] [Scilit]
- Aslam, H.; Mortula, M.M.; Yehia, S.; Ali, T.; Kaur, M. Evaluation of the Factors Impacting the Water Pipe Leak Detection Ability of GPR, Infrared Cameras, and Spectrometers under Controlled Conditions. Appl. Sci. 2022, 12, 1683. [Google Scholar] [CrossRef] [Scilit]
- Islam, M.R.; Azam, S.; Shanmugam, B.; Mathur, D. Leak Detection and Localization in Underground Water Supply System Using Thermal Imaging and Geophone Signals through Machine Learning. Intell. Syst. Appl. 2024, 23, 200404. [Google Scholar] [CrossRef] [Scilit]
- Hunaidi, O.; Chu, W.T. Acoustical characteristics of leak signals in plastic water distribution pipes. Appl. Acoust. 1999, 58, 235–254. [Google Scholar] [CrossRef] [Scilit]
- Gao, Y.; Brennan, M.J.; Joseph, P.F.; Muggleton, J.M.; Hunaidi, O. On the selection of acoustic/vibration sensors for leak detection in plastic water pipes. J. Sound Vib. 2005, 283, 927–941. [Google Scholar] [CrossRef] [Scilit]
- Muggleton, J.M.; Brennan, M.J. Leak noise propagation and attenuation in submerged plastic water pipes. J. Sound Vib. 2004, 278, 527–537. [Google Scholar] [CrossRef] [Scilit]
- Hu, Z.; Tariq, S.; Zayed, T. A Comprehensive Review of Acoustic Based Leak Localization Method in Pressurized Pipelines. Mech. Syst. Signal Process. 2021, 161, 107994. [Google Scholar] [CrossRef] [Scilit]
- Schweizerischer Verein des Gas- und Wasserfaches (SVGW). W4 D Richtlinie Für Wasserverteilung: Planung, Projektierung, Bau, Prüfung Sowie Betrieb Und Instandhaltung Der Trinkwasserverteilung Ausserhalb Von Gebäuden; Teil 5, Themenblatt 4-Leckortung; SVGW: Zürich, Switzerland, 2022. [Google Scholar]
- Hamamed, N.; Mechri, C.; Mhammedi, T.; Yaakoubi, N.; El Guerjouma, R.; Bouaziz, S.; Haddar, M. Comparative Study of Leak Detection in PVC Water Pipes Using Ceramic, Polymer, and Surface Acoustic Wave Sensors. Sensors 2023, 23, 7717. [Google Scholar] [CrossRef] [Scilit] [PubMed]
- Barfuss, S.L. Water Main Break Rates in the USA and Canada: A Comprehensive Study; Utah State University: Logan, UT, USA, 2023; Report 682; Available online: https://digitalcommons.usu.edu/water_rep/682/ (accessed on 28 July 2026).
- Robinson, D.A.; Campbell, C.S.; Hopmans, J.W.; Hornbuckle, B.K.; Jones, S.B.; Knight, R.; Ogden, F.; Selker, J.; Wendroth, O. Soil Moisture Measurement for Ecological and Hydrological Watershed-Scale Observatories: A Review. Vadose Zone J. 2008, 7, 358–389. [Google Scholar] [CrossRef] [Scilit]
- Vereecken, H.; Huisman, J.A.; Pachepsky, Y.; Montzka, C.; van der Kruk, J.; Bogena, H.; Weihermüller, L.; Herbst, M.; Martinez, G.; Vanderborght, J. On the spatio-temporal dynamics of soil moisture at the field scale. J. Hydrol. 2014, 516, 76–96. [Google Scholar] [CrossRef] [Scilit]
- Beven, K.; Germann, P. Macropores and water flow in soils revisited. Water Resour. Res. 2013, 49, 3071–3092. [Google Scholar] [CrossRef] [Scilit]
- Murtikusuma, O.C.; Primawan, A.B.; Sumarno, L. Underground Water Pipe Leak Detection System Based on Soil Moisture Values with Fuzzy Logic. Int. J. Eng. Res. Appl. 2024, 14, 67–71. [Google Scholar] [CrossRef] [Scilit]
- Ramezaninia, M.; Shams, M.; Zoofaghari, M. Machine Learning-Driven Microwave Imaging for Soil Moisture Estimation near Leaky Pipe. Electron. Lett. 2024, 60, e70073. [Google Scholar] [CrossRef] [Scilit]
- Carnevale Castillo, D.A.; Carminati, M. A Pipe-Embeddable Impedance Sensor for Monitoring Water Leaks in Distribution Networks: Design and Validation. Sensors 2023, 23, 3117. [Google Scholar] [CrossRef] [Scilit] [PubMed]
- Abdelmoneim, A.A.; Al Kalaany, C.M.; Khadra, R.; Derardja, B.; Dragonetti, G. Calibration of Low-Cost Capacitive Soil Moisture Sensors for Irrigation Management Applications. Sensors 2025, 25, 343. [Google Scholar] [CrossRef] [Scilit] [PubMed]
- Bogena, H.R.; Huisman, J.A.; Schilling, B.; Weuthen, A.; Vereecken, H. Effective Calibration of Low-Cost Soil Water Content Sensors. Sensors 2017, 17, 208. [Google Scholar] [CrossRef] [Scilit] [PubMed]
- Bertocco, M.; Parrino, S.; Peruzzi, G.; Pozzebon, A. Estimating Volumetric Water Content in Soil for IoUT Contexts by Exploiting RSSI-Based Augmented Sensors via Machine Learning. Sensors 2023, 23, 2033. [Google Scholar] [CrossRef] [Scilit] [PubMed]
- van der Velde, R.; Benninga, H.-J.F.; Retsios, B.; Vermunt, P.C.; Salama, M.S. Twelve Years of Profile Soil Moisture and Temperature Measurements in Twente, the Netherlands. Earth Syst. Sci. Data 2023, 15, 1889–1910. [Google Scholar] [CrossRef] [Scilit]
- Sadeghioon, A.M.; Metje, N.; Chapman, D.N.; Anthony, C.J. SmartPipes: Smart Wireless Sensor Networks for Leak Detection in Water Pipelines. J. Sens. Actuator Netw. 2014, 3, 64–78. [Google Scholar] [CrossRef] [Scilit]
- Boebel, M.; Frei, F.; Blumensaat, F.; Ebi, C.; Meli, M.L.; Rust, A. Batteryless Sensor Devices for Underground Infrastructure—A Long-Term Experiment on Urban Water Pipes. J. Low Power Electron. Appl. 2023, 13, 31. [Google Scholar] [CrossRef] [Scilit]
- Levintal, E.; Ganot, Y.; Taylor, G.; Freer-Smith, P.; Suvocarev, K.; Dahlke, H.E. An Underground, Wireless, Open-Source, Low-Cost System for Monitoring Oxygen, Temperature, and Soil Moisture. SOIL 2022, 8, 85–97. [Google Scholar] [CrossRef] [Scilit]
- Balivada, S.; Grant, G.; Zhang, X.; Ghosh, M.; Guha, S.; Matamala, R. A Wireless Underground Sensor Network Field Pilot for Agriculture and Ecology: Soil Moisture Mapping Using Signal Attenuation. Sensors 2022, 22, 3913. [Google Scholar] [CrossRef] [Scilit] [PubMed]
- Cariou, C.; Moiroux-Arvis, L.; Pinet, F.; Chanet, J.-P. Internet of Underground Things in Agriculture 4.0: Challenges, Applications and Perspectives. Sensors 2023, 23, 4058. [Google Scholar] [CrossRef] [Scilit] [PubMed]
- Cotrim, R.; Assis, F.; dos Santos Brito, A.; Peixouto, Y.S.; Peixouto, L.S. Multi-Hop LoRa-Based Underground Network for Monitoring Soil Moisture in Agriculture. Comput. Electron. Agric. 2024, 227, 109592. [Google Scholar] [CrossRef] [Scilit]
- Hossain, F.F.; Messenger, R.; Captain, G.L.; Ekin, S.; Jacob, J.D.; Taghvaeian, S.; O’Hara, J.F. Soil Moisture Monitoring through UAS-Assisted Internet of Things LoRaWAN Wireless Underground Sensors. IEEE Access 2022, 10, 102107–102118. [Google Scholar] [CrossRef] [Scilit]
- Pádua, L.; Marques, P.; Dinis, L.-T.; Moutinho-Pereira, J.; Sousa, J.J.; Morais, R.; Peres, E. Detection of Leak Areas in Vineyard Irrigation Systems Using UAV-Based Data. Drones 2024, 8, 187. [Google Scholar] [CrossRef] [Scilit]
- ISO/IEC/IEEE 29148:2018; Systems and Software Engineering—Life Cycle Processes—Requirements Engineering. International Organization for Standardization: Geneva, Switzerland, 2018.
- Kelley, K.; Clark, B.; Brown, V.; Sitzia, J. Good practice in the conduct and reporting of survey research. Int. J. Qual. Health Care 2003, 15, 261–266. [Google Scholar] [CrossRef] [Scilit] [PubMed]
- Šimůnek, J.; van Genuchten, M.T.; Šejna, M. The HYDRUS Software Package for Simulating the Two- and Three-Dimensional Movement of Water, Heat, and Multiple Solutes in Variably-Saturated Porous Media: Technical Manual, Version 3.03; PC-Progress: Prague, Czech Republic, 2020; Available online: https://www.pc-progress.com/downloads/Pgm_Hydrus3D3/HYDRUS3D_Technical_Manual_v3.pdf (accessed on 17 September 2026).


Disclaimer/Publisher’s Note: The statements, opinions and data contained in all publications are solely those of the individual author(s) and contributor(s) and not of MDPI and/or the editor(s). MDPI and/or the editor(s) disclaim responsibility for any injury to people or property resulting from any ideas, methods, instructions or products referred to in the content. |
© 2026 by the authors. Licensee MDPI, Basel, Switzerland. This article is an open access article distributed under the terms and conditions of the Creative Commons Attribution (CC BY) license.