


Abstract
This study explores the effect of direct current (DC) electrical treatment on the effective permeability of porous media. The whole treatment program lasted 6430 min (107 h). Heavy oil and brine-saturated cores were subjected to a series of four treatments using different voltages (40 V, 10 V, 5 V, and 35 V) using the same Berea sandstone samples for all tests. There were noticeable changes in effective permeability at each step. Effective permeability decreased the most during the first treatment at 40 V. A decrease in voltage to 10 V allowed effective permeability to increase to a value closer to the untreated state. Effective permeability continued to increase to the highest value of the entire test at the 5 V treatment. The final treatment was at 35 V. Even though the data provide evidence of changes in effective permeability at different voltages, it would be unwise to draw conclusions based on rank-order voltage tests. For one thing, all samples had been exposed to previous treatments, and therefore it is difficult to discern if the observed changes in permeability are due to an individual treatment. The conditioning of the samples could also explain the changes. The data provide evidence of permeability changes over a fixed sequence of treatments; the data do not show the ranking of voltages, nor does it show the optimal voltage. There are some other things we need to be clear about regarding boundaries. Because current versus time data were not broken down by phase, energy consumption and efficiency figures could not be calculated. Pore-scale processes were not observed, and field-scale oil recovery was not measured. As such, the results are controlled laboratory observations, a proof of concept rather than a production-ready outcome. The goal of the work is to monitor the change in permeability for the 40 → 10 → 5 → 35 V sequence for a duration of 6430 min. Of all the methods, EEOR is the one that has not been deeply studied and applied, which indicates the presence of considerable unexplored potential within this promising approach. Field applications of electrical stimulation have been reported in several regions. Although numerous publications and studies have shed light on electrostimulation enhanced oil recovery (EOR), the field remains ripe for further exploration, owing to its inherent complexity and multidisciplinary nature. Many aspects of the technology remain far from fully understood. For example, the precise mechanisms of how varying types and degrees of electrical stimulation impact different types of reservoir rocks and fluid characteristics are not yet fully delineated. This proof-of-concept study documents effective permeability measurements during a fixed sequence of constant DC voltage phases. It does not separate voltage from treatment history, determine an energy optimum, or establish oil recovery performance. It is important to understand how reservoir heterogeneity affects the effectiveness of electrostimulation. In addition, optimizing the energy usage of the process to maximize oil recovery while minimizing environmental and economic costs is a vast area for potential study. Moreover, the development and refinement of real-time data analytics and control systems, like the proposed control panel, to better manage and adapt electrostimulation processes based on reservoir responses is another promising research direction. Electrostimulation is a promising area of EOR technology, and there is still much to explore. Further research will help us better understand the underlying mechanisms and develop this technology for more effective oil recovery.
1. Introduction
Extracting heavy and viscous crude oil is difficult, often leaving up to 90% of the known resource trapped. This is a global issue, with enormous heavy oil reserves and countless other hydrocarbons left behind in hard-to-access reservoirs. The problem is not that we do not know the oil is there, but that we do not yet have a practical and economical way to recover it. In addition, near-wellbore damage mechanisms such as paraffin deposition and incursion of liquids and solids reduce formation permeability and cause a reduction in oil production. In addition, limited success is achieved in reducing high water production and a high water cut that significantly decreases well productivity. In the Oman field study by Rudyk et al. [1], treated producing wells showed oil production rate increases of 25% and 36% relative to forecast, while nearby untreated wells showed increases of 11% and 64%; one treated well showed no noticeable response. Difficulties are also encountered in producing heavy oil resources and from low permeability reservoirs [1]. Current production technologies are not able to economically recover all hydrocarbon resources; large reserves of all oil are being left behind [2]. Millions of oil and gas wells have been abandoned worldwide, and abandoned wells can remain sources of methane emissions and other environmental risks [3].
Conventional enhanced oil recovery (EOR) methods have limitations when applied to heavy oils.
Several emerging EOR technologies, including electrical EOR approaches, have been reviewed and proposed to address those situations for which established technologies are not appropriate [4]. Electro-enhanced oil recovery (EEOR) has been proposed to address production improvement in marginal wells and environments where other technologies either do not work or are not attractive [1].
When assessing the investment in emerging technologies like electro-enhanced oil recovery (EEOR), the standard “Cost of Lifting” (COL) metric used for conventional oil fields is not the right measure.
This is because the oil reserves in question have already been discovered. They are simply unrecoverable with current methods. Successfully developing a technology like EEOR is therefore equivalent to finding vast new reserves, as it unlocks previously trapped oil in an economical way. EEOR is a particularly promising technology that can boost oil recovery in conditions where other methods fail. It operates with minimal water requirements and a lower energy input, potentially at a lower cost than standard secondary or tertiary recovery techniques. The process itself involves running direct current (DC) electricity between electrodes. Cathodes are placed within the oil-producing reservoir, while anodes are positioned at the surface or elsewhere underground, creating an electrical circuit that enhances oil movement toward production wells. The major electrical processes are resistance heating using direct current (DC) or a low- and medium-frequency alternating current (AC) ranging from 60 Hz to 300 kHz, a high-frequency electric current represented by radio frequency (3 kHz–300 GHz) and microwave (300 MHz–300 GHz) methods, and heating by means of electrical heaters (typically 60 Hz) [5,6,7].
The historical development of electrical EOR includes some concepts, such as the one put forward by Workman [8]. His 1930 patent proposed inducing electrolysis in the aquifer beneath an oil zone to generate gases that would reduce oil viscosity and enhance mobility. Since no documentation suggests this method was ever tested, the reference is cited to establish the early origin of the concept rather than to document a proven technology. Sarapuu [9] suggested employing high-density electrical currents to carbonize hydrocarbons, thereby improving their flow into wellbores. Similarly, Bell [10] put forward a method that used a high-density DC current to push oil directly from the reservoir toward production wells. In a different approach, Gill [11,12] and Crowson and Gill [13] advocated for the use of an alternating current (AC) to thermally heat the reservoir, which reduces oil viscosity and facilitates recovery.
Chilingar et al. [14] (1970) previously investigated direct current treatment of natural and synthetic sandstone cores and reported several-fold increases in liquid flow rate, including a residual response after current interruption. Therefore, the present study does not claim that DC-induced changes in sandstone flow or permeability are novel. Its specific contribution is the sequential examination of four applied voltage levels (40, 10, 5, and 35 V) over 6430 min in heavy oil/brine-saturated Berea cores, tracking phase-specific effective permeability across distinct saturation conditions. Unlike a single-voltage comparison, this sequence documents a nonmonotonic response and recovery toward baseline under subsequent voltage changes. These observations do not independently identify the pore-scale mechanism or establish an optimal field-scale operating condition.
One of the first studies on electro-osmosis for EOR was conducted independently by G. V. Chilingar and his team at the University of Southern California and by Tikhomolova [15] at the University of St. Petersburg. Both of their laboratory studies indicated that this low-power mechanism showed significant promise as an EOR technology [7,16,17,18,19,20,21].
Several electrical heating methods were proposed to reduce the viscosity of heavy oil production wells. For instance, there was low-frequency alternating current (AC) heating. This was directly applied in Canadian heavy oil fields [22]. Alternatively, other techniques such as electromagnetic (EM) and radio frequency (RF) induction [23], as well as downhole resistive heaters, have been suggested to achieve the same goal of heating the critical near-wellbore region of the reservoir.
Although the research divisions of several major oil companies have explored various AC, radio frequency, and downhole heating methods for EOR, EPI is, to our knowledge, the sole organization to have successfully proven DC electrical stimulation through both lab and field research. EEOR (electro-enhanced oil recovery) seems to be the only electrical approach that has demonstrated effects beyond simple Joule heating of the reservoir. The historical development of electrical oil recovery concepts also included a series of patented approaches [8,9,10,11,12,13].
EEOR efficiency was tested by many international field trials targeting heavy oil and oil sands. These demonstrations have yielded significant results. A low-frequency AC trial was conducted in Brazil’s Rio Panon field. This technology boosted production from 1.2 to 10 barrels per day over 70 days [24]. In the Santa Maria Basin, California, a DC application led to a tenfold increase in production while cutting water cut from 45% to 12%. Similarly, in the eastern Alberta plains, a DC test successfully increased the oil rate from 0.21 to 0.91 m3/day [25]. Beyond oil, electrical stimulation has also been investigated for gas production from hydrate deposits [20].
1.1. Electrochemical Background
A total of four principal mechanisms are posited to function within enhanced oil recovery (EEOR), as substantiated by extant empirical field and laboratory investigations. These mechanisms are electromigration, electrophoresis, electro-osmosis, and Joule heating, and all of them are called electrokinetic mechanisms.
The theoretical basis of coupled transport processes was investigated by Lars Onsager, who received the Nobel Prize in Chemistry. Simplified descriptions of the underlying theory were later presented by Mitchell, as well as by Nourbehecht and Madden.
In matrix notation, Onsager’s relationships can be represented as:
where Ji = generalized flux vector; Lij = generalized coupling coefficient tensor; ∇Φj = gradient of generalized potential field.
Ji = Lij∇Φj
When a current is forced through a material that opposes its flow, that opposition generates heat; this is what we call Joule heating. The heat produced per unit volume is given by:
where pxᵧᵧ = local power loss per unit volume; J = electrical current density vector; E = local electric field vector; σ = local electrical conductivity tensor; || || = magnitude operator.
pxᵧᵧ = J · E = σ||E||2
Total power dissipation in a circuit element is:
where P = circuit element power loss; I = electrical current; R = resistance; ∆V = circuit element voltage drop.
P = ∫∫∫ pxᵧᵧ dV = I2R = I∆V
Electro-osmosis is the flow of pore fluids induced by an applied electric field. The phenomenon has been widely explored in soil mechanics [26,27,28] and environmental remediation works [27,29].
The application of an electric field across a porous medium that contains charged particles (clay minerals) directs the fluid residing in the diffuse double layer adjacent to the surfaces of the particles toward the electrode possessing an opposing charge. This fluid movement can enhance fluid flow through porous media. This is more evident in formations characterized by low permeability.
The stronger the applied electric field is, the faster the electro-osmotic flow is working. It is mathematically expressed as:
where q_eo = electro-osmotic flow rate; k_e = electro-osmotic permeability coefficient; E = applied electrical field strength; A = cross-sectional area.
q_eo = k_e × E × A
Dissolved ions in the fluid begin to move when we apply an electric field. Negative ions are pulled toward the anode and positive toward the cathode. This is essentially what electromigration is about.
Electrophoresis works in a similar fashion, though here the electric field acts on charged particles floating in the fluid rather than ions in solution. In EEOR, both of these mechanisms work together to move and redistribute chemical species throughout the reservoir.
1.2. Electrochemical Reactions Induced by Direct Current
If we apply a direct current (DC) through a reservoir, it establishes redox (reduction–oxidation) gradients between the two electrodes. Oxidation reactions proceed at the anode, while reduction reactions take place at the cathode; this is a fundamental electrochemical relationship that, in the context of oil recovery, carries significant practical implications. Wittle et al. [25] demonstrated that these reactions are not merely incidental byproducts of current flow but are, in fact, central to the recovery mechanism itself.
A conventional EEOR operation involves a relatively straightforward set of surface and downhole components. At the surface, a DC power supply and control panel manage the electrical parameters and monitor system performance. Electrical cables connect this surface unit to downhole electrodes installed within the producing formation. Cathodes (negative electrodes) are typically placed within production wells, while anodes (positive electrodes) may be configured either as surface arrays or as downhole installations at varying depths [2]. Field implementations have demonstrated that existing well casings and tubing can often be repurposed as electrodes, substantially reducing the need for dedicated downhole hardware [30].
The DC current travels from the surface power supply through the cables and into the cathodes within the formation. Then the current flows through the reservoir rock and fluids toward the anodes.
The current activates along its path a coupled set of electrokinetic and electrochemical mechanisms that together drive the recovery process.
The setup is further supported by monitoring and data acquisition instrumentation that continuously records electrical parameters, fluid production rates, and reservoir behavior throughout the experiment. As the current flows through the reservoir, several interdependent physical and chemical mechanisms are activated simultaneously. Wittle et al. [25] and Wittle et al. [2] identified five primary processes: electromigration, electrophoresis, Joule heating, electro-osmosis, and electrochemical reactions.
Joule heating arises from the resistive dissipation of electrical energy within formation fluids and the rock matrix, raising local temperature and reducing oil viscosity in a manner comparable to but more depth-flexible than conventional thermal EOR methods. Electro-osmosis drives pore fluid movement in response to the applied electric field; laboratory coreflood studies have shown that this effect can reduce displacement pressure, alter wettability, and modify the zeta potential of mineral surfaces [31,32]. Ion transport through electromigration and electrophoresis redistributes charged species and colloidal particles within the pore network, further modifying flow behavior [24,33].
Ansari et al. [34] reported an approximately 11–29% increase in carbonate core permeability during electrokinetic-assisted surfactant EOR experiments. EEOR may be economically more attractive than conventional EOR methods under suitable conditions.
One of the most frequently cited advantages is the absence of any required working fluid. Unlike steam flooding, which demands continuous water injection and substantial energy for steam generation, or chemical EOR, which relies on surfactant or polymer supply chains, EEOR operates entirely on electrical power [25,35]. This is especially relevant in remote or water-scarce environments.
The technology is also notably depth-independent in principle. Although conventional steam flooding is generally restricted to relatively shallow heavy oil reservoirs because of heat losses, DC-based EEOR has been proposed for substantially greater depths; Wittle et al. reported applicability below 10,000 ft (about 3000 m) [25].
Permeability heterogeneity, which often compromises the effectiveness of fluid-injection techniques by causing preferential flow through high-permeability streaks (thief zones), poses less of a constraint for EEOR. Because the electrical field distributes more uniformly through the formation than injected fluids, the channeling problem is largely circumvented [35]. This uniform distribution also makes the method applicable across a wide range of formation permeabilities, from tight reservoirs where laboratory evaluations have confirmed measurable recovery improvements [31], to conventional and carbonate formations [30,34].
From a project economics standpoint, EEOR allows for incremental capital deployment. Facilities may be installed progressively, distributing capital expenditure across the project lifetime. The equipment may be operated remotely with limited routine maintenance. Additionally, electro-osmotic suppression of water production has been documented in field demonstrations, resulting in reduced water cut and lower fluid handling costs [25].
The carbon footprint of EEOR depends on the electricity source and the energy consumed per barrel of recovered oil; it was not quantified in this study.
There are no burners, no injection of hazardous chemicals, and water consumption is substantially lower than in thermal or waterflood operations [35]. As the energy industry faces increasing scrutiny over its environmental footprint, these attributes position EEOR as a technically viable and environmentally defensible recovery strategy across a range of reservoir types.
This laboratory study applied constant DC voltage sequentially at 40, 10, 5, and 35 V to Berea sandstone cores and measured effective permeability over 6430 min. Because the same cores experienced successive phases, the resulting trends describe the response to the complete treatment history and cannot be interpreted as independent voltage-specific effects.
The aim is to characterize the observed permeability trajectory during sequential DC treatment and identify hypotheses for future controlled testing, not to establish a causal optimum, an electrical energy efficiency gain, or field-scale production benefits.
The broader EEOR concept includes several electrical stimulation methods, but the present laboratory study investigated only sequential constant direct-current (DC) voltage phases (40, 10, 5, and 35 V). Neither alternating current frequency nor pulsed current parameters were varied or optimized. Earlier electrical EOR investigations provide context [14,36,37], while the specific contribution here is the measured effective permeability trajectory during the fixed DC treatment sequence. These observations do not establish an independently optimal voltage or field-scale performance.
Drawing from our previous research conducted in Oman [38], we have tested the work in the field, but a comprehensive understanding of the natural technique remains to be achieved.
A key advantage of electrical stimulation is its rapid application and the fact that it does not require dismantling existing production equipment, thereby reducing the risk of equipment damage and operational disruption. The relatively simple intervention also minimizes the potential for reservoir damage while reducing energy consumption and maintenance requirements. As a result, electrical stimulation can significantly improve overall operational efficiency.
Electrical stimulation can be applied as a relatively short well intervention compared with long-duration thermal or chemical EOR operations; however, treatment duration is reservoir- and design-dependent [2,25].
Published EEOR studies and field demonstrations show that electrical treatment can be implemented as a targeted intervention without continuous injection of steam or chemical working fluids [2,25]. Treatment time depends on reservoir properties, electrode configuration, current density, and the intended recovery mechanism.
During the years of production, the reservoir matures, and oil and gas production gradually declines. This is happening partly due to changes in the permeability of the reservoir rock.
The developed technology directly targets this issue by recovering and improving permeability, thereby sustaining and potentially increasing production output over time.
This approach uses the reservoir rock and its conductive pore fluids as part of an electrical circuit. In the present experiments, the cores were subjected to four sequential constant direct current (DC) voltage levels (40, 10, 5, and 35 V). No pulsed current waveform, frequency, duty cycle, or pulse width was applied or investigated, and no alternating current tests were conducted. Figure 1 illustrates the general electrode arrangement.
Figure 1.
Regulated electrical current. Well bearing. The current travels via the casing and then through the permeable zone to another well, thereby completing the electrical circuit.
As these currents travel, they convert electrical energy into thermal energy through ohmic losses in the formation. The electrical conductivity of a reservoir depends on the resistivity of its native pore water, which is itself governed by several factors, including the concentration of dissolved salts in the electrolyte, the volume of electrolyte contained within a unit of rock, and the structural geometry of the pore space.
In the rock, two metal tubes are placed, representing the well casing with holes representing perforations. The tubes are covered with cement. Water is injected through the perforations at various flow rates in one well and produced from the other well. An electric current is applied to these two tubes, which are used as the cathode and anode. The number, placement, and dimensions of the electrodes can be varied in the experimental setup. The temperature of the box is regulated and monitored in the container.
The theoretical hookup diagrams for individual wells are shown in Figure 2.
Figure 2.
1 = Electric energy source; 2 = electric cable; 3 = grounding electrodes; 4 = open shaft; 5 = electrode inside the well; 6 = guiding tool; 7 = filtering station.
The pressure gradient (dP) is measured, and permeability is calculated at fixed flow rates before and after electrical treatment. Changes in permeability before and after electrical treatment are compared under various conditions. Temperature was continuously monitored by the data logger throughout the experiment. The measured system temperature remained within 23 ± 1 °C (22–24 °C). No bulk water boiling or steam generation was observed under these experimental conditions; therefore, the previous statement that ‘water boiling is recorded’ has been removed.
The aim of this project is to develop a laboratory-based model for evaluating voltage-dependent permeability responses and informing subsequent investigations of electrical operating conditions and oil recovery.
2. Materials and Methods
2.1. Sample Preparation
Eight Berea sandstone core samples (diameter 3.5 cm, length 7.0 cm; nominal porosity 19%) were used (Figure 3). Their initial absolute permeabilities were 150 or 300 mD, as specified by sample ID in Table 1. Initial absolute permeability was measured using the PERM GFO 1503 R2K (PERM Inc. Instruments, Calgary, AB, Canada). The cylindrical bulk volume was 67.35 cm3, and the corresponding nominal pore volume was 12.80 cm3 (Vp = πD2Lφ/4).
Table 1.
Consolidated properties and initial conditions of the eight Berea sandstone samples. D = diameter; L = length; φ = nominal porosity; Vp = nominal pore volume calculated from geometry and φ; Kabs = initial absolute permeability; ke, 0 = measured initial effective permeability of the indicated fluid. All samples used brine prepared with 5.00 g NaCl per 100 mL distilled water and received the same sequential DC treatment (baseline → 40 → 10 → 5 → 35 V).
Prior to saturation, the samples were cleaned using a Dean–Stark extractor with toluene and methanol as solvents to remove any residual hydrocarbons or contaminants, followed by oven drying at 80 °C for 24 h until a constant weight was achieved. The dry weight (W_dry) and bulk volume of each sample were recorded.
Using the confirmed dimensions (D = 3.5 cm, L = 7.0 cm) and porosity (φ = 0.19), the calculated bulk volume is 67.35 cm3 and the nominal pore volume is 12.80 cm3.
For Sᵥ = 0.70 and So = 0.30: brine = 0.70 × 12.80 = 8.96 cm3; crude oil = 0.30 × 12.80 = 3.84 cm3.
For Sᵥ = 0.50 and So = 0.50: brine = 0.50 × 12.80 = 6.40 cm3; crude oil = 0.50 × 12.80 = 6.40 cm3.
The brine was prepared by dissolving 5.00 g of NaCl in 100 mL of distilled water (50 g NaCl per litre of water used for preparation).
It was continuously stirred at room temperature until full dissolution was achieved. Crude oil of density 0.946 g/cm3 (API gravity = 18°), sourced from the Shaikan field (Kurdistan Region of Iraq), was filtered through a 0.45 µm membrane to remove any particulates prior to use.
The nominal pore volume (12.80 cm3, calculated from the confirmed core dimensions and 19% porosity) was used for both saturation conditions. For Sᵥ/So = 0.70/0.30, the target brine and oil volumes were 8.96 and 3.84 cm3, respectively; for Sᵥ/So = 0.50/0.50, the target volumes were 6.40 and 6.40 cm3. The saturation fractions represent nominal target conditions. The samples were subsequently aged under static conditions at 1.85 MPa and 80 °C for 24 h, as originally described. These aging conditions are distinct from the earlier saturation procedure described in Section 2.2.
2.2. Experimental Conditions
The same eight Berea sandstone cores described in Section 2.1 were used throughout (diameter 3.5 cm, length 7.0 cm, nominal porosity 19%, initial absolute permeability 150 or 300 mD). The consolidated sample-by-sample properties and initial measured effective permeabilities are reported in Table 1.
Brine was prepared using 5.00 g NaCl per 100 mL distilled water, consistent with Section 2.1. The sandstone samples were saturated with the respective formation fluid (brine and crude oil) in a pressurized (1.85 MPa) stainless steel autoclave placed in an oven at 120 °C for 48 h for effective saturation (Figure 1). FESEM was used for descriptive examination of sandstone grains at 5 kV. However, paired pre- and post-electrical treatment FESEM/SEM or CT images were not acquired in the present study; therefore, the FESEM examination is not used as direct evidence of electrically induced pore-scale structural changes.
Figure 3.
(A) Core sample before saturation. Formation: Upper Devonian. Permeability: 150, 300 mD. (B) Core sample after saturation, Sw = 0.7. So = 0.3.
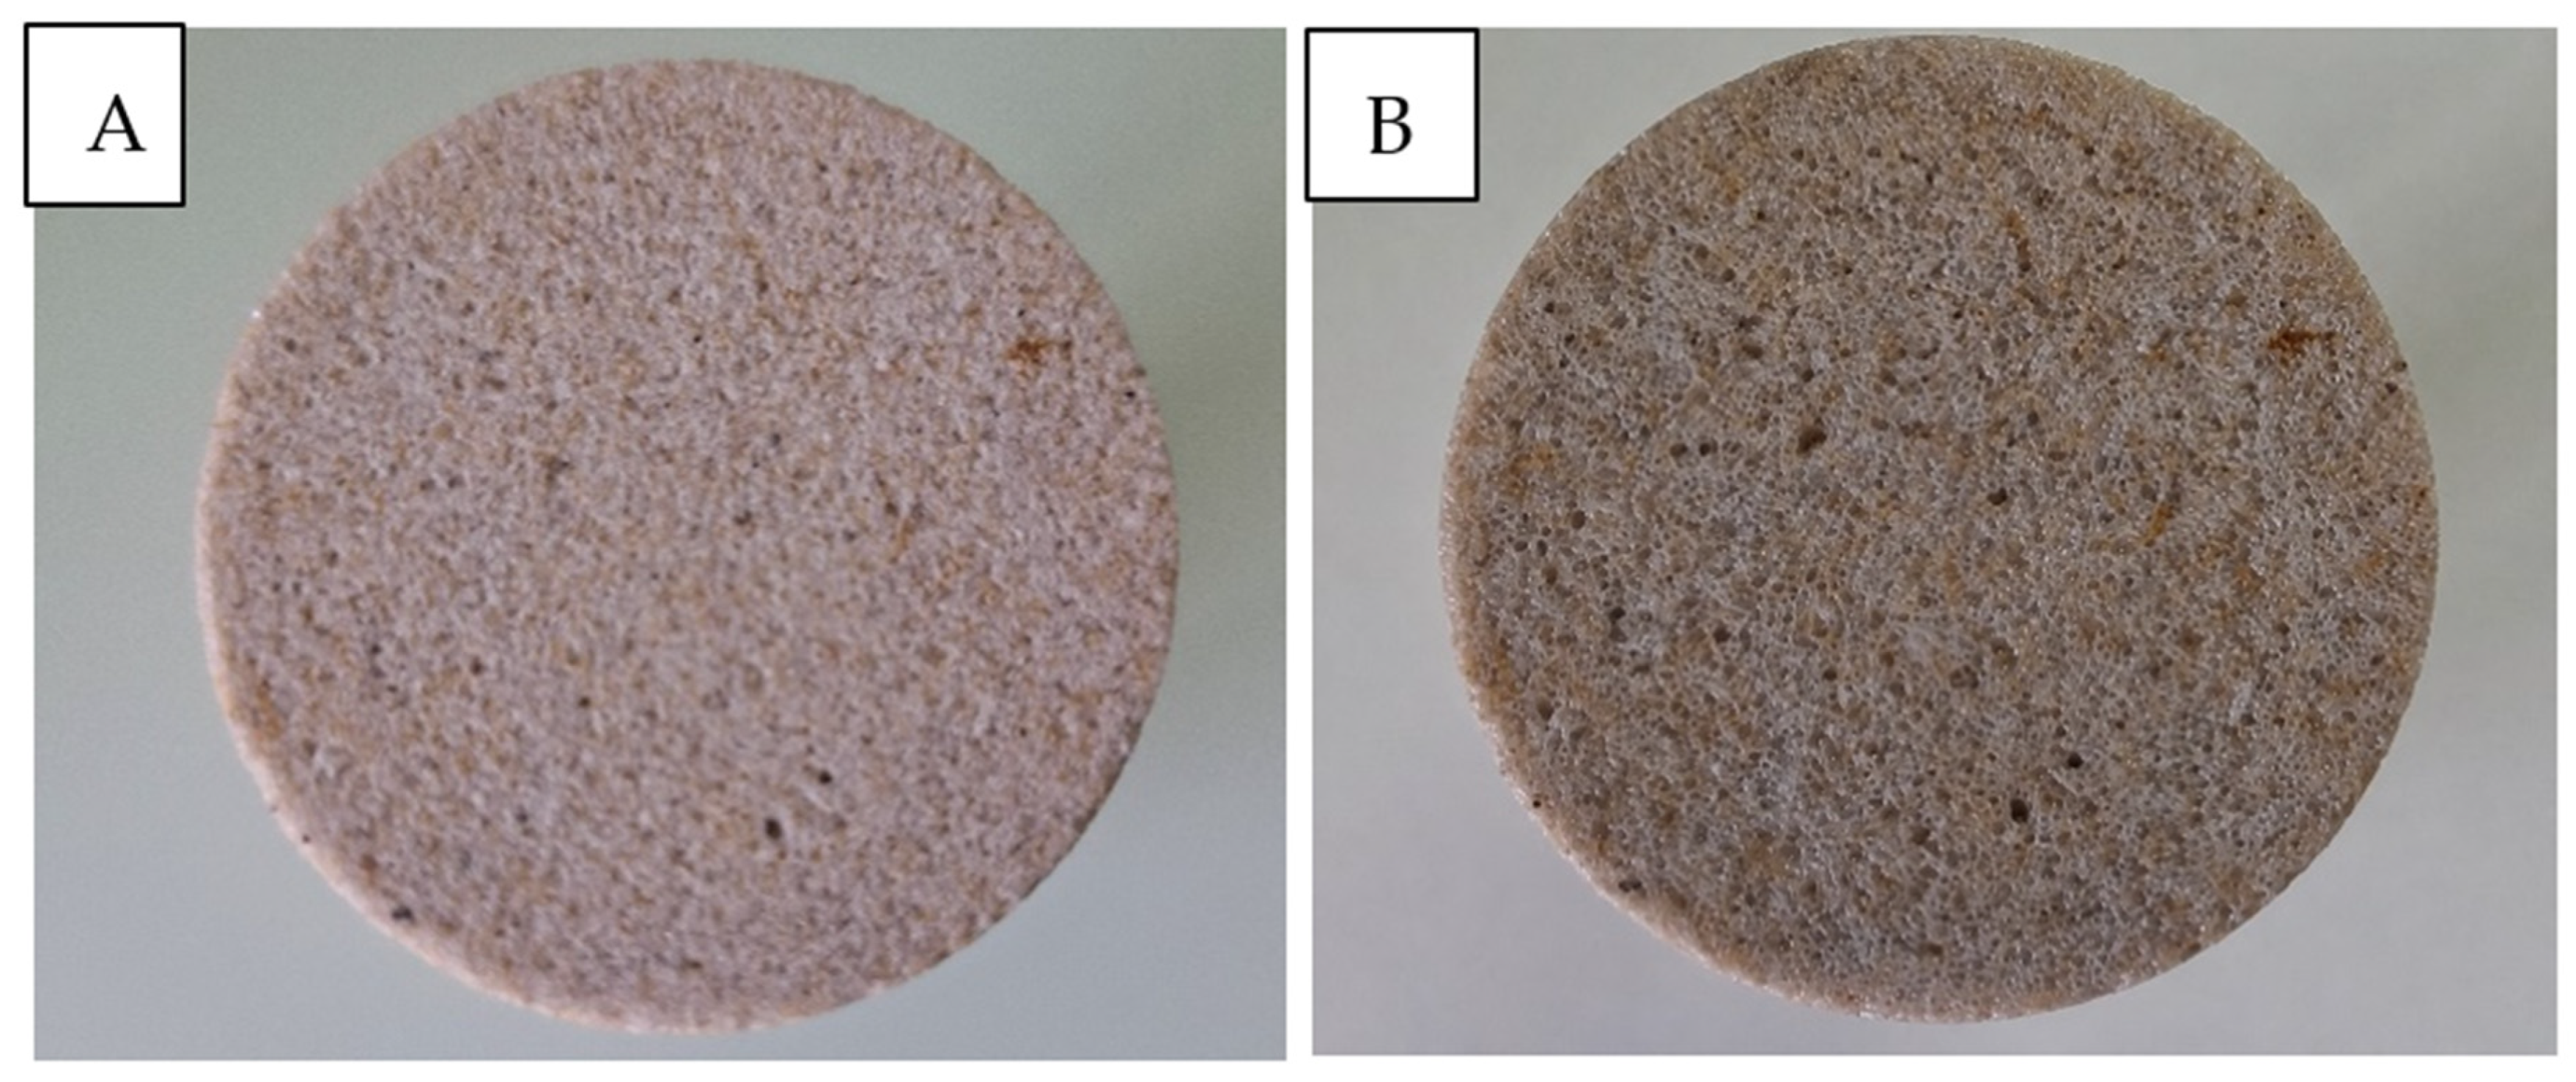
To investigate remediation under these conditions, a sandstone core plug was fabricated for this study by Kocurek Industries (Caldwell, TX, USA). Its properties were designed to reflect key characteristics of the target reservoir.
This experimental approach, utilizing a representative synthetic core instead of actual field samples, provides a controlled basis for initial technology evaluation. The simulated environment also incorporates other challenging field conditions, such as high water cut (50–70%), brine prepared at 50 g NaCl per litre of water, and a typical well spacing of up to 400 m, which provide context but were not all directly reproduced at field scale. This study focuses on electrokinetic (EK) enhanced remediation as a non-invasive method to improve near-wellbore permeability and fluid flow under this specific set of reservoir conditions.
The experimental setup (Figure 4) integrated three primary subsystems. The system consisted of a metal cell housing the sample, integrated electrodes, and stopwatches. The electrical system featured a variable DC power supply (0–50 V, 0–5 A) connected to the cell electrodes via insulated cables, with system performance monitored by a digital ammeter and voltmeter.
Figure 4.
Utility model; (B) real picture of utility model; (C) wells working as cathode and anode.
The collection of data was performed by a data logger in order to record voltage, current, and temperature.
The measured effective permeability of the oil or water phase (indicated in Table 1) was measured using the CF-150 permeameter prior to and following each DC voltage treatment phase. Permeability was not continuously measured during electrical exposure, and the electrical data logger only measured voltage, current, and temperature during the exposure. Brine and oil effective permeabilities were measured separately, and the corresponding phase was identified in Table 1. Effective permeabilities were measured relative to the phase that was saturated in the core and not absolutely. It was assumed that the other phase was present in the pore space during the flow measurements, and the saturation state was not confirmed in the available data. Measurements of oil and brine effective permeabilities were made separately under steady-state flowing conditions through fully or partially saturated cores containing both fluid phases. Inlet pressures to the apparatus during the tests were 45 bar (oil) and 30 bar (brine). A downstream back pressure regulator (BPR) was set at 10 bar. Nominal flow rates through the core were set at 0.030 mL/min (oil) and 0.053 mL/min (brine). It was assumed that the flow was laminar. Core temperatures were 23 ± 1 °C. Two technical readings were reported for each condition measured. For each liquid phase α, steady-state Darcy’s law is k_eff,α = Q_α μ_α L/(A ΔP_α), where Q is the volumetric flow rate, μ is the dynamic viscosity, L = 0.070 m is the core length, A = πD2/4 is the cross-sectional area of the core (D = 0.035 m), and ΔP_α is the pressure drop across the core. No core-mounted differential pressure sensor was used. The measured inlet pressure and BPR setting cannot be equated to core-face pressures. Core pressure differentials were retrospectively calculated from the effective permeability values using Darcy’s law: ΔP_α,calc = Q_α μ_α L/(A k_eff,α). The calculated values use effective permeability, assumed flow rates, and viscosity.
At the end of the experiments, the sample was dried, and absolute permeability was measured to ensure no damage to the pore structure occurred. The measurement was performed by PERM GFO 1503 R2K.
The experiment began with a baseline measurement to determine the initial effective permeability of water and oil (Table 1).
All eight samples in Table 1 followed the same sequential treatment program (baseline/C1, 40 V, 10 V, 5 V, 35 V), with effective permeability measured after each phase. The reported trajectories represent individual samples with different starting absolute permeabilities, saturation conditions, and measured fluid phases (n = 1 for each sample/phase combination). The initial measured effective permeability for each sample is included in the consolidated table.
Eight distinct core samples were used in thirty experimental runs, with repeated runs performed on previously used cores after cleaning and restoration to the initial saturation conditions.
Subsequently, a direct current was applied across the sample in four sequential phases: Phase 1 applied 40 V from 0 to 2000 min; Phase 2 reduced the voltage to 10 V from 2000 to 4265 min; Phase 3 further reduced the voltage to 5 V from 4265 to 4955 min; and Phase 4 increased the voltage to 35 V from 4955 to 6430 min, resulting in a total test duration of 107.2 h. The corresponding current density during the initial high-voltage phase was calculated to be 16.2 A/m2. Voltage, current, and temperature were logged at regular intervals throughout the experiment. The temperature record remained within 23 ± 1 °C (22–24 °C) throughout all voltage phases, with no temperature excursion approaching the boiling point of water. Accordingly, the permeability changes observed in this experiment are not attributed to bulk thermal heating, boiling, or steam generation. The current was not constant between phases; it varied with the applied voltage and with changes in the electrical conductivity/resistance of the brine-saturated porous medium during treatment. Because phase-resolved current–time data are not reported here, electrical energy consumption (E = ∫V·I·dt) is not calculated, and Δk/V is therefore reported only as a voltage-normalized permeability response metric rather than an energy efficiency metric. Electrical resistivity and conductivity were derived from the recorded voltage and current data.
Sensitivity Analysis
To show the variability in reported mean effective permeability, CV was assumed to be 3%, 5%, and 10% in Table 2. Model-based standard deviations were calculated as SD_model = mean(k_eff) × CV/100. CV values were assumed for illustration and were not estimated from experiments. Therefore, results of the calculations do not show repeatability or independent core reproducibility and should not be interpreted as error bars or confidence intervals.
Table 2.
Standard deviations for illustrative mean effective permeability values under coefficients of variation (CV).
3. Results and Discussion
3.1. Electrokinetic Treatment
During the 40 → 10 → 5 → 35 V treatment sequence, measured effective permeability varied greatly and non-monotonically. The eight samples varied in initial permeability and saturation state, as well as measured fluid phases (see Table 1). The variations are mostly related to the different treatment phases, but the effects of voltage, treatment time, and previous exposure were also not controlled. The data do not establish a causal relationship between voltage and permeability. Interpretation of effective permeability requires an understanding of saturation. For a fluid phase α, k_eff,α = k_abs × k_r,α, where k_abs is absolute permeability, and k_r,α is the relative permeability of that phase. Different initial saturation groups (Sw/So = 0.70/0.30 and 0.50/0.50) were different experimental conditions, and effective permeability values associated with those groups should not be combined. Within a single sample, variations in phase redistribution, local saturation changes, and/or capillary occupancy can occur during the treatment, resulting in a change in k_r,α. Since saturation was not monitored during all measurement steps, effects due to changes in saturation and structural changes cannot be distinguished. Stage-specific saturation data were not independently measured. The Sw/So values of 0.70/0.30 and 0.50/0.50 prescribed for the initial conditions describe preparation conditions only. Oil and brine saturations before and after the 40 V (0–2000 min), 10 V (2000–4265 min), 5 V (4265–4955 min), and 35 V (4955–6430 min) treatment stages are not known. Thus, saturation constancy cannot be demonstrated for any stage. Additionally, no stage-specific saturation values can be inferred from the relative permeability curves. Relative permeability changes may cause observed variations in effective permeability. Moreover, the distribution of fluid phases and capillary occupancy may affect effective permeability. The effects of changes in intrinsic pore structure cannot be measured separately from the effects described. The application of Condition C2 (40 V, Table 3) caused a reduction of more than an order of magnitude in effective permeability.
Table 3.
Conditions of treatment.
Possible mechanisms include the electrophoretic displacement of charges, the electrochemical deposition of constituents, and gas formation. These effects would temporarily reduce flow and constrict pore throats. These mechanisms are consistent with the principles of electrokinetic theory. They may explain the observed changes in effective permeability; however, they were not verified by this work due to the absence of pore-scale imaging and analysis of effluent. A conceptual illustration of the observed changes in effective permeability is presented in Figure 5.
Figure 5.
Conceptual illustration of the observed effective permeability response: (A) initial condition; (B) reduced effective permeability during the 40 V phase; and (C) enhanced effective permeability during the 5 V phase. The diagrams are schematic and do not directly demonstrate pore-scale mechanisms. The approximately tenfold response refers to measured effective permeability, not to a directly measured tenfold increase in volumetric flow rate.
Effective permeability approached baseline during the 10 V phase and reached its largest observed enhancement during the subsequent 5 V phase, before moving closer to baseline during the final 35 V phase. However, the 5 V stage began after 4265 min (approximately 71.1 h) of prior exposure at 40 and 10 V. The apparent 5 V enhancement could therefore include cumulative electrochemical or transport effects, fluid redistribution, or other time-dependent carryover. The study cannot isolate the intrinsic effect of applying 5 V to an untreated core.
Recovery toward baseline under subsequent phases is an observed feature of this treatment history; it does not demonstrate intrinsic reversibility under independently repeated voltage cycles. Explanations involving pore blockage, particle migration, electro-osmosis, or electrochemical reactions remain hypotheses pending pore-scale imaging and effluent analyses.
3.2. Performance on Stimulation
Three descriptive response intervals can be distinguished along the applied sequence: a marked permeability decrease during the initial 40 V stage, recovery toward baseline during 10 V, and the largest measured increase during the later 5 V stage. These are sequence-associated observations, not independently validated operational voltage zones. The ratio Δk/V is a voltage-normalized response indicator, not a measure of electrical energy efficiency. Actual energy input requires integration of voltage multiplied by measured current over time (E = ∫V(t)I(t)dt). Phase-resolved current records are not reported, so electrical energy consumption, energy per permeability change, and claims of an 800-fold efficiency gain cannot be calculated or supported.
The pooled effective permeability dataset exhibits substantial variability (reported coefficient of variation: 122.4%), reflecting differences among samples, fluid phases, initial saturation, and sequential treatment stages. The largest reported increase occurred during the 5 V phase, whereas the initial 40 V phase showed strong reductions (Figure 6). These comparisons do not identify an optimal voltage because each stage followed earlier electrical exposure, and independent controls and identical condition replicates were unavailable. Any proposed benefit of lower-voltage operation requires confirmation using fresh matched cores, randomized voltage order, and measured electrical energy input.
Figure 6.
Effective permeability measured at baseline and after each completed DC voltage phase for the individual samples. Measurements were discrete (0, 2000, 4265, 4955, and 6430 min).
The high coefficient of variation (122.4%) should be interpreted cautiously. It quantifies the overall dispersion across measurements obtained from samples with different starting permeability, saturation state, fluid phase, and electrical treatment stage; it is therefore not a pure estimate of repeatability.
Figure 7 displays normalized effective permeability values for successive stages of the fixed treatment sequence. The reported decline during 40 V, recovery during 10 V, enhancement during 5 V, and later response during 35 V describe phase-associated observations. They cannot be used to rank independently applied voltages or to establish a universal response curve because elapsed time and prior electrical exposure were not controlled separately. The voltage-normalized response Δk/V is a descriptive ratio only. Its apparent variation across the four stages cannot be interpreted as a causal voltage dependence or an electrical energy efficiency comparison. Computing energy consumption would require the measured current history for each stage and integration of electrical power over time. The experiment documented substantial changes in measured effective permeability during the sequential electrical treatment program. The available design cannot attribute those changes to individual voltages independently of cumulative exposure. The experimental results demonstrate a voltage-dependent change in effective permeability. The underlying pore-scale mechanisms were not measured directly. The approximately tenfold enhancement observed at 5 V (Condition C5) is compatible with non-thermal electrokinetic processes reported in the literature, including electro-osmosis, electromigration, and redistribution of charged species or particles. However, no paired pre-/post-treatment SEM/CT images or effluent measurements of fines, ions, or pH were obtained. These processes are therefore discussed as hypotheses rather than demonstrated mechanisms. Because the measured system temperature remained at 23 ± 1 °C throughout the experiment, a bulk thermal mechanism is not supported by the present thermal data. During the initial 40 V phase, effective permeability decreased markedly. The near-isothermal recorded temperature argues against bulk steam generation, but electrochemical gas formation, precipitation, or particle redistribution were not measured and remain hypotheses. The statistical variability (coefficient of variation: 122.4%) in the effective permeability measurements reflects the dynamic response of the porous medium during electrical treatment. This value is used consistently throughout the manuscript for the analyzed dataset. The largest observed permeability enhancement occurred during the 5 V phase of the sequence, after prolonged treatment at higher voltages. This observation motivates independent low-voltage tests but does not establish that 5 V is intrinsically superior or that any particular voltage range is optimal. The experimental temperature remained approximately 23 ± 1 °C. The present work provides preliminary laboratory observations for planning a subsequent controlled experimental program. Identifying operational voltage settings or designing a field-ready system will require independent single-voltage tests, treatment order controls, repeatability assessment, and energy accounting.
Figure 7.
Effective permeability responses at baseline and after successive completed DC treatment phases (40 → 10 → 5 → 35 V).
3.3. Technological Process of Creation of Utility Model
The broader EEOR concept may have applications to depleted oil fields, but the present study measured laboratory effective permeability only. Environmental benefits, treatment duration, operating efficiency, and field-scale production gains were not evaluated in these experiments.
The technology works by using the reservoir itself as a conductor. Formation water naturally contains dissolved salts, which act as an electrolyte [16,20,39,40]. The broader literature includes low-frequency electrical treatments between electrodes, whereas this study used constant DC voltage [17,21,25]. In principle, an electrical current passing through a resistive rock–fluid matrix can generate Joule heating [18,41,42,43]. However, Joule heating is discussed here as a general mechanism reported for electrical reservoir stimulation and not as the dominant mechanism in the present laboratory experiment. In this study, the logged system temperature remained at 23 ± 1 °C, indicating that any Joule heating was too small to generate a measurable bulk temperature rise or steam formation.
Several pore-scale mechanisms have been proposed in the literature for electrically treated porous media, including electro-osmosis associated with the electrical double layer, electromigration of dissolved ions, electrophoretic transport of charged particles, and electrochemical reactions at electrodes [16,20]. In the present study, these mechanisms provide a theoretical framework only; changes in the electrical double layer or pore surface structure were not measured directly.
Accordingly, clay transformation into non-swelling amorphous structures is not claimed as an experimentally demonstrated outcome of the present work. Verification of such mineralogical or structural transformation would require paired pre- and post-treatment mineralogical and microscopic characterization, which was not performed here.
Likewise, destruction of the electrical double layer, release of fines, and subsequent cleaning or enlargement of pore throats are treated as possible hypotheses rather than observed processes. Although charged particles and ions can migrate under an applied electric field [24,32], the present study did not quantify fines in the effluent, pore-throat geometry, particle size distributions before and after treatment, or changes in surface/mineral structure. Direct SEM/CT imaging and effluent characterization are required to test these hypotheses [30,39].
Gas generation and thermal effects can occur during electrical treatment under appropriate electrochemical or high-temperature conditions. In the present experiment, bulk thermal effects were not observed: the logged temperature remained within 22–24 °C, and no boiling or steam generation occurred. Electrochemically generated gas bubbles remain a possible high-voltage mechanism, but gas generation was not measured directly and is therefore not used as a confirmed explanation for the permeability response. The response may also depend on formation-water salinity, electrical conductivity, porosity, permeability, mineralogy, and clay content [14,31].
The literature discusses electrokinetic transport, electrode reactions, and Joule heating as possible processes during electrical treatment. The present experiments directly measured changes in effective permeability during a sequential DC program under essentially isothermal conditions; they did not identify the causal mechanism or independently isolate voltage effects.
The observed phase-associated decrease, recovery, and enhancement provide descriptive categories for the tested sequence, not validated destructive, maintenance, and optimal voltage zones. Mechanistic attribution to electro-osmosis, ion migration, or electrochemical reactions, and any claim of superior energy efficiency at 5–10 V, require further direct measurements.
In the high-voltage zone (35–40 V), possible causes of permeability reduction include electrochemical gas bubbles, mineral precipitation, electrode reactions, or particle aggregation [16,39]. These possibilities are mechanistic hypotheses and were not directly distinguished by the present measurements. The medium-voltage response may reflect a different balance of electrical and electrochemical processes, but confirming this interpretation will require phase-resolved current data together with pore-scale imaging and effluent chemical analysis.
The largest measured enhancement occurred during the 5 V stage, but the response may include effects accumulated during earlier phases. The result supports further investigation with independent cores, randomized treatment order, electrical energy logging, and pore-scale characterization; it does not establish field feasibility or an energy-optimal operating range.
3.4. Effective Permeability Changes
During the 6430 min (107.2 h) sequential DC program, effective permeability varied substantially from initial values of 15–85 mD, with reported maxima of 380 mD for water and 153 mD for oil and minima of approximately 2–7 mD. Because the applied voltage order was fixed, these changes represent a combined treatment history response rather than independently identified voltage effects.
The largest observed increase relative to baseline occurred during the 5 V phase, whereas the initial 40 V phase was associated with marked permeability reduction. Later measurements approached earlier values. However, treatment history, time, and voltage are confounded; the data do not establish an intrinsic 5 V optimum or demonstrate repeated-cycle reversibility.
The observed recovery toward earlier permeability values is a feature of the measured sequential response, not proof that the pore structure was unchanged or that the same behavior would occur in an independently repeated treatment. The pooled coefficient of variation (122.4%) reflects heterogeneous measurements and does not quantify experimental repeatability.
The nonlinear voltage response suggests that more than one process may contribute to the observed permeability changes. Electro-osmosis and ion migration at lower voltage, and electrochemical gas formation, electrode reactions, precipitation, or particle redistribution at higher voltage, are plausible candidate mechanisms based on the literature. However, the present permeability measurements cannot determine which process dominated at each voltage. These interpretations therefore remain hypotheses to be tested by direct imaging and fluid/effluent characterization.
The recovery of effective permeability toward its initial value after voltage reduction demonstrates reversibility of the measured flow response over the experimental timescale. It does not prove the absence of permanent geochemical or pore-structural alteration, because paired pre-/post-treatment SEM/CT imaging and mineralogical or effluent analyses were not performed. Future replicated experiments should combine permeability measurements with direct structural and chemical characterization to determine whether any persistent changes occur.
3.5. Absolute Permeability Measurements
Absolute permeability was measured before saturation and after completion of the electrical stimulation experiments using the PERM GFO 1503 R2K gas permeameter, with Klinkenberg correction. All eight cores listed in Table 1 underwent the same sequential electrical treatment (40 V, 10 V, 5 V, and 35 V). Samples 1–4 had Sw/So = 0.70/0.30, and samples 5–8 had Sw/So = 0.50/0.50. These groups differed in initial saturation, not in stimulation status. No separate unstimulated control cores are documented in this study.
Before saturation, cores were cleaned using the Dean–Stark procedure with toluene and methanol and dried at 80 °C for 24 h, as described in Section 2.1. After the electrical experiments, the cores underwent Soxhlet extraction to remove retained hydrocarbons and soluble residues before repeat absolute permeability measurements.
For post-experimental cleaning, cores were placed in Soxhlet extraction thimbles and extracted with heated toluene (300–400 mL) until the circulating solvent appeared clear. Extraction was then repeated with methanol, followed by drying at 80 °C for 24 h. Soxhlet extraction was selected to provide repeated solvent contact with cores exposed to Shaikan heavy crude oil (18° API). However, the study did not directly compare the cleaning efficiencies of Soxhlet and Dean–Stark extraction. Because the pre- and post-experiment cleaning protocols differed, differences in residual organic material, soluble salts, or solvent-related effects may influence the measured after-values and limit strict comparability.
In addition, Klinkenberg correction was applied to convert gas permeability (k_g) to equivalent liquid permeability (k_∞):
where b is the Klinkenberg slip factor, and P_mean is the mean pore pressure. The absolute permeability values measured before and after sequential electrical stimulation for Berea sandstone cores under different initial oil–brine saturation conditions are presented in Table 4.
Table 4.
Comparison of absolute permeability before and after sequential electrical stimulation in Berea sandstone cores under different initial oil–brine saturation conditions.
For the 70/30 cores (Sw = 0.70, So = 0.30), measured absolute permeability decreased from 150 to 142 mD (5.3%) and from 300 to 280 mD (6.7%) after the experiments and cleaning.
For the 50/50 cores (Sw = 0.50, So = 0.50), measured absolute permeability decreased from 150 to 135 mD and from 300 to 270 mD (10% in both cases). These cores were electrically stimulated, as specified in the experimental test matrix. The larger residual reduction at higher initial oil saturation may be associated with retained organic material, particle redistribution, or pore-throat restriction, but the present data do not establish asphaltene deposition or irreversible formation damage as the cause.
These before-and-after absolute permeability measurements reflect the combined experimental history, including electrical stimulation, exposure to brine and crude oil, and subsequent cleaning. In the absence of unstimulated controls, identical pre-/post-cleaning procedures, and paired pore-scale or compositional analyses, the individual contribution of electrical stimulation cannot be isolated. Future experiments should use matched unstimulated controls, standardized cleaning protocols, and direct imaging/effluent analyses to distinguish these effects.
The before-and-after absolute permeability values provide a complementary, but not mechanism-specific, endpoint assessment. They were obtained after cleaning and drying and cannot be equated with the effective permeability trajectories recorded under oil/brine saturation. In particular, the modest residual changes in absolute permeability do not establish that the larger transient effective permeability responses arose from changes in pore-throat geometry. Different initial saturation states and unmeasured time-dependent saturation changes remain potential confounding factors.
3.6. Model-Based Sensitivity Analysis and Its Relationship to the Berea Sandstone Experiments
This section is a supplementary model-based sensitivity analysis. The laboratory experiments described in Section 2 and Section 3.1, Section 3.2, Section 3.3, Section 3.4 and Section 3.5 were performed exclusively on Berea sandstone cores, whereas Figure 8 and Figure 9 represent a separate model-based dimensionless sensitivity analysis. These curves are not experimental measurements obtained from the eight Berea sandstone samples and should not be interpreted as such.
Figure 8.
Model-based sensitivity calculation of the reversible production response, expressed as Q/Q0 versus the dimensionless energy release rate variable we/E″Q0. Curve 1 represents the idealized linear case. Curves 2–4 use F″ = 10 with L″ = 0.1, 0.2, and 0.3, respectively; the additional high-sensitivity calculation uses F″ = 40.
Figure 9.
Model-based treatment efficiency function (ψe) plotted against the dimensionless energy release rate variable we/E″Q0. The curve is a sensitivity calculation.
In Figure 8, Q is the calculated production rate, Q0 is the corresponding baseline production rate, and Q/Q0 is the dimensionless production rate ratio. The quantity we/E″Q0 is the dimensionless energy release rate variable used in the model, where we denotes the model energy release rate term and E″ is the characteristic normalization term. F″ is a dimensionless parameter representing the assumed sensitivity of the medium response to temperature-dependent property changes, whereas L″ is a dimensionless parameter representing the assumed spatial extent of the treatment effect. ψe denotes the model treatment efficiency function. These quantities belong to the sensitivity model.
The purpose of varying F″ and L″ is to test the sensitivity of the model response to assumed material response strength and treatment extent.
Figure 6 and Figure 7 demonstrate a voltage-dependent and reversible change in effective permeability, whereas the model in Figure 8 and Figure 9 explores how such a change, if translated to a production system, could affect the normalized production response under different assumed parameter combinations.
In Figure 9, ψe is used as an efficiency function for comparing parameter combinations.
The sensitivity calculations indicate that the position and magnitude of the model response depend on the assumed F″ and L″ values. This result is used only to demonstrate parameter sensitivity and to motivate future coupling of experimentally measured electrical energy input, permeability response, and reservoir-scale production models.
4. Discussion and Future Recommendations
The following discussion concerns possible future field-scale electrical stimulation concepts, not additional experiments performed in the present study. Published approaches include low-frequency alternating current heating, in which electrical energy can be dissipated as heat within the formation. Such approaches differ from the sequential constant DC laboratory program reported here. Reservoir electrical conductivity depends on formation-water salinity, water-filled pore volume, and pore-space geometry.
Any future evaluation of low-frequency AC or pulsed electrical stimulation would require a separate experimental design with defined waveform, frequency, amplitude, pulse width, duty cycle, and control method, as applicable. None of these frequency- or pulse-related variables was tested or optimized in the present work.
Future work could develop an independently controlled laboratory model to examine electrode configuration, electrical insulation, and reservoir permeability under separately assigned stimulation conditions. Such experiments could compare constant DC, alternating current, and pulsed current treatments, with frequency and time-dependent application schemes explicitly specified where relevant. Temperature would also be monitored. These are proposed future investigations, not results of the current study.
In future thermal or low-frequency AC stimulation studies, temperature distribution, pore geometry, and possible localized heating near electrodes would require direct assessment. Temperature and pressure monitoring could support model validation and evaluation of any risk of local steam formation. In the present constant DC experiments, bulk temperature remained at 23 ± 1 °C, and steam generation was not observed.
The experiments will also include verification of the effects of electrostimulation on the well material itself. In electrical resistive heating, the electrical circuit is completed through the water present in the formation. If the well casing itself is used directly to transmit current, the influence of temperature and electrolyte-related chemical reactions on the condition of the casing surface will be examined, given that the applied voltage is in direct contact with the formation.
4.1. Research Recommendations
Further investigation should include direct microscale and chemical evidence. Paired pre- and post-treatment SEM or micro-CT imaging is required to determine whether pore-throat geometry, particle distribution, or mineral surfaces change during electrical treatment [44]. Effluent should also be analyzed for suspended fines/particle size distribution, major ion composition, and pH before, during, and after each voltage phase. These measurements would allow the proposed mechanisms—fines migration, electrochemical precipitation, gas formation, and changes in clay/surface behavior—to be tested rather than inferred from permeability trends alone.
In future work, an investigation into mineralogical alterations is necessary to understand how these changes correlate with modifications in mechanical stability and reactivity [45].
A detailed exploration of current density variations is warranted to assess their influence on electrochemical processes, which are fundamental for efficiency optimization in energy storage systems [46]. The effects of different electrode materials on performance metrics must be studied to identify optimal configurations that enhance electrochemical activity [47].
The influence of pore fluid chemistry on the electrokinetic phenomena should be tested in future or other works [48].
According to Vane and Zang [49], the variations in ionic composition can significantly alter transport dynamics. The dependencies of temperature on these processes are also essential to be explored. The thermal variations can affect reaction kinetics and transport behaviors [48].
Investigating the permanence of modifications post-field removal is crucial to ascertain the long-term applicability of the findings in real-world scenarios, as these alterations may have implications for material longevity [50]. Cyclic loading effects must also be evaluated to understand how repeated stress impacts the integrity and functionality of the material over time [51]. A comprehensive assessment of weathering impacts is also relevant for predicting long-term changes in sandstone durability and performance under environmental exposure [52].
Coupled electrokinetic reactive-transport models can integrate fluid flow, electromigration, electro-osmosis, and geochemical reactions in porous media [53]. Particle transport simulation models must be refined to capture the dynamic behavior of particles under varying environmental conditions, giving a better understanding of transport mechanisms [54]. If we implement algorithms on a pore network, it can give vital information on changes in porosity and connectivity over time, enabling predictions of permeability and fluid flow [55]. Finite-element formulations of coupled electrokinetic transport provide a practical numerical framework for solving these interacting processes [56].
4.2. Comparison with Related Works
Previous DC-EOR investigations provide context for the permeability changes observed here. The contribution of the present study is the documentation of a nonmonotonic effective permeability trajectory during a fixed sequential DC program in oil/brine-saturated Berea sandstone. It does not independently establish a 5–10 V optimum, a non-destructive pore-scale mechanism, or reproducibility under repeated voltage cycles [57,58].
Prior electrokinetic EOR studies have reported permeability or recovery responses in different rock and fluid systems. In the present study, increased effective permeability was observed during the 5 V phase of a sequential program. Because this phase followed prolonged treatment at 40 and 10 V, the data cannot establish whether 5 V alone would produce the same response or whether permanent mineral alteration was absent. Field feasibility remains untested [59,60].
Earlier reviews describe possible electrokinetic transport effects in porous media. The present results document phase-specific effective permeability changes in sandstone but do not directly establish changes in pore connectivity, surface tension, or other pore-scale properties. Those interpretations require independent physical and chemical measurements [61,62].
Related numerical and experimental studies motivate further investigation of electrically assisted recovery. Their field-scale predictions are not validated by the present laboratory dataset, which measured effective permeability rather than incremental oil production. Extrapolation to reservoir-scale sweep efficiency or production gains would require calibrated modelling and field validation.
The present observations provide preliminary data for the design of future experiments. Independent samples, treatment order controls, electrical energy measurements, and direct mechanism tests are needed before broader conclusions can be drawn.
5. Conclusions
This laboratory proof-of-concept study recorded substantial changes in effective permeability during a fixed sequential DC treatment (40 → 10 → 5 → 35 V) lasting 6430 min (107.2 h). Initial measured effective permeabilities ranged from 15 to 85 mD, with reported maxima of 380 mD for water and 153 mD for oil and minima of approximately 2–7 mD. These measurements describe the response to the full treatment sequence; they do not isolate a voltage-specific causal effect.
The largest observed enhancement occurred during the 5 V phase, whereas marked reductions were observed during the preceding 40 V phase. Since the 5 V phase began after approximately 71 h of prior treatment, cumulative and carryover effects cannot be excluded. Therefore, 5 V cannot be identified as an optimal operating voltage from this experiment. Electro-osmosis, particle redistribution, electrochemical precipitation, and gas formation remain unverified candidate mechanisms.
The approach of effective permeability toward earlier values during later phases indicates a changing macroscopic response, but does not establish complete reversibility or the absence of permanent geochemical or structural changes. The residual differences in post-treatment absolute permeability further caution against claims of no lasting alteration.
Because saturation was not independently quantified before and after each electrical treatment stage, the reported effective permeability responses cannot be attributed solely to alterations in pore pathways. The two Sw/So ratios are initial conditions, not verified constant saturations throughout the treatment. Future studies should measure stage-resolved phase saturations and independently determine absolute and relative permeability under matched saturation conditions.
Accordingly, the principal experimental finding is a treatment-sequence-associated variation in phase-specific effective permeability under two distinct initial saturation conditions. The data do not distinguish saturation-driven relative permeability effects from any possible changes in solid pore pathways. Direct saturation monitoring, matched saturation controls, and pore-scale imaging are required to resolve these mechanisms.
The present data do not establish an electrical energy efficiency advantage. In particular, Δk/V is not an energy efficiency metric, and an 800-fold gain is unsupported without phase-resolved current–time records and integrated electrical energy input. The sequential design and lack of independent controls also prevent causal ranking of the tested voltages. No field-scale production response was measured.
No additional chemical EOR agents were injected as part of the electrical treatment; however, the samples were initially saturated with brine and crude oil and were subjected to solvent cleaning during preparation and post-experimental analysis.
To evaluate the lasting impact of electrical stimulation on the core material, absolute permeability was measured before and after experiments using the Klinkenberg-corrected method.
The measured absolute permeabilities before and after the experiments are summarized below. For the 70/30 cores (Sw = 0.7, So = 0.3), absolute permeability decreased from 150 and 300 mD to 142 and 280 mD, respectively. For the 50/50 cores, it decreased from 150 and 300 mD to 135 and 270 mD. These measurements indicate a residual change in absolute permeability after the test, but the cause cannot be assigned specifically to asphaltene deposition, clay redistribution, or pore-throat plugging from the available data. Such mechanisms require direct pre-/post-treatment imaging and compositional analysis for confirmation.
Overall, the study provides preliminary laboratory evidence that effective permeability can vary substantially during sequential DC exposure in oil/brine-saturated sandstone. It does not demonstrate an optimal voltage, confirm a particular pore-scale mechanism, establish an energy efficiency improvement, or validate reservoir-scale oil recovery.
Future work should use matched untreated controls and fresh cores independently assigned to each voltage, randomized or counterbalanced voltage sequences, identical preparation and cleaning procedures, repeated measurements, phase-resolved current logging to calculate E = ∫V(t)I(t)dt, and pore-scale imaging and effluent analyses. Incremental oil recovery measurements and validated upscaling would be required before field-performance claims.
Funding
This research received no external funding.
Institutional Review Board Statement
Not applicable.
Informed Consent Statement
Not applicable.
Data Availability Statement
The original contributions presented in this study are included in the article. Further inquiries can be directed to the corresponding author.
Conflicts of Interest
The author declares no conflict of interest.
References
- Amba, S.A.; Chilingar, G.V.; Beeson, C.M. Use of Direct Electrical Current for Increasing the Flow Rate of Reservoir Fluids During Petroleum Recovery. J. Can. Pet. Technol. 1964, 3, 8–14. [Google Scholar] [CrossRef] [Scilit]
- Wittle, J.K.; Hill, D.G.; Chilingar, G.V. Direct Electric Current Oil Recovery (EEOR)—A New Approach to Enhancing Oil Production. Energy Sources Part A 2011, 33, 805–822. [Google Scholar] [CrossRef] [Scilit]
- Lei, T.; Chen, X.; Ma, S.; Jing, L.; Guan, D. A Global Inventory of Methane Emissions from Abandoned Oil and Gas Wells and Possible Mitigation Pathways. Natl. Sci. Rev. 2025, 12, nwaf184. [Google Scholar] [CrossRef] [Scilit] [PubMed]
- Rehman, M.M.; Meribout, M. Conventional versus electrical enhanced oil recovery: A review. J. Pet. Explor. Prod. Technol. 2012, 2, 169–179. [Google Scholar] [CrossRef] [Scilit]
- Wacker, B.; Karmeileopardus, D.; Trautmann, B.; Helget, A.; Torlak, M. Electromagnetic Heating for In-Situ Production of Heavy Oil and Bitumen Reservoirs. In Proceedings of the Canadian Unconventional Resources Conference, Calgary, AB, Canada, 15–17 November 2011. SPE-148932-MS. [Google Scholar] [CrossRef] [Scilit]
- Sierra, R.; Tripathy, B.; Bridges, J.E.; Farouq Ali, S.M. Promising Progress in Field Application of Reservoir Electrical Heating Methods. In Proceedings of the SPE International Thermal Operations and Heavy Oil Symposium, Porlamar, Venezuela, 12–14 March 2001. SPE-69709-MS. [Google Scholar] [CrossRef]
- Ovalles, C.; Fonseca, A.; Lara, A.; Alvarado, V.; Urrecheaga, K.; Ranson, A.; Mendoza, H. Opportunities of Downhole Dielectric Heating in Venezuela. In Proceedings of the SPE International Thermal Operations and Heavy Oil Symposium, Calgary, AB, Canada, 4–7 November 2002. SPE-78980-MS. [Google Scholar]
- Workman, A. Method of Recovering and Increasing the Production of Oil. U.S. Patent 1,784,214, 9 December 1930. [Google Scholar]
- Sarapuu, E. Method of Underground Electrolinking and Electrocarbonization of Mineral Fuels. U.S. Patent 2,795,279, 11 June 1957. [Google Scholar]
- Bell, G.T. Electrolytically Promoting the Flow of Oil from a Well. U.S. Patent 2,799,641, 16 July 1957. [Google Scholar]
- Gill, W.G. Method and Apparatus for Secondary Recovery of Oil. U.S. Patent 3,507,330, 21 April 1970. [Google Scholar]
- Gill, W.G. Electrical Method and Apparatus for the Recovery of Oil. U.S. Patent 3,542,066, 15 February 1972. [Google Scholar]
- Crowson, F.L.; Gill, W.G. Method and Apparatus for Secondary Recovery of Oil. U.S. Patent 3,605,888, 20 September 1971. [Google Scholar]
- Chilingar, G.V.; El-Nassir, A.; Stevens, R.G. Effect of Direct Electrical Current on Permeability of Sandstone Cores. J. Pet. Technol. 1970, 22, 830–836. [Google Scholar] [CrossRef] [Scilit]
- Tikhomolova, K.P. Electro-Osmosis; Kemp, T.J., Translator; Ellis Horwood: New York, NY, USA, 1993. [Google Scholar]
- Chilingar, G.V.; Chang, K.S.; Davis, J.E.; Farhanghi, H.J.; Adamson, L.G.; Sawabini, S. Possible Use of Direct Electrical Current for Augmenting Reservoir Energy During Petroleum Production. Compass Sigma Gamma Epsil. 1968, 45, 272–285. [Google Scholar]
- Rangel-German, E.R.; Schembre, J.; Sandberg, C.; Kovscek, A.R. Electrical-Heating-Assisted Recovery for Heavy Oil. J. Pet. Sci. Eng. 2004, 45, 213–231. [Google Scholar] [CrossRef] [Scilit]
- Chilingar, G.V.; Haroun, M. (Eds.) Electrokinetics for Petroleum and Environmental Engineers; Scrivener Publishing/Wiley: Hoboken, NJ, USA, 2014. [Google Scholar] [CrossRef] [Scilit]
- Chilingarian, G.V.; Islam, M.R. A New Technique for Recovering Heavy Oil and Tar Sands. Int. J. Sci. Technol. 1995, 2, 15–28. [Google Scholar]
- Islam, M.R. A New Recovery Technique for Gas Production from Alaskan Gas Hydrates. J. Pet. Sci. Eng. 1994, 11, 267–281. [Google Scholar] [CrossRef] [Scilit]
- Hamida, T.; Babadagli, T. Displacement of Oil by Different Interfacial Tension Fluids Under Ultrasonic Waves. Colloids Surf. A Physicochem. Eng. Asp. 2008, 316, 176–189. [Google Scholar] [CrossRef] [Scilit]
- Chilingar, G.V.; Loo, W.W.; Khilyuk, L.F.; Katz, S.A. Electrobioremediation of Soils Contaminated with Hydrocarbons and Metals. Energy Sources 1997, 19, 129–146. [Google Scholar] [CrossRef] [Scilit]
- Tchillingarian, G.V. Possible Utilization of Electrophoretic Phenomenon for Separation of Fine Sediments into Grades. J. Sediment. Res. 1952, 22, 29–32. [Google Scholar] [CrossRef] [Scilit]
- Ghazanfari, E.; Pamukcu, S.; Karpyn, Z.T.; Vahedifard, F. Characterization of Oil-Bearing Sandstones for Sustainable Oil Production in Electrically Enhanced Oil Recovery. In Proceedings of the Geo-Congress 2014: Geo-Characterization and Modeling for Sustainability, Atlanta, GA, USA, 23–26 February 2014; pp. 515–523. [Google Scholar] [CrossRef] [Scilit]
- Wittle, J.K.; Hill, D.G.; Chilingar, G.V. Direct Current Electrical Enhanced Oil Recovery in Heavy-Oil Reservoirs to Improve Recovery, Reduce Water Cut, and Reduce H2S Production While Increasing API Gravity. In Proceedings of the SPE Western Regional and Pacific Section AAPG Joint Meeting, Bakersfield, CA, USA, 31 March–2 April 2008. SPE-114012-MS. [Google Scholar] [CrossRef] [Scilit]
- Ghazanfari, E.; Pamukcu, S. Mathematical Modeling of Electrokinetic Transport and Enhanced Oil Recovery in Porous Geo-Media. In Electrokinetics for Petroleum and Environmental Engineers; Chilingar, G.V., Haroun, M., Eds.; Wiley/Scrivener: Hoboken, NJ, USA, 2014. [Google Scholar] [CrossRef] [Scilit]
- Zhang, L.; Wang, N.; Jing, L.; Fang, C.; Shan, Z.; Li, Y. Electro-Osmotic Chemical Treatment for Marine Clayey Soils: A Laboratory Experiment and a Field Study. Geotech. Test. J. 2017, 40, 72–83. [Google Scholar] [CrossRef] [Scilit]
- Liu, F.; Fu, H.; Zhou, J.; Wang, J.; Cai, Y.; Zhao, R.; Lou, X.; Jin, Y.; Yuan, W. Vacuum Preloading Combined with Intermittent Electro-Osmosis for Dredged Slurry Strengthening. Geotech. Test. J. 2020, 43, 775–790. [Google Scholar] [CrossRef] [Scilit]
- Han, D.; Wu, X.; Li, R.; Tang, X.; Xiao, S.; Scholz, M. Critical Review of Electro-Kinetic Remediation of Contaminated Soils and Sediments: Mechanisms, Performances and Technologies. Water Air Soil Pollut. 2021, 232, 335. [Google Scholar] [CrossRef] [Scilit]
- Keglevic, K. In Situ Heavy-Oil Upgrading by Electric Enhanced Oil Recovery: Complex Carbonate Heavy-Oil Field Case. In Proceedings of the SPE International Heavy Oil Conference and Exhibition, Kuwait City, Kuwait, 10–12 December 2018. [Google Scholar] [CrossRef] [Scilit]
- Jia, Z.; Ning, Z.; Lyu, F. Laboratory Evaluation of Electrically Enhanced Oil Recovery in Tight Reservoirs. Energy Fuels 2024, 38, 200–213. [Google Scholar] [CrossRef] [Scilit]
- Ghazanfari, E.; Pamukcu, S.; Pervizpour, M.; Karpyn, Z. Investigation of Generalized Relative Permeability Coefficients for Electrically Assisted Oil Recovery in Oil Formations. Transp. Porous Media 2014, 105, 235–253. [Google Scholar] [CrossRef] [Scilit]
- Peraki, M.; Ghazanfari, E.; Pinder, G.F. Numerical Investigation of Two-Phase Flow Encountered in Electrically Enhanced Oil Recovery. J. Pet. Explor. Prod. Technol. 2018, 8, 1505–1518. [Google Scholar] [CrossRef] [Scilit]
- Ansari, A.; Haroun, M.; Al Kindy, N.; Ali, B.; Shrestha, R.A.; Sarma, H. Electrokinetics Assisted Surfactant-EOR to Optimize Mature Waterfloods in Abu Dhabi Carbonate Reservoirs. In Proceedings of the SPE Asia Pacific Oil and Gas Conference and Exhibition, Jakarta, Indonesia, 22–24 October 2013. SPE-165909-MS. [Google Scholar]
- Ikpeka, P.M.; Ugwu, J.O.; Pillai, G.G.; Russell, P. Effectiveness of Electrokinetic-Enhanced Oil Recovery (EK-EOR): A Systematic Review. J. Eng. Appl. Sci. 2022, 69, 60. [Google Scholar] [CrossRef] [Scilit]
- Wittle, J.K.; Bell, C.W. Electrochemical Process for Effecting Redox-Enhanced Oil Recovery. U.S. Patent 6,877,556, 12 April 2005. [Google Scholar]
- Wittle, J.K.; Bell, C.W. Method for Enhancing Oil Production Using Electricity. U.S. Patent 7,325,604 B2, 5 February 2008. [Google Scholar]
- Rudyk, S.N.; Taura, U.; Al-Jahwary, M. Enhancing oil recovery by electric current impulses well treatment: A case of marginal field from Oman. Fuel 2022, 314, 123115. [Google Scholar] [CrossRef] [Scilit]
- Ghosh, B.; Al Shalabi, E.W.; Haroun, M. The Effect of DC Electrical Potential on Enhancing Sandstone Reservoir Permeability and Oil Recovery. Pet. Sci. Technol. 2012, 30, 2148–2159. [Google Scholar] [CrossRef] [Scilit]
- Al Shalabi, E.W.; Ghosh, B.; Haroun, M.; Pamukcu, S. The Application of Direct Current Potential to Enhancing Waterflood Recovery Efficiency. Pet. Sci. Technol. 2012, 30, 2160–2168. [Google Scholar] [CrossRef] [Scilit]
- Green, D.W.; Willhite, G.P. Enhanced Oil Recovery; SPE Textbook Series; Society of Petroleum Engineers: Richardson, TX, USA, 1998; Volume 6. [Google Scholar]
- Smalls, P.T.; Villamor-Lora, R.; Germaine, J.T.; Einstein, H.H. Joule Heating of Brine Saturated Berea Sandstone: Observations from DC Electric Current. In Proceedings of the 57th U.S. Rock Mechanics/Geomechanics Symposium, Atlanta, GA, USA, 25–28 June 2023. [Google Scholar] [CrossRef] [Scilit]
- Lashgari, H.R.; Delshad, M.; Sepehrnoori, K.; de Rouffignac, E. Development and Application of Electrical-Joule-Heating Simulator for Heavy-Oil Reservoirs. SPE J. 2016, 21, 87–100. [Google Scholar] [CrossRef] [Scilit]
- Leng, Y. Materials Characterization: Introduction to Microscopic and Spectroscopic Methods, 2nd ed.; Wiley-VCH: Weinheim, Germany, 2013. [Google Scholar] [CrossRef] [Scilit]
- Qiao, J.; Ni, Z.; Tong, Y.; Xu, S.; Zhao, Q.; Liu, L.; Liu, Q.; Tang, X. Influence of Weathering on the Physicomechanical Properties of Sandstone: Multi-Scale Analysis. J. Rock Mech. Geotech. Eng. 2026; in press. [CrossRef] [Scilit]
- Hu, W.; Cheng, W.-C.; Wen, S. Investigating the Effect of Degree of Compaction, Initial Water Content, and Electric Field Intensity on Electrokinetic Remediation of an Artificially Cu- and Pb-Contaminated Loess. Acta Geotech. 2023, 18, 937–949. [Google Scholar] [CrossRef] [Scilit]
- Xiao, J.; Zhou, S. Effect of Electrode Materials on Electrokinetic Remediation of Uranium Contaminated Soil. IOP Conf. Ser. Earth Environ. Sci. 2019, 300, 032074. [Google Scholar] [CrossRef] [Scilit]
- Gallo, A.; Sprocati, R.; Islam, K.T.; Rolle, M. Combined Effects of Porosity, Tortuosity and Pore Water Composition on Electrokinetic Transport Dynamics in Porous Media. Electrochim. Acta 2025, 524, 145969. [Google Scholar] [CrossRef] [Scilit]
- Vane, L.M.; Zang, G.M. Effect of Aqueous Phase Properties on Clay Particle Zeta Potential and Electro-Osmotic Permeability: Implications for Electro-Kinetic Soil Remediation Processes. J. Hazard. Mater. 1997, 55, 1–22. [Google Scholar] [CrossRef] [Scilit]
- Yasuhara, H.; Kinoshita, N.; Ohfuji, H.; Takahashi, M.; Ito, K.; Kishida, K. Long-Term Observation of Permeability in Sedimentary Rocks under High-Temperature and Stress Conditions and Its Interpretation Mediated by Microstructural Investigations. Water Resour. Res. 2015, 51, 5425–5449. [Google Scholar] [CrossRef] [Scilit]
- Wen, M.; Harpers, N.; Inskip, N.F.; Buckman, J.; Singh, K.; Miller, P.; Busch, A. Mechanical Responses and Permeability Evolution in Porous Sandstones Under Cyclic Loading Conditions: Implications for Subsurface Hydrogen Storage. Rock Mech. Rock Eng. 2025, 58, 10643–10673. [Google Scholar] [CrossRef] [Scilit]
- Potysz, A.; Bartz, W. Bioweathering of Minerals and Dissolution Assessment by Experimental Simulations—Implications for Sandstone Rocks: A Review. Constr. Build. Mater. 2022, 316, 125862. [Google Scholar] [CrossRef] [Scilit]
- Sprocati, R.; Masi, M.; Muniruzzaman, M.; Rolle, M. Modeling Electrokinetic Transport and Biogeochemical Reactions in Porous Media: A Multidimensional Nernst–Planck–Poisson Approach with PHREEQC Coupling. Adv. Water Resour. 2019, 127, 134–147. [Google Scholar] [CrossRef] [Scilit]
- Babakhani, P.; Bridge, J.; Doong, R.-A.; Phenrat, T. Continuum-Based Models and Concepts for the Transport of Nanoparticles in Saturated Porous Media: A State-of-the-Science Review. Adv. Colloid Interface Sci. 2017, 246, 75–104. [Google Scholar] [CrossRef] [Scilit] [PubMed]
- Raeini, A.Q.; Bijeljic, B.; Blunt, M.J. Reliability of Algorithms Interpreting Topological and Geometric Properties of Porous Media for Pore Network Modelling. Transp. Porous Media 2019, 128, 271–301. [Google Scholar] [CrossRef] [Scilit]
- Paz-García, J.M.; Johannesson, B.; Ottosen, L.M.; Ribeiro, A.B.; Rodríguez-Maroto, J.M. Modeling of Electrokinetic Processes by Finite Element Integration of the Nernst–Planck–Poisson System of Equations. Sep. Purif. Technol. 2011, 79, 183–192. [Google Scholar] [CrossRef] [Scilit]
- Zhang, W.; Ning, Z.; Zhang, B.; Wang, Q.; Cheng, Z.; Huang, L.; Qi, R.; Shang, X. Experimental Investigation of Driving Brine Water for Enhanced Oil Recovery in Tight Sandstones by DC Voltage. J. Pet. Sci. Eng. 2019, 180, 485–494. [Google Scholar] [CrossRef] [Scilit]
- Xie, Y.-W.; Li, H.-Y.; Zhang, C.-Y.; Su, Y.; Huang, Q.; Jiang, F.; Chen, C.-H.; Han, S.-P.; Zhang, J.-J. A Further Investigation to Mechanism of the Electrorheological Effect of Waxy Oils: Behaviors of Charged Particles under Electric Field. Pet. Sci. 2023, 20, 1247–1254. [Google Scholar] [CrossRef] [Scilit]
- Amrouche, F.; Blunt, M.J.; Iglauer, S.; Aiouache, F.; Short, M. A Novel Hybrid Enhanced Oil Recovery Technique to Enhance Oil Production from Oil-Wet Carbonate Reservoirs by Combining Electrical Heating with Nanofluid Flooding. Mater. Today Sustain. 2024, 27, 100915. [Google Scholar] [CrossRef] [Scilit]
- Li, Q.; Ning, Z.; Li, J.; Jia, Z. Laboratory Study on the Transformation of Oil-Water Interface Properties under Direct Current Electric Field. Geoenergy Sci. Eng. 2024, 239, 212953. [Google Scholar] [CrossRef] [Scilit]
- Bogdanov, I.I.; Torres, J.A.; Akhlaghi, H.A.; Kamp, A.M. The Influence of Salt Concentration in Injected Water on Low-Frequency Electrical-Heating-Assisted Bitumen Recovery. SPE J. 2011, 16, 548–558. [Google Scholar] [CrossRef] [Scilit][Green Version]
- Ace, A.G. An Investigation of the Influence of Applied Electrical Potential Gradients on Flow of Fluids in Porous Media. Master’s Thesis, University of Southern California, Los Angeles, CA, USA, 1955. [Google Scholar]
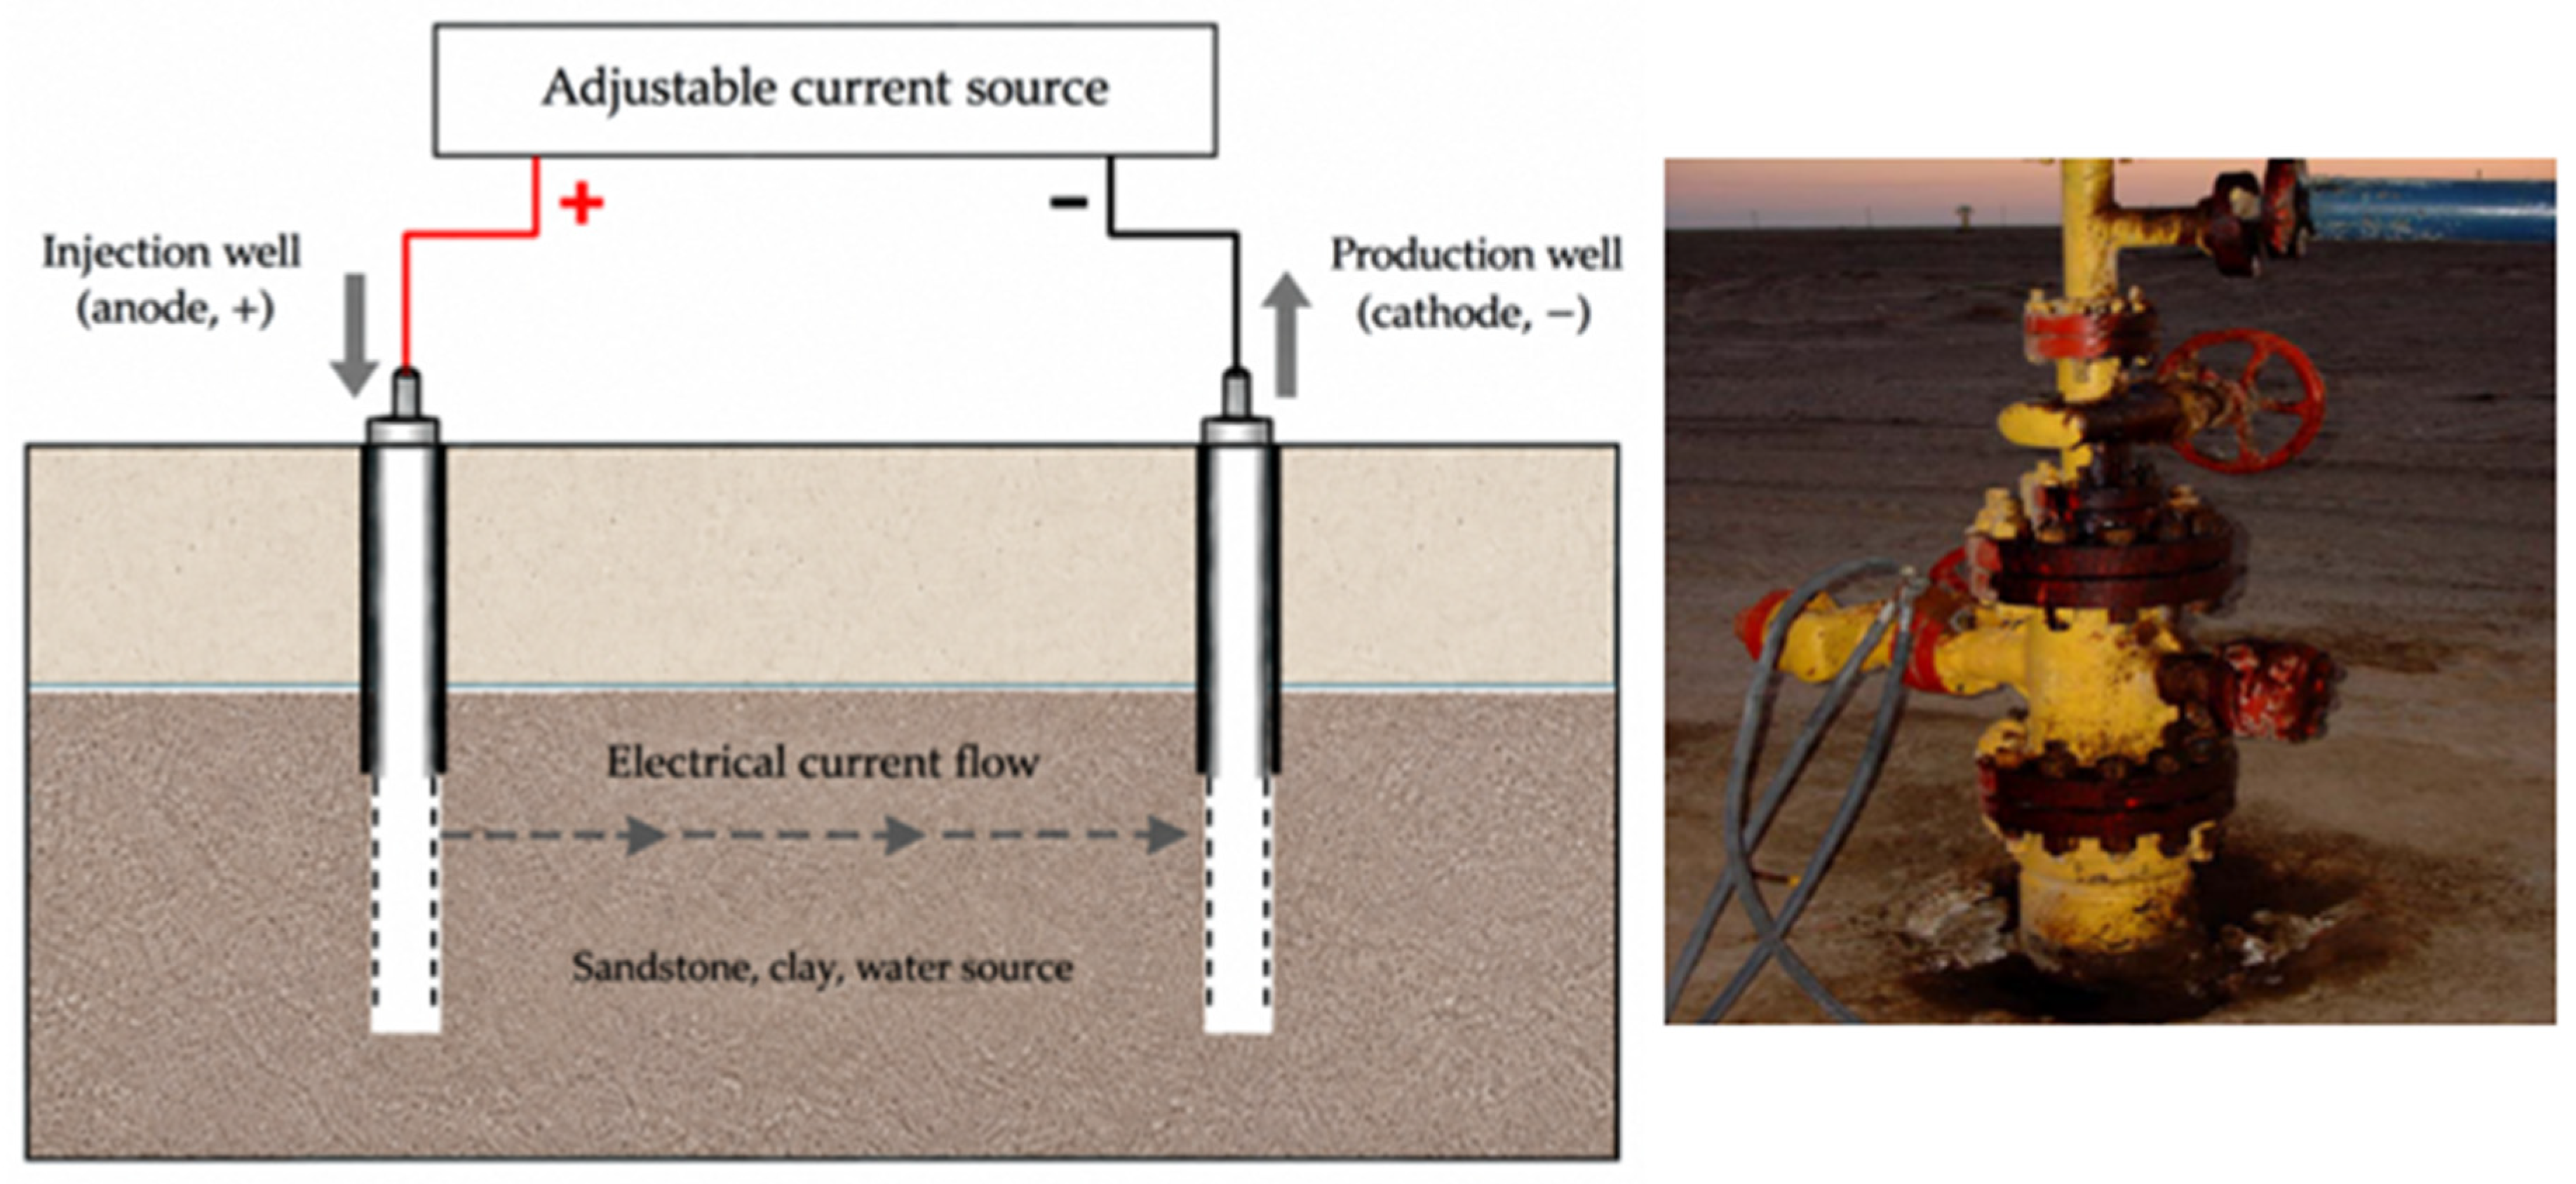
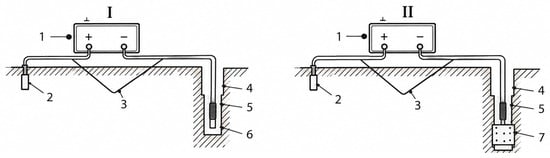
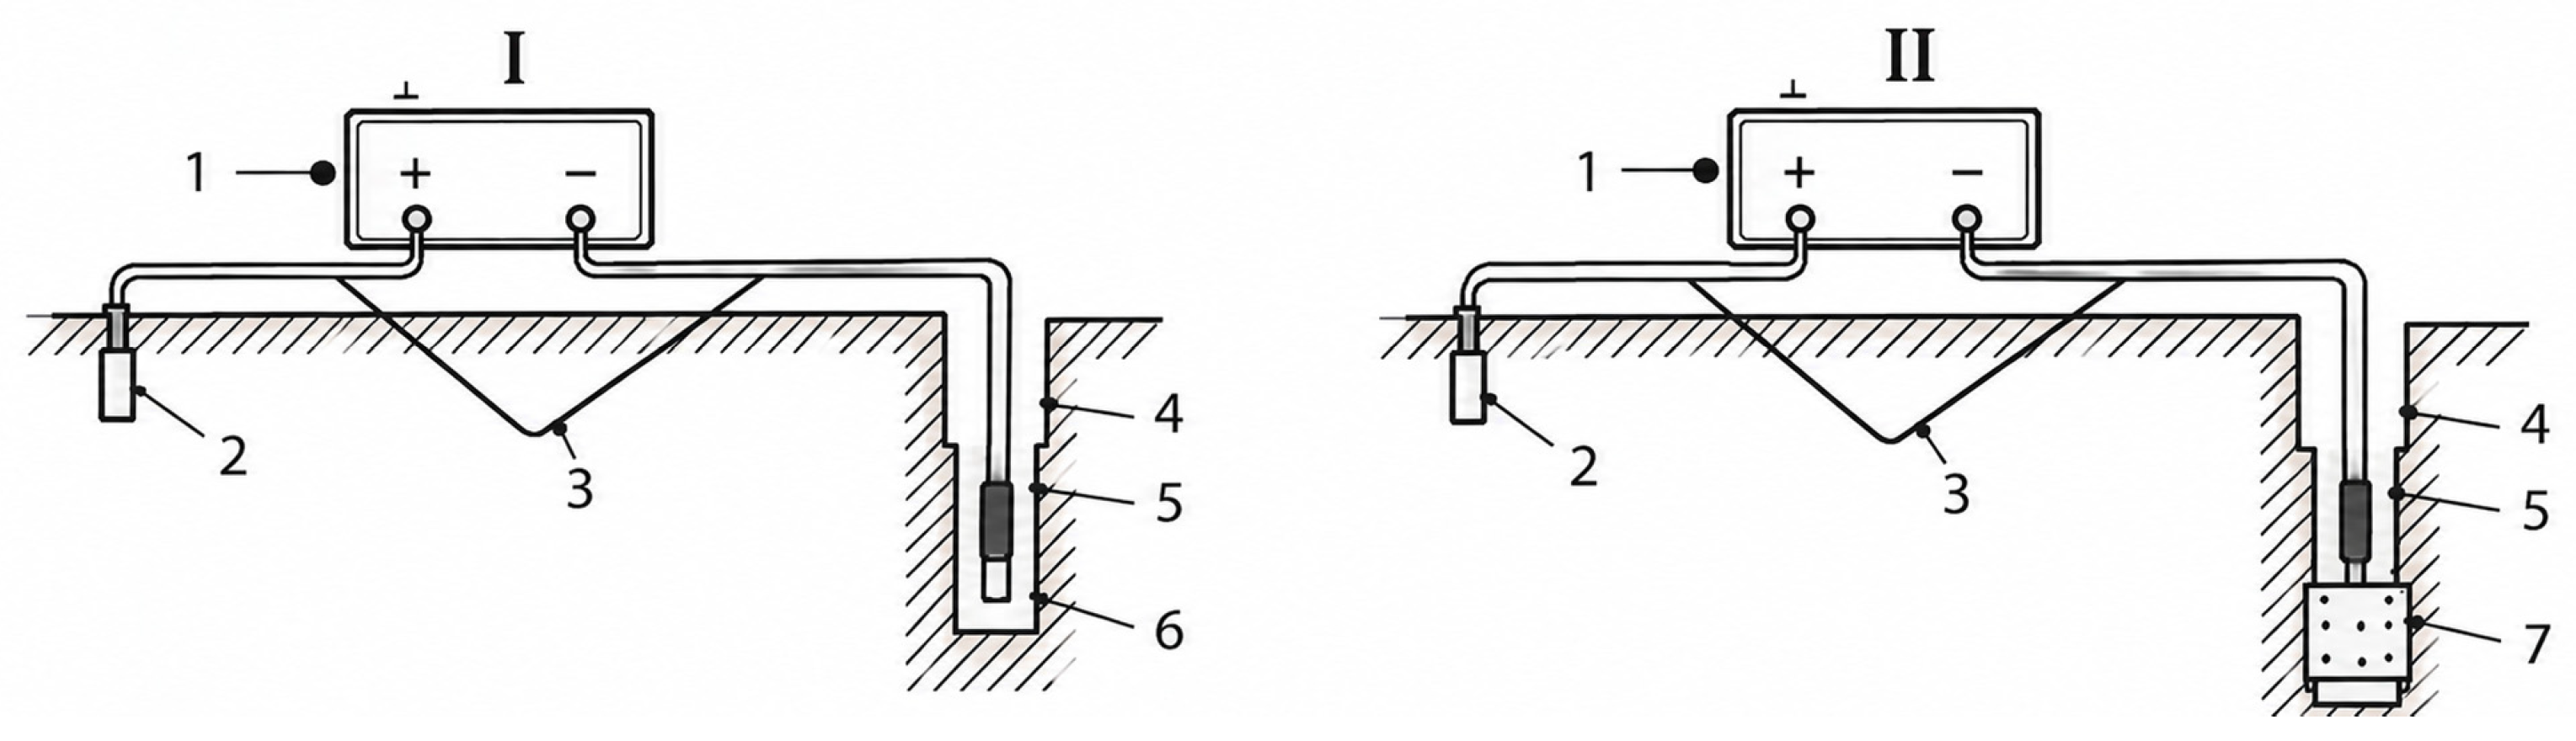
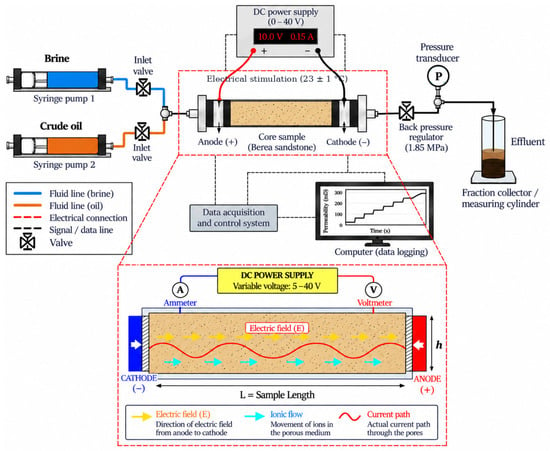
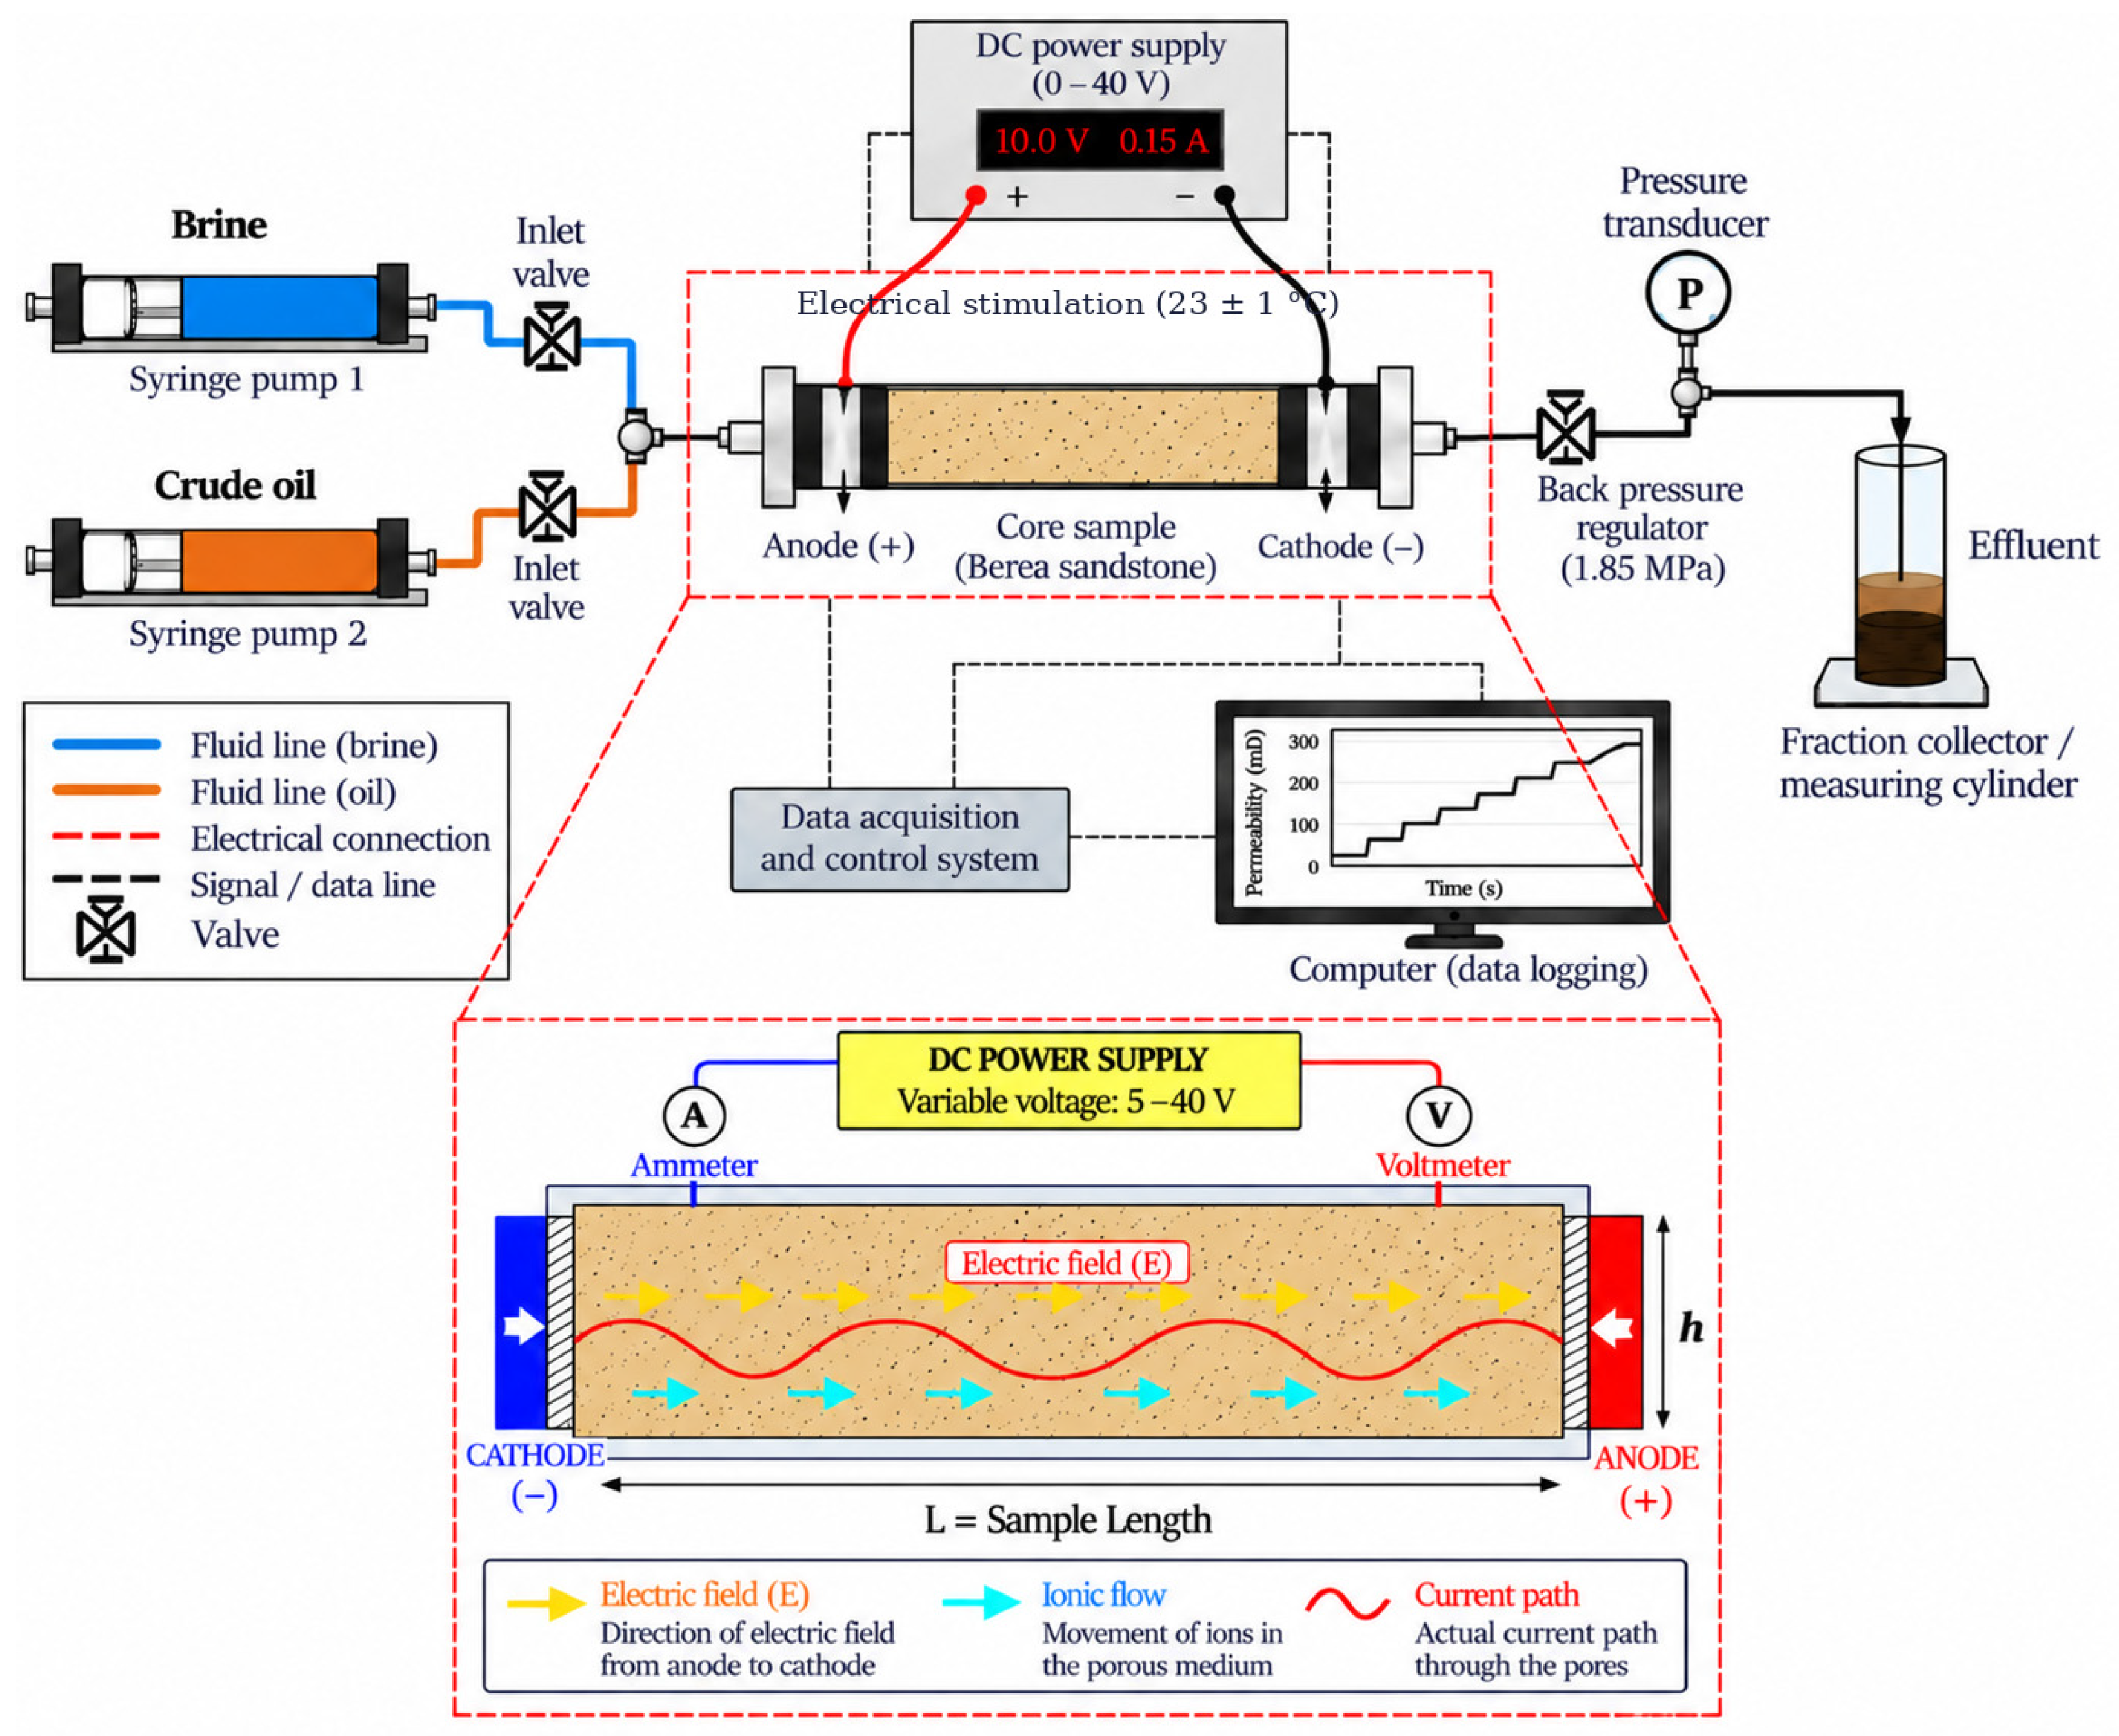
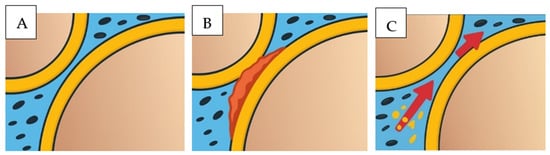
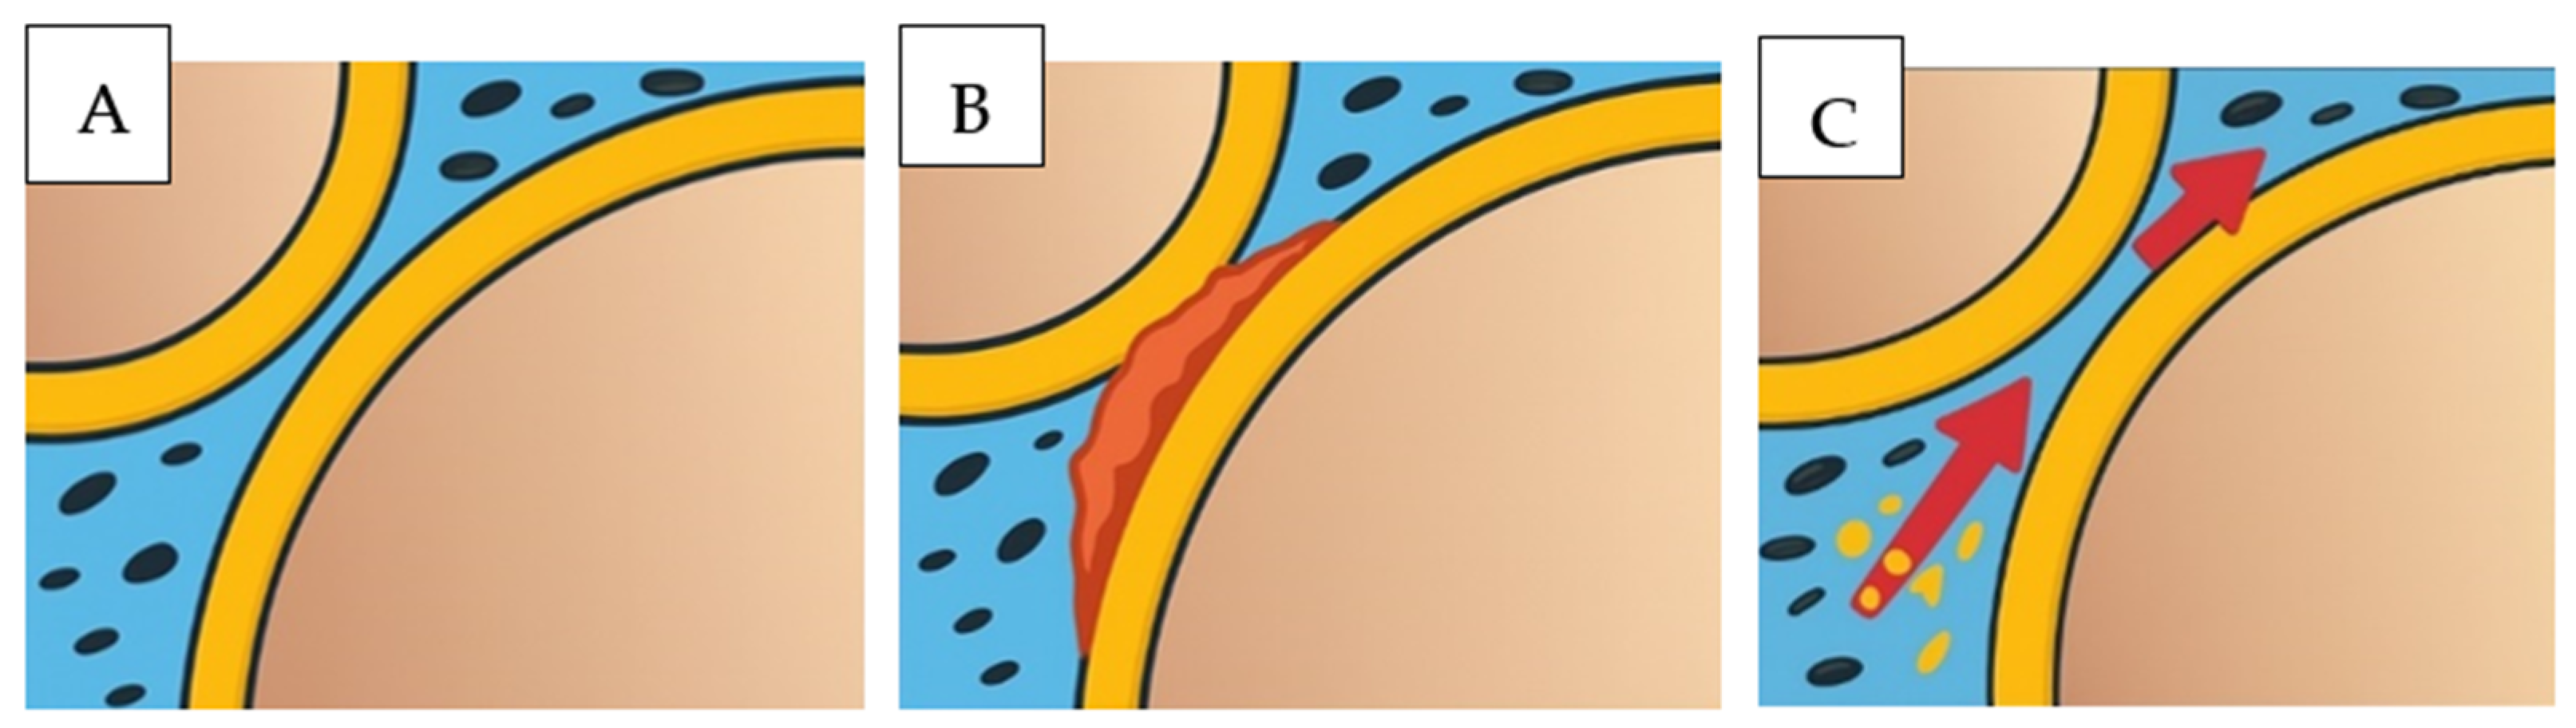
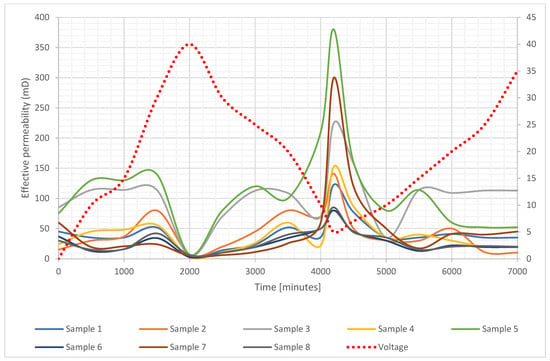
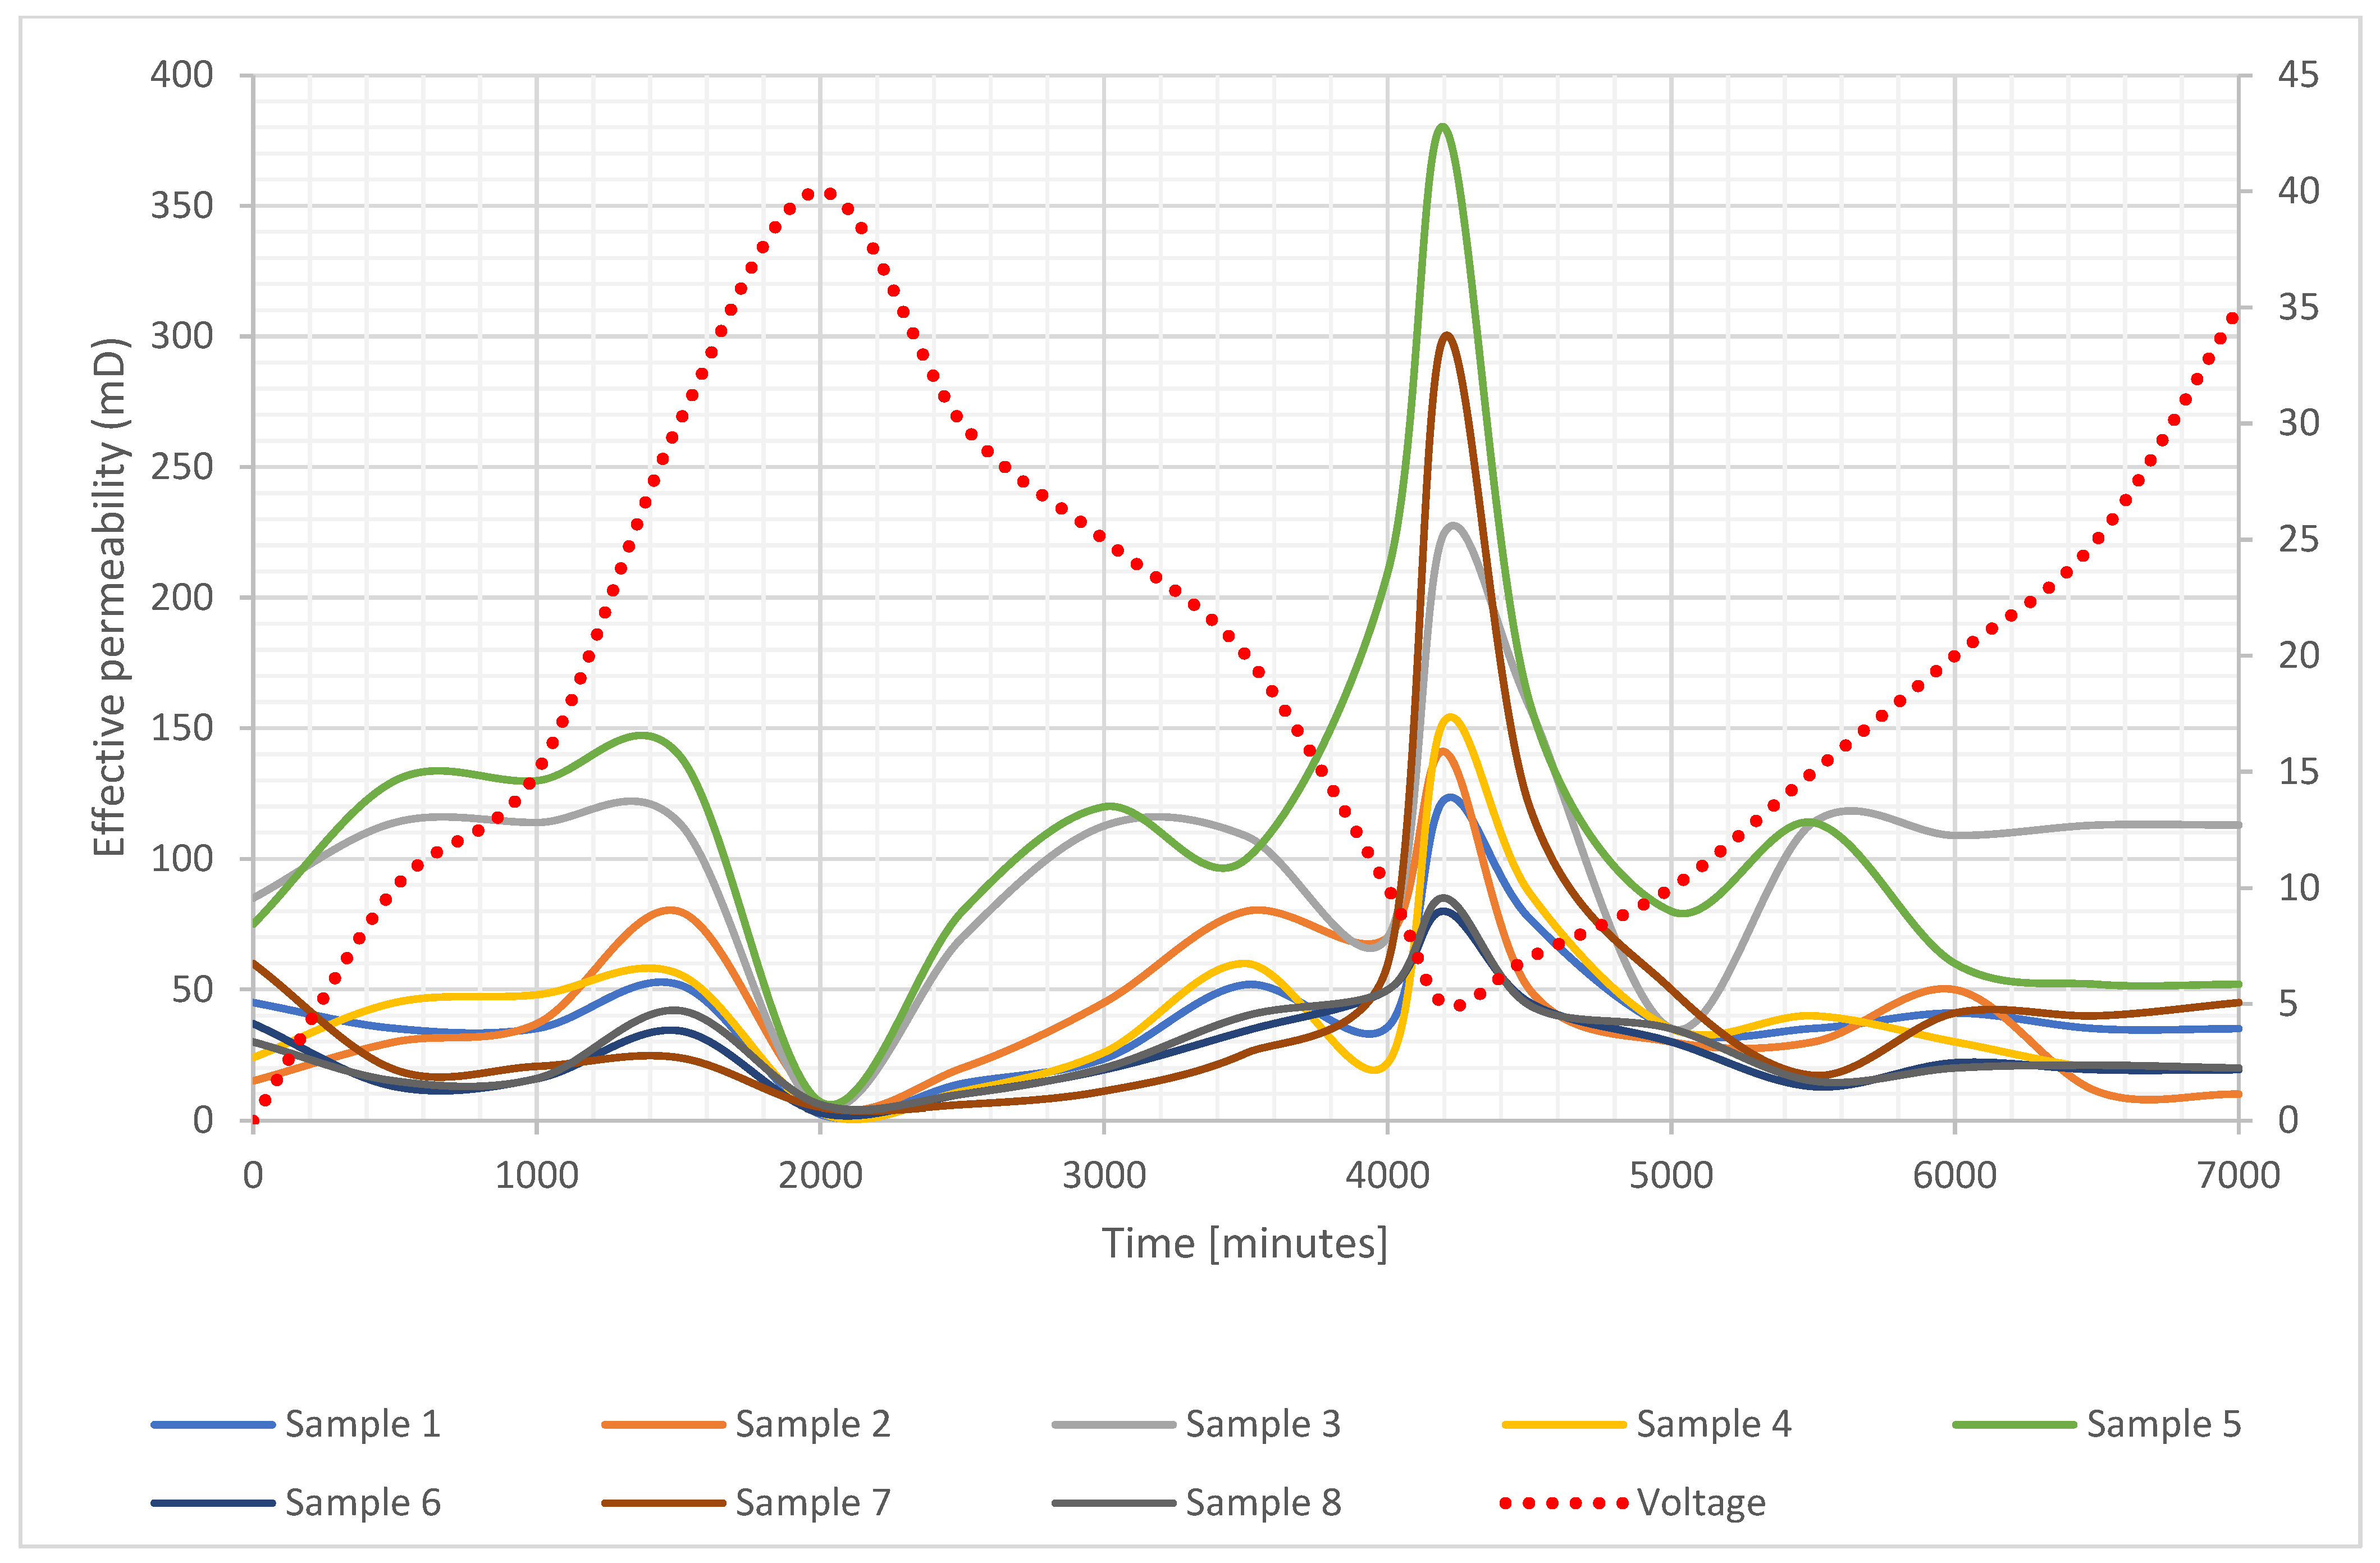
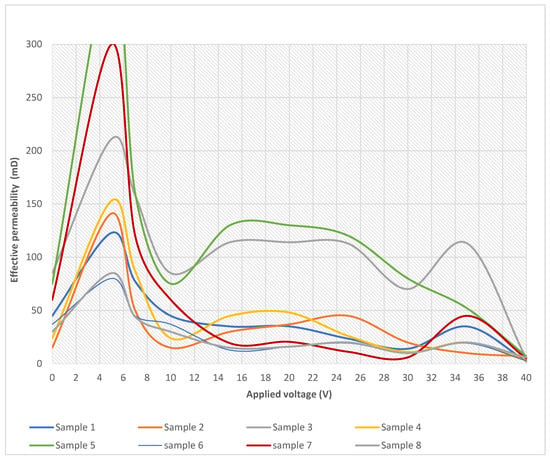
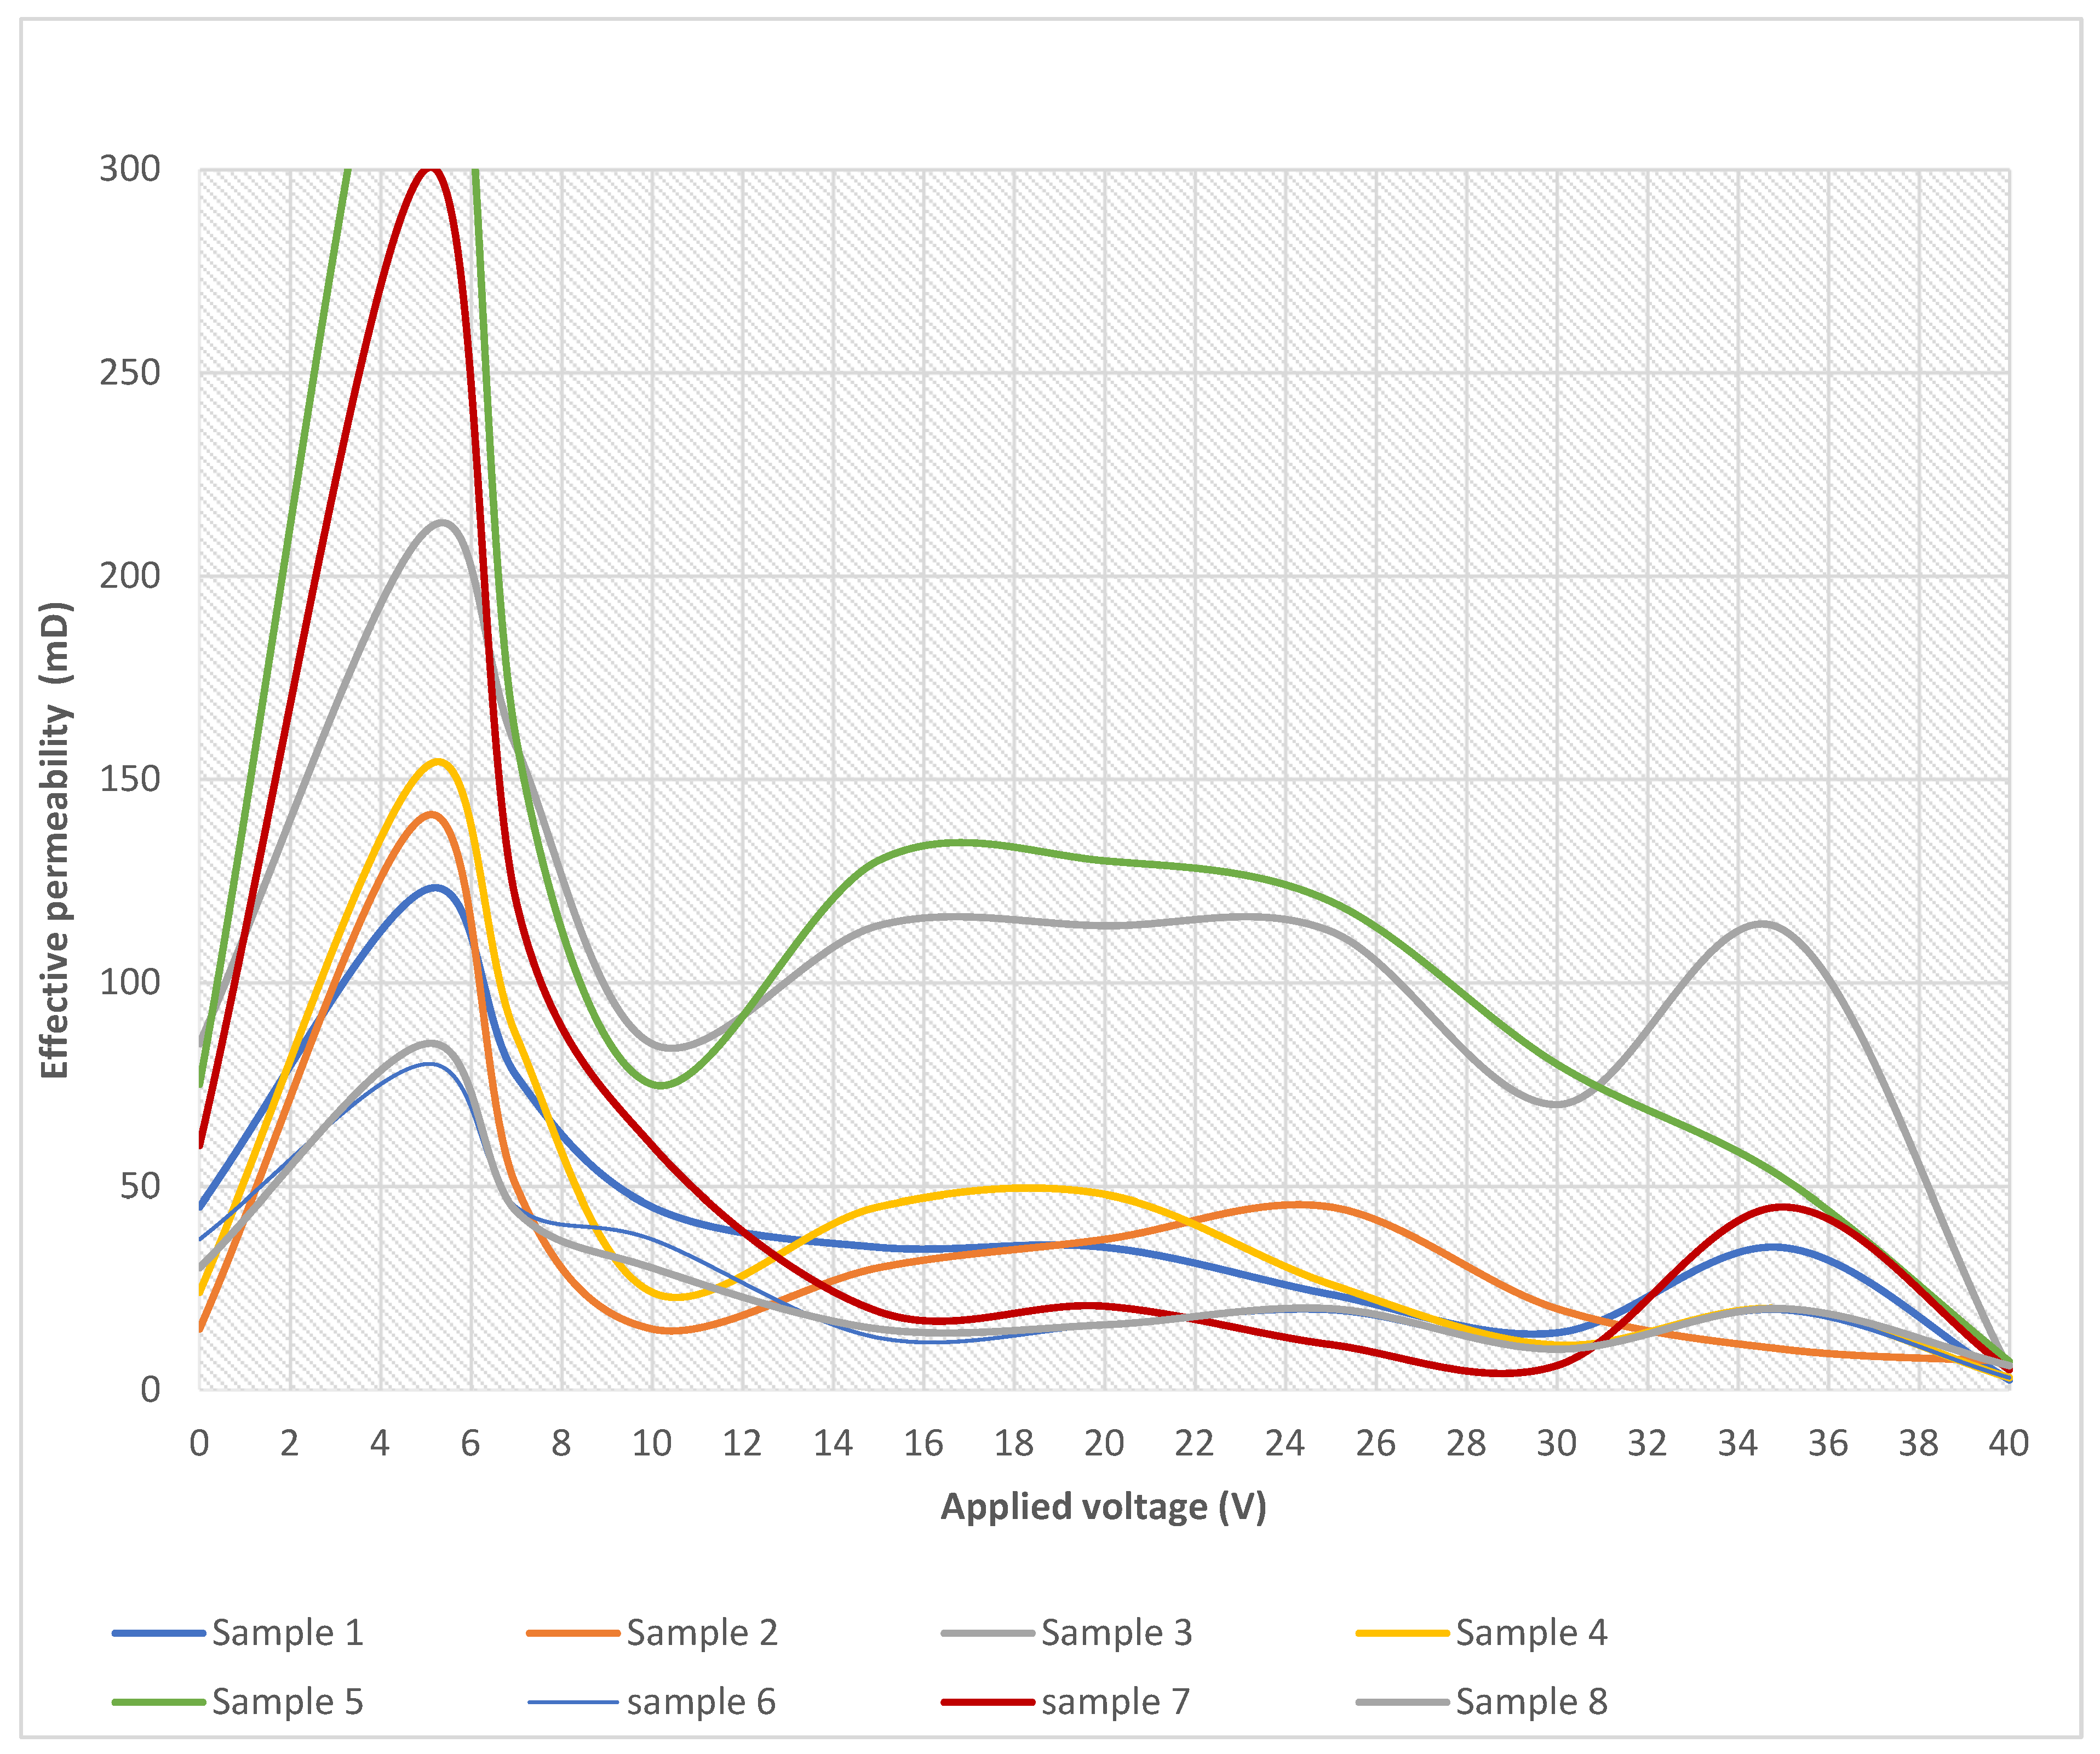
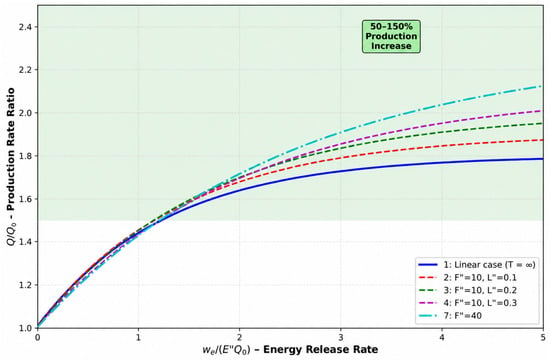
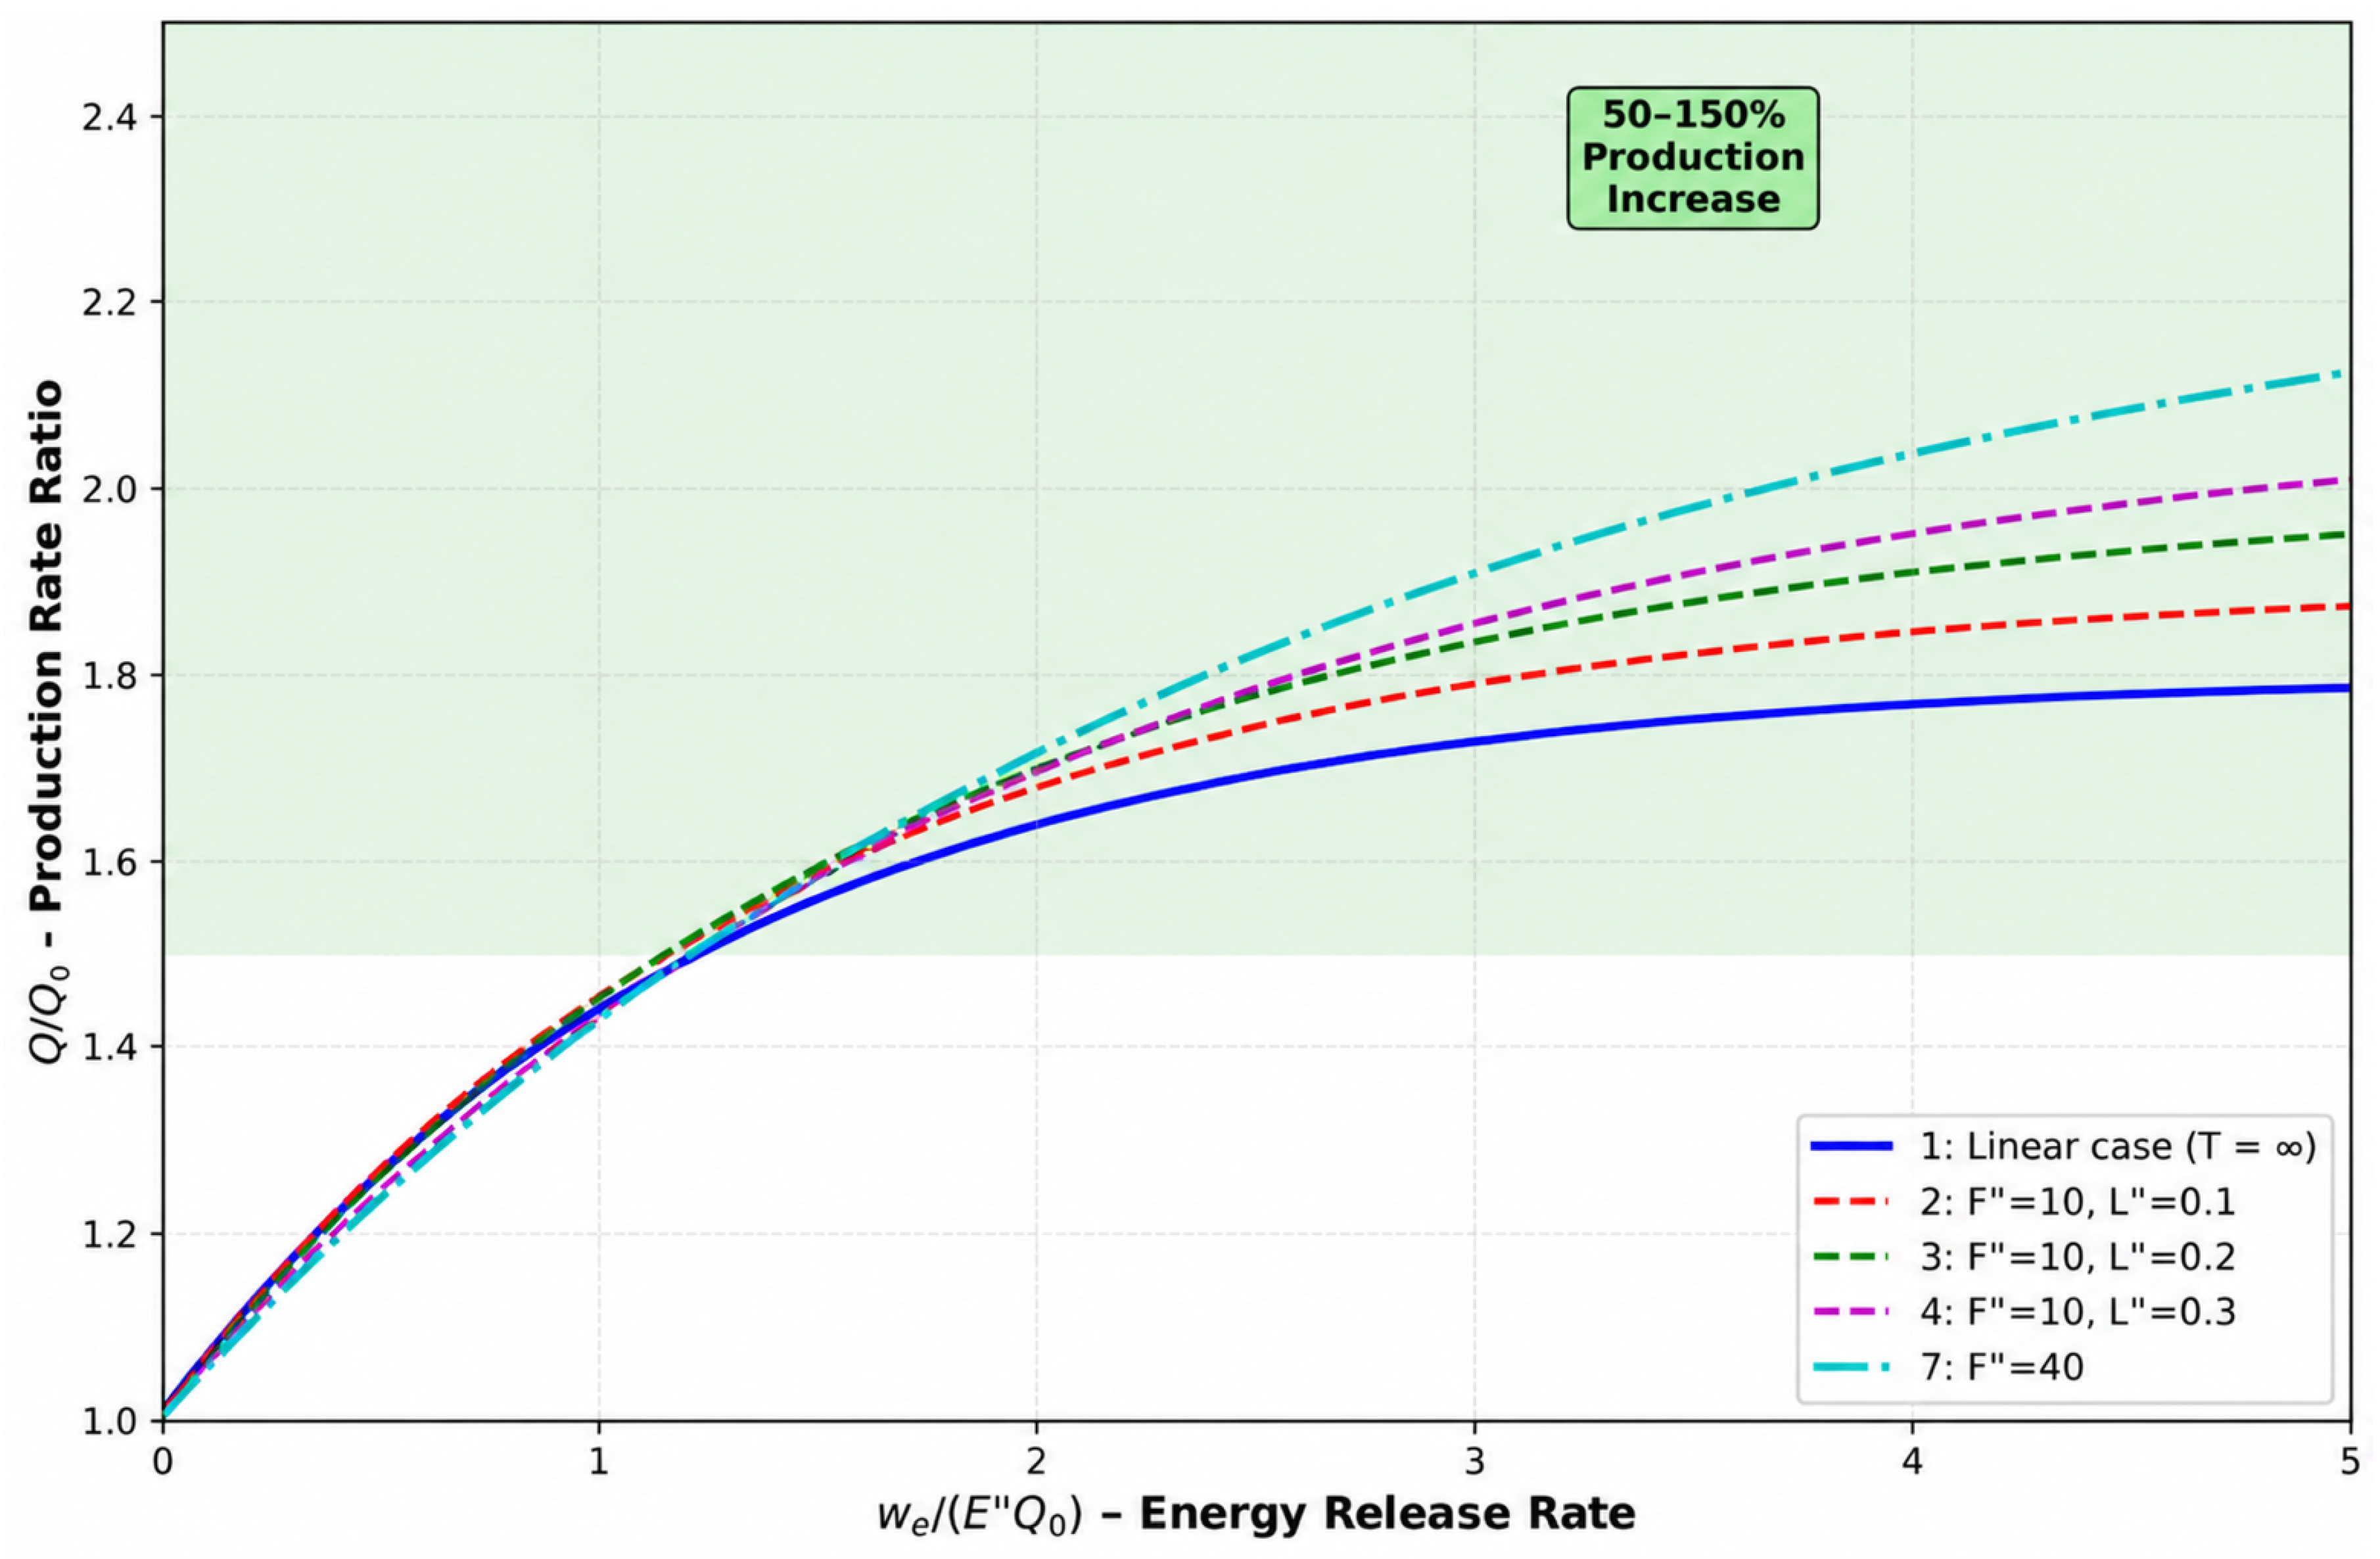
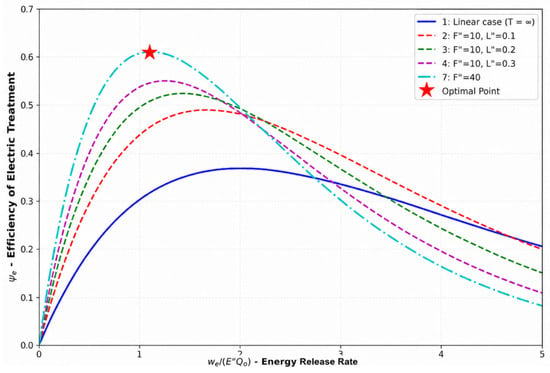
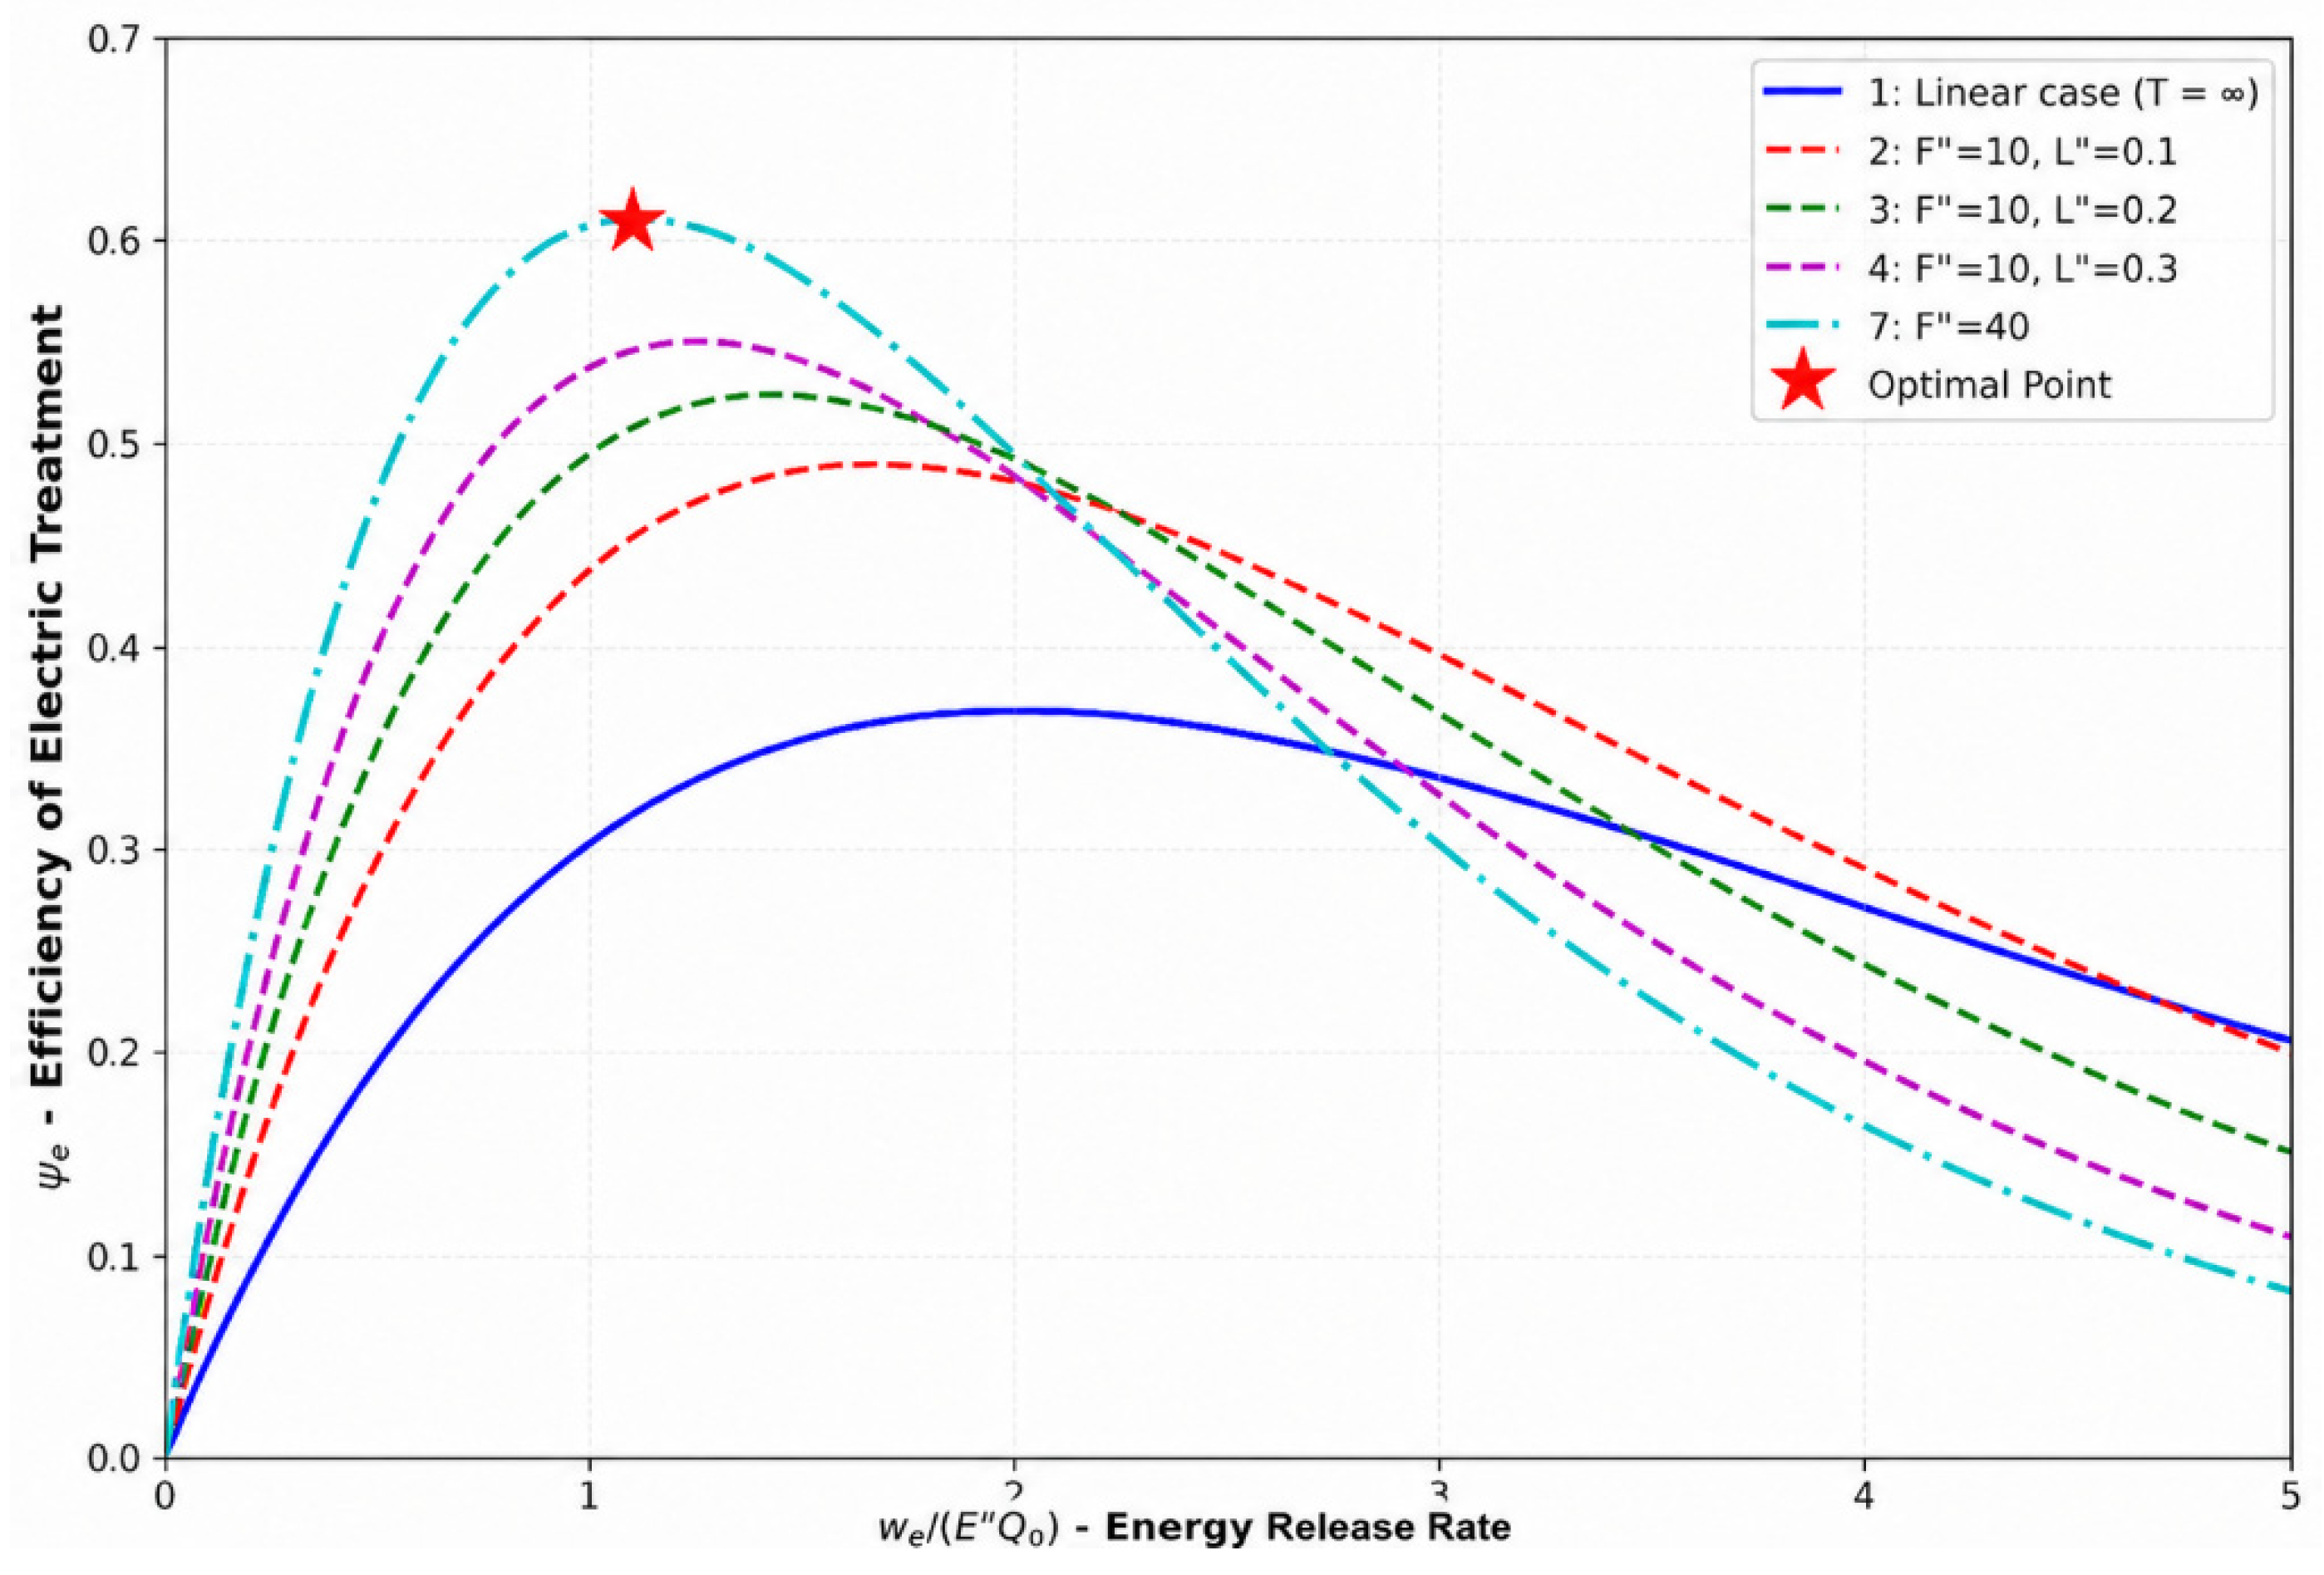

Disclaimer/Publisher’s Note: The statements, opinions and data contained in all publications are solely those of the individual author(s) and contributor(s) and not of MDPI and/or the editor(s). MDPI and/or the editor(s) disclaim responsibility for any injury to people or property resulting from any ideas, methods, instructions or products referred to in the content. |
© 2026 by the author. Licensee MDPI, Basel, Switzerland. This article is an open access article distributed under the terms and conditions of the Creative Commons Attribution (CC BY) license.