


Abstract
With the increasing penetration of intermittent renewable energy, combined-cycle power plants are increasingly operated under frequent and deep load-following conditions. Under such conditions, transient irreversibility and its coupling with seasonal boundary changes cannot be adequately characterized by conventional steady-state analysis. Therefore, this paper constructs a dynamic analysis framework based on actual operational data. The first- and second-order rates of change in component exergy destruction are introduced to quantify the direction, intensity, and acceleration of thermodynamic deterioration during winter and summer load ramp-ups and ramp-downs. The results reveal a hierarchical dynamic response. The combustion chamber and gas turbine exhibit the highest and nearly synchronous sensitivity, whereas the heat recovery steam generator (HRSG) and steam turbine respond later and their fluctuations persist longer because of water-/steam-side thermal inertia. The air compressor, condenser, and fuel heater are comparatively insensitive. Load direction and season jointly produce pronounced asymmetric behavior. Winter transients generally exhibit stronger and longer-lasting exergy fluctuations than summer transients. Based on the dynamic diagnosis and engineering adjustability, HRSG feedwater flow is selected as the optimization variable. A feedwater-response adjustment scheme, guided by dynamic exergy analysis, is evaluated through offline calculations and comparisons with historical plant operating data. Relative to the original operation, the maximum relative reduction in HRSG exergy destruction is 20.14%, and the maximum relative increase in exergy efficiency is 7.56%.
1. Introduction
As environmental pollution and carbon emissions associated with coal-fired power generation become increasingly prominent [1,2,3], renewable energy accounts for a growing share of installed capacity and electricity generation in modern power systems. Consequently, the grid requires faster, deeper peak-regulation capability. Combined-cycle power plants (CCPPs) feature rapid start-ups and shutdowns, flexible load regulation, and low pollutant emissions [4]. They have therefore become important peak regulation resources for renewable energy integration and stable grid operation. However, prolonged operation under off-design conditions and frequent load ramping can substantially reduce system efficiency. Both thermal and exergy efficiencies deteriorate as the unit departs from its design point [4,5]. Such an operation can also degrade the thermodynamic performance of critical components, thereby compromising operating economy and safety.
Most existing studies have focused on steady-state thermodynamic analyses of combined-cycle systems. These studies identify the combustion chamber (CC) as the component with the greatest exergy destruction [6,7,8,9,10] and quantify component-level exergy destruction and exergy efficiency through energy–exergy analysis [11,12,13,14]. Thermoeconomic methods have also been incorporated into systems analysis and multi-objective optimization to improve performance and economic viability simultaneously [15,16,17,18,19,20]. These studies generally optimize operating parameters and component performance at prescribed operating points, mostly through simulation [11,21,22,23,24]. Their optimization results may therefore be difficult to apply to combined-cycle units that undergo frequent changes in operating conditions. Most remain at the level of theoretical analysis or numerical simulation and offer limited engineering implementability. In contrast, operating combined-cycle units exhibit pronounced dynamic behavior, and their operating parameters continuously vary with time [25]. Steady-state analysis cannot adequately characterize the temporal evolution of internal irreversibility under transient conditions. Accordingly, several studies have investigated dynamic exergy analysis [26,27]. They revealed time-dependent variations in component exergy destruction and exergy efficiency during changes in operating conditions. However, these studies mainly examined the state variables themselves. State variables alone cannot fully reveal component sensitivity to load disturbances. This limitation hinders the identification of dynamically sensitive components and the development of targeted optimization measures. To address this issue, Hao et al. [28] proposed dynamic exergy indicators that reflect exergy inertia, sensitivity, and stability of the working fluid. They identified the most sensitive components in a power plant boiler and provided a new basis for sensitivity analysis under dynamic conditions. However, their work focused mainly on a single item of equipment, such as a boiler. Dynamic exergy behavior across the key components of a combined-cycle unit during complex load transients remains insufficiently characterized. Therefore, a criterion is still needed to quantify component-level dynamic exergy variation during load ramping. Such a criterion would support the identification of sensitive components and optimization decisions for dynamic operation.
The operating performance of a combined-cycle unit is strongly affected by ambient conditions, particularly ambient temperature [29]. As ambient temperature increases, both maximum power output and operating efficiency decrease [30,31,32]. For an operating combined-cycle unit, ambient temperature is not a constant boundary condition and varies considerably with the season. Seasonal changes alter both the system boundaries and the unit operating mode. For the unit investigated here, summer peak demand requirements lead to more frequent start-ups, shutdowns, and variable-load operations. During the summer, both the duration of grid-connected operation and electricity generation were significantly higher than in the winter. Therefore, there are significant seasonal variations in the operating conditions of this unit. Under high-frequency peak regulation, frequent load ramping also produces distinct dynamic responses among components [33,34]. Previous studies show that the steam cycle responds with a clear delay because of its greater thermal inertia. Its stabilization time is substantially longer than that of the gas turbine side. Although previous studies have examined combined-cycle dynamic responses and load change behavior, most have used power output, temperature variation, or response time as the principal metrics. Component dynamic response has rarely been evaluated from an exergy perspective.
Accordingly, this study uses measured operating data from an F-class CCPP. A component sensitivity criterion based on exergy destruction analysis is proposed for variable-load operation. The criterion quantitatively characterizes the sensitivity of each component during load transients. The exergy destruction behavior of the key components is then analyzed during load ramp-up and ramp-down to identify the most sensitive thermodynamic components. Component exergy destruction distributions and their variations are further evaluated under different seasonal ambient conditions. This analysis reveals asymmetric responses between load ramp-up and ramp-down and clarifies their seasonal differences. Finally, components with potential for operational improvement are identified, and an engineering-oriented adjustment analysis is conducted under variable-load conditions.
2. System Description and Thermodynamic Model
2.1. Unit Summary and Data Acquisition
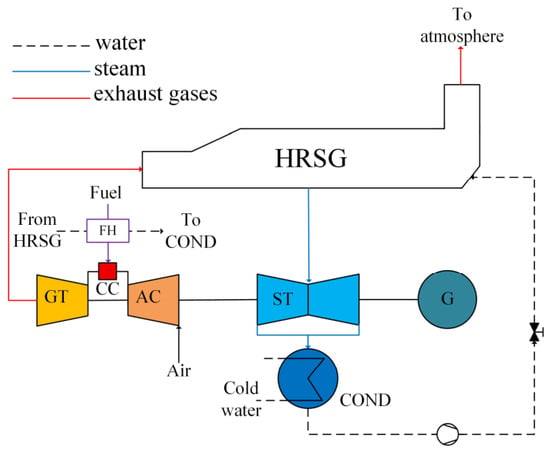
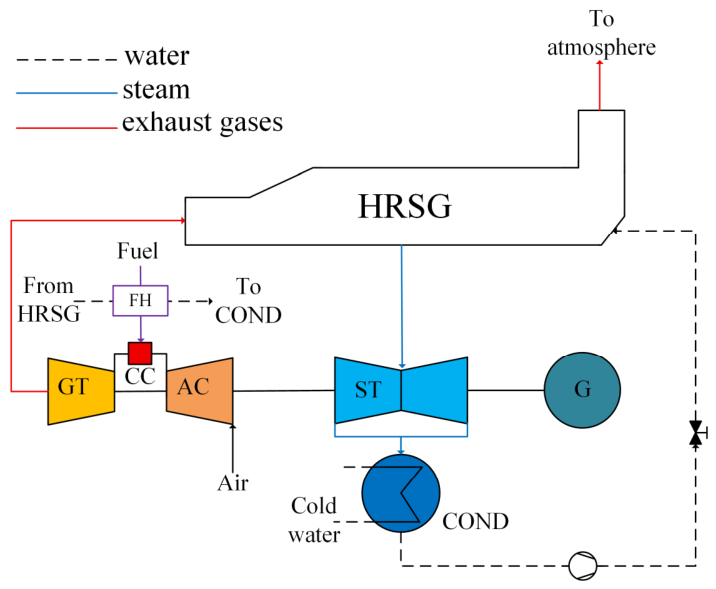
The investigated system is an S109FA combined-cycle unit with a single-shaft arrangement. It mainly comprises one S109FA gas turbine, one D10 steam turbine, one 390H generator, and one NG-109FA-R HRSG. Figure 1 presents a schematic of the combined-cycle system. The rated capacity is approximately 395 MW, and the operating range is 70–100% load. The unit can ramp rapidly, with a maximum load ramping rate of 11 MW/min.
Figure 1.
Schematic of the gas–steam combined-cycle unit.
The data used in this study were obtained from measured operating records at the Jinjiang Gas-Fired Power Plant. Operating parameters were acquired from the plant’s distributed control system (DCS) and field instruments at a sampling interval of 5 s. To ensure representative operating conditions, load-ramp data were screened, and records containing abnormal fluctuations or missing measurements were excluded. Operating parameters were collected at key state points of the gas turbine (GT), HRSG, and steam turbine (ST). The main data categories required for the analysis are listed in Table 1. To account for the effects of measurement errors and instrument precision on the thermodynamic calculations, an uncertainty analysis was conducted, with the detailed calculations provided in Table S1.
Table 1.
Key measured parameters for thermodynamic analysis of the combined-cycle system.
2.2. Basic Assumptions
The following assumptions are adopted. Air and exhaust gas are treated as ideal gases, with compositions listed in Table 2. Heat transfer between each component and the surroundings is neglected. The reference state is defined as p0 = 101.32 kPa and T0 = 298.15 K. Thermophysical properties of the working fluids are obtained using REFPROP 9.1. The thermodynamic and exergy calculations, together with the first- and second-order finite-difference analyses, were performed in Microsoft Excel based on the measured operating data.
Table 2.
Compositions of air and exhaust gas.
2.3. Energy and Exergy Analyses
The energy analysis model for the combined-cycle system follows the formulations in Refs [35,36]. The exergy analysis model follows Refs [37,38]. Only physical and chemical exergies are considered [39]. The required equations are summarized in Table 3.
Table 3.
Formula for combined-cycle calculations.
The condenser is treated as a dissipative component, and therefore no conventional fuel-product exergetic efficiency is defined. Nevertheless, its exergy destruction can be evaluated from the exergy balance over the condenser control volume. The control volume includes the steam/condensate side and the circulating cooling-water side, with the corresponding inlet and outlet exergy rates considered in the balance. Under the adopted quasi-steady approximation, with heat leakage to the external environment neglected and no shaft work across the control volume, the condenser exergy destruction rate is obtained from the difference between the total inlet and outlet exergy rates. The corresponding thermodynamic properties are determined from the measured operating states. The resulting exergy destruction values therefore represent quasi-steady estimates at the measured operating states.
For the dynamic variable-load process of the combined-cycle system, the unsteady exergy balance equation is expressed as follows:
where denotes the rate of change in the total exergy stored within the control volume; and denote the exergy rates entering and leaving the system, respectively; represents the exergy transfer associated with heat; denotes the useful power output; and denotes exergy destruction.
The first-order rate of change in exergy destruction (R1) is defined as the first derivative of exergy destruction with respect to time. Its unit is MW/min or MW/s, and it represents the instantaneous rate of change in exergy destruction. It is calculated as follows:
Since this study uses actual measurement data from a power plant, Equation (3) can be derived by applying the discrete difference method to approximate the rate of change of using the difference between two consecutive time steps.
By combining Equations (1)–(3) with the numerical difference formulation, the approximate expression for the first-order rate of change in exergy destruction is obtained as Equation (4).
Similarly, the second-order rate of change in exergy destruction (R2) is defined as the second derivative of exergy destruction with respect to time. It represents the acceleration of exergy destruction variation. Its unit is MW/min2 or MW/s2, and it describes how the first-order rate itself evolves. The expression is given below:
The present study adopts a measurement-based thermodynamic analysis approach rather than a component-characteristic dynamic simulation model. The operating trajectories of temperature, pressure, mass flow rate, and power are obtained from the plant DCS. Thermodynamic properties and component exergy quantities are calculated from these measured states at successive sampling instants, and their temporal variations are subsequently analyzed using finite-difference calculations.
3. Dynamic Exergy Characteristics During Load Ramping
3.1. Dynamic Performance During Variable-Load Processes
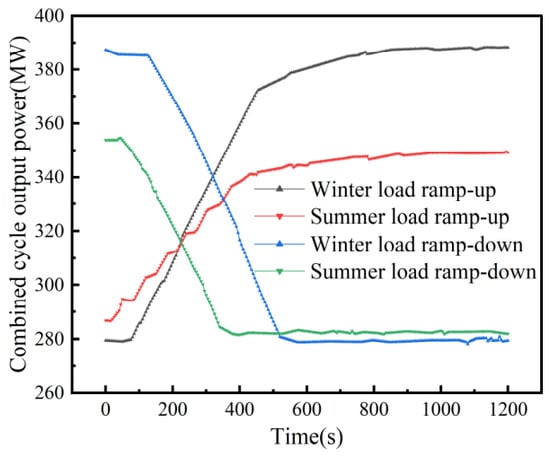
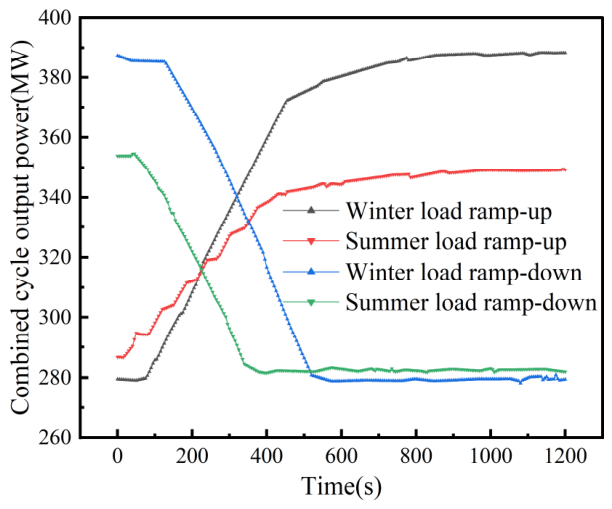
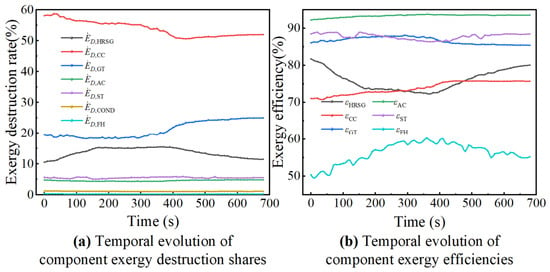
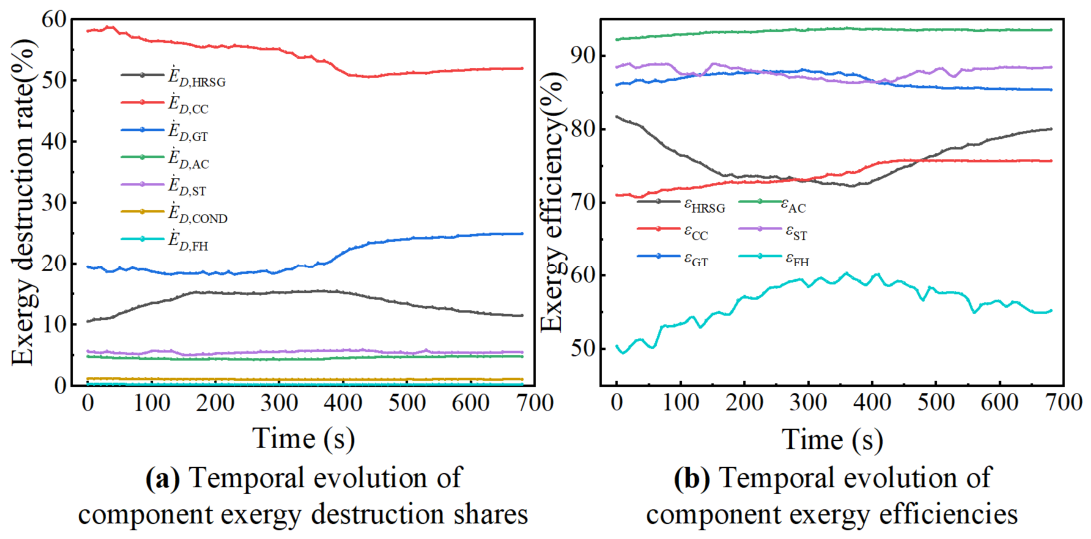
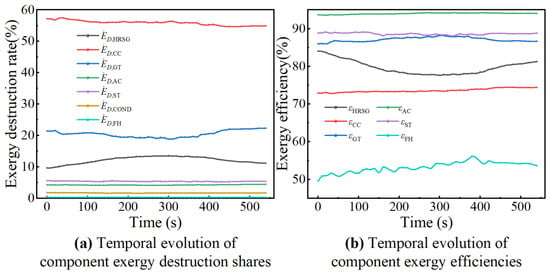
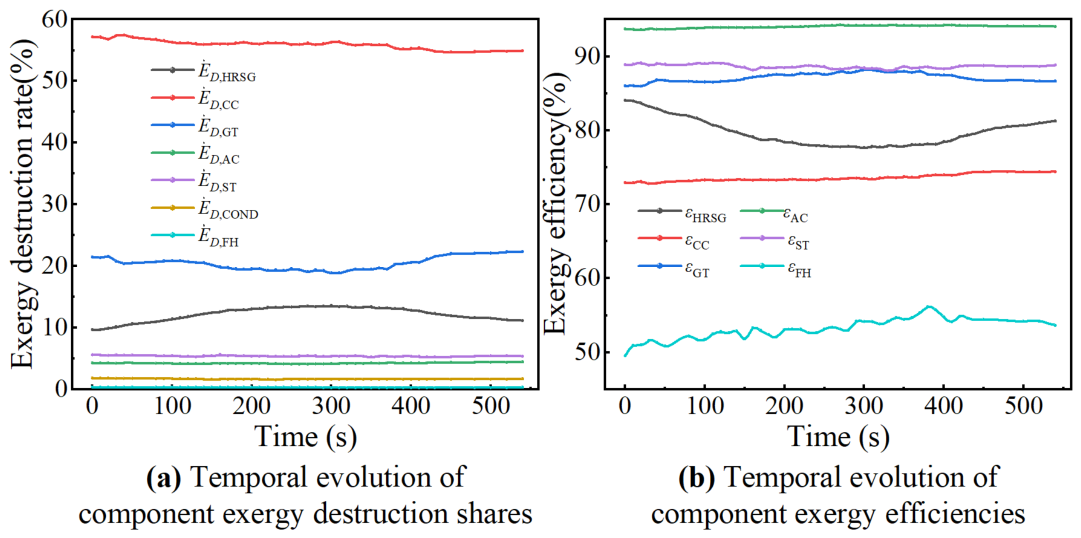
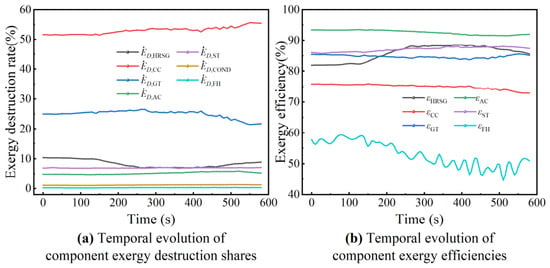
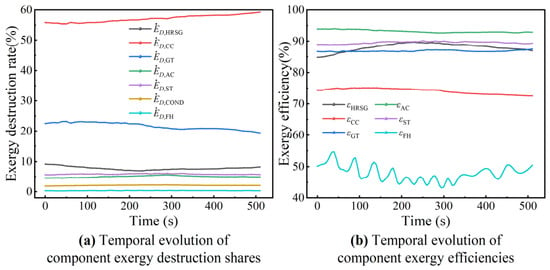
A combined-cycle unit can complete load ramp-up or ramp-down within a relatively short period. To investigate its dynamic thermodynamic behavior, four representative operating datasets are selected. They correspond to winter ramp-up, summer ramp-up, winter ramp-down, and summer ramp-down conditions. Figure 2 shows the load variation under different operating conditions, and the corresponding analysis results are presented in Figure 3, Figure 4, Figure 5 and Figure 6.
Figure 2.
Comparison of power response curves for combined-cycle systems under variable loads.
Figure 3.
Dynamic exergy performance analysis of major components during winter load ramp-up.
Figure 4.
Dynamic exergy performance analysis of major components during summer load ramp-up.
Figure 5.
Dynamic exergy performance analysis of major components during winter load ramp-down.
Figure 6.
Dynamic exergy performance analysis of major components during summer load ramp-down.
Figure 3 and Figure 4 compare the exergy analysis results before and after the load ramp-up. The exergy destruction share of the CC decreases, and the reduction is more pronounced in winter. The winter reduction reaches approximately 12.3%, whereas the summer reduction is only 4.92%. The exergy efficiency of the CC increases to some extent. The exergy destruction share of the GT fluctuates during the early ramp-up stage. It then rises to approximately 25% in winter and 23% in summer during the late stage. The GT maintains a relatively high exergy efficiency, fluctuating around 86%. By contrast, the exergy performance of the AC changes gradually. Its share of exergy destruction remains low and shows no marked fluctuations, while its exergy efficiency is the highest among the components. Overall, load ramp-up affects the topping cycle components differently. The strongest effect is observed for the CC, followed by the GT, whereas the effect on the AC is limited.
For the bottoming cycle, the HRSG exergy destruction share initially increases and then decreases as load rises. Its peak is approximately 16% in winter and 13% in summer. The maximum HRSG exergy destruction reaches 54.2 MW in winter and 40 MW in summer. These values are 87.7% and 59.0% higher than their respective initial values. The HRSG exergy efficiency first decreases and then recovers, with a larger reduction in winter. This behavior is primarily attributable to HRSG thermal inertia. During the early ramp-up stage, gas-side thermal input increases rapidly, whereas steam-side parameters respond with a distinct delay. This mismatch intensifies heat transfer irreversibility. Comparison of gas-side and steam-side thermodynamic response times indicates a delay of approximately 150–180 s between the two sides. In winter, the exhaust gas flow rate and exhaust gas exergy level are higher. Consequently, the increase in HRSG exergy destruction is substantially greater than in summer. Meanwhile, the ST exergy destruction share and exergy efficiency show no clear trend and fluctuate within limited ranges. Exergy destruction in the COND and FH is relatively small, particularly for the FH. However, the FH exhibits a low exergy efficiency and relatively pronounced fluctuations. Overall, except for the HRSG, bottoming cycle components show only limited variation in their exergy destruction shares during load ramp-up.
Figure 5 and Figure 6 show that component exergy destruction shares during load ramp-down exhibit a clear reverse asymmetry relative to those during ramp-up. The CC remains the largest contributor to total exergy destruction. Its exergy destruction share increases continuously during ramp-down, by up to 11% in winter and approximately 7.05% in summer. Its exergy efficiency decreases continuously as load declines. The GT exergy destruction share decreases moderately, but the overall variation remains limited. The AC follows a trend similar to that observed during ramp-up and shows no pronounced fluctuation. However, its exergy efficiency decreases slightly.
For the bottoming cycle, the exergy destruction shares of all components except the HRSG remain nearly unchanged. During load ramp-down, the HRSG exergy destruction share first decreases and then increases, reaching a minimum of approximately 7%. Its exergy efficiency first increases and then decreases. This behavior is mainly caused by thermal inertia. During the early load ramp-down stage, the gas-to-steam-side temperature difference decreases, thereby reducing heat transfer irreversibility. The exergy destruction shares of the ST, COND, and FH follow trends similar to those observed during ramp-up and show no substantial fluctuations.
Further comparison of Figure 3, Figure 4, Figure 5 and Figure 6 show that exergy destruction fluctuations are more pronounced in winter and more moderate in summer, indicating a clear seasonal asymmetry. In winter, the lower ambient temperature increases air density, compressor inlet mass flow, and fuel supply. Lower temperature conditions also increase temperature differences during combustion and heat transfer. These effects intensify irreversibility and lead to greater exergy destruction in both individual components and the overall combined-cycle system than in summer.
These observations are consistent with the transient exergy analysis of combined-cycle operation reported by Wittenburg et al. [26]. Their study showed that a higher load change rate increases the maximum exergy destruction rates of the HRSG and the water/steam cycle. When GT exhaust temperature and exhaust gas flow change rapidly, the evaporator, steam drum, and metal heating surfaces respond more slowly because of their thermal capacities. Water-/steam-side thermodynamic parameters, therefore, lag behind gas-side changes.
3.2. Component Sensitivity During Variable-Load Processes
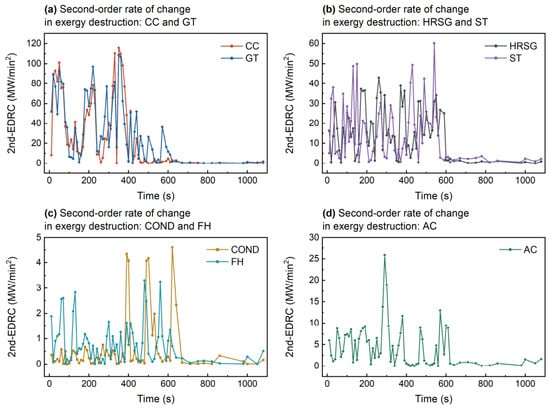
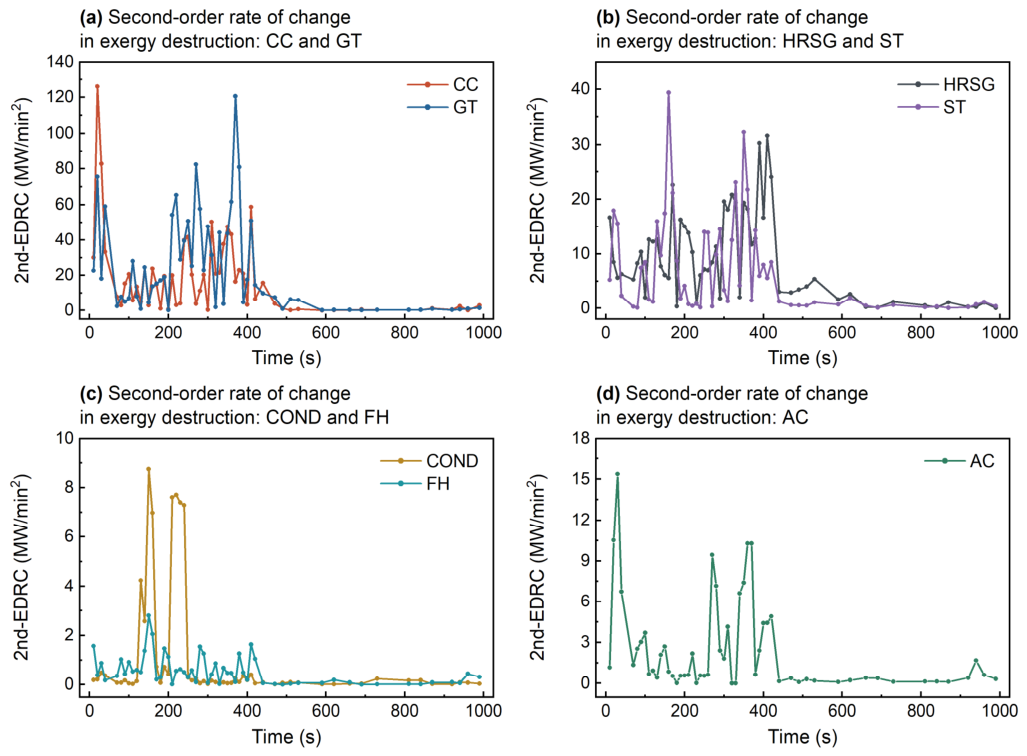
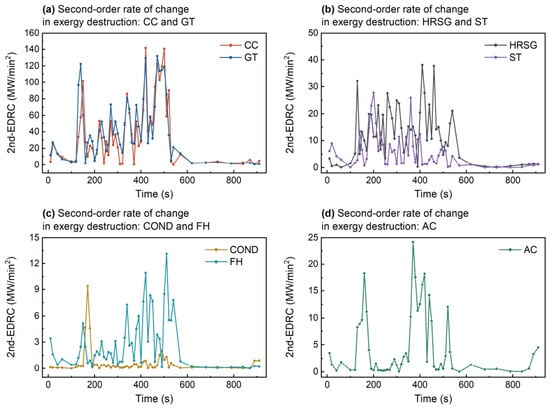
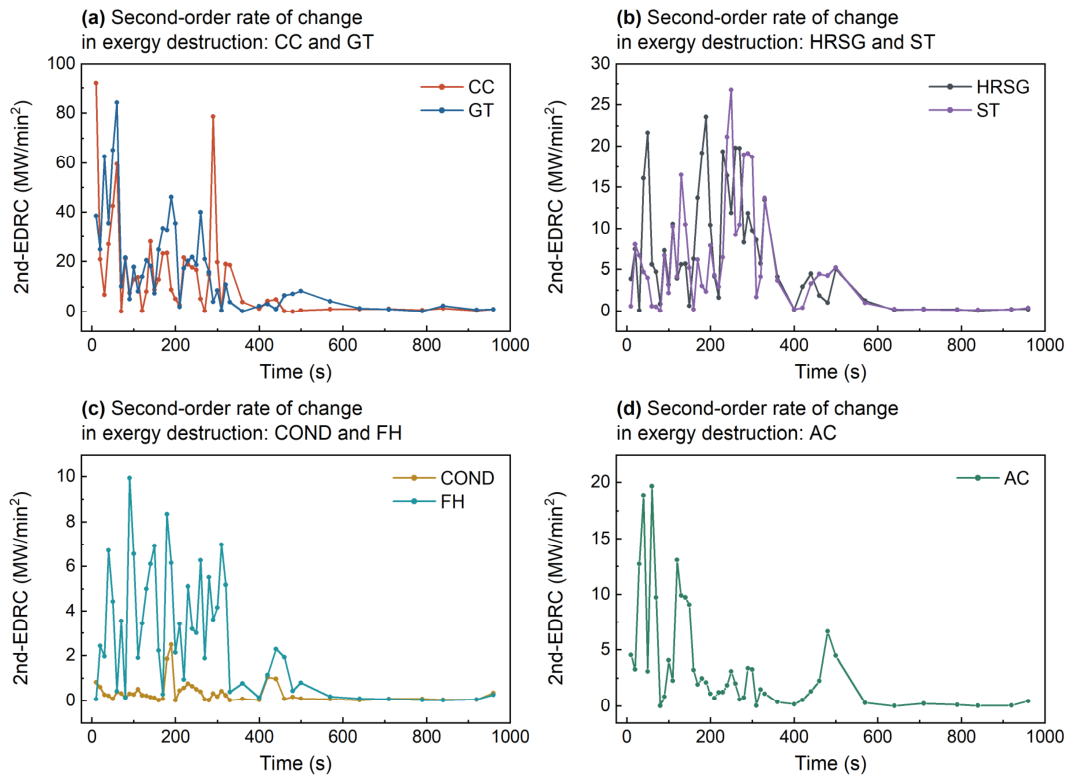
Figure 7, Figure 8, Figure 9 and Figure 10 show the dynamic absolute values of the second-order rates of change in exergy destruction for each component under different variable-load conditions. The CC and GT exhibit the largest values, and their peaks occur at nearly the same time. The CC shows a larger fluctuation amplitude and is therefore the most dynamically sensitive component, followed by the GT. During load changes, rapid adjustments in the air–fuel ratio, fuel flow rate, and flame temperature substantially increase combustion irreversibility. These adjustments produce strong fluctuations in CC exergy destruction, which are subsequently transmitted to the GT. Seasonal comparison shows that the CC and GT generally exhibit higher peaks and more frequent fluctuations in winter.
Figure 7.
R2 in various components during winter load ramp-up.
Figure 8.
R2 in various components during summer load ramp-up.
Figure 9.
R2 in various components during winter load ramp-down.
Figure 10.
R2 in various components during summer load ramp-down.
Although the absolute second-order rates of change in exergy destruction for the HRSG and ST are lower than those of the CC and GT, their peaks generally occur during the middle or late stages of load variation. Their fluctuations also persist for longer periods. Seasonal comparison shows that fluctuations in the second-order rate generally persist longer under winter conditions. The delayed responses of the HRSG and ST are particularly evident during the middle and late stages. In summer, the variable-load process is shorter, and the larger component fluctuations are concentrated mainly in the middle stages.
The COND and FH exhibit relatively low dynamic sensitivity. The COND changes smoothly overall and is only weakly affected by load disturbances. Although the FH has a low second-order rate overall, it shows frequent local fluctuations, particularly during ramp-down. The AC also maintains a low second-order rate. Compared with other topping cycle components, its dynamic characteristics are primarily characterized by a small number of spikes and an overall relatively smooth trend.
Figure 7, Figure 8, Figure 9 and Figure 10 and Table 4 show that the combined-cycle unit does not exhibit a single exergy response mode during the variable-load process. Instead, it displays a distinct hierarchical dynamic response. The CC and GT have high absolute second-order rates, and their peaks occur at similar times. The gas turbine side, therefore, exhibits a rapid, disturbance-dominated response. The HRSG and ST have lower peaks, but these peaks generally occur during the middle and late stages and persist longer. The AC, COND, and FH show lower amplitudes and mainly local fluctuations.
Table 4.
Comparison of component dynamic responses under different variable-load conditions.
Table 5 shows that the combined first- and second-order criteria provide a more complete description of component dynamic response during load ramping. The first-order rate primarily indicates the direction and instantaneous intensity of the variation in exergy destruction. The second-order rate further indicates whether that variation is accelerating or decelerating.
Table 5.
Operating state classification of combined-cycle components using the first- and second-order rates of change in exergy destruction.
The proposed dynamic indicators should be distinguished from direct measures of thermodynamic performance. Exergy destruction quantifies the magnitude of irreversibility, whereas R1 and R2 characterize its temporal variation. Therefore, the indicators are used primarily to identify dynamically sensitive components and periods of rapidly changing irreversibility. They do not, by themselves, determine an optimal operating condition or guarantee an improvement in exergetic efficiency. The potential benefit of an operational adjustment must be evaluated separately by comparing exergy destruction and exergetic efficiency under comparable operating boundary conditions.
The above analysis demonstrates that the proposed dynamic exergy indicators provide not only a quantitative characterization of component responses during load transients but also a basis for identifying potential targets for operational improvement. However, a high dynamic sensitivity does not necessarily indicate a high potential for operational adjustment. The selection of an appropriate optimization target must also consider the physical mechanisms of exergy destruction, the availability of adjustable operating variables, and the constraints imposed by the existing plant control system.
4. Optimization of HRSG Variable-Load Operation Based on Dynamic Diagnosis
4.1. Selection of the Optimization Target and Decision Variable
During variable-load operation, the power trajectory required by the grid is regarded as an externally imposed constraint rather than an optimization variable. Therefore, the objective of the present study is not to reduce or modify the required ramping rate. Instead, the optimization focuses on the internal thermodynamic response of the CCPP while the prescribed load trajectory is maintained. Specifically, the dynamic exergy indicators are used to identify periods during which the mismatch between the rapidly varying GT exhaust-energy input and the slower water-/steam-side response produces additional HRSG irreversibility. Feedwater-response adjustment is therefore investigated as a potential means of improving gas–steam thermal matching, subject to the constraints imposed by the existing plant control system.
The preceding results show that the CC and GT have high absolute R2 during load ramping and respond most strongly to load disturbances. However, their operating states are constrained by the load command, fuel input, combustion stability, exhaust temperature limits, and GT control strategy. Direct on-site adjustment is therefore limited. Table 6 shows that the HRSG does not have the largest absolute exergy destruction. Nevertheless, it exhibits a larger relative winter–summer difference, indicating a stronger coupled response to seasonal boundary conditions and variable-load processes.
Table 6.
Winter–summer differences in component exergy destruction at different load levels.
The HRSG connects the gas turbine topping cycle and the steam bottoming cycle. Its exergy destruction depends on GT exhaust temperature, flue gas flow rate, and gas-side exergy input. It is also influenced by bottoming cycle boundary conditions, including feedwater temperature, feedwater flow rate, condensate temperature, cooling water temperature, and condenser pressure.
Based on the combined consideration of dynamic exergy characteristics and engineering adjustability, the HRSG is selected as the target for operational improvement. During load ramp-up, the GT exhaust-gas temperature and mass flow rate change rapidly, whereas the water-/steam-side response of the HRSG is delayed by its thermal inertia. This mismatch between gas-side heat input and water-/steam-side heat absorption contributes to increased heat-transfer irreversibility. Among the operating variables associated with the HRSG, feedwater flow is selected for further investigation because it influences the heat absorption and steam generation processes and can be regulated through the existing feedwater control system. Accordingly, the dynamic exergy indicators are used to characterize the evolution of HRSG irreversibility, while feedwater adjustment is investigated as a potential means of improving gas–steam thermal matching during the prescribed load-ramping process. The effectiveness of this adjustment is subsequently evaluated by comparing the calculated HRSG exergy performance with historical operating data under comparable load and thermal boundary conditions.
4.2. Prediction and Validation of HRSG Feedwater Flow
Following the selection of the HRSG as the operational improvement target, a feedwater-response adjustment strategy is investigated to reduce the thermodynamic irreversibility associated with the delayed water-/steam-side response during load ramp-up. The proposed procedure comprises three stages: dynamic exergy diagnosis, feedwater-response adjustment, and comparison with historical operating data.
First, the HRSG exergy destruction and its first- and second-order rates of change are calculated from the measured operating trajectory. The first-order indicator, R1, describes the direction and rate of change in exergy destruction, whereas the second-order indicator, R2, characterizes the acceleration or deceleration of this variation. These indicators provide information on the temporal evolution of HRSG irreversibility and help identify periods requiring particular attention during the feedwater-response adjustment.
Three operating cases are considered for comparison. The original operating case adopts the measured feedwater-flow trajectory as the reference. In Case A, a first-order-based feedwater adjustment is considered to improve the response of the water-/steam-side to the increasing gas-side thermal input. In Case B, the second-order indicator is additionally incorporated to moderate abrupt variations in the adjusted feedwater trajectory. The resulting HRSG exergy destruction and exergetic efficiency are evaluated and compared with the original operating case and the available historical operating data.
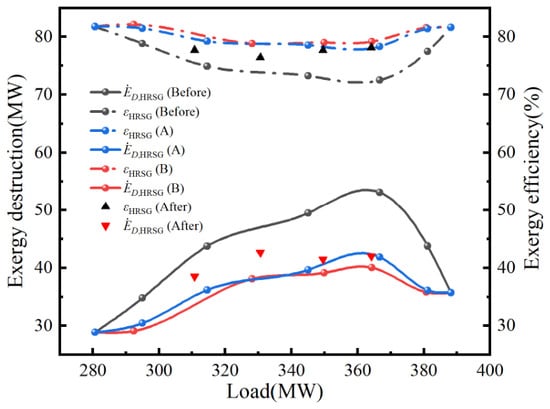
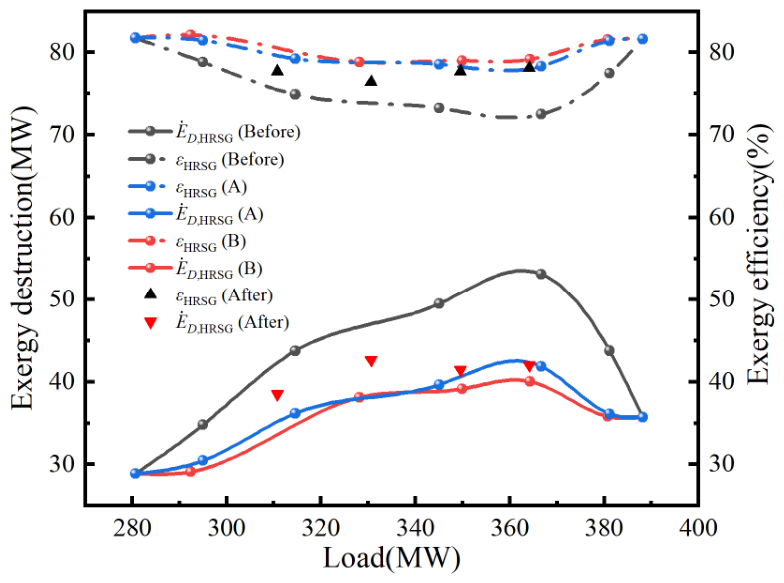
Figure 11 presents the predicted variations in HRSG exergy destruction and exergy efficiency with load under the original, first-order, and coordinated first-/second-order feedwater strategies. Historical operating data are included for validation. Under the original strategy, HRSG exergy destruction increases markedly with load and reaches high levels in the medium- and high-load ranges. Correspondingly, HRSG exergy efficiency decreases over the intermediate load range.
Figure 11.
Prediction and historical validation of HRSG exergy destruction and exergy efficiency under different feedwater response strategies.
Comparison of the first-order regulation case A and coordinated first-/second-order regulation case B shows that both strategies substantially reduce HRSG exergy destruction and improve exergy efficiency. The historical validation points for HRSG exergy destruction and exergy efficiency lie between the original and optimized prediction curves. They are closer to the predictions obtained after first-order and coordinated first-/second-order regulation. This agreement indicates that a faster feedwater response can reduce HRSG exergy destruction and improve exergy efficiency under similar load and gas-side thermal boundary conditions. The reduction in HRSG exergy destruction does not result merely from a higher feedwater flow rate. A higher water-/steam-side heat capacity rate improves the absorption of increasing gas-side heat input. Consequently, irreversibility caused by the finite temperature difference in heat transfer decreases. As load increases from 310 to 364 MW, HRSG exergy destruction rises from 42.45 to 52.61 MW under the original operating case. At the validation points, it increases only from 38.53 to 42.01 MW. The maximum relative reduction in HRSG exergy destruction reaches 20.14%. The maximum relative improvement in exergy efficiency reaches 7.56%.
4.3. Engineering Applicability and Limitations
The practical significance of the proposed approach lies in providing a thermodynamic diagnostic basis for improving the internal operating response of a CCPP during mandatory load-following operation. Unlike conventional operating-point analysis, the proposed dynamic exergy indicators characterize not only the magnitude of component irreversibility but also its temporal variation. This information can assist in identifying components and operating periods in which transient thermodynamic losses warrant further investigation.
For the investigated plant, the dynamic exergy analysis identifies the HRSG as a suitable candidate for operational improvement because of its delayed water-/steam-side response and the availability of feedwater regulation. The proposed feedwater-response adjustment is intended to improve the thermal matching between the gas and water/steam sides without deliberately modifying the externally imposed load trajectory. The comparison with historical operating data provides supporting evidence for the potential reduction in HRSG exergy destruction under comparable operating conditions.
Nevertheless, the proposed adjustment has been evaluated offline and has not been implemented as a closed-loop control strategy in the operating plant. Practical deployment would require coordination with the existing feedwater control system and explicit consideration of steam-drum water-level limits, steam pressure and temperature requirements, feedwater regulation rates, and equipment operating constraints. Therefore, the present results demonstrate the potential engineering applicability of dynamic-exergy-guided operational adjustment, while further plant-level implementation and validation remain necessary.
Furthermore, the proposed dynamic exergy indicators characterize thermodynamic disturbances rather than mechanical degradation. Establishing a quantitative relationship between these indicators and maintenance costs would require additional information on component thermal stresses, operating cycles, degradation, and maintenance history. This relationship will be investigated in future work.
5. Conclusions
Based on measured operating data from an F-class CCPP, this study establishes an analytical framework for variable-load operation. A dynamic exergy method based on the second-order rate of change in exergy destruction is proposed. The evolution of component exergy destruction, sensitivity ranking, and seasonally asymmetric responses is systematically evaluated. On this basis, the performance of an engineering-oriented operational adjustment strategy, evaluated through offline calculations and historical data comparisons, is further predicted. The main conclusions are as follows:
- (1)
- A component sensitivity criterion suitable for variable-load processes is proposed. R1 identifies the direction and instantaneous intensity of the change in exergy destruction, whereas the absolute value of R2 quantifies its acceleration and dynamic sensitivity.
- (2)
- Component exergy behavior depends jointly on ramp direction and seasonal boundary conditions. During ramp-up, the CC exergy destruction share decreases, whereas the HRSG share first increases and then decreases; during ramp-down, the corresponding trends are reversed. Winter cases generally exhibit larger and longer-lasting exergy fluctuations than summer cases, although the peak magnitude is not governed by ramp direction alone. The season mainly changes the intensity and persistence of the response, while the component sensitivity hierarchy remains broadly consistent.
- (3)
- The transient deterioration of the HRSG is governed by dynamic mismatch between the rapidly changing gas-side heat input and the slower water-/steam-side response. During ramp-up, the HRSG exergy destruction reaches 54.2 MW in winter and 40.0 MW in summer, corresponding to increases of 87.7% and 59.0% relative to the respective initial states. The gas-side/steam-side response lag is approximately 150–180 s.
- (4)
- A first-order dominant, second-order smoothed feedwater response optimization method for HRSG has been proposed for combined-cycle load-up processes. The R1 provides a basis for the feedwater adjustment direction and target correction. The R2 identifies strong fluctuations in the first-order signal and smooths the feedwater flow rate. Historical operating points support the predicted improvement trend under comparable load and gas-side boundary conditions. Relative to the original operation, the maximum relative reduction in HRSG exergy destruction is 20.14%, and the maximum relative increase in exergy efficiency is 7.56%.
These findings indicate that dynamic exergy analysis can serve as a diagnostic and decision support tool for identifying potential operational improvements during prescribed load-following processes. By combining component-level dynamic sensitivity with engineering adjustability, the proposed approach establishes a connection between transient thermodynamic diagnosis and targeted operational adjustment. Further work is required to evaluate the strategy under closed-loop operating conditions and to verify its long-term performance and reliability.
Supplementary Materials
The following supporting information can be downloaded at: https://www.mdpi.com/article/10.3390/app162110556/s1. Table S1. Thermodynamic equations for the main components of the combined-cycle system; Table S2. Uncertainty analysis results for the CCPP.
Author Contributions
Conceptualization, W.S. and Y.Z.; methodology, X.L.; validation, X.L. and J.Z.; formal analysis, W.S.; investigation, X.L.; resources, J.Z.; data curation, J.H. and Z.Y.; writing—original draft preparation, X.L.; writing—review and editing, J.Z.; visualization, J.H. and T.P.; supervision, J.Z.; project administration, J.Z. and Y.Z.; funding acquisition, W.S. and J.Z. All authors have read and agreed to the published version of the manuscript.
Funding
This research was funded by the Natural Science Foundation of Fujian Province, China (2021J01854 and 2025J01873), and the Natural Science Foundation of Xiamen, China (3502Z202571044).
Institutional Review Board Statement
Not applicable.
Informed Consent Statement
Not applicable.
Data Availability Statement
The data presented in this study are available upon request from the corresponding authors.
Acknowledgments
The authors gratefully acknowledge Jinjiang Gas Power Co., Ltd., Jinjiang, China, for providing experimental facilities for this research.
Conflicts of Interest
Author Jing Hu and Yingchi Zhou are employed by the company Fujian Jinjiang Gas Power Co., Ltd. The remaining authors declare that the research was conducted in the absence of any commercial or financial relationships that could be construed as a potential conflict of interest.
Abbreviations
The following abbreviations are used in this manuscript:
| Nomenclature | Subscript | ||
| Latin symbols | a | Air | |
| T | Temperature [°C, K] | g | Exhaust gas |
| Power [kW] | in | Inlet | |
| r | Pressure ratio [-] | out | Outlet |
| k | Specific heat ratio [-] | f | Fuel |
| cp | Constant pressure specific heat [kJ/kg·K] | 0 | Reference state |
| m | Mass flow rate [kg/s] | st | Steam |
| t | Time [s] | w | Water |
| Heat transfer rate [kW] | cw | Colding water | |
| e | Specific exergy [kJ/kg] | Abbreviations | |
| E | Total exergy stored within the control volume [kJ] | AC | Air compressor |
| Exergy rate [kW] | CC | Combustion chamber | |
| Exergy destruction rate [kW] | CCPP | Combined-cycle power plant | |
| h | Specific enthalpy [kJ/kg] | GT | Gas turbine |
| Fuel exergy rate [kW] | ST | Steam turbine | |
| Product exergy rate [kW] | LHV | Lower heating value | |
| s | Specific entropy [kJ/kg·K] | HRSG | Heat recovery steam generator |
| p | Pressure [kPa] | COND | Condenser |
| R1 | First-order rate of change in exergy destruction [MW/min] | FH | Fuel heater |
| R2 | Second-order rate of change in exergy destruction [MW/min2] | DCS | Distributed control system |
| Greek symbols | Superscripts | ||
| ε | Exergy efficiency [%] | CH | Chemical exergy |
| ζ | Ratio between chemical exergy and lower heating value of the fuel [-] | PH | Physical exergy |
References
- Zhang, N.; Hou, H.; Yu, G.; Hu, E.; Duan, L.; Zhao, J. Simulated performance analysis of a solar aided power generation plant in fuel saving operation mode. Energy 2019, 166, 918–928. [Google Scholar] [CrossRef] [Scilit]
- Ding, Z.; Hou, H.; Yu, G.; Hu, E.; Duan, L.; Zhao, J. Performance analysis of a wind-solar hybrid power generation system. Energy Convers. Manag. 2019, 181, 223–234. [Google Scholar] [CrossRef] [Scilit]
- Mohammadi, A.; Ashouri, M.; Ahmadi, M.H.; Bidi, M.; Sadeghzadeh, M.; Ming, T. Thermoeconomic analysis and multiobjective optimization of a combined gas turbine, steam, and organic Rankine cycle. Energy Sci. Eng. 2018, 6, 506–522. [Google Scholar] [CrossRef] [Scilit]
- Li, Y.; Zhang, G.; Wang, L.; Yang, Y. Part-load performance analysis of a combined cycle with intermediate recuperated gas turbine. Energy Convers. Manag. 2020, 205, 112346. [Google Scholar] [CrossRef] [Scilit]
- Ali Motamed, M.; Genrup, M.; Nord, L.O. Part-load thermal efficiency enhancement in gas turbine combined cycles by exhaust gas recirculation. Appl. Therm. Eng. 2024, 244, 122716. [Google Scholar] [CrossRef] [Scilit]
- Ersayin, E.; Ozgener, L. Performance analysis of combined cycle power plants: A case study. Renew. Sustain. Energy Rev. 2015, 43, 832–842. [Google Scholar] [CrossRef] [Scilit]
- Elwardany, M.; Nassib, A.M.; Mohamed, H.A.; Abdelaal, M.R. Energy and exergy assessment of 750 MW combined cycle power plant: A case study. Energy Nexus 2023, 12, 100251. [Google Scholar] [CrossRef] [Scilit]
- Pattanayak, L.; Sahu, J.N.; Mohanty, P. Combined cycle power plant performance evaluation using exergy and energy analysis. Environ. Prog. Sustain. Energy 2017, 36, 1180–1186. [Google Scholar] [CrossRef] [Scilit]
- Balku, Ş. Analysis of combined cycle efficiency by simulation and optimization. Energy Convers. Manag. 2017, 148, 174–183. [Google Scholar] [CrossRef] [Scilit]
- Ahmadi, P.; Dincer, I.; Rosen, M.A. Exergy, exergoeconomic and environmental analyses and evolutionary algorithm based multi-objective optimization of combined cycle power plants. Energy 2011, 36, 5886–5898. [Google Scholar] [CrossRef] [Scilit]
- Yang, Y.; Bai, Z.; Zhang, G.; Li, Y.; Wang, Z.; Yu, G. Design/off-design performance simulation and discussion for the gas turbine combined cycle with inlet air heating. Energy 2019, 178, 386–399. [Google Scholar] [CrossRef] [Scilit]
- Li, K.; Chi, J.; Zhang, S. Energy and exergy analysis of gas turbine combined cycle with exhaust gas recirculation under part-load conditions. Technology 2023, 37, 2149–2160. [Google Scholar] [CrossRef] [Scilit]
- Abbasi Khams, A.; Salehi, G.; Vahabi, M.; Zolfigol, A. Advanced exergy and exergoeconomic analysis of a three-pressure combined cycle power plant under full and partial loads. J. Therm. Anal. Calorim. 2025, 150, 21703–21721. [Google Scholar] [CrossRef] [Scilit]
- Babaei Jamnani, M.; Kardgar, A. Energy-exergy performance assessment with optimization guidance for the components of the 396-MW combined-cycle power plant. Energy Sci. Eng. 2020, 8, 3561–3574. [Google Scholar] [CrossRef] [Scilit]
- Wang, Z.; Duan, L.; Zhang, Z. Environmental thermoeconomic performance analysis of gas turbine combined cycle under off-design conditions. Energy Sci. Eng. 2022, 11, 127–142. [Google Scholar] [CrossRef] [Scilit]
- Abdulsitar, A.S.; Saeed, A.F.; Ismaeel, H.H. Optimizing the energy and economic performance of a 125 MW gas turbine power plant through exergy analysis. Appl. Therm. Eng. 2026, 283, 128913. [Google Scholar] [CrossRef] [Scilit]
- Kaviri, A.G.; Jaafar, M.N.M.; Lazim, T.M. Modeling and multi-objective exergy based optimization of a combined cycle power plant using a genetic algorithm. Energy Convers. Manag. 2012, 58, 94–103. [Google Scholar] [CrossRef] [Scilit]
- Ahmadi, P.; Dincer, I. Thermodynamic and exergoenvironmental analyses, and multi-objective optimization of a gas turbine power plant. Appl. Therm. Eng. 2011, 31, 2529–2540. [Google Scholar] [CrossRef] [Scilit]
- Wang, Z.; Duan, L.; Zhang, Z. Thermoeconomic cost analysis on operation strategies of gas turbine combined cycle under off-design conditions. Case Stud. Therm. Eng. 2021, 28, 101617. [Google Scholar] [CrossRef] [Scilit]
- Gu, H.; Cui, X.; Zhu, H.; Si, F.; Kong, Y. Multi-objective optimization analysis on gas-steam combined cycle system with exergy theory. J. Clean. Prod. 2021, 278, 123939. [Google Scholar] [CrossRef] [Scilit]
- Pattanayak, L.; Padhi, B.N. Thermodynamic simulation and economic analysis of combined cycle with inlet air cooling and fuel pre-heating: Performance enhancement and emission reduction. Energy Convers. Manag. 2022, 267, 115884. [Google Scholar] [CrossRef] [Scilit]
- Mohammed, M.K.; Awad, O.I.; Rahman, M.M.; Najafi, G.; Basrawi, F.; Abd Alla, A.N.; Mamat, R. The optimum performance of the combined cycle power plant: A comprehensive review. Renew. Sustain. Energy Rev. 2017, 79, 459–474. [Google Scholar] [CrossRef] [Scilit]
- Li, Y.; Zhang, G.; Bai, Z.; Song, X.; Wang, L.; Yang, Y. Backpressure adjustable gas turbine combined cycle: A method to improve part-load efficiency. Energy Convers. Manag. 2018, 174, 739–754. [Google Scholar] [CrossRef] [Scilit]
- Farahani, Y.; Jafarian, A.; Mahdavi Keshavar, O. Dynamic simulation of a hybrid once-through and natural circulation Heat Recovery Steam Generator (HRSG). Energy 2022, 242, 122996. [Google Scholar] [CrossRef] [Scilit]
- Michalakakis, C.; Cullen, J.M. Dynamic exergy analysis: From industrial data to exergy flows. J. Ind. Ecol. 2022, 26, 12–26. [Google Scholar] [CrossRef] [Scilit] [PubMed]
- Wittenburg, R.; Hübel, M.; Holtz, D.; Müller, K. Transient Exergy Analysis of the Dynamic Operation of a Combined Cycle Power Plant. In Proceedings of the ASME 2021 Power Conference, Virtual, 20–22 July 2021; American Society of Mechanical Engineers: Houston, TX, USA, 2021; Volume 85109, p. V001T12A7. [Google Scholar]
- Zhao, L.; Zhang, J.; Wang, X.; Feng, J.; Dong, H.; Kong, X. Dynamic exergy analysis of a novel LNG cold energy utilization system combined with cold, heat and power. Energy 2020, 212, 118649. [Google Scholar] [CrossRef] [Scilit]
- Guo, M.; Hao, Y.; Nižetić, S.; Lee, K.Y.; Sun, L. Modelica-based heating surface modelling and dynamic exergy analysis of 300 MW power plant boiler. Energy Convers. Manag. 2024, 312, 118557. [Google Scholar] [CrossRef] [Scilit]
- Aslan, A.; Büyükköse, A.O. Comparative Performance Analysis of Machine Learning-Based Annual and Seasonal Approaches for Power Output Prediction in Combined Cycle Power Plants. Energies 2025, 18, 5110. [Google Scholar] [CrossRef] [Scilit]
- González-Díaz, A.; Alcaráz-Calderón, A.M.; González-Díaz, M.O.; Méndez-Aranda, Á.; Lucquiaud, M.; González-Santaló, J.M. Effect of the ambient conditions on gas turbine combined cycle power plants with post-combustion CO2 capture. Energy 2017, 134, 221–233. [Google Scholar] [CrossRef] [Scilit]
- Wan, A.; Chen, T. Performance degradation analysis of combined cycle power plant under high ambient temperature. Therm. Sci. 2022, 26, 1897–1906. [Google Scholar] [CrossRef] [Scilit]
- Şen, G.; Nil, M.; Mamur, H.; Doğan, H.; Karamolla, M.; Karaçor, M.; Kuyucuoğlu, F.; Yörükeren, N.; Bhuiyan, M.R. The effect of ambient temperature on electric power generation in natural gas combined cycle power plant—A case study. Energy Rep. 2018, 4, 682–690. [Google Scholar] [CrossRef] [Scilit]
- Shin, J.; Jeon, Y.; Maeng, D.; Kim, J.; Ro, S.J.E. Analysis of the dynamic characteristics of a combined-cycle power plant. Energy 2002, 27, 1085–1098. [Google Scholar] [CrossRef] [Scilit]
- MMontañés, R.; GarÐarsdóttir, S.Ó.; Normann, F.; Johnsson, F.; Nord, L.O. Demonstrating load-change transient performance of a commercial-scale natural gas combined cycle power plant with post-combustion CO2 capture. Int. J. Greenh. Gas Control 2017, 63, 158–174. [Google Scholar] [CrossRef] [Scilit]
- Kurt, H.; Recebli, Z.; Gedik, E. Performance analysis of open cycle gas turbines. Int. J. Energy Res. 2009, 33, 285–294. [Google Scholar] [CrossRef] [Scilit]
- Altarawneh, O.R.; Alsarayreh, A.A.; Al-Falahat, A.a.M.; Al-Kheetan, M.J.; Alrwashdeh, S.S. Energy and exergy analyses for a combined cycle power plant in Jordan. Case Stud. Therm. Eng. 2022, 31, 101852. [Google Scholar] [CrossRef] [Scilit]
- Tsatsaronis, G. Definitions and nomenclature in exergy analysis and exergoeconomics. Energy 2007, 32, 249–253. [Google Scholar] [CrossRef] [Scilit]
- Ameri, M.; Ahmadi, P.; Khanmohammadi, S. Exergy analysis of a 420 MW combined cycle power plant. Int. J. Energy Res. 2008, 32, 175–183. [Google Scholar] [CrossRef] [Scilit]
- Tsatsaronis, G.; Kelly, S.O.; Morosuk, T.V. Endogenous and exogenous exergy destruction in thermal systems. In Proceedings of the ASME 2006 International Mechanical Engineering Congress and Exposition, Chicago, IL, USA, 5–10 November 2006; American Society of Mechanical Engineers: Houston, TX, USA, 2006; Volume 47640, pp. 311–317. [Google Scholar]

Disclaimer/Publisher’s Note: The statements, opinions and data contained in all publications are solely those of the individual author(s) and contributor(s) and not of MDPI and/or the editor(s). MDPI and/or the editor(s) disclaim responsibility for any injury to people or property resulting from any ideas, methods, instructions or products referred to in the content. |
© 2026 by the authors. Licensee MDPI, Basel, Switzerland. This article is an open access article distributed under the terms and conditions of the Creative Commons Attribution (CC BY) license.