


Abstract
As the automation of welding processes expands, vision-based inspection technologies for quantitative weld quality evaluation and defect detection have become increasingly important. However, the stable segmentation of weld bead regions remains challenging because actual weld images often include low contrast between the base material and weld bead, non-uniform illumination, spatter, and noise. To address these issues, this study proposes the Dark-Region Enhanced Fuzzy C-Means (DRE-FCM) algorithm, an FCM clustering-based weld bead segmentation method suitable for factory automation environments, using weld product images acquired under controlled experimental conditions. The segmented weld bead regions are subsequently classified into good and defective products using a modified projection-based classification method. The proposed method employs Firefly Algorithm-optimized Fuzzy C-means (FAFCM) to alleviate sensitivity to initial cluster centers and reduce the tendency to converge to local optima. In the preprocessing stage, the Inverse Gaussian Gradient (IGG) is applied to enhance weak edges in dark regions and compensate for ambiguous boundaries caused by brightness imbalance. An iterative noise reduction filter is further applied to reduce the noise sensitivity of FAFCM and improve weld bead object extraction. The extracted objects are then classified using a modified IHP-Seg. algorithm based on morphological information, including weld bead length and width. Experimental results show that the proposed method achieved a mean Intersection over Union (mIoU) of 0.94, a mean Pixel Accuracy (mPA) of 0.98, and an average segmentation time of 0.15 s, outperforming the compared conventional and deep learning-based methods. Furthermore, all objects were correctly classified, demonstrating the applicability of the proposed method to weld quality inspection in limited data environments.
1. Introduction
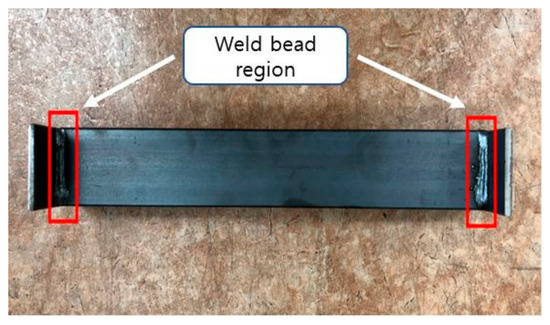
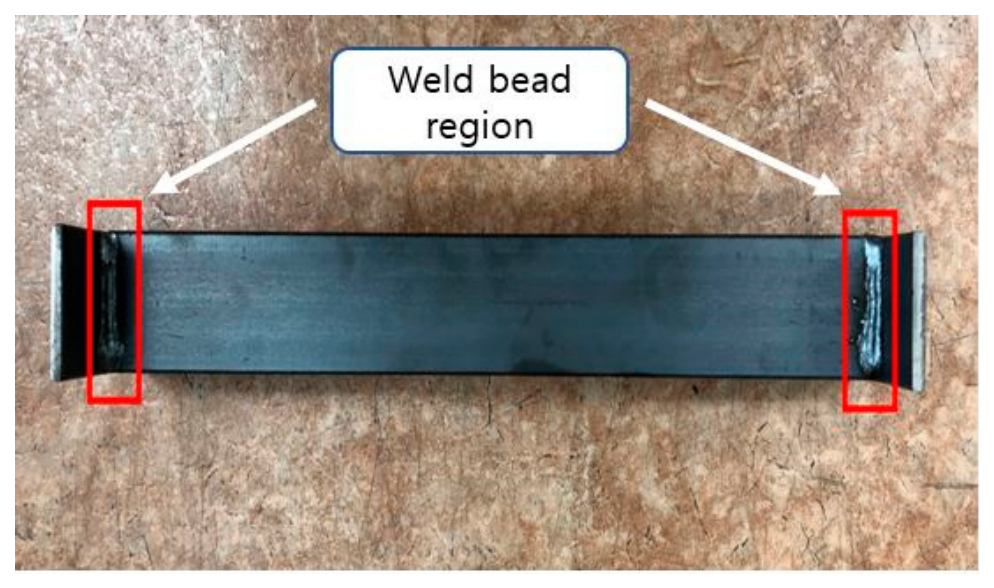
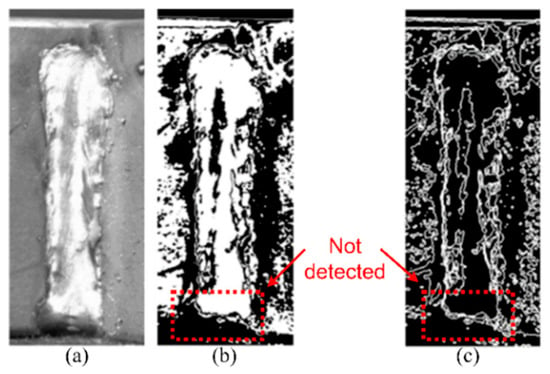
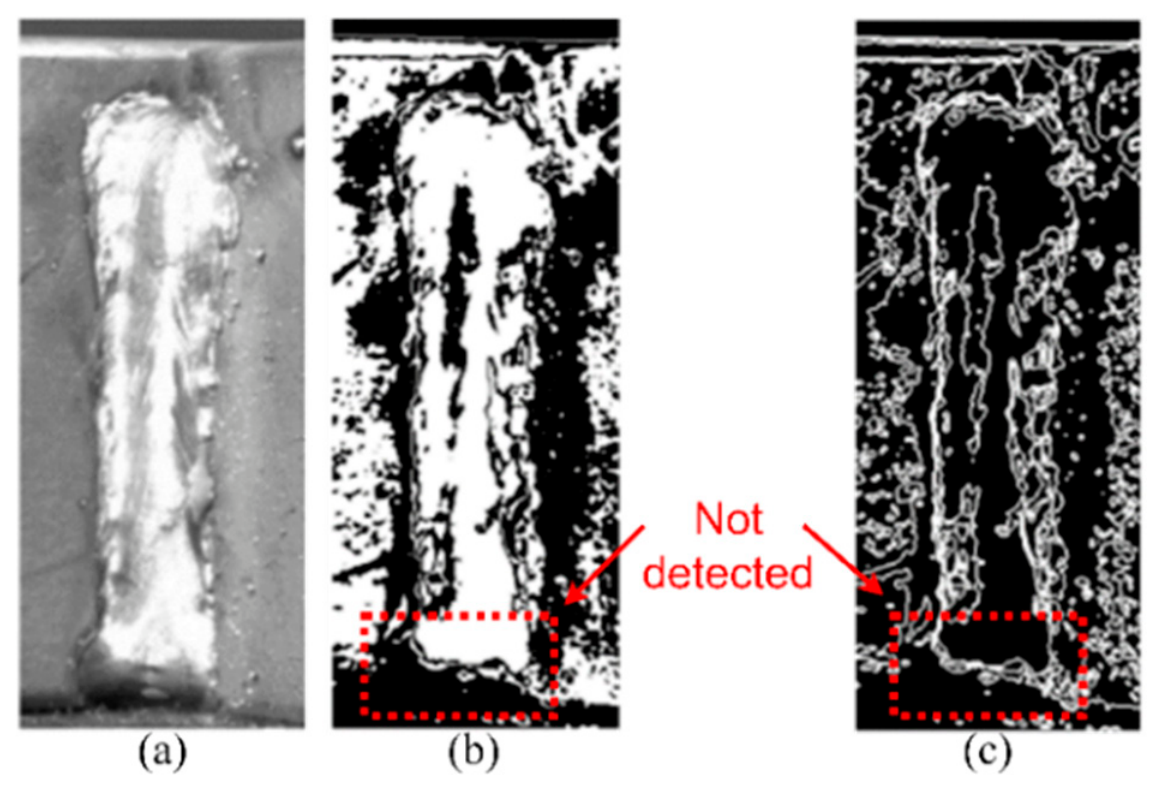
Welding is an essential process for product assembly and structural joining in various industries. Recently, the automation of welding processes for mass production has become increasingly important. Accordingly, with the growing demand for quality assurance, technologies for accurately evaluating the weld quality and determining the presence of defects have become increasingly important. Image-based analysis techniques have attracted attention in the field of weld quality inspection because they are non-destructive and suitable for real-time processing. In particular, they have become core technologies for object detection and quality classification. However, weld images present several challenges during analysis due to their inherent characteristics. In particular, there is often low contrast between the base material and the weld bead, brightness imbalance depending on the image location, and substantial noise caused by spatter generated during the welding process. These factors make accurate segmentation difficult and consequently serve as major causes of reduced accuracy in object detection and quality classification. In addition, as shown in Figure 1, products such as SRD (Shear Reinforcement of Dual- anchorage), which are used as construction materials, are welded to connect multiple base materials and are generally placed on an inspection table for quality inspection. Depending on the experimental environment, shadows may form beneath the welded region, as shown in Figure 2a, causing some weld beads to appear darker than others. These shadows make the boundaries of the weld beads unclear, even after binary conversion, as shown in Figure 2b, or edge detection, as shown in Figure 2c. As a result, accurate segmentation becomes difficult, which can lead to errors in quality inspection. Accordingly, various segmentation techniques have been proposed in previous studies to address these issues, and among clustering-based methods, C-means-based approaches have been actively investigated.
Figure 1.
Products manufactured by welding (SRD).
Figure 2.
Weld images processed using image processing techniques: (a) Grayscale (b) Otsu-Binary (c) Laplacian Edges.
Fuzzy C-means (FCM) is a representative soft clustering-based segmentation method that calculates the membership degree, allowing each pixel to partially belong to multiple clusters. However, conventional FCM has several limitations, including sensitivity to initial cluster centers, susceptibility to local optima, and vulnerability to noise and outliers. To address these issues, recent FCM-based image segmentation studies have been conducted in several directions, including metaheuristic optimization, integration of spatial/local information, feature weighting, uncertainty modeling, and structural representation. In particular, metaheuristic optimization-based FCM studies focus on alleviating the sensitivity of FCM to initial cluster centers and its tendency to fall into local optima. CSFCM [1] automated the determination of the number of clusters and the initial cluster centers through cooperative optimization combining GA, BBO, and FA, while AUTO-FCM-FMA [2] searched for optimal centroids using the Firefly Mate Algorithm and then applied them to FCM. In addition, CEFAFCM [3] combined a chaotic enhanced Firefly Algorithm with spatially modified FCM to address noise, intensity inhomogeneity, and partial volume effects in MRI images. FCM [4] coupled with the Firefly Optimization Algorithm also aimed to improve MR image segmentation performance by integrating Firefly optimization with FCM. These studies demonstrate that Firefly Algorithm-based optimization can mitigate the dependence of FCM on initial cluster centers and reduce the risk of convergence to local optima. In addition, various studies have been conducted to improve the robustness of FCM against noise and boundary instability. FALRCM [5], Self-learning weighted FLICM [6], FCM-VMF [7], Deformable spatial FCM [8], Dual-local FCM [9], and esFCM [10] improve segmentation performance by incorporating local, non-local, and region-level information, deformable windows, and quadratic surface prototypes. Furthermore, CGFFCM [11] and FSC_LNML [12] reflected the importance of different image features through feature weighting and subspace weighting, while the intuitionistic fuzzy, possibilistic fuzzy, and interval type-2 fuzzy-based studies in [13,14,15] addressed uncertainty, noise, and overlapping cluster problems that are difficult to represent using membership information alone. Fuzzy low-rank structural clustering incorporated low-rank representation or dictionary learning to exploit structural image information and denoising effects [16].
Taken together, existing FCM-based segmentation studies have been extended in various ways to address issues such as initialization sensitivity, vulnerability to noise, insufficient spatial information, lack of feature-importance consideration, and limited representation of uncertainty. In particular, although some studies did not explicitly target dark regions as objects to be detected, they suggest the potential for low-light or dark-region segmentation by addressing issues such as intensity inhomogeneity, uneven illumination, weak edges, low SNR, grayscale differences, and local spatial information. Since FCM forms clusters based on pixel intensity and membership degree, regions with relatively low intensity can also be represented as a distinct cluster characteristic. Therefore, when appropriate initial cluster center search, spatial information incorporation, and noise suppression are combined, dark regions appearing under shadowed or low-light conditions can also be considered as segmentation targets. However, most FCM-based studies have been validated on medical images, natural images, color benchmark images, or synthetic noisy images, and studies directly applying them to industrial images such as weld bead images, where metal reflection, low contrast, spatter, non-uniform bead shapes, and micro-defects coexist, remain limited. In particular, in weld bead segmentation, the intensity difference between the bead and the base material is small, some bead regions may appear dark due to shadows or reflected light, and spatter noise and weak boundaries may occur simultaneously. In such cases, conventional FCM or FCM combined with the Firefly Algorithm alone may not be sufficient to compensate for weak edges in dark regions and brightness imbalance. Therefore, to stably segment dark regions around weld beads or low-light defect candidate regions, an additional image feature enhancement process is required to emphasize weak edges and mitigate brightness imbalance, in combination with the clustering characteristics of FCM. In addition to FCM, conventional segmentation studies have been conducted in various ways because they do not require large-scale training data and have the advantage of high interpretability. Representative methods include active contour, 3D point cloud-based approaches, grayscale profile analysis, model-based residual analysis, filter-based segmentation, HDR image processing, and GrabCut. Mlyahilu et al. [17] segmented weld bead edges using morphological geodesic active contour, while Huang et al. [18] segmented weld beads using texture/global features and an ML classifier from 3D point clouds acquired with a RealSense depth camera. Lei et al. [19] extracted the cross-sectional morphology of multi-layer multi-pass weld beads through row–column grayscale segmentation. In the field of weld defect detection, Hua et al. [20] proposed model-based segmentation using laser vision-based dynamic ideal contours and residual analysis, Radi et al. [21] segmented horizontal defects in radiographic images using specialized filters, and Zheng et al. [22] extracted weak defect features by combining Laplacian edge enhancement with improved Otsu thresholding. In addition, Wang et al. [23] extracted the geometric features of the weld pool and keyhole in K-TIG welding using improved HDR fusion. Furthermore, the active contour-based medical image segmentation studies in [24,25], as well as the improved GrabCut studies in [26,27], can serve as methodological references for object segmentation involving complex boundaries or backgrounds. However, these conventional methods are sensitive to illumination changes, metal reflection, low contrast, spatter, similar intensity distributions between the background and weld bead, and parameter settings. Therefore, weld bead segmentation requires a methodology that maintains interpretability and low data dependency while being robust to dark regions, low-contrast boundaries, reflected light, and noise.
Recently, deep learning-based methods, including U-Net, DeepLabv3+, YOLO/instance segmentation, CNN-Transformer hybrids, SAM-based foundation models, and lightweight real-time segmentation networks, have been actively applied in the field of weld segmentation. In weld bead and weld region segmentation, it is important to accurately extract bead boundaries and morphological information. Wang et al. [28] improved the boundary accuracy of weld regions using heatmap detail guidance and image matting, while Cai et al. [29] analyzed molten pool contours and weld surface morphology using an attention-based lightweight semantic segmentation model. Zhang et al. [30] performed weld bead segmentation and defect classification in a nuclear reprocessing plant environment by combining a denoising network, Attention U-Net, and HMM, and OU-net_M model [31] identified, localized, and calculated the size of weld beads and defects using a lightweight FCN. In studies on weld seam tracking and real-time robotic segmentation, lightweight architecture and real-time performance are emphasized along with accuracy. The lightweight DeepLabv3+ model [32] was applied to a wall-climbing robot, while Wei et al. [33] extracted the seam ROI using FastSAM and then detected precise edges through point cloud-based region growing. Wu et al. [34] proposed a multi-task CNN that combines semantic segmentation and edge detection, and Kang et al. [35] extracted weld feature points using improved DeepLabv3+ and EfficientDet. In addition, Zou and Zeng [36] performed real-time weld seam segmentation and robotic tracking using a lightweight SOLOv2-based network, Chen et al. [37] using a CNN-Transformer hybrid DSNet, and Zhao et al. [38] using an improved YOLOv8s-Seg model. In weld defect and NDT-based segmentation studies, defect regions are segmented from various inspection data, including X-ray images, radiographic testing images, PAUT data, and ultrasonic B-scan images. Zhang and Zhang [39] segmented defects in PAUT volume data using 3D U-Net, and Yang et al. [40] recognized defects using improved Faster R-CNN after extracting the weld bead ROI. Zhou et al. [41] applied SAM-based WRT-SAM to radiographic weld defect segmentation, while Naddaf-Sh et al. [42] utilized SAM 1 and SAM 2 for weld defect detection in ultrasonic B-scan images. Wang et al. [43] addressed small defects and background noise using WFD-YOLO based on YOLO11n-seg, and Zhang et al. [44] combined multi-scale U-Net with a Transformer to incorporate both local details and global context. In addition, Yang et al. [45] segmented the weld seam fusion pool using CvT-UNet, which combines CNN and Transformer architectures. Recently, DINOv2 [46] and Swin-Unet [47] have also been proposed as deep learning-based segmentation-related methods. These methods provide self-supervised visual features and a Transformer-U-Net architecture, respectively, and can therefore be utilized as backbone models for weld bead segmentation. Despite these advances, deep learning-based segmentation methods still have limitations in practical weld inspection environments. Most models are trained based on specific datasets and inspection environments, and their generalization performance may degrade when lighting conditions, weld shapes, or inspection methods change. In addition, actual weld bead images often contain metal reflections, arc light, spatter, smoke, low contrast, dark defect candidate regions, small defects, and irregular boundaries, making stable segmentation difficult. Furthermore, in industrial environments, collecting sufficient defect data and performing precise annotation require considerable time and cost; therefore, deep learning models that heavily rely on large-scale training data have limitations in practical applications. Accordingly, for weld bead segmentation, clustering-based segmentation methods that have low dependence on training data and can directly respond to changes in pixel intensity are required as complementary approaches.
To address the limitations of existing segmentation methods, this study proposes an DRE-FCM based weld bead segmentation method that combines the Inverse Gaussian Gradient (IGG) with FAFCM. Existing FCM-based studies have shown that dark regions with relatively low intensity can be represented as cluster characteristics based on pixel intensity and membership degree. However, FCM-based clustering alone has limitations in compensating for edge information weakened by shadows or brightness imbalance. In weld bead images, such conditions can blur dark-region boundaries and reduce the intensity difference between the base material and the weld bead, making stable boundary detection difficult. Therefore, this study applies IGG as a preprocessing step and combines it with FAFCM to develop a segmentation method applicable to weld quality inspection in factory automation environments. The proposed method performs weld bead segmentation and quality classification using product images acquired under controlled experimental conditions. IGG is first used to enhance weak edges in dark regions and compensate for ambiguous boundaries caused by shadows and brightness imbalance. Then, FAFCM segments the weld bead region based on pixel intensity and membership degree while alleviating the initial-value sensitivity and local optima problems of conventional FCM. Finally, morphological information extracted from the segmentation results is applied to a modified IHP-Seg. algorithm with predefined classification criteria to classify weld bead quality. The main contributions of this paper are outlined below.
- An IGG-assisted preprocessing and FAFCM-based segmentation framework is introduced to enable more reliable extraction of weld bead boundaries from industrial images characterized by weak boundaries, non-uniform illumination, and dark regions.
- The σ value in IGG is selected based on the dispersion of the grayscale image, allowing edge sensitivity to be adjusted according to image characteristics and improving the robustness of boundary detection.
- FAFCM is employed to reduce the initial-value sensitivity of FCM and improve segmentation stability.
- A multi-stage noise reduction process is applied to suppress spatter and irrelevant noise components, improving contour accuracy and supporting subsequent contour-based classification.
- The IHP-Seg methodology proposed by Lee et al. [48] is applied with experimentally optimized thresholds and integrated with DRE-FCM to classify weld bead quality based on bead length and width. This approach requires no model training and provides a simple, interpretable, and computationally efficient inspection pipeline that is practical for industrial sites with limited data.
The remainder of this paper is organized as follows: Section 2 reviews related works on image segmentation and clustering based methods. Section 3 introduces the proposed segmentation and classification methodology in detail. Section 4 presents the experimental results and performance evaluations. Finally, Section 5 concludes the paper and discusses future research directions.
2. Related Works
2.1. Fuzzy C-Means Algorithm
Fuzzy C-means (FCM) is a clustering algorithm based on fuzzy logic that allows each pixel to partially belong to multiple clusters. Unlike the K-means algorithm, where each pixel point belongs to only a single cluster, FCM assigns a membership degree to every cluster, effectively capturing the ambiguous boundaries of pixels. Let the dataset to be clustered, be denoted as X = {x1, x2,…, xN} ⊂ ℝd, where xj represents the j-th pixel feature vector, d is the feature dimension, and N is the total number of pixels. Given a predefined number of clusters, clustering is performed under the assumption that each pixel has a membership degree associated with every cluster. FCM performs clustering by iteratively updating the cluster centers and membership degrees in a manner that minimizes the fuzzy objective function Jm, which is defined as follows
where xj ∈ ℝd denotes the j-th pixel feature vector, ci ∈ ℝd represents the i-th cluster center, and m > 1 is the fuzziness parameter. The term uij ∈ [0, 1] indicates the membership degree of the j-th data point belonging to the i-th cluster. For any given j-th pixel, the membership degrees must satisfy the constraint . The membership degrees uij and the cluster centers ci are updated iteratively according to the following equations.
The membership degree is calculated probabilistically to represent how strongly each data point belongs to a given cluster. Each cluster center is updated as a weighted average of the data points, where the weights are determined by the membership degrees uij. In other words, data points xj with higher membership degrees contribute more significantly to the computation of the cluster center ci, while those with lower membership degrees have a diminished influence.
2.2. FCM with Firefly Algorithm
The Firefly algorithm (FA) is a metaheuristic method inspired by the flashing behavior and social interaction patterns of fireflies, where multiple candidate solutions are explored randomly to find the global optimum [4]. Brighter fireflies attract nearby fireflies, and the swarm of solutions collectively moves toward the global optimum. FA operates according to the following three fundamental rules:
- All fireflies are attracted to each other regardless of their gender;
- The attractiveness between fireflies is proportional to their brightness and inversely proportional to the distance between them. Thus, a brighter firefly attracts other less bright fireflies, and the strength of attraction decreases as the distance between two fireflies increases. If there are no brighter fireflies nearby, a firefly moves randomly;
- The brightest firefly (i.e., the best solution) is not attracted to any other fireflies and moves randomly.
Each firefly represents a candidate solution, and its intensity is associated with the objective function. A firefly moves toward a brighter solution xj, which can be mathematically expressed as follows:
where xi(t) is the position of the i-th firefly at the time t, and xj(t) is the position of the brighter j-th firefly at time t. The parameter α controls the step size, and rand is a random number generated from a uniform distribution in the range [0, 1]. The parameter β represents the attractiveness coefficient between fireflies i and j based on their distance rij, and it is defined as:
where β0 is the maximum attractiveness when r = 0, γ is the absorption coefficient, and r denotes the distance between fireflies xi and xj. In the FAFCM algorithm, the optimal cluster centers obtained by the FA are used as the initial values for the FCM algorithm, which then iteratively updates the cluster centers and membership degrees until the objective function converges. The pseudo code of the FAFCM algorithm is presented below (Algorithm 1).
rij = ‖xi − xj‖,
| Algorithm 1 FAFCM Algorithm |
| Randomly generate a population of n fireflies xi (i = 1, 2, …, n), Each firefly represents a set of c cluster centers C = {c1, …, cC}, The light intensity Ii of firefly xi is computed using the FCM objective function Jm. Initialize FA parameters: absorption coefficient γ, attractiveness β0, randomness α. |
| WHILE t < Max Generation DO |
| FOR i = 1 to n DO |
| FOR j = 1 to n DO |
| IF Ij > Ii, THEN |
| Move firefly i toward firefly j |
| End IF |
| END FOR |
| Update membership matrix U and re-evaluate light intensity Ii |
| END FOR |
| END WHILE |
| Use the best firefly’s cluster centers to initialize FCM |
| Run standard FCM until convergence to refine U and C |
| Assign each point xj to the cluster with highest membership value uij. |
2.3. Inverse Gaussian Gradient
The Inverse Gaussian Gradient (IGG) is a well-established edge-enhancement operator, widely used as an edge-stopping function in geodesic active contour models [17]. In this study, IGG is employed as a preprocessing step to emphasize weak edges in dark weld bead regions, thereby promoting finer segmentation. For an input image I(x,y), the IGG processed image g(I) is defined as follows [17]:
where ∇ = (∂/∂x, ∂/∂y)T denotes the spatial gradient operator, ∗ denotes the two-dimensional convolution operator. Accordingly, ‖∇(Gσ ∗ (I))‖ represents the gradient magnitude of the Gaussian smoothed image at pixel location (x,y). is the two-dimensional Gaussian kernel, where (x,y) denote the spatial coordinates relative to the kernel center and σ is the standard deviation of the Gaussian distribution, which controls the degree of smoothing. Convolving the input image I(x,y) with Gσ suppresses high frequency noise while preserving low frequency structural information, thereby providing gradient information that is more robust to noise. The output g(I) takes values in the range (0, 1]. At locations where the edges are distinct, the magnitude ‖∇(Gσ ∗ (I))‖ becomes large, causing g(I) to decrease. Conversely, in flat regions where the edge magnitude is small, g(I) increases. Consequently, g(I) exhibits lower values near edges and higher values in flat regions. As a result, IGG is robust to noise and effectively enhances even weak edges, allowing fine boundaries to be better distinguished. Additionally, since regions with small gradients are suppressed, IGG enables a focus on significant boundary information, making it particularly suitable for precise segmentation of images with complex and intricate structures.
2.4. Image Histogram Projection-Segmentation Algorithm
Lee et al. [48] proposed an image projection-based inspection algorithm for weld bead quality assessment of SRD products. The algorithm first extracts a Region of Interest (ROI) containing the weld bead from the input image and then projects the pixel brightness values within the ROI in the vertical and horizontal directions to detect the weld bead location. For this purpose, the average brightness values in the vertical direction, MBV(x), and horizontal direction, MBH(y), are calculated from the RGB image I(x,y,c) within the ROI as follows.
where I(x,y,c) denotes the brightness value of the c-th color channel at pixel (x,y) within the ROI; xs, xe, ys, and ye denote the ROI boundaries along the x- and y-axes; and W and H represent the width and height of the ROI, respectively. In this algorithm, the weld bead boundary is determined by identifying points where the brightness value changes rapidly in the projection-based brightness histogram. The reference brightness value MBT used to determine the weld bead region is defined as follows.
MBT = (MBmax − MBmin) × τ + MBmin,
In the original study, τ = 0.5 was used to detect the weld bead region based on the point corresponding to 50% of the average brightness histogram. Subsequently, the width Wb and height Hb of the weld bead are measured using the boundary coordinates obtained in the vertical and horizontal directions, and the weld bead is classified as good or defective by comparing these values with predefined threshold values.
where θw and θh denote the predefined threshold values for the bead width and bead height, respectively. This method has the advantage of evaluating weld quality using brightness projection and morphological dimension information without requiring additional model training. However, since it strongly depends on the brightness difference between the weld bead and the base material, it may have limitations in stably detecting the weld bead under conditions involving non-uniform illumination, shadows, low contrast, or spatter noise. Therefore, in this study, the image projection-based procedure proposed by Lee et al. [48] was partially modified and applied to the classification stage. In particular, this study used a reference value corresponding to 20% of the average brightness histogram, namely τ = 0.2, to determine the weld bead region, and this ratio was determined experimentally. Through this modification, unnecessary outer regions and noise in the segmentation results can be reduced, and final quality classification is performed by measuring the bead length and width based on the valid weld bead region.
3. DRE-FCM Algorithm
Weld images present several challenges in image analysis because the color and intensity distributions of the base material and weld bead are similar, and a large amount of noise is included due to spatter generated during the welding process. These characteristics make accurate segmentation of the weld bead region difficult, and low segmentation accuracy can directly affect the performance of subsequent classification tasks. Therefore, improving segmentation accuracy is an important factor in enhancing the reliability of the overall analysis process for weld quality inspection. To address these problems, this study proposes an DRE-FCM based weld bead segmentation method. The proposed method combines the clustering capability of FCM, the global search ability of the Firefly Algorithm, and the edge enhancement effect of the Inverse Gaussian Gradient (IGG). Since FCM calculates the membership degree for each cluster based on differences in pixel intensity, not only bright regions but also dark regions with relatively low intensity can be represented as distinct cluster characteristics. This property is useful for considering shadowed regions around the weld bead or low-light defect candidate regions as segmentation targets. However, conventional FCM is sensitive to initial cluster centers and is prone to convergence to local optima, which can lead to unstable segmentation results in complex weld images. To overcome this limitation, FAFCM, which incorporates the Firefly Algorithm, was applied in this study. FA was selected among various metaheuristic algorithms for the following reasons. Since the attractiveness between fireflies decreases with distance, the population automatically subdivides into subgroups that simultaneously explore different regions of the search space, which makes FA effective in avoiding local optima in multimodal problems. In addition, FA requires relatively few control parameters and involves no crossover or mutation operations, making it computationally efficient for low-dimensional problems such as cluster center initialization with c = 2. Previous FA-based FCM studies have also demonstrated its effectiveness in mitigating the initialization sensitivity of FCM [2,3,4].
The Firefly Algorithm can alleviate the sensitivity to initial cluster centers and the local optimum problem through its global search capability, thereby enabling more stable clustering results [4]. Nevertheless, clustering-based methods are sensitive to changes in pixel intensity and can therefore be strongly affected by noise such as spatter. Accordingly, in this study, multiple noise reduction filters were applied during the segmentation process to minimize the influence of spatter and unnecessary noise, enabling more precise boundary detection. Another major factor that degrades segmentation performance in weld images is non-uniform brightness distribution. In particular, dark regions below the weld bead can blur object boundaries, making contour detection difficult. Simple brightness adjustment is often insufficient to recover such weak boundary information. To overcome this limitation, IGG was applied in the preprocessing stage. IGG enhances edge information weakened by brightness imbalance and compensates for boundary information that can be easily lost in dark regions. This enables more stable boundary detection even in weld images with large luminance variations and ultimately improves the overall segmentation performance. Therefore, the proposed DRE-FCM method is designed to compensate for weak edges in dark regions and brightness imbalance using IGG, while alleviating the sensitivity to initial cluster centers and the local optimum problem using FAFCM. In addition, by incorporating a noise reduction process, the proposed method aims to more stably segment dark regions around the weld bead and low-light defect candidate regions. The pseudo code of the DRE-FCM algorithm is presented below (Algorithm 2).
| Algorithm 2 DRE-FCM (Dark-Region Enhanced FCM) Algorithm |
| Input: Weld bead image I, FA parameters (n, γ, β0, α, Max Generation), FCM parameters (c = 2, m = 2.0, tol = 10−6, maxiter = 300) |
| Output: Binary weld bead mask B |
| Iroi ← ROI Extraction (I) |
| Ig ← Grayscale (Gaussian Blur (Iroi)) |
| s ← Standard Deviation (Ig) |
| σ ← Select sigma (s) using the experimentally determined dispersion-based settings |
| g ← IGG (Ig; σ) using Equation (7) |
| (U, C) ← FAFCM (g; n, γ, β0, α, Max Generation, c, m, tol, maxiter) using Algorithm 1 |
| L ← ARGmaxi (Uij) for each pixel j |
| B0 ← Binary Threshold (L, target = weld bead cluster) B ← Adaptive Median Filter (B0, max kernel size = 3) return B |
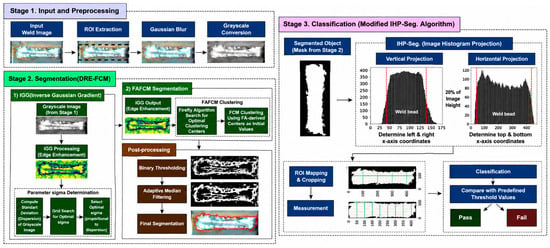
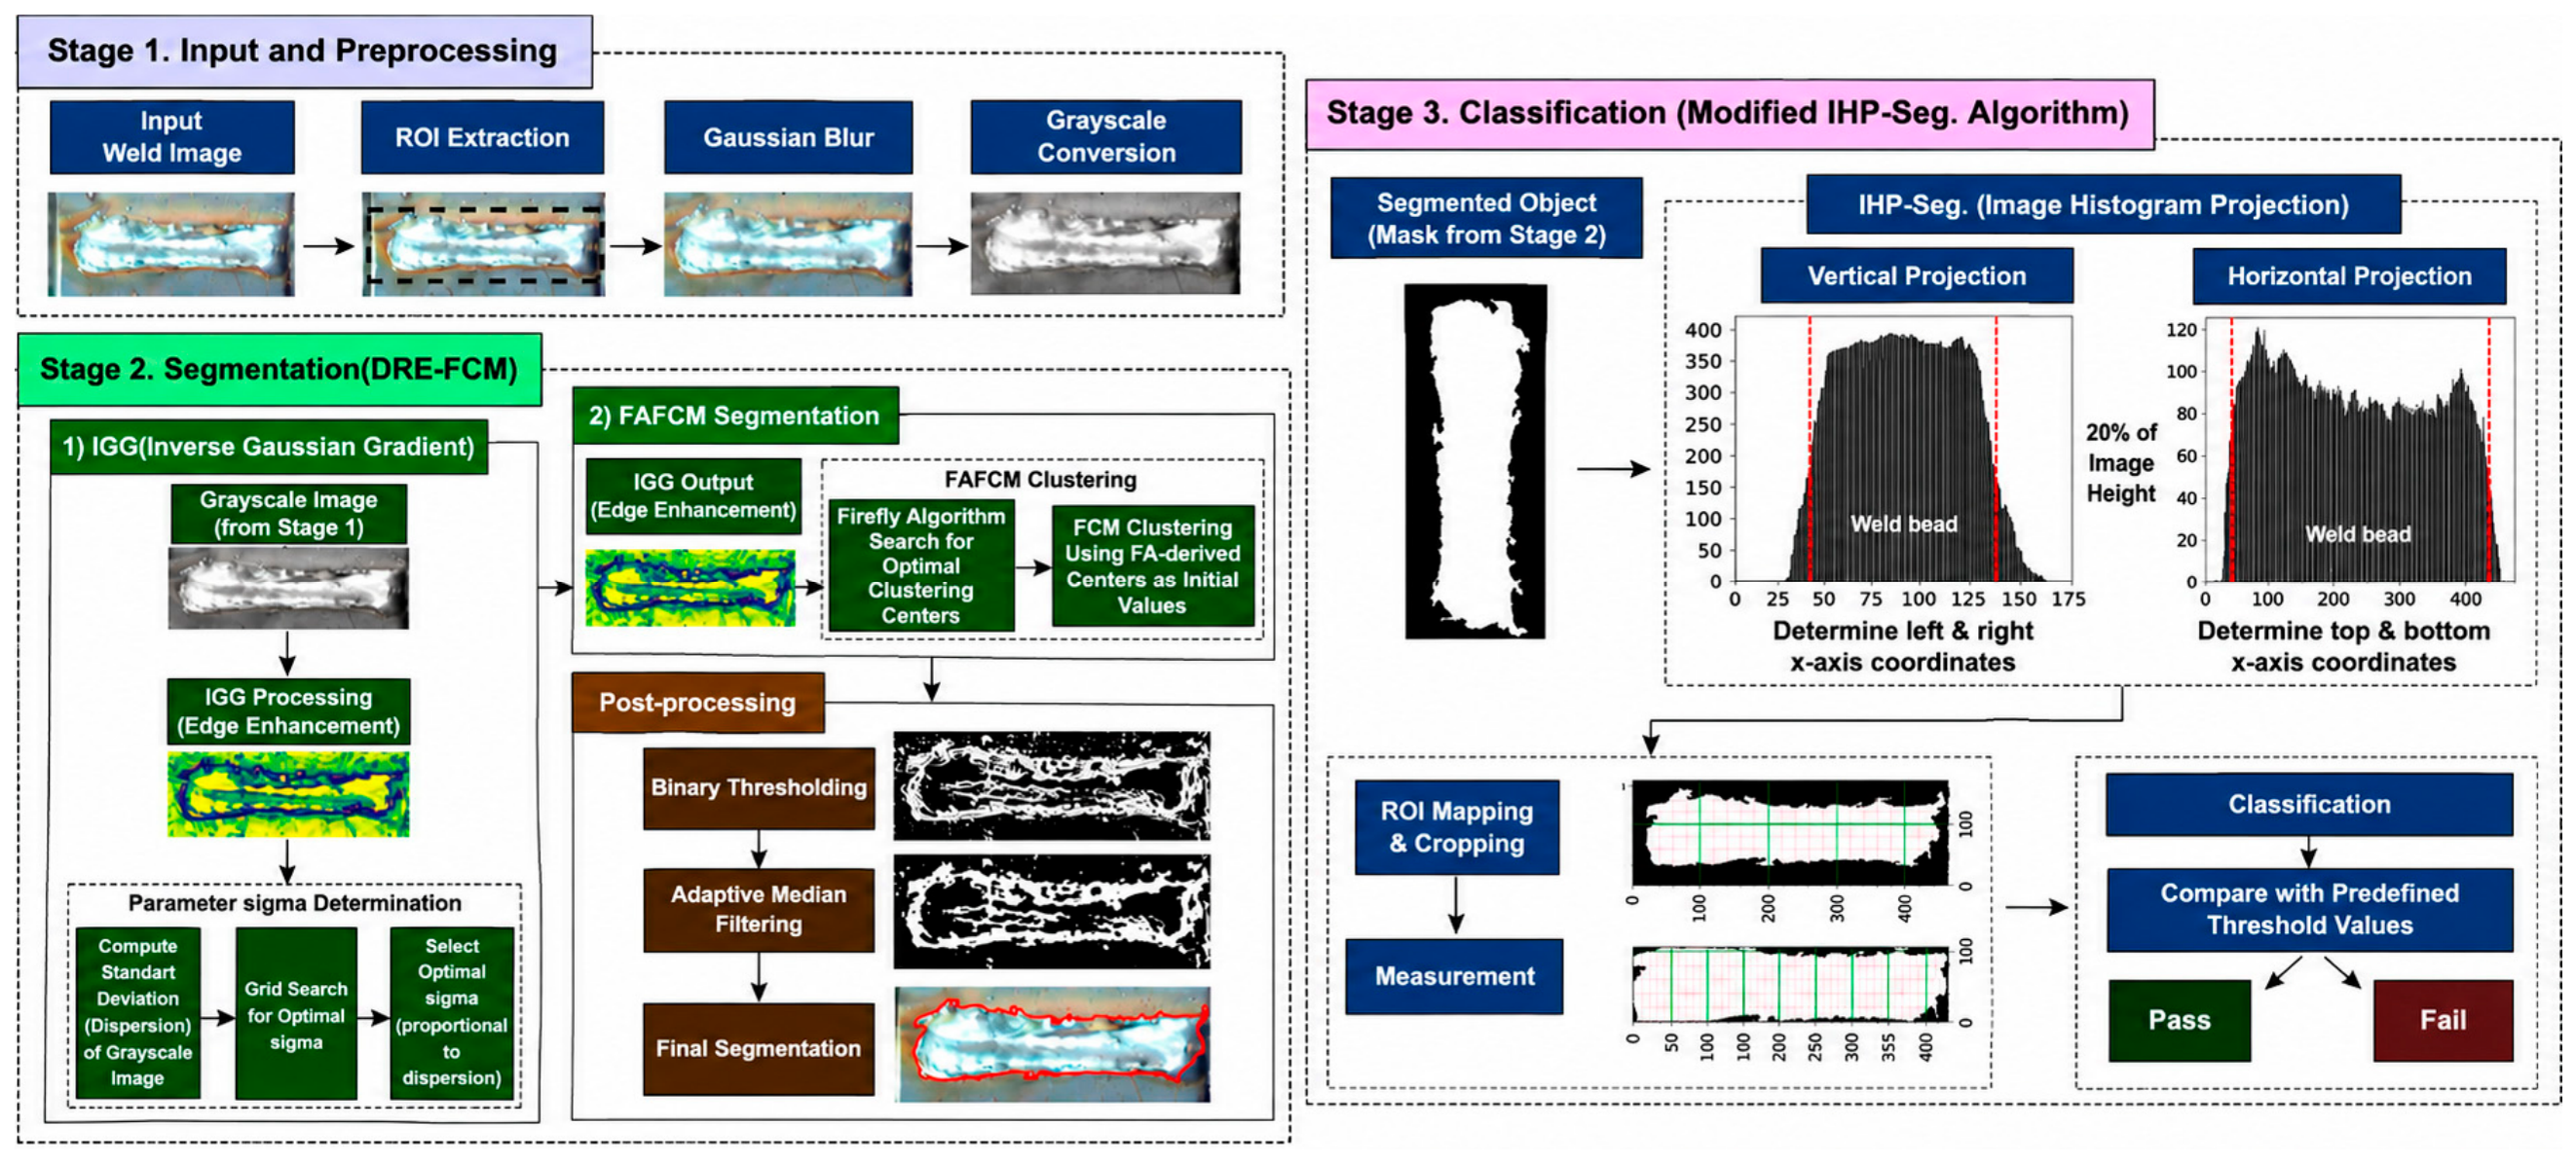
In this paper, we propose a complete weld product analysis framework that covers the entire process from image acquisition to object detection through DRE-FCM based segmentation, followed by classification for quality assessment. The overall workflow is shown in Figure 3. In the segmentation stage, the proposed DRE-FCM method was applied to extract weld bead objects. In the classification stage, selected procedures from the IHP-Seg. algorithm proposed by Lee et al. [48] were utilized. Based on the morphological information of the weld bead extracted from the segmentation results, weld quality was classified.
Figure 3.
Flowchart of the proposed algorithm for weld bead segmentation and quality classification.
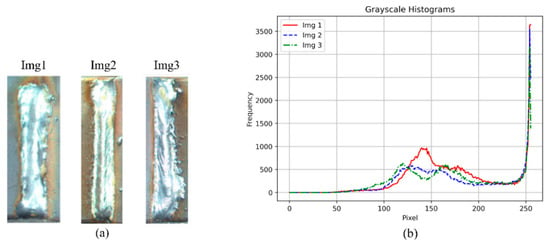
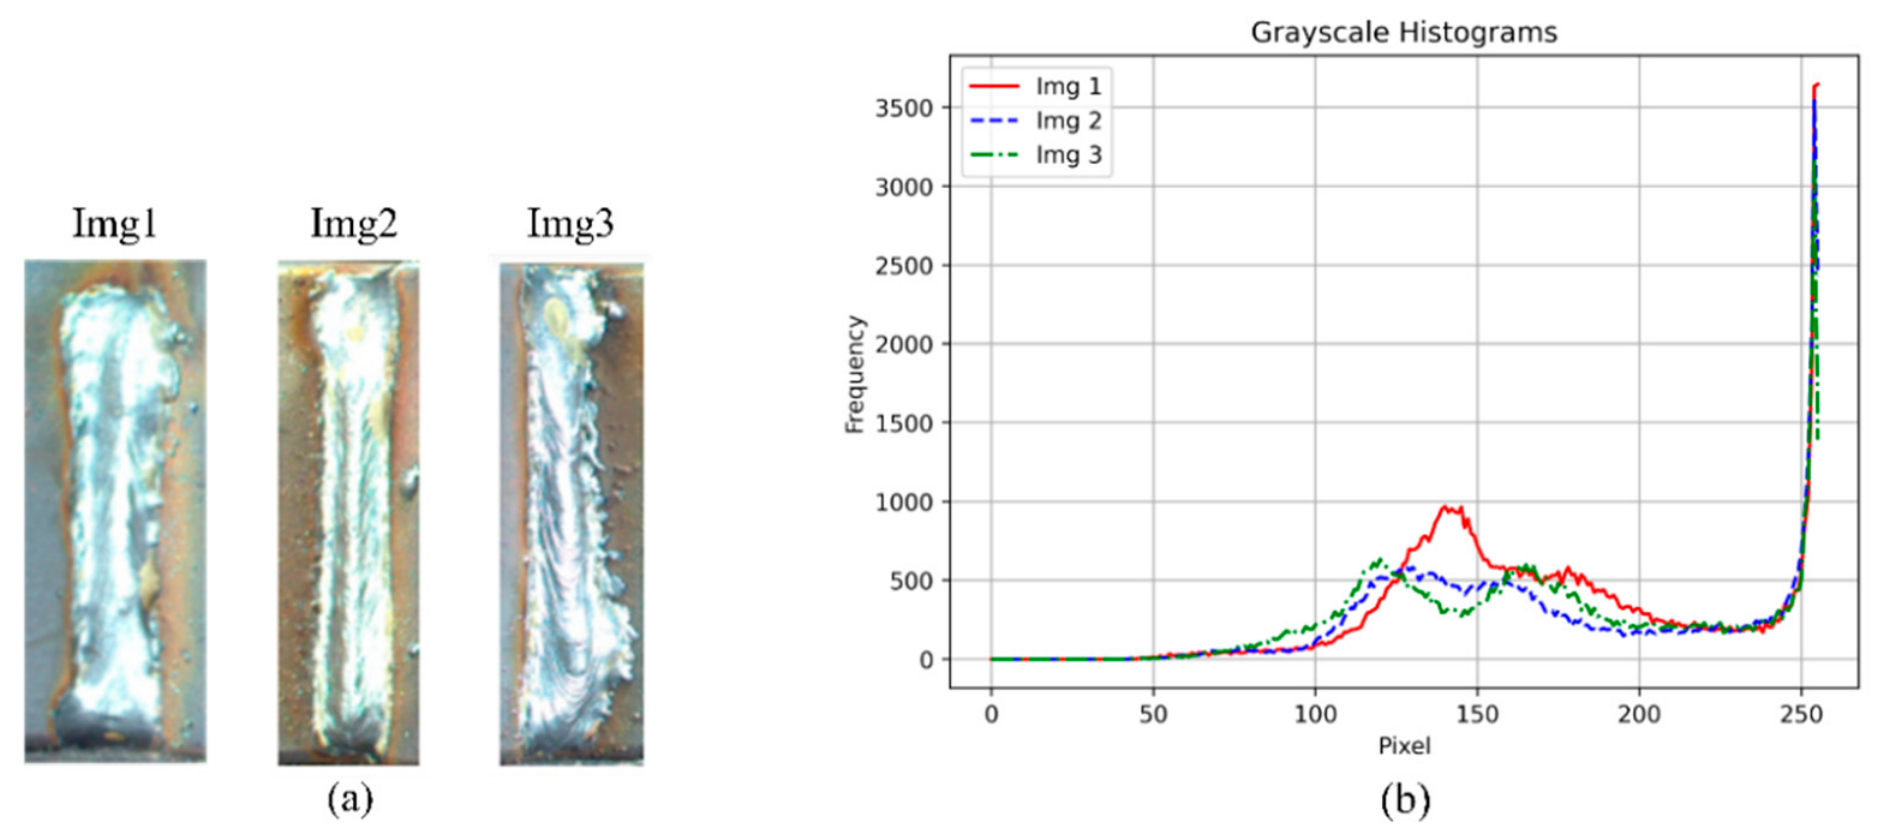
The first stage of the proposed method consists of weld image input and preprocessing. First, a Region of Interest (ROI) is extracted from the input image to reduce computational load and limit the analysis area. Gaussian Blur is then applied to reduce image noise, and the image is converted into a grayscale image for subsequent processing. In the second stage, segmentation of the weld bead region is performed. To accurately detect the outer boundary of the weld bead, the Inverse Gaussian Gradient (IGG) is applied in the preprocessing stage. As shown in Equation (7), the parameter σ controls the sensitivity of edge detection, and the degree of edge enhancement varies depending on the value of σ. In this study, the σ value was adjusted based on the standard deviation of the input grayscale image. In general, a higher image dispersion indicates greater variation in pixel intensity, which may lead to excessive edge detection or the enhancement of even small noise components. Therefore, for images with higher dispersion, a larger σ value was applied to smooth the gradient and reduce sensitivity to noise, thereby enabling more stable boundary detection. Based on this principle, the σ value was adjusted in proportion to the image dispersion, and the optimal σ value was determined through grid search. After the weld bead images shown in Figure 4a were converted into grayscale images, their dispersion values were 48.12, 55.67, and 53.90 from left to right, respectively, and the corresponding histograms are shown in Figure 4b. Based on these dispersion values, the optimal σ value was determined to be 40 for Img.1, which had the lowest dispersion, 45 for Img.3, and 50 for Img.2, which had the highest dispersion. To verify the effectiveness of the dispersion-based σ selection, its segmentation performance was compared with that obtained by applying a fixed σ (35, 40, 45, or 50) to all 30 test images. As shown in Table 1, the dispersion-based σ selection strategy achieved the highest mIoU of 0.894 ± 0.024, whereas the fixed σ settings yielded mIoU values ranging from 0.797 ± 0.143 to 0.852 ± 0.031. These results show that the appropriate σ varies depending on the image characteristics, indicating that adaptively adjusting σ according to the brightness dispersion of the image contributes to effectively balancing weak-edge enhancement.
Figure 4.
IGG parameter setting according to the σ value in grayscale images: (a) Example weld bead images (Img1, Img2, Img3), (b) Grayscale histograms of three images.
Table 1.
Comparison of segmentation performance between fixed σ settings and the dispersion-based σ selection (30 images, mean ± standard deviation).
After IGG preprocessing is completed, segmentation is performed using the FAFCM algorithm. First, the Firefly Algorithm (FA) is used to search for the optimal cluster centers, and the identified cluster centers are then applied as the initial values for FCM. This allows the object and background to be distinguished more effectively and alleviates the sensitivity of conventional FCM to initial cluster centers and its tendency to converge to local optima. However, because weld images inherently contain a high level of noise, FCM may incorrectly detect spatter or unnecessary regions as objects. In addition, although IGG can effectively enhance weak edges in dark regions of the weld bead, it may also emphasize some noise components. To address this issue, binary threshold was first applied, followed by Adaptive Median filtering. This process helps remove unnecessary noise while preserving the actual object contour, thereby improving the accuracy of the final boundary extraction.
In the third stage, classification of the segmented object is performed. In this study, morphological information such as bead length and width was used to determine whether the weld bead satisfied the quality requirements, and a modified Image Histogram Projection-Segmentation algorithm (IHP-Seg. algorithm) was applied for this purpose [48]. The IHP-Seg. algorithm constructs a histogram based on the pixel distribution within the ROI and uses it to extract the valid region of the weld bead object. First, image projection is performed in the vertical direction to generate a pixel density histogram along the x-axis. A reference line corresponding to 20% of the image height (the red line in Stage 3 of Figure 3), which was experimentally determined as the optimal percentage, is then set, and the x-axis coordinates of both edges satisfying this criterion are determined. The determined coordinates are mapped back to the ROI and used to crop the valid region of the weld bead. The same process is repeated in the horizontal direction, through which the height and width of the object are finally measured. Finally, the measured dimensions are compared with predefined threshold values to classify the quality status of the weld bead.
4. Experiments and Results
4.1. Experimental Environment
In this study, a total of 30 good weld product images were used for the first segmentation experiment and the conventional method comparison in the second segmentation experiment. For the deep learning method comparison in the second segmentation experiment, 300 good product images were used for training and validation, and 30 images were used for testing. In the third classification experiment, 330 good product images and 12 defective product images were used for analysis. The weld bead images were captured after product manufacturing at an SRD production factory, under an illumination condition of approximately 700 Lux. All images were resized to a resolution of 256 × 256 pixels. The experimental environment consisted of Windows 10 Pro, an Intel® Core™ i9-10900K CPU @ 3.70 GHz, and Python 3.12.4. Since the proposed method was implemented on a CPU, all comparative experiments were also conducted under the same CPU environment to ensure consistency in the experimental conditions.
4.2. Evaluation Indicators
The image segmentation addressed in this paper is a multi-class classification problem, where each pixel is classified into one of multiple classes. For the evaluation of image segmentation performance, mean Pixel Accuracy (mPA), mean Intersection over Union (mIoU), Dice coefficient and Average Segmentation Time were used, which are defined as follows [49].
where K represents the total number of classes in the dataset, and pii denotes the number of pixels which true class is i and are predicted by the model as class j. A denotes the predicted segmentation region, B denotes the ground truth region, and A ∩ B represents the overlapping region between the prediction and the ground truth. Therefore, Pixel Accuracy (PA) represents the ratio of the number of correctly classified pixels to the total number of pixels, and mean Pixel Accuracy (mPA) is the average of PA across all classes. Intersection over Union (IoU) is a metric that measures the degree of overlap between the prediction (Ip) and the ground truth (Ig), while mean Intersection over Union (mIoU) represents the average of all individual IoUi values. In addition, the Average Segmentation Time (Avg. Seg. Time) refers to the average segmentation speed across the entire dataset, and it was used as an evaluation metric to test real time performance.
4.3. Segmentation Experiments Using DRE-FCM and Clustering Method Derived from FCM
First, weld bead segmentation was performed by applying the Inverse Gaussian Gradient (IGG) operator to FAFCM, a Firefly Algorithm-based FCM clustering method, according to the procedure shown in Figure 3. To determine the optimal σ value for the IGG operation, the dispersion of each grayscale image was first considered, and a grid search was then conducted over σ = 35, 40, 45 and 50. As a result, σ = 40 produced the best segmentation results for all images except Img. 2 and Img. 3 in Figure 4. The main parameters applied to FAFCM were set as follows. The number of clusters c was set to 2 to separate the weld bead from the background, and the fuzziness index m was set to 2.0, which is commonly used as the default value. In addition, the convergence tolerance was set to tol = 0.000001, and the maximum number of iterations, maxiter, was set to 300 to allow sufficient updates of the membership degree. Meanwhile, the maximum kernel size of the Adaptive Median Filter was determined through grid search, and the optimal value was selected as 3. Using the optimized values, a total of 30 weld bead images were analyzed.
As shown in Table 2, the proposed method achieved high segmentation performance, with an mIoU of 0.94, an mPA of 0.98, and a Dice score of 0.98. In addition, an ablation study was conducted to quantitatively analyze the individual contribution of each component of the proposed method to the final segmentation performance. To this end, the performance was compared under conditions in which the main components of the proposed method, namely FA, post-processing, and IGG, were removed individually. As shown in Table 2, the proposed method including all components achieved the best performance, followed by the cases without FA, without post-processing, and without IGG. In particular, the largest decrease in segmentation performance was observed when IGG was removed. This indicates that the IGG operator plays a crucial role in improving the final segmentation performance by enhancing weak edges in dark regions and compensating for brightness imbalance.
Table 2.
Ablation study on the contribution of each component to the final segmentation performance (w/o: without).
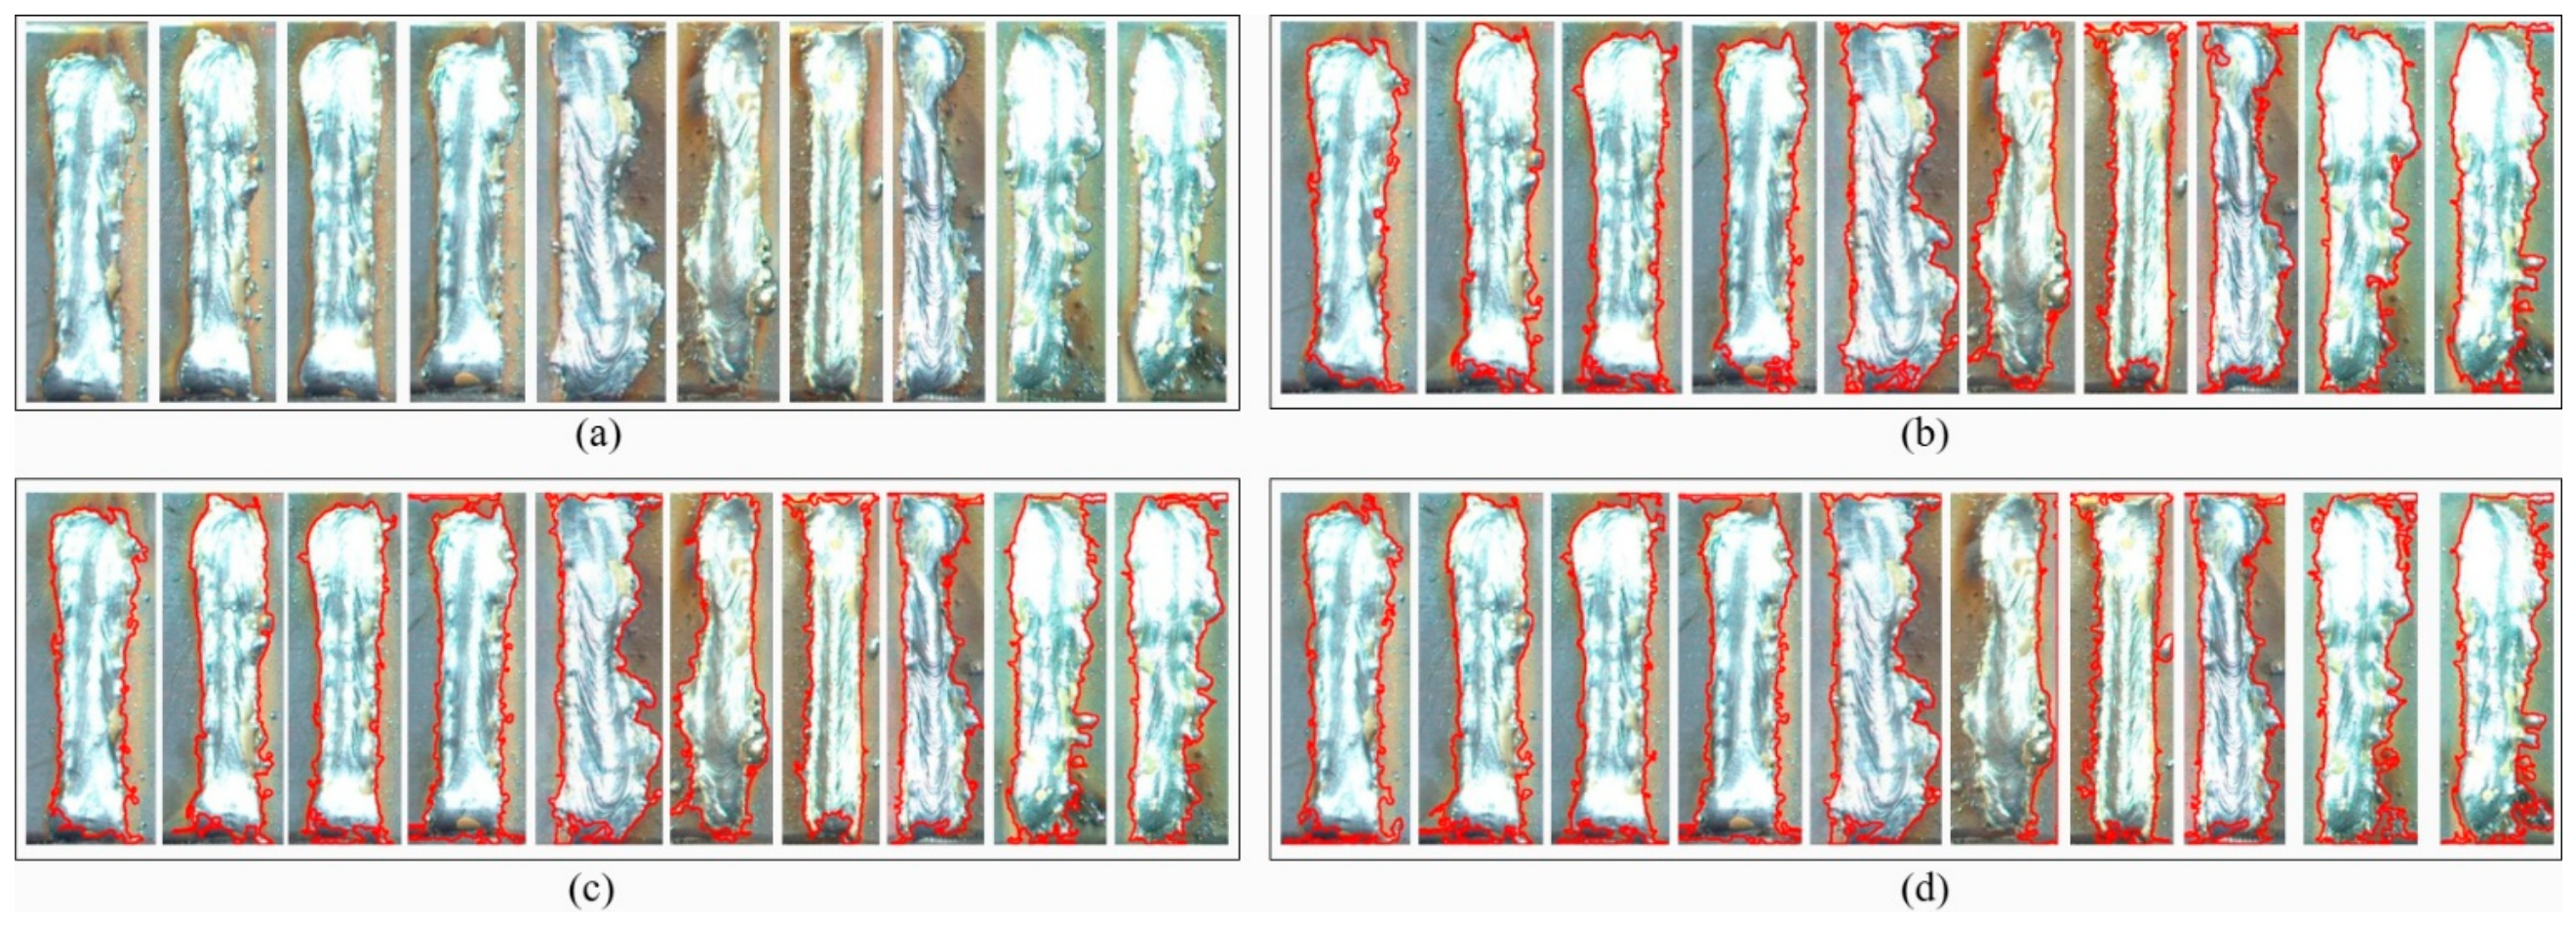
Next, the results of applying the IGG operator to various methods derived from FCM clustering were compared. FCM and CSFCM were selected as the comparison methods, and IGG-based segmentation was performed for all models following the same procedure as FAFCM, as shown in Figure 3. In addition, parameter optimization was conducted for each method, and the same parameter values as those used for FAFCM were selected as the optimal values. As a result, Figure 5 presents 10 representative images selected from the 30 experimental results obtained using each method. Based on the raw images in Figure 5a, DRE-FCM in Figure 5b segmented the weld bead region in a form most similar to the contour of the original image and effectively enhanced the blurred regions at the bottom of the weld bead. In addition, the morphological structure was relatively well preserved in the overall segmentation results. Although slight over- segmentation was observed in the lower region of the third image and in the upper regions of the eighth and tenth images, the irregular boundary regions were generally detected with relatively high accuracy. FCM with IGG in Figure 5c also produced generally acceptable segmentation results; however, compared with DRE-FCM, its contours tended to appear more complex and uneven. In particular, over-segmentation was observed in the fourth, ninth, and tenth images. In contrast, CSFCM with IGG in Figure 5d showed the lowest segmentation performance among the three methods. Specifically, the weld bead region was not properly segmented in the sixth image, and small spatter was excessively detected in the seventh image, resulting in a significant decrease in segmentation accuracy compared with the other models.
Figure 5.
Comparison of segmentation results obtained using FCM-derived methods: (a) Raw data, (b) DRE-FCM, (c) FCM with IGG, (d) CSFCM with IGG.
Table 3 presents the quantitative evaluation results of the segmentation performance for each algorithm shown in Figure 5. DRE-FCM achieved the best performance in both mIoU and mPA. Although FCM with IGG showed the shortest computation time, its segmentation performance was lower than that of DRE-FCM. CSFCM with IGG exhibited the lowest segmentation performance and required a relatively long computation time. These results indicate that FCM with IGG and CSFCM with IGG tend to respond too sensitively to pixel-level variations, leading to excessive boundary segmentation and reduced quantitative accuracy. Therefore, the proposed DRE-FCM is considered to provide the most stable and accurate segmentation performance among the three methods for weld bead images containing weak boundaries and brightness imbalance.
Table 3.
Comparison of segmentation performance metrics for FCM derived algorithms.
4.4. Segmentation Experiments Using Other Methods
To validate the performance of the proposed method, comparative segmentation experiments were conducted by applying conventional methods and deep learning methods to the same weld bead images. As conventional methods, Morphological Geodesic Active Contour with IGG and Improved GrabCut were used. As deep learning methods, various models were compared, including DeepLabV3+, SegFormer-B0, Swin-Unet-Tiny, YOLO11n-seg, DINOv2 ViT-S/14, FastSAM-s, and SAM2. Considering the limited number of experimental data, relatively lightweight models were selected for each deep learning-based method. For the deep learning models, the 330 good product images were divided into 300 images for 5-fold fine-tuning and 30 images for testing. In each fold, 240 images were used for training and 60 images for validation. The 30 test images were identical to those used to evaluate the proposed method and were not included in the training or validation sets. The parameters of each method were optimized based on segmentation performance, recommended values from the corresponding papers, and the experimental environment. For the conventional methods, Morphological Geodesic Active Contour with IGG was configured with iterations = 40, Balloon = −2, and smoothing = 4, while Improved GrabCut was configured with iterCount = 3 and min_size = 100. For the deep learning methods, DeepLabV3+ was set to two classes, namely background and weld bead, and evaluated using 5-fold cross-validation. SegFormer-B0 employed an ImageNet-1K pretrained encoder and was trained using the AdamW optimizer with a learning rate of 0.000001, followed by 5-fold cross-validation. Swin-Unet-Tiny was trained using the SGD optimizer with a momentum of 0.9 and a learning rate of 0.01. YOLO11n-seg was trained for 80 epochs per fold, and the optimizer and learning rate were set according to the recommended values in the original paper. DINOv2 ViT-S/14 was trained using the AdamW optimizer with a learning rate of 0.001. Since FastSAM-s and SAM2 are zero-shot models, their pretrained weights were used without additional fine-tuning.
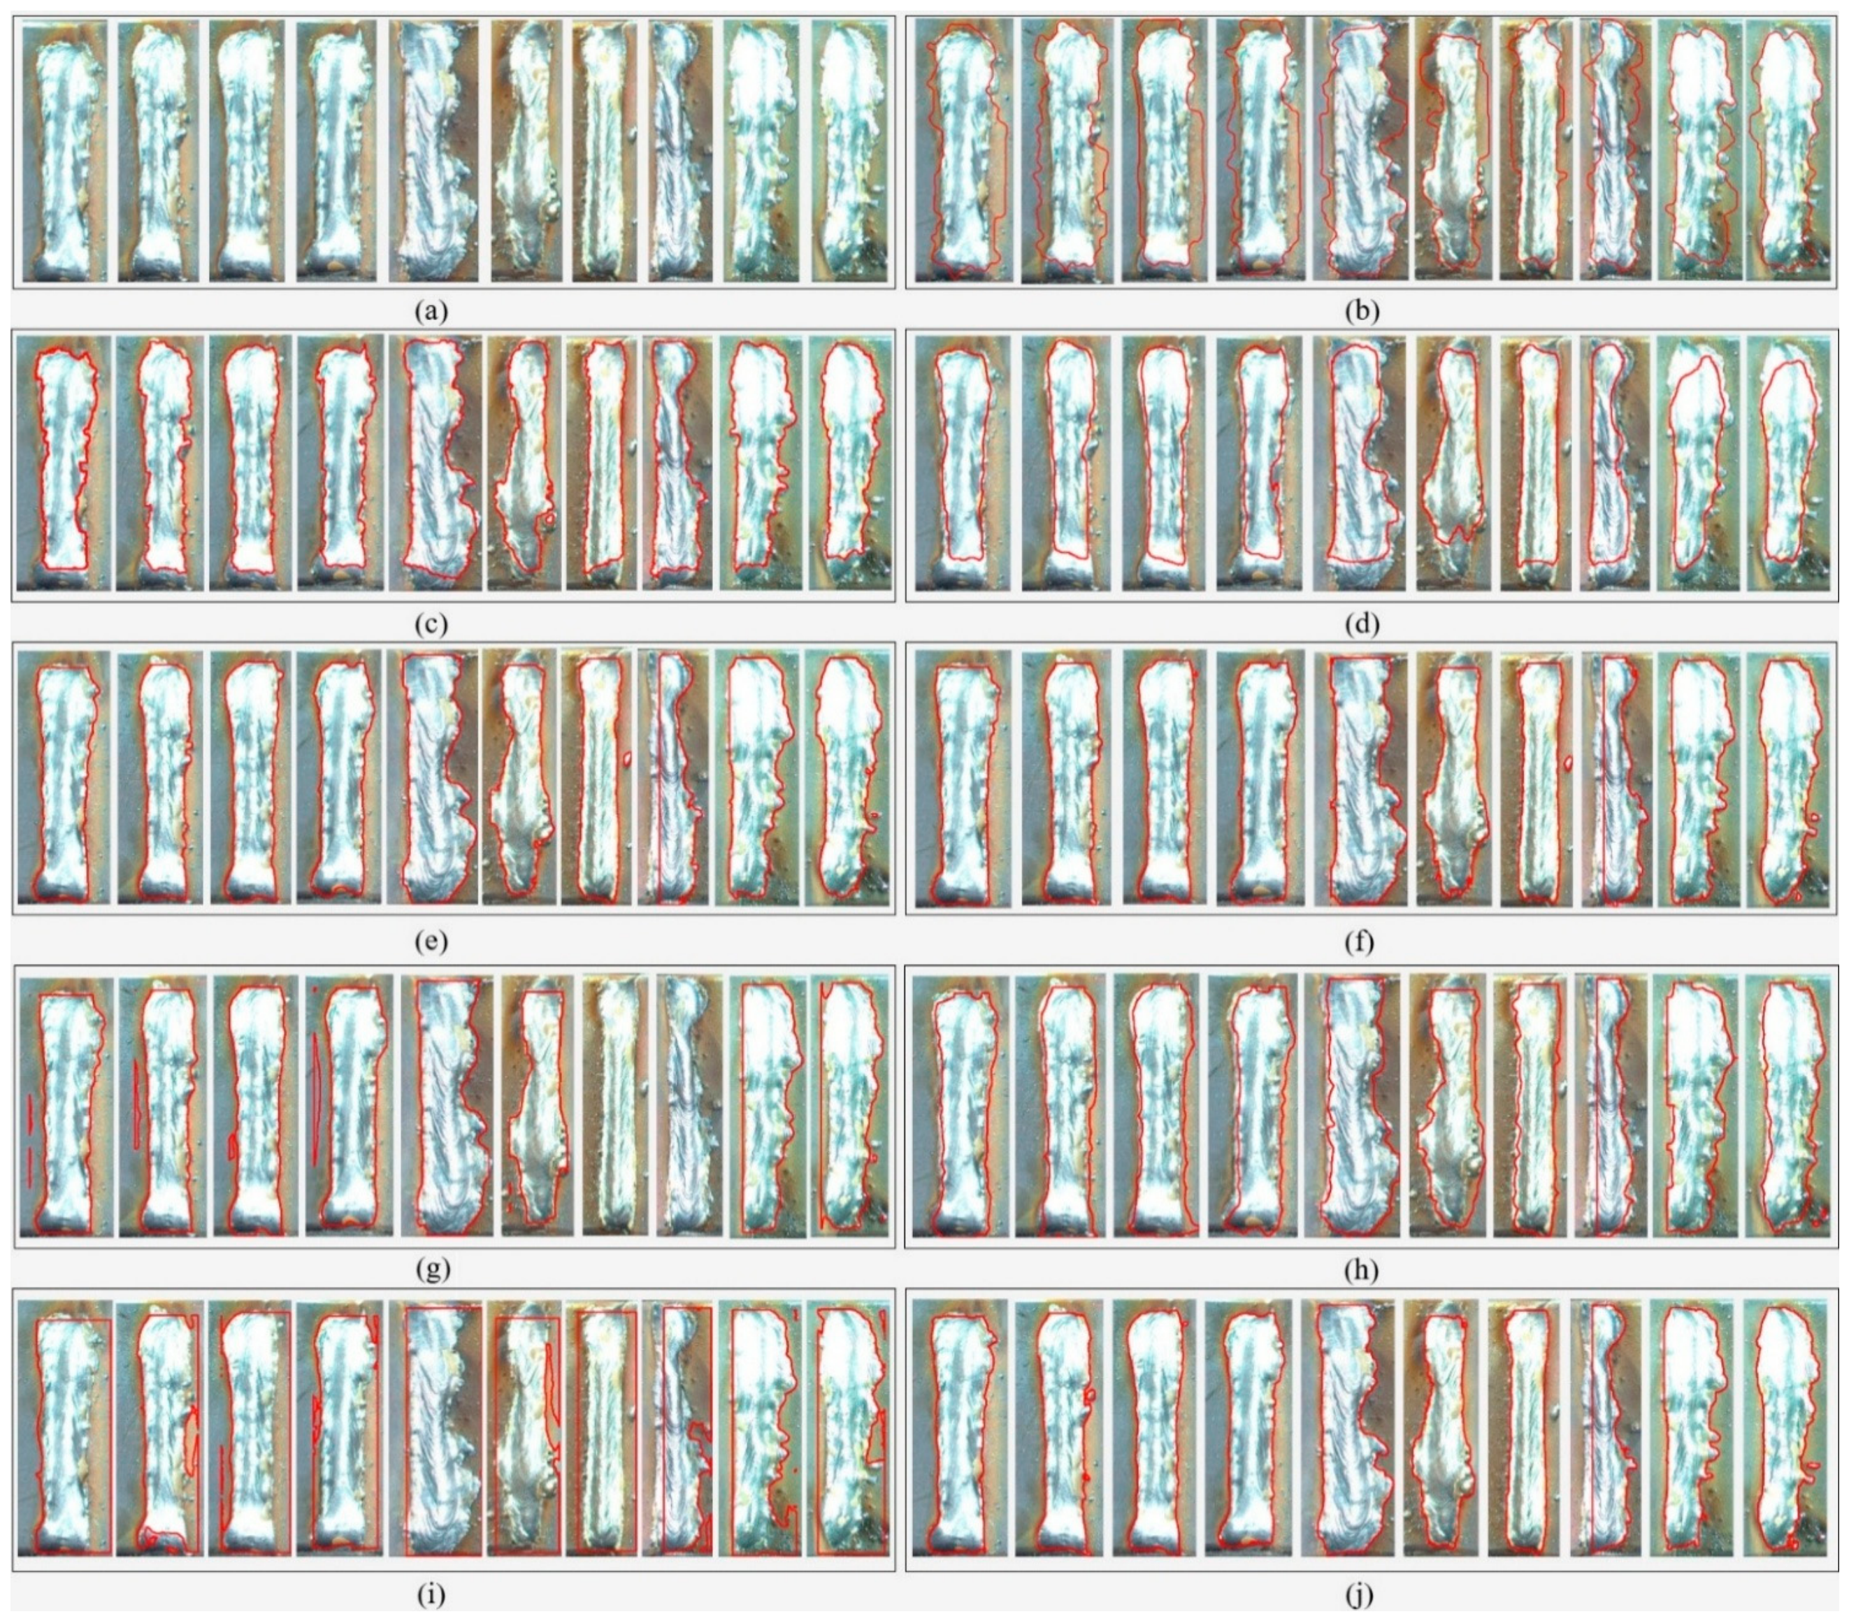
As shown in Figure 6b, Morphological Geodesic Active Contour with IGG generally followed the contour of the weld bead; however, it tended to over-segment regions larger than the actual bead area. Improved GrabCut in Figure 6c preserved the bead contour relatively accurately, but the dark regions below the weld bead were often excluded from the segmentation results. DeepLabV3+ in Figure 6d failed to sufficiently detect the dark regions below the weld bead and showed under-segmentation, particularly in the fifth, sixth, and eighth to tenth images. Among the recently proposed deep learning-based models, most methods, except FastSAM-s, detected the dark regions below the weld bead to some extent. However, SegFormer-B0, Swin-Unet-Tiny, DINOv2 ViT-S/14, and SAM2 failed to segment some upper or left weld regions in several images and additionally detected spatter. YOLO11n-seg detected background regions in some cases or failed to detect the weld bead itself. In contrast, FastSAM-s did not stably segment the weld bead region in most images, showing the lowest qualitative performance.
Figure 6.
Comparison of segmentation results obtained using conventional and deep learning-based methods: (a) Raw data, (b) Morphological geodesic active contour with IGG, (c) Improved Grabcut, (d) DeepLabV3+ (e) SegFormer-B0 (f) Swin-Unet-Tiny (g) YOLO11n-seg (h) DINOv2 ViT-S/14 (i) FastSAM-s (j) SAM2.
Table 4 presents the quantitative evaluation results of the segmentation performance for each method. Consistent with the qualitative results shown in Figure 6, the proposed DRE-FCM achieved the best overall performance in terms of mIoU, mPA, and average segmentation computation time. Among the deep learning methods, SegFormer-B0 and Swin-Unet-Tiny showed relatively good performance; however, unlike the proposed method, they required model training and exhibited substantially longer computation times. SAM2 did not require additional model training and achieved a certain level of segmentation performance, but its heavy model structure resulted in a very long computation time. Conventional methods had the advantage of not requiring model training, but they showed limitations in stably segmenting the dark regions below the weld bead and ambiguous boundaries. In particular, as observed in Figure 6, FastSAM-s showed the lowest segmentation performance. Therefore, the proposed DRE-FCM was able to stably segment dark regions and ambiguous boundaries of weld beads without requiring deep learning model training, even under a limited data environment. In addition, it outperformed the conventional and deep learning-based methods in terms of segmentation accuracy and computational efficiency. A Wilcoxon signed-rank test was conducted to compare the proposed DRE-FCM method with SegFormer-B0 and Swin-Unet-Tiny, which exhibited similar mIoU and mPA performance in Table 4. The mean mIoU differences (ΔmIoU) were +0.001 (95% CI: −0.0154 to 0.0174) and +0.004 (95% CI: −0.0245 to 0.0325) for SegFormer-B0 and Swin-Unet-Tiny, respectively. The corresponding Wilcoxon test statistics (W) were 59 and 57, with p-values of 0.978 and 0.890, respectively. Although no statistically significant differences were observed between DRE-FCM and either model (p > 0.05), the proposed method achieved slightly higher mean mIoU values. These findings suggest that DRE-FCM provides segmentation performance comparable to that of the two deep learning-based models under the evaluated experimental conditions. Furthermore, as shown in Table 4, the proposed method achieved an average segmentation time of 0.15 s per image on a general-purpose CPU using Python, corresponding to approximately 6–7 images per second without requiring a GPU or model training. As shown in Table 3, since FCM with IGG required only 0.04 s, most of the additional computation time of the proposed method can be attributed to the FA-based search for the initial cluster centers, whereas IGG, median filtering, and projection-based classification consist of simple image operations with relatively low computational cost. Therefore, the processing time in a real-time implementation is expected to depend mainly on the FA stage. Additionally, the processing speed is expected to be further improved by implementing the algorithm in a compiled language, parallelizing the fitness evaluation of fireflies, adjusting the population size and the number of generations, or reusing the cluster centers obtained from previous images as initial values under stable process conditions.
Table 4.
Comparison of segmentation performance metrics for conventional and deep learning-based methods.
4.5. Image Classification Using DRE-FCM Segmentation Results
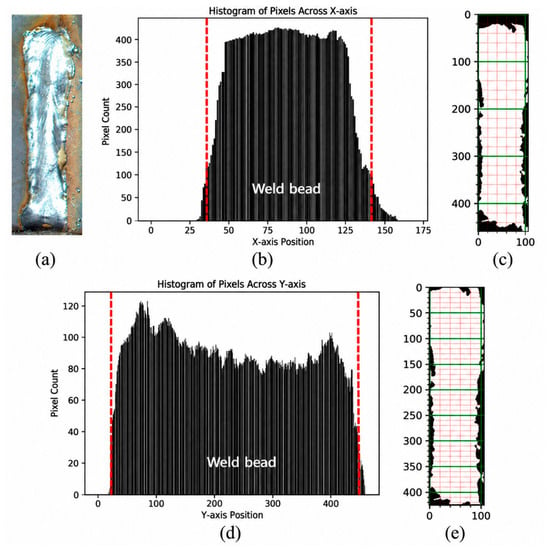
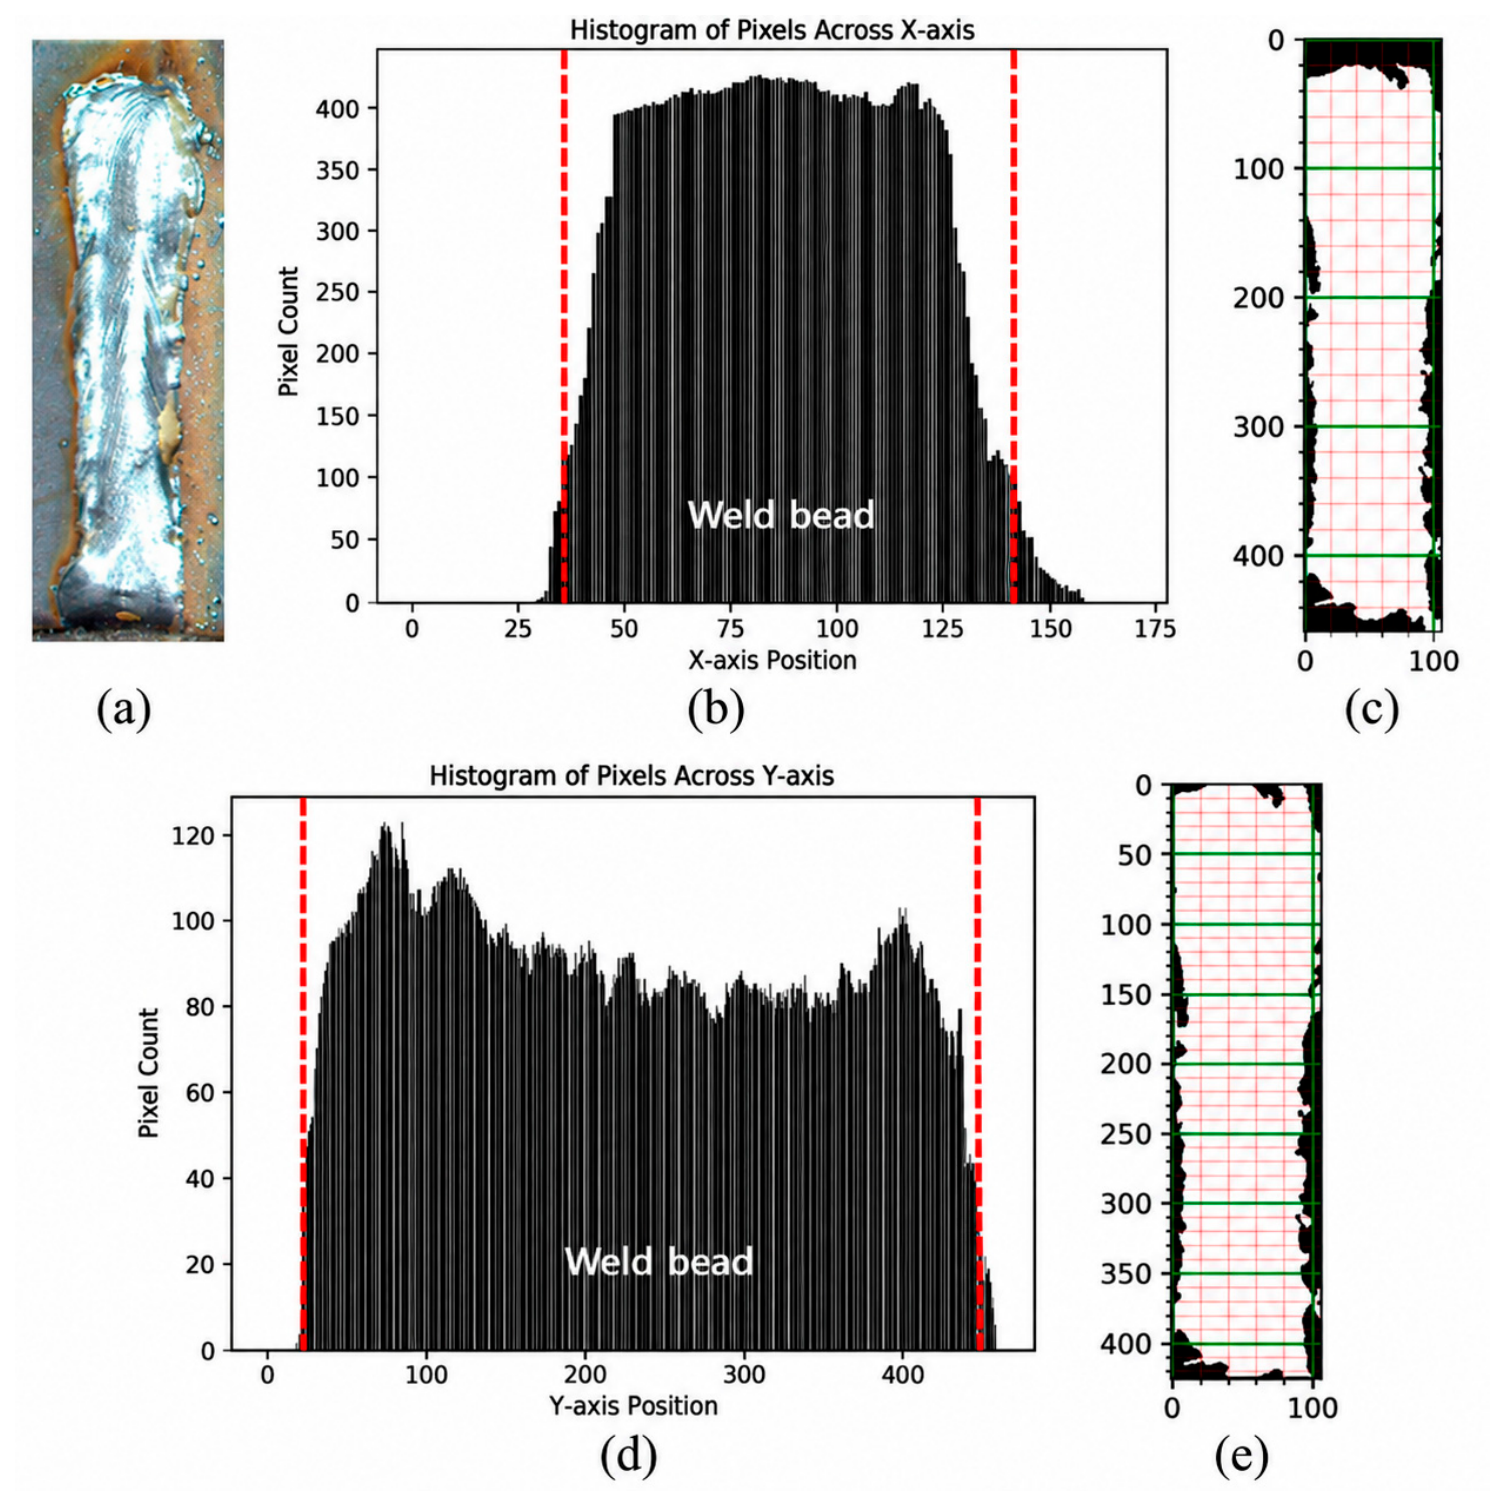
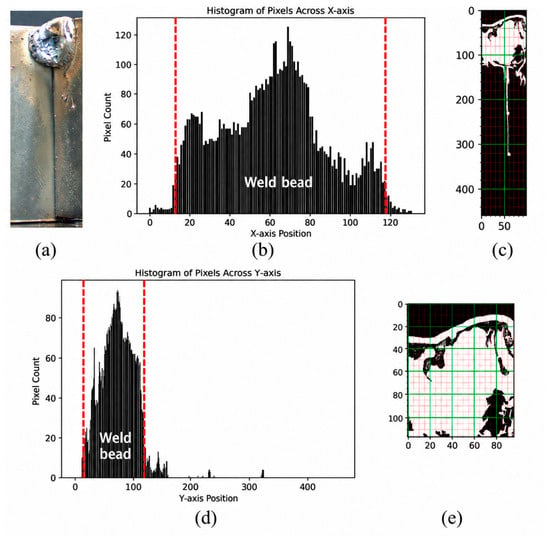
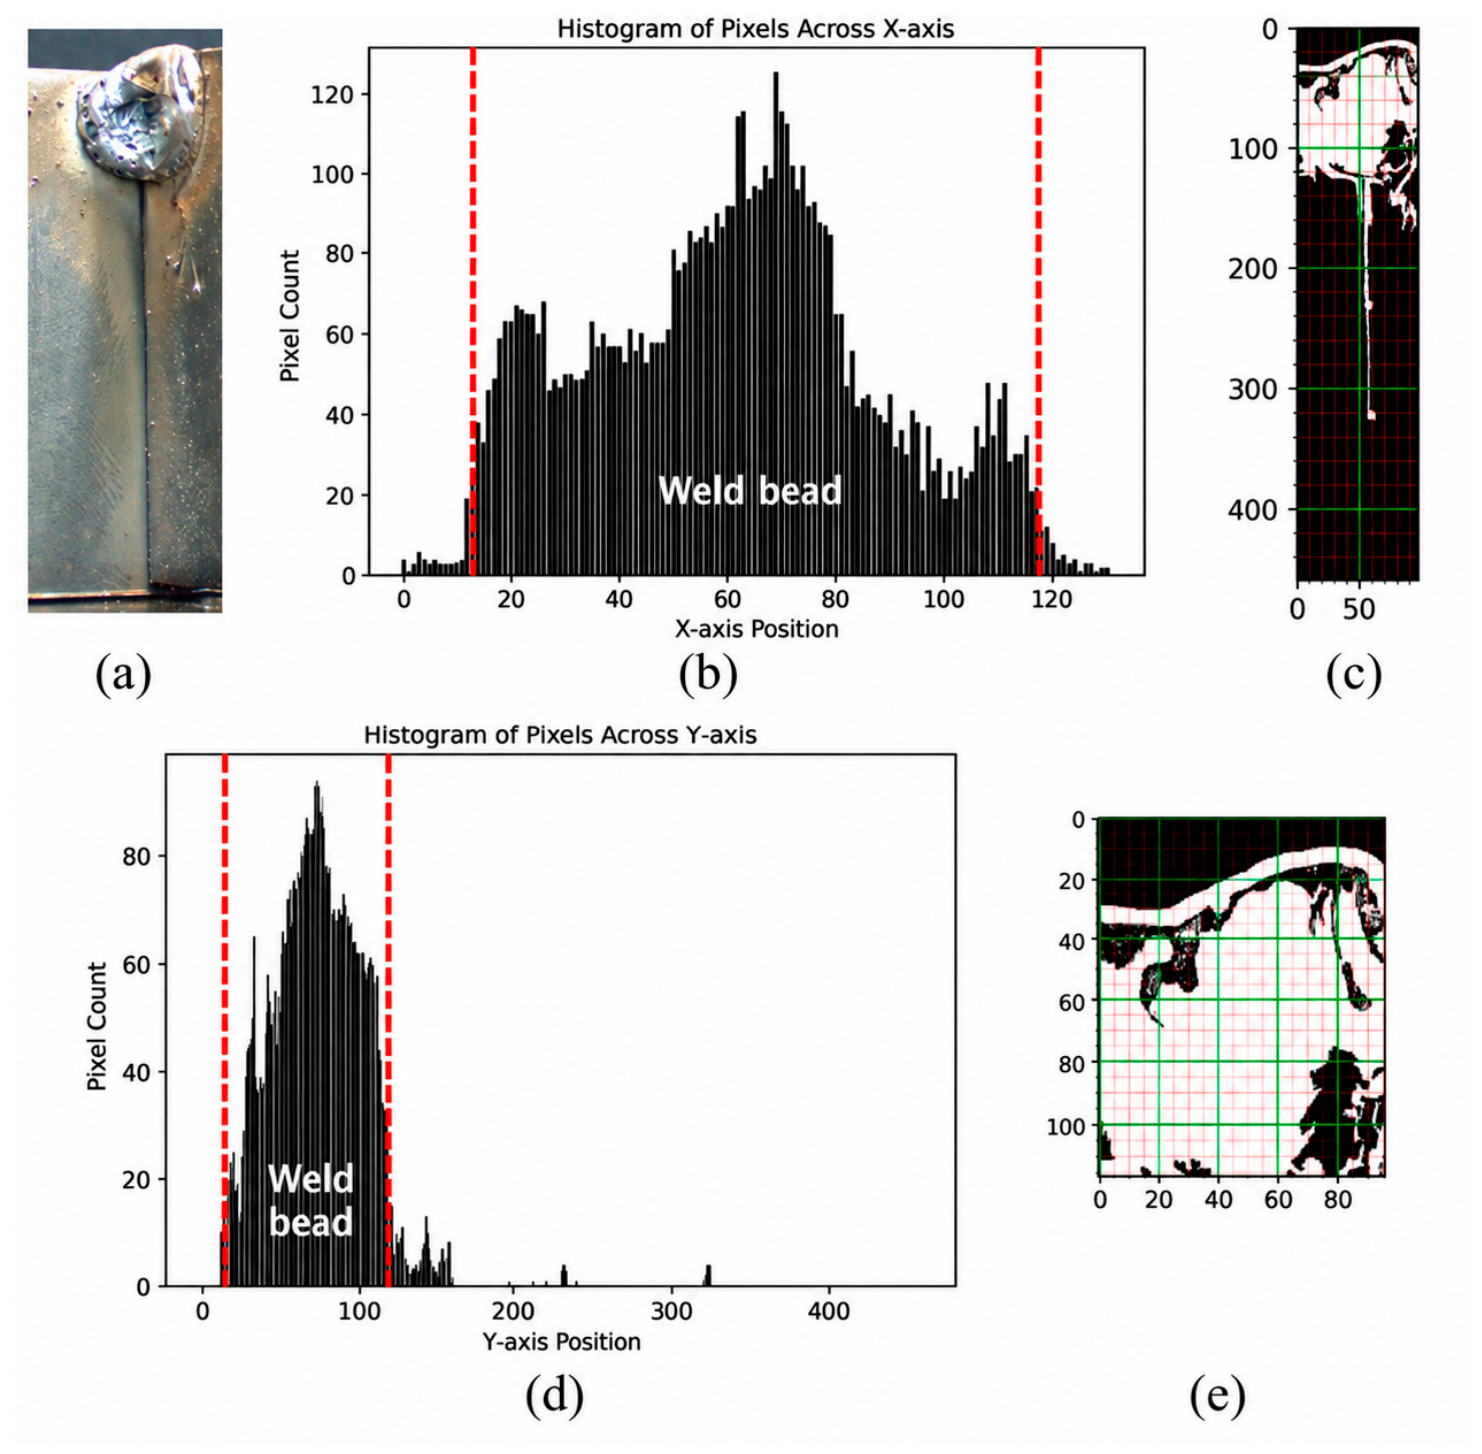
Based on the morphological segmentation results obtained using the DRE-FCM algorithm, final classification was performed to determine the acceptability of the weld bead. In this study, bead length and width, which are important geometric criteria for quality assessment, were used, and the IHP-Seg. algorithm proposed by Lee et al. [48] was applied. In this study, experiments were conducted with τ set to 10%, 20%, and 30%, and Figure 7 and Figure 8 present the results obtained with τ = 20%. Figure 7 and Figure 8 show examples applied to good and defective products, respectively. Figure 7a and Figure 8a show the raw images. Each image was first segmented using the DRE-FCM method and then converted into a binary mask, where the weld bead region was set to white and the background was set to black. Subsequently, image projection-based cropping was performed to accurately extract the weld bead region. First, vertical image projection was applied, as shown in Figure 7b and Figure 8b, to generate a pixel density histogram along the x-axis. In the generated histogram, the position corresponding to 20% of the total height was set as the reference line, and the image was cropped around the region satisfying this criterion. As a result, only the core region containing the weld bead in the vertical direction was extracted, as shown in Figure 7c and Figure 8c. The same procedure was then applied in the horizontal direction using horizontal image projection to generate the histograms shown in Figure 7d and Figure 8d. Based on these histograms, the segmented region was further cropped to obtain the final weld bead regions shown in Figure 7e and Figure 8e. As shown in the x-axis and y-axis histograms in Figure 7b,d and Figure 8b,d, the pixel density is high in the central region where the weld bead is located and sharply decreases toward the edges. This indicates that the regions below the 20% reference line mainly correspond to margins or noise, and that unnecessary outer regions and noise can be effectively removed through image projection-based cropping. Finally, the height and width of the cropped weld bead image were measured. If either measured value was smaller than the height threshold Thrvi or the width threshold Thrhi, the corresponding product was classified as defective. In the experimental dataset, the average height and width of the weld beads were approximately 480 and 70, respectively. Accordingly, the thresholds were set to Thrvi = 200 and Thrhi = 50, corresponding to approximately half of the average values. By applying the proposed criteria, a total of 330 good products and 12 defective products were classified. As shown in the confusion matrix in Table 5, where good products were defined as the positive class, the precision, recall, F1-score, and Matthews correlation coefficient (MCC) were all 1.00. In this study, experiments were conducted with τ set to 10%, 20%, and 30%. When τ = 10% and 20%, all good and defective products were correctly classified, whereas when τ = 30%, 12 of the 330 good products were misclassified as defective, reducing the accuracy to 96.49%. In addition, when τ = 10%, the measured bead region extended beyond the region segmented by DRE-FCM. Therefore, τ = 20% was selected as the final value, as it correctly classified all products while most accurately reflecting the segmented bead region.
Figure 7.
Image projection-based cropping result for a good product: (a) Good product, (b) Image histogram of pixels across x-axis, (c) Result of vertical cut, (d) Image histogram of pixels across y-axis (e) Result of horizontal cut (The red dashed lines indicate the weld bead boundaries determined by the 20% reference line).
Figure 8.
Image projection-based cropping result for a defective product: (a) Defective product, (b) Image histogram of pixels across x-axis, (c) Result of vertical cut, (d) Image histogram of pixels across y-axis (e) Result of horizontal cut (The red dashed lines indicate the weld bead boundaries determined by the 20% reference line).
Table 5.
Confusion matrix of the classification results (positive class: good product).
4.6. Limitations
This study has some limitations. First, the proposed method was validated using weld bead images acquired under controlled illumination conditions of approximately 700 Lux, and its performance in different lighting environments may require further verification. Second, several parameters, including σ in IGG, the median filter size, the projection ratio τ, and the classification thresholds, were determined through grid search or empirical analysis based on the current dataset; therefore, these values may need to be readjusted when the inspection environment changes. In particular, σ is the most sensitive parameter when generalizing the framework to other environments, as its optimal value depends on the grayscale dispersion of the input images; to address this, σ was selected in proportion to the image dispersion, allowing it to be adjusted according to the characteristics of new images. Third, the deep learning models used for comparison were trained on a relatively small dataset, and their performance may improve as more data become available. Nevertheless, the proposed method remains advantageous in limited-data environments because it requires no model training, has low computational cost, and provides interpretable results. In addition, the number of defective samples was limited because defects rarely occur in actual production lines, and the defects in this dataset mainly involved dimensional deviations. Therefore, future work will validate the proposed method using a larger number and wider variety of defective samples.
5. Conclusions
Welding processes have increasingly been automated to support mass production, making technologies for accurately evaluating weld quality and identifying defects more important than ever. In particular, accurate segmentation of weld images is essential for vision-based weld quality inspection. However, conventional segmentation methods often suffer from low segmentation accuracy due to the low contrast between the base material and the weld bead, brightness imbalance, spatter, and image noise. To address these limitations, this study proposes an FCM clustering-based segmentation and classification methodology for weld quality inspection in factory automation environments using weld product images acquired under controlled experimental conditions. Among FCM-based models, FAFCM, which incorporates the Firefly Algorithm to optimize the initial cluster centers, was adopted. In addition, the Inverse Gaussian Gradient (IGG) was applied as a preprocessing step to enhance weak edges in dark regions affected by brightness imbalance, thereby enabling more robust boundary detection. Furthermore, an iterative noise reduction filter was employed to alleviate the noise sensitivity of FAFCM, resulting in more accurate object extraction. In the classification stage, morphological features, including the bead length and width, were utilized to determine whether the weld bead satisfied the quality requirements. To achieve this, a modified version of the IHP-Seg. algorithm was partially adopted, and the extracted morphological characteristics were used for quality classification. Experimental results demonstrated that the proposed method achieved an mIoU of 0.94, an mPA of 0.98, and an average segmentation time of 0.15 s, outperforming the compared methods in terms of segmentation performance. Furthermore, by applying the modified IHP-Seg. algorithm to the segmentation results generated by DRE-FCM, all weld bead samples were correctly classified. In this study, all experiments were conducted on a general-purpose CPU (Intel Core i9-10900K) without GPU acceleration, and the proposed method does not require pre-trained model weights or training. Its main operations, including Gaussian filtering, gradient computation, FCM iterations, median filtering, and histogram projection, are standard image processing operations supported by widely used libraries such as OpenCV and NumPy architectures. Therefore, the proposed method can be deployed on a CPU-based industrial PC installed on the production line, or on an embedded edge device located near the inspection camera, with low memory requirements.
In future work, we plan to validate the method across a wider range of welding and illumination environments and to develop an adaptive parameter selection strategy to improve its generalizability. Furthermore, we will focus on extending the proposed methodology to a wider range of welding environments and product types, conducting a comprehensive comparison with other metaheuristic-based FCM variants (e.g., PSO-, DE-, and GWO-FCM), and improving its real-time processing capability to further enhance its applicability in industrial factory automation.
Author Contributions
Conceptualization, J.L.; methodology, J.L.; software, J.L.; validation, J.L. and J.K.; formal analysis, J.L.; investigation, J.L.; resources, J.L.; data curation, J.L.; writing—original draft preparation, J.L.; writing—review and editing, J.K.; visualization, J.L.; supervision, J.K.; project administration, J.K.; funding acquisition, J.K. All authors have read and agreed to the published version of the manuscript.
Funding
This research was supported by the Regional Innovation System & Education (RISE) program through the Institute for Regional Innovation System & Education in Busan Metropolitan City, funded by the Ministry of Education (MOE) and the Busan Metropolitan City Republic of Korea (2026-RISE(ANCHOR)-02-001-041) and this work was supported in part by the small and Medium Business Technology Innovation Development Project from TIPA, grant number 00278083.
Institutional Review Board Statement
Not applicable.
Informed Consent Statement
Not applicable.
Data Availability Statement
The original contributions presented in this study are included in the article. Further inquiries can be directed to the corresponding author.
Conflicts of Interest
The authors declare no conflicts of interest.
References
- Abdellahoum, H.; Mokhtari, N.; Brahimi, A.; Boukra, A. CSFCM: An improved fuzzy C-means image segmentation algorithm using a cooperative approach. Expert Syst. Appl. 2021, 166, 114063. [Google Scholar] [CrossRef] [Scilit]
- Alomoush, W.; Alrosan, A.; Alomari, Y.M.; Alomoush, A.A.; Almomani, A.; Alamri, H.S. Fully automatic grayscale image segmentation based fuzzy C-means with firefly mate algorithm. J. Ambient Intell. Humaniz. Comput. 2022, 13, 4519–4541. [Google Scholar] [CrossRef] [Scilit]
- Gudise, S.; Babu, K.G.; Savithri, T.S. An advanced fuzzy C-means algorithm for the tissue segmentation from brain magnetic resonance images in the presence of noise and intensity inhomogeneity. Imaging Sci. J. 2024, 72, 520–539. [Google Scholar] [CrossRef] [Scilit]
- Thomas, E.; Kumar, S.N. Fuzzy C-means clustering coupled with firefly optimization algorithm for the segmentation of neurodisorder magnetic resonance images. Procedia Comput. Sci. 2024, 235, 1577–1589. [Google Scholar] [CrossRef] [Scilit]
- Wang, Q.; Wang, X.; Fang, C.; Jiao, J. Fuzzy image clustering incorporating local and region-level information with median memberships. Appl. Soft Comput. 2021, 105, 107245. [Google Scholar] [CrossRef] [Scilit]
- Song, Q.; Wu, C.; Tian, X.; Song, Y.; Guo, X. A novel self-learning weighted fuzzy local information clustering algorithm integrating local and non-local spatial information for noise image segmentation. Appl. Intell. 2022, 52, 6376–6397. [Google Scholar] [CrossRef] [Scilit]
- Zhang, H.; Li, H.; Chen, N.; Chen, S.; Liu, J. Novel fuzzy clustering algorithm with variable multi-pixel fitting spatial information for image segmentation. Pattern Recognit. 2022, 121, 108201. [Google Scholar] [CrossRef] [Scilit]
- Zhang, H.; Liu, J. Fuzzy C-means clustering algorithm with deformable spatial information for image segmentation. Multimed. Tools Appl. 2022, 81, 11239–11258. [Google Scholar] [CrossRef] [Scilit]
- Wu, C.; Wang, Z. A modified fuzzy dual-local information C-mean clustering algorithm using quadratic surface as prototype for image segmentation. Expert Syst. Appl. 2022, 201, 117019. [Google Scholar] [CrossRef] [Scilit]
- Jafrasteh, B.; Lubián-Gutiérrez, M.; Lubián-López, S.P.; Benavente-Fernández, I. Enhanced spatial fuzzy C-means algorithm for brain tissue segmentation in T1 images. Neuroinformatics 2024, 22, 407–420. [Google Scholar] [CrossRef] [Scilit] [PubMed]
- Golzari Oskouei, A.; Hashemzadeh, M.; Asheghi, B.; Balafar, M.A. CGFFCM: Cluster-weight and group-local feature-weight learning in fuzzy C-means clustering algorithm for color image segmentation. Appl. Soft Comput. 2021, 113, 108005. [Google Scholar] [CrossRef] [Scilit]
- Wei, T.; Wang, X.; Li, X.; Zhu, S. Fuzzy subspace clustering noisy image segmentation algorithm with adaptive local variance and non-local information and mean membership linking. Eng. Appl. Artif. Intell. 2022, 110, 104672. [Google Scholar] [CrossRef] [Scilit]
- Wei, D.; Wang, Z.; Si, L.; Tan, C.; Lu, X. An image segmentation method based on a modified local-information weighted intuitionistic fuzzy C-means clustering and gold-panning algorithm. Eng. Appl. Artif. Intell. 2021, 101, 104209. [Google Scholar] [CrossRef] [Scilit]
- Wei, T.; Wang, X.; Wu, J.; Zhu, S. Interval type-2 possibilistic fuzzy clustering noisy image segmentation algorithm with adaptive spatial constraints and local feature weighting and clustering weighting. Int. J. Approx. Reason. 2023, 157, 1–32. [Google Scholar] [CrossRef] [Scilit]
- Huang, C.; Lei, H.; Chen, Y.; Cai, J.; Qin, X.; Peng, J.; Zhou, L.; Zheng, L. Interval type-2 enhanced possibilistic fuzzy C-means noisy image segmentation algorithm amalgamating weighted local information. Eng. Appl. Artif. Intell. 2024, 137, 109135. [Google Scholar] [CrossRef] [Scilit]
- Song, S.; Jia, Z.; Yang, J.; Kasabov, N. Image segmentation based on fuzzy low-rank structural clustering. IEEE Trans. Fuzzy Syst. 2023, 31, 2153–2166. [Google Scholar] [CrossRef] [Scilit]
- Mlyahilu, J.N.; Lee, J.E.; Kim, Y.B.; Kim, J.N. Morphological geodesic active contour algorithm for the segmentation of the histogram-equalized welding bead image edges. IET Image Process. 2022, 16, 2680–2696. [Google Scholar] [CrossRef] [Scilit]
- Huang, K.; Dong, Z.; Wang, J.; Fei, Y. Weld bead segmentation using RealSense depth camera based on 3D global features and texture features of subregions. Signal Image Video Process. 2023, 17, 2369–2383. [Google Scholar] [CrossRef] [Scilit]
- Lei, T.; Gong, S.; Wu, C. A multi-layer multi-pass weld bead cross-section morphology extraction method based on row–column grayscale segmentation. Materials 2024, 17, 4683. [Google Scholar] [CrossRef] [Scilit] [PubMed]
- Hua, S.; Li, B.; Shu, L.; Jiang, P.; Cheng, S. Defect detection method using laser vision with model-based segmentation for laser brazing welds on car body surface. Measurement 2021, 178, 109370. [Google Scholar] [CrossRef] [Scilit]
- Radi, D.; Abo-Elsoud, M.E.A.; Khalifa, F. Accurate segmentation of weld defects with horizontal shapes. NDT E Int. 2022, 126, 102599. [Google Scholar] [CrossRef] [Scilit]
- Zheng, G.; Luo, C.; Shen, M.; Lv, W.; Jiang, W.; Yang, W. Automatic extraction method of weld weak defect features for ultra-high voltage equipment. Energy Eng. 2023, 120, 985–1000. [Google Scholar] [CrossRef] [Scilit]
- Wang, Z.; Shi, Y.; Hong, X.; Zhang, B.; Chen, X.; Zhan, A. Weld pool and keyhole geometric feature extraction in K-TIG welding with a gradual gap based on an improved HDR algorithm. J. Manuf. Process. 2022, 73, 409–427. [Google Scholar] [CrossRef] [Scilit]
- Shekari, M.; Rostamian, M. Brain tumor segmentation from MRI using FCM clustering, morphological reconstruction, and active contour. Multimed. Tools Appl. 2024, 83, 42973–42998. [Google Scholar] [CrossRef] [Scilit]
- Pandey, S.K.; Bhandari, A.K. Morphological active contour based SVM model for lung cancer image segmentation. Multimed. Tools Appl. 2024, 83, 70395–70418. [Google Scholar] [CrossRef] [Scilit]
- Pang, S.; Thio, T.H.G.; Siaw, F.L.; Chen, M.; Xia, Y. Research on improved image segmentation algorithm based on GrabCut. Electronics 2024, 13, 4068. [Google Scholar] [CrossRef] [Scilit]
- Wang, J.; Wang, X. Intelligent trademark image segmentation through multi-stage optimization. Electronics 2025, 14, 3914. [Google Scholar] [CrossRef] [Scilit]
- Wang, Q.; Mei, J.; Jiang, W.; Zhu, H. SHDM-Net: Heat map detail guidance with image matting for industrial weld semantic segmentation network. Eng. Appl. Artif. Intell. 2023, 126, 106946. [Google Scholar] [CrossRef] [Scilit]
- Cai, W.; Shu, L.; Geng, S.; Zhou, Q.; Cao, L. Real-time monitoring of weld surface morphology with lightweight semantic segmentation model improved by attention mechanism during laser keyhole welding. Opt. Laser Technol. 2024, 174, 110707. [Google Scholar] [CrossRef] [Scilit]
- Zhang, C.; Wang, Z.; Zhang, B.; Ma, S.; Jia, D.; Ma, J. RWB-Net: A deep learning framework for automated weld bead segmentation and classification in nuclear reprocessing plants. J. Manuf. Process. 2025, 153, 113–137. [Google Scholar] [CrossRef] [Scilit]
- Cai, W.; Shu, L.; Geng, S.; Zhou, Q.; Cao, L. Weld beads and defects automatic identification, localization, and size calculation based on a lightweight fully convolutional neural network. Opt. Laser Technol. 2024, 170, 110266. [Google Scholar] [CrossRef] [Scilit]
- Wang, J.; Huang, L.; Yao, J.; Liu, M.; Du, Y.; Zhao, M.; Su, Y.; Lu, D. Weld seam tracking and detection robot based on artificial intelligence technology. Sensors 2023, 23, 6725. [Google Scholar] [CrossRef] [Scilit] [PubMed]
- Wei, P.; Cheng, S.; Li, D.; Song, R.; Zhang, Y.; Zhang, W. Coarse-to-fine detection of multiple seams for robotic welding. arXiv 2024, arXiv:2408.10710. [Google Scholar]
- Wu, Z.; Gao, P.; Han, J.; Bai, L.; Lu, J.; Zhao, Z. Real-time segmentation network for accurate weld detection in large weldments. Eng. Appl. Artif. Intell. 2023, 117, 105008. [Google Scholar] [CrossRef] [Scilit]
- Kang, S.; Qiang, H.; Yang, J.; Liu, K.; Qian, W.; Li, W.; Pan, Y. Research on a feature point detection algorithm for weld images based on deep learning. Electronics 2024, 13, 4117. [Google Scholar] [CrossRef] [Scilit]
- Zou, Y.; Zeng, G. Lightweight segmentation network based on SOLOv2 for weld seam feature extraction. Measurement 2023, 208, 112492. [Google Scholar] [CrossRef] [Scilit]
- Chen, J.; Wang, C.; Shi, F.; Kaaniche, M.; Zhao, M.; Jing, Y.; Chen, S. DSNet: A dynamic squeeze network for real-time weld seam image segmentation. Eng. Appl. Artif. Intell. 2024, 133, 108278. [Google Scholar] [CrossRef] [Scilit]
- Zhao, M.; Liu, X.; Wang, K.; Liu, Z.; Dong, Q.; Wang, P.; Su, Y. Welding seam tracking and inspection robot based on improved YOLOv8s-Seg model. Sensors 2024, 24, 4690. [Google Scholar] [CrossRef] [Scilit] [PubMed]
- Zhang, S.; Zhang, Y. Automated weld defect segmentation from phased array ultrasonic data based on U-Net architecture. NDT E Int. 2024, 146, 103165. [Google Scholar] [CrossRef] [Scilit]
- Yang, W.; Xiao, Y.; Shen, H.; Wang, Z. Generalized weld bead region of interest localization and improved Faster R-CNN for weld defect recognition. Measurement 2023, 222, 113619. [Google Scholar] [CrossRef] [Scilit]
- Zhou, Y.; Shi, K.; Hao, G. WRT-SAM: Foundation model-driven segmentation for generalized weld radiographic testing. arXiv 2025, arXiv:2502.11338. [Google Scholar]
- Naddaf-Sh, A.-M.; Baburao, V.S.; Zargarzadeh, H. Leveraging Segment Anything Model (SAM) for weld defect detection in industrial ultrasonic B-scan images. Sensors 2025, 25, 277. [Google Scholar] [CrossRef] [Scilit] [PubMed]
- Wang, S.; Li, M.; Xue, F.; Zhang, H.; Jia, D. WFD-YOLO: A hybrid YOLO architecture with frequency-domain guidance for weld defect segmentation. Appl. Sci. 2026, 16, 6019. [Google Scholar] [CrossRef] [Scilit]
- Zhang, S.; Wang, X.; Zhang, T. Combining multi-scale U-Net with Transformer for welding defect detection of oil/gas pipeline. IEEE Access 2025, 13, 5437–5445. [Google Scholar] [CrossRef] [Scilit]
- Yang, L.; Wang, H.; Meng, W.; Pan, H. CvT-UNet: A weld pool segmentation method integrating a CNN and a transformer. Heliyon 2024, 10, e34738. [Google Scholar] [CrossRef] [Scilit] [PubMed]
- Oquab, M.; Darcet, T.; Moutakanni, T.; Vo, H.; Szafraniec, M.; Khalidov, V.; Fernandez, P.; Haziza, D.; Massa, F.; El-Nouby, A.; et al. DINOv2: Learning robust visual features without supervision. arXiv 2023, arXiv:2304.07193. [Google Scholar]
- Cao, H.; Wang, Y.; Chen, J.; Jiang, D.; Zhang, X.; Tian, Q.; Wang, M. Swin-Unet: Unet-like pure transformer for medical image segmentation. In Proceedings of the European Conference on Computer Vision Workshops (ECCVW), Tel Aviv, Israel, 23–27 October 2022; Springer: Cham, Switzerland, 2023; Volume 13803, pp. 205–218. [Google Scholar] [CrossRef] [Scilit]
- Lee, J.; Choi, H.; Kim, J. Inspection algorithm of welding bead based on image projection. Electronics 2023, 12, 2523. [Google Scholar] [CrossRef] [Scilit]
- Qi, M.; Gao, H.; Wang, T.; Du, B.; Li, H.; Zhong, W.; Tang, Y. Method for segmentation of bean crop and weeds based on improved UperNet. IEEE Access 2023, 11, 143804–143814. [Google Scholar] [CrossRef] [Scilit]

Disclaimer/Publisher’s Note: The statements, opinions and data contained in all publications are solely those of the individual author(s) and contributor(s) and not of MDPI and/or the editor(s). MDPI and/or the editor(s) disclaim responsibility for any injury to people or property resulting from any ideas, methods, instructions or products referred to in the content. |
© 2026 by the authors. Licensee MDPI, Basel, Switzerland. This article is an open access article distributed under the terms and conditions of the Creative Commons Attribution (CC BY) license.