


Featured Application
Task-specific validation and simple training-derived references can expose limitations of kinematic landing-force estimates that pooled scores conceal. The evaluation applies to offline biomechanics research.
Abstract
The contribution of contact-aligned kinematics to landing-force estimation requires evaluation against simple task-based predictions. We analyzed 2191 trials from 43 participants across six jump-landing tasks and two fatigue conditions. The outcome was peak total vertical ground reaction force within 150 ms of the assigned contact event, normalized to body weight (BW). Participant-disjoint nested cross-validation evaluated 160 kinematic features, fixed model families, and a procedure selecting the family and hyperparameters through inner validation. ElasticNet achieved a participant-balanced mean absolute error of 0.662 BW, compared with 0.608 BW for a training-derived task-specific median; all four learning procedures had higher error. Target-task exclusion increased AdaptiveML’s six-task macroaveraged error by 0.113 BW (95% confidence interval, 0.076–0.150) relative to an equal-size training control retaining the target task. Fatigued-to-non-fatigued transfer increased its error by 0.022 BW (adjusted ); the reverse estimate was BW (adjusted ). The directional contrast varied across model families. A broader engineered representation improved Ridge performance but did not clearly improve on the task-specific median. Task coverage affected estimator performance, while these models did not demonstrate additional accuracy beyond task-based references. The analyses concern retrospective estimation from processed, force-aligned kinematics and do not establish prospective or clinical validity.
1. Introduction
Estimating early landing vertical ground reaction force (vGRF) from movement recordings requires more than a favorable error averaged across all trials. The estimate must be evaluated in new participants and against references appropriate to the movements represented in development. vGRF measures the external load exchanged with the ground; it does not measure ligament force or future injury. Clinical biomechanics illustrates the importance of defining the outcome precisely. Studies after anterior cruciate ligament reconstruction (ACLR) have reported altered involved-limb loading, with findings that depend on the task, limb, and force measure examined [1,2]; measurement and reporting methods also vary across this literature [3]. Even the first and second landings of a drop vertical jump can differ in interlimb force asymmetry despite similar peak vGRF [4]. A longitudinal stair-descent study found changes in muscle coordination across the first postoperative year [5], providing complementary neuromuscular evidence rather than a direct measure of external landing force.
The movement preceding contact may carry information about subsequent impact. In single-leg lateral landings, pre-contact knee flexion was associated with peak vGRF [6]. Vertical-jump and step-off landings from equal heights differed in pre-contact joint configuration and subsequent vertical impulse [7]. Comparisons across landing protocols have also shown task-dependent kinematics and kinetics [8,9,10]. After ACLR, whole-body asymmetry, performance, and force-time patterns vary across tasks or movement phases [11,12,13]. A model trained across several tasks could therefore obtain a favorable pooled score by capturing task-level differences while estimating variation within each task poorly. Task-specific reporting and a simple task-conditioned reference are needed to determine how much information the kinematic features add.
Ground reaction force has been estimated from inertial sensors during jump landing and other movements [14,15,16], and from video-based pose estimates during single-leg landing [17]. OpenCap derives movement dynamics from smartphone video [18]; a subsequent study used its kinematics and a mechanical model to estimate force profiles across several jump types [19]. A review of inertial approaches in ACL rehabilitation identified generalization to patient populations and varied movements as an unresolved issue [20]. These methods differ in sensing modality, available time span, force outcome, and evaluation design. Their reported errors cannot directly establish the performance of an estimator using only a short, contact-aligned segment of processed joint angles. For repeated-trial data, participant-disjoint evaluation tests new-person generalization, whereas task exclusion tests a movement absent from model development [21,22,23]. Learned preprocessing and model selection must remain inside the development partitions [24].
Fatigue may change landing kinematics or force-time behavior, although the affected measures and direction of change depend on the protocol and task [25,26,27,28,29]. Ankle kinematics have also been used to estimate musculoskeletally simulated ACL force during single-leg landing before and after fatigue [30]. That outcome differs from measured external vGRF. A biomechanical change alone does not show that a force estimator will generalize less well, and a directional difference in prediction error does not identify a physiological fatigue mechanism.
The public dataset of Calisti et al. [31,32] contains synchronized motion and force recordings for six jump-landing tasks before and after a fatigue protocol in participants with and without ACL injury history. The ACL-history group includes both surgically and conservatively treated participants. Earlier analyses classified injury history from post-contact joint angles [33] or compared early post-contact kinematics in two unilateral tasks [34]. We evaluated a different question: how participant separation, task coverage, fatigue-condition coverage, and kinematic representation affect offline estimates of early peak total vGRF. We compared learned models with training-only global and task-conditioned baselines, controlled training-set size when evaluating task exclusion, and assessed whether the fatigue findings depended on model family. Inputs used the released, zero-lag-filtered kinematics at nominally pre-contact times and a force-derived contact event; the study therefore evaluates retrospective estimation rather than prospective prediction.
2. Materials and Methods
2.1. Data Source, Protocol, and Analysis Cohort
We performed a secondary analysis of the public jump-landing dataset of Calisti et al. [31,32], distributed under a CC BY 4.0 license. The released cohort contained 43 participants: 21 with an ACL injury history, including 19 who had undergone ACL reconstruction and two treated nonoperatively, and 22 controls. The ACL-history group was therefore not an exclusively post-ACLR sample. Source eligibility required no lower-limb injury within the preceding six months and no history of severe ankle injury. Participants in the ACL-history group had experienced one or two ipsilateral ACL injuries and had been cleared to return to level I sport for at least one year before testing. The original study had University of Innsbruck ethics approval (certificate 98/2022) and written informed consent [31].
The protocol included bilateral countermovement jumps (CMJ), single-leg countermovement jumps (uCMJ), single-leg crossover hops (COH), bilateral drop jumps (DJ), single-leg medial rotation hops (MRH), and single-leg forward hops (SLH). DJs were performed by stepping off a 30-cm box, absorbing the first landing, and then jumping upward. Non-fatigued trials were collected before the fatigue protocol. Fatigue was induced by repeated single-leg squats and 30-cm step-ups, with a criterion of either a reduction of at least 20% in maximal jump height or a reduction of at least 10% together with a Borg CR10 rating above 5. Exercise bouts were repeated to maintain the fatigued condition [31].
The release audit identified 2200 trial containers with recomputable load targets. The source-quality exclusion s29_CMJ_r_t2.c3d, which mapped to a uCMJ record in the analysis inventory, was removed, leaving 2199 records. We also excluded s39_CMJ_t3.c3d: its exceptional contact-event adjudication could not be sufficiently supported by the available physical-event evidence to retain a manually selected event. Seven DJ records lacked the complete primary input window. The final cohort comprised 2191 trials from all 43 participants: 255 CMJ, 507 uCMJ, 171 COH, 242 DJ, 507 MRH, and 509 SLH trials, including 1099 non-fatigued and 1092 fatigued trials. Participants contributed 33–52 trials (median, 52); 35 contributed all 52 planned trials. All models, baselines, and sensitivity analyses used this same cohort. The trial-identity and exclusion ledger is provided in Supplementary Methods S1 and Table S1.
2.2. Processed Kinematics, Contact Event, and Load Target
The source study recorded synchronized marker trajectories at 250 Hz and force-platform signals at 1000 Hz. Released inverse-kinematics coordinates were calculated in OpenSim 4.3 after marker trajectories had been processed with a third-order, 15-Hz zero-lag Butterworth filter. The source inverse-kinematics processing used the MATLAB–OpenSim scripting interface (MATLAB R2021a; The MathWorks, Inc., Natick, MA, USA) [31]. We used these released coordinates rather than reconstructing a causally filtered signal pipeline.
Source contact events were defined by filtered, resampled vertical force exceeding 20 N. The supplied IC field was used for uCMJ, COH, MRH, and SLH; the earlier of IC_K and IC_A was used for CMJ; and the earlier of IC_first_K and IC_first_A was used for the first DJ landing. The supplied one-based event indices were converted to zero-based 250-Hz indices and mapped to the synchronized 1000-Hz original C3D force series at a 4:1 sample ratio. The excluded exceptional CMJ trial was not assigned a substitute event in the final cohort.
For trial j from participant i, the outcome was peak total vertical ground reaction force over the first 150 force samples beginning at contact, normalized to body weight:
where is the mapped contact index, indexes the available force platforms, and is body mass from the participant log. The target was expressed in body weights (BW). It represented total external vertical force, including both platforms when available, rather than limb-specific force or ACL loading.
2.3. Contact-Aligned Predictor Representation
The primary representation used 50 samples per signal at nominal times from to ms relative to contact; the contact sample itself was excluded. Twenty angular coordinates covered pelvic list, tilt, and rotation; bilateral hip flexion, adduction, and rotation; bilateral knee angle, adduction, and rotation; bilateral ankle angle; and lumbar extension, bending, and rotation. For each coordinate, eight features were calculated: values at , , and ms; the terminal-minus-initial change; range; population standard deviation; least-squares slope over the full window; and slope over its final 10 samples. The last feature represented a nominal 40-ms terminal segment. This produced 160 features.
This fixed 20-coordinate representation provided a common input for comparisons between development strategies and model families. It concentrated on angular configuration of the pelvis, lower limbs, and trunk; it was not assumed to be the most accurate available representation. Broader signal coverage was evaluated separately. Target force magnitudes were not predictors, and task, fatigue condition, participant identity, ACL-history group, and demographic variables were not appended to the machine-learning feature vectors. Contact timing nevertheless came retrospectively from force data. Zero-lag processing also means that samples after a nominal input time can influence the coordinate reported at that time. The inputs therefore define an offline, contact-aligned estimation problem, not a demonstrated prospective pre-contact measurement pipeline.
2.4. Participant-Disjoint Development and Model Selection
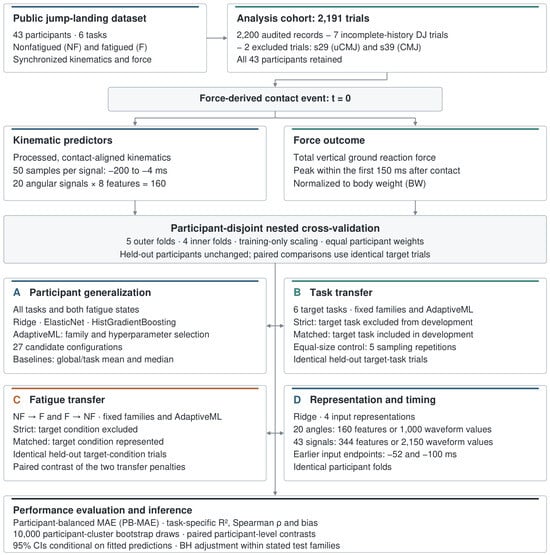
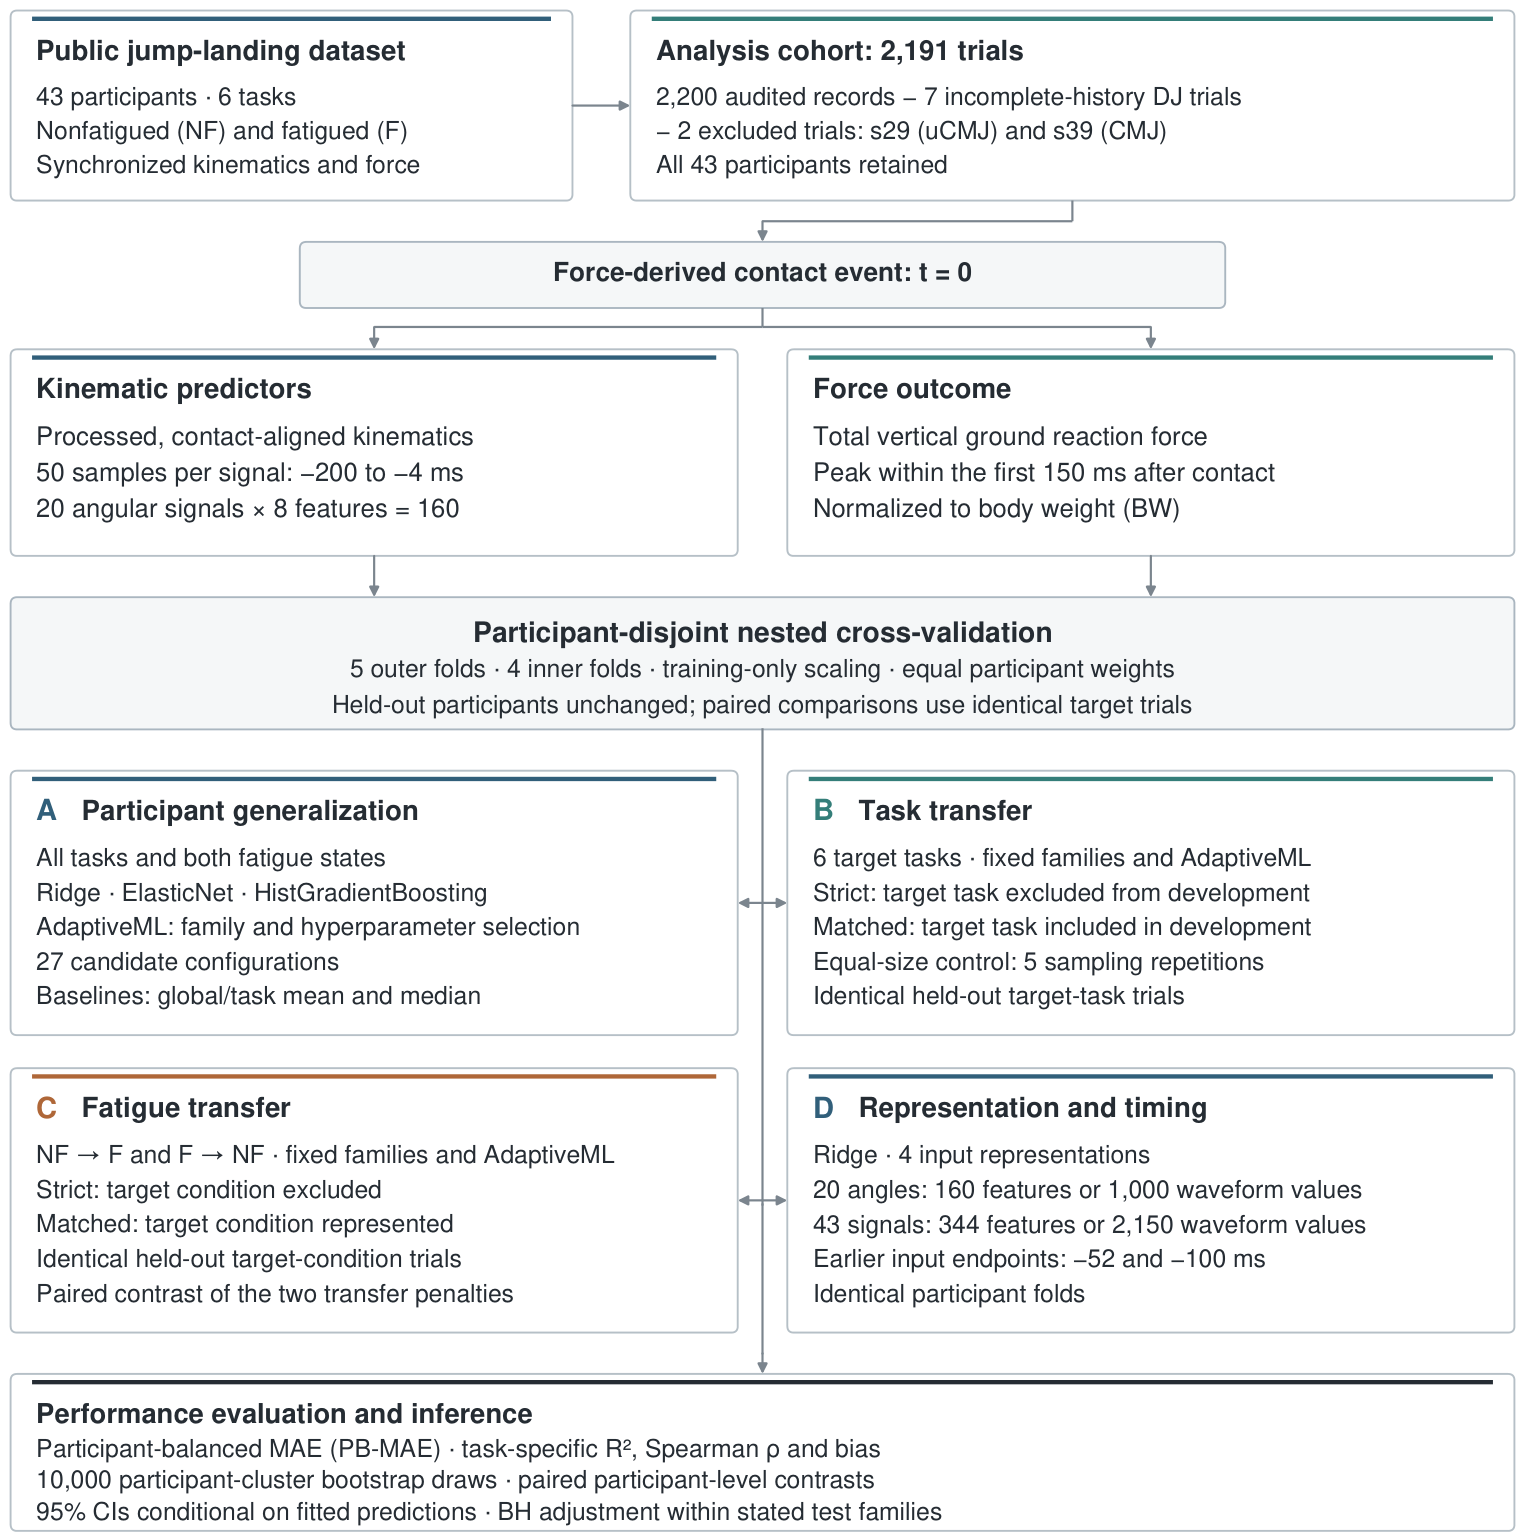
We retained five participant-disjoint outer folds and four participant-disjoint inner folds within each outer training set (Figure 1). Fold assignments balanced ACL-history/control membership and coverage across tasks and fatigue conditions, with sex and trial counts as secondary criteria; kinematic and target values were not used to assign folds. Every participant’s trials remained together. Inner selection, standardization, and final fitting used only the participants permitted in the active training partition, as required for evaluation of repeated-trial movement data [22,23]. Predictions were concatenated across the five held-out outer test sets.
Figure 1.
Workflow of data processing, participant-disjoint model development, and paired evaluation in the revised cohort. Branches A–D show primary participant generalization, task transfer with equal-size controls, fatigue transfer, and representation/window sensitivity. Force-derived alignment and processed source kinematics define a retrospective evaluation; participant-bootstrap intervals are conditional on fitted predictions.
Three model families were evaluated. Ridge used nine logarithmically spaced penalties from to . ElasticNet used ten combinations of and L1 ratio , with an intercept, a maximum of 20,000 iterations, and tolerance . Histogram-based gradient boosting (HistGradientBoosting) used eight combinations of maximum leaf nodes , minimum leaf size , and L2 regularization ; learning rate was 0.05, the maximum number of iterations was 300, loss was squared error, and early stopping was disabled. Thus, the full candidate grid contained 27 configurations, not an equal number from each family.
Within each fit, trial weights were proportional to , where was the number of eligible training trials from participant i. We rescaled weights to mean one, giving each included participant equal total training weight. Ridge and ElasticNet used feature standardization fitted from the weighted mean and weighted population variance of the current training partition; HistGradientBoosting used unscaled features. We did not use principal component analysis, target transformation, or target-dependent feature selection.
For each fixed family, hyperparameters minimized participant-balanced mean absolute error (PB-MAE) over the concatenated inner-fold predictions. AdaptiveML used the same criterion to choose both the family and its hyperparameters from all 27 configurations. It was a development procedure for selecting one fitted predictor, rather than a new model architecture or an ensemble. The selected configuration was refitted on eligible outer-training participants and applied once to the outer test set. This nesting separated configuration selection from final evaluation [24].
2.5. Training-Only Reference Baselines
The original training-mean baseline predicted the mean of the training participants’ individual target means. We retained it and added participant-weighted median baselines because PB-MAE evaluates absolute error. For an eligible training set , its weighted median was the first observed target, in ascending target order, whose cumulative trial weight reached at least half of the total weight:
No averaging of two central targets was used. A global median pooled eligible training trials. A task-specific median used only the eligible training trials of the task being evaluated, with participant weights recomputed within that task. Task-specific baselines thus used a known task label for reference assignment, whereas the learned predictors used kinematics alone.
All reference values were recalculated from the permitted outer-training data. In matched evaluation, the target task was represented among training participants and its task-specific reference was available. Under strict task transfer, the target task had no training records, so only a source-domain global median could be estimated; no target-task mean or median was taken from test data. Under strict fatigue transfer, task-specific medians were estimated from the source fatigue condition and applied to the corresponding tasks in the target condition. We did not use test participants’ own target means or medians, which would require their outcome measurements and would change the unseen-participant evaluation problem.
2.6. Task Transfer, Fatigue Transfer, and Equal-Size Controls
Each task was held out in turn for strict task transfer. AdaptiveML selection and fitting used only the other five tasks from outer-training participants, and evaluation used the held-out task from outer-test participants. Strict fatigue transfer developed a predictor on non-fatigued trials and tested it on fatigued trials, and vice versa, again with participant isolation. The target task or fatigue condition was absent from both training and inner selection.
Strict predictions were compared with matched AdaptiveML predictions from the primary participant-disjoint analysis on exactly the same target-domain test trials. Matched development included target-domain records from outer-training participants. For target task q, the transfer penalty and task macroaverage were
where denotes PB-MAE on that task. The fatigue macroaverage assigned equal weight to its two transfer directions. These comparisons evaluated exclusion of a development domain; the full-size task comparison also changed training-set size. To assess task coverage at equal training size, we constructed five matched subsets for each outer fold and target task. Sampling matched the strict source set’s record count within each training-participant-by-fatigue stratum. When a stratum contained target-task records, the subset retained target-task representation while maintaining the matched count; selection used trial identities and domain labels, not target values. Each subset underwent the same four-fold inner selection from 27 candidates and outer-training refit. Reproducible subset generators used the seed sequence , where and b, f, and q index the sampling replicate, outer fold, and target task, respectively.
For each participant and target task, matched-control MAE was averaged across the five independently fitted subsets before calculation of the paired strict-minus-control penalty. Predictions were not averaged into an ensemble, and the five subsets were not treated as five independent participant samples. The resulting contrast assessed the effect of including target-task examples at matched training size, while still changing task composition; it did not isolate a particular biomechanical mechanism.
2.7. Representation and Truncated-Window Sensitivity
Ridge was evaluated with four representations under the same participant-disjoint folds and nine-penalty grid: the primary 20-coordinate engineered features (160 values); flattened processed waveforms from those 20 coordinates (1000 values); engineered features from all 43 released coordinates (344 values); and flattened processed waveforms from all 43 coordinates (2150 values). The full set included pelvic translations and additional lower-limb and upper-limb coordinates, so these were 43 kinematic signals, not 43 joint angles. The waveform inputs were processed inverse-kinematics coordinates, not raw marker recordings. Standardization and penalty selection were fitted separately within the permitted training partitions.
We also evaluated Ridge with the primary angular signals truncated to end at or ms instead of ms, retaining 38 or 26 samples from the original -ms starting point. Eight features were recomputed from each retained window. Their initial, midpoint, and terminal values used zero-based indices 0, , and : midpoint times were , , and ms for the 50-, 38-, and 26-sample windows. Change, range, population standard deviation, full-window slope, and terminal slope were recalculated from retained samples; terminal slope always used the final 10 samples. Each window had independent nested Ridge selection for matched development and all six strict task-transfer analyses. These were truncated windows, not equal-duration windows shifted earlier. Source zero-lag filtering and force-derived alignment were unchanged, so this sensitivity analysis did not establish causally available pre-contact prediction.
2.8. Performance Measures and Statistical Inference
For evaluated participant set and participant i’s trial set , PB-MAE was
This metric guided inner selection and gave each evaluated participant equal weight. Secondary metrics were participant-balanced root mean squared error, trial-pooled MAE and root mean squared error, Spearman correlation, mean signed bias (prediction minus observation), and pooled . For the trial set being reported,
Overall and task-restricted values therefore used different reference means. Task-restricted metrics were calculated from the relevant out-of-fold trials for each learned predictor and baseline; was not averaged across participants or folds. The task macroaverage gave each of six task-specific PB-MAEs equal weight, rather than pooling their trials.
We obtained 95% percentile confidence intervals using 10,000 participant-cluster bootstrap draws, stratified by ACL-history and control membership, with seed 20,260,808. Each draw sampled participants with replacement within group and carried their observed trial records and multiplicity across paired predictions. For task macroaverages, a single cohort draw was shared across all six tasks; participants without DJ records did not contribute to that task’s mean. The same principle was used for paired fatigue directions, baselines, and sensitivity contrasts. These intervals were conditional on the fitted out-of-fold predictions and did not quantify uncertainty from repeating the entire model-training process. The resampling unit was the participant, not the trial, outer fold, or equal-size-control replicate.
Two-sided Wilcoxon signed-rank tests used paired participant-level MAE differences. Benjamini–Hochberg adjustment at was applied separately to three fixed-family-versus-training-mean comparisons, six AdaptiveML task-transfer comparisons, and two AdaptiveML fatigue-transfer comparisons. An additional exploratory direction contrast compared, within participant,
where each was strict-minus-matched participant MAE in its target condition. Its Wilcoxon p value was unadjusted and reported as exploratory; it did not enter the two-direction false-discovery-rate family. Baseline extensions, macroaverages, equal-size controls, representation comparisons, and truncated-window comparisons were described using paired differences and confidence intervals without additional confirmatory tests. Directional prediction differences could not separate fatigue from testing order because non-fatigued testing always preceded the fatigue protocol.
3. Results
3.1. Participant Generalization and Training-Only Baselines
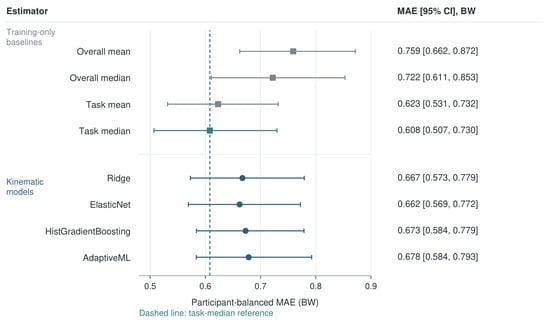
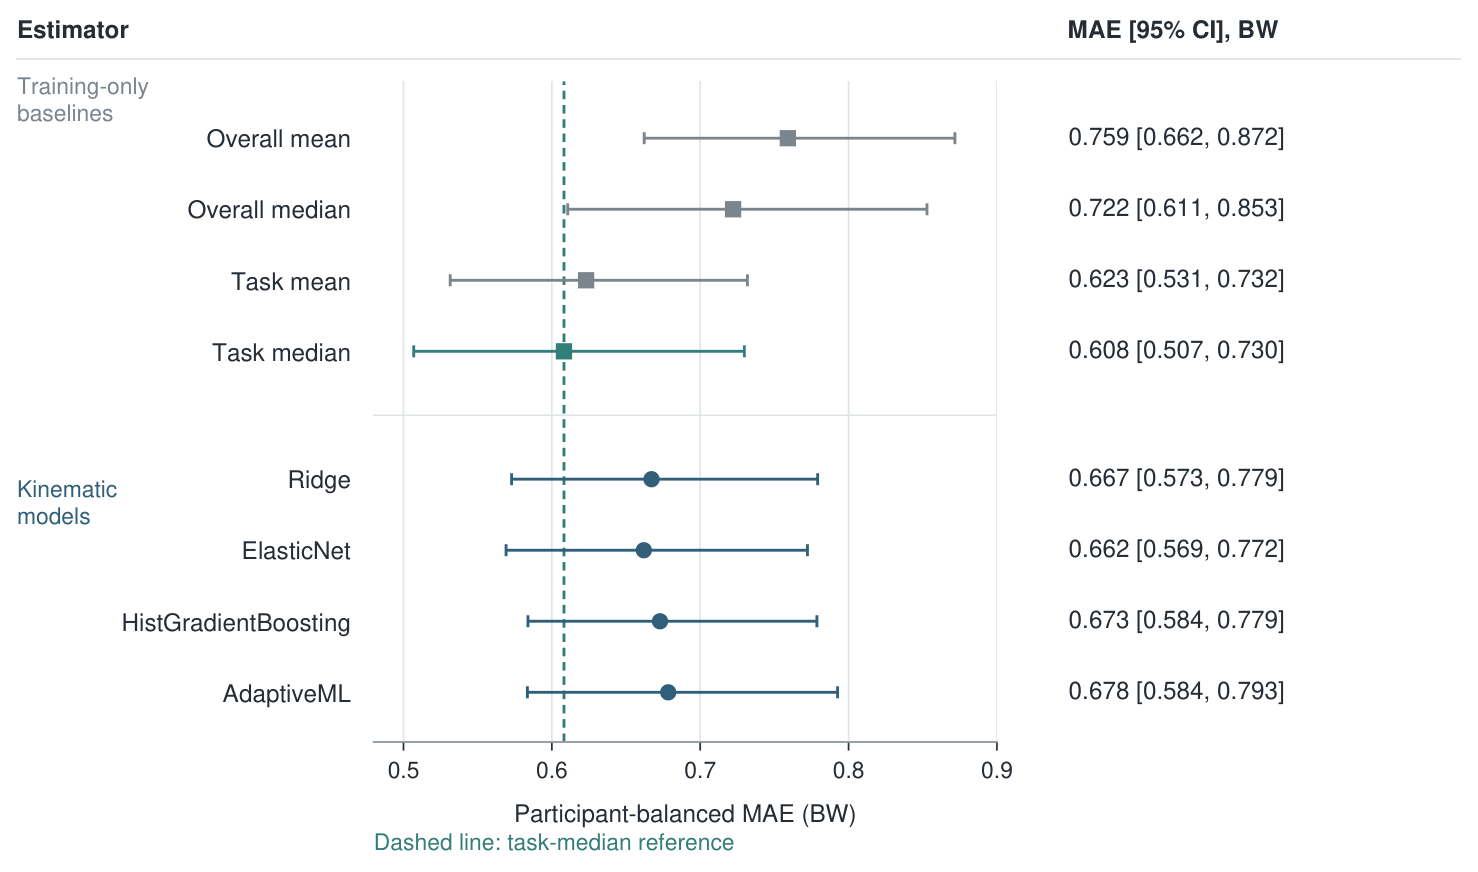
The revised cohort contained 2191 trials from 43 participants. ElasticNet had the lowest PB-MAE among the four primary learning procedures, at 0.662 BW (Table 1). The task-specific weighted-median baseline achieved 0.608 BW. Paired model-minus-baseline differences were positive for every procedure: 0.059 BW (95% CI, 0.024–0.094) for Ridge, 0.054 BW (0.019–0.089) for ElasticNet, 0.065 BW (0.019–0.114) for HistGradientBoosting, and 0.070 BW (0.031–0.110) for AdaptiveML. The learning procedures therefore did not show additional accuracy beyond a training-derived task label reference (Figure 2).
Table 1.
Unseen-participant performance in the revised cohort. Baselines were estimated using outer-training participants only. Intervals are participant-bootstrap 95% confidence intervals conditional on fitted predictions.
Figure 2.
Participant-balanced errors for the four learning procedures and training-only baselines. Squares denote training-only baselines and circles denote kinematic learning procedures. The teal square and dashed vertical line identify the task-specific weighted-median point estimate. Bars are participant-bootstrap 95% confidence intervals.
The three fixed families improved on the overall training-mean baseline of 0.759 BW. Their mean error differences were , , and BW, respectively; BH-adjusted Wilcoxon p values were , , and 0.0063. These comparisons with the overall mean do not override the stronger task-specific reference. Pooled trial-level was positive for each model, but AdaptiveML’s task-restricted was negative under all six matched and all six strict evaluations (Table 2). Across the fixed families, 17 of 18 matched task-specific values were negative; the exception was HistGradientBoosting for CMJ (). All 18 strict task-specific values were negative (Supplementary Table S3a,b).
Table 2.
AdaptiveML performance within each target task. Mean bias is prediction minus observation, in BW. , Spearman correlation (), and bias use the same held-out trials for matched and strict evaluation.
3.2. Task Transfer and Equal-Size Training Controls
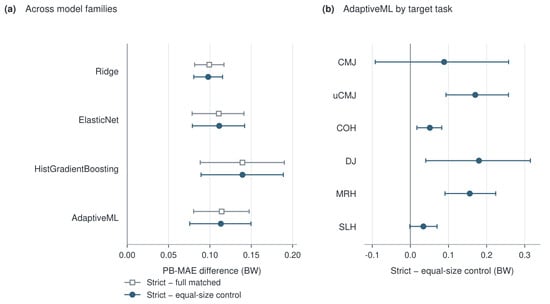
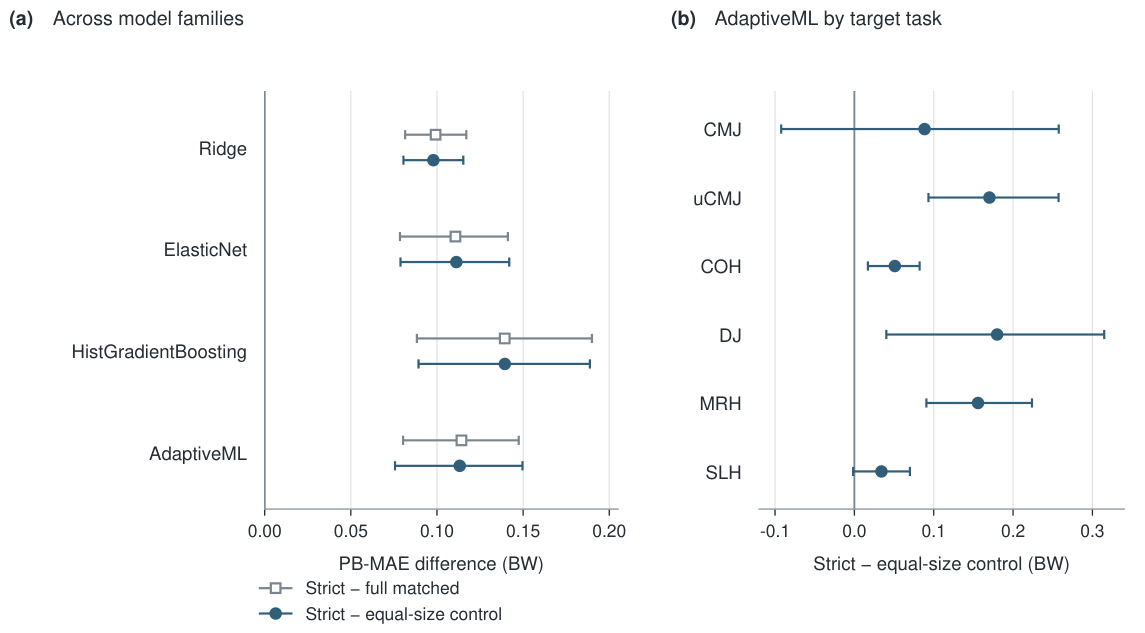
AdaptiveML’s six-task macroaveraged PB-MAE increased from 0.760 BW in matched evaluation to 0.874 BW under strict task transfer, a paired increase of 0.114 BW (95% CI, 0.080–0.147). After matching training quantities within participant and fatigue-state strata while retaining target-task coverage, the increase was 0.113 BW (0.076–0.150; Table 3). The equal-size control differed from full matched training by 0.001 BW ( to 0.013). Across the five control repetitions, AdaptiveML’s macroaveraged strict-minus-control point estimates ranged from 0.106 to 0.119 BW.
Table 3.
Six-task macroaveraged task-transfer performance. The equal-size reference averages participant-level errors across five sampled training sets before bootstrap inference.
The controlled macroaveraged penalty remained positive for each fixed family (Figure 3a). For AdaptiveML, task-specific intervals were positive for uCMJ, COH, DJ, and MRH; intervals for CMJ and SLH included zero (Figure 3b). These control contrasts address training quantity, while retaining the task-composition difference that defines task coverage. They do not identify a causal biomechanical mechanism.
Figure 3.
Task-transfer penalties relative to full and equal-size matched training. Panel (a) compares six-task macroaveraged penalties for each development procedure. Panel (b) shows AdaptiveML’s strict-minus-equal-size-control penalty by target task. The vertical line at zero in panel (b) denotes no difference between strict transfer and the equal-size control. Bars are participant-bootstrap 95% confidence intervals conditional on the fitted models and sampled control sets.
Strict AdaptiveML improved on the source-only weighted-mean reference (macro PB-MAE 0.919 BW) by 0.045 BW (95% CI, 0.015–0.072). It did not clearly improve on the source-only weighted-median reference (0.873 BW): the model-minus-reference difference was 0.000 BW ( to 0.038). A target-task-specific training reference was unavailable in this protocol because the target task was absent throughout development.
3.3. Fatigue Transfer
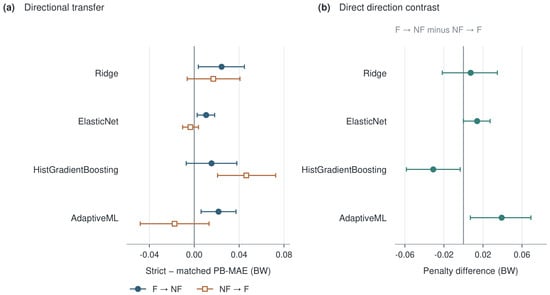
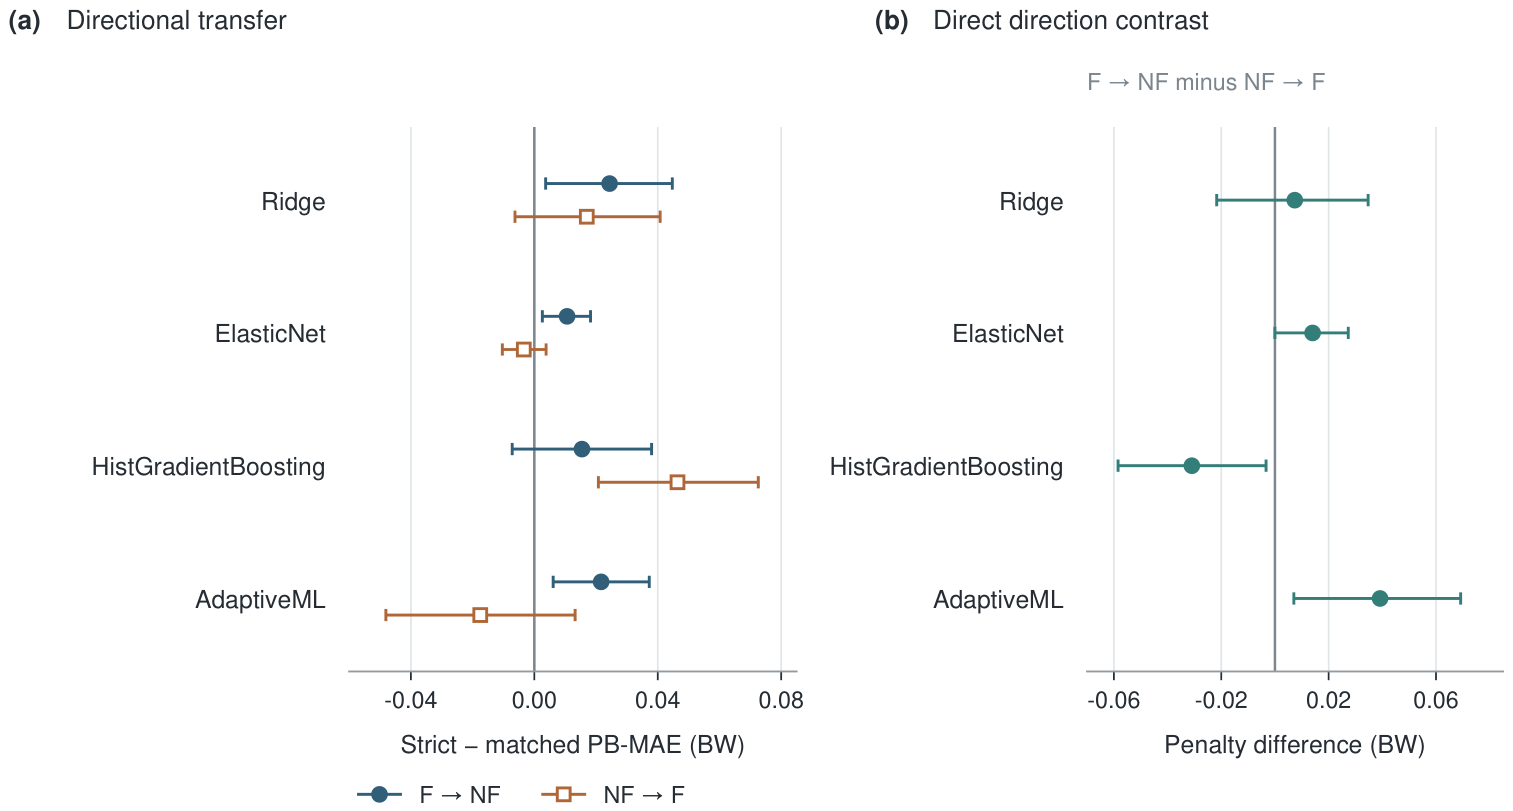
For AdaptiveML, transfer from non-fatigued to fatigued trials yielded a penalty of BW (95% CI, to 0.013; BH-adjusted ). Transfer from fatigued to non-fatigued trials yielded a penalty of 0.022 BW (0.006–0.037; adjusted ). The equally weighted average penalty was 0.002 BW ( to 0.021; Table 4).
Table 4.
AdaptiveML fatigue transfer on identical held-out records. Each transfer penalty is strict minus matched PB-MAE. Directional tests share a two-test BH adjustment family.
The direct paired contrast, defined as the fatigued-to-non-fatigued penalty minus the reverse penalty, was 0.039 BW (95% CI, 0.007–0.069). The exploratory Wilcoxon signed-rank test yielded an unadjusted , assessed separately from the two directional tests. This contrast varied across model families: 0.007 BW ( to 0.035) for Ridge, 0.014 BW ( to 0.027) for ElasticNet, and BW ( to ) for HistGradientBoosting (Figure 4). The latter showed the opposite direction. AdaptiveML’s strict fatigue macro PB-MAE of 0.681 BW also exceeded the source-condition task-specific median reference of 0.611 BW, by 0.070 BW (0.030–0.110).
Figure 4.
Fatigue-transfer penalties and direct directional contrasts across model families. F denotes fatigued and NF non-fatigued. The vertical zero lines denote no transfer penalty in panel (a) and no difference between the two directional penalties in panel (b). Bars are participant-bootstrap 95% confidence intervals. Model-specific contrasts do not isolate physiological fatigue from protocol order.
3.4. Kinematic Representation Sensitivity
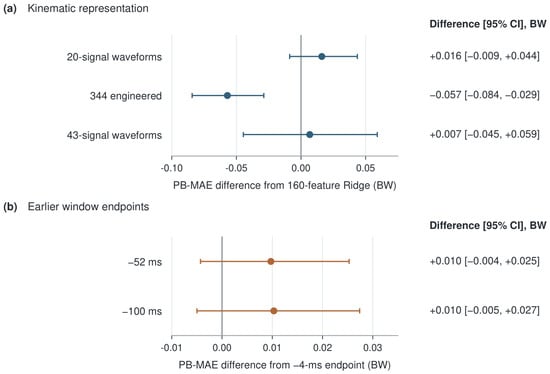
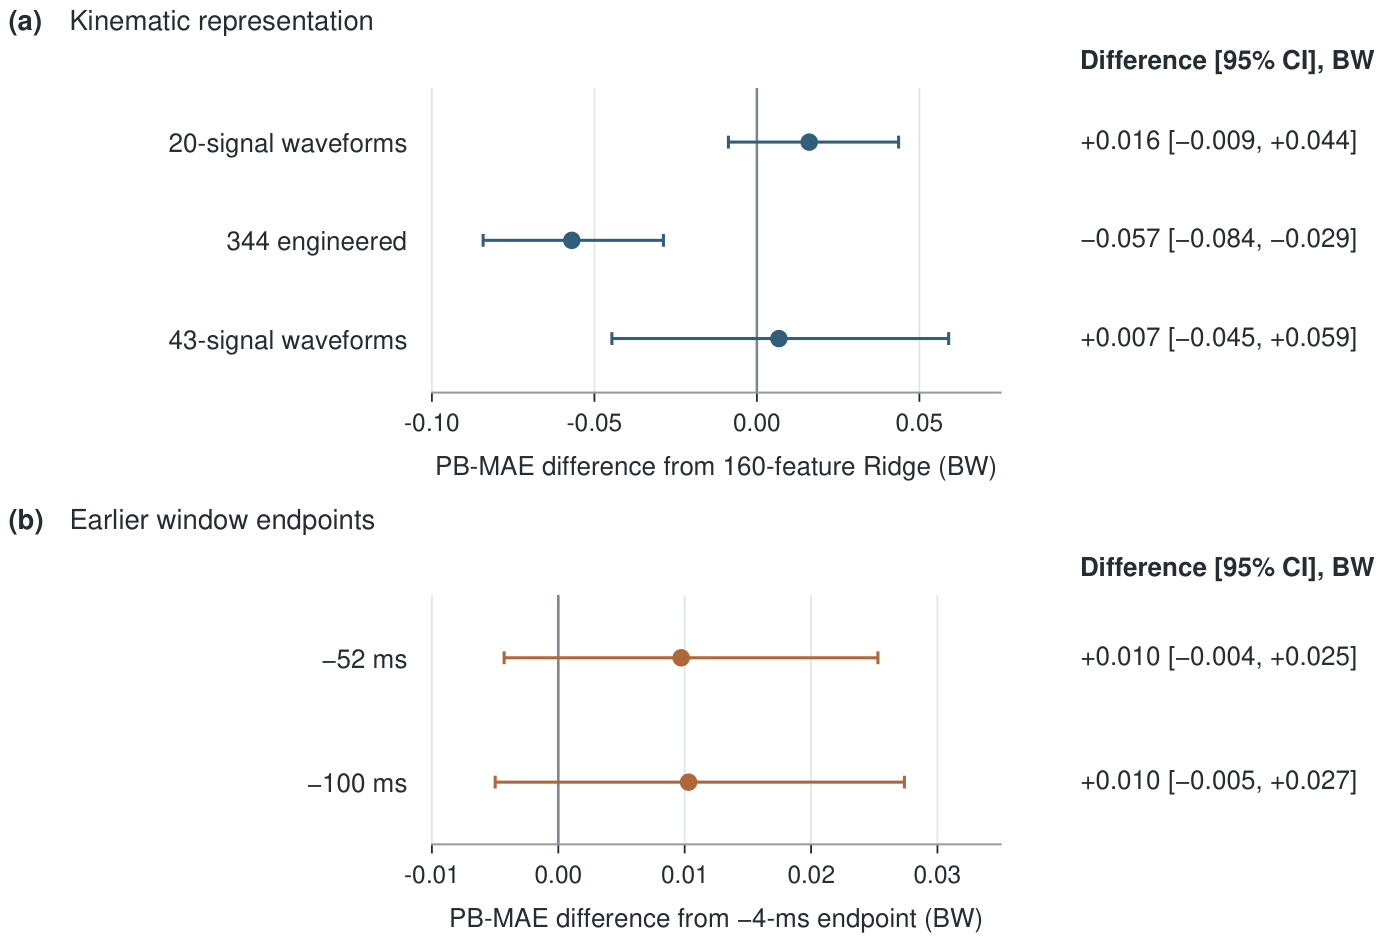
Engineered features from all 43 released signals reduced Ridge PB-MAE from 0.667 BW for the primary 160-feature representation to 0.610 BW for the 344-feature representation (Table 5). The paired difference was BW (95% CI, to ), an 8.5% reduction. The 20- and 43-signal processed waveform representations yielded errors of 0.683 and 0.674 BW; intervals for both paired differences relative to primary Ridge included zero (Figure 5a).
Table 5.
Ridge representation sensitivity using identical participant folds. The 43 released signals include angular coordinates and translations. Waveforms are processed source signals.
Figure 5.
Paired changes in Ridge PB-MAE for kinematic representations (a) and earlier processed-window endpoints (b). The vertical line at zero denotes no change from the primary 160-feature Ridge representation in panel (a) or the -ms endpoint in panel (b). Bars are participant-bootstrap 95% confidence intervals. Earlier endpoints truncate the original window; they do not represent equal-duration translations or causal filtering.
The broader engineered representation did not clearly improve on the task-specific median baseline: the difference was 0.002 BW (95% CI, to 0.034). Its six-task macroaveraged difference from that baseline was 0.007 BW ( to 0.042). No individual task established lower error for the broader Ridge representation; COH had higher error by 0.106 BW (0.028–0.181). These representation comparisons concern generalization to new participants, rather than strict transfer of the broader representation.
3.5. Earlier Window Endpoints and Repeated-Trial Variability
Ridge PB-MAE was 0.667 BW for the full processed window ending at ms, 0.677 BW for the truncated window ending at ms, and 0.677 BW for the window ending at ms. The paired increases were 0.010 BW (95% CI, to 0.025) and 0.010 BW ( to 0.027), respectively (Figure 5b). The six-task macroaveraged strict-minus-matched penalty remained positive across endpoints: 0.099 BW (0.082–0.117), 0.109 BW (0.083–0.134), and 0.097 BW (0.073–0.121). Intervals for changes in transfer penalty relative to the full window included zero. Truncation changed window duration and feature summaries; the source preprocessing remained retrospective.
Of 852 observed participant-by-task-by-condition-by-side cells, 679 contained two or three repeated trials. Participant-balanced mean within-cell standard deviations were 0.722 BW for CMJ, 0.273 BW for uCMJ, 0.580 BW for DJ, 0.272 BW for MRH, and 0.296 BW for SLH. Corresponding unscaled median absolute deviations were 0.372, 0.143, 0.280, 0.138, and 0.161 BW (Supplementary Table S7). COH had one observation per side and condition, precluding estimation of repeated-trial variability. These estimates describe observed variation and do not define a measurement-error floor or a clinical prediction threshold.
4. Discussion
The revised analysis shows that the apparent value of kinematic force estimation depends on the benchmark and evaluation domain. In 2191 eligible trials, the 160-feature models improved on a global training-mean reference, but none outperformed a training-only task-median baseline. Excluding the target task increased AdaptiveML error even when training-set size was controlled. Yet strict transfer did not clearly outperform a simple median fitted to the permitted source-task data. The contribution is an evaluation of these limits: pooled performance, task coverage, and model choice change the interpretation of an offline external-force estimator.
4.1. Incremental Information Beyond Task-Level Baselines
ElasticNet achieved a participant-balanced mean absolute error (PB-MAE) of approximately 0.662 BW, whereas the task-median baseline achieved approximately 0.608 BW. This changes the conclusion supported by comparison with the global training mean alone. The learned models can improve on a task-agnostic reference without adding useful information beyond a simple task-conditioned estimate. Task identity was not supplied to the kinematic models, but differences in their inputs can still encode movement type. Positive all-trial pooled alongside negative within-task is consistent with this concern. It does not by itself quantify the fraction of performance arising from between-task differences.
The meaning of an out-of-sample depends on its reference [35]. Here, a negative task-specific value means that squared prediction error exceeded the error of predicting the observed mean of the evaluated task. That observed test-set mean is a descriptive reference, not a deployable baseline. The revised task-median baseline instead uses only the permitted outer-training participants and directly tests incremental performance under the primary absolute-error metric. Means and medians answer related but different questions: a median is an appropriate constant reference for absolute error, whereas is based on squared error.
Task-conditioned baselines require training examples of the target task. They are available in matched development, but not in a strict analysis that excludes the target task from training and inner-loop selection. A participant-specific target mean would likewise require target measurements from the held-out participant and would change the new-participant question. The source-only median provides the feasible constant reference for strict task transfer. Comparisons therefore depend on the information legitimately available under each evaluation design, rather than on a single baseline used across incompatible settings.
4.2. Task Coverage After Controlling Training-Set Size
The six-task macroaveraged PB-MAE was 0.760 BW with matched development and 0.874 BW when the target task was excluded. Reducing the task-covered training data to match the strict training-set size gave a PB-MAE of 0.761 BW. Strict transfer remained worse by 0.113 BW (95% CI, 0.076–0.150). The penalty therefore persisted under the implemented sample-size control and cannot be explained solely by fewer training trials. It reflects the tested change in task composition and development information; the control does not isolate a single biomechanical cause or recreate every possible sampling design.
The strict model’s comparison with the source-only median was much less favorable: the macroaveraged difference was approximately +0.0004 BW (95% CI, to +0.038). The task-exclusion penalty demonstrates a limitation of the regression strategy, but does not establish useful kinematics-based transfer beyond this simple source reference. Task coverage can improve absolute predictions by supplying information about the target load distribution without producing accurate trial-level estimates within that task.
Published differences between vertical-jump and step-off landings, across landing protocols, and across post-ACLR tasks support task-specific evaluation [7,8,9,10,11,12,13]. They do not identify the cause of an individual transfer penalty in these data. The clinical literature also often measures involved-limb or phase-specific force, whereas the present outcome is the total external vertical force in the first 150 ms, including both force platforms where available. In bilateral tasks, that total cannot be interpreted as the load borne by an individual limb. Published asymmetry or involved-limb values therefore cannot supply an interchangeable clinical accuracy threshold for this outcome [1,2].
4.3. Fatigue Direction Is Dependent on the Model
For AdaptiveML, training on fatigued trials and testing on non-fatigued trials increased PB-MAE by 0.022 BW (95% CI, 0.006–0.037), whereas the reverse direction gave a difference of BW (95% CI, to +0.013). Their direct contrast was +0.039 BW (95% CI, 0.007–0.069). This exploratory comparison shows directional asymmetry for the adaptive development procedure; the lack of a clear macroaveraged penalty does not establish equivalence between fatigue conditions.
That asymmetry was not consistent across model families. The histogram-based gradient-boosting contrast had the opposite sign ( BW; 95% CI, to ), while the Ridge and ElasticNet contrast intervals included zero. The adaptive result should therefore be interpreted as a property of the evaluated model-selection strategy under these data, rather than as a general law of fatigue transfer. Opposite patterns from two strategies applied to the same cohort weaken a physiological interpretation of the direction.
Experimental fatigue studies have reported protocol-dependent joint responses, timing changes, and differences over post-fatigue recovery [25,26,27,28,29,36,37]. Work predicting model-derived ACL force from ankle kinematics addresses a related but different target [30]. Neither literature establishes the direction of this study’s regression error. In the source protocol, non-fatigued measurements always preceded the fatigue protocol [31]. Fatigue, repeated exposure, elapsed time, and order were therefore not independently varied. No reanalysis of this fixed sequence can identify their separate effects without additional assumptions or independently collected data. The exploratory directional tests are interpreted within that limitation.
4.4. Kinematic Representation
Using engineered features from all 43 released coordinates reduced Ridge PB-MAE from 0.667 to 0.610 BW. The paired improvement of 0.057 BW (95% CI, 0.029–0.084) supports sensitivity to the available coordinate set. However, the broader representation did not clearly outperform the task-median reference: its PB-MAE difference was +0.002 BW (95% CI, to +0.034). More coordinates improved this regression model relative to its narrower input, but did not establish additional predictive value beyond the stronger baseline. The original 20-angle representation remains the reference for the primary comparisons, with the broader representation reported transparently as a sensitivity analysis; choosing it as the primary representation after inspecting its result would change the analysis question.
The flattened waveform alternatives do not isolate feature count alone, because waveform representation and engineered summaries differ in both dimension and information structure. No feature-importance analysis was used to assign the broader representation’s improvement to a particular joint or physiological mechanism.
Studies using inertial sensors, video, or full-body mechanics have different measurement inputs and force targets [14,15,16,17,18,19]. Their error values are useful context but do not provide a direct ranking of the present models. Specifying the sensor pipeline, outcome, baseline, and evaluation domain is necessary before comparing accuracy [20,22].
4.5. Earlier Endpoints and Repeated-Trial Variation
Ending the Ridge input at or ms instead of ms increased PB-MAE by approximately 0.010 BW in each comparison, with intervals spanning zero. Task-exclusion penalties remained positive for all three windows. This sensitivity analysis truncates the interval before contact; it does not translate an equal-duration window to a new time. Its comparisons jointly change the available history, endpoint, and summaries. They cannot identify an optimal prospective observation window or establish when a causal signal first becomes predictive. Zero-lag processing and force-derived alignment remain part of every comparison.
Repeated-trial variation provided a descriptive scale for the prediction error. It could be estimated in 679 of 852 participant–task–condition–leg cells; COH had only one planned trial per leg and condition, so within-cell variation could not be estimated for that task. Participant-balanced mean within-cell standard deviations were 0.722 BW for CMJ and 0.580 BW for DJ, compared with 0.272–0.296 BW for uCMJ, MRH, and SLH. The corresponding unscaled median absolute deviations were 0.372 and 0.280 BW for CMJ and DJ, and 0.138–0.161 BW for the other three tasks. An overall model PB-MAE near 0.66 BW therefore occurs alongside markedly different task-specific variation.
Those standard deviations and median absolute deviations are not interchangeable with model MAE, and neither is a measurement-noise floor. Trial-to-trial variation can include genuine differences in movement execution as well as measurement and processing variation. These summaries do not isolate those components or establish an acceptable clinical error. The present error cannot be characterized as clinically small from their comparison, especially when the relevant clinical literature uses a single-limb force measure, a different time window, or a different normalization. Such effects require an outcome-matched evaluation rather than an unsupported numerical comparison across studies.
4.6. Scope of the Offline Estimate
The contact event was obtained from the force recordings, and the released marker trajectories were processed with zero-lag filtering before inverse kinematics [31]. A sample at a nominally pre-contact time can therefore contain information from later marker samples. Removing contact and post-contact indices from the feature window does not make the complete processing pipeline causal. Contact timing supplies alignment information from the reference system, although force magnitude is not a model input. The resulting estimate is conditional on that retrospectively supplied alignment. Establishing prospective performance would require independent contact detection and causal processing evaluated together against a separately measured force reference.
The evidence concerns 43 participants with mixed ACL injury histories and healthy controls, six laboratory tasks, and the source fatigue protocol. The ACL-history group includes 19 surgically treated and two conservatively treated participants; no group-specific prediction claim is made. No independent cohort, new acquisition system, field recording, or clinical decision threshold was evaluated. The revised analysis excludes one trial flagged for source-data quality and one trial with an unresolved exceptional contact-event mapping, leaving 2191 trials. This correction resolves the analysis-cohort discrepancy but does not increase the number of independent participants. Participant-level folds and inference address repeated-trial dependence; they cannot establish population-wide transportability from this sample.
The next evidential step is to test whether a complete measurement pipeline can improve on appropriate task-conditioned and source-only baselines in an independent cohort. Until then, the present results support reporting simple baselines and task-restricted performance when evaluating offline force estimation. They do not validate ligament-force assessment, injury prediction, or rehabilitation decisions.
5. Conclusions
Task exclusion increased error even when development-set quantities were matched within participant and fatigue-state strata. However, the primary kinematic learning procedures did not improve on a task-specific weighted-median reference, and a broader engineered Ridge representation did not clearly surpass that reference. Positive pooled values coexisted with weak task-restricted performance. Fatigue-transfer direction depended on the model family and could not be separated from protocol order. These results support task-specific validation and stronger baseline comparisons in offline external-force estimation. They do not validate a prospective force-estimation pipeline or establish ACL loading, injury prediction, or clinical utility.
Supplementary Materials
The following supporting information can be downloaded at https://www.mdpi.com/article/10.3390/app162110504/s1: Supplementary Methods S1: Source cohort, quality decisions, and event audit; S2: Predictor representations and configuration grid; S3: Evaluation, baselines, and uncertainty; S4: Full development and fixed-family transfer; S5: Training-size-matched coverage control; S6: Window truncation sensitivity; S7: Ridge representation sensitivity; S8: Repeated-trial target variability; S9: Computational provenance and availability. Supplementary tables: Table S1: Revised modeling cohort. Task rows and condition rows partition the same records separately; Table S2: Overall held-out performance in the revised cohort; Table S3a: Matched performance for each model family and task; Table S3b: Strict source-task performance for each model family and task; Table S4a: AdaptiveML task-transfer differences on identical test trials; Table S4b: Six-task macroaveraged transfer for all model families; Table S4c: Equal-training-size coverage control, averaged at participant-loss level across five trial-sampling seeds; Table S5a: Fatigue transfer in both directions; Table S5b: Macroaveraged fatigue penalty and exploratory difference between directional penalties; Table S6a: Ridge representation sensitivity; Table S6b: Expanded engineered Ridge representation versus the task-specific weighted-median benchmark; Table S7: Within-participant repeated-trial target variability; Table S8: Signal identities in the retained representations. The expanded representation includes translations as well as angular coordinates; Table S9: All 27 retained primary configurations. Fixed family parameters are given in the accompanying text; Table S10a: Ridge window-truncation sensitivity in the fixed revised cohort; Table S10b: Task-level Ridge transfer after window truncation. The source data descriptor and dataset cited in the Supplementary Materials are included in the main reference list [31,32].
Author Contributions
Conceptualization, L.L.; methodology, L.L.; software, Y.Z. and L.L.; validation, Y.Z. and L.L.; formal analysis, Y.Z. and L.L.; investigation, Y.K. and L.L.; data curation, B.Z., Y.K. and L.L.; writing—original draft preparation, Y.Z. and L.L.; writing—review and editing, B.Z. and H.-K.S.; supervision, H.-K.S.; project administration, H.-K.S., Y.Z. and B.Z. contributed equally to this work. All authors have read and agreed to the published version of the manuscript.
Funding
This research received no external funding.
Institutional Review Board Statement
Ethical review and approval were not required for the present study, as confirmed by the authors’ institution, because it was a secondary analysis of publicly available, anonymized data and involved no new participant recruitment, intervention, participant contact, or access to identifiable private information. The original data collection was approved by the Ethics Committee of the University of Innsbruck (certificate 98/2022) [31].
Informed Consent Statement
Written informed consent was obtained from all participants in the original study [31]. No new participants were recruited, and no new informed consent was obtained for the present secondary analysis.
Data Availability Statement
The source dataset is available on Figshare (version 1; https://doi.org/10.6084/m9.figshare.28890545.v1) under CC BY 4.0 [32]. The revised derived data and analysis outputs for the final 2191 trials from 43 participants are publicly available at https://doi.org/10.6084/m9.figshare.34003527.v2 (CC BY 4.0). The corresponding analysis code is available at https://doi.org/10.6084/m9.figshare.34003536.v2 (MIT). These version-2 deposits contain the retained predictions and results, participant folds, exclusion and event-audit records, figure-source data, environment requirements, and reproduction instructions. The original input archives are retained within the deposits with their SHA256 hashes. Version 1 of the derived-data and code records preserves the historical release and is superseded for the present analysis.
Acknowledgments
The authors acknowledge the publicly available jump-landing dataset used in this secondary analysis.
Conflicts of Interest
The authors declare no conflicts of interest.
References
- Lepley, A.S.; Kuenze, C.M. Hip and Knee Kinematics and Kinetics During Landing Tasks After Anterior Cruciate Ligament Reconstruction: A Systematic Review and Meta-Analysis. J. Athl. Train. 2018, 53, 144–159. [Google Scholar] [CrossRef] [Scilit] [PubMed]
- Labban, W.; Manaseer, T.; Golberg, E.; Sommerfeldt, M.; Nathanail, S.; Dennett, L.; Westover, L.; Beaupre, L. Jumping into recovery: A systematic review and meta-analysis of discriminatory and responsive force plate parameters in individuals following anterior cruciate ligament reconstruction during countermovement and drop jumps. J. Exp. Orthop. 2024, 11, e12018. [Google Scholar] [CrossRef] [Scilit] [PubMed]
- Labban, W.; Stadnyk, M.; Sommerfeldt, M.; Nathanail, S.; Dennett, L.; Westover, L.; Manaseer, T.; Beaupre, L. Kinetic measurement system use in individuals following anterior cruciate ligament reconstruction: A scoping review of methodological approaches. J. Exp. Orthop. 2021, 8, 81. [Google Scholar] [CrossRef] [Scilit] [PubMed]
- Bates, N.A.; Ford, K.R.; Myer, G.D.; Hewett, T.E. Impact differences in ground reaction force and center of mass between the first and second landing phases of a drop vertical jump and their implications for injury risk assessment. J. Biomech. 2013, 46, 1237–1241. [Google Scholar] [CrossRef] [Scilit] [PubMed]
- Wei, Y.; Zhou, Z.; Jie, T.; Yuan, Y.; Zhou, H.; Gao, X.; Chen, T.; Ge, Q.; Xiang, L.; Xu, D.; et al. Distinct Motor Modules After Anterior Cruciate Ligament Reconstruction During Stair Descent: A One-Year Longitudinal Study. IEEE Trans. Neural Syst. Rehabil. Eng. 2026, 34, 1734–1745. [Google Scholar] [CrossRef] [Scilit] [PubMed]
- Aizawa, J.; Ohji, S.; Koga, H.; Masuda, T.; Yagishita, K. Correlations between sagittal plane kinematics and landing impact force during single-leg lateral jump-landings. J. Phys. Ther. Sci. 2016, 28, 2316–2321. [Google Scholar] [CrossRef] [Scilit] [PubMed]
- Harry, J.R.; Freedman Silvernail, J.; Mercer, J.A.; Dufek, J.S. Comparison of pre-contact joint kinematics and vertical impulse between vertical jump landings and step-off landings from equal heights. Hum. Mov. Sci. 2017, 56, 88–97. [Google Scholar] [CrossRef] [Scilit] [PubMed]
- Cruz, A.; Bell, D.; McGrath, M.; Blackburn, T.; Padua, D.; Herman, D. The Effects of Three Jump Landing Tasks on Kinetic and Kinematic Measures: Implications for ACL Injury Research. Res. Sports Med. 2013, 21, 330–342. [Google Scholar] [CrossRef] [Scilit] [PubMed]
- Heebner, N.R.; Rafferty, D.M.; Wohleber, M.F.; Simonson, A.J.; Lovalekar, M.; Reinert, A.; Sell, T.C. Landing Kinematics and Kinetics at the Knee During Different Landing Tasks. J. Athl. Train. 2017, 52, 1101–1108. [Google Scholar] [CrossRef] [Scilit] [PubMed]
- Pilanthananond, M.; Tharawadeepimuk, K.; Saengsirisuwan, V.; Limroongreungrat, W. Muscle Activation and Ground Reaction Force between Single-Leg Drop Landing and Jump Landing among Young Females during Weight-Acceptance Phase. Sports 2023, 11, 185. [Google Scholar] [CrossRef] [Scilit] [PubMed]
- King, E.; Richter, C.; Franklyn-Miller, A.; Daniels, K.; Wadey, R.; Moran, R.; Strike, S. Whole-body biomechanical differences between limbs exist 9 months after ACL reconstruction across jump/landing tasks. Scand. J. Med. Sci. Sports 2018, 28, 2567–2578. [Google Scholar] [CrossRef] [Scilit] [PubMed]
- Warnecke, B.F.; Richter, C.; King, E.; Paternoster, F.K. Residual Performance and Biomechanical Asymmetries During Jumping Tasks in Female Athletes at 9 Months After Anterior Cruciate Ligament Reconstruction. Orthop. J. Sports Med. 2024, 12, 23259671241276826. [Google Scholar] [CrossRef] [Scilit] [PubMed]
- Baumgart, C.; Hoppe, M.W.; Freiwald, J. Phase-Specific Ground Reaction Force Analyses of Bilateral and Unilateral Jumps in Patients with ACL Reconstruction. Orthop. J. Sports Med. 2017, 5, 2325967117710912. [Google Scholar] [CrossRef] [Scilit] [PubMed]
- Chaaban, C.R.; Berry, N.T.; Armitano-Lago, C.; Kiefer, A.W.; Mazzoleni, M.J.; Padua, D.A. Combining Inertial Sensors and Machine Learning to Predict vGRF and Knee Biomechanics during a Double Limb Jump Landing Task. Sensors 2021, 21, 4383. [Google Scholar] [CrossRef] [Scilit] [PubMed]
- Cerfoglio, S.; Galli, M.; Tarabini, M.; Bertozzi, F.; Sforza, C.; Zago, M. Machine Learning-Based Estimation of Ground Reaction Forces and Knee Joint Kinetics from Inertial Sensors While Performing a Vertical Drop Jump. Sensors 2021, 21, 7709. [Google Scholar] [CrossRef] [Scilit] [PubMed]
- Hendry, D.; Leadbetter, R.; McKee, K.; Hopper, L.; Wild, C.; O’Sullivan, P.; Straker, L.; Campbell, A. An Exploration of Machine-Learning Estimation of Ground Reaction Force from Wearable Sensor Data. Sensors 2020, 20, 740. [Google Scholar] [CrossRef] [Scilit] [PubMed]
- Ishida, T.; Ino, T.; Yamakawa, Y.; Wada, N.; Koshino, Y.; Samukawa, M.; Kasahara, S.; Tohyama, H. Estimation of Vertical Ground Reaction Force during Single-leg Landing Using Two-dimensional Video Images and Pose Estimation Artificial Intelligence. Phys. Ther. Res. 2024, 27, 35–41. [Google Scholar] [CrossRef] [Scilit] [PubMed]
- Uhlrich, S.D.; Falisse, A.; Kidziński; Muccini, J.; Ko, M.; Chaudhari, A.S.; Hicks, J.L.; Delp, S.L. OpenCap: Human movement dynamics from smartphone videos. PLoS Comput. Biol. 2023, 19, e1011462. [Google Scholar] [CrossRef] [Scilit] [PubMed]
- Verheul, J.; Robinson, M.A.; Burton, S. Jumping towards field-based ground reaction force estimation and assessment with OpenCap. J. Biomech. 2024, 166, 112044. [Google Scholar] [CrossRef] [Scilit] [PubMed]
- Krishnakumar, S.; van Beijnum, B.J.F.; Baten, C.T.M.; Veltink, P.H.; Buurke, J.H. Estimation of Kinetics Using IMUs to Monitor and Aid in Clinical Decision-Making during ACL Rehabilitation: A Systematic Review. Sensors 2024, 24, 2163. [Google Scholar] [CrossRef] [Scilit] [PubMed]
- Saeb, S.; Lonini, L.; Jayaraman, A.; Mohr, D.C.; Kording, K.P. The need to approximate the use-case in clinical machine learning. GigaScience 2017, 6, gix019. [Google Scholar] [CrossRef] [Scilit] [PubMed]
- Halilaj, E.; Rajagopal, A.; Fiterau, M.; Hicks, J.L.; Hastie, T.J.; Delp, S.L. Machine learning in human movement biomechanics: Best practices, common pitfalls, and new opportunities. J. Biomech. 2018, 81, 1–11. [Google Scholar] [CrossRef] [Scilit] [PubMed]
- Roberts, D.R.; Bahn, V.; Ciuti, S.; Boyce, M.S.; Elith, J.; Guillera-Arroita, G.; Hauenstein, S.; Lahoz-Monfort, J.J.; Schröder, B.; Thuiller, W.; et al. Cross-validation strategies for data with temporal, spatial, hierarchical, or phylogenetic structure. Ecography 2017, 40, 913–929. [Google Scholar] [CrossRef] [Scilit]
- Varma, S.; Simon, R. Bias in error estimation when using cross-validation for model selection. BMC Bioinform. 2006, 7, 91. [Google Scholar] [CrossRef] [Scilit] [PubMed]
- Webster, K.E.; Santamaria, L.J.; McClelland, J.A.; Feller, J.A. Effect of Fatigue on Landing Biomechanics after Anterior Cruciate Ligament Reconstruction Surgery. Med. Sci. Sport. Exerc. 2012, 44, 910–916. [Google Scholar] [CrossRef] [Scilit] [PubMed]
- Benjaminse, A.; Webster, K.E.; Kimp, A.; Meijer, M.; Gokeler, A. Revised Approach to the Role of Fatigue in Anterior Cruciate Ligament Injury Prevention: A Systematic Review with Meta-Analyses. Sport. Med. 2019, 49, 565–586. [Google Scholar] [CrossRef] [Scilit] [PubMed]
- Watanabe, S.; Aizawa, J.; Shimoda, M.; Enomoto, M.; Nakamura, T.; Okawa, A.; Yagishita, K. Effect of short-term fatigue, induced by high-intensity exercise, on the profile of the ground reaction force during single-leg anterior drop-jumps. J. Phys. Ther. Sci. 2016, 28, 3371–3375. [Google Scholar] [CrossRef] [Scilit] [PubMed]
- Nardon, M.; Ferri, U.; Caffi, G.; Bartesaghi, M.; Perin, C.; Zaza, A.; Alessandro, C. Kinematics but not kinetics alterations to single-leg drop jump movements following a subject-tailored fatiguing protocol suggest an increased risk of ACL injury. Front. Sport. Act. Living 2024, 6, 1418598. [Google Scholar] [CrossRef] [Scilit] [PubMed]
- Asaeda, M.; Hirata, K.; Ohnishi, T.; Ito, H.; Miyahara, S.; Fukuhara, K.; Nakashima, Y.; Iwamoto, Y.; Ushio, K.; Mikami, Y.; et al. Time course of biomechanics during jump landing before and after two different fatigue tasks. Asia-Pac. J. Sports Med. Arthrosc. Rehabil. Technol. 2024, 37, 40–46. [Google Scholar] [CrossRef] [Scilit] [PubMed]
- Xu, D.; Zhou, H.; Quan, W.; Gusztav, F.; Wang, M.; Baker, J.S.; Gu, Y. Accurately and effectively predict the ACL force: Utilizing biomechanical landing pattern before and after-fatigue. Comput. Methods Programs Biomed. 2023, 241, 107761. [Google Scholar] [CrossRef] [Scilit] [PubMed]
- Calisti, M.; Mohr, M.; Federolf, P. Motion capture data of six jump-landings, fatigued and non-fatigued, after anterior cruciate ligament injury. Sci. Data 2025, 12, 1645. [Google Scholar] [CrossRef] [Scilit] [PubMed]
- Calisti, M.; Mohr, M.; Federolf, P. Motion Capture Data of Six Jump-Landing, Fatigued and Non-Fatigued, After Anterior Cruciate Ligament Injury, Data set, version 1; Figshare: London, UK, 2025. [Google Scholar] [CrossRef]
- Calisti, M.; Mohr, M.; Riechelmann, F.; Werner, I.; Federolf, P. Return-To-Sport Assessments After Anterior Cruciate Ligament Injury: Which Jump-Landing Test Is Sensitive to an ACL-Injury History Under Fatigued or NonFatigued Conditions? Eur. J. Sport Sci. 2025, 25, e12317. [Google Scholar] [CrossRef] [Scilit] [PubMed]
- Wang, B.; Wang, Z.; Cheng, L. Task dependent early landing kinematics after return to sport in individuals with ACL reconstruction: A secondary analysis. BMC Musculoskelet. Disord. 2026, 27, 589. [Google Scholar] [CrossRef] [Scilit] [PubMed]
- Hawinkel, S.; Waegeman, W.; Maere, S. Out-of-Sample R2: Estimation and Inference. Am. Stat. 2024, 78, 15–25. [Google Scholar] [CrossRef] [Scilit]
- Patrek, M.F.; Kernozek, T.W.; Willson, J.D.; Wright, G.A.; Doberstein, S.T. Hip-Abductor Fatigue and Single-Leg Landing Mechanics in Women Athletes. J. Athl. Train. 2011, 46, 31–42. [Google Scholar] [CrossRef] [Scilit] [PubMed]
- Zhang, X.; Xia, R.; Dai, B.; Sun, X.; Fu, W. Effects of Exercise-Induced Fatigue on Lower Extremity Joint Mechanics, Stiffness, and Energy Absorption during Landings. J. Sports Sci. Med. 2018, 17, 640–649. [Google Scholar]

Disclaimer/Publisher’s Note: The statements, opinions and data contained in all publications are solely those of the individual author(s) and contributor(s) and not of MDPI and/or the editor(s). MDPI and/or the editor(s) disclaim responsibility for any injury to people or property resulting from any ideas, methods, instructions or products referred to in the content. |
© 2026 by the authors. Licensee MDPI, Basel, Switzerland. This article is an open access article distributed under the terms and conditions of the Creative Commons Attribution (CC BY) license.