


Abstract
As heavy-duty vehicles and emission regulations are becoming more stringent, it is very important to pursue and develop technological advancements to tackle the scarcity of fossil fuels and emissions. To address this issue, this paper aims to investigate the effect of hybrid flow control methods on the coefficient of drag for an Ahmed body. In this study, four distinct types of flaps were tested to determine the most effective geometry for drag reduction compared to the baseline value obtained using in-house experiments. Next, the synthetic jet actuation (SJA) is incorporated into the configuration to understand the effect of forcing on the coefficient of drag. This study proposes a novel two-stage hybrid flow-control strategy combining a perforated panel with SJA for aerodynamic reduction in a square-back Ahmed body. In the first stage, the perforated panel passively modifies the flow immediately upstream of the base region, attenuating the momentum and energetic flow structures entering near the wake and thereby promoting a more favorable wake state. In the second stage, synthetic jet actuators actively manipulate the conditioned wake to further enhance pressure recovery and reduce aerodynamic drag. This sequential passive–active approach is intended to reduce the actuation demand placed on the synthetic jets while achieving greater overall drag reduction than an exclusively active flow-control strategy. For the passive control cases the elliptic flap with holes achieved 9.38% drag reduction compared to the baseline. For the hybrid control case combining both passive control and SJA, this value increased to 12.34%.
1. Introduction
Heavy-duty vehicles (HDVs) contribute around 25% of the greenhouse gas (GHG) emissions within Europe [1]. In accordance with the European Union (EU) Regulation 2019/1242, the CO2 emissions per km for new HDVs must be reduced by 90% until 2040 [2]. To meet this deadline, technology roadmaps developed by the Automotive Council and Advanced Propulsion Centre (APC) provide guidance highlighting potentially influential technologies. To improve the systems’ efficiency and emissions of heavy-duty vehicles, advanced highway aerodynamics are named as one of the technology enablers which are projected be developed until 2050 [3]. To further support this, the EU have published an amendment to directive 96/53/EC (2015/719) to provide additional flexibility for development and attachment of flaps and aerodynamic devices to enhance efficiency and reduce the fuel consumption of heavy goods vehicles [4,5].
Considering the discussed points, it is evident that innovation in aerodynamics is sought after and well supported by legislation and regulation to reduce the emissions and increase the efficiency of heavy-duty vehicles. To evaluate the aerodynamic performance of heavy-duty vehicles, experimental and numerical studies are performed. For both types of studies, bluff bodies are used to reduce computational time and eliminate unnecessary complications generated by vehicle geometry. The most commonly used bluff body type is the Ahmed body, which was first developed and used by Ahmed et al. in 1984 [6]. The body aims to replicate the geometrical features of a heavy-duty vehicle in a simpler manner.
Altaf et al. [7] have conducted a study which investigated the effect of utilizing multiple flaps located on a square-back MAN truck, which was validated by an Ahmed body to investigate the effect on drag reduction. In this study, the mounting angle, geometry, length and surface area of the flaps were altered to identify the scenario which will create the maximum amount of drag reduction. The results indicated that for the best-case scenario, using an elliptic flap, a drag reduction of around 11% was obtained. Comparatively, for a length-equivalent and surface-area-equivalent flap, the drag reduction values observed were 6.37 and 6.84%, respectively. Bruneau et al. [8] have investigated the effect of using porous devices on a two-dimensional square-back Ahmed body. In total, five cases were studied which were incorporated without a porous layer, a porous layer located at the top of the body and symmetrical configurations. The configurations were tested at Re = 30,000 and Re = 60,000. It was concluded that the highest drag reduction was achieved when the static pressure was increased, and the vorticity was reduced. For the best-case scenario, where the porous layer was attached to the front and the top surfaces, a drag reduction of around 45% was observed. Bruneau et al. [9] have also investigated the effect of combining passive control methods with active techniques on drag reduction for a square-back Ahmed body. For this study, a Reynolds number of 8275 was used. The synthetic jets were located at the top, middle and bottom sections of the model, where the amplitudes were selected to be 0.15, 0.3, 0.6 and 0.9, respectively. For the passive control, two distinct cases were used where the porous media was located at the top of the model and symmetrically. When both control methods are coupled, for the best-case scenario, 31% drag reduction was observed, which was primarily generated by the relocation of the vortex recirculation by using hybrid control methods. Zhou et al. [10] have investigated the aerodynamic performance of a 35° Ahmed body, which was fitted with spoilers equipped with different opening areas at Re = 2.78 × 10⁶. The cases tested ranged from no opening to full opening. The results indicated that the growing spoiler area is inversely proportional to the drag reduction until the threshold value is reached, which inhibits the drag reduction. This trend continues beyond this point. The shallowest opening (Case 2) exhibits the highest reduction, which was recorded to be 6.5%. The spoilers utilized were reported to be strongly influencing the vortex dynamics, where the formation of separation layer was inhibited. Additionally, the separation in the spoilers leads to additional air flow at the lower section of the body, which reduces pressure drag, further influencing the drag coefficient. Darabasz et al. [11] explored the effect of utilizing various geometries of cavity walls on flat-back Ahmed body on drag reduction. For this study, Re = 6 × 10⁵ and four distinct top spoiler designs were used which incorporated through and blind holes. The holes were 25 mm in width and height; the thickness alternated between 6 and 9 mm. It was concluded that the design used was influential in wake stability and flow separation, reducing the drag. Mohammadikalakoo et al. [12] have explored the effect of incorporating passive flow control to an Ahmed body with the aid of rear linking tunnels. The investigations involved both experimental and numerical studies utilizing 25° and 30°/35° Ahmed bodies, respectively. The rear linking tunnels were created to redirect the flow from the side walls which contribute to the high pressure to the wake region located at the back of the model where the low-pressure region is present. In total, three distinct versions of the rear linking tunnels were utilized, which were the rectangular, four-hole and five-hole tunnels. For all of the configurations, the holes located at the side of the model was larger in size compared to the holes located at the back. The tunnels were tested at 10, 20 and 30 m/s, respectively. The numerical results indicate 2–5% drag reduction compared to the baseline where the highest drag reduction was achieved for the 30° Ahmed body at 30 m/s. The drag reduction was found to be directly proportional to the slant angle. The movement of the high-pressure region to the back of the body is found to be largely contributing to the reduction in the size of the wake, hence the pressure drag. Thacker et al. [13] have investigated the suppression effect using two distinct geometries of passive control devices located at the rear slant of a 25° Ahmed body. The control devices utilized were classified as sharp- and round-edge, both located at the intersection between the roof and the slant to minimize flow separation, hence reducing the drag. Compared to the baseline, a drag reduction of 10% was achieved due to the removal of the flow separation at the central section of the model by using the flow control devices. In addition to this, the wake vortices were pushed further away from the back of the model, further reducing the drag. Selvaraju et al. [14] have studied the aerodynamic performance of an SUV car model utilizing a vortex generator and diffusers to manipulate the flow behavior. The overall width of the diffuser was 1000 mm and the delta-shaped vortex generator was located on the roof of the model. The results indicated that when both flow control devices are utilized, a total drag reduction of around 7.93% was achieved. Tran et al. [15] have investigated the aerodynamic behavior of a 0.7-scale Ahmed body with various deflectors mounted at a range of angles with a Reynolds number of 2.45 × 10⁵. Each deflector was 14 mm in length and 1.5 mm in thickness. Deflection angles ranging between −16° and 25° were tested. The results indicate that the highest amount of drag reduction was achieved at 8% utilizing a deflection angle of 0°. This was concluded to be caused by the flat slant and base surface pressure distribution. Govardhan et al. [16] have employed shape optimization to study the improvement in aerodynamics on an Ahmed body. In this study, the back shape and rear slant design was modified to achieve drag reduction. The slant angles used ranged between 5° and 30°. The 30° slant angle version altered the vortex structure, improving the flow separation and achieving a drag reduction between 7 and 10%. Han et al. [17] investigated the effect of utilizing synthetic jets for active flow control on a 2D vehicle model numerically. The results of this study were compared to another study which utilized the LES (large eddy simulation) method instead of the partially averaged Navier–Stokes (PANS) method. Synthetic jet actuators were located at the top and the bottom of the model in slots. The arrangement utilized for the study was the same as the study previously undertaken by Pastoor et al. [18]. The results indicated that compared to the LES methodology, the PANS method achieved an around 15% lower drag coefficient. Hanfeng et al. [19] studied the effect of flow deflectors on aerodynamic drag reduction using an Ahmed body with a 25° slant angle. The Reynolds number utilized for this study was 8.7 × 10⁵. The deflectors were positioned at the side and leading edge of the slant. Utilizing the TEM (top-edge-mounted) deflectors were found to reduce the drag coefficient by between 10.9% and 11.6% for the 1–3% length flow deflectors. McNally et al. [20] studied the effect of active flow control on a Honda simplified body which is a flat-back ground vehicle. A number of microjets located in normal and tangential orientation to the body were utilized. The injection location, diameter and blowing ratio for the jets were controlled parameters. Numerical studies achieved a maximum drag reduction of 2.6% when the jets were relocated upstream. Cui et al. [21] have compared utilizing steady and blowing synthetic jets to investigate the aerodynamic performance of an Ahmed body. The experimental results obtained were compared against a numerical simulation based on the LES model. In this study, the actuation strategy, location, direction and the velocity of jets were controlled variables. A total of 17 jets and three distinct mounting locations at the back of the model were utilized. The study concluded that a drag reduction of 3% and 9% could be achieved using steady blowing and synthetic jets, respectively. Bing-Xin et al. [22] have investigated the aerodynamic effects of utilizing an unsteady jet to understand the flow characteristics on a 25° Ahmed body. The jets were arranged in a slot on the rear part of the body. The slots were placed in four distinct locations at different mounting angles. The jets were activated both in suction and blowing configurations. The results indicated that compared to the baseline, a drag reduction of around 13% was achieved using the low-frequency suction jet located at the upper edge of the model. Finally, the high-frequency jet located on the sides of the Ahmed body achieved 13.6% and 9.1% drag reduction for blowing and suction control, respectively. In a review paper by Herberg et al. [23], comparing the active control methods in the literature, based on the decision matrix compiling factors such as performance, efficiency and robustness, synthetic jets were ranked in third place.
From the literature review conducted, it is clearly evident that both passive controls using flaps and synthetic jets are widely utilized as an effective method for drag reduction. Previously conducted studies investigated hybrid control methods but the combination of geometric flaps located at the back of the body and synthetic jets remain mostly unexplored. Both passive flaps and synthetic jets are effective in pushing the recirculation region and altering vortex dynamics to achieve drag reduction. In this study, the effect of passive (flaps) and hybrid control methods (flaps and SJA) on vehicle aerodynamics were investigated numerically using an Ahmed body. Perforated flaps were used to reduce the energy of the flow prior to SJA. This translates to a lower baseline drag coefficient which enhances further drag reduction and more precise flow control. Additionally, higher drag reduction can be achieved as the baseline drag value is lower compared to a solely active flow control system. Hence, this approach can be identified as a novel and two-stage flow control method. Additionally, this study aims to reinforce the baseline findings by addressing geometrical ambiguity in a previously published study. In total, four flap geometries (with and without holes) attached at the rear of the Ahmed body is compared and validated against the experimental values obtained in-house. Following this, for the best-case scenario, where maximum drag reduction was achieved, the effect of utilizing a hybrid method incorporating synthetic jets to the flaps with holes was investigated.
2. Theory and Methodology
All simulations were performed using the realizable k-ε turbulence model with enhanced wall treatment (EWT). The realizable k-ε model is a two-equation Unsteady Reynolds-averaged Navier–Stokes (URANS) closure that improves upon the standard k-ε formulation by satisfying mathematical constraints on the Reynolds stress tensor and using an improved transport equation for the turbulent dissipation rate ε [24,25]. These modifications make the realizable k-ε model more accurate for flows involving strong streamline curvature, rotation, and separated shear layers, all of which are present in the Ahmed body wake. The choice of the realizable k-ε model with EWT is appropriate for the present configuration, which involves a complex three-dimensional separated wake, passive flap surfaces with flow communication through perforations, and periodic synthetic jet actuators (SJAs) forcing [26,27]. The continuity equation is shown in Equation (1) where ρu is the mass flux density and velocity vector.
Equation (2) illustrates the conservation of momentum equation where −∇p is the pressure gradient, μ is molecular viscosity, ρf are external forces and u is the velocity vector.
Equation (3) illustrates the turbulent k equation where ρ is the fluid density, is the mean velocity vector, Gk is the production of turbulent energy due to mean velocity gradient, where Gb is the production of turbulent energy due to the buoyancy. YM represents the contribution of the fluctuating dilation in compressible turbulence to the overall dissipation rate. μ and μt are molecular and turbulent viscosity. ρk is the turbulent kinetic energy per unit volume of fluid and σk is the Prandtl number. Sk represents user-defined source term.
Equation (4) shows the turbulent ε equation where ρ is the fluid density, is the mean velocity component, μ and μt are molecular and turbulent viscosity, Gk is the production of turbulence kinetic energy due to the mean velocity gradients and Gb is the production of turbulent energy due to the buoyancy. σε is the Prandtl number. C1ε, C2ε and C3ε are tuning constants. Sε is a user-defined source term. ρε is the dissipation rate.
Equation (5) illustrates the momentum coefficient equation where ρj is the density of the fluid, is the synthetic jet area (circular orifice), Ujm is amplitude of the synthetic jet, ρ∞ is the density of the freestream flow and S∞ is the vertical maximum surface of the body [28].
2.1. Experimental Methodology
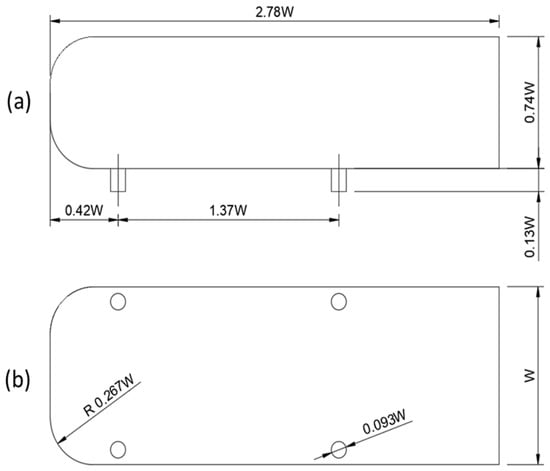
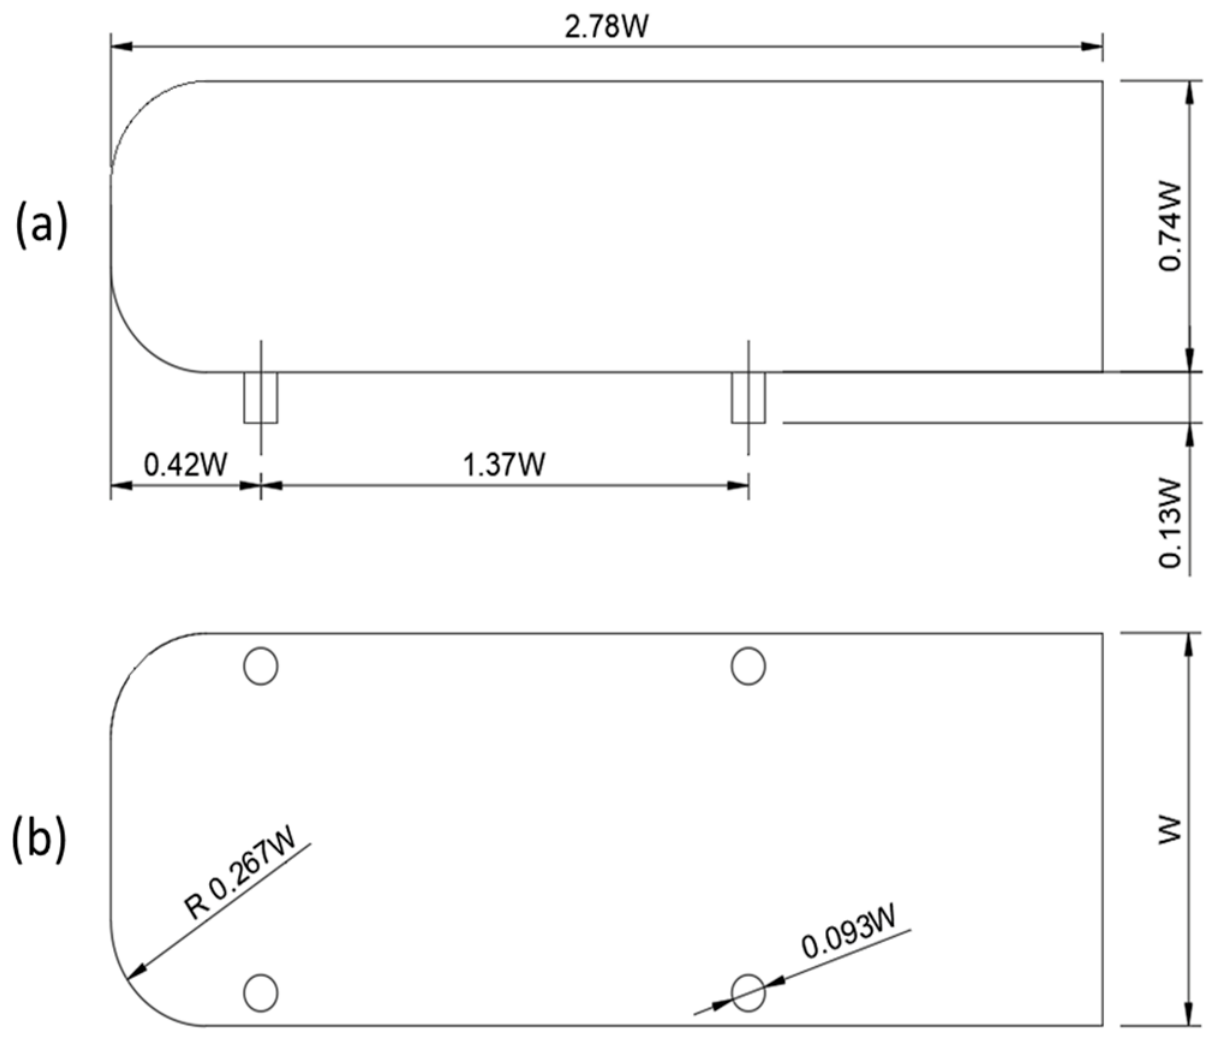
Experiments were conducted using a square-back Ahmed body. The model was designed at an approximate geometric scale of 1:1.8 relative to the original configuration introduced by Ahmed et al. [6]. The dimensions of the model are shown in Figure 1.
Figure 1.
Schematic illustrating the dimensions of the side (a) and bottom (b) view of the Ahmed body where W is 0.216 m as utilized by Brackston et al. [29]. The diameter of the support legs is 0.093 W.
2.1.1. Wind Tunnel Facility
The experiments were carried out in a closed-return wind tunnel with a test-section cross-sectional area of 1.37 m × 1.22 m and a length of 3.00 m. The resulting blockage ratio of the Ahmed body model was approximately 2.1%, which is sufficiently low to neglect blockage corrections. The freestream turbulence intensity within the test section was below 0.1%. The tunnel operating speed was maintained at 10 m/s, corresponding to a Reynolds number based on body height of approximately ReH = 1.09 × 10⁵. Freestream velocity was monitored continuously using a calibrated Pitot-static tube, while the wind tunnel control system maintained the target velocity with at least 0.25% accuracy.
2.1.2. Force and Pressure Measurement
Aerodynamic forces and moments acting on the model were measured using a six-component ATI Gamma IP68 force balance (sourced from ATI Industrial Automation of North Carolina, USA) mounted beneath the raised floor. The system recorded the three force components (Fx, Fy, Fz) and three moment components (Mx, My, Mz) at a sampling frequency of 25 kHz. The force balance had a measurement resolution of ±0.0125 N, corresponding to an uncertainty of approximately ±0.006 in the non-dimensional force coefficients. The unsteady pressure field on the vehicle base was measured using eight Endevco 8507C pressure transducers (sourced from PCB Piezotronics of Depew, NY, USA) flush-mounted on the square-back surface. Pressure signals were sampled at 25 kHz, enabling time-resolved analyses of the wake dynamics and spectral characteristics. To complement these measurements, an ESP-DTC electronically scanned pressure-digital temperature compensation) pressure scanner equipped with 64 pressure channels arranged in an equally spaced 8 × 8 grid was used to obtain time-averaged base-pressure distributions. The pressure taps were distributed with a spacing of approximately Δy = Δz ≈ 0.055W, and the scanner data were acquired at 250 Hz. The high-frequency pressure transducers were primarily used for wake-frequency identification and power spectral density analyses, whereas the pressure scanner measurements were employed for the determination of mean base-pressure coefficients and pressure distributions.
2.1.3. Data Acquisition and Experimental Procedure
All measurement systems were synchronized and controlled using a National Instruments data acquisition platform operated through LabVIEW v(16.0.0.) To minimize measurement drift and ensure accurate force calibration, force-balance zero offsets were recorded before and after each experimental run with the wind tunnel switched off. Additional measurements of ambient pressure and temperature were acquired throughout the experiments to determine the air density required for aerodynamic coefficient calculations.
2.2. Simulation Methodology, Solver Settings, Numerical Schemes and Reference Values
The pressure-based coupled solver was used for all simulations. Spatial discretization employed the second-order upwind scheme for momentum, turbulent kinetic energy, and dissipation rate, with the pressure interpolation scheme applied at cell faces. For all cases, a realizable k-ε turbulence model with enhanced wall treatment (EWT) was used with convergence criteria of 105 on all residuals to capture time-dependent vortex shedding and flow separation in the bluff body wake. For the SJA simulations, the solver was switched to transient mode with the second-order implicit time integration scheme. A time step of Δt = 0.001 s was used for all transient cases, providing temporal resolution to capture both the SJA actuation cycles and the lower-frequency wake dynamics. Each time step converged to a maximum of 20 inner iterations. The reference values and air properties used in this study are shown in Table 1.
Table 1.
Reference values and air properties at 15 °C used for non-dimensional coefficient computation in ANSYS Fluent 2023.2.
2.3. Boundary Conditions
The inlet was set as a velocity inlet with uniform freestream velocity U∞ = 10 m/s and a turbulence intensity of Tu = 0.1%, consistent with the Brackston et al. [29] wind tunnel specification of less than 0.1%. The outlet was set as a pressure outlet with zero-gauge static pressure. The tunnel top and side walls were treated as symmetry boundaries to avoid boundary layer development on the tunnel walls that was not present in the experiment. The ground plane was modeled as a moving wall translating at Uwall = 10 m/s in the streamwise direction, replicating the raised-floor ground simulation of the experimental configuration and avoiding the artificial boundary layer accumulation that would result from a stationary ground wall. All Ahmed body and flap surfaces were set as stationary no-slip walls.
For the passive control simulations, the flap surfaces were assigned as stationary no-slip walls at the appropriate deflection angle. For the active–passive control simulations, a two-stage boundary condition strategy was adopted. In the first stage, the SJA orifice faces were assigned as no-slip wall boundary conditions, replicating the unactuated state and providing a controlled baseline for the hybrid configuration. After confirming baseline convergence, the SJA orifice boundary conditions were switched to velocity inlet type with a sinusoidal normal velocity profile Vj·sin (2πft), where Vj is the peak jet velocity and f is the actuation frequency determined from power spectral density analysis of the baseline wake. This two-stage approach allows direct quantification of the drag change attributable solely to SJA, with the passive flap geometry held constant between the two stages. Table 2 illustrates the boundary conditions applied for all simulations.
Table 2.
Boundary conditions were applied in all simulations. SJA orifice conditions differ between baseline (wall) and controlled (velocity inlet) stages of the active–passive simulations.
2.4. Geometry of the Ahmed Body and Wind Tunnel Domain
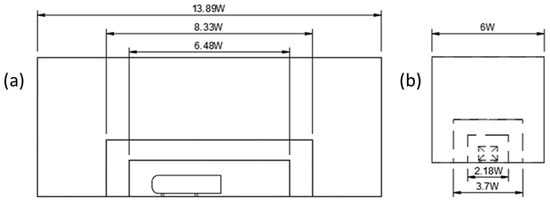
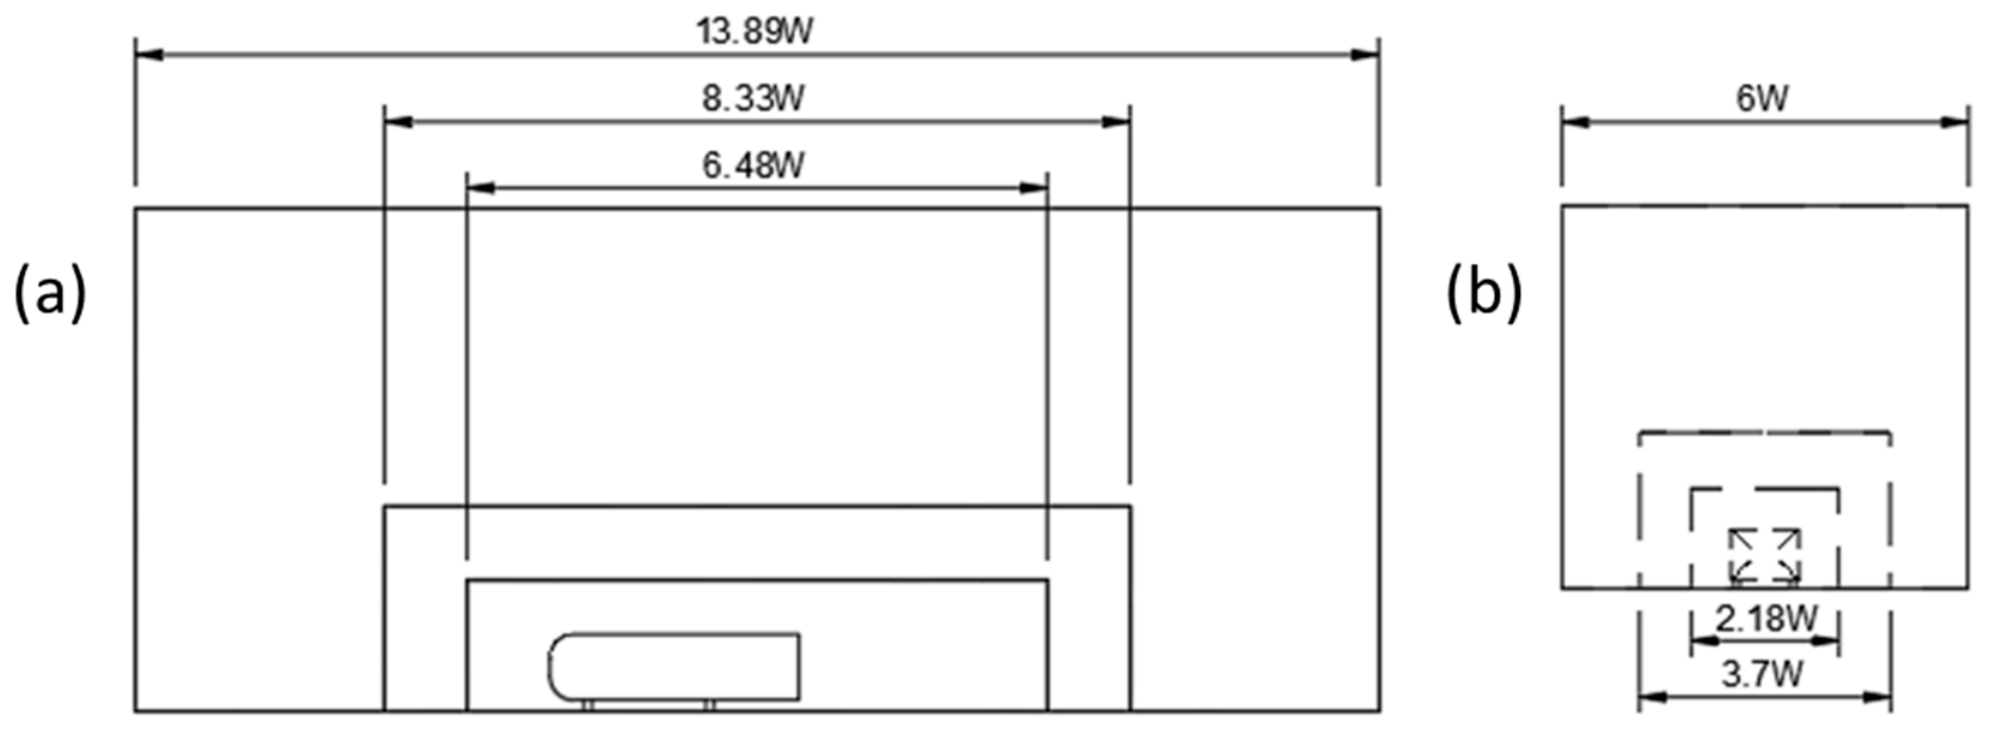
The geometry and the domain utilized by Brackston et al. [29] was used as a baseline to understand the accuracy and the effectiveness of the mesh generated. Figure 1 provides a schematic illustrating the dimensions of the Ahmed body. Figure 2 illustrates the side and back view of the wind tunnel domain. All the dimensions displayed are based on the width (W) of the Ahmed body model used by Brackston et al., which is 0.216 m [29].
Figure 2.
Schematic to illustrate the dimensions of the side view (a) and back view (b) of the wind tunnel domain where W is 0.216 m as utilized by Brackston et al. [29].
2.5. Boundary Layer Formation
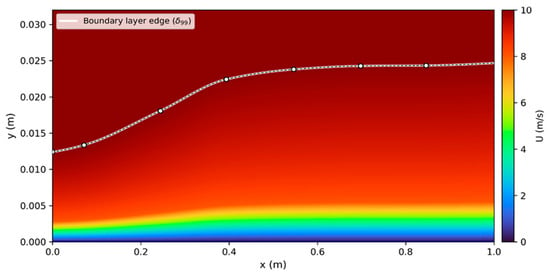
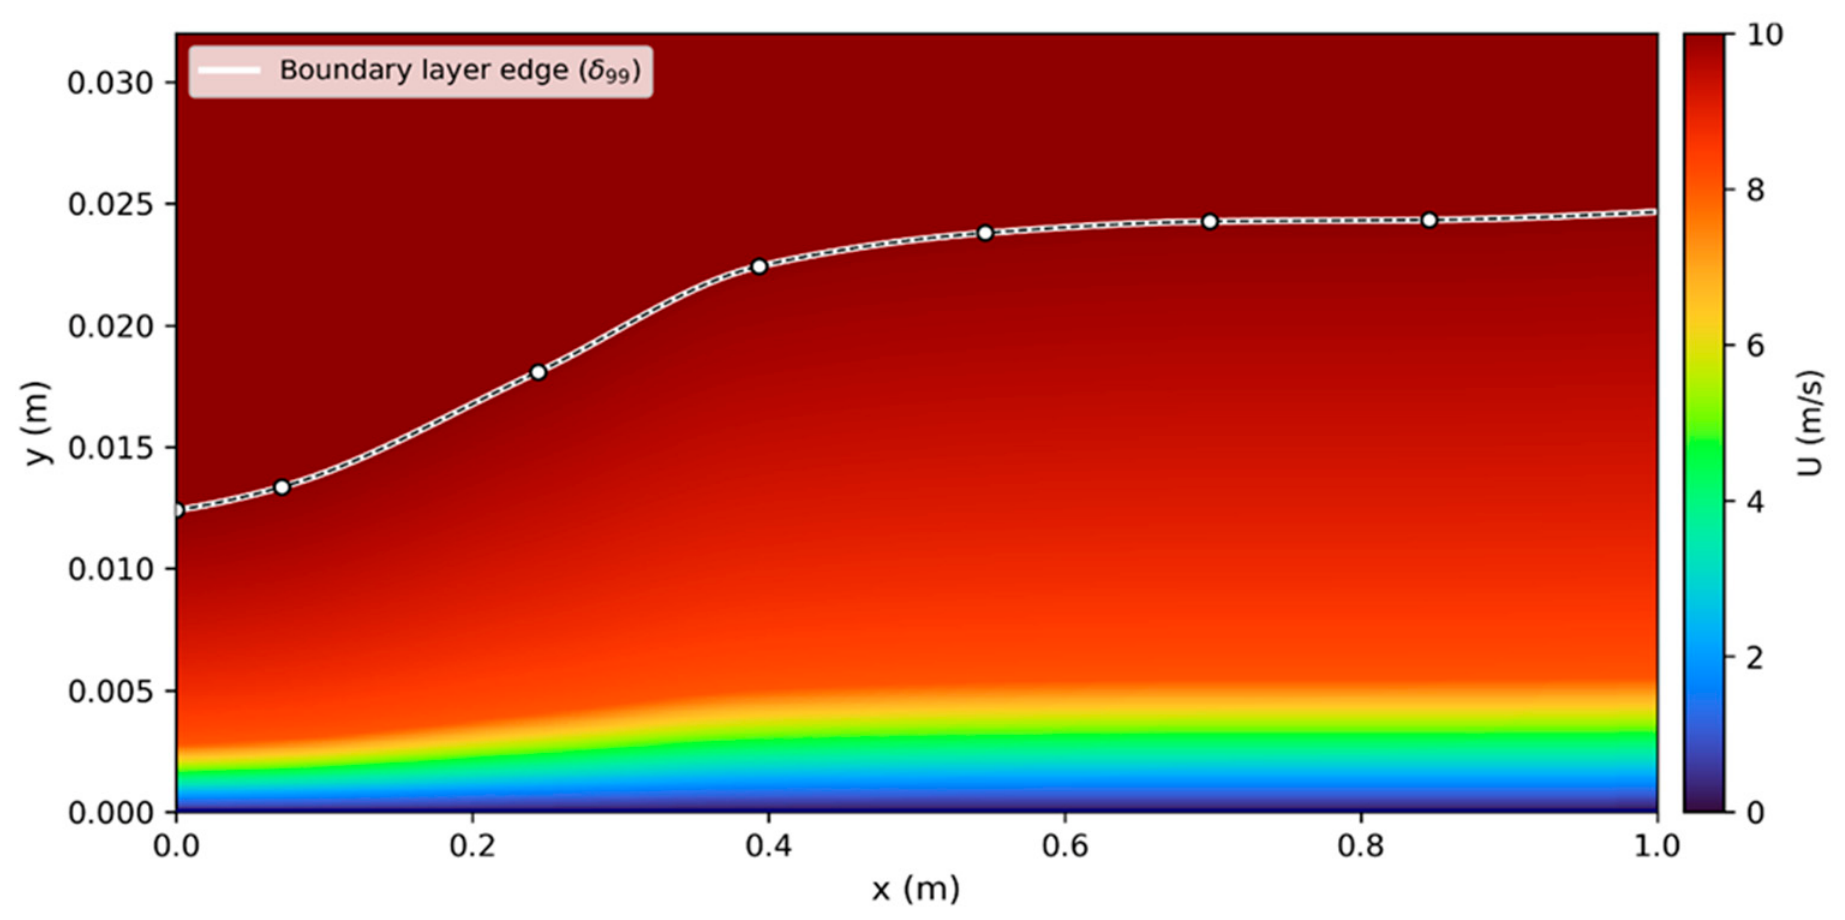
To understand the boundary layer formation and behavior within the domain, a preliminary study was undertaken to create a boundary layer profile indicating the thickness and boundary layer formation directly in front of the Ahmed body. The results from this study were used to identify and predict flow conditions and physics which will directly influence the coefficient of drag values as the model was stationary and not mounted to a rolling belt. The results indicate a maximum boundary layer thickness of 24.7 mm. Figure 3 illustrates the velocity field contour to present the boundary layer growth.
Figure 3.
Boundary layer thickness for the domain where the boundary layer is plotted in white.
2.6. Base-Pressure Coefficient
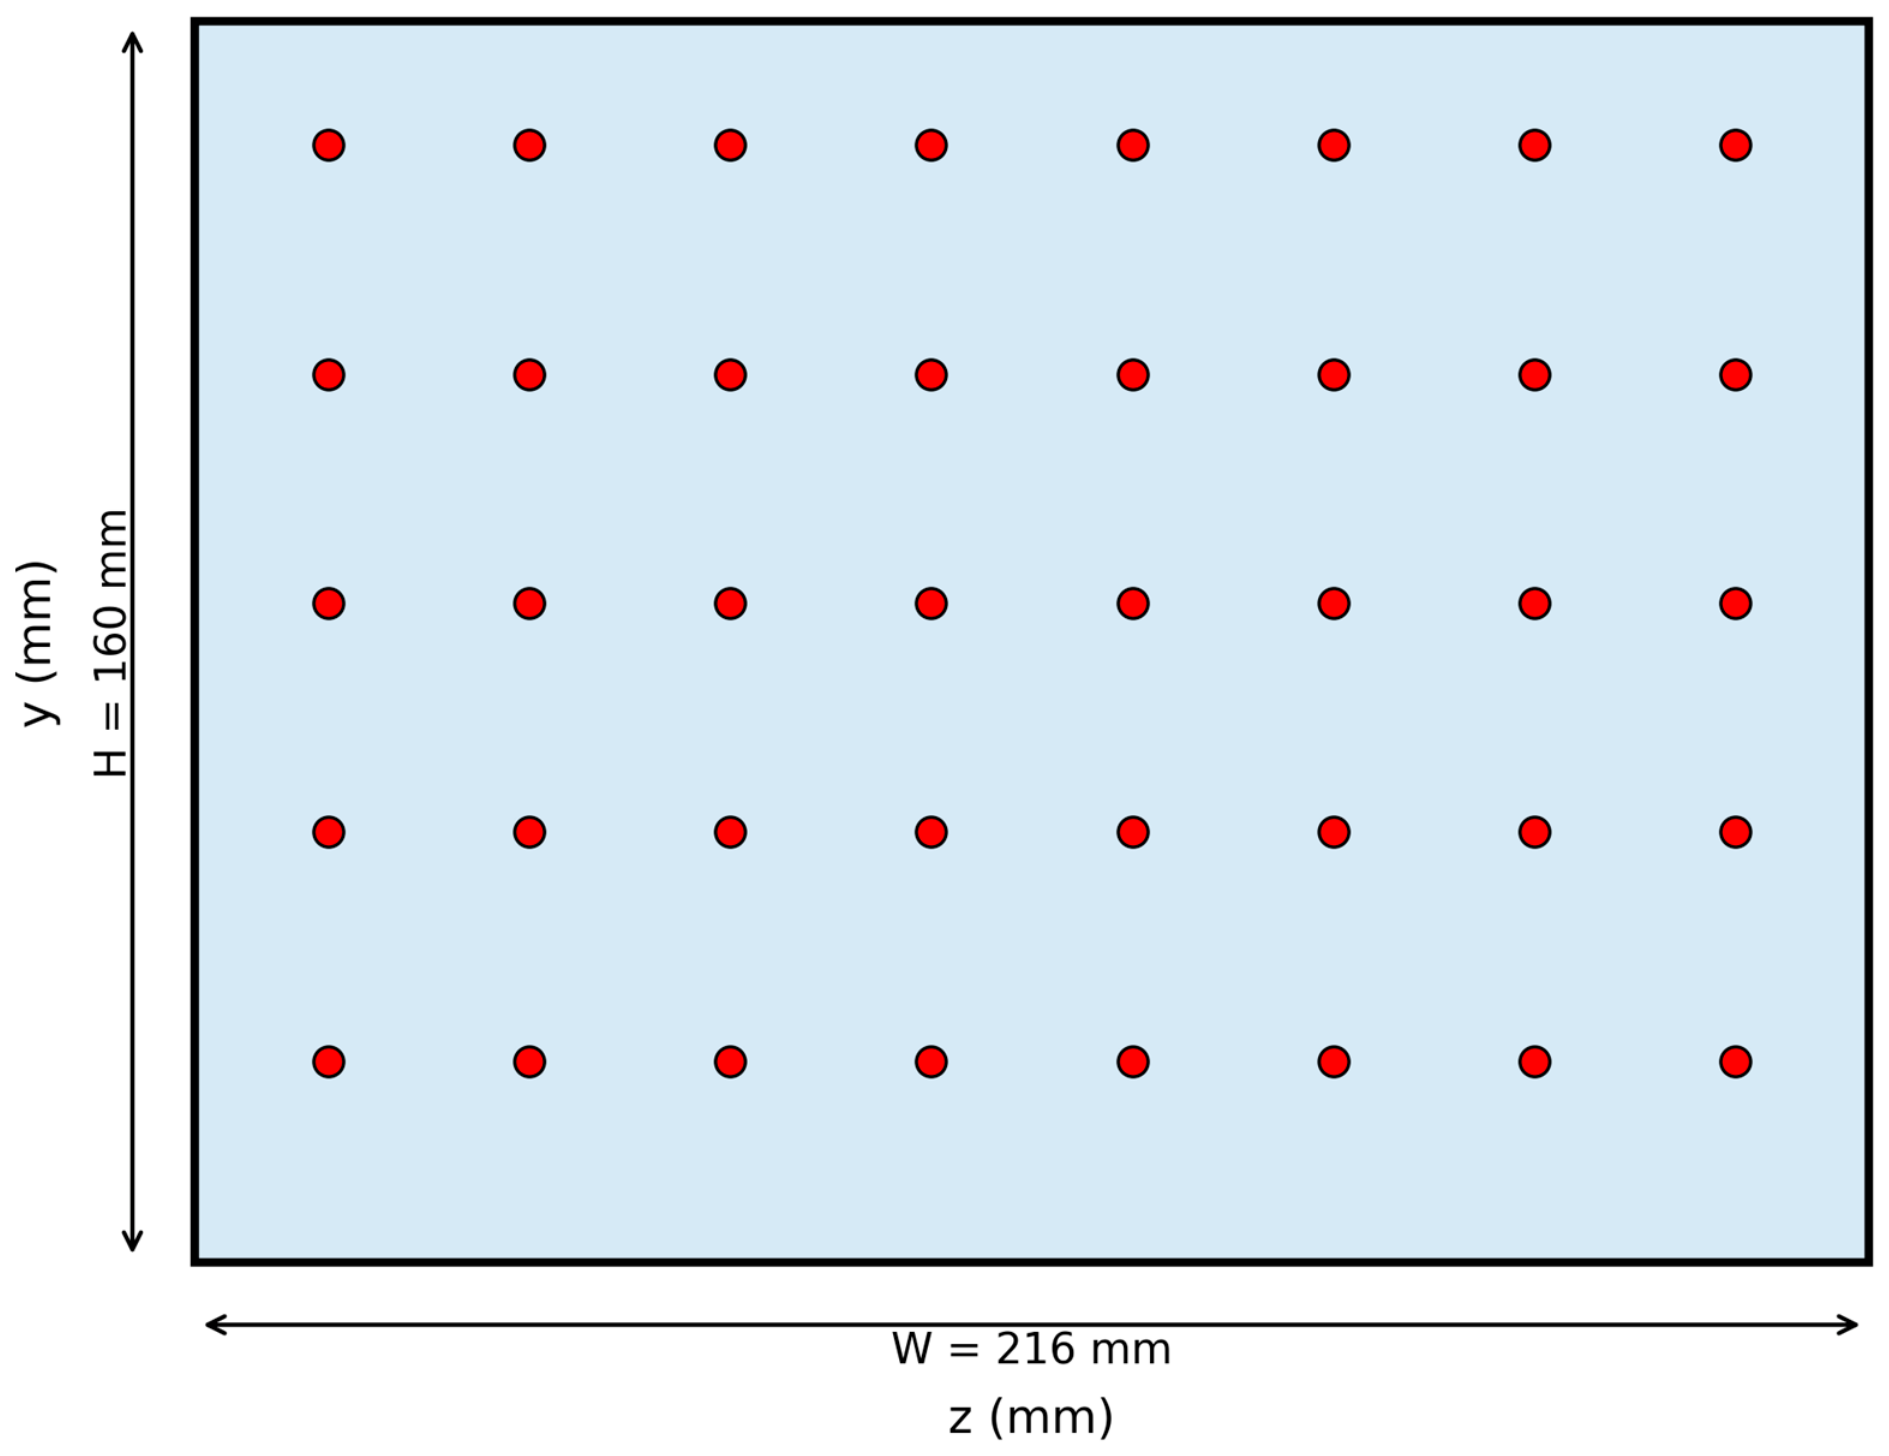
To determine the base-pressure coefficient (Cpb), a total of 40 static pressure probes arranged in an 8 × 5 grid which were distributed uniformly across the back of the Ahmed body was used. The probes were placed such that any overlap with the SJA slot locations were avoided, ensuring that the pressure measurements reflect the unobstructed base surface response rather than being influenced by local jet-induced flow near the actuator exits. Static pressure was sampled at each probe location throughout the simulation/measurement period, and the instantaneous values were time-averaged to obtain the mean pressure. The local pressure coefficient at each probe was computed using Equation (6)
where Pb is the local static pressure, P∞ is the freestream static pressure, ρ is the fluid density and U∞ is the freestream velocity. The base-pressure coefficient Cpb was then obtained by averaging the Cp values over all 40 probe locations, providing a representative measure of the mean pressure distribution acting on the base surface. The area-averaged pressure coefficient at the rear of the body can be determined using Equation (7)
where is the area-averaged pressure coefficient, Abase is the area of the back of the Ahmed body and Cp is the base-pressure coefficient. Figure 4 illustrates the orientation of the pressure probes.
Figure 4.
Pressure probes located on the back of the Ahmed body (colored in red).
2.7. Wake Dynamics and Power Spectral Density (PSD)
A total of three velocity probes located streamwise were used to observe the wake dynamics and flow behavior for all passive flow-control configurations. The coordinates for the probes were 50, 100 and 150 mm, respectively, on the x-axis with respect to the model height which was 0.160 m. On the z-axis, the probes were offset by 40 mm symmetrically to ensure wake bistability and symmetry breaking. Similarly, conducting the PSD analysis, a probe which was located at 100 mm on the x-axis based on the model height was used. These coordinates were chosen such that the recirculation bubble for all configurations was captured accurately.
3. Geometry of the Flaps
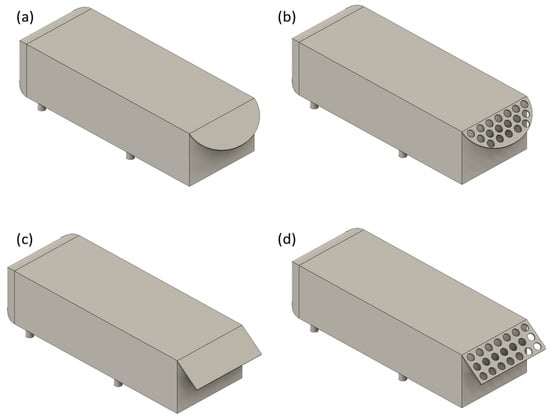
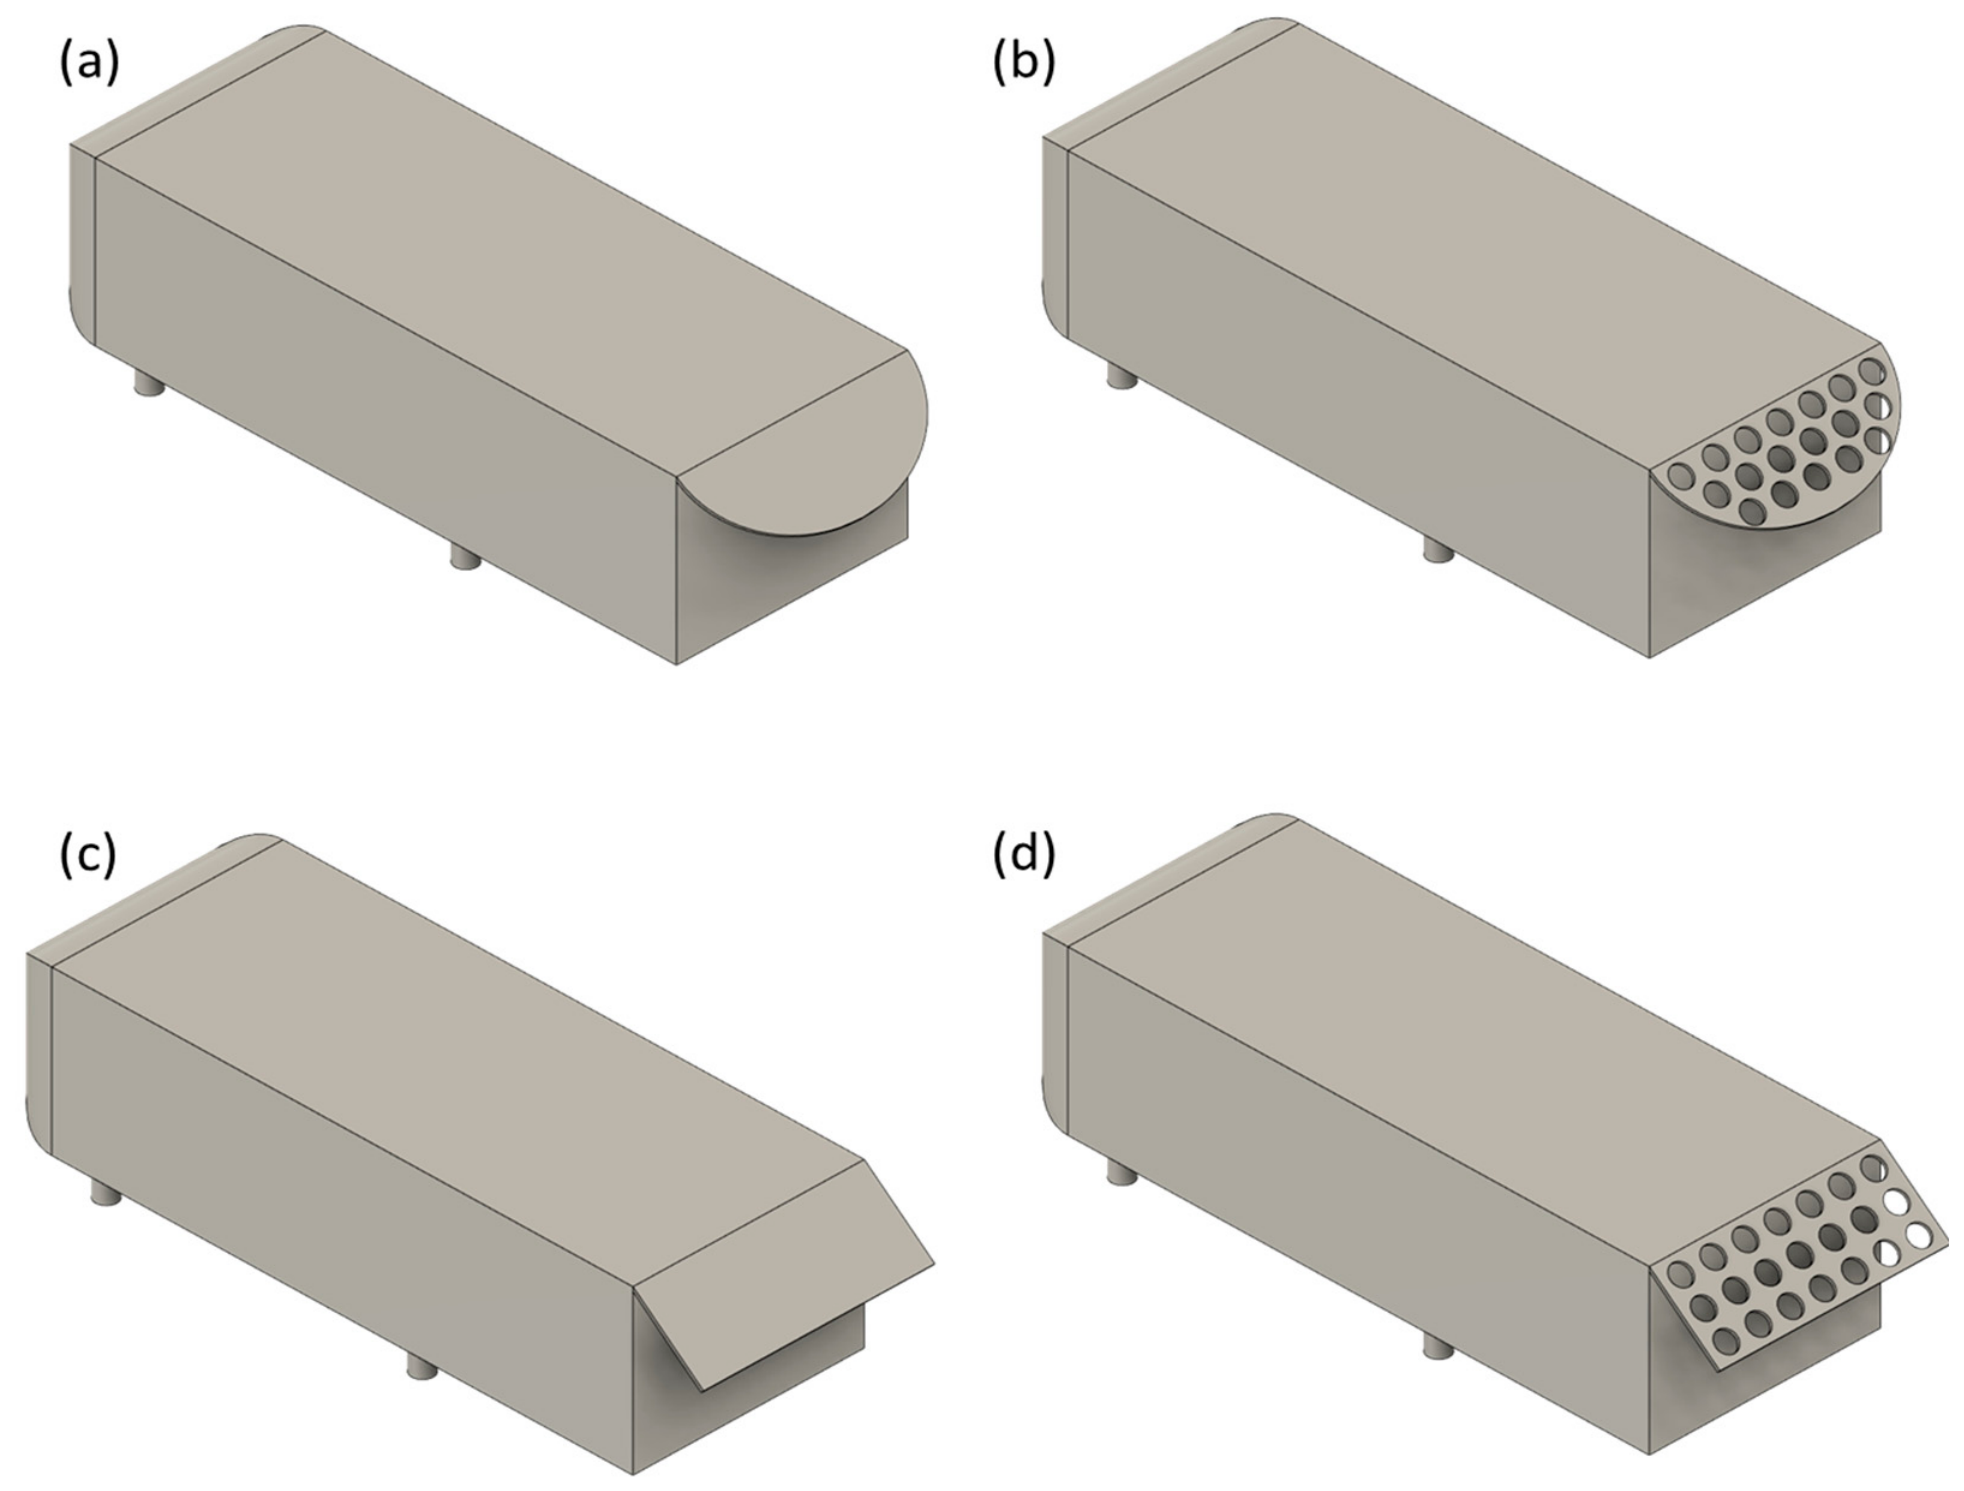
For this study, two distinct shapes of flaps, which were rectangular and elliptic, were utilized. Both flaps had a fixed length of 86.2 mm and a uniform thickness of 3 mm across all configurations. This allows for a controlled comparison between the passive flow control geometries selected. In addition to the regular flaps, flaps with holes were also used, which were equipped with 20 mm diameter holes where the spacing between the holes was set to be 30 mm. For all the configurations, flap mounting angles ranging from 10° to 80° were studied to determine the optimal mounting angle. Figure 5 illustrates the passive control method configurations tested during this study. The geometry for the flaps were drawn upon previously considered and investigated designs by Altaf et al. [7].
Figure 5.
Passive flow-control configurations illustrating the elliptic flap (a), elliptic flap with holes (b), rectangular flap (c) and rectangular flap with holes (d).
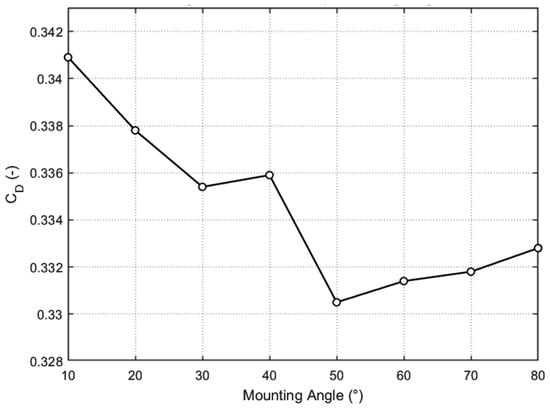
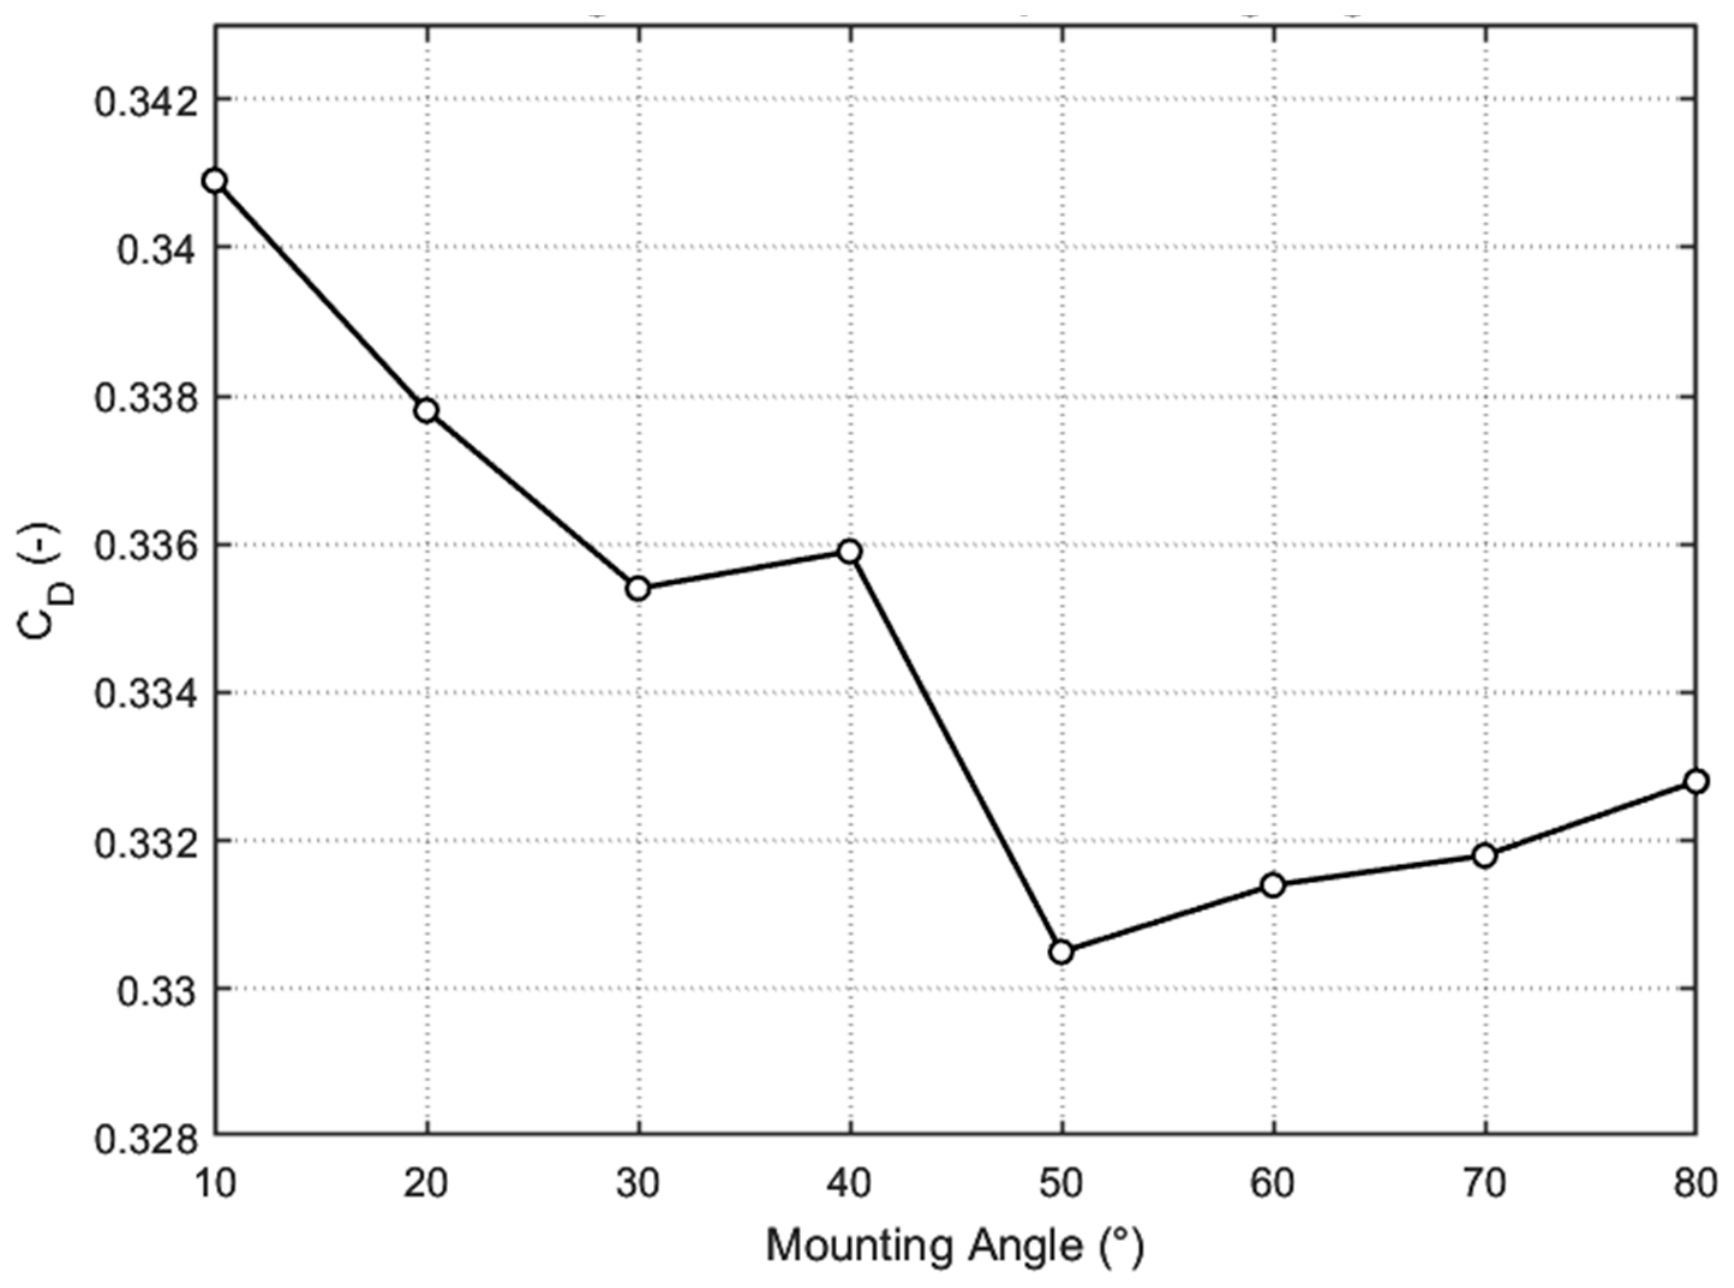
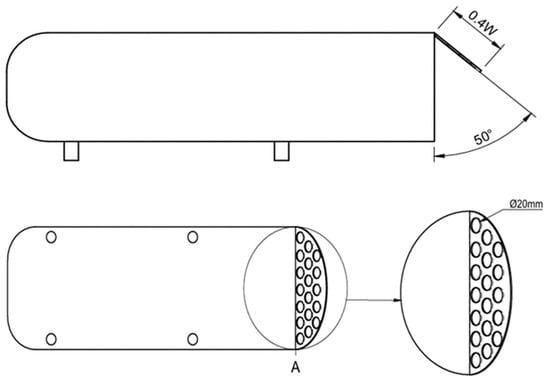
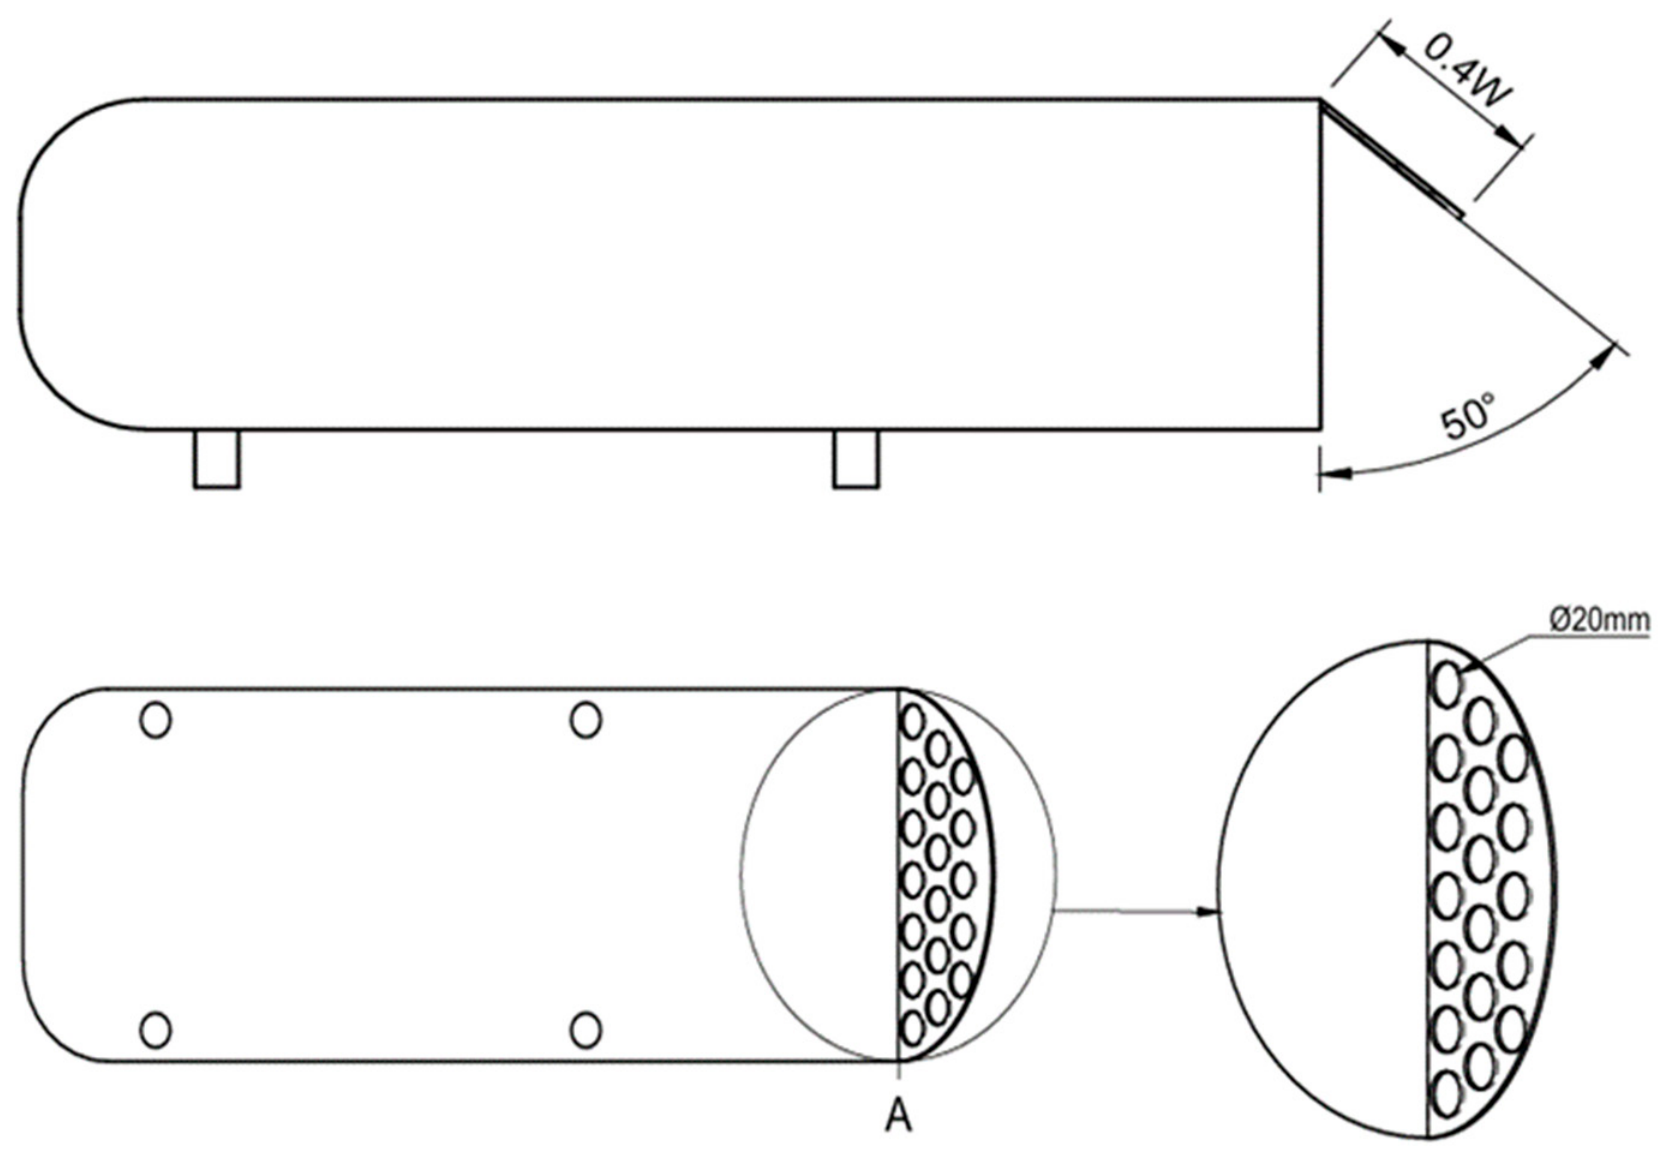
To determine the best passive flow-control configuration, a parametric study was undertaken between all four configurations shown in Figure 5. In agreement with the findings presented by Altaf et al. [7], the best-performing configuration was identified as the elliptic flap with holes. Another study was also undertaken to identify the optimal mounting angle of the flap. Flap mounting angles ranging between 10° and 80° were investigated. For each flap mounting angle, the coefficient of drag was used as a performance metric. The results indicate a coefficient of drag value of 0.3305 which is around 3% better compared to the least effective configuration of 10° flap mounting angle. The 50° flap mounting angle will be later used for integrating the synthetic jet actuation (SJA) to achieve hybrid control. Figure 6 illustrates the relationship between drag coefficient and mounting angle for elliptic flaps with holes ranging between 10 and 80°. Figure 7 illustrates an example of the 50° flap mounting angle using the elliptic flap with holes on the bluff body.
Figure 6.
Drag coefficient against flap mounting angle for elliptic flap with holes.
Figure 7.
Schematic illustrating the 50° mounting angle using the elliptic flap with holes where A shows an enlarged view for the hole orientation.
4. Meshing
Before commencing with the simulations, a mesh dependency study was conducted using the baseline configuration, which is shown in Figure 1. The coefficient of drag values obtained were compared against the baseline result obtained from in-house experiments as described in Section 2.1 which was 0.368. This was used as a baseline to confirm and understand the accuracy and mesh dependency of the mesh proposed for this study. Mesh element sizes ranging from 1.96 to 8.44 million elements and 1–5 s average was used to obtain CD,CFD values. The results of the mesh dependency study are shown in Table 3.
Table 3.
Results of the mesh dependency study for baseline configuration.
The results of the mesh dependency study for the base model, when compared to the CD values obtained from the in-house experiment, indicated that the percentage error ranged between 0.11 and 7.36%. The mesh dependency of the passive flow control (elliptic flap) and a hybrid flow control case (elliptic flap with holes and SJA) were also investigated using a 3–5 s average to discard the initial transient period due to increased geometrical complexity. The results of both studies are shown in Table 4 and Table 5, respectively.
Table 4.
Results of the mesh dependency study for passive flow control.
Table 5.
Results of the mesh dependency study for hybrid flow control geometry.
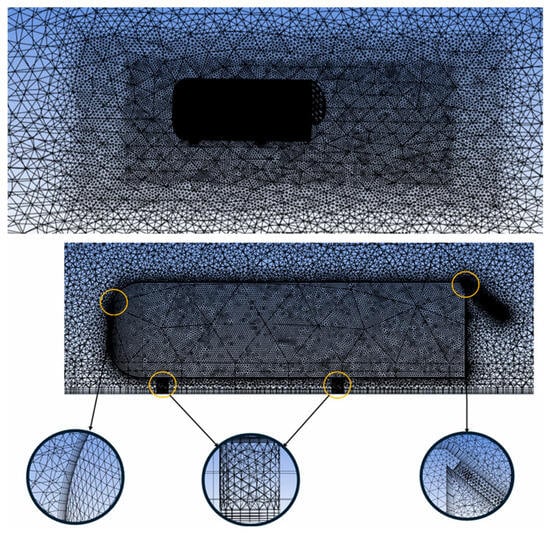
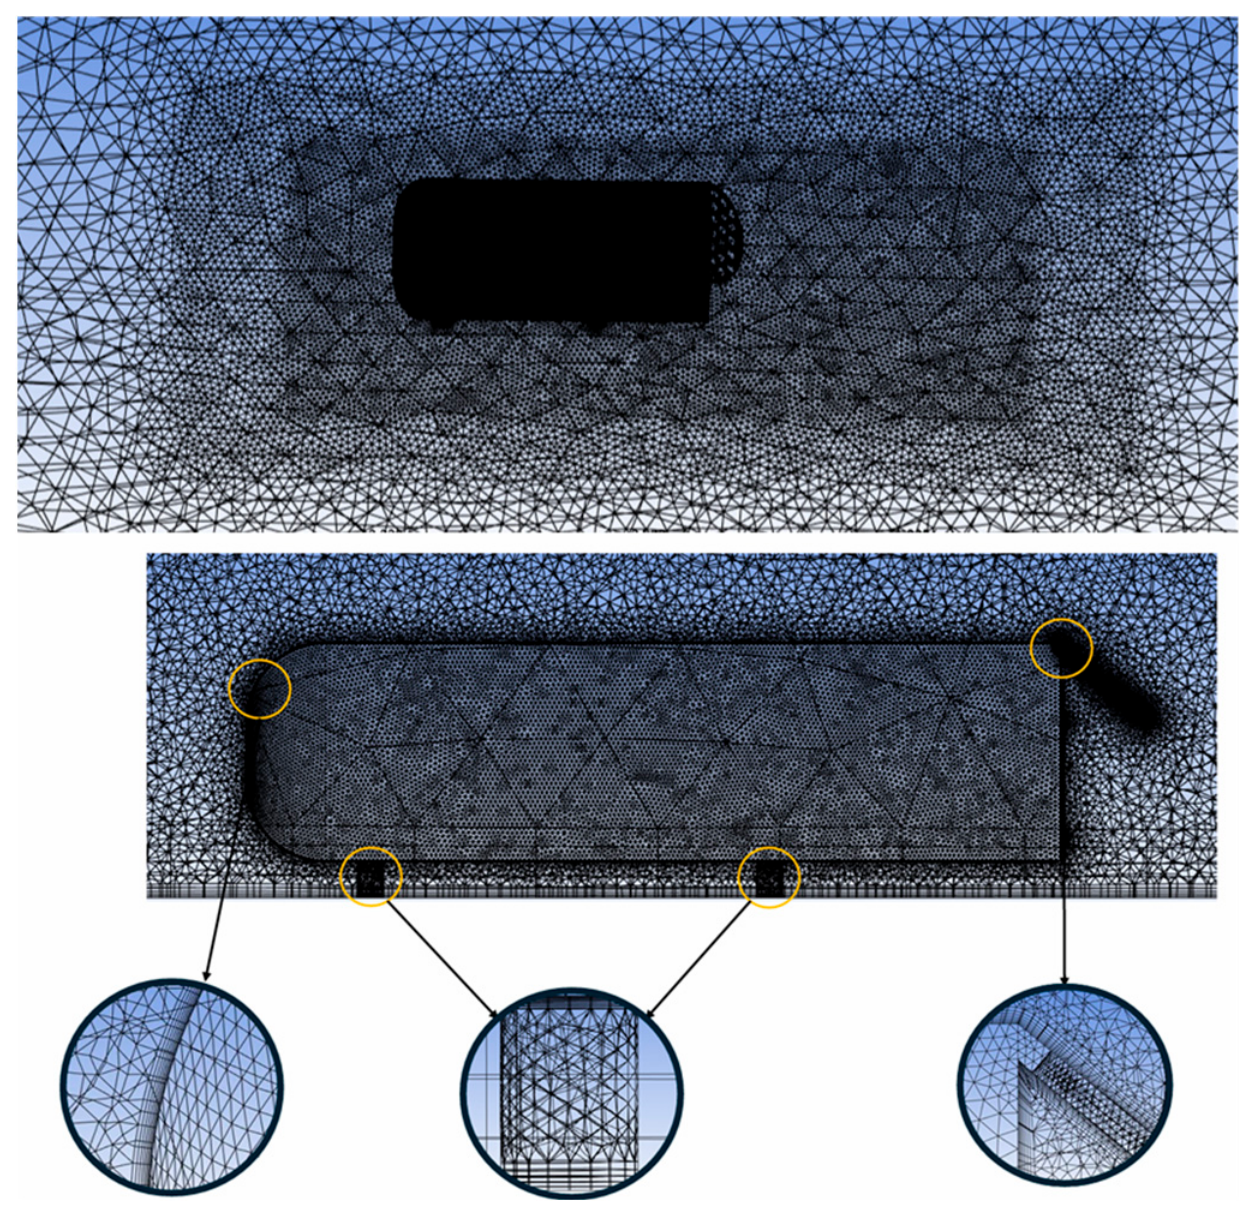
As there was no direct baseline coefficient of drag value for the passive flow control and the hybrid flow control cases, to verify the mesh dependency, the deviation between the coarse and fine mesh were compared. The results of the mesh dependency study for the passive flow control case indicate a maximum deviation of 2.83%. The fluctuation in percentage error between 4.10 and 6.69 million element cases indicates an overly fine mesh where the rounding errors are present in the calculation. Beyond approximately 6.9 million elements, further mesh refinement produced only small variations in the predicted drag coefficient, with no systematic change in the solution. For the hybrid flow control case, compared to the coarse mesh, a maximum deviation of 3.25% was recorded. Similarly, beyond 6.90 million elements, the rounding errors governed the discretization and accuracy obtained by the additional number of cells. Therefore, for both cases the 6.9-million-element mesh was selected as a suitable compromise between spatial resolution and computational cost. The final mesh exhibited an average skewness of 0.2047, with a maximum localized skewness of 0.7951. These maximum values were isolated strictly within the non-critical boundaries and did not impact on the high-gradient regions near the body walls. Furthermore, the minimum orthogonal quality was maintained above 0.1844 which safely exceeds the recommended threshold of 0.10 for stable ANSYS Fluent simulations. The y+ value was 3.78. The final version of the mesh generated, which consists of around 6 million elements with the 50° flap mounting angle, can be seen in Figure 8.
Figure 8.
The mesh generated with the 50° flap mounting angle for the elliptic flap with holes.
5. Validation of Baseline Drag Coefficient Values
As mentioned previously in Section 1, to ensure the reliability and accuracy of the results obtained from the CFD study, the drag coefficient results obtained using a previously conducted experimental study were utilized. As the study carried out by Altaf et al. [7] utilized a MAN truck body and commercial finite volume method solver, it was deemed to be inconsistent to compare the coefficient of drag values obtained from this study. Instead, the experimental results obtained by using the same geometry of the Ahmed body were utilized to compare the performance and determine the accuracy of the results. This provided a two-step validation as the computational study was both tested for mesh dependency and compared against the experimental values. The results obtained by Altaf et al. [7] was also used for comparison to verify the fidelity of the methodology while maintaining an experimentally accurate numerical method. As shown in Table 3, when compared to an identical setup investigated experimentally, for the baseline configuration, the error between the drag coefficient values is only 0.11%.
The numerical drag coefficient used in this comparison was picked from the 6-million-element mesh as explained and justified in Section 4. The percentage error value obtained indicates that the numerical method utilized was accurate when compared to the exact experimental setup. This provides a comparable metric as the geometry is consistent between the two studies. Based on this comparison, the numerical method was demonstrated to be both mesh independent and consistent with the experimental values obtained during in-house experiments. Based on these findings, the 6.69-million-element mesh can be confidently used to investigate the effect of different flap configurations, as shown in Figure 5, to determine the most influential passive control methodology. Similarly, for hybrid flow, a 6.90-million-element mesh will be utilized as shown in Table 5.
6. Results and Discussion
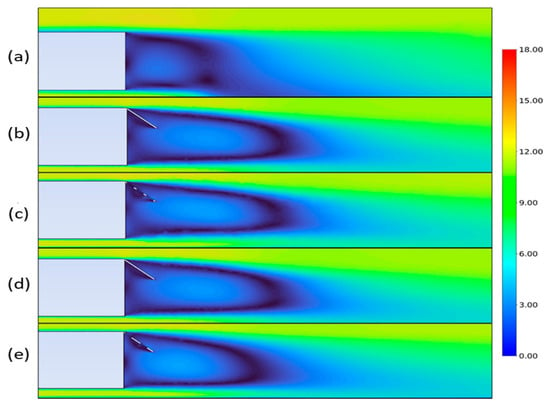
A total of 17 cases were studied utilizing the configurations shown in Figure 5. In the four cases with the flaps, the addition of the holes led to a drag decrease of 3.30%, with elliptic flaps producing the best results in both with- and without-holes configurations, in agreement with the findings presented by Altaf et al. [7].
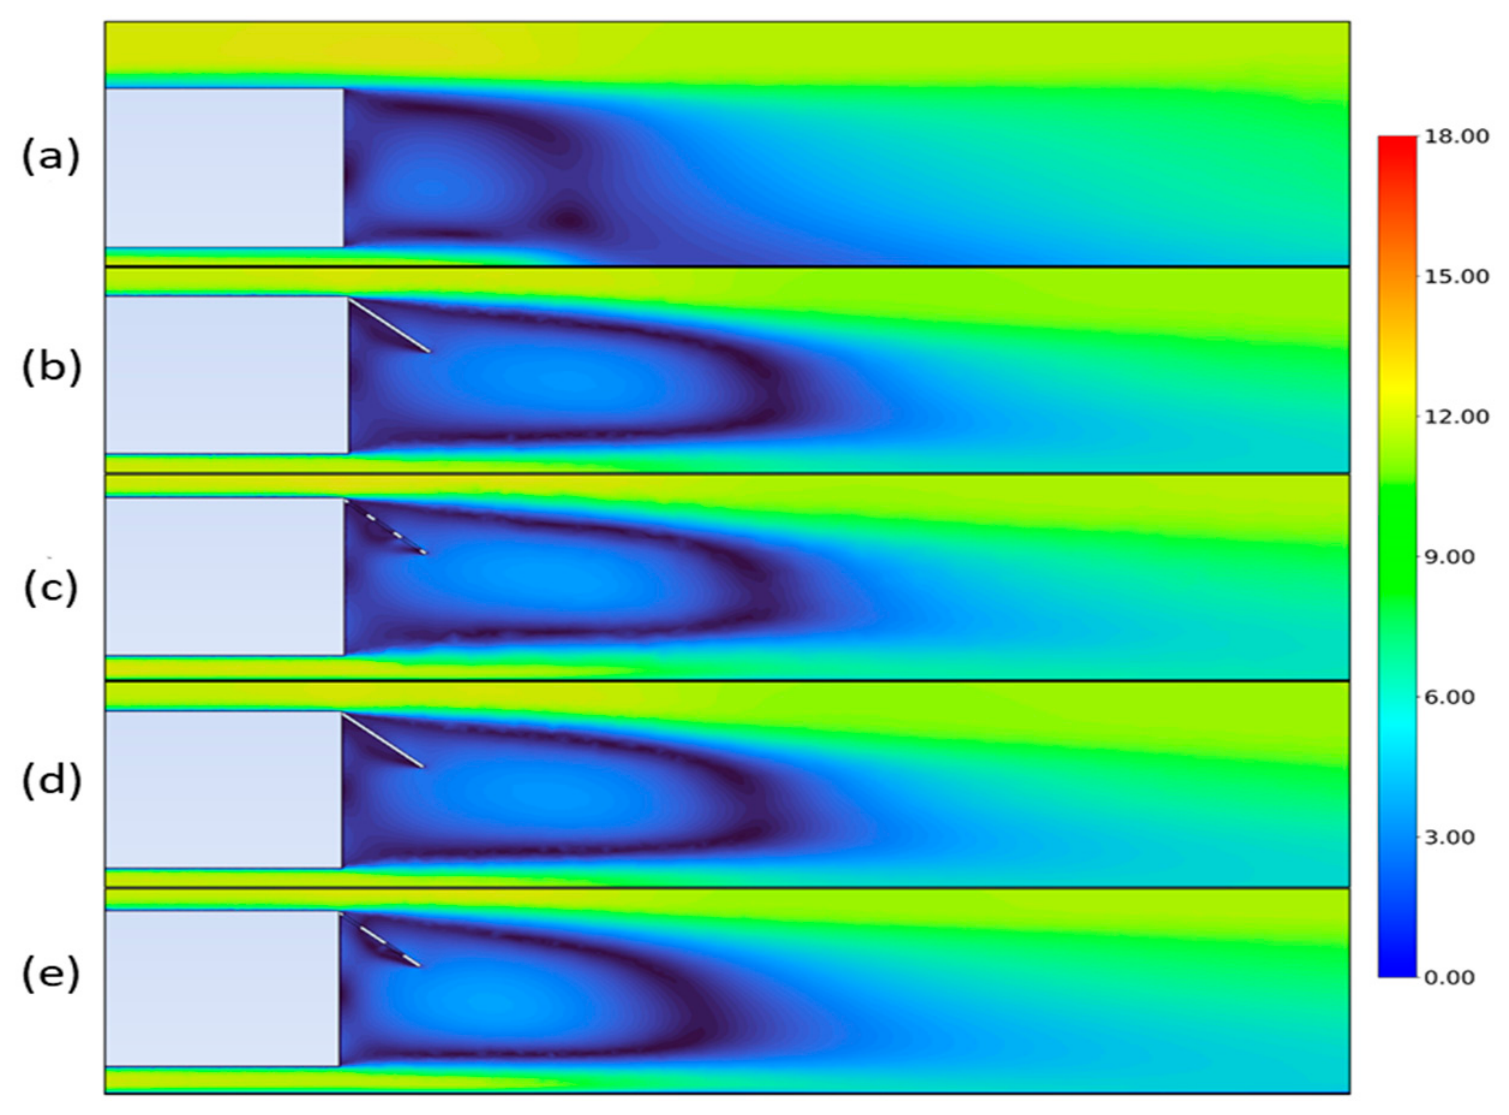
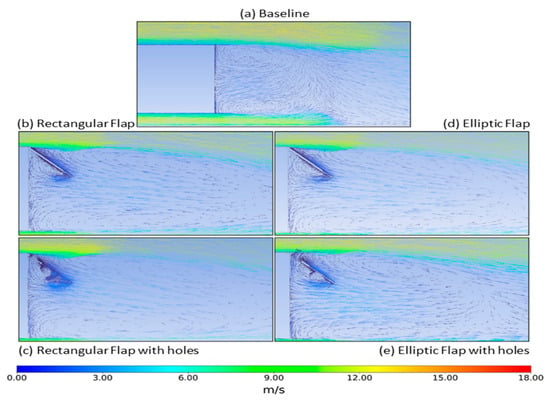
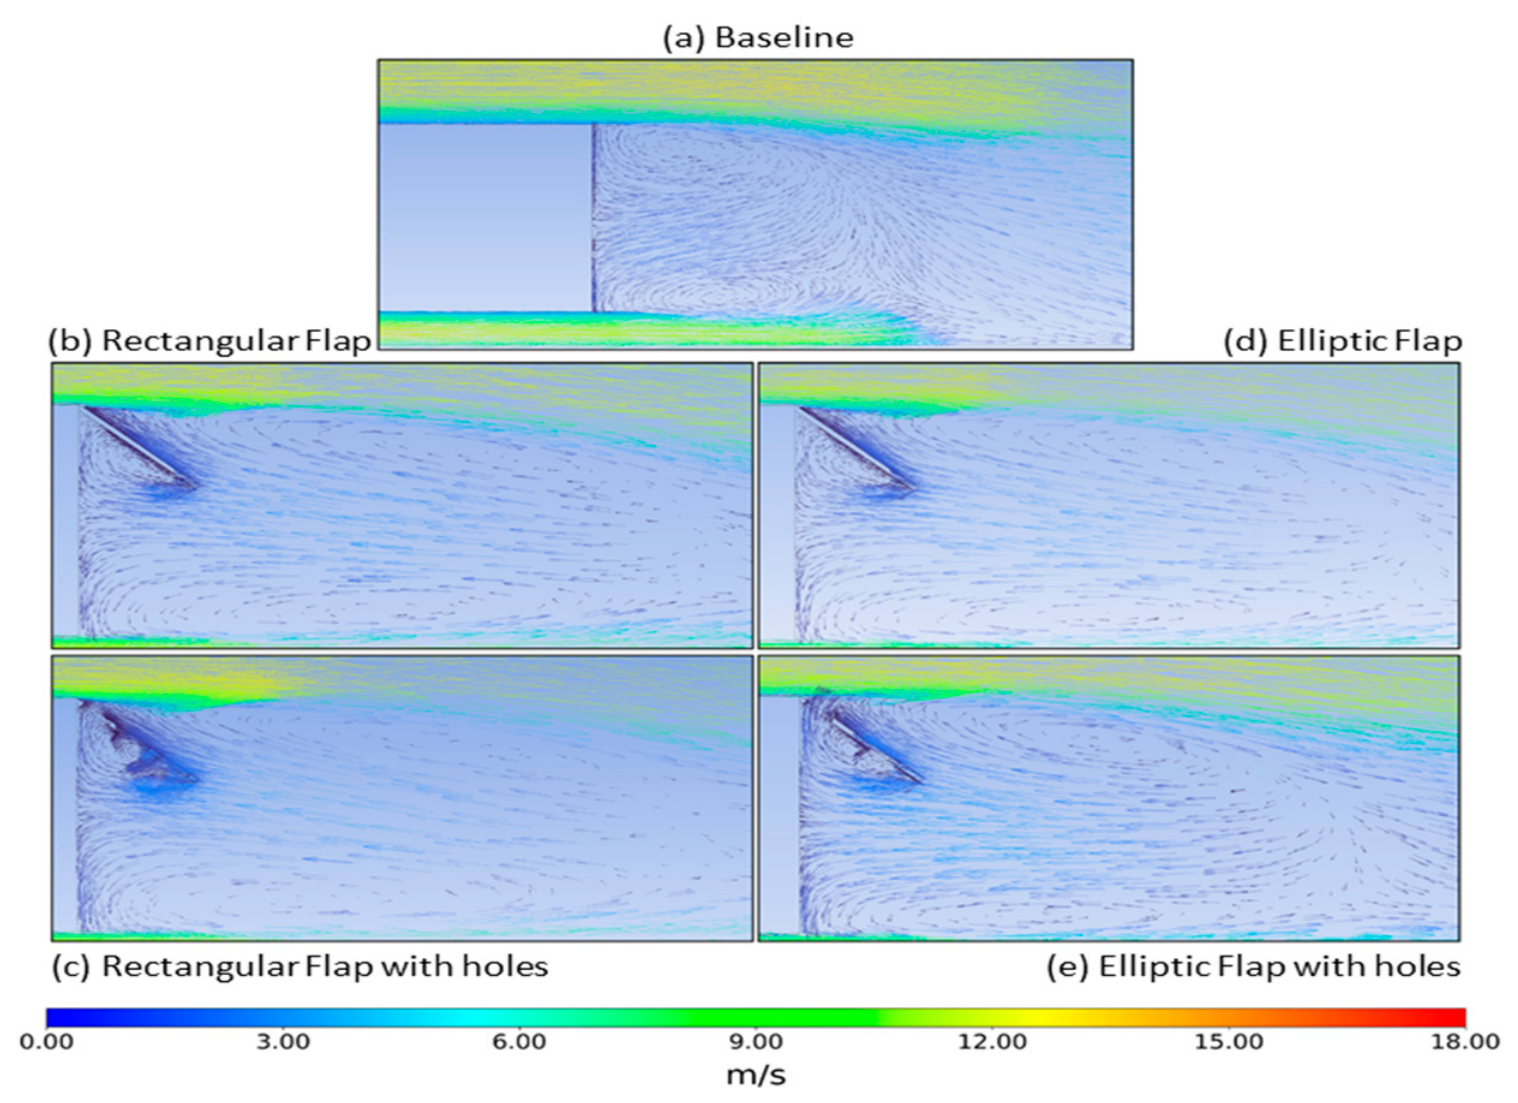
The effect of the flaps was such that the primary recirculation vortices directly after the Ahmed body base, leading the drag formation, were broken up and pushed further back. This extended the wake region and reduced the drag formation at the base due to the high-velocity, low-pressure, circulating flow. The flow behavior in the wake is illustrated by the velocity contours and velocity vectors in Figure 9 and Figure 10, respectively. Among all passive control configurations, the elliptic flap with holes showed the best drag reduction performance. The elliptic profile minimizes the bluntness of the wing edges. It smooths the pressure distribution around the geometry; the holes allow for controlled mass transfer between the high-pressure and low-pressure sides of the wing. This combination effectively weakens the return zone in the wake region and suppresses large-scale vortex structures that are responsible for pressure resistance. Finally, the holes and the flap attached to the back of the model reduce the energy of the flow which leads to further reduction in drag coefficient values as a main contributor.
Figure 9.
Velocity contours for all flap configurations where baseline (a), rectangular flap (b), rectangular flap with holes (c), elliptic flap (d) and elliptic flap with holes (e) are shown.
Figure 10.
Velocity vectors for all flap configurations.
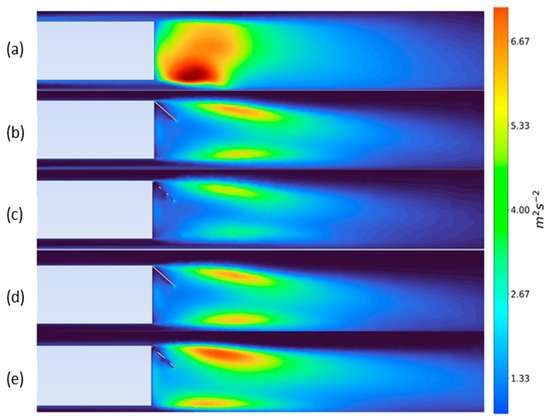
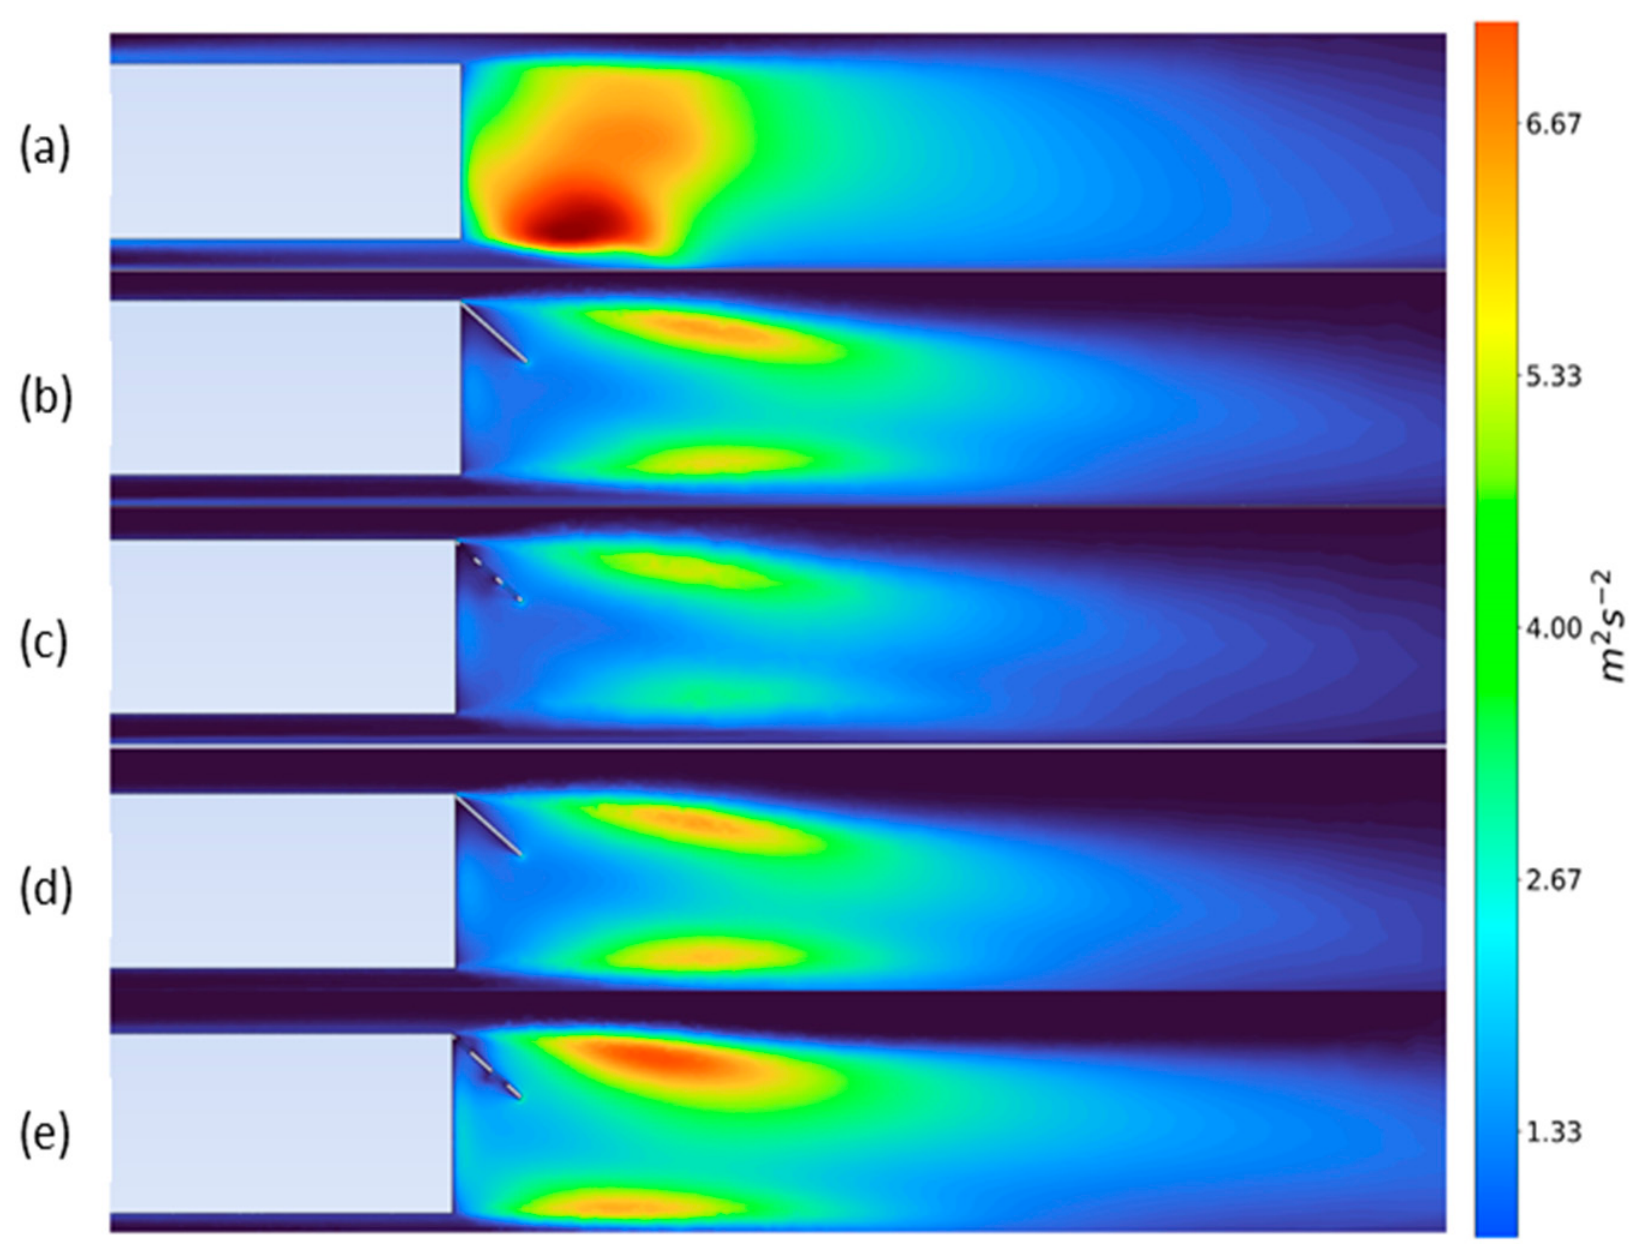
Figure 9b,d illustrates the disruption of the recirculating layer due to the flaps. Furthermore, in Figure 10c,e, the direction of the velocity vectors demonstrate that the first row of holes is the primary contributor to the re-energizing of the trailing edge separating flow. Figure 11e and Figure 12 shows a distinct visual, where the wake of the Ahmed body is slightly reduced once again with the addition of holes to the elliptic flap—an observation not consistent with the rectangular flap with the same configuration. This resultant mechanism could be influential in the increased drag reduction of the elliptic flap with holes, compared to the rectangular flap with holes. This effect can be further explored in Figure 11a–e and Figure 12 which illustrate the turbulent kinetic energy (TKE) in the wake.
Figure 11.
Turbulent kinetic energy in the wake for all configurations where baseline (a), rectangular flap (b), rectangular flap with holes (c), elliptic flap (d) and elliptic flap with holes (e) are shown.
Figure 12.
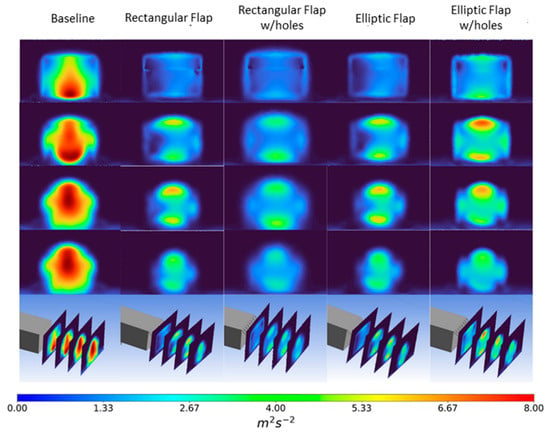
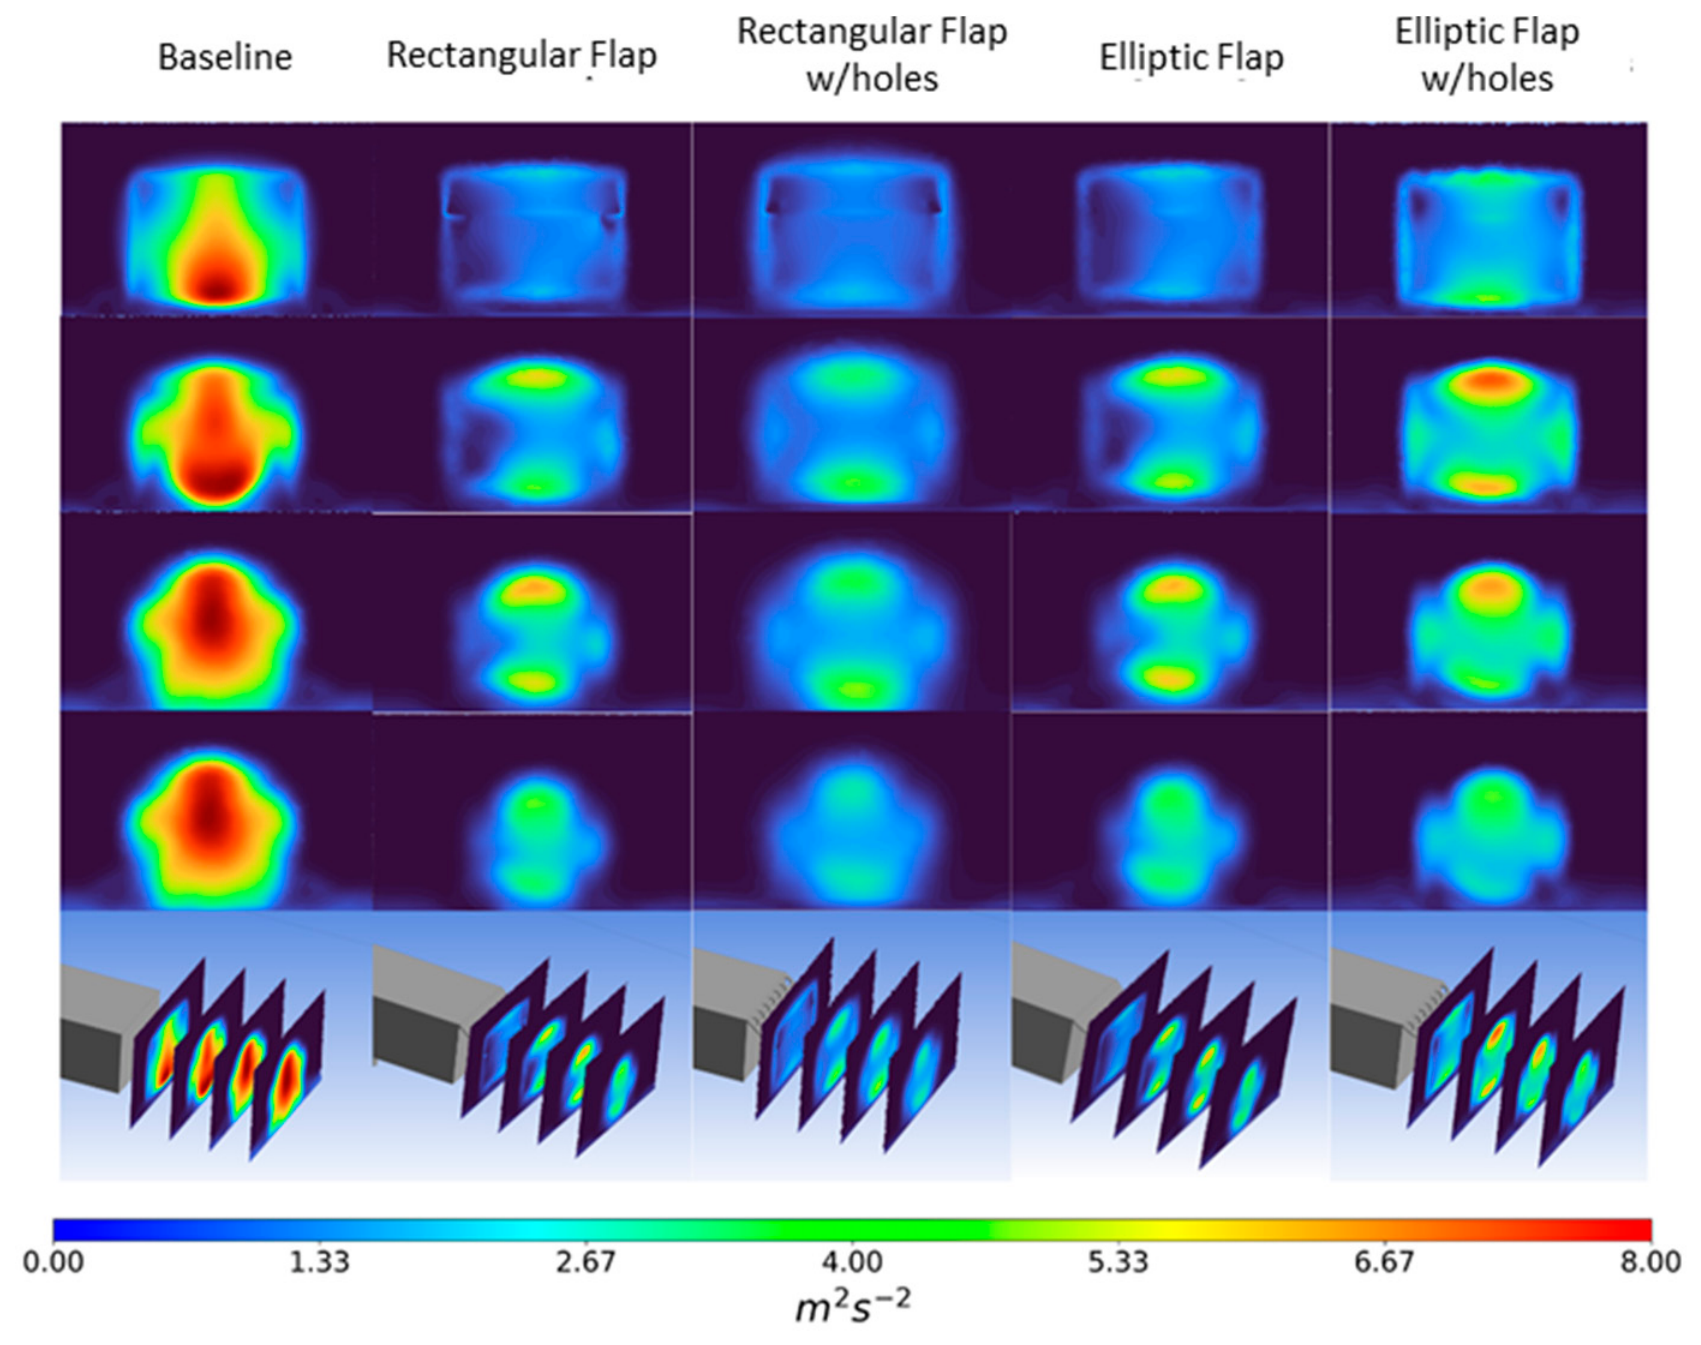
Turbulent kinetic energy in the wake for all configurations at the back of the model.
For all five cases displayed in Figure 11 and Figure 12, the mean turbulence in the wake steadily decreases with the addition of flaps. The baseline case in Figure 12 has the highest mean turbulence, which is located directly behind the base, driving the sucking vortices. This turbulence is broken up and pushed further downstream in the wake, where it is no longer primarily fed by the separating flow, but also by the shear layer interaction, which imparts rotational energy onto the vortex.
While TKE is not a direct measure of vorticity, it provides the mean turbulence in a region; the vectors shown in Figure 10 confirm the smaller shear flow, hence weaker circulation. For the elliptic flap with holes in Figure 11e, TKE is observed to rise abruptly in the downstream region when compared to the other cases.
However, as this flap configuration provided the highest drag reduction of 9.38%, the increased turbulence in the wake affects the base-pressure-driven drag distinctly compared to a scenario where it is located directly behind the base. The enhanced turbulent momentum transport accelerates entrainment into the displaced recirculation bubble, promoting earlier wake closure and greater base-pressure recovery compared to the rectangular configuration, despite the higher shear layer TKE.
Additionally, the turbulence bubble length is measurably shorter for the elliptic flap case, providing further justification for the enhanced entrainment effect driven by shear layer TKE. This bubble can also be noted in the accompanying columns for each case in the grid plot right below the midplane contours, where TKE is plotted on four planes in the wake, each at a distance of 0.1 m from the other, with the first being directly behind the flap trailing edge. A comparison of the coefficient of drag values and the percentage reduction for all passive flow-control configurations is shown in Table 6.
Table 6.
Coefficient of drag and percentage reduction compared to the in-house experimental baseline values for passive flow configurations.
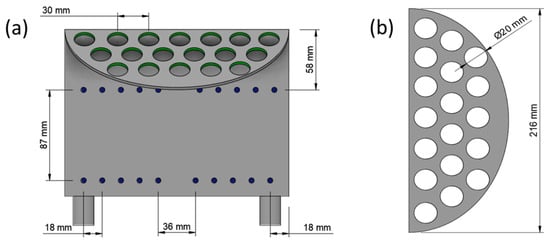
The results indicate that out of all cases with 50° flap mounting angles, the best-performing configuration was the elliptic flap with holes, achieving around 9.38% drag reduction compared to the experimental baseline obtained by in-house experiments, in agreement with the results reported by Altaf et al. [7]. Based on this, the synthetic jet actuation was combined with the elliptic flap with holes, and the schematic of the final configuration and the schematic of the elliptic flap are shown in Figure 13a and Figure 13b, respectively.
Figure 13.
Schematic of the hybrid control method utilizing the elliptic flap with holes (colored in green) and synthetic jet actuation (colored in blue) (a). Schematic of the elliptic flap with holes (b).
As shown in Figure 13a, a total of 20 synthetic jet actuators (SJAs) with a diameter of 5 mm are integrated into the flap surface to introduce active flow control. The SJA are located 18 mm from the side walls of the body, and the horizontal gap between each bank is 36 mm. The SJA was configured to activate based on a sinusoidal function (VJsin(2πft)) for a duration of 5 s to observe the vortex shedding stability. The effect of synthetic jet actuation was measured by sweeping the velocity ratio and forcing frequency which was set as F+ = 1, with two additional frequency cases studied, superharmonic and subharmonic. The velocity ratio was swept for half, equal to, and double the freestream velocity of 10 m/s. The results from this sweep are provided in Table 7 where CD and Cpb are compared against the baseline values. Cpb for the baseline model was 0.1832.
Table 7.
Results of the hybrid control method combining the elliptic flap with holes and SJA.
The results show a linear relationship between velocity ratio (VR) and drag reduction. VR = 0.5, corresponding to momentum coefficient (Cμ) = 2.841 × 10⁻³, produces the highest drag reduction across all forcing frequencies, achieving a maximum of 12.34% at F+ = 1.0. For VR = 1.0 at Cμ = 1.136 × 10⁻², intermediate reductions of between 10.92 and 10.95% are achieved. VR = 1.5 at Cμ = 2.557 × 10⁻² (the highest momentum input) corresponds to the lowest drag reductions between 4.50 and 8.04%. For higher amounts of momentum injection equal to or greater than the freestream, superharmonic forcing was found to yield a higher drag reduction. The combination of low Cμ and lock-on forcing ensured wake of comparatively moderate momentum injection, which matched up better with the natural shedding frequency, assisting in stabilizing the wake far from the body.
Furthermore, at VR = 0.5, the jet velocity is adequately matched to the local shear layer velocity to energize the shear layer without disrupting its organized rollup. At VR = 1.5, the jet momentum significantly exceeds the shear layer velocity scale, injecting excess momentum which disrupts the coherent vortical structures. This result is consistent with the effects of over-blowing reported by Kourta et al. [28] which illustrated that for an Ahmed body with synthetic jet actuation at the rear window, the drag reduction saturates and stabilizes beyond a critical Cμ value.
Additionally, Roumeas et al. [30] have also reported that excessive momentum injection near the edges of the flat-back can elongate the recirculation, rather than suppressing it. The sensitivity of drag reduction with respect to forcing frequency is weak but still evident in VR ≤ 1.0. However, at VR = 1.5, F+ sensitivity is most pronounced. F+ = 0.5 and F+ = 1.0 generate a drag reduction of 6.80% and 4.50%, respectively, which are consequently the least effective cases within the dataset. These values correspond to the values where the forcing and natural shedding frequencies are matched. Paired with the high momentum injection input at VR = 1.5, the resonant forcing is suspected to be amplifying the natural wake instability rather than suppressing it. The recovery at F+ = 1.5 suggests that superharmonic forcing at high VR partially mitigates this destabilizing coupling.
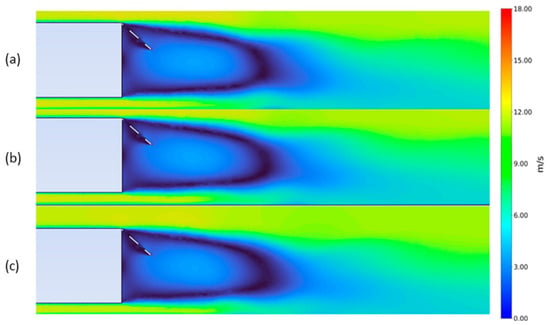
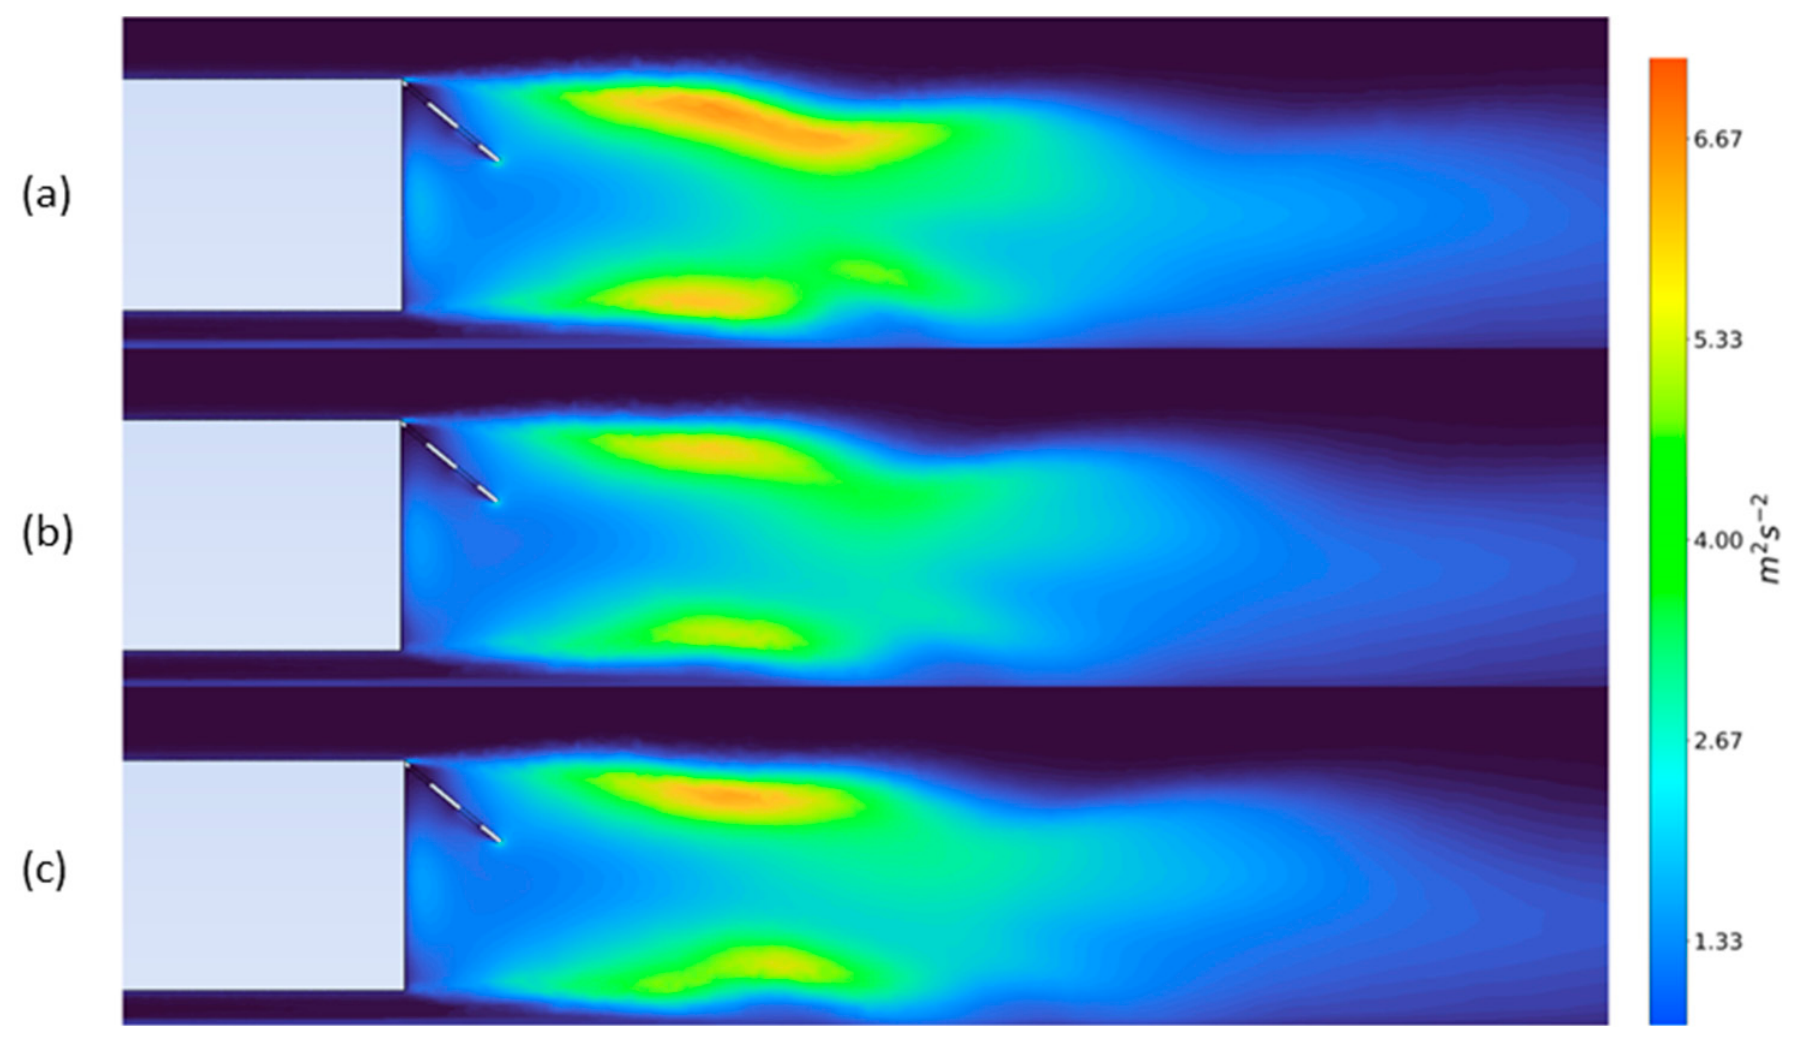
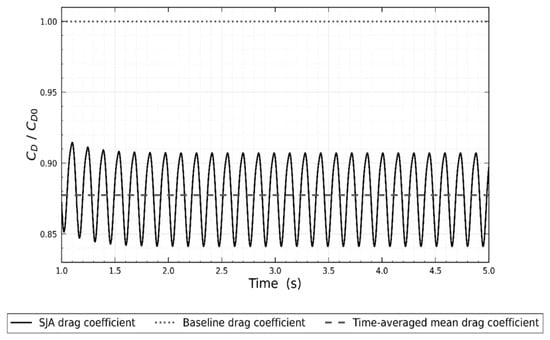
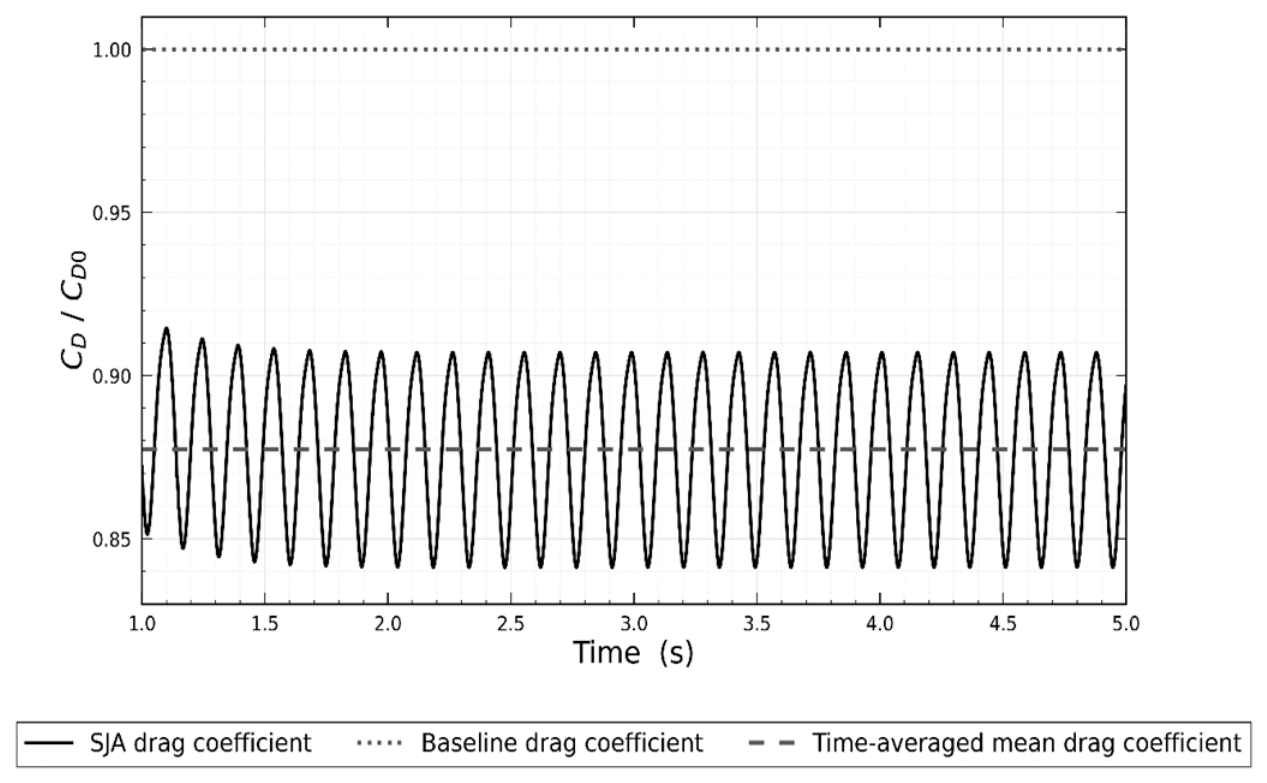
The velocity and the TKE contours for the case which achieved the highest drag reduction at three time steps are shown in Figure 14 and Figure 15 respectively. The change in normalized drag throughout the activation period of the SJA for the best case and a comparison against the baseline can be seen in Figure 16.
Figure 14.
Velocity contours for Case 2 at time steps 3.4 s (a), 3.8 s (b) and 4.2 s (c).
Figure 15.
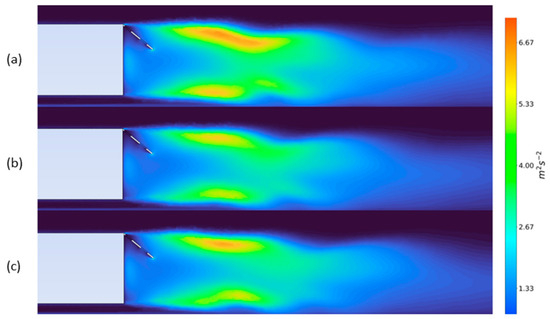
TKE contours for Case 2 at time steps 3.4 s (a), 3.8 s (b) and 4.2 s (c).
Figure 16.
Normalized drag against activation time for the best hybrid flow control and baseline.
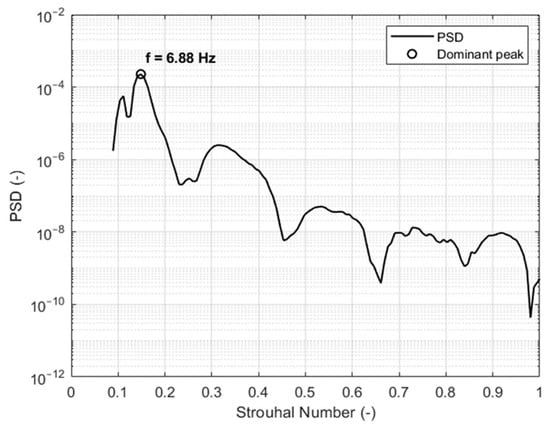
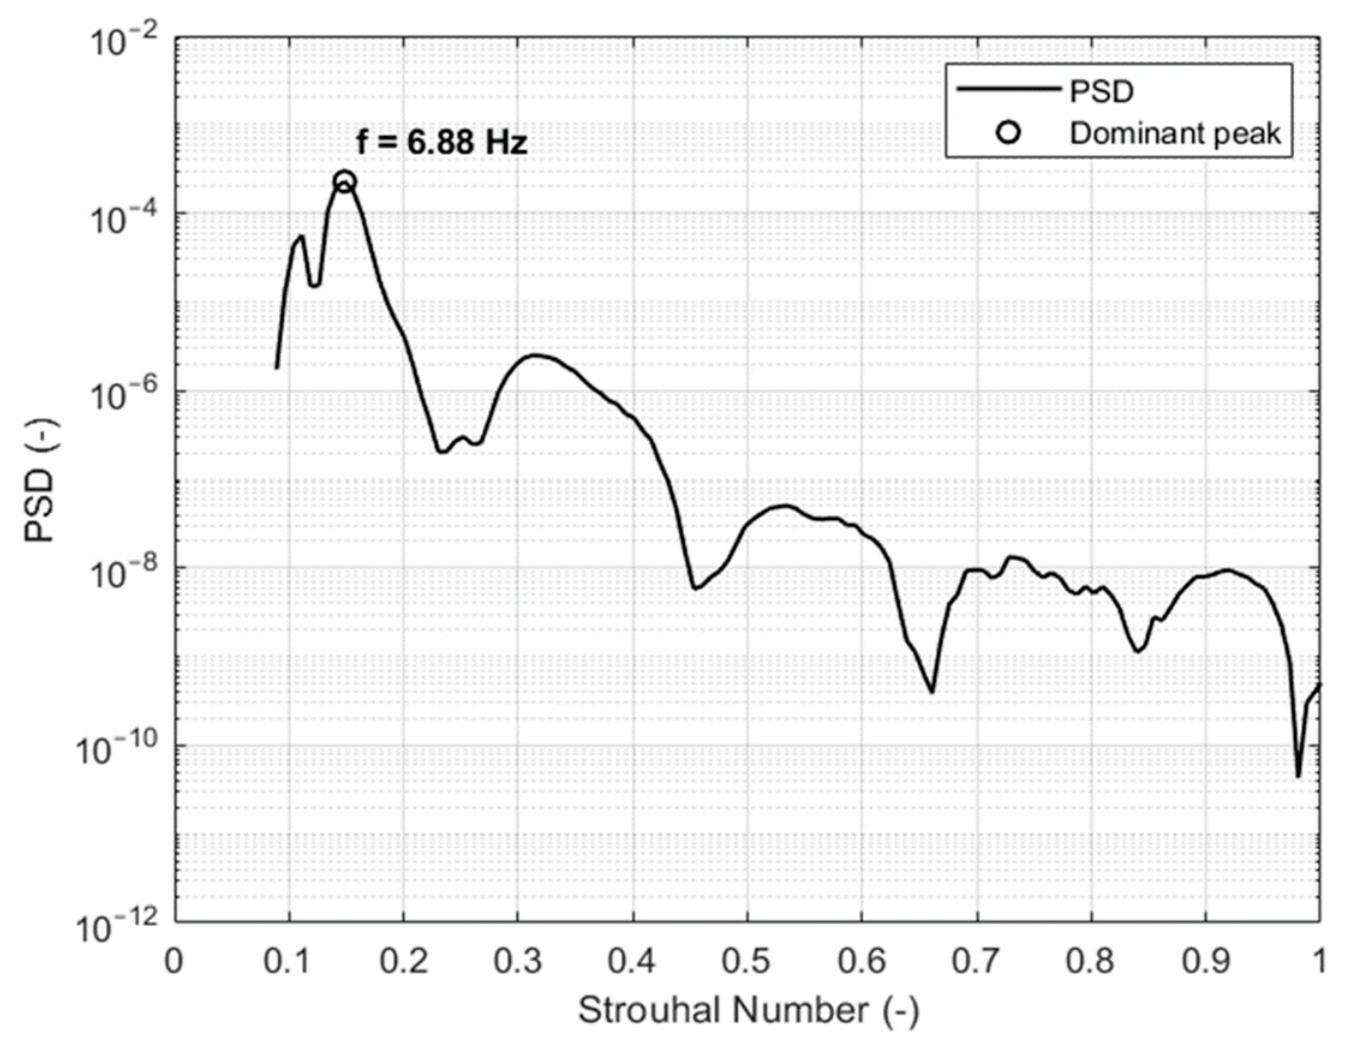
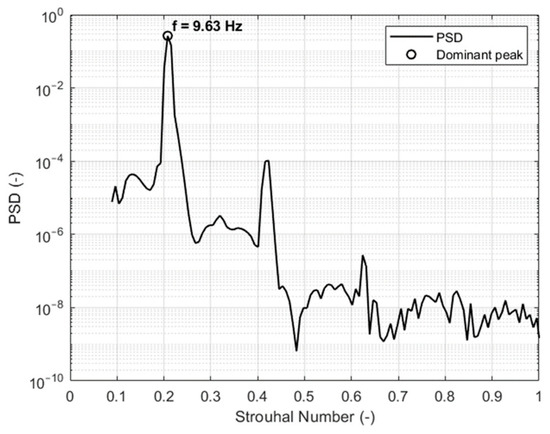
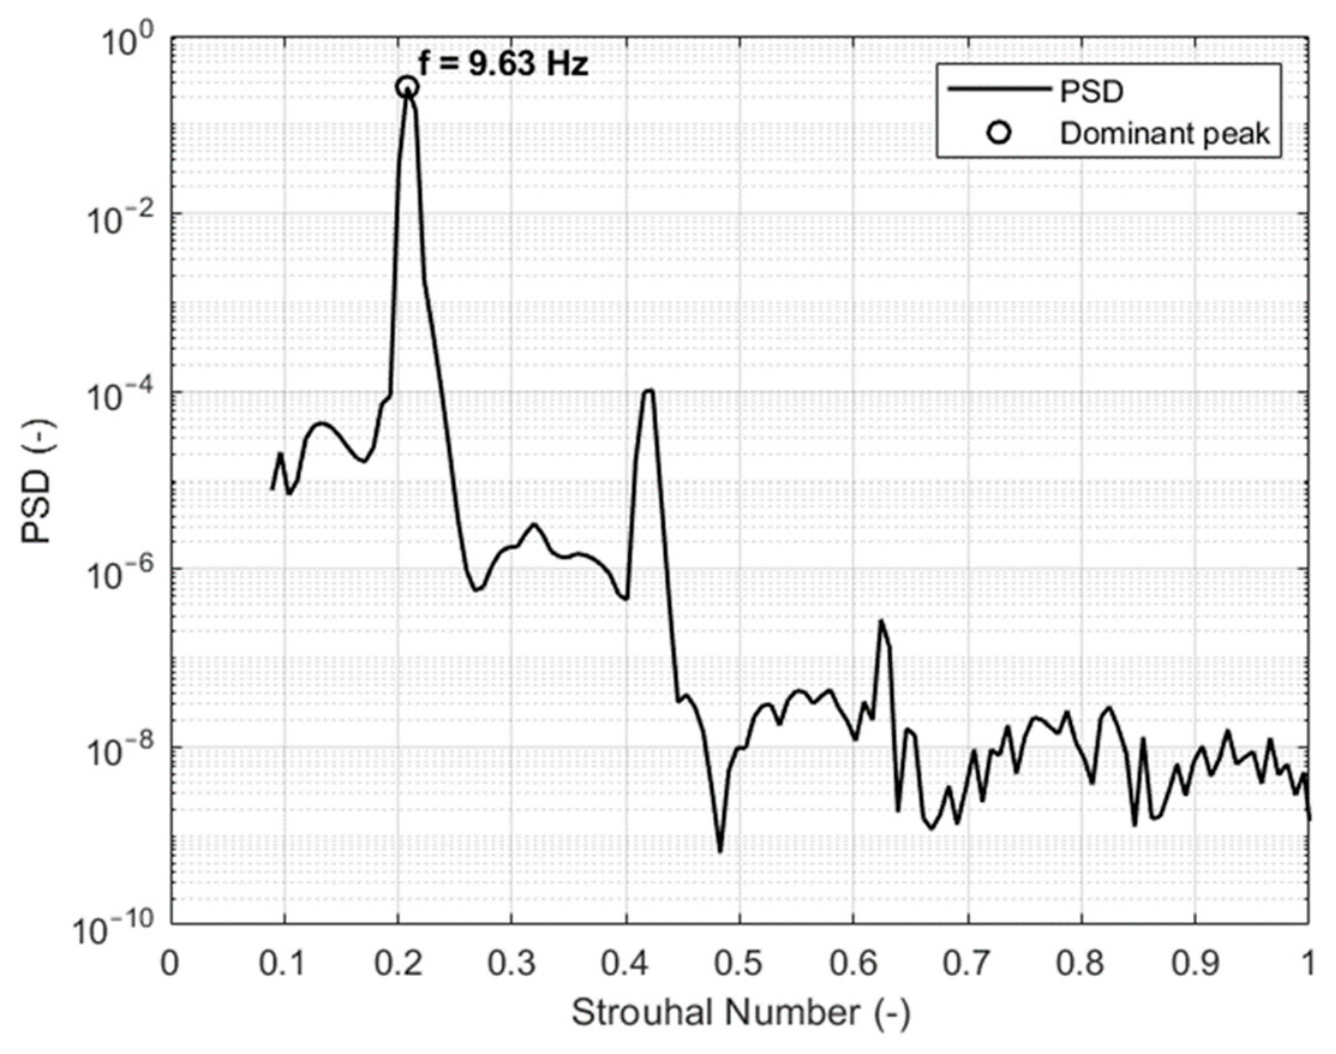
In addition to investigating CD and Cpb, the power spectral density (PSD) analysis for the elliptical flap and best-performing hybrid flow control case were also conducted. The PSD natural shedding frequency for the baseline was determined to be 14.19 Hz. For the elliptic flap case, results demonstrated a natural shedding frequency of 6.88 Hz whereas the natural shedding frequency for the best-performing hybrid case (F+ = 1 and VR = 0.5) was 9.63 Hz. The results of the PSD study for the elliptic flap case and the best-performing hybrid case are shown in Figure 17 and Figure 18, respectively. A summary of the results illustrating the reduction in CD based on flow control methodology is shown in Table 8.
Figure 17.
PSD results for SJA using the elliptic flap with holes.
Figure 18.
PSD results for hybrid flow control with F+ = 1 and VR = 0.5.
Table 8.
Summary of results for the passive and hybrid control methods compared to the experimental baseline obtained in-house.
The results obtained specifically for the passive control strategies are in agreement with the results presented by Altaf et al. [7]. As reported, the most effective flap configuration for drag reduction was found to be the elliptic flap with holes. This is in agreement with the results presented by Zhou et al. [10] who have identified flaps with openings/holes to be more effective in generating drag reduction. Additionally, the relationship between the increasing flap mounting angle and the 50° optimal mounting angle identified within this study is also in agreement with the results presented by Mohammadikalakoo et al. [12]. The velocity and TKE contours obtained clearly illustrate that the hybrid flow control is the most effective method in pushing the recirculation layer and wake instability from the back section of the body, in return reducing the pressure, hence the drag coefficient recorded. These findings are in agreement with the results presented by Bruneau et al. [9]. As indicated by the velocity and TKE contours, the recirculation region for the flow behind the Ahmed body is pushed further away, which reduces the wake pressure in return, affecting the drag coefficient. In addition to this, the TKE observed for the elliptic flap with holes and the elliptic flap with SJA indicates that the turbulent recirculation and wake bistability is positively influenced by hybrid flow control measures. Table 9 summarizes the key aerodynamic and wake characteristics of the baseline, passive, and hybrid flow-control configurations. The comparison considers the changes in drag coefficient (CD), base-pressure coefficient (Cpb), and dominant wake frequency to elucidate the evolution of the proposed two-stage flow-control strategy.
Table 9.
Comparison of aerodynamic performance and wake characteristics for the baseline, passive, and hybrid flow-control configurations.
The baseline configuration exhibits a drag coefficient of 0.3680 and a base-pressure coefficient of 0.1832, with a dominant wake frequency of 14.19 Hz. Introducing the elliptic flap as the first stage of flow control reduces CD to 0.3335, corresponding to a 9.38% reduction relative to the baseline. This reduction is accompanied by a 26.58% decrease in the magnitude of Cpb, indicating a reduction in the base-pressure deficit and improved pressure recovery at the rear of the body. The dominant wake frequency is also reduced substantially from 14.19 Hz to 6.88 Hz, demonstrating that the passive flap considerably modifies the natural wake dynamics.
The addition of synthetic jet actuation provides the second stage of the flow-control mechanism. For the hybrid configuration at VR = 0.5 and F+ = 1, CD is further reduced to 0.3226, corresponding to a total drag reduction of 12.34% relative to the baseline and an additional reduction of approximately 3.27% compared with the elliptic-flap configuration. The magnitude of Cpb is reduced by 34.17% relative to the baseline, indicating further improvement in base-pressure recovery. Interestingly, the dominant frequency increases from 6.88 Hz for the passive configuration to 9.63 Hz under hybrid control, while remaining below the baseline value of 14.19 Hz. This indicates that the additional drag reduction achieved by the synthetic jet is not associated simply with further suppression of the dominant wake frequency. Instead, the active stage further reorganizes the already modified wake, resulting in enhanced base-pressure recovery and a corresponding reduction in pressure drag.
7. Conclusions
In this study, the drag reduction of hybrid control methods on an Ahmed body were investigated using five configurations which were baseline, rectangular flap, rectangular flap with holes, elliptic flap and elliptic flap with holes. The baseline values were compared to the drag coefficient results obtained from an in-house experimental study conducted using the same Ahmed body geometry as per the CFD studies described in the article. The drag reduction trends from the study conducted were used to verify the trend in aerodynamic performance for passive control configurations. For the best-performing configuration, SJA was incorporated at various momentum coefficient and velocity ratio values to identify the combination which would result in the highest drag reduction compared to the baseline Ahmed body coefficient of drag. The results of the study indicated that the highest drag reduction achieved at 50° flap mounting angle compared to the baseline was 9.38% using the elliptic flap with holes, which is in agreement with the experimental baseline values. This has also contributed in further reinforcing the baseline results and in clarifying the experimental ambiguity based on the lack of geometry information in the study presented previously in literature. When the SJA was incorporated to this configuration using a VR = 0.5, corresponding to the momentum coefficient Cμ = 2.841 × 10⁻³, a total drag reduction of 12.34% was achieved compared to the baseline. The results also indicated that the VR and Cμ were highly influential in the drag reduction, as at certain values, when the forcing frequency aligned with the natural vortex shedding frequency, the drag reduction achieved was less than the values achieved by the passive flow control only. This illustrates that the hybrid control methodology is an effective control mechanism to enhance drag reduction by influencing the flow dynamics of the wake and recirculation region of the flow departing from the rear of the Ahmed body.
For future investigation, additional SJA configurations and other frequencies and actuation types must be tested to enhance the drag reduction and improve aerodynamic performance. To further reinforce the results obtained, tests at different Reynolds number values and external conditions such as cornering or accelerating/decelerating must also be studied to determine the effectiveness of this control methodology throughout the full range of motion for road vehicles. In addition to this, novel geometries of flaps and different shapes of holes can be utilized to investigate the specific aerodynamic effect generated. In addition to this, addition of flaps to the side of the body and potentially incorporating a diffuser to the bottom of the Ahmed body could further enhance the drag reduction effect generated by the hybrid control methodology.
Author Contributions
Conceptualization and methodology, B.G. and O.T.; methodology, B.G. and O.T.; validation, Y.I.M.S.; formal analysis, Y.I.M.S.; data curation, Y.I.M.S.; writing—original draft preparation, O.T. and Y.I.M.S.; writing—review and editing, B.G. and O.T.; visualization, Y.I.M.S.; supervision, B.G. and O.T. All authors have read and agreed to the published version of the manuscript.
Funding
This research and APC were funded by Middle East Technical University, Northern Cyprus Campus (Scientific Research Project (BAP) Funding 25-D-15).
Institutional Review Board Statement
Not applicable.
Informed Consent Statement
Not applicable.
Data Availability Statement
Data available on request due to restrictions (e.g., privacy, legal or ethical reasons).
Acknowledgments
The authors would like to thank Mohammad Mansoor Khan for their help in data curation, writing and visualization aspects of this manuscript.
Conflicts of Interest
The authors declare no conflicts of interest.
Abbreviations
The following abbreviations are used in this manuscript:
| SJA | Synthetic jet actuation |
| GHG | Greenhouse gasses |
| HDV | Heavy-duty vehicles |
| EU | European Union |
| SUV | Sports utility vehicle |
| PANS | Partially averaged Navier–Stokes |
| LES | Large eddy simulations |
| TEM | Top-edge-mounted |
| EWT | Enhanced wall treatment |
| RANS | Reynolds-averaged Navier–Stokes |
| ESP | Electronically scanned pressure |
| DTC | Digital temperature compensation |
| TKE | Turbulent kinetic energy |
References
- Council of the European Union. Heavy-Duty Vehicles: Council and Parliament Reach a Deal to Lower CO2 Emissions from Trucks, Buses and Trailers; European Union: Brussels, Belgium, 2024. [Google Scholar]
- European Union. Regulation (EU) 2019/1242, OJ L 198; European Union: Brussels, Belgium, 2019. [Google Scholar]
- APC UK. Mobility of Goods; Advanced Propulsion Centre UK; Automotive Council UK: Coventry, UK, 2024. [Google Scholar]
- European Union. Council Directive 96/53/EC, OJ L 235; European Union: Brussels, Belgium, 1996. [Google Scholar]
- European Union. Driective (EU) 2015/719 of the European Parliament and of the Council; European Union: Brussels, Belgium, 2015. [Google Scholar]
- Ahmed, S.R.; Ramm, G.; Faltin, G. Some Salient Features of the Time -Averaged Ground Vehicle Wake. SAE Trans. 1984, 93, 473–503. [Google Scholar]
- Altaf, A.; Omar, A.A.; Asrar, W. Passive drag reduction of square back road vehicles. J. Wind Eng. Ind. Aerodyn. 2014, 134, 30–43. [Google Scholar] [CrossRef] [Scilit]
- Bruneau, C.-H.; Mortavazi, I.; Gilliéron, P. Passive Control Around the Two-Dimensional Square Back Ahmed Body Using Porous Devices. J. Fluids Eng. 2008, 130, 061101. [Google Scholar] [CrossRef] [Scilit]
- Bruneau, C.-H.; Creusé, E.; Depeyras, D.; Gilliéron, P.; Mortazavi, I. Coupling active and passive techniques to control the flow past the square back Ahmed body. Comput. Fluids 2010, 39, 1875–1892. [Google Scholar] [CrossRef] [Scilit]
- Zhou, H.; Zhang, W.; Huang, T.; Li, H. Numerical Analysis of the Aerodynamic Performance of an Ahmed Body Fitted with Spoilers of Different Opening Areas. Fluid Dyn. Mater. Process. 2025, 21, 1113–1131. [Google Scholar] [CrossRef] [Scilit]
- Darabasz, T.; Bonnavion, G.; Cadot, O.; Goraguer, Y.; Borée, J. Drag reduction using longitudinal vortices on a flat-back Ahmedbody. Exp. Fluids 2023, 64, 20. [Google Scholar] [CrossRef] [Scilit]
- Mohammadikalakoo, B.; Schito, P.; Mani, M. Passive flow control on Ahmed body by rear linking tunnels. J. Wind Eng. Ind. Aerodyn. 2020, 205, 104330. [Google Scholar] [CrossRef] [Scilit]
- Thacker, A.; Aubrun, S.; Leroy, A.; Devinant, P. Effects of suppressing the 3D separationon the rear slant on the flow structures around an Ahmed body. J. Wind Eng. Ind. Aerodyn. 2012, 107–108, 237–243. [Google Scholar] [CrossRef] [Scilit]
- Selvaraju, P.N.; Kumar, D.S. Effect of external devices on aerodynamic performance of SUV car model. In Proceedings of theInternational Conference on Advanced Materials on Modern Manufacturing, Chandigarh, India, 1–3 November 2022. [Google Scholar]
- Tran, T.H.; Hijikuro, M.; Anyoji, M.; Uchida, T.; Nakashima, T.; Shimizu, K. Surface flow and aerodynamic drag of Ahmed body with deflectors. Exp. Therm. Fluid Sci. 2023, 145, 110887. [Google Scholar] [CrossRef] [Scilit]
- Govardhan, D.; Rao, M.V.N.; Rao, P.S.; Kumar, I.; Lakshmi, M.V. Adjoint shape optimization of Ahmed body to improve aerodynamics. Mater. Today Proc. 2023. [Google Scholar] [CrossRef] [Scilit]
- Han, X.; Krajnović, S.; Basara, B. Study of active flow control for a simplified vehicle model using the PANS method. Int. J. Heat Fluid Flow 2013, 42, 139–150. [Google Scholar] [CrossRef] [Scilit]
- Pastoor, M.; Henning, L.; Noack, B.R.; King, R.; Tadmor, G. Feedback shear layer control for bluff body drag reduction. J. Fluid Mech. 2008, 608, 161–196. [Google Scholar] [CrossRef] [Scilit]
- Wang, H.; Zhou, Y.; Zou, C.; He, X. Aerodynamic drag reduction of an Ahmed body based on deflec-tors. J. Wind Eng. Ind. Aerodyn. 2016, 148, 34–44. [Google Scholar] [CrossRef] [Scilit]
- McNally, J.; Fernandez, E.; Robertson, G.; Kumar, R.; Taira, K.; Alvi, F.; Yamaguchi, Y.; Murayama, K. Drag reduction on a flat-back ground vehicle with active flow control. J. Wind Eng. Ind. Aerodyn. 2015, 145, 292–303. [Google Scholar] [CrossRef] [Scilit]
- Cui, W.; Zhu, H.; Xia, C.; Yang, Z. Comparison of Steady Blowing and Synthetic Jets for Aerodynamic Drag Reduction of a Simplified Vehicl. Procedia Eng. 2015, 126, 388–392. [Google Scholar] [CrossRef] [Scilit]
- Wang, B.X.; Yang, Z.G.; Zhu, H. Active flow control on the 25°Ahmed body using a new unsteady jet. Int. J. Heat Fluid Flow 2019, 79, 108459. [Google Scholar] [CrossRef] [Scilit]
- Herberg, M.R.; De Pinto, S.; Donato, M.T.; Pascazio, G. Active Flow Control Techniques: Classification, Analysis, and Future Trends for Automotive Applications. Fluids 2026, 11, 106. [Google Scholar] [CrossRef] [Scilit]
- Chipongo, K.; Khiadani, M.; Lari, K.S. Comparison and verification of turbulence Reynolds-averaged Na-vier–Stokes closures to model spatially varied flows. Sci. Rep. 2020, 10, 19059. [Google Scholar] [CrossRef] [Scilit] [PubMed]
- Shih, T.-H.; Liou, W.W.; Shabbir, A.; Yang, Z.; Zhu, J. A new k-ϵ eddy viscosity model for high reynolds number turbulent flows. Comput. Fluids 1995, 24, 227–238. [Google Scholar] [CrossRef] [Scilit]
- Cai, S.-G.; Mozaffari, S.; Jacob, J.; Sagaut, P. Application of immersed boundary based turbulence wall mod-eling to the Ahmed body aerodynamics. Phys. Fluids 2022, 34, 095106. [Google Scholar] [CrossRef] [Scilit]
- Kadivar, M.; Tormey, D.; McGranaghan, G. A comparison of RANS models used for CFD prediction of turbulent flow and heat transfer in rough and smooth channels. Int. J. Thermofluids 2023, 20, 100399. [Google Scholar] [CrossRef] [Scilit]
- Kourta, A.; Leclerc, C. Characterization of synthetic jet actuation with application to Ahmed body wake. Sens. Actuators A Phys. 2013, 192, 13–26. [Google Scholar] [CrossRef] [Scilit]
- Brackston, R.; Garcia de la Cruz, J.M.; Wynn, A.; Rigas, G.; Morrison, J.F. Stochastic modelling and feedback control of bistability in a turbulent bluff body wake. J. Fluid Mech. 2016, 802, 726–749. [Google Scholar] [CrossRef] [Scilit]
- Rouméas, M.; Gilliéron, P.; Kourta, A. Drag reduction by flow separation control on a car after body. Int. J. Numer. Methods Fluids 2009, 60, 1222–1240. [Google Scholar] [CrossRef] [Scilit]

Disclaimer/Publisher’s Note: The statements, opinions and data contained in all publications are solely those of the individual author(s) and contributor(s) and not of MDPI and/or the editor(s). MDPI and/or the editor(s) disclaim responsibility for any injury to people or property resulting from any ideas, methods, instructions or products referred to in the content. |
© 2026 by the authors. Licensee MDPI, Basel, Switzerland. This article is an open access article distributed under the terms and conditions of the Creative Commons Attribution (CC BY) license.