


Abstract
The strong interaction between impact loading and joints can induce slip instability in jointed rock masses, posing a serious threat to construction safety and long-term stability in rock engineering. To investigate the dynamic slip characteristics of rock-like specimens containing an artificial persistent joint under impact loading, cement mortar rock like specimens with joint dip angles of 50°, 60°, and 70° were prepared. Impact tests were conducted using an SHPB system combined with high-speed imaging and DIC. The results show that the presence of joints significantly deteriorates the dynamic load-bearing capacity of the rock mass and reduces stress-wave transmission. As the joint dip angle increases from 50° to 70°, the shear stress component acting on the joint decreases, while the normal constraint increases. As a result, joint slip is suppressed, and both slip displacement and slip velocity decrease. Joint slip can induce secondary cracks to propagate into the rock matrix, but failure becomes more localized along the joint as the dip angle increases. Increasing impact loading intensity significantly increases the dynamic strength of jointed rock masses, intensifies joint slip, and induces more severe secondary damage. Energy analysis shows that joints change the energy dissipation mechanism. The input energy is mainly dissipated through joint compression deformation, shear slip, and induced secondary damage. The results provide a reference for stability evaluation and dynamic disaster prevention in jointed rock masses under impact disturbance.
1. Introduction
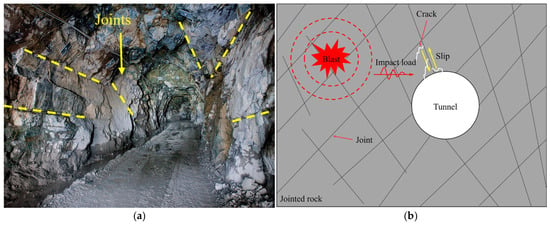
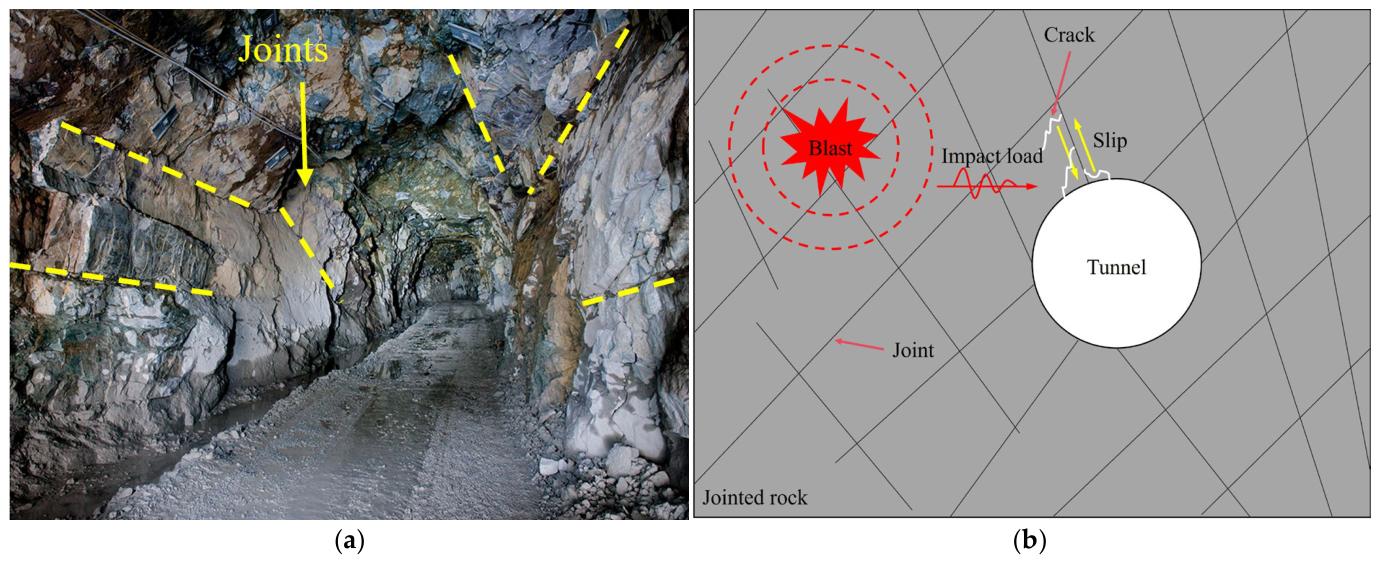
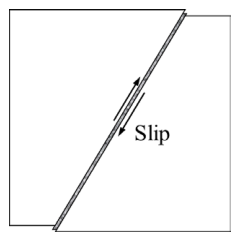
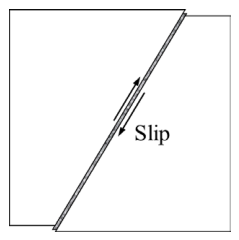
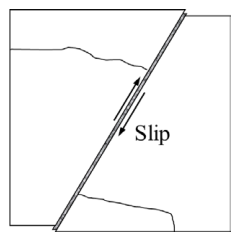
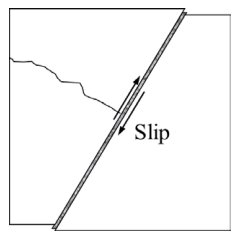
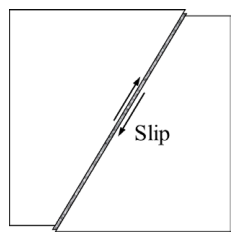
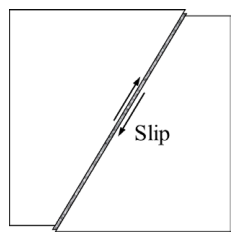
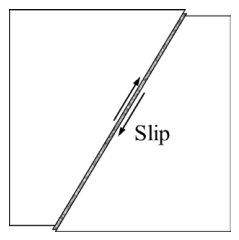
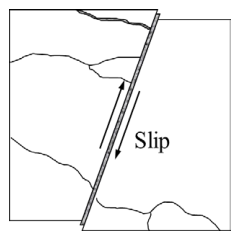
With the continued development of energy and infrastructure, both the scale and number of rock engineering projects, including slopes, hydropower engineering, underground mines, and deep tunnels, have continued to increase [1,2]. Engineering practice has shown that [3,4,5], as a result of long-term tectonic processes, abundant joints are developed in rock masses and play a controlling role in their deformation, strength and failure (Figure 1a). Rock mass engineering may be affected by blasts throughout its entire construction and operation cycle, and the resulting impact loading is an important factor inducing instability of jointed rock masses [6]. Impact loading is characterized by transient loading and high strain rate, and interacts strongly with structural planes such as joints (Figure 1b). On the one hand, when the tangential shear stress component induced by the incident stress at the joint exceeds the interfacial shear strength, shear slip can be triggered along the joint in the jointed rock mass [7]. On the other hand, the transmission and reflection of stress waves can generate pronounced stress concentrations at local contact zones along the joint, driving crack initiation, propagation, and coalescence in the rock matrix and posing a serious threat to construction safety and long-term stability in rock engineering [8]. Therefore, a systematic investigation of the shear slip characteristics of jointed rock masses under impact loading and their progressive failure mechanism is of great significance for dynamic disaster prevention and control in rock engineering.
Figure 1.
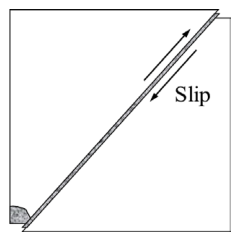
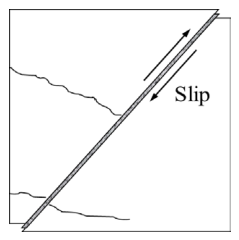
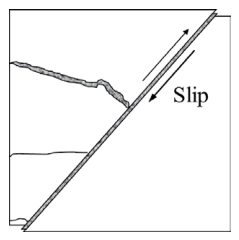
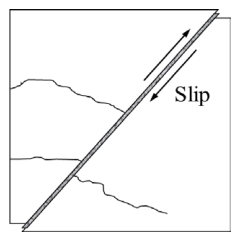
Schematic diagram of dynamic disasters in jointed rock masses under impact loading: (a) jointed surrounding rock of an underground opening; (b) dynamic disaster induced by joint slip.
This key issue has been extensively investigated in previous studies. Based on blasting experiments and discrete element simulations, Heuze et al. [9] showed that joints exert a strong control on stress wave propagation. On the one hand, dominant joints or continuous discontinuities can produce a wave-guide effect, causing stress waves to propagate or concentrate along preferred directions and thereby enhancing the local dynamic response. On the other hand, joints can induce stress wave reflection and energy attenuation, resulting in a decoupling effect. Using SHPB tests, Li et al. [10], Zhou and Gu [11], Cen et al. [12] investigated the dynamic compression-shear behavior of jointed rock masses with different dip angles. They found that the presence of joints significantly degrades the dynamic mechanical properties of rock masses and alters crack initiation, propagation, and final failure modes. Bennouna et al. [13] demonstrated that joint orientation, joint shear strength, and seismic-action direction can markedly influence the stability of fractured rock slopes. These studies indicate that joints significantly affect stress-wave propagation, dynamic strength, and macroscopic failure behavior; however, the relative motion of joints during impact loading and its evolution still require further investigation.
Relative slip along discontinuities under dynamic loading is an important manifestation of instability in jointed rock masses. Previous studies have shown that [14,15], under dynamic disturbances such as seismic loading, excavation unloading, and blasting, joints can exhibit different slip states and evolution stages. Wang et al. [16] investigated the shear mechanical behavior of sandstone under different lateral stress, normal stress, and dynamic disturbance conditions. They proposed that the structural characteristics of the rock mass and dynamic disturbances jointly influence its shear instability. Li et al. [17] conducted dynamic shear tests on jointed rock masses using a BSHPB device and divided the joint slip process into distinct stages. Yu et al. [18] analyzed the effects of impact-induced fault slip on the stress, displacement, and strain energy of tunnels. With the development of high-speed photography and digital image correlation (DIC) techniques, dynamic slip processes can be observed more directly. Xiao et al. [19] quantitatively analyzed the fault slip process under impact loading. Yao et al. [20] and Xie et al. [21] measured the shear displacement of discontinuities under impact-induced direct shear loading. These studies have established a basic understanding of discontinuity slip behavior and its evolution under dynamic loading.
However, existing studies on the dynamic slip of discontinuities have mainly focused on direct shear loading or dynamic responses under specific stress conditions, while the slip behavior of persistent joints with different dip angles under axial impact loading remains insufficiently understood. In particular, variations in joint dip angle not only alter the stress state along the joint plane but also affect stress-wave transmission and reflection at the joint. How these changes further influence slip initiation and the subsequent development of joint slip remains unclear. Therefore, the relationship between stress-wave transmission characteristics and dynamic joint slip under different joint dip angles still requires further investigation.
Accordingly, impact tests were conducted on rock-like specimens containing persistent joints with different dip angles using an SHPB system. High-speed photography and DIC were employed. Intact specimens were also tested for comparison. First, the basic dynamic response characteristics of the specimens and the transmission and reflection of stress waves at the joint interface were analyzed. Subsequently, based on the full-field deformation information obtained by DIC, the effects of joint dip angle on slip initiation and the subsequent evolution of dynamic slip were examined, together with the deformation and dynamic failure characteristics associated with the development of joint slip. On this basis, the energy dissipation characteristics of specimens with different joint dip angles were further discussed in terms of energy evolution. The results provide a reference for understanding slip-induced instability of jointed rock masses under impact disturbance and for the prevention and control of related dynamic hazards in rock engineering.
2. Experimental Section
2.1. Specimen Preparation
2.1.1. Mechanical Properties of Materials
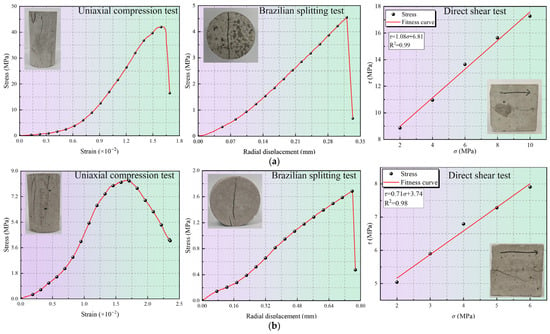
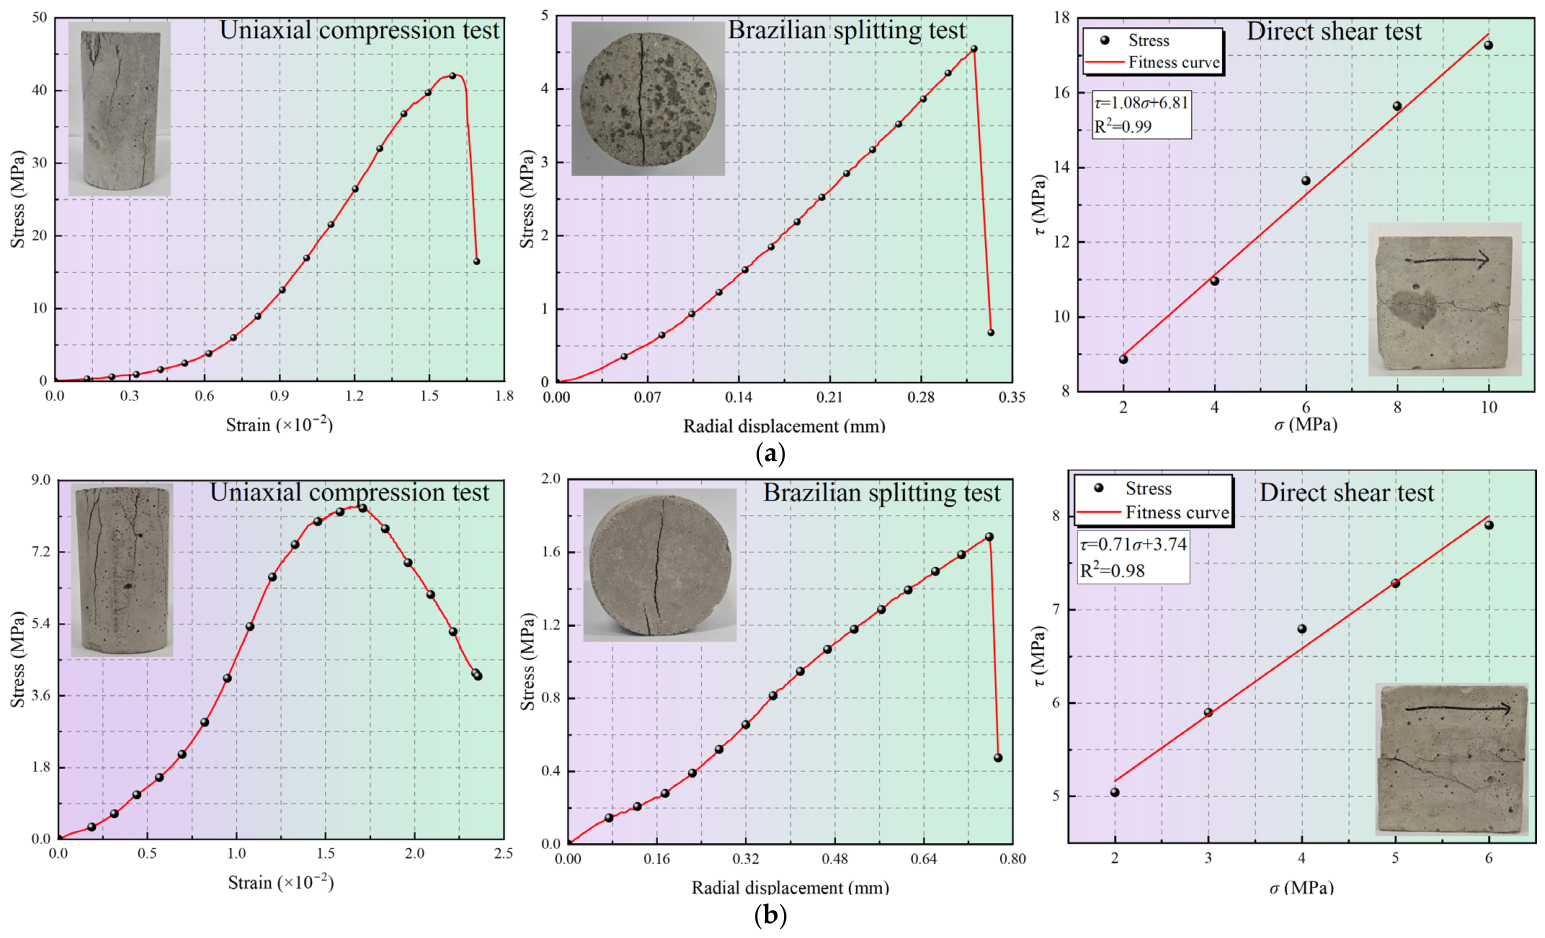
Due to the difficulty in sampling natural jointed rock masses and their significant discreteness, even if natural rock is used to fabricate specimens with different joint configurations, the inherent primary defects inside the samples may interfere with the test results. Therefore, jointed rock mass specimens were artificially fabricated using cement-mortar material in this test [22,23,24]. The rock matrix was prepared using ordinary Portland cement (P.O 42.5R), sand, and water at a mass ratio of 1:2:0.5. Li et al. [25] indicated that the deformation of rock masses and block motion under impact disturbance are usually concentrated on the weak interfaces between rock blocks. Therefore, a low-strength mortar was used to create artificial weak bonding interfaces between the rock blocks. The mortar consisted of composite Portland cement (P.C 32.5R), fly ash, sand, and water at a mass ratio of 1:0.4:4:1.2. Standard specimens were separately prepared for material property testing and cured in a humid environment for at least 28 days. Basic physical and mechanical tests were then conducted to determine the material properties, as shown in Figure 2. The basic physical and mechanical properties of the materials are listed in Table 1.
Figure 2.
Mechanical property test results of the jointed rock mass materials: (a) rock matrix material; (b) joint material.
Table 1.
Mechanical parameters of jointed rock mass materials.
2.1.2. Sample Preparation Method
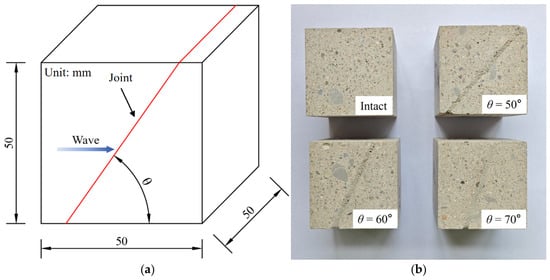
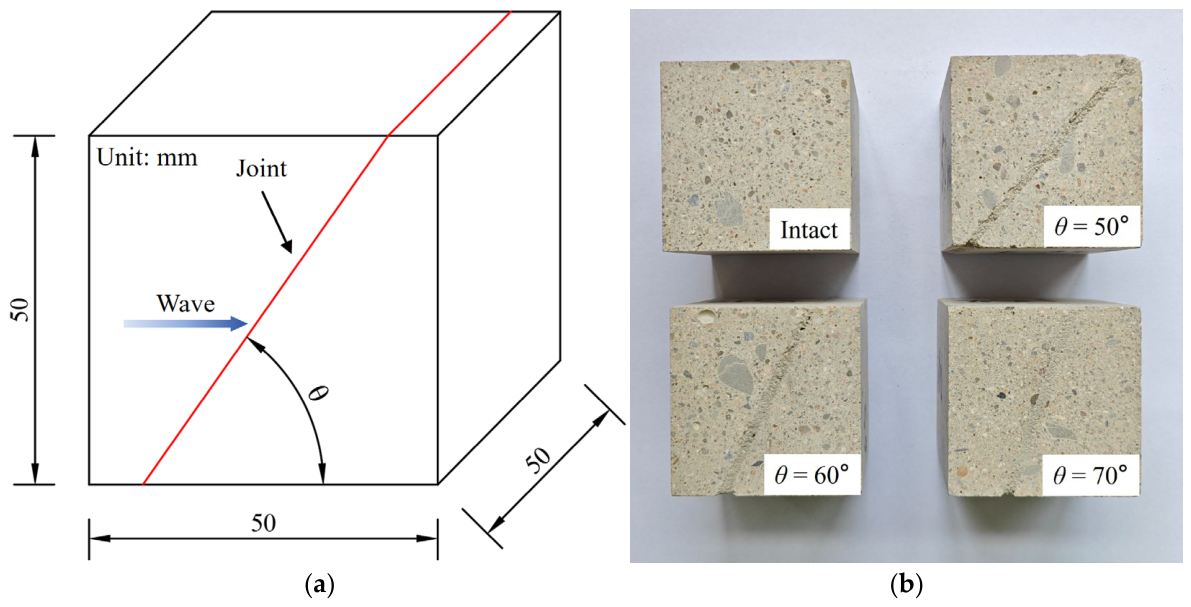
When the propagation direction of the impact load forms an angle with the joint plane, the stress acting on the joint plane can be resolved into normal and tangential components, with the tangential component potentially inducing shear slip along the joint. Based on this consideration, the present study focuses on a single persistent, smooth, and rigid structural plane to investigate the dynamic slip characteristics of the joint under impact loading. By varying the angle between the impact-load propagation direction and the joint plane, joint dip angles of 50°, 60°, and 70° were selected, with an intact specimen included for comparison. All specimens had dimensions of 50 × 50 × 50 mm, and their geometries are shown in Figure 3.
Figure 3.
Jointed rock mass specimens: (a) schematic of specimen dimensions; (b) specimen photograph.
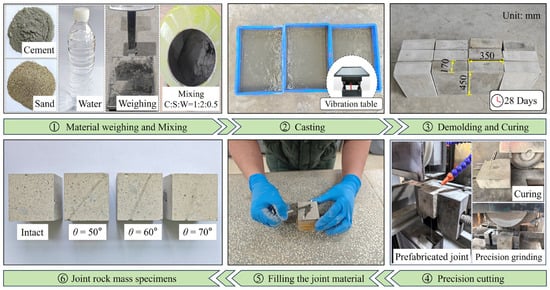
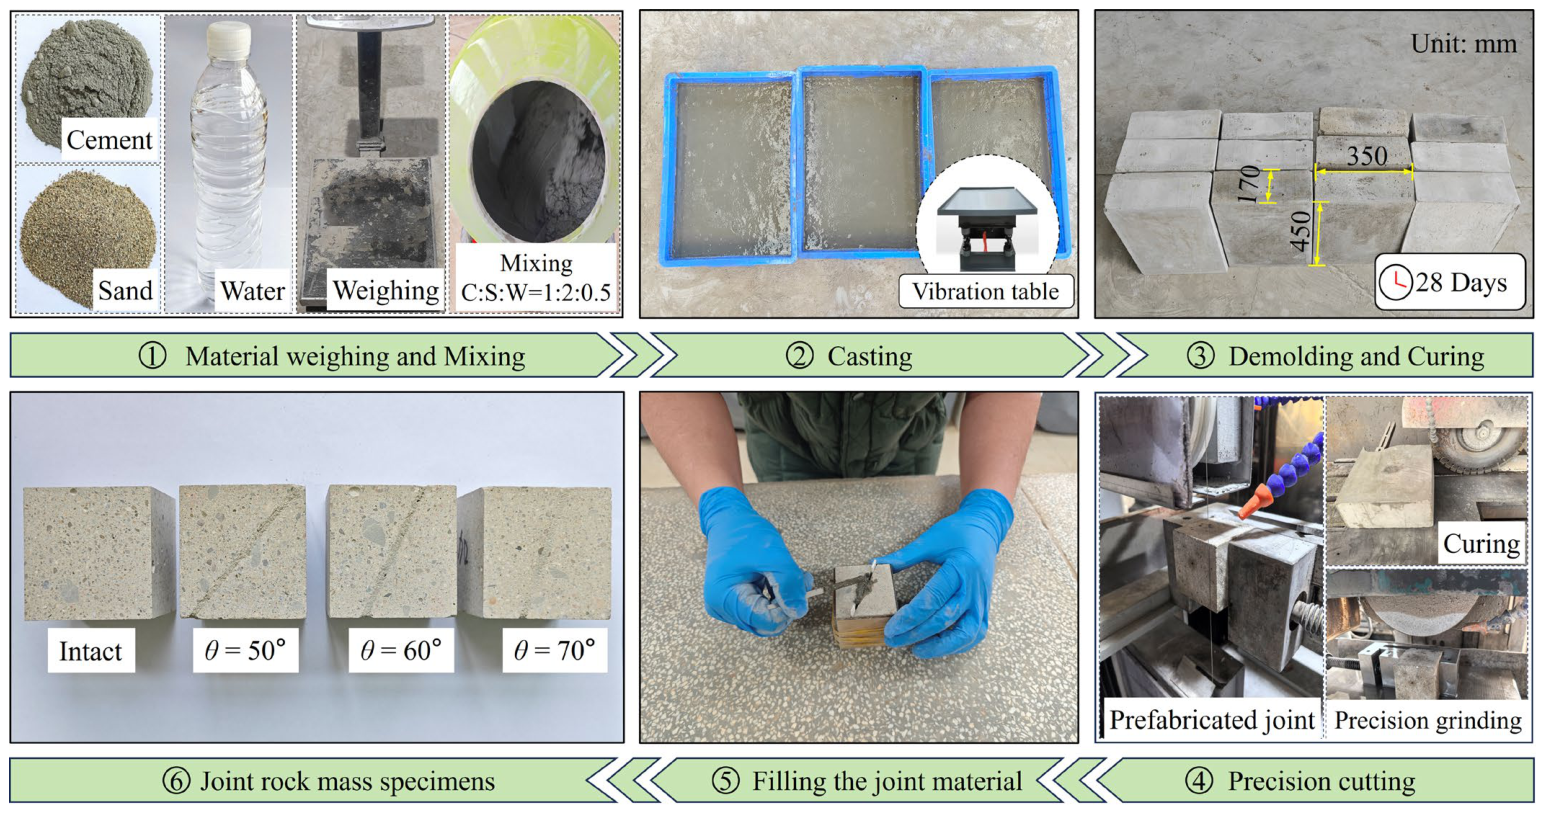
The preparation procedure for the jointed rock specimens is shown in Figure 4. First, the raw materials were weighed according to the designed mix proportion of the rock matrix analog material, and then thoroughly mixed with a blender. The prepared mortar was subsequently poured into the mold and compacted on a vibrating table to eliminate internal air bubbles and improve the compactness of the specimens. After the mortar reached its initial setting state, the specimens were demolded and cured for 28 days under standard curing conditions at a temperature of approximately 20 °C and a relative humidity above 95%, ensuring that the material reached stable mechanical properties. After curing, the rock blocks with the designed joint dip angles were precisely cut using a diamond cutter. Finally, the previously prepared joint material was filled between the rock blocks. To ensure a consistent joint thickness among the specimens, 2 mm thick spacers were used during filling. After the joint material had set, the specimens were subjected to a second stage curing in a humid environment for at least 28 days. This ensured sufficient curing of the joint material and allowed it to reach a stable mechanical state.
Figure 4.
Fabrication process of jointed rock mass specimens.
2.2. Loading Scheme
Blast-induced impact loading in rock mass engineering can severely threaten the overall stability of rock mass structures. When an explosion occurs in a solid medium, the explosion energy is released in an extremely short time and forms a strong transient compression wave. Its time–history curve can usually be simplified to an approximate half-sine waveform [26,27,28]. It exhibits the typical characteristics of pulse loading, including short duration, high amplitude and high strain rate. To simulate this type of pulse loading, the SHPB test system is widely adopted in experimental investigations of rock dynamics [29,30].
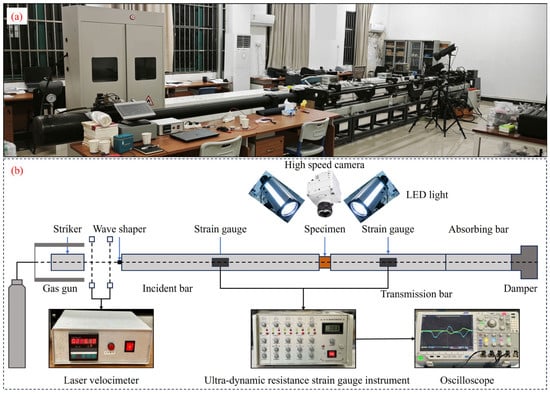
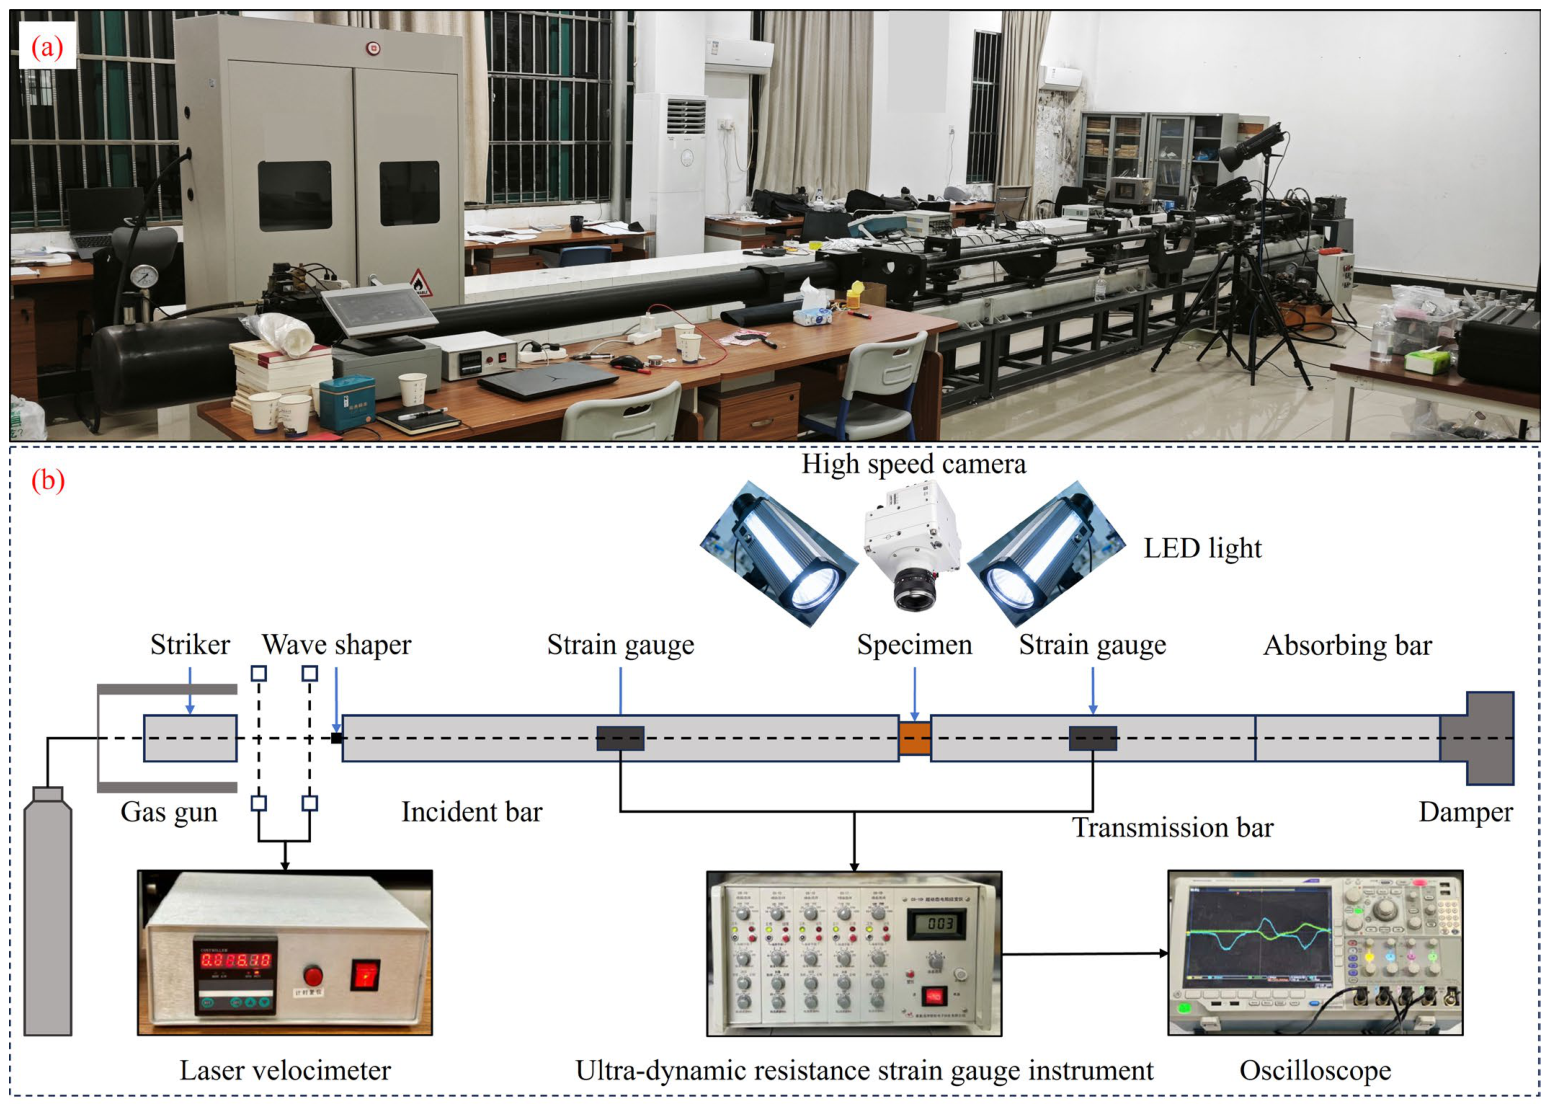
Therefore, the SHPB test system was used to apply impact loading in this study. It mainly consists of a loading subsystem and a signal acquisition subsystem, as illustrated in Figure 5. The incident and transmitted bars were made of high-strength steel, with an elastic modulus of 210 GPa, a density of 7900 kg/m3, and a longitudinal wave velocity of 5188 m/s. The lengths of the incident and transmitted bars were 3000 mm and 2500 mm, respectively, and both bars had a diameter of 75 mm. To reduce stress wave dispersion and promote dynamic stress equilibrium, a rubber pulse shaper with a diameter of 10 mm and a thickness of 3 mm was installed on the loading end of the incident bar, shaping the stress wave into an approximately half-sine waveform [11,31]. Strain gauges were mounted at the axial midsections of the incident and transmitted bars and connected to an ultra-dynamic resistance strain gauge instrument to record stress wave signals, with a Tektronix MDO4054C oscilloscope used for signal acquisition. A laser velocimeter was installed at the end of the incident bar to monitor the impact velocity of the striker.
Figure 5.
Split Hopkinson pressure bar system: (a) equipment photograph; (b) schematic diagram.
In this test, the incident velocity of the striker was controlled by adjusting the impact pressure of the gas gun. Four impact pressure conditions were set at 0.06 MPa, 0.07 MPa, 0.08 MPa, and 0.09 MPa, and a laser velocimeter was employed to record the actual impact velocity of the striker. For each designed condition, one test was initially conducted. After preliminary analysis of the results, supplementary tests were performed on selected conditions requiring further verification; accordingly, the actual number of tests was not identical across all conditions. Table 2 lists the final loading conditions and the corresponding test results.
Table 2.
Test loading scheme.
2.3. DIC Measurement
2.3.1. Basic Principles of DIC
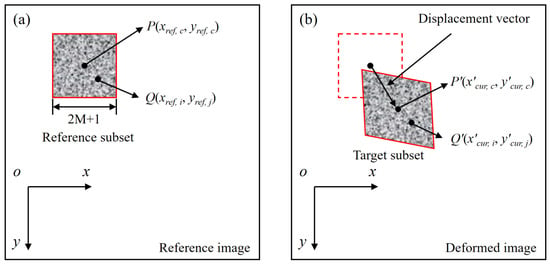
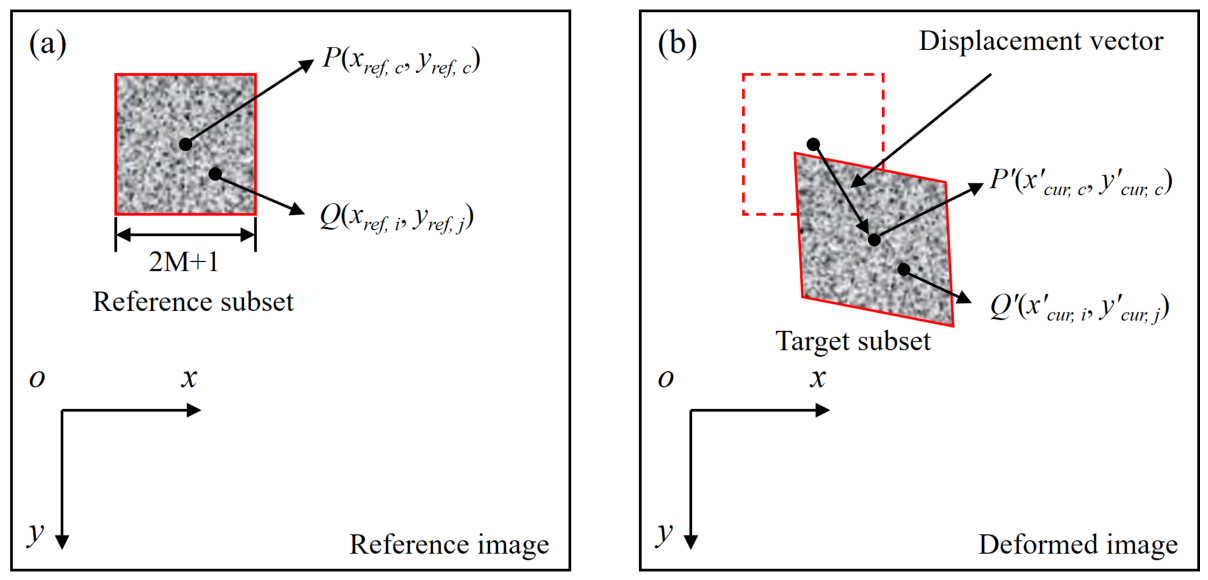
Digital image correlation (DIC) is a non-contact optical measurement method. By preparing a random speckle pattern on the object surface and correlating speckle images before and after deformation, DIC enables quantitative measurement of deformation information, such as displacement and strain [32]. Its basic principle is shown in Figure 6.
Figure 6.
Basic principle of the DIC method [33,34]: (a) reference image; (b) deformed image.
In full-field deformation measurement, the reference image is divided into numerous small regions called subsets or subwindows. It is assumed that the grayscale value within each subset remains constant, and these deformed subsets are then tracked in the deformed image. As shown in Figure 6, a reference subset with a size of (2M + 1) × (2M + 1) pixels is selected from the reference image, with its center at P(xref,c, yref,c). The coordinates of an arbitrary point Q(xref,i, yref,j) after deformation, denoted as Q′(x′cur,i, y′cur,j), can be calculated by the following formula [35]:
where u0 and v0 are the displacement components of the subset center P(xref,c, yref,c) in the x and y directions, respectively; ∂u/∂x and ∂v/∂y are the normal strain components; ∂v/∂x and ∂u/∂y are the shear strain components; S represents the set of all pixels within the subset.
2.3.2. DIC Measurement Method
The DIC system consists of a high-speed camera, Motion Studio 1.0 image acquisition software, and high power illumination. The high-speed camera (IDT Y7-S2) was used to capture the dynamic slip process of jointed rock masses with different dip angles under impact loading. The high-speed camera was manufactured by Integrated Design Tools Inc., USA. The frame rate was set to 55,000 fps, with a resolution of 512 × 440 pixels. A high power LED light was also used to increase the illumination of the specimen surface and improve data accuracy.
The DIC measurement procedure was as follows. First, the specimen surface was cleaned with alcohol and uniformly coated with a layer of matte white paint. After drying, matte black paint was randomly sprayed to form speckle patterns with different sizes and distributions. After the specimen was mounted in the loading device, the position and focal length of the high-speed camera were adjusted. The LED lights on both sides of the camera were then turned on, and the brightness was carefully adjusted and stabilized. Finally, DIC imaging was synchronized with the loading process to capture the dynamic slip process of the specimen in real time.
2.4. Stress Equilibrium Verification
In the SHPB test, the striker generates an incident wave (εi) after impacting the incident bar. Owing to the difference in wave impedance among the incident bar, transmitted bar, and specimen, the incident wave is partially transmitted and reflected when it reaches the bar-specimen interface, thereby forming a reflected wave (εr) and a transmitted wave (εt), which propagate along the incident bar and transmitted bar, respectively. The stresses at both ends of the specimen can be calculated using Equations (2) and (3) [36].
where Eb and Ab are the elastic modulus and cross-sectional area of the bars, respectively; F1 and F2 denote the forces at the incident and transmitted ends of the specimen, respectively. According to the assumption of uniform strain, the dynamic stresses at both ends of the specimen tend to reach equilibrium under the combined effects of multiple back-and-forth stress wave propagations and interfacial reflections, namely F1 = F2. Thus:
F1 = EbAb(εi + εr)
F2 = EbAbεt
εi(t) + εr(t) = εt(t)
Based on the one-dimensional stress wave theory, when the stresses at both ends of the specimen reach equilibrium, the axial strain rate , axial strain ε and stress σ of the specimen can be calculated via the two-wave method [37]:
where A0 and As are the cross-sectional areas of the bars and the specimen; εr(t) and εt(t) represent the reflected strain and transmitted strain, respectively; E0 and C0 are the elastic modulus and one-dimensional elastic wave velocity of the bars; Ls is the length of the specimen.
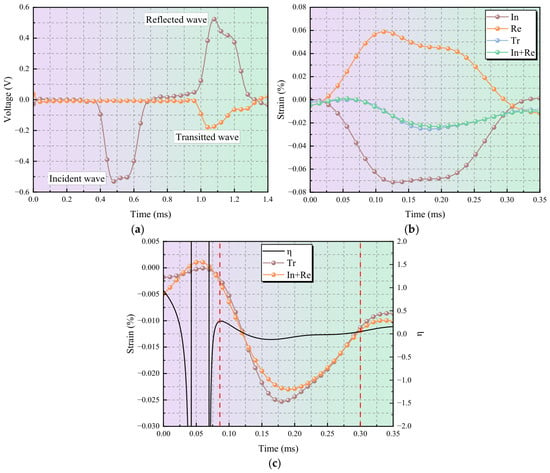
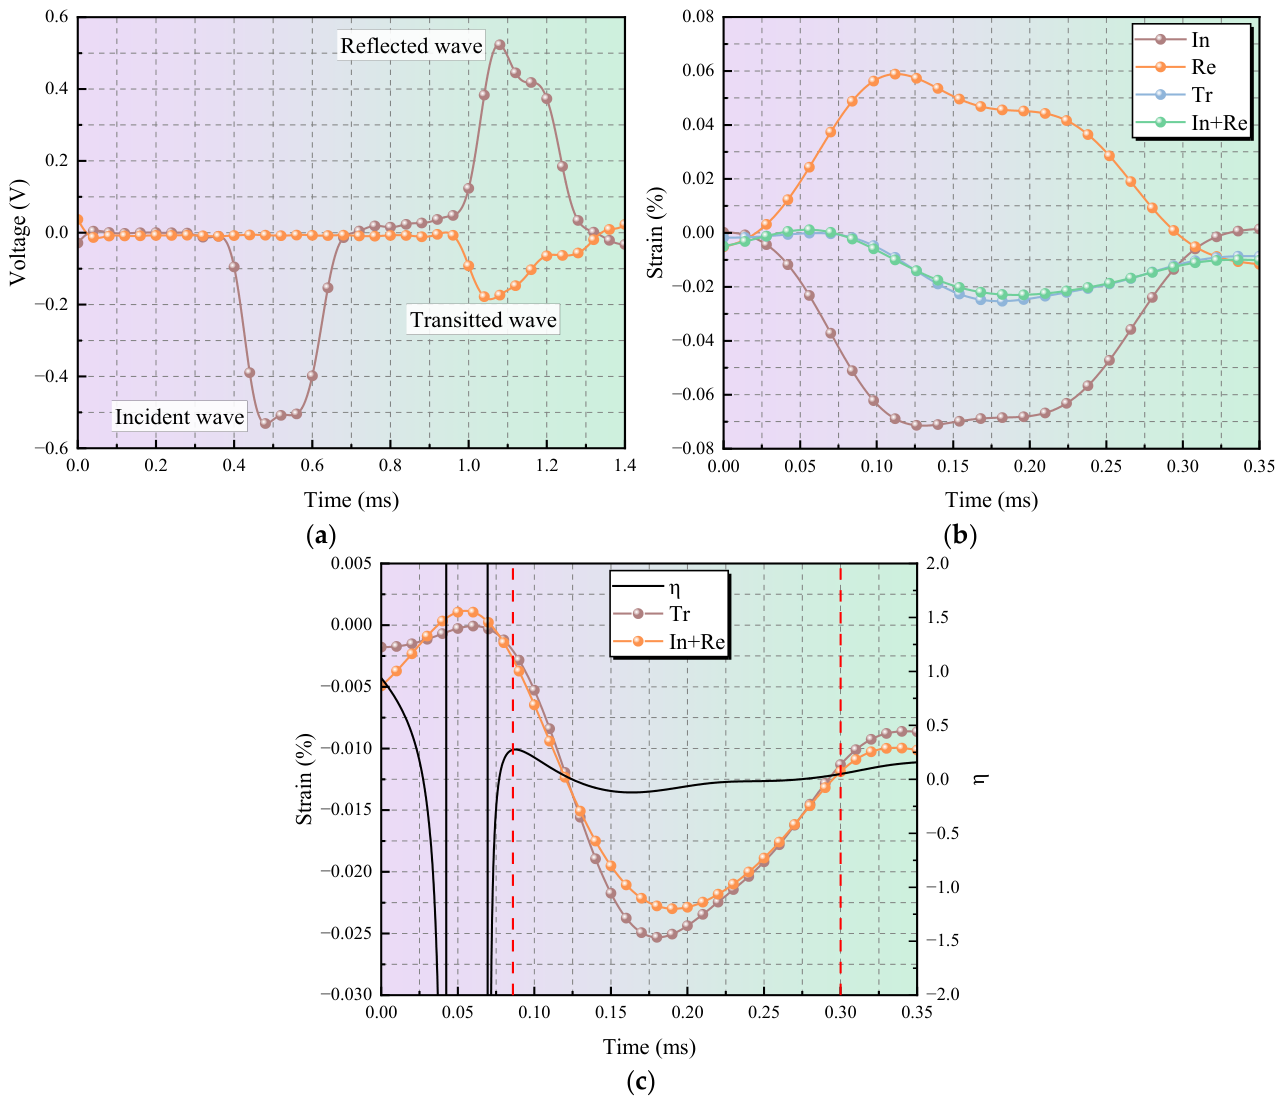
Dynamic stress equilibrium verification is a fundamental prerequisite to guarantee the validity and reliability of SHPB tests. Dynamic stress equilibrium was verified for all specimens. The results showed that both the intact and jointed rock specimens satisfied the dynamic stress equilibrium condition. Figure 7a presents a typical waveform obtained from the intact rock specimen under an impact pressure of 0.09 MPa. As shown in Figure 7b, the sum of the incident and reflected strains exhibits an overall trend similar to that of the transmitted strain, and the transmitted strain is approximately equal to the sum of the incident and reflected strains. In addition, a dynamic stress equilibrium factor (η) was introduced to quantitatively analyze the stress equilibrium state at both ends of the specimen.
Figure 7.
Dynamic stress equilibrium verification: (a) typical waveform; (b) stress equilibrium verification; (c) stress equilibrium factor.
Figure 7c shows the dynamic stress equilibrium factor of the specimen in a typical test. The factor remains approximately zero from about 0.086 ms to 0.3 ms, and this time window can be roughly regarded as the stress equilibrium stage. Therefore, the specimen fails under dynamic stress equilibrium conditions, confirming that the stress equilibrium control in the test is reasonable and acceptable.
3. Results and Discussion
3.1. Stress–Strain Curves
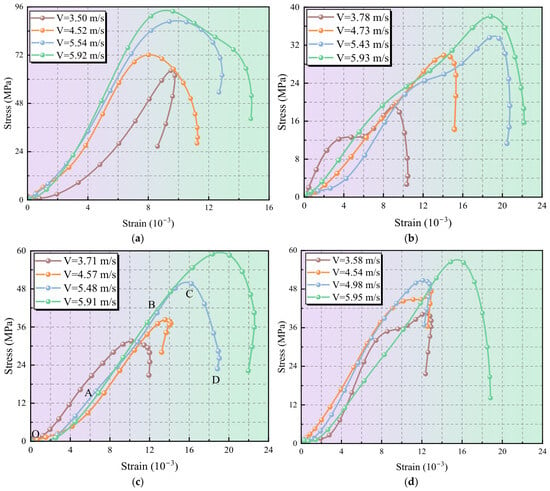
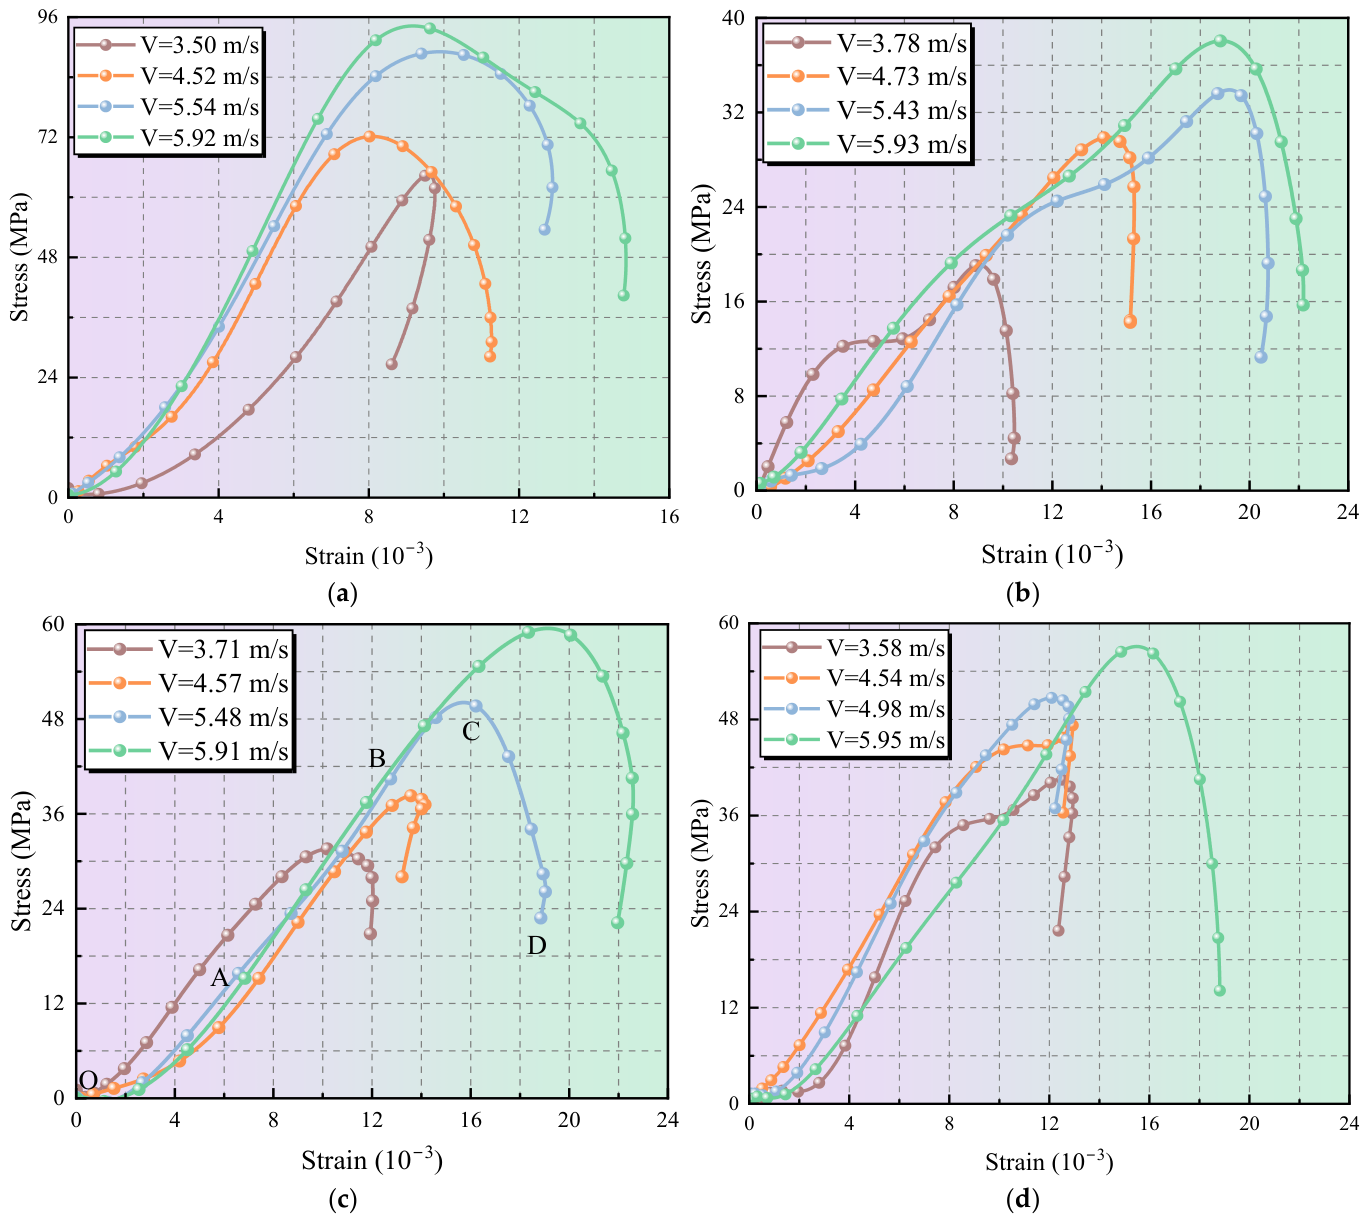
Dynamic loading tests were conducted on jointed rock mass specimens with different dip angles. The stress–strain curves under each condition were obtained, as shown in Figure 8. These curves reflect the dynamic failure behavior of the jointed rock masses. Taking the 60° specimen at an impact velocity of 5.48 m/s as an example (Figure 8c), the failure process can be divided into four stages: compaction, elastic deformation, nonlinear deformation, and instability failure. In the initial compaction stage (OA), the stress–strain curve shows a concave shape. The specimen is mainly characterized by pore compaction and joint compression. In the elastic deformation stage (AB), the stress–strain relationship is linear, and the specimen response is dominated by elastic deformation. In the nonlinear deformation stage (BC), the stress–strain curve gradually deviates from linearity. This stage is critical for the initiation and rapid development of joint slip, accompanied by damage accumulation in the rock matrix. In the instability failure stage (CD), crack coalescence and intensified joint slip lead to the formation of a macroscopic failure structure. The overall load-bearing capacity then decreases rapidly, and dynamic instability failure eventually occurs.
Figure 8.
Stress–strain curves: (a) intact rock mass; (b) dip angle 50°; (c) dip angle 60°; (d) dip angle 70°.
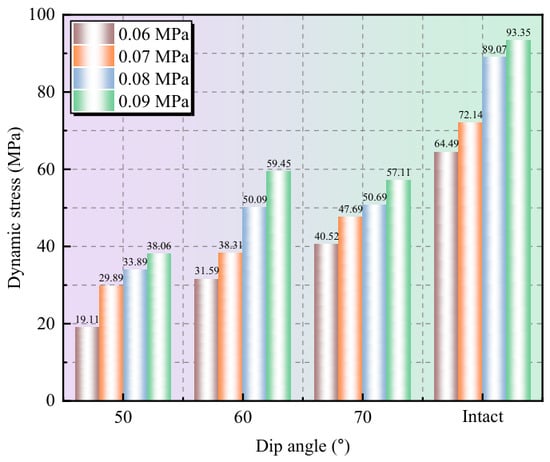
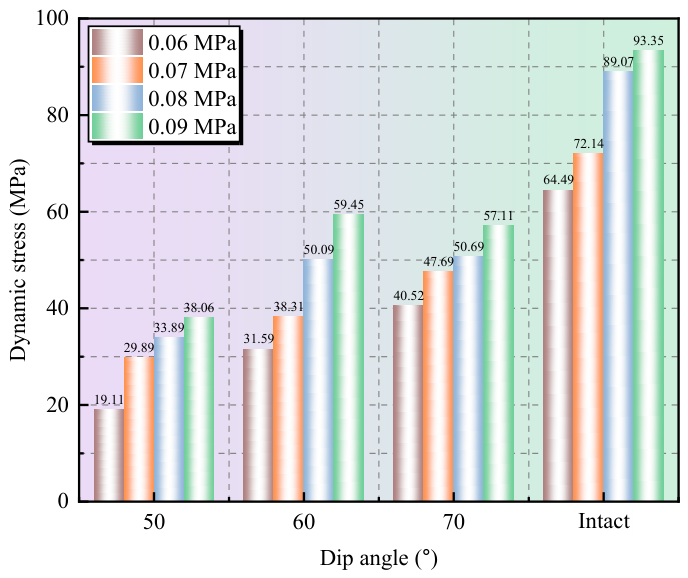
The test results of all specimens are summarized in Table 3. The variation in dynamic strength under different impact pressures is shown in Figure 9. The dynamic strength of both intact and jointed rock masses increases with increasing impact pressure. This indicates that the dynamic load-bearing capacity improves as the impact-loading intensity increases, showing a clear rate effect.
Table 3.
Summary of test results.
Figure 9.
Dynamic strength of specimens under different impact pressures.
For the intact rock mass, the dynamic strength increased from 64.49 MPa to 93.35 MPa as the impact pressure increased from 0.06 MPa to 0.09 MPa, corresponding to an increase of 44.8%. By contrast, the dynamic strength of the jointed specimens was generally much lower than that of the intact rock mass. This indicates that the presence of joints significantly weakens the dynamic strength of the rock mass and reduces its load-bearing capacity under impact loading. Taking an impact pressure of 0.06 MPa as an example, the dynamic strength of the intact rock mass was 64.49 MPa. The dynamic strengths of the 50°, 60°, and 70° jointed specimens were 19.11 MPa, 31.59 MPa, and 40.52 MPa, respectively. Compared with the intact rock mass, the strength decreased by 70.4%, 51.0%, and 37.2%, respectively.
For the jointed rock masses, the dip angle has a significant effect on dynamic strength. As the dip angle increases from 50° to 70°, the dynamic strength generally increases. The increase is most pronounced at an impact pressure of 0.06 MPa. Compared with the 50° specimen, the dynamic strengths of the 60° and 70° specimens increase by 65.31% and 112.04%, respectively. This indicates that increasing the joint dip angle can enhance the dynamic load-bearing capacity of the jointed rock mass to some extent. However, this increase becomes less pronounced as the impact pressure increases. For the 60° and 70° specimens, the difference in peak strength decreases. At an impact pressure of 0.09 MPa, the dynamic strength of the 70° specimen is 3.94% lower than that of the 60° specimen. This indicates that the control of joint dip angle on strength is weakened when the impact loading is sufficiently strong. It should be noted that, at an impact pressure of 0.08 MPa, the actual impact velocity of the 70° specimen was 4.98 m/s, which was lower than the 5.48 m/s measured for the 60° specimen, and the corresponding incident energy was also relatively lower. Therefore, under this loading condition, the differences in the responses of specimens with different joint dip angles may be influenced by both the joint dip angle and differences in the actual loading intensity.
The effect of joint dip angle on dynamic strength is closely related to changes in the slip condition of the joint. When the incident stress σin reaches an inclined joint, it is resolved into a normal stress component σn and a tangential stress component στ along the joint, as given in Equation (7). Once the tangential stress component στ exceeds the shear strength of the joint, slip occurs along the joint plane. This slip then affects the dynamic strength of the specimen.
According to Equation (6), once the joint dip angle exceeds 45°, the normal stress component σn increases as the dip angle increases. As a result, the joint is subjected to stronger normal constraint. In contrast, the tangential stress component στ gradually decreases, and the dynamic condition for shear slip is weakened. Therefore, in this study, the 50° joint has the smallest normal stress component and the largest tangential stress component. This makes shear failure and slip more likely to occur along the joint, thereby reducing the dynamic load-bearing capacity of the specimen. As the joint dip angle increases, the normal constraint on the joint becomes stronger, while the tangential stress component along the joint decreases. This suppresses relative slip between the two sides of the joint to some extent and improves the slip resistance and overall load-bearing capacity of the specimen.
3.2. Stress Wave Transmission and Reflection Characteristics
When the incident stress wave reaches the joint interface, reflection and transmission occur at the joint because of the difference in wave impedance between the rock matrix and the joint. Based on Hertzian contact theory, Misra and Marangos [38] derived the reflection and transmission behavior of stress waves at joints or fracture surfaces. To quantitatively characterize the influence of joints on stress wave propagation, the reflection coefficient Rc and transmission coefficient Tc were used. They can be calculated using Equation (8) [39].
where εt(t), εr(t), and εi(t) represent the transmitted wave, reflected wave and incident wave, respectively.
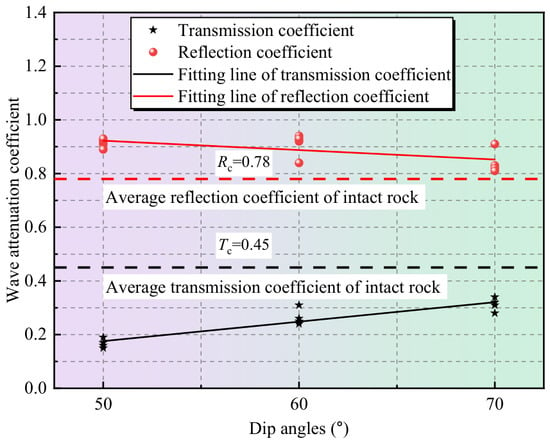
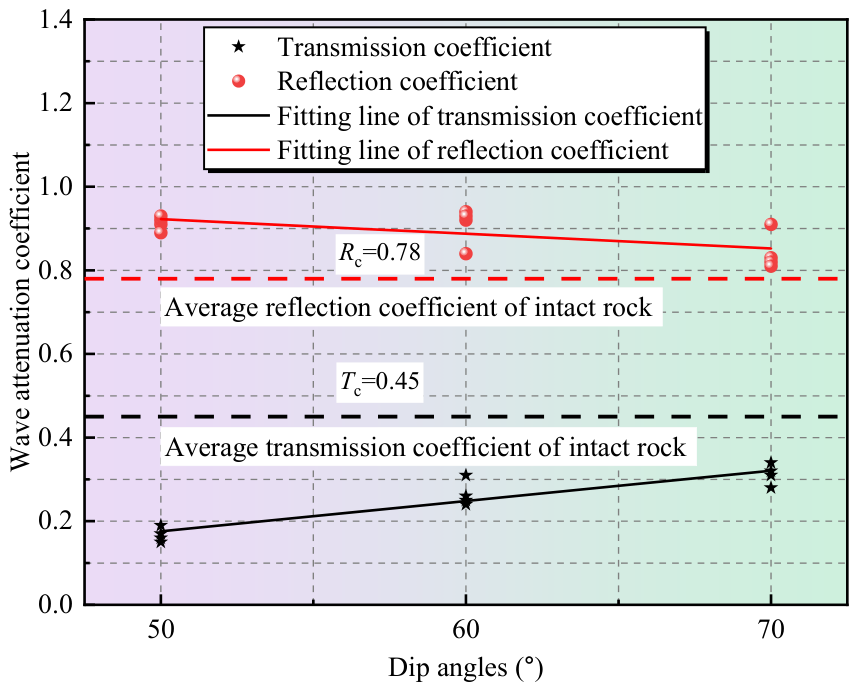
Table 3 presents the reflection and transmission coefficients of the jointed rock mass specimens with different dip angles under impact loading. Figure 10 shows the effects of joint dip angle on the reflection coefficient Rc and transmission coefficient Tc. Compared with the intact rock mass, the jointed rock masses show much lower transmission coefficients and generally higher reflection coefficients. The average transmission coefficient of the intact rock mass is approximately 0.448. In contrast, the average transmission coefficients of the 50°, 60°, and 70° jointed specimens are 0.168, 0.265, and 0.313, respectively. These values are approximately 62.6%, 40.8%, and 30.2% lower than that of the intact rock mass. Meanwhile, the average reflection coefficients of the 50°, 60°, and 70° jointed specimens are 0.913, 0.908, and 0.843, respectively. All of these values are higher than the average reflection coefficient of the intact rock mass, which is 0.778. This result indicates that the joint acts as an interface with wave impedance discontinuity. It significantly weakens stress wave transmission between the rock blocks on the two sides of the joint and enhances interfacial reflection. The reduced transmission makes it difficult for the two sides of the joint to develop a synchronized dynamic response. As a result, deformation compatibility across the interface is weakened, creating favorable dynamic conditions for relative slip along the joint.
Figure 10.
Reflection and transmission coefficients of jointed rock masses.
Changes in dip angle further regulate stress wave propagation. For the 50° jointed specimen, impact loading is more likely to induce shear deformation and relative slip along the joint. In this case, displacement continuity and deformation compatibility are more easily disrupted. Stress waves are therefore more strongly impeded when crossing the joint interface, as reflected by the lowest transmission coefficient and the highest reflection coefficient. As the dip angle increases, the normal constraint on the joint becomes stronger. The degree of interface closure and contact continuity also improves, and joint slip is suppressed to some extent. As a result, stress waves can pass through the joint interface more easily, leading to a higher transmission coefficient and a lower reflection coefficient. These results indicate that the dip angle regulates the normal constraint and tangential stress acting on the joint interface. It also affects the difference in displacement development between the two sides of the joint, thereby controlling the transmission and reflection characteristics of stress waves at the joint.
3.3. Dynamic Evolution Characteristics of Joint Slip
Joint slip is an important manifestation of dynamic instability in jointed rock masses under impact loading, and its evolution reflects changes in the relative motion and deformation compatibility between the two sides of the joint. To reveal the dynamic evolution characteristics of joint slip, the surface resultant displacement field obtained by DIC was first used to analyze the development of displacement differences and displacement discontinuities across the joint. The relative slip-displacement time histories between the two sides of the joint were then extracted to quantitatively identify slip initiation and its subsequent evolution. On this basis, the slip velocity was further calculated to characterize the acceleration, peak, and decay stages of joint slip.
3.3.1. Evolution Characteristics of Displacement Field
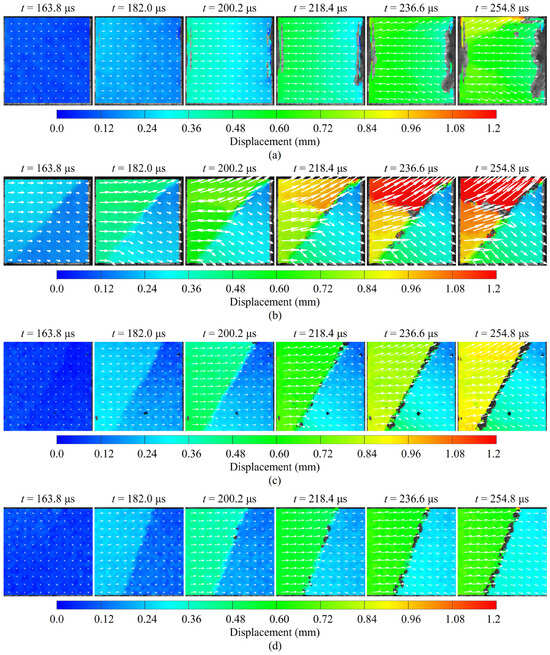
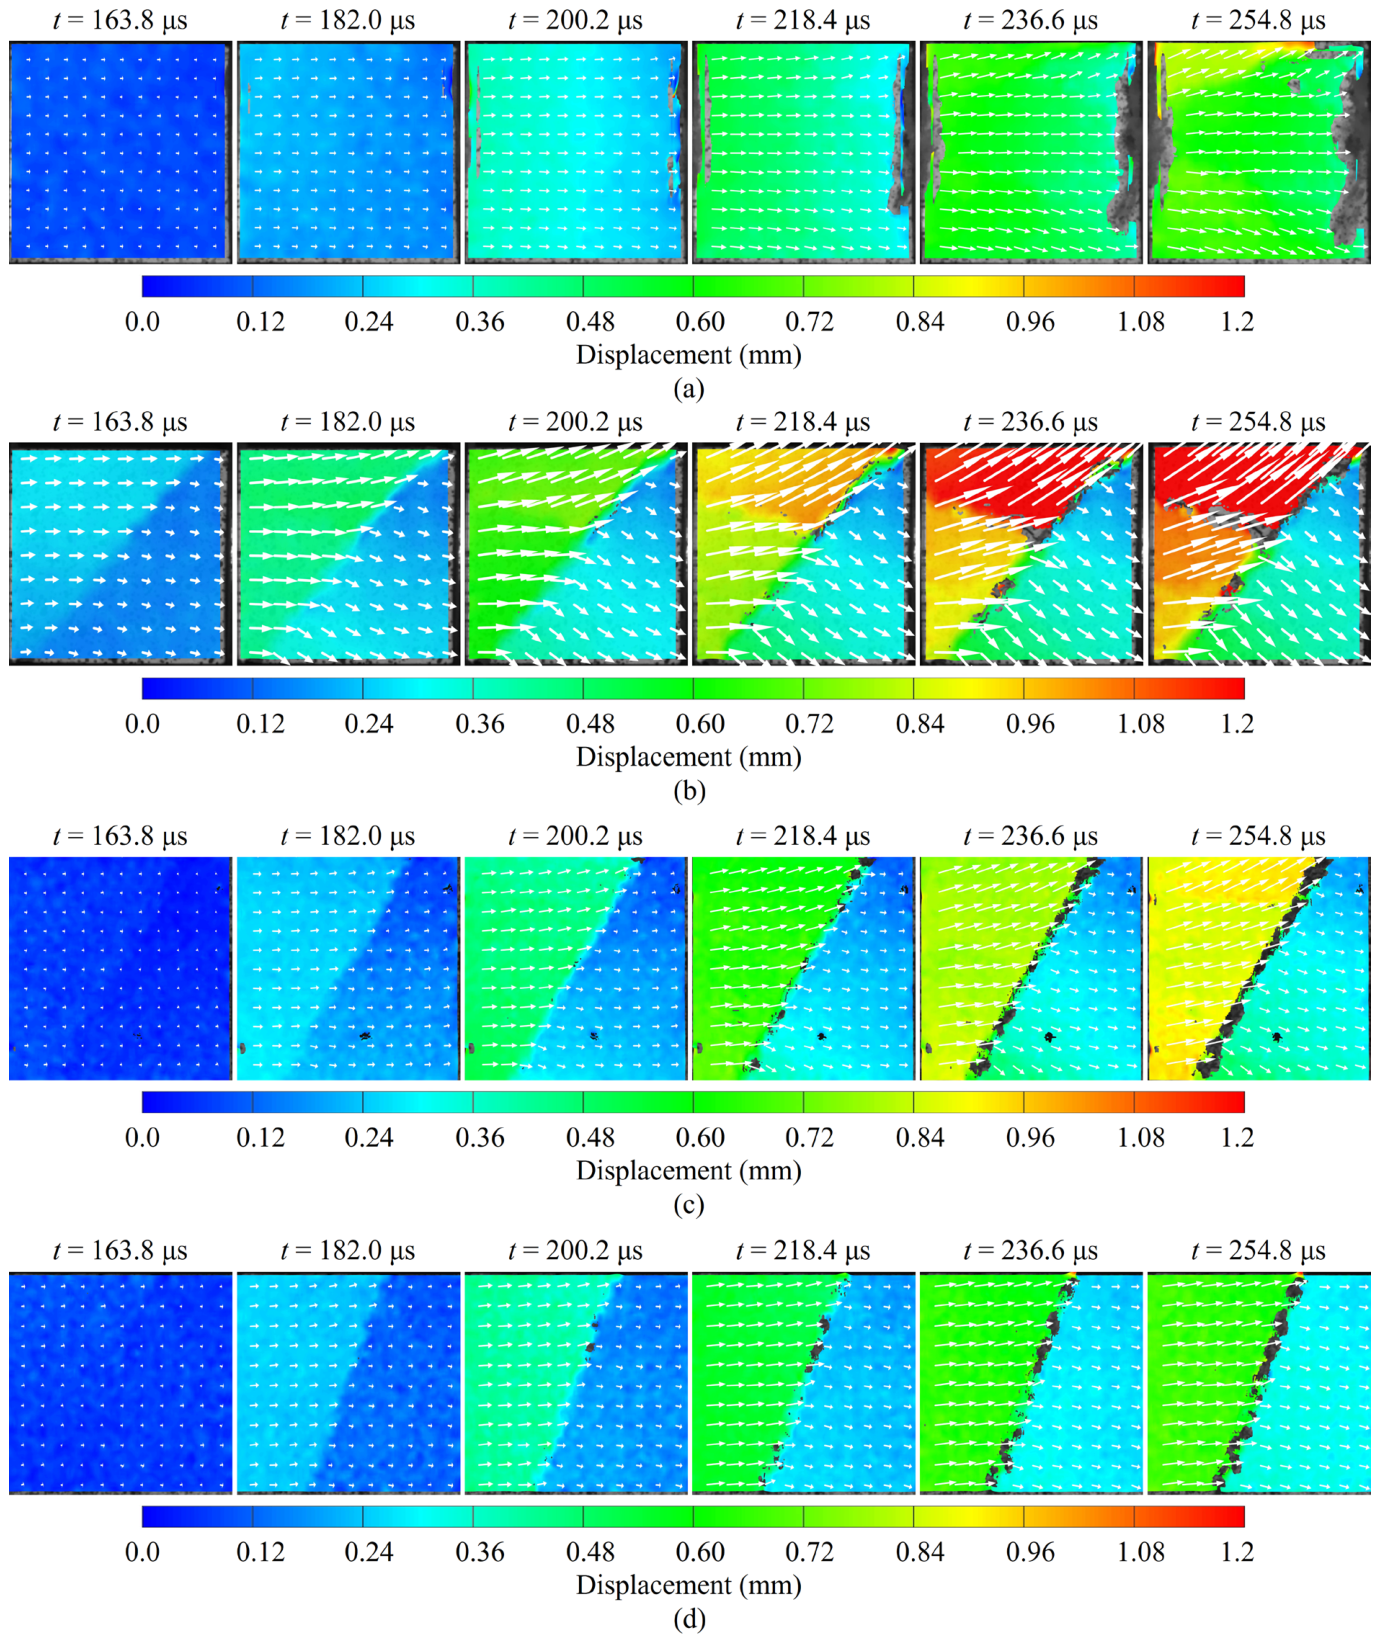
Based on the DIC method, the full-field displacements of the intact and jointed rock mass specimens were obtained using VIC-2D 8.0 software. Taking an impact pressure of 0.08 MPa as an example, Figure 11 shows the evolution of the resultant displacement field D on the specimen surface. The displacement vector arrows indicate the local movement direction.
Figure 11.
Displacement fields of intact and jointed rock mass specimens: (a) intact rock mass; (b) dip angle 50°; (c) dip angle 60°; (d) dip angle 70°.
The results show that the presence of the joint significantly changes the displacement evolution of the specimen. A displacement discontinuity gradually forms across the joint. For the intact rock mass specimen (Figure 11a), the surface displacement field is relatively continuous during the early loading stage. The deformation is mainly characterized by uniform compression. As impact loading continues, damage gradually accumulates inside the specimen. The displacement magnitude in local regions then begins to increase, accompanied by crack propagation and local fragmentation. At this stage, the continuity of the displacement field gradually decreases. Local displacement concentration and deflection of the displacement direction also become more pronounced.
For the jointed rock mass specimens, the presence of the joint weakens displacement continuity. Under impact loading, a clear displacement discontinuity band forms along the joint direction. For the 50° jointed specimen (Figure 11b), a slight displacement difference had already developed across the joint at 163.8 μs, while the overall displacement field still remained relatively continuous. By 182 μs, the difference in displacement growth between the two sides of the joint had increased markedly, and the displacement vectors also began to change direction, forming a relatively clear displacement discontinuity band near the joint. With continued impact loading, the displacement difference across the joint further increased and the displacement discontinuity band became more pronounced, indicating the continued development of relative motion between the blocks on the two sides of the joint. For the 60° jointed specimen (Figure 11c), the surface displacement field remained relatively uniform before 163.8 μs, and the overall displacement was small. By 182 μs, a discernible displacement gradient began to develop near the joint, and the displacement difference between the two sides of the joint gradually became apparent. After 200.2 μs, the displacement difference across the joint further increased, accompanied by a pronounced change in the displacement vector direction, and a relatively clear displacement discontinuity gradually developed. Compared with the 50° specimen, the formation of an obvious displacement discontinuity in the 60° specimen occurred relatively later, and the displacement difference across the joint was small.
For the 70° jointed specimen (Figure 11d), the surface displacement field remained relatively continuous before 182 μs. At 200.2 μs, a locally discernible displacement discontinuity began to appear near the joint, indicating a gradual reduction in deformation compatibility between the blocks on the two sides of the joint. After 218.4 μs, the displacement vectors on the two sides of the joint showed further changes in direction. However, both the displacement difference and the degree of directional change were smaller than those observed in the 50° and 60° specimens, indicating that the development of relative motion across the joint was weaker in the 70° specimen. A comparison of the displacement field evolution of jointed rock specimens with different dip angles shows that the joint dip angle has a pronounced influence on the development of displacement differences and displacement discontinuities across the joint. As the joint dip angle increases, the displacement difference between the two sides of the joint gradually decreases. Among the specimens, the 50° specimen develops a distinct displacement discontinuity band relatively early and exhibits the largest displacement difference across the joint; the degree of displacement discontinuity is reduced in the 60° specimen; and the 70° specimen shows the smallest overall displacement magnitude and the smallest displacement difference across the joint. These results indicate that, with increasing joint dip angle, the development of relative motion between the two sides of the joint under impact loading is progressively weakened.
3.3.2. Joint Slip Displacement
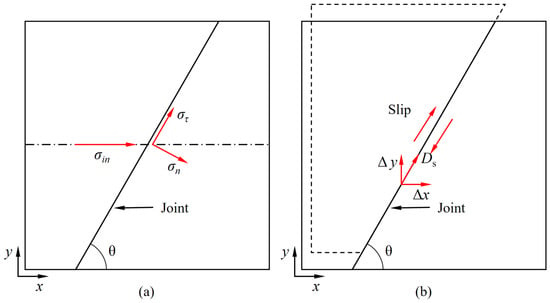
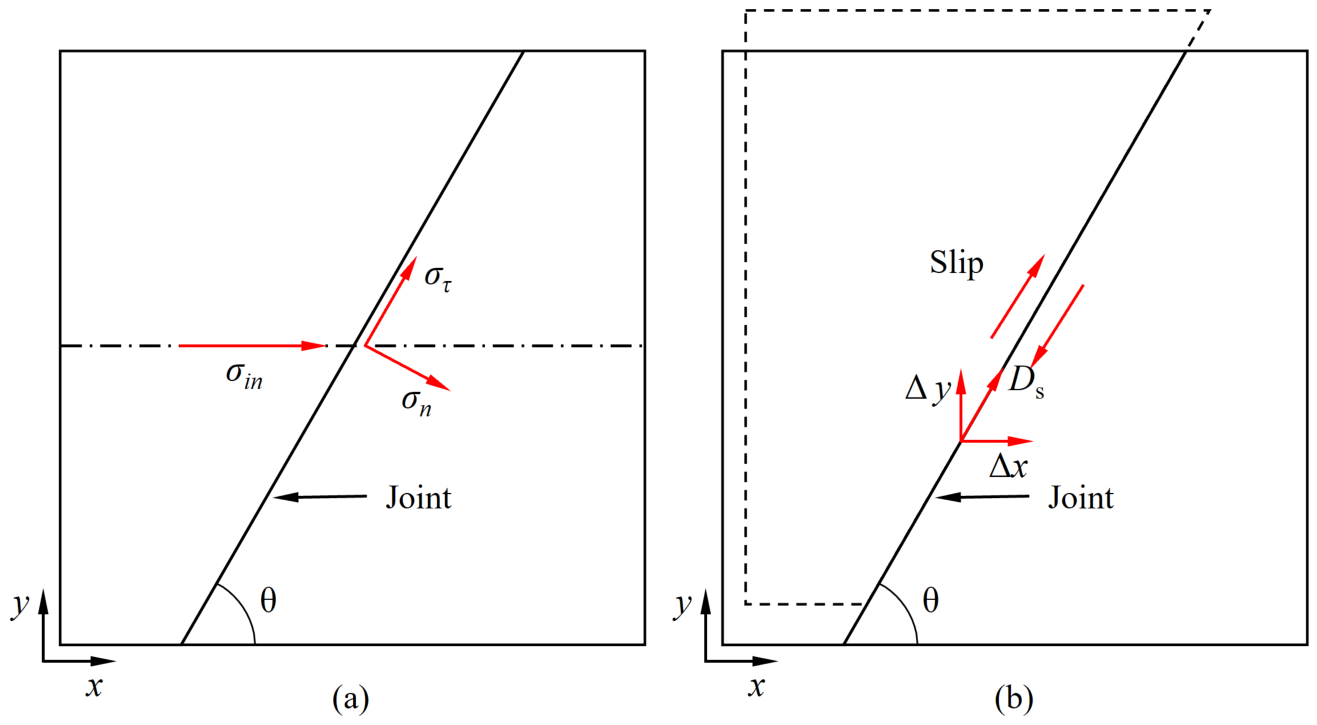
The presence of the joint changes stress wave propagation and the local stress state. When the incident stress σin reaches an inclined joint, the stress state is shown in Figure 12a. When the tangential stress component στ exceeds the shear strength of the joint, slip occurs along the joint plane (Figure 12b). The slip displacement Ds can then be expressed as:
where Δx and Δy are the displacement differences between the two sides of the joint in the x and y directions, respectively.
Ds=Δx · cosθ + Δy · sinθ
Figure 12.
Schematic diagram of slip analysis of jointed rock masses: (a) stress analysis of the joint plane; (b) slip displacement along the joint plane.
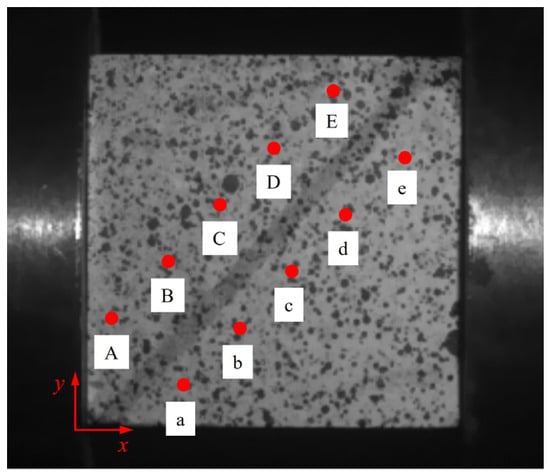
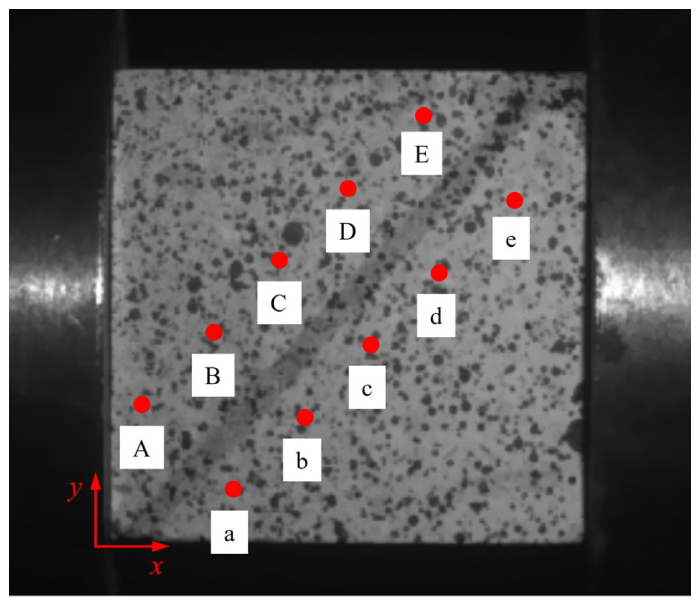
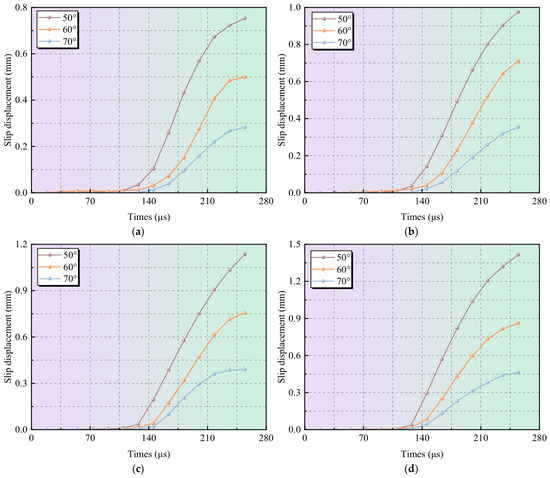
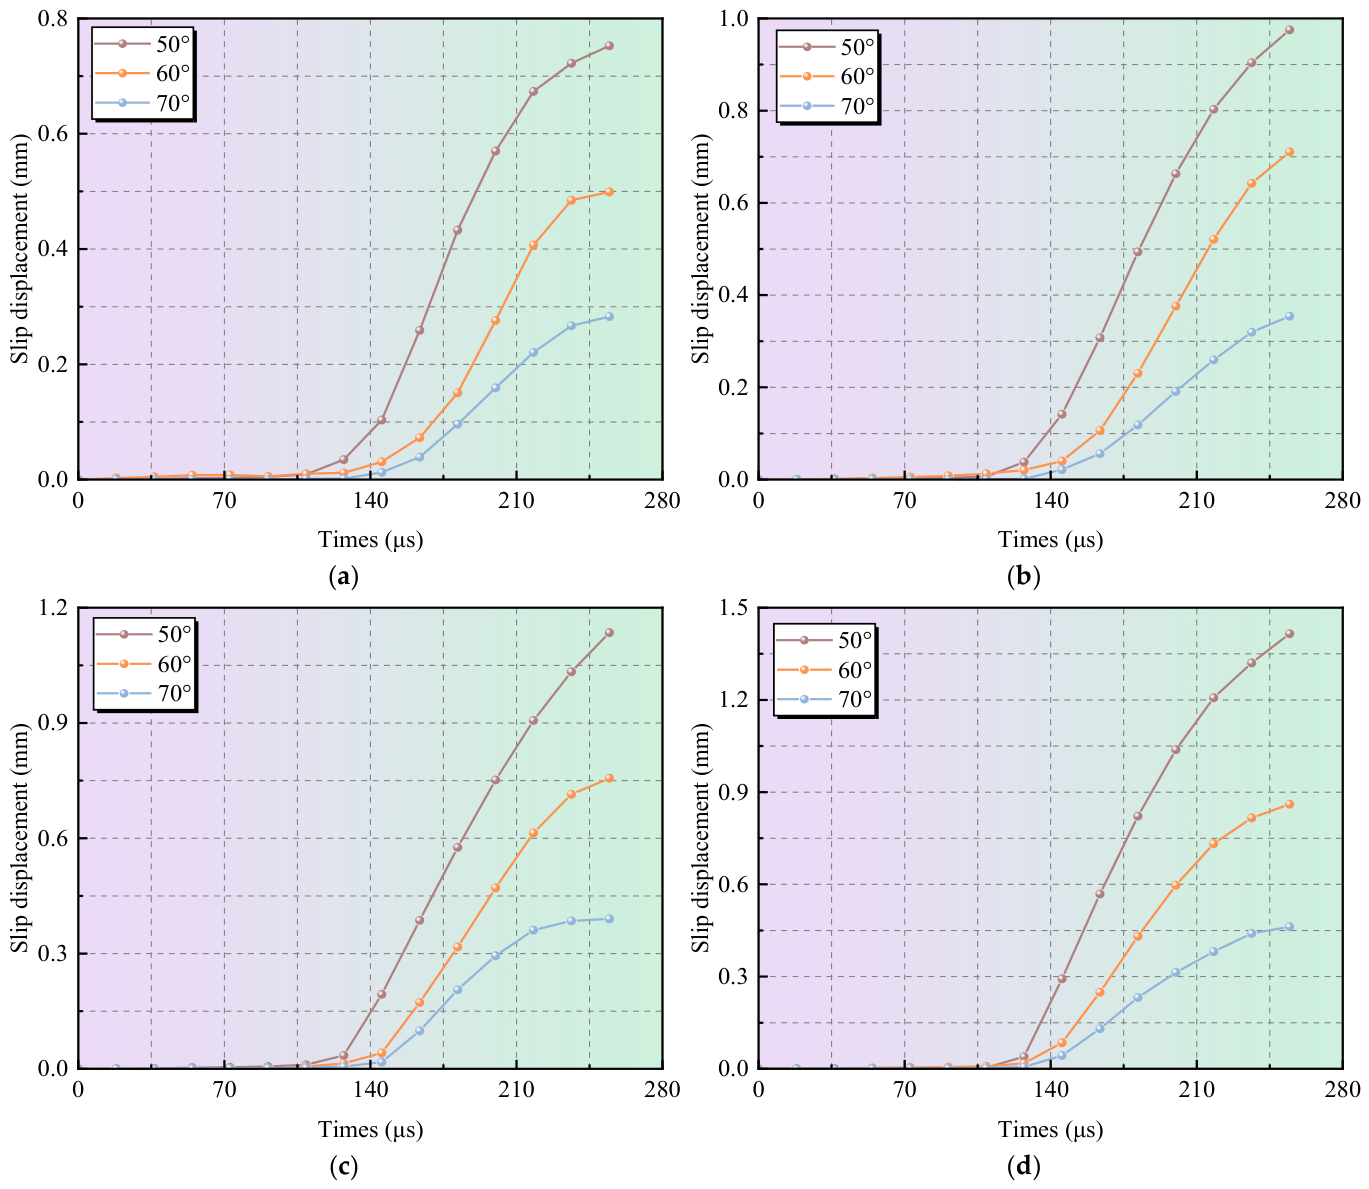
Owing to its high measurement accuracy and computational efficiency, DIC has been used to analyze slip along rock discontinuities. It provides a reliable method for the quantitative analysis of joint slip [40,41]. To further characterize the dynamic slip behavior of the joint, five groups of monitoring points were arranged along the joint direction (Figure 13). The displacement time histories in the x and y directions were obtained for jointed rock mass specimens with different dip angles. The slip displacement at each monitoring point was then calculated using Equation (9). The average value of the five monitoring points was used as the representative slip displacement of the specimen. In this way, the slip displacement of jointed rock masses with different dip angles under impact loading was obtained, as shown in Figure 14.
Figure 13.
Schematic diagram of the displacement monitoring point arrangement.
Figure 14.
Slip displacement curves of jointed rock masses under different impact pressures: (a) 0.06 MPa; (b) 0.07 MPa; (c) 0.08 MPa; (d) 0.09 MPa.
As shown in Figure 14, all jointed rock mass specimens with different dip angles exhibit obvious slip under impact loading. The slip displacement increases rapidly with time. Among them, the 50° jointed specimen consistently shows the largest slip displacement, followed by the 60° specimen, while the 70° specimen shows the smallest value. This indicates that the joint dip angle has a significant influence on slip development. Based on the time–history curves of relative slip displacement across the joint, relative slip in the 50° specimen begins at approximately 127.4 μs, whereas that in the 60° and 70° specimens begins at approximately 145.6 μs. Compared with the 50° specimen, slip initiation is delayed in the 60° and 70° specimens, while the difference in initiation time between these two specimens is not obvious. Compared with the slip initiation time, the joint dip angle exerts a more pronounced influence on the subsequent development of slip. As the joint dip angle increases from 50° to 70°, the increase in slip displacement progressively decreases, indicating that a larger joint dip angle more effectively suppresses relative motion between the two sides of the joint. In addition, for a given joint dip angle, the slip displacement generally increases with increasing impact loading intensity, indicating that stronger impact loading promotes relative slip across the joint and leads to a larger final residual slip displacement.
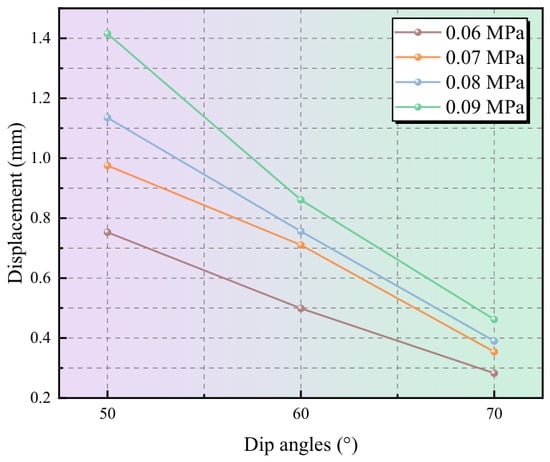
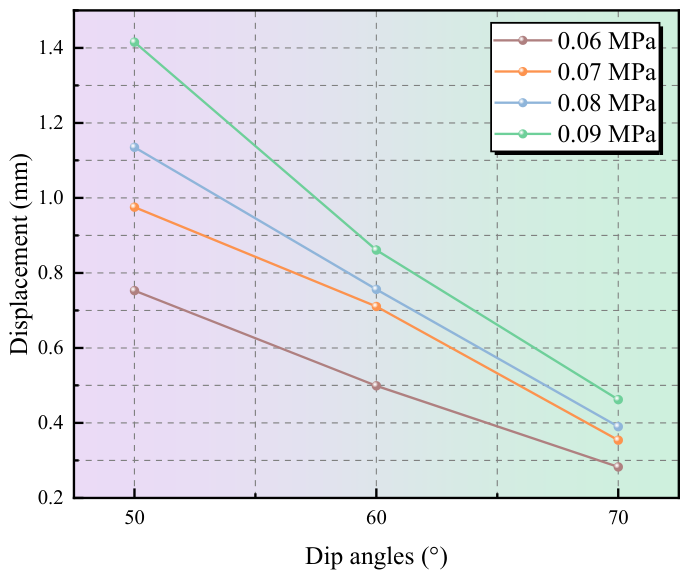
Figure 15 shows the variation in maximum slip displacement with joint dip angle and impact pressure. The results show that the maximum slip displacement of all specimens generally increases with increasing impact pressure. This indicates that stronger impact loading intensifies joint slip development. For the 50° specimen, the slip displacement increases from 0.753 mm at 0.06 MPa to 1.42 mm at 0.09 MPa, with an increase of approximately 88.6%. For the 60° specimen, it increases from 0.499 mm to 0.861 mm, with an increase of approximately 72.5%. For the 70° specimen, it increases from 0.283 mm to 0.462 mm, with an increase of approximately 63.3%. This result is consistent with the findings of Yao et al. [20] and Xie et al. [21], indicating that increased dynamic loading promotes joint slip development. However, the degree of slip varies significantly among joints with different dip angles, suggesting that dynamic joint slip is controlled not only by loading intensity, but also by joint orientation as an important structural factor.
Figure 15.
Variation in maximum slip displacement with dip angle and impact pressure.
Under the same impact pressure, the maximum slip displacement gradually decreased as the joint dip angle increased. At an impact pressure of 0.09 MPa, the maximum slip displacements of the 50°, 60°, and 70° specimens were 1.420, 0.861, and 0.462 mm, respectively. Compared with the 50° specimen, the maximum slip displacements of the 60° and 70° specimens decreased by approximately 39.4% and 67.5%, respectively. The same trend was observed under the other impact loading conditions, indicating that the joint dip angle has a significant influence on the degree of dynamic slip. Joints with smaller dip angles exhibited larger slip displacements, whereas joint slip was progressively suppressed as the dip angle increased. These results indicate that the joint dip angle is an important structural parameter controlling the dynamic slip response of planar joints under impact loading.
3.3.3. Joint Slip Velocity
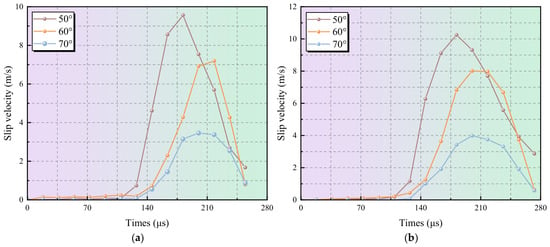
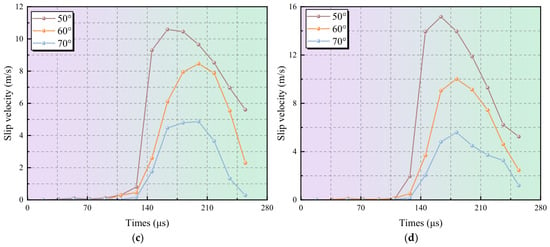
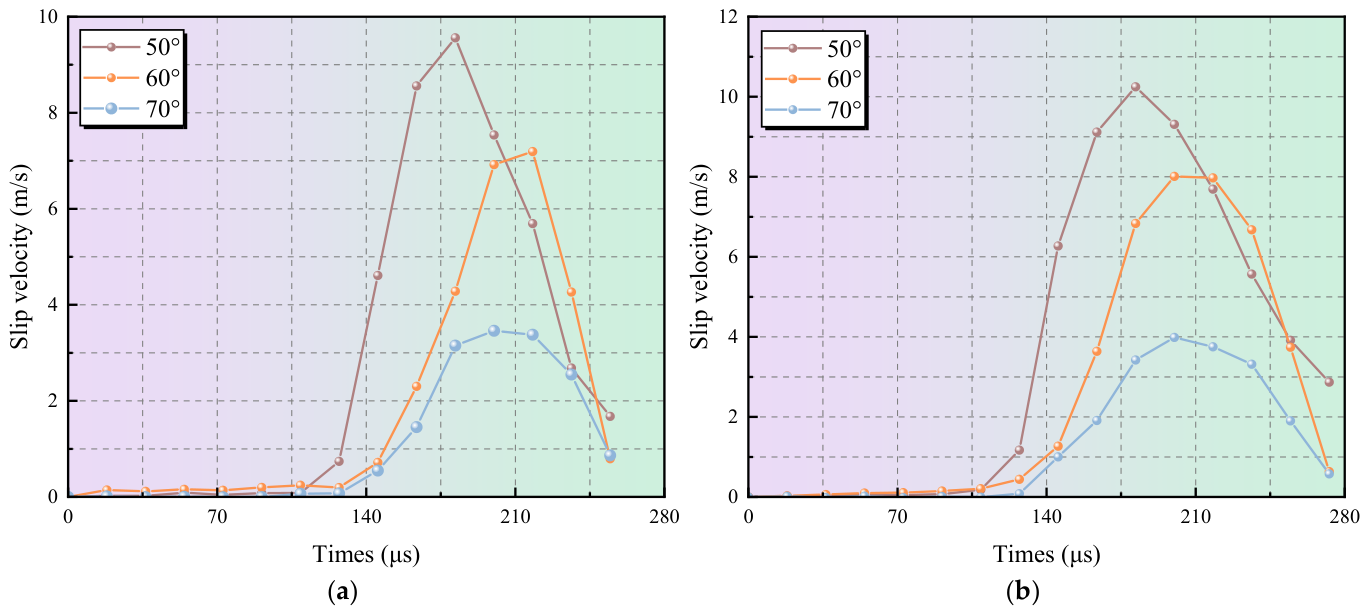
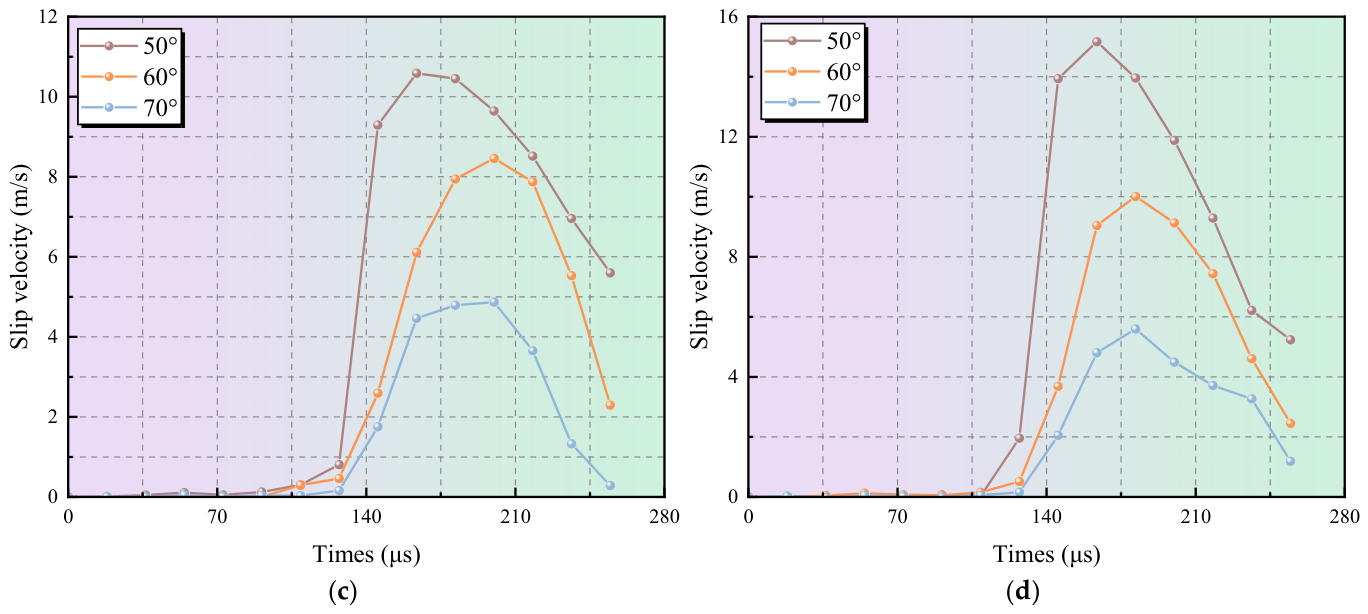
Slip velocity Vs is an important parameter for characterizing the dynamic slip behavior of jointed rock masses. It reflects the instantaneous development intensity of joint slip and the abruptness of slip instability. Slip velocity is defined as the first derivative of joint slip displacement Ds with respect to time t. Figure 16 shows the time–history curves of slip velocity for the 50°, 60°, and 70° jointed rock masses under different impact pressures. Overall, the slip velocity of all specimens shows a clear pulse-like evolution. The velocity is low during the early loading stage, then increases rapidly and reaches a peak, and finally decays gradually after the peak. From 109.08 to 127.26 μs, the slip velocity of each specimen remains relatively low. This indicates that the relative displacement between the two sides of the joint is still in the initial development stage. After 127.26 μs, the slip velocity increases rapidly. This indicates rapid development of relative slip across the joint, and the specimen enters the accelerated slip stage. After the peak velocity is reached, the slip velocity gradually decreases. This suggests that joint slip changes from rapid development to decelerated slip and residual deformation.
Figure 16.
Slip velocity curves of jointed rock masses under different impact pressures: (a) 0.06 MPa; (b) 0.07 MPa; (c) 0.08 MPa; (d) 0.09 MPa.
Unlike the shear-slip behavior of rough joints, the present study focuses on planar joints, which exhibit different stages of dynamic slip evolution. For example, Li et al. [17] used sawtooth-shaped joints to represent rough joints with pronounced surface asperities. During shear, such joints undergo not only relative displacement along the joint plane, but also geometric interlocking, asperity climbing, and dilation, causing the shear resistance of the joint to evolve continuously. Consequently, after the initial slip causes a drop in shear stress, the shear stress can accumulate again, resulting in a distinct secondary stress accumulation stage. In contrast, planar joints lack pronounced geometric interlocking and dilation. Once slip is initiated, the joint rapidly enters an accelerated slip stage under sustained impact loading; after the slip velocity reaches its peak, it gradually decreases and eventually develops into residual slip. Overall, the dynamic slip of rough joints is jointly governed by geometric interlocking, dilation, and the evolution of normal constraint induced by surface asperities, whereas slip along planar joints is mainly characterized by sustained relative motion after the shear resistance is overcome. As a result, the two types of joints exhibit different stages of slip evolution.
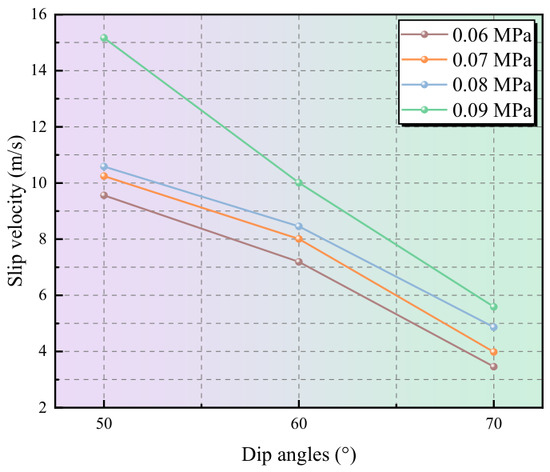
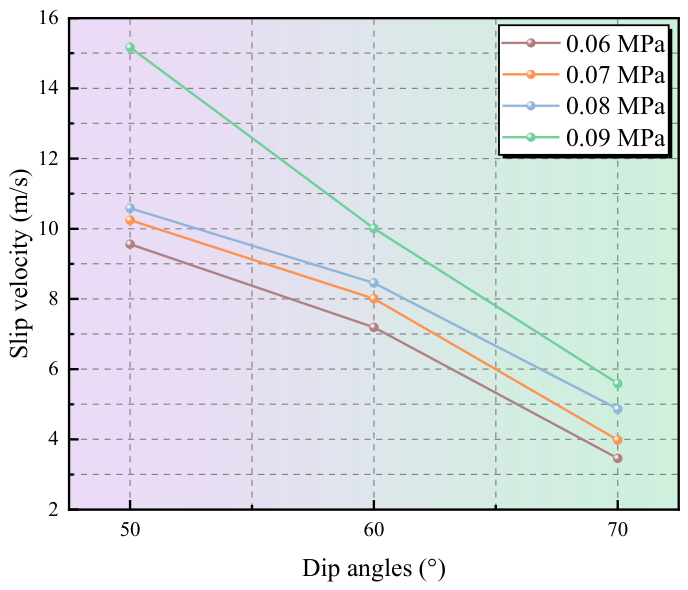
Figure 17 further shows the variation in peak slip velocity with joint dip angle and impact pressure. It provides additional evidence for the dynamic slip instability characteristics of jointed rock masses. Overall, the peak slip velocity decreased continuously with increasing joint dip angle. The 50° specimen exhibited the highest peak slip velocity, ranging from approximately 9.56 to 15.17 m/s, followed by the 60° specimen at approximately 7.19–10.00 m/s, while the 70° specimen showed the lowest values of approximately 3.49–5.59 m/s. Compared with the 50° specimen, the peak slip velocity decreased by 24.8–34.1% for the 60° specimen and by 63.2–63.5% for the 70° specimen. These results indicate that joints with different dip angles exhibit significant differences in the instantaneous intensity of slip development.
Figure 17.
Variation in peak slip velocity with dip angle and impact pressure.
At the same joint dip angle, the peak slip velocity generally increased with increasing impact pressure, indicating that stronger impact loading significantly promotes rapid joint slip. This trend is consistent with previous studies. Xiao et al. [19] reported that fault slip rate under impact loading exhibits a distinct acceleration–peak–decay evolution, while the dynamic shear tests of Yao et al. [20] and Xie et al. [21] likewise showed that increasing dynamic loading promotes joint slip development. The present results further indicate that the enhancement of rapid slip is not governed solely by loading intensity, but is also modulated by the stress state on the joint plane. As the joint dip angle increases, the normal constraint on the joint becomes stronger, whereas the tangential stress component along the joint decreases, thereby suppressing rapid relative movement between the rock blocks on the two sides of the joint. These results indicate that impact loading governs the driving level of dynamic slip, while the joint dip angle further controls the instantaneous intensity of slip development by altering the stress state on the joint plane.
3.4. Dynamic Failure Characteristics of Jointed Rock Masses
3.4.1. Dynamic Failure Process
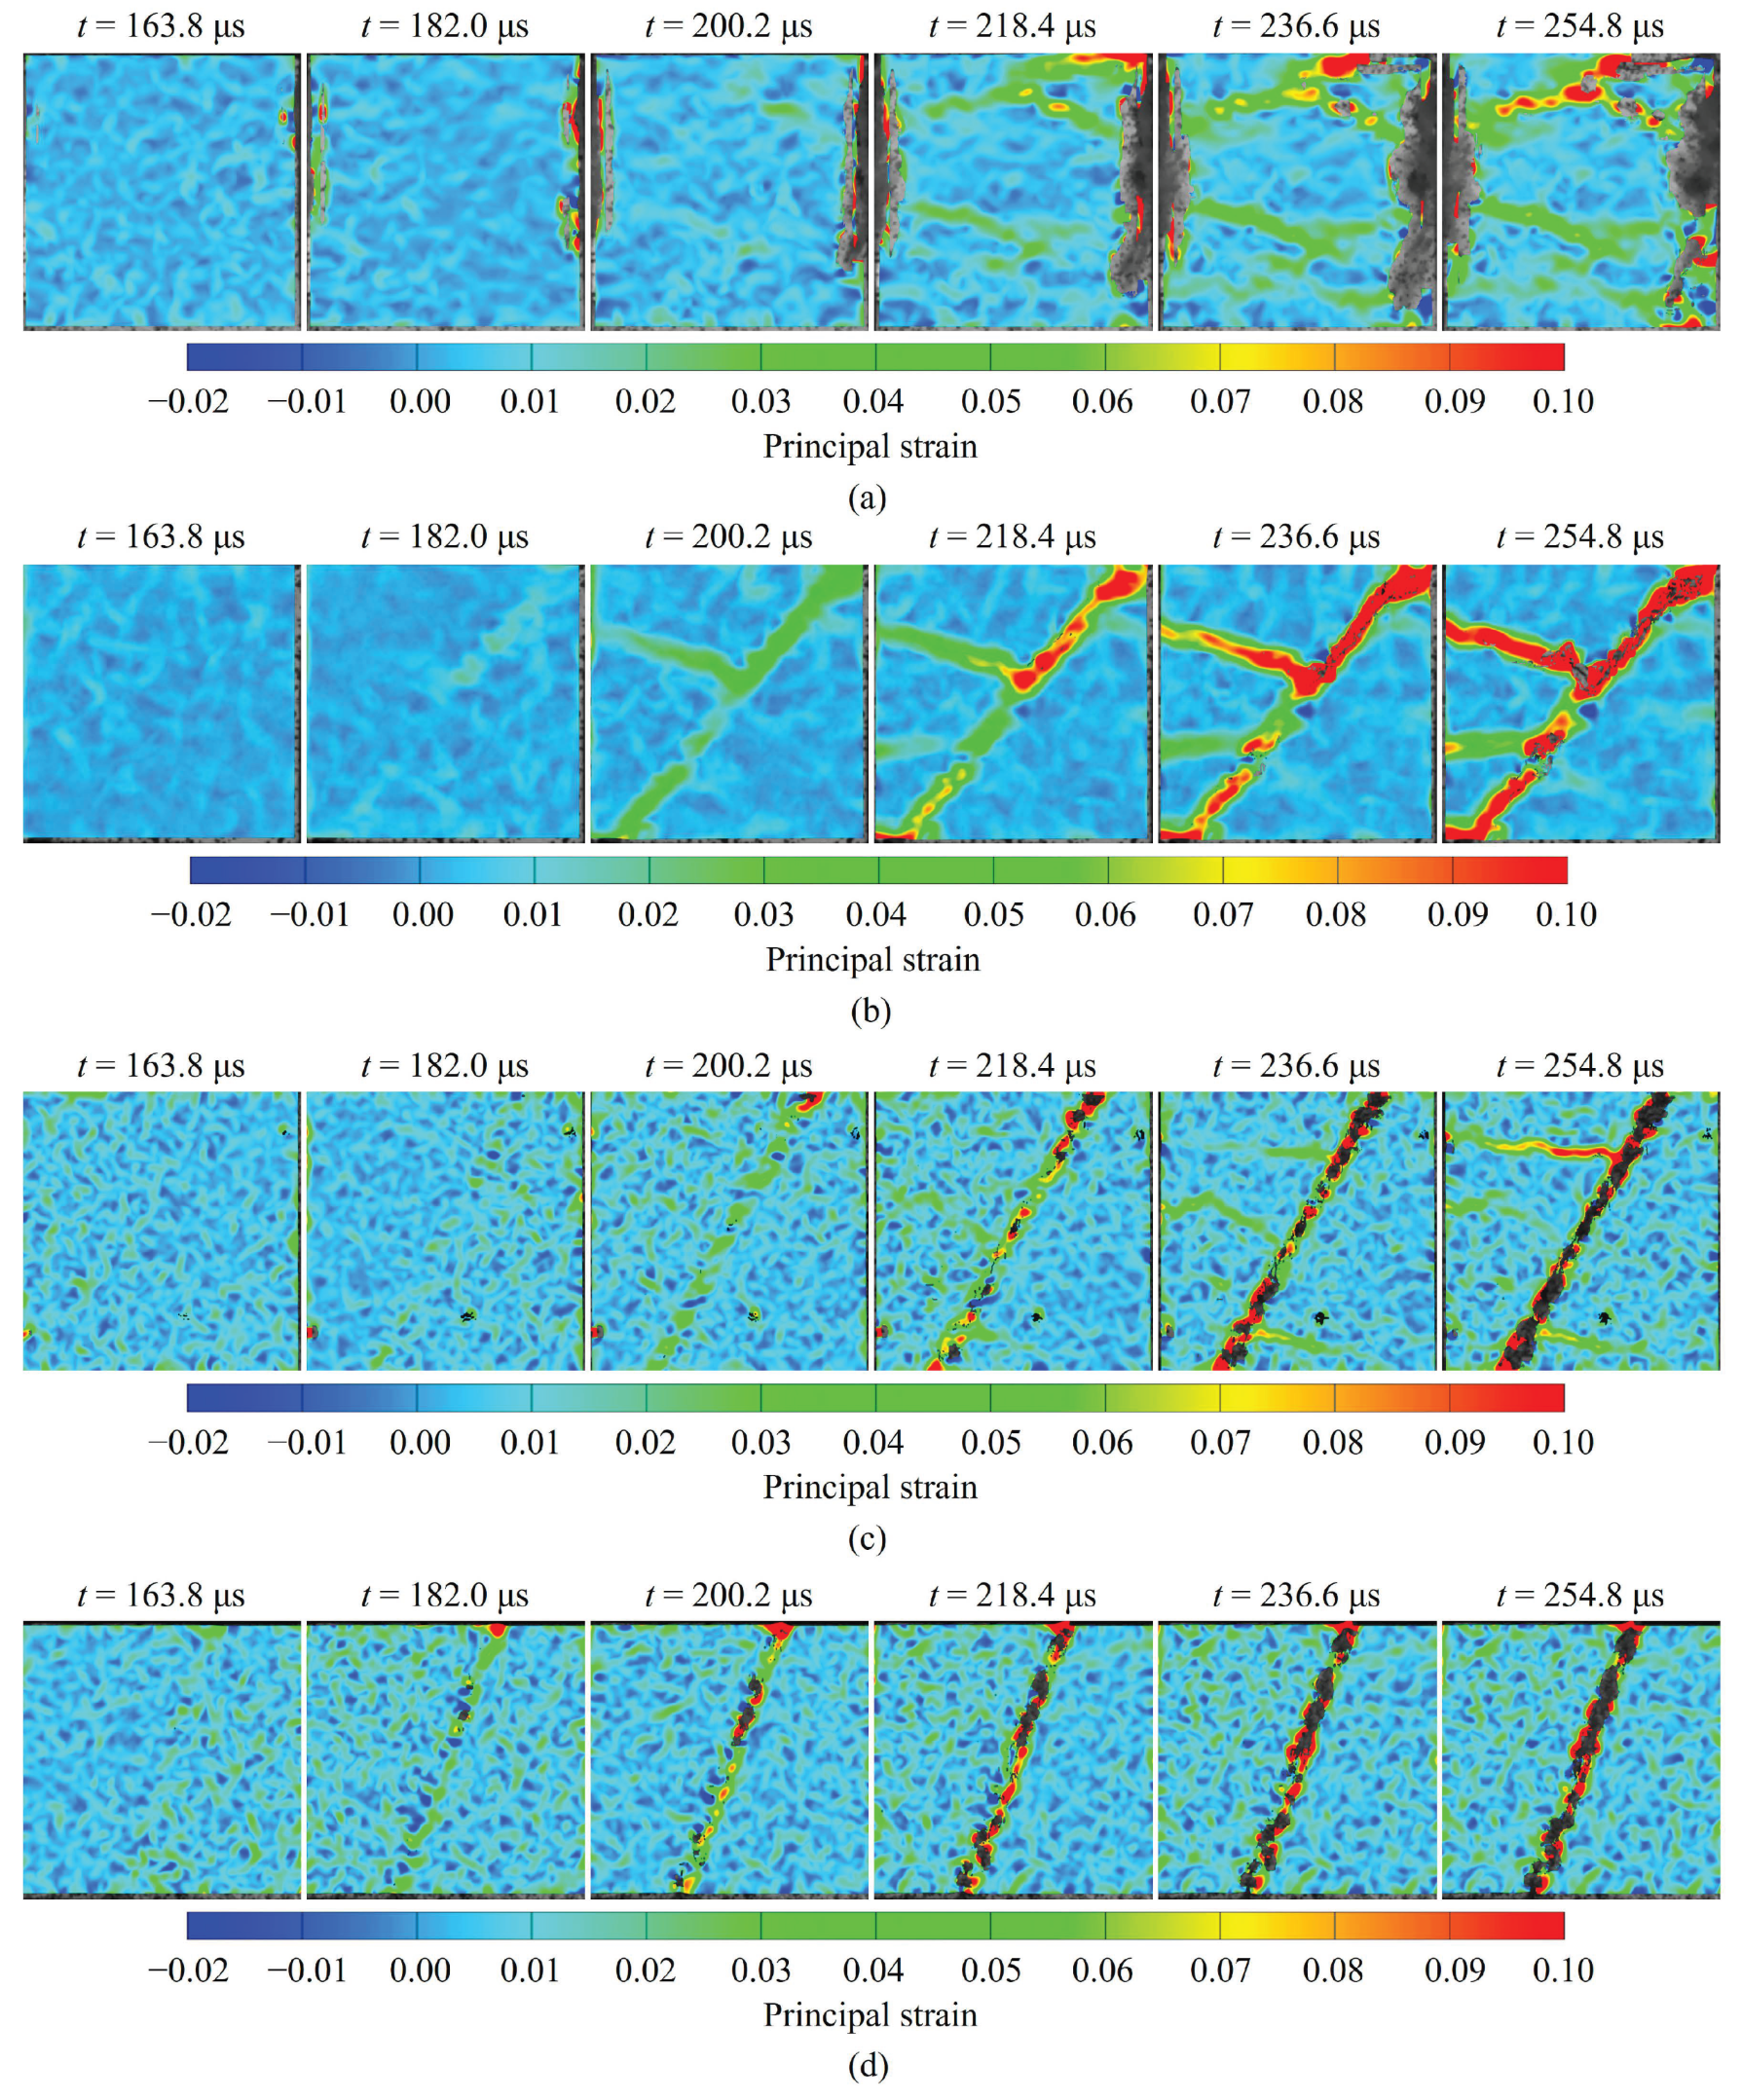
Joint slip is not limited to relative movement between the rock blocks on the two sides of the joint. It can also modify the local stress state inside the specimen and induce crack initiation, propagation, and coalescence. To further reveal the relationship between joint slip and crack propagation, this section analyzes the crack evolution process of jointed rock masses with different dip angles based on the DIC maximum principal strain field. Taking an impact pressure of 0.08 MPa as an example, the evolution of the maximum principal strain field is shown in Figure 18. Overall, the dynamic failure processes of the intact and jointed rock masses are markedly different. For the intact rock mass (Figure 18a), the specimen has relatively good structural integrity. The strain distribution is relatively uniform during the early loading stage. As impact loading continues, the specimen eventually exhibits brittle failure controlled by the rock matrix. For the jointed rock masses, the joint is a zone of abrupt change in material properties and geometry. It weakens the overall continuity of the specimen and alters the stress wave propagation path and local stress distribution. The results show that high-strain zones first concentrate near the joint and then develop along the joint direction. Meanwhile, joint slip causes strain concentration at the joint tips and local contact zones. This further promotes crack initiation and propagation in the rock matrix.
Figure 18.
Strain fields of intact and jointed rock mass specimens: (a) intact rock mass; (b) dip angle 50°; (c) dip angle 60°; (d) dip angle 70°.
For the 50° specimen (Figure 18b), the tangential stress component on the joint is relatively large, whereas the normal constraint is relatively weak. Therefore, the joint is more easily activated under impact loading. Strain concentration gradually appears near the joint at 182 μs and then extends along the joint direction. With the rapid development of joint slip, deformation incompatibility between the rock blocks on both sides of the joint becomes more pronounced. Stress concentration then occurs in local contact zones of the joint, causing the high-strain zone to extend into the rock matrix. At 200.2 μs, a high-strain band has already formed in the block on the left side of the joint. As impact loading continues, more high-strain bands develop, eventually leading to macroscopic failure. For the 60° specimen (Figure 18c), joint slip is less pronounced. After 218.4 μs, high-strain zones begin to appear on both sides of the joint and gradually expand under continued impact loading. Compared with the 50° specimen, the high-strain zones in the 60° specimen have a smaller spatial extent. This indicates that matrix damage induced by joint slip is weakened as the joint dip angle increases. For the 70° specimen (Figure 18d), the normal constraint on the joint is further enhanced. The deformation compatibility between the rock blocks on both sides of the joint is therefore improved. As a result, local stress concentration induced by joint slip is weakened. The high-strain zones are mainly concentrated near the joint and its adjacent regions, with no obvious tendency to extend into the rock matrix.
In summary, the joint is a preferential zone for strain concentration and damage development under impact loading. For joints with lower dip angles, the tangential stress component is larger. Rapid relative movement between the rock blocks on both sides of the joint is therefore more likely to occur. This induces high strain concentration at the joint tips and local contact zones, further promoting crack propagation in the rock matrix. As the joint dip angle increases, the normal constraint becomes stronger and slip development is restricted. The extent of crack propagation gradually decreases, and failure tends to be more localized near the joint and its adjacent regions.
3.4.2. Macroscopic Failure Mode
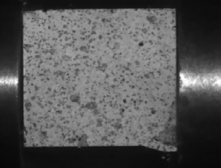
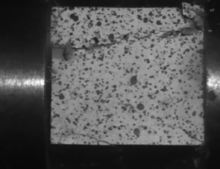
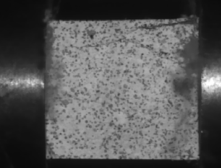
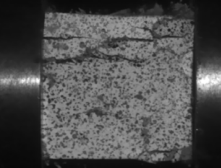
Table 4 shows the macroscopic failure morphologies of the intact and jointed rock masses. For the intact rock mass, the macroscopic failure mode is mainly controlled by crack initiation, propagation, and coalescence in the rock matrix. At an impact velocity of 3.5 m/s, the specimen mainly undergoes local crushing failure. When the impact velocity increases to 4.52 m/s and 5.54 m/s, the number of main cracks increases, and the cracks gradually propagate. The specimen eventually exhibits axial tensile and shear failure. When the impact velocity further increases to 5.92 m/s, the velocity-strengthening effect becomes more pronounced. Distributed cracks are rapidly generated inside the specimen, resulting in relatively severe failure.
Table 4.
Macroscopic failure patterns of intact and jointed rock masses.
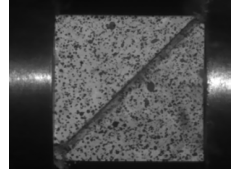
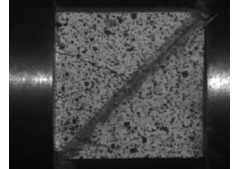
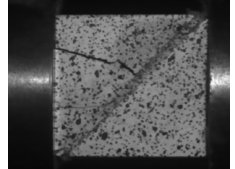
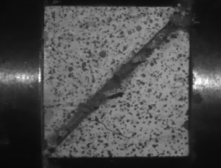
The macroscopic failure morphologies of the jointed rock masses show that the presence of the joint significantly changes the failure path of the specimen. The joint becomes an important zone for deformation and damage development under impact loading. Jointed rock masses with different dip angles all exhibit failure characteristics dominated by shear slip along the joint. When the joint dip angle is 50°, shear slip along the joint is the most pronounced, and failure is mainly concentrated near the joint. As the impact velocity increases, local damage near the joint increases, accompanied by tensile cracks in the rock matrix. However, the failure mode remains dominated by joint slip. When the joint dip angle is 60°, the degree of slip decreases. At lower impact velocities, the specimen mainly undergoes shear slip along the joint. When the impact velocity increases to 5.48 m/s and 5.91 m/s, joint slip further induces crack propagation in the rock matrix, and the failure mode changes. When the joint dip angle increases to 70°, the normal constraint on the joint becomes stronger, and shear slip along the joint is restricted to some extent. At lower impact velocities, failure is mainly concentrated near the joint, showing shear slip failure along the joint. When the impact velocity increases to 5.95 m/s, joint slip intensifies, and crack propagation in the rock matrix further develops. The specimen eventually undergoes severe instability failure.
Overall, the macroscopic failure mode of jointed rock masses is jointly controlled by joint dip angle and impact-loading intensity. Specimens with lower joint dip angles have a larger tangential stress component and weaker normal constraint. They are therefore more prone to shear slip along the joint, and their failure is mainly controlled by interfacial slip. As the joint dip angle increases, the normal constraint on the joint becomes stronger, and the degree of joint slip gradually decreases. Under low-to-moderate impact velocities, failure is mainly localized near the joint and its adjacent regions. Meanwhile, increasing impact velocity enhances strain concentration and crack propagation in the rock matrix. The failure mode therefore changes gradually from joint-slip-dominated failure to a coupled mode controlled by both joint slip and matrix crack propagation. These results further indicate that joint slip is not only a direct manifestation of dynamic instability in jointed rock masses, but also an important driving factor for local crack propagation and the transition of macroscopic failure modes.
3.5. Energy Dissipation Behavior
Rock mass failure under impact loading is essentially the result of energy input, propagation, absorption, and dissipation. To further reveal the energy conversion mechanism of jointed rock masses under impact loading, the energy evolution process was analyzed based on one-dimensional stress wave theory. The energy evolution can be calculated using Equation (10) [42]. In addition, a preliminary free-bar calibration test was conducted on the SHPB apparatus, and the results indicated that the energy loss of stress waves during propagation in the pressure bars was small. Therefore, the energy loss associated with stress-wave propagation in the pressure bars was neglected in the energy calculations.
where Ei, Er, and Et are the incident wave energy, reflected wave energy, and transmitted wave energy, respectively. A0 is the cross-sectional area of the pressure bar. εi(t), εr(t), and εt(t) are the incident strain, reflected strain, and transmitted strain, respectively. E0 and C0 are the elastic modulus and wave velocity of the pressure bar, respectively. According to the law of energy conservation, the dissipated energy Ea can be expressed as follows [43,44]:
Ea = Ei − Er − Et
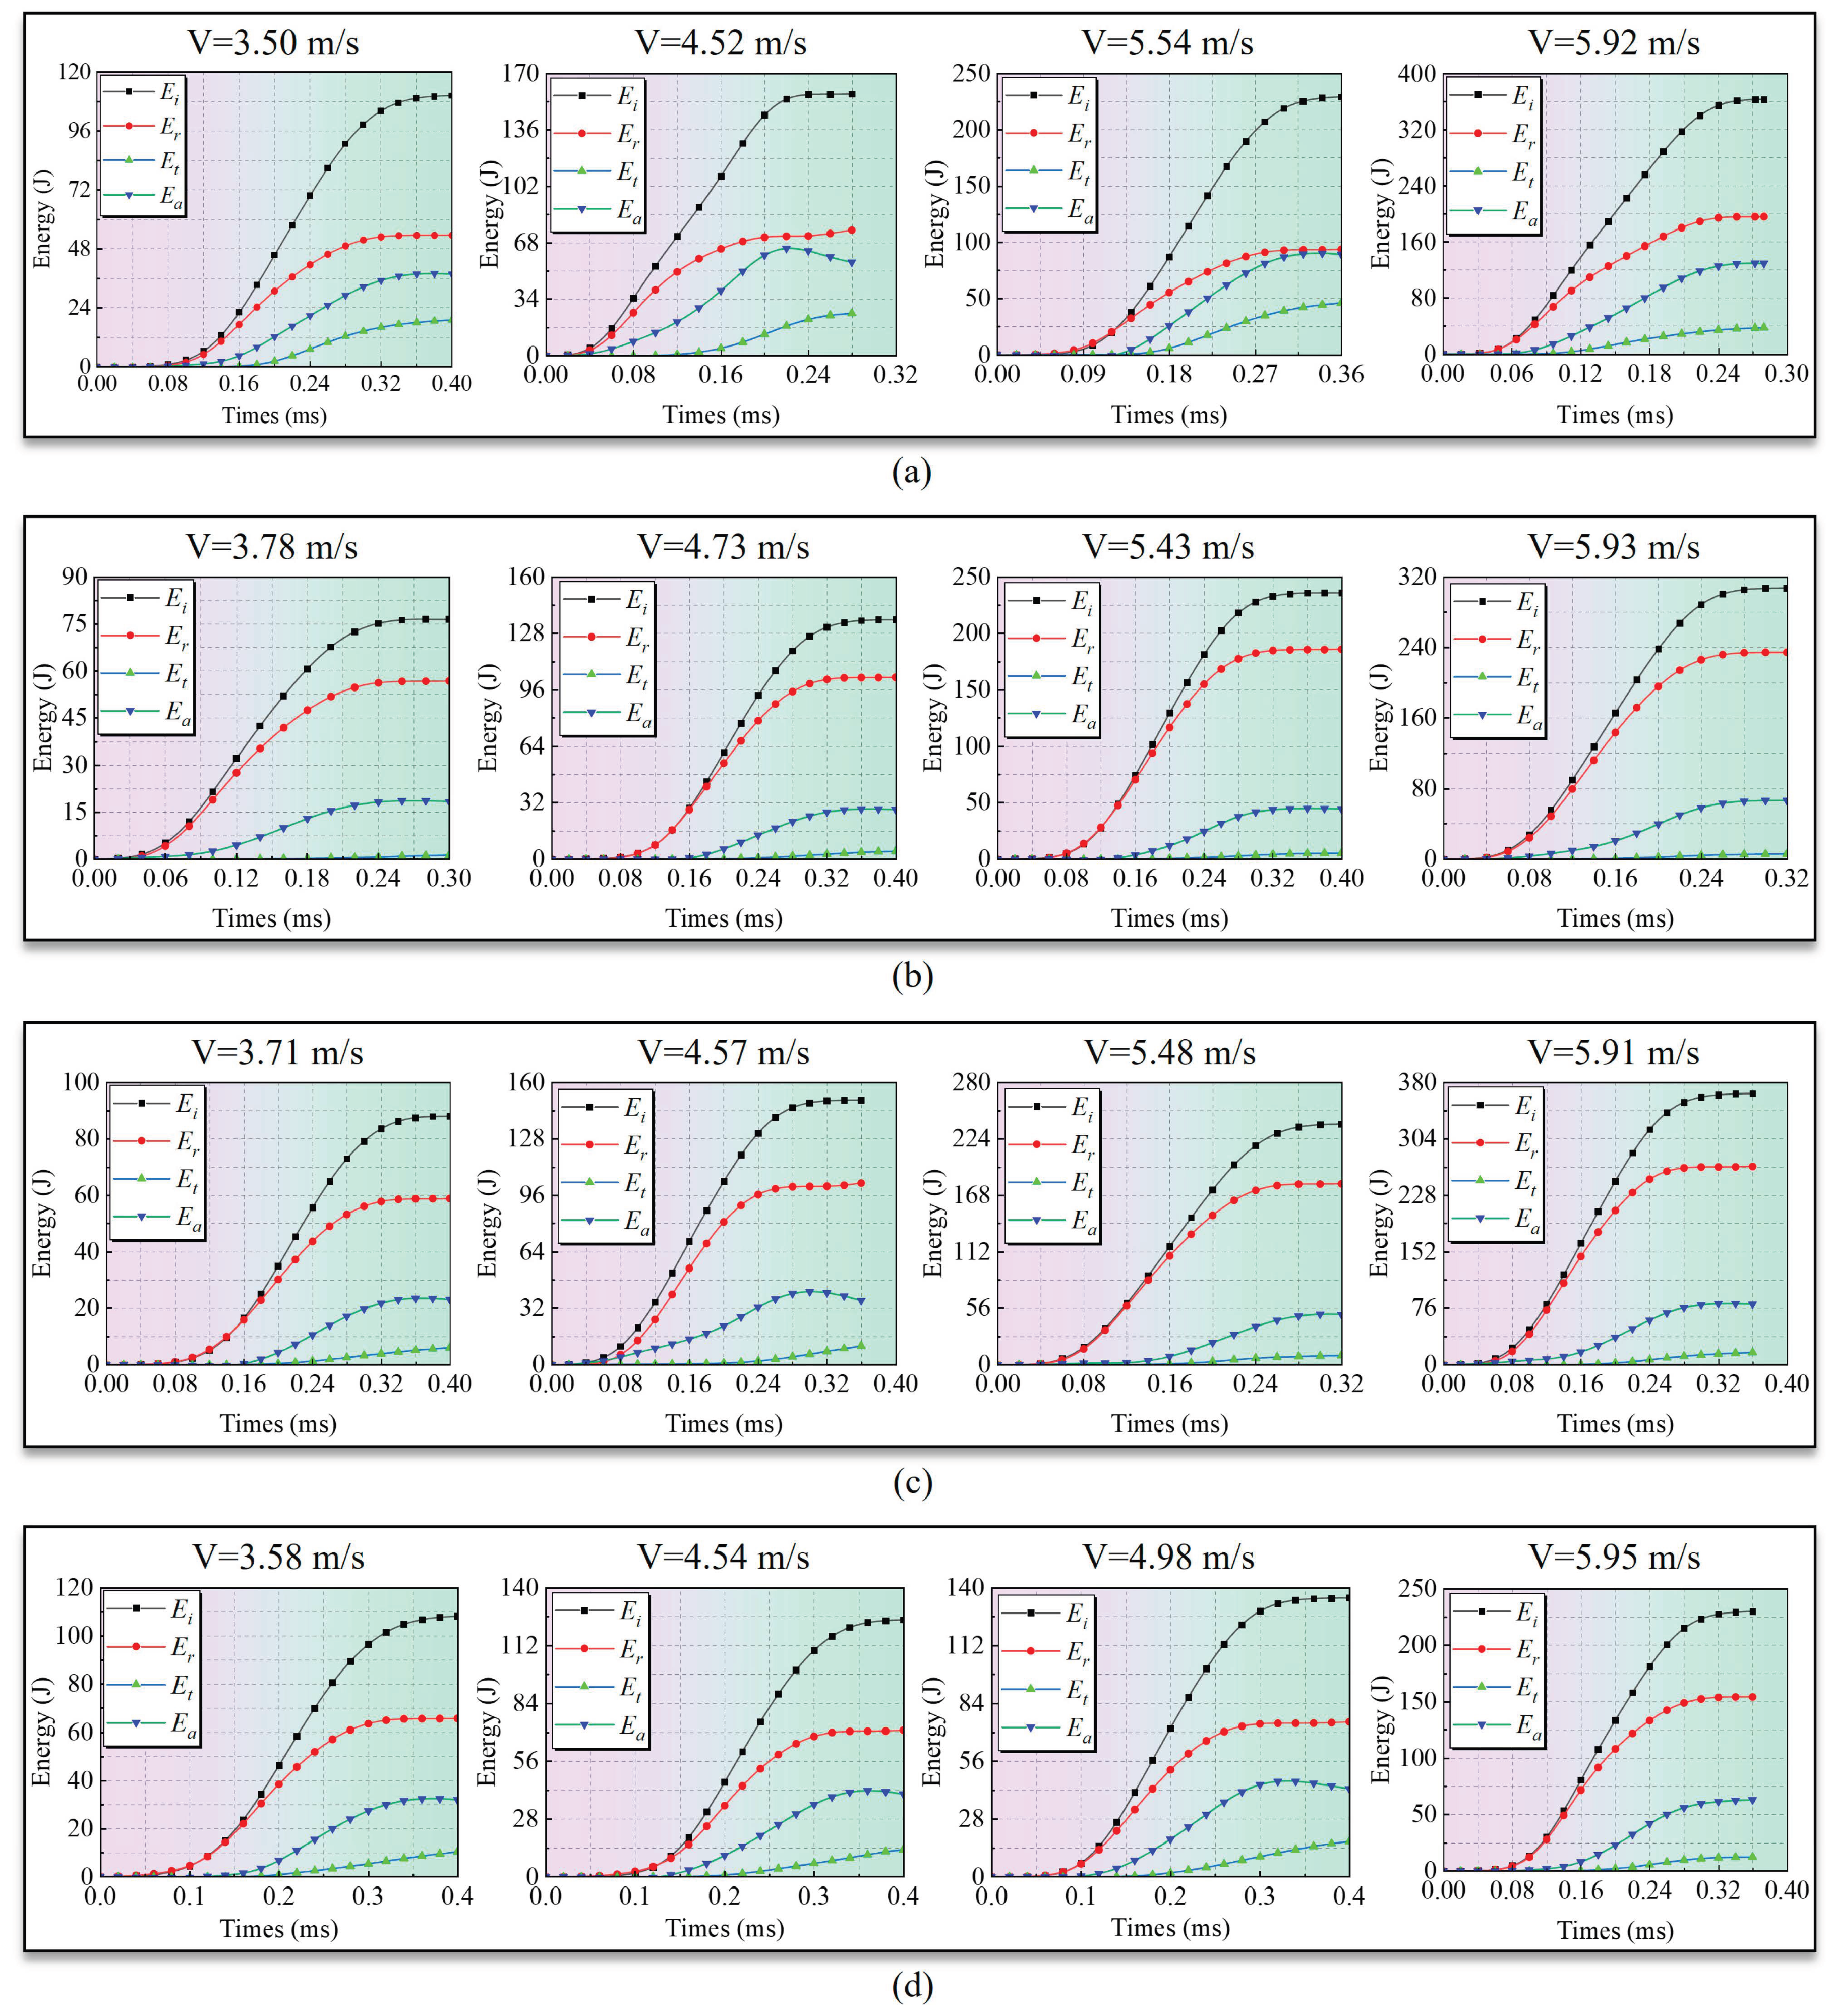
Figure 19 shows the energy evolution processes of the intact rock mass and jointed rock mass specimens with different dip angles under impact loading. Overall, the energy evolution of all specimens exhibits clear staged characteristics. During the early loading stage, the input incident energy is relatively low. The specimens mainly undergo elastic deformation and local joint compression, and the absorbed energy increases slowly. As impact loading continues, the incident energy increases rapidly. Joint slip, interfacial friction, and damage in the rock matrix gradually develop, causing the absorbed energy to increase sharply. In the later loading stage, the impact load is gradually released. Crack propagation and joint slip tend to stabilize, and all energy curves eventually enter a stable stage.
Figure 19.
Energy evolution curves of intact and jointed rock mass specimens: (a) intact rock mass; (b) dip angle 50°; (c) dip angle 60°; (d) dip angle 70°.
A comparison between the intact and jointed rock masses shows that the presence of the joint significantly changes the propagation and dissipation paths of impact energy. For the intact rock mass, the internal structure is relatively continuous. Stress wave energy can pass through the specimen more effectively, and the absorbed energy is mainly consumed by crack initiation, crack propagation, and local fragmentation in the rock matrix. By contrast, the jointed rock mass contains a clear interface with wave impedance discontinuity. This causes stronger reflection of the incident energy at the joint and reduces the proportion of transmitted energy. The joint interface not only weakens energy transfer between the rock blocks on the two sides of the joint, but also changes the energy dissipation mechanism of the specimen. Energy is dissipated through joint compression, interfacial slip, frictional work, and local damage. This indicates that the joint interface acts as a significant barrier to impact energy propagation.
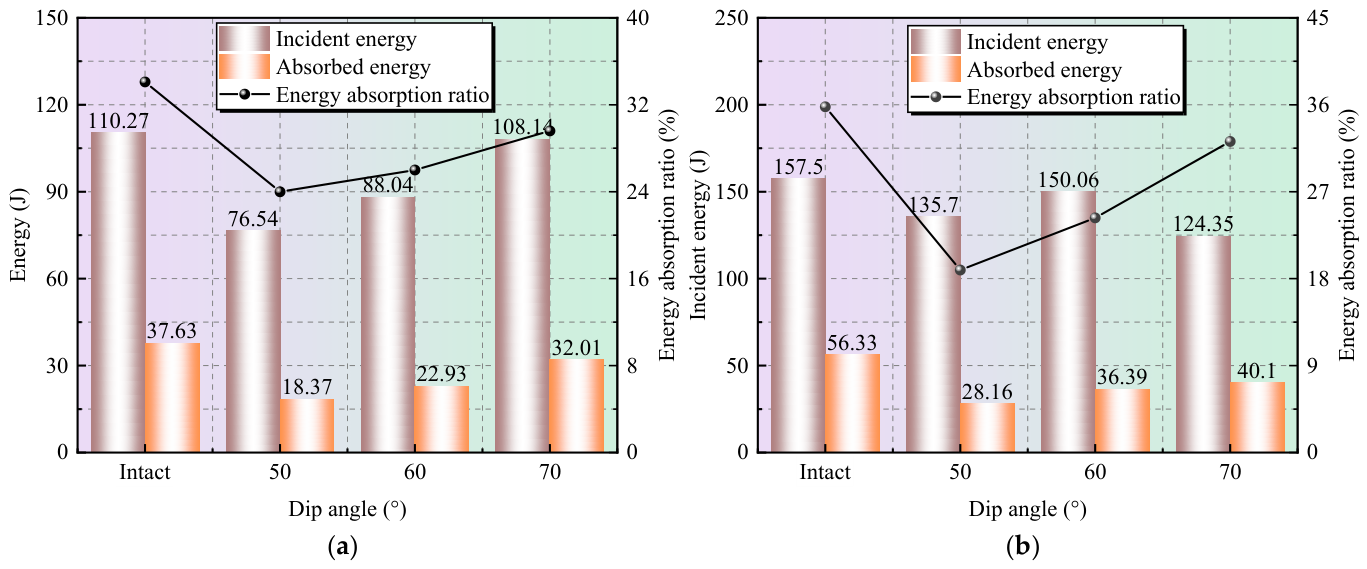
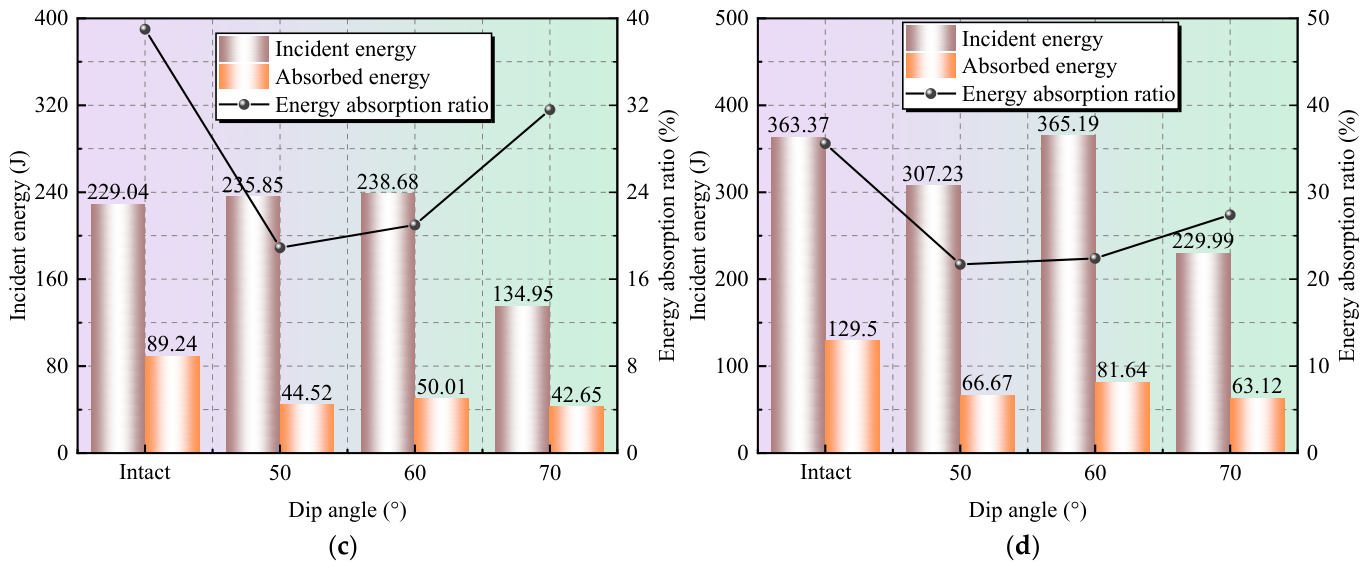
To further characterize the distribution of incident energy in the specimen, the energy transmission ratio Te, energy reflection ratio Re, and energy absorption ratio De are defined as the ratios of transmitted energy Et, reflected energy Er, and dissipated energy Ea to incident energy Ei, respectively [45], as given in Equation (12):
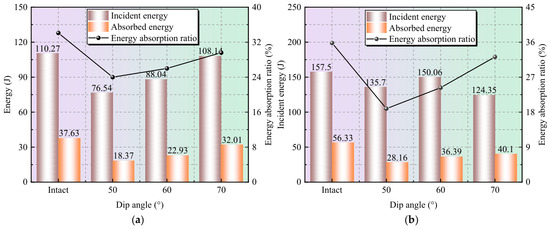
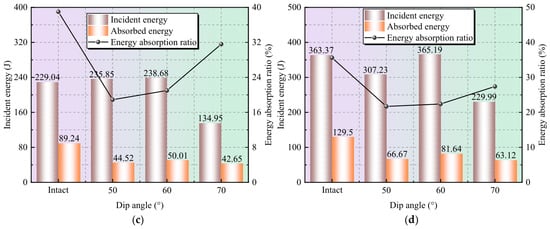
Table 5 lists the energy parameters under different conditions and Figure 20 shows the energy dissipation behavior of the intact and jointed rock masses under different impact pressures. The results show that the energy dissipation ratio of the intact rock mass ranges from 34.1% to 39.0% under different impact loading intensities, remaining at the highest level. Its energy dissipation is mainly associated with plastic deformation of the rock matrix, crack initiation and propagation, and local fragmentation. By contrast, the energy dissipation ratio of the jointed rock masses is generally lower than that of the intact rock mass. This is related to the presence of the weak plane. As a weak plane in the rock mass, the joint changes the energy dissipation mechanism. Under impact loading, energy in the jointed rock mass is mainly dissipated through joint compression deformation, shear slip, and induced local failure. Jointed rock masses are prone to slip instability along weak structural planes, which allows part of the input energy to be released through interfacial slip. As a result, damage in the rock matrix is relatively limited, and the jointed rock masses show a relatively low energy dissipation level.
Table 5.
Statistical summary of energy parameters for jointed rock mass specimens.
Figure 20.
Energy dissipation behavior of intact and jointed rock masses under different impact pressures: (a) 0.06 MPa; (b) 0.07 MPa; (c) 0.08 MPa; (d) 0.09 MPa.
The jointed specimens with different dip angles exhibit different energy dissipation ratios. The 50° specimen has a larger slip displacement and a higher slip velocity. This indicates that rapid slip instability is more likely to occur along the joint, allowing part of the input energy to be released through interfacial slip. As a result, its energy dissipation ratio is relatively low. As the joint dip angle increases, the normal constraint on the joint becomes stronger, and interfacial friction is enhanced. Joint slip is therefore suppressed to some extent, which increases the energy dissipation ratio.
4. Conclusions
In this study, dynamic loading tests were conducted on jointed rock masses with different dip angles under impact loading using an SHPB test system, combined with high-speed photography and DIC. The effects of joint dip angle and impact loading intensity on the slip failure behavior of jointed rock masses were investigated. The main conclusions are as follows:
(1) The presence of joints significantly deteriorated the dynamic load-bearing capacity of the specimens and their stress-wave transmission capability. As the joint dip angle increased from 50° to 70°, the dynamic load-bearing capacity and stress-wave transmission generally increased, while wave reflection correspondingly decreased. With increasing impact loading intensity, the dynamic strength of the jointed specimens at all dip angles showed an overall increasing trend; however, the stress-wave transmission capability did not exhibit a consistent monotonic variation.
(2) Under impact loading, joint slip approximately undergoes three stages: initial development, accelerated slip, and decelerated slip. As the joint dip angle increases, joint slip is suppressed, mainly manifested by decreases in slip displacement and peak slip velocity. Among the tested specimens, the 50° jointed specimen exhibits the largest slip displacement and peak slip velocity, whereas the 70° jointed specimen shows the weakest slip response. With increasing impact loading intensity, joint slip is generally enhanced, with both slip displacement and peak slip velocity showing increasing trends.
(3) The joint significantly altered the spatial distribution of surface deformation and failure in the specimens, with high-strain zones mainly concentrated along the joint and in its adjacent regions. As the joint dip angle increased, joint slip was reduced and the extension of the high-strain zones into the rock-like matrix became less pronounced. With increasing impact loading intensity, matrix cracking and local failure became more evident.
(4) The joint acts as a barrier to energy propagation. A large portion of the input energy is reflected at the joint, resulting in a reduction in transmitted energy. The joint also changes the energy dissipation mechanism of the rock mass. The input energy is mainly dissipated through joint compression deformation, shear slip, and induced local failure. The energy dissipation ratio increases with increasing joint dip angle.
Research Limitations
This study still has several limitations due to constraints in the experimental conditions and research scope. Cement mortar rock like specimens were used, and their material composition and joint characteristics differ to some extent from those of natural rock masses. In addition, only a single artificial persistent joint was considered, with joint dip angles limited to 50–70°, which cannot fully represent more complex joint configurations or a broader range of joint orientations. Moreover, two-dimensional DIC was employed to characterize the full-field deformation on the specimen surface, which has inherent limitations in capturing three-dimensional deformation and failure behavior. Future studies will further consider natural rock joints and a broader range of joint dip angles to improve the understanding of the dynamic slip and failure characteristics of jointed rock masses under impact loading.
Author Contributions
Conceptualization, G.D.; methodology, G.D.; validation, Y.C.; formal analysis, C.L.; investigation, Y.H.; resources, L.Z.; data curation, Y.W.; writing—original draft preparation, G.D.; writing—review and editing, G.D.; visualization, C.L.; supervision, C.L.; project administration, L.Z.; funding acquisition, C.L. All authors have read and agreed to the published version of the manuscript.
Funding
This research received no external funding.
Institutional Review Board Statement
Not applicable.
Informed Consent Statement
Not applicable.
Data Availability Statement
The original contributions presented in this study are included in the article. Further inquiries can be directed to the corresponding author.
Conflicts of Interest
The authors declare no conflicts of interest.
References
- Wu, S.Y.; Shen, M.B.; Wang, J. Jinping hydropower project: Main technical issues on engineering geology and rock mechanics. Bull. Eng. Geol. Environ. 2010, 69, 325–332. [Google Scholar] [CrossRef] [Scilit]
- Zhang, D.L.; Sun, Z.Y.; Fang, Q. Scientific problems and research proposals for Sichuan-Tibet railway tunnel construction. Undergr. Space 2022, 7, 419–439. [Google Scholar] [CrossRef] [Scilit]
- He, M.C.; Wang, Q. Rock dynamics in deep mining. Int. J. Min. Sci. Technol. 2023, 33, 1065–1082. [Google Scholar] [CrossRef] [Scilit]
- Xin, C.L.; Feng, W.K.; Song, D.Q.; Huang, S.; Liu, X. Seismic damage to non-fault-crossing and fault-crossing tunnels: Comparative study of the 2008 Wenchuan earthquake (Mw 7.9) and the 2022 Menyuan earthquake (Mw 6.7). Eng. Fail. Anal. 2024, 166, 108843. [Google Scholar] [CrossRef] [Scilit]
- Yu, P.Y.; Ding, X.L.; Huang, S.L.; Pan, P.-Z.; Zhang, Y.; He, J.; He, J.; Han, G. Deformation characteristics of surrounding rock in a large underground opening under high in situ stress and complex rock mass structures: A case study of yebatan hydropower station. Rock Mech. Rock Eng. 2026. Epub ahead of printing. [Google Scholar] [CrossRef] [Scilit]
- Li, P.; Liu, Y.; Zhang, J.; Guo, Q.; Tang, C.; Wang, M.; Cai, M. Failure features and support design of the tunnel surrounding rock in fractured rock masses in a deep mine exposed to blasting disturbance. Eng. Fract. Mech. 2026, 335, 111920. [Google Scholar] [CrossRef] [Scilit]
- Serdaliyev, Y.; Iskakov, Y. Research into mass stress and failure zone parameters during blasting of fractured high benches using blasthole charges. Min. Miner. Depos. 2024, 18, 98–108. [Google Scholar] [CrossRef] [Scilit]
- Petlovanyi, M.; Sai, K. Numerical modelling of critical conditions for the onset of a limit state in the rock mass surrounding unfilled underground voids in iron ore deposits. Eng. J. Satbayev Univ. 2026, 148, 38–47. [Google Scholar] [CrossRef] [Scilit]
- Heuze, F.E.; Morris, J.P. Insights into ground shock in jointed rocks and the response of structures there-in. Int. J. Rock Mech. Min. Sci. 2007, 44, 647–676. [Google Scholar] [CrossRef] [Scilit]
- Li, D.Y.; Han, Z.Y.; Zhu, Q.Q.; Zhang, Y.; Ranjith, P. Stress wave propagation and dynamic behavior of red sandstone with single bonded planar joint at various angles. Int. J. Rock Mech. Min. Sci. 2019, 117, 162–170. [Google Scholar] [CrossRef] [Scilit]
- Zhou, X.P.; Gu, S.Y. Dynamic mechanical properties and cracking behaviours of persistent fractured granite under impact loading with various loading rates. Theor. Appl. Fract. Mech. 2022, 118, 103281. [Google Scholar] [CrossRef] [Scilit]
- Cen, D.F.; Wei, S.G.; Guo, Y.Q.; Yong, R. Experimental investigation on dynamic compression-shear properties and strength criterion of frozen soil-filled joints. Bull. Eng. Geol. Environ. 2026, 85, 124. [Google Scholar] [CrossRef] [Scilit]
- Bennouna, R.; Ouadif, L.; Akhssas, A.; Senhaji, A.S.; Boulaid, G. Wedge stability analysis in fractured soft rock slopes for different orientations of seismic components. Min. Miner. Depos. 2024, 18, 1–8. [Google Scholar] [CrossRef] [Scilit]
- Ji, H.Q.; Liu, R.C.; Yu, L.Y.; Zhu, X. Influence of joint inclination on mechanical behaviors of shales during unloading-induced slip processes. Int. J. Rock Mech. Min. Sci. 2023, 170, 105487. [Google Scholar] [CrossRef] [Scilit]
- Wei, Y.; Li, J.C.; Li, X.; Jin, J. Slip behaviors of rock joints subjected to weak shear disturbances: An experimental study. Eng. Geol. 2025, 350, 107971. [Google Scholar] [CrossRef] [Scilit]
- Wang, B.; He, B.G.; Lin, B. Shear failure behavior of rock under high-stress and multidirectional dynamic disturbances: Insights from true triaxial double-sided shear tests. Int. J. Rock Mech. Min. Sci. 2026, 202, 106490. [Google Scholar] [CrossRef] [Scilit]
- Li, J.C.; Yuan, W.; Li, H.B.; Zou, C. Study on dynamic shear deformation behaviors and test methodology of sawtooth-shaped rock joints under impact load. Int. J. Rock Mech. Min. Sci. 2022, 158, 105210. [Google Scholar] [CrossRef] [Scilit]
- Yu, L.Y.; Wu, D.Y.; Su, H.J.; Geng, S.; Ju, M.; Li, Y.; Guo, J. Influences of fault slip induced by dynamic loading on the mechanical responses of tunnels. Tunn. Undergr. Space Tech. 2025, 160, 106533. [Google Scholar] [CrossRef] [Scilit]
- Xiao, H.F.; Gao, G.Y.; Xu, Y.; Wang, P.; Wu, N.; Huang, X. Influence of axial prestress and loading rate on dynamic fracture of pre-faulted granite. Eng. Fract. Mech. 2025, 328, 111535. [Google Scholar] [CrossRef] [Scilit]
- Yao, W.; Wang, C.L.; Xia, K.W.; Zhang, X. An experimental system to evaluate impact shear failure of rock discontinuities. Rev. Sci. Instrum. 2021, 92, 034501. [Google Scholar] [CrossRef] [Scilit]
- Xie, S.J.; Li, J.C.; Wang, S.Y.; Li, X. An experimental investigation on the dynamic shear characteristics of wet joints. Int. J. Rock Mech. Min. Sci. 2025, 194, 106193. [Google Scholar] [CrossRef] [Scilit]
- Tang, Q.T.; Xie, W.B.; Jing, S.G.; Wang, X.; Su, Z. Experimental and numerical investigation on the mechanical behavior of rock-like material with complex discrete joints. Rock Mech. Rock Eng. 2024, 57, 4493–4511. [Google Scholar] [CrossRef] [Scilit]
- Meng, Y.Y.; Jing, H.W.; Zhou, Z.F.; Zhang, L.; Sun, S. Experimental investigation on the mixed-mode fracture behavior of rock-like material with bedding plane. Theor. Appl. Fract. Mech. 2022, 117, 103159. [Google Scholar] [CrossRef] [Scilit]
- Cao, R.H.; Cao, P.; Lin, H.; Fan, X.; Zhang, C.; Liu, T. Crack initiation, propagation, and failure characteristics of jointed rock or rock-like specimens: A review. Adv. Civ. Eng. 2019, 2019, 6975751. [Google Scholar] [CrossRef] [Scilit]
- Li, Z.H.; Li, J.; Wang, M.Y.; Jiang, H.M.; Wu, H.X.; Pan, X.Y.; Chen, W.; Wang, D.R. Theoretical and experimental study on ground impact damage effect under large equivalent explosion. Part I: Field measurement analysis of ground impact failure phenomenon of deep buried caverns. Chin. J. Rock Mech. Eng. 2022, 41, 865–876. (In Chinese) [Google Scholar] [CrossRef]
- Cheng, R.S.; Chen, W.S.; Hao, H.; Li, J. A state-of-the-art review of road tunnel subjected to blast loads. Tunn. Undergr. Space Tech. 2021, 112, 103911. [Google Scholar] [CrossRef] [Scilit]
- Zhu, J.B.; Li, Y.S.; Peng, Q.; Deng, X.; Gao, M.; Zhang, J. Stress wave propagation across jointed rock mass under dynamic extension and its effect on dynamic response and supporting of underground opening. Tunn. Undergr. Space Tech. 2021, 108, 103648. [Google Scholar] [CrossRef] [Scilit]
- Cui, J.B.; Xie, L.F.; Qiao, W.; Qiu, L.; Hu, Z.; Wu, L. Study on blasting characteristics of rock mass with weak interlayer based on energy field. Sci. Rep. 2022, 12, 12698. [Google Scholar] [CrossRef] [Scilit]
- Qiu, J.D.; Xie, H.P.; Zhu, J.B.; Wang, J.; Deng, J. Dynamic response and rockburst characteristics of underground cavern with unexposed joint. Int. J. Rock Mech. Min. Sci. 2023, 169, 105442. [Google Scholar] [CrossRef] [Scilit]
- Wu, W.X.; Gong, F.Q.; Ren, L.; Yu, W.; Zhang, Z.-X. Dynamic triggering mechanism of rockburst in highly stressed rectangular tunnel under impact load. Tunn. Undergr. Space Tech. 2025, 165, 106908. [Google Scholar] [CrossRef] [Scilit]
- Song, D.Q.; Mai, S.W.; Liu, X.L.; Hu, N.; Shi, W.; Wang, E.; Yang, Y. Real-time high-temperature SHPB experimental investigation on dynamic mechanical properties and fracture characteristics of surrounding rock in tunnel fire explosion. Eng. Fract. Mech. 2025, 329, 111596. [Google Scholar] [CrossRef] [Scilit]
- Xie, P.Y.; Zhao, W.S.; Chen, W.Z.; Zhou, S.; Qin, C.; Gao, H.; Tong, Y.; Li, X.; Zhou, H. The influence of normal stress on mechanical shear properties and damage characteristics of rock joints under pre-peak cyclic loadings. Rock Mech. Rock Eng. 2026. Epub ahead of printing. [Google Scholar] [CrossRef] [Scilit]
- Pan, B. Reliability-guided digital image correlation for image deformation measurement. Appl. Opt. 2009, 48, 1535–1542. [Google Scholar] [CrossRef] [Scilit]
- Chen, T.Y.; Dang, N.M.; Wang, Z.Y.; Chang, L.-W.; Ku, W.-Y.; Lo, Y.-L.; Lin, M.-T. Use of digital image correlation method to measure bio-tissue deformation. Coatings 2021, 11, 924. [Google Scholar] [CrossRef] [Scilit]
- Lu, H.; Cary, P.D. Deformation measurements by digital image correlation: Implementation of a second-order displacement gradient. Exp. Mech. 2000, 40, 393–400. [Google Scholar] [CrossRef] [Scilit]
- Wu, T.X.; Liu, R.; Lai, Y.M.; Zhang, X.; Ren, Z.; Du, J.; Xu, F.; Wu, Y. Dynamic behavior and viscoelastic-plastic damage constitutive modeling of inclined coal-rock composites under triaxial impact loading. Eng. Fail. Anal. 2026, 192, 110823. [Google Scholar] [CrossRef] [Scilit]
- Zhang, Q.B.; Zhao, J. Determination of mechanical properties and full-field strain measurements of rock material under dynamic loads. Int. J. Rock Mech. Min. Sci. 2013, 60, 423–439. [Google Scholar] [CrossRef] [Scilit]
- Misra, A.; Marangos, O. Rock-joint micromechanics: Relationship of roughness to closure and wave propagation. Int. J. Geomech. 2011, 11, 431–439. [Google Scholar] [CrossRef] [Scilit]
- Li, J.C.; Li, N.N.; Li, H.B.; Zhao, J. An SHPB test study on wave propagation across rock masses with different contact area ratios of joint. Int. J. Impact Eng. 2017, 105, 109–116. [Google Scholar] [CrossRef] [Scilit]
- Hedayat, A.; Walton, G. Laboratory determination of rock fracture shear stiffness using seismic wave propagation and digital image correlation. Geotech. Test. J. 2017, 40, 92–106. [Google Scholar] [CrossRef] [Scilit]
- Wang, F.L.; Xia, K.W.; Yao, W.; Wang, S.; Wang, C.; Xiu, Z. Slip behavior of rough rock discontinuity under high velocity impact: Experiments and models. Int. J. Rock Mech. Min. Sci. 2021, 144, 104831. [Google Scholar] [CrossRef] [Scilit]
- Wang, W.Y.; Deng, Y.J.; Liu, L.B.; Zhang, L.; Yao, Y. Dynamic mechanical properties and energy dissipation analysis of rubber-modified aggregate concrete based on SHPB tests. Constr. Build. Mater. 2024, 445, 137920. [Google Scholar] [CrossRef] [Scilit]
- Liu, T.T.; Ding, L.Y.; Wang, G.; Ma, R.; Li, X. Dynamic properties and failure mechanism of granite with non-persistent joints subjected to impact load. Int. J. Rock Mech. Min. Sci. 2023, 169, 105451. [Google Scholar] [CrossRef] [Scilit]
- Zhou, Y.; Zou, S.Z.; Wen, J.M.; Zhang, Y. Study on the damage behavior and energy dissipation characteristics of basalt fiber concrete using SHPB device. Constr. Build. Mater. 2023, 368, 130413. [Google Scholar] [CrossRef] [Scilit]
- Han, Z.H.; Li, D.Y.; Li, X.B. Dynamic mechanical properties and wave propagation of composite rock-mortar specimens based on SHPB tests. Int. J. Min. Sci. Technol. 2022, 32, 793–806. [Google Scholar] [CrossRef] [Scilit]

Disclaimer/Publisher’s Note: The statements, opinions and data contained in all publications are solely those of the individual author(s) and contributor(s) and not of MDPI and/or the editor(s). MDPI and/or the editor(s) disclaim responsibility for any injury to people or property resulting from any ideas, methods, instructions or products referred to in the content. |
© 2026 by the authors. Licensee MDPI, Basel, Switzerland. This article is an open access article distributed under the terms and conditions of the Creative Commons Attribution (CC BY) license.