


Abstract
Sandstone and cemented coal gangue-fly ash backfill (CGFB) form composite load-bearing structures in goafs, where repeated water ingress and drainage may weaken stability. This study investigated sandstone–CGFB composite specimens subjected to 0, 3, 6, and 10 water immersion–drying cycles using uniaxial compression, energy analysis, acoustic emission (AE) monitoring, scanning electron microscopy (SEM), and digital image analysis. The results show that increasing the cycle number prolonged initial compaction, reduced the pre-peak slope and peak stress, and promoted gradual post-peak deformation. From 0 to 10 cycles, the mean uniaxial compressive strength decreased from 4.78 to 1.70 MPa, while the 50% secant modulus E50 decreased from 579.63 to 125.08 MPa, representing reductions of 64.44% and 78.42%, respectively. Meanwhile, the peak strain increased from 0.0098 to 0.0146. The peak total input energy decreased from 23.93 to 13.01 kJ·m−3, and dissipated energy accounted for 97.9% of the total input energy at test termination after 10 cycles. AE counts and energy shifted from concentrated release near and after the peak to earlier, more dispersed activation. Tensile-type AE events remained dominant, reaching 95.1% at 6 cycles, whereas the shear-type proportion increased to 21.2% at 10 cycles. The dynamic b-value showed stage-dependent rather than monotonic variation, reflecting a transition from fracture localization near the peak to early defect activation and subsequent small-scale damage. In the selected post-failure CGFB-side SEM fields, the apparent fracture-surface defect fraction increased from 21.23% to 35.89%. Together with the mechanical and AE results, the fracture-surface observations are consistent with a progressive weakening of the cemented structure and a shift toward earlier, more dispersed damage during loading. These laboratory findings provide indicators for assessing the water-related deterioration of sandstone–CGFB composite structures in backfilled goafs.
1. Introduction
With increasing mining depth and geological complexity, maintaining the stability of backfilled goafs has become increasingly important for controlling roof deformation, overburden movement, and associated ground-pressure disasters in coal mines [1,2,3]. Cemented backfill can interact with the surrounding rock to form a composite load-bearing structure, thereby restricting roof subsidence and reducing the risk of local instability [4,5,6]. Among the available backfill materials, cemented coal gangue-fly ash backfill (CGFB) has attracted considerable attention because of its high utilization of coal-based solid waste, adjustable mechanical properties, and environmental benefits [7,8,9,10]. Nevertheless, its heterogeneous particle–paste interfaces and complex pore structure make its mechanical performance sensitive to environmental disturbances [11,12,13,14]. In backfilled coal mines, fissure water from overlying strata, accumulated water in goafs, and intermittent drainage can subject the surrounding rock-backfill structure to repeated water ingress and drying (Figure 1) [15,16]. During this process, repeated water migration, matrix softening, moisture-induced deformation, and weakening of aggregate–matrix interfaces can progressively alter the pore structure and deteriorate the integrity of the backfill [17,18]. The micropores, microcracks, and heterogeneous particle–paste contacts in coal-based solid waste backfill may further increase its sensitivity to repeated wetting and drying, thereby affecting the strength, stiffness, failure mode, and energy dissipation of CGFB [19,20,21,22,23]. Consequently, clarifying the water-induced degradation and progressive failure of sandstone–CGFB composite structures is important for identifying instability risks and developing disaster prevention strategies for backfilled goafs.
Figure 1.
Schematic illustration of mine-water accumulation and infiltration in a sandstone–CGFB backfilled goaf.
Meanwhile, water–rock interaction is a key factor governing the stability of surrounding rock-backfill composite bearing systems in underground engineering [24,25,26]. Existing studies have extensively investigated the degradation characteristics and underlying mechanisms of rock mechanical properties under water-influenced conditions. For example, Wong et al. systematically investigated the influence of water on rock strength and summarized the relationships among uniaxial compressive strength, elastic modulus, and tensile strength under both static and dynamic loading conditions [27]. Tang et al. employed uniaxial shear tests to characterize the acoustic emission responses of raw coal specimens with different moisture contents [28]. Yin et al. combined uniaxial and triaxial compression tests with X-ray diffraction, scanning electron microscopy, and energy-dispersive spectroscopy to elucidate the mesostructural softening mechanisms of gypsum rock subjected to long-term water immersion [29]. Su et al. conducted triaxial tests on gypsum rock with different immersion durations and established a damage constitutive model incorporating energy dissipation and time-dependent parameters [30]. Chen et al. performed uniaxial compression tests and acoustic emission monitoring on sandstone specimens under different humidity conditions, and systematically analyzed the humidity-dependent evolution of stress–strain behavior, mechanical parameters, acoustic emission energy, and crack development [31]. Chen et al. investigated the effects of joint inclination and connectivity on the mechanical response and degradation mechanisms of intermittently jointed sandstone based on long-term immersion tests [32]. Qiu et al. developed a microscopic damage model for sandstone by integrating freeze–thaw cycling and computed tomography scanning while considering both the degree of water immersion and the number of freeze–thaw cycles [33]. Hu et al. clarified the variation in the mechanical properties of shale through a series of physical and mechanical tests under different humidity conditions [34]. Yao et al. investigated the failure modes and mechanical behavior of coal-bearing strata under different water saturation levels and lithological combinations, and revealed the influence of water–rock interaction on deformation and failure processes using acoustic emission techniques [35]. Zhao et al. systematically elucidated the effects of coupled physical, chemical, and mechanical water–rock interactions on the mechanical behavior of rock fractures through theoretical analysis and experimental investigation [36]. Related studies have also examined the compressive failure of cement-based composites [37], changes in coal pore structure following external treatment [38], and the monitoring of coal and rock failure using microseismic and electromagnetic signals [39,40]. Research on hydraulic treatments has addressed changes in coal seam seepage [41]. In the broader context of fluid transport, channel geometry has also been investigated for its influence on water evaporation and cooling [42]. These studies provide methods and observations relevant to material failure, pore characterization, monitoring, and fluid movement. However, the combined evolution of mechanical performance, AE activity, and fracture-surface characteristics in a sandstone–CGFB composite under repeated immersion and drying remains insufficiently understood.
In practical backfill mining, CGFB and the overlying sandstone jointly carry mining-induced loads, and the response of the composite structure depends on the properties of both materials and their contact region. Previous studies have examined the mechanical behavior of rock-based composite specimens and the water-related response of filling materials [43,44,45,46,47], as well as the rheological and hydration characteristics of gangue- and fly ash-based backfill materials [48,49]. Comparatively limited attention has been given to the progressive failure of sandstone–CGFB composites subjected to repeated water ingress and drying. In particular, the relationships among stiffness degradation, energy redistribution, AE fracture activity, and final fracture-surface morphology remain insufficiently understood. Therefore, sandstone–CGFB composite specimens subjected to 0, 3, 6, and 10 immersion–drying cycles were investigated using uniaxial compression, energy analysis, AE monitoring, SEM observation, and digital image analysis. This study relates changes in strength, stiffness, and energy storage to AE activity and the post-failure fracture-surface characteristics within the same composite system. The objectives were to: (1) quantify changes in strength, stiffness, deformation, and energy storage; (2) characterize the timing of AE activity and the evolution of tensile- and shear-type AE events; and (3) examine the association between fracture-surface characteristics and macroscopic progressive failure. These laboratory findings provide experimental indicators for assessing the water-related deterioration of sandstone–CGFB composite structures and informing the interpretation of roof-backfill behavior in water-bearing goafs.
2. Materials and Methods
2.1. Raw Materials
The materials used to prepare the sandstone–CGFB composites included sandstone, cement, fly ash, coal gangue, and water. The sandstone was collected from the roof strata of a working face in a coal mine in Shandong Province, China. The collected sandstone consisted of irregular blocks without standardized dimensions. Each selected block was sufficiently large to permit the extraction of cylindrical cores with a nominal diameter of 50 mm. To preserve the structural integrity of the sandstone and minimize the effects of weathering and material variability on the experimental results, intact sandstone blocks without obvious weathering or through-going fractures were selected, sealed at the site, and transported to the laboratory. The cement, fly ash, and coal gangue were all obtained from Shandong Province. Ordinary Portland cement of grade P·O 42.5, produced by the Third Cement Plant of Rizhao, Shandong Province, was used as the primary cementitious material for the backfill. The cement particles were predominantly smaller than 80 μm. The fly ash (FA) was fine ash discharged from the coal-fired boiler of the Huangdao Power Plant in Qingdao, Shandong Province. It was classified as Class F Grade II fly ash and appeared light gray, with a residue of less than 30% on a 45 μm sieve. The coal gangue was obtained from the Daizhuang Coal Mine in Shandong Province and was used as the aggregate of the backfill after secondary crushing and sieving. All coal gangue particles used in the mixture were smaller than 15 mm. Laboratory tap water was used for both mixture preparation and cyclic water immersion. The water had a near-neutral pH of 7.2 ± 0.2, and no acid, sulfate, chloride, or other chemical reagents were additionally introduced.
The major chemical compositions of the cement, fly ash, and coal gangue were determined using X-ray fluorescence spectroscopy. The XRF results and morphologies of the raw materials are shown in Figure 2. As shown in Figure 2, the cement contained a relatively high proportion of CaO, indicating favorable cementing and hydration capacities. The fly ash and coal gangue contained relatively high proportions of SiO2 and Al2O3, which could contribute to skeleton support, particle filling, and supplementary cementitious reactions within the backfill. The raw materials differed considerably in particle size, mineral composition, and chemical composition. These differences in particle size and composition contributed to the heterogeneous particle-paste-pore structure of the CGFB, which may influence its deformation and fracture behavior during cyclic immersion and subsequent loading.
Figure 2.
Morphologies and major chemical compositions of the raw materials.
2.2. Experimental Methods
The backfill slurry was prepared using a mass ratio of cement, fly ash, and coal gangue of 1:4:6, with a solids mass concentration of 78%. After weighing each component according to the designed proportions, the components were thoroughly mixed, and mixing water was gradually added. Mechanical stirring was used to ensure uniform mixing of the coal gangue, fly ash, cement, and water. After mixing, the backfill slurry was poured into molds for specimen preparation. After demolding, the specimens were placed in a curing chamber. The curing temperature was maintained at 20 ± 2 °C, the relative humidity was not lower than 95%, and the curing age was 28 d. After curing, the CGFB specimens were visually inspected, and specimens with obvious surface cracks, voids, or local defects were discarded.
The sandstone specimens were prepared according to the relevant requirements of the International Society for Rock Mechanics (ISRM). First, cylindrical cores with a nominal diameter of 50 mm were drilled from the intact sandstone blocks using a core drilling machine. The cores were subsequently cut and ground into cylindrical sandstone specimens with a diameter of 50 mm and a height of 50 mm. The nonparallelism between the two end faces was controlled within 0.05 mm. The end faces were required to be flat, smooth, and free of obvious cracks and local defects. The deviation angle of the specimen axis did not exceed 0.25°. The CGFB specimens were processed to the same dimensions as the sandstone specimens, and their end faces were trimmed and ground. Subsequently, the sandstone and CGFB specimens were assembled vertically along the axial direction. Following the specimen-preparation method widely adopted in laboratory studies of rock-based composite structures [50,51,52], a two-component epoxy resin adhesive was used to bond the two materials and maintain the integrity and axial alignment of the composite specimens during handling and loading. The height ratio of sandstone to CGFB was maintained at 1:1. During bonding, only a small amount of adhesive was uniformly applied, and the two end faces were maintained in close contact to minimize the thickness of the adhesive layer and the formation of local voids. All specimens were prepared using the same adhesive, mixing procedure, bonding method, and curing conditions. After the adhesive had fully cured, both ends of the composite specimens were uniformly ground. Finally, sandstone–CGFB composite specimens with a diameter of 50 mm and a height of 100 mm were prepared. This preparation procedure ensured consistent interface conditions among all specimens and enabled a systematic evaluation of the hydro-mechanical degradation and progressive failure of sandstone–CGFB composites under different numbers of water immersion–drying cycles.
Before cyclic water immersion, all composite specimens were dried in a constant-temperature forced-air drying oven maintained at 25 ± 2 °C until their masses remained essentially stable. After drying, the specimens were placed in containers filled with water. To simulate the repeated water ingress and drainage experienced by backfill structures in water-bearing goafs, cyclic water immersion was conducted through alternating immersion and drying stages. Each cycle consisted of 24 h of complete water immersion followed by 24 h of controlled drying. The 24 h immersion stage allowed water to migrate through the accessible pores and particle–paste interfaces within the CGFB, whereas the subsequent 24 h drying stage promoted moisture loss and drying shrinkage under consistent environmental conditions. After each immersion stage, the specimens were removed, the surface water was gently wiped off, and the specimens were dried in the same constant-temperature forced-air drying oven maintained at 25 ± 2 °C before the next immersion stage. The specimens were divided into four groups subjected to 0, 3, 6, and 10 immersion–drying cycles. The NC = 0 group was used as the reference, while NC = 3, NC = 6, and NC = 10 represented the initial, intermediate, and advanced stages of cyclic deterioration, respectively. This grouping enabled the stage-dependent evolution of the mechanical, energy, acoustic emission, and mesoscopic characteristics to be systematically compared. Each group contained three specimens. After completing the prescribed number of immersion–drying cycles, the specimens were subjected to uniaxial compression testing.
Uniaxial compression tests were conducted on the sandstone–CGFB composite specimens subjected to different numbers of cyclic water immersion using a Shimadzu AG-X250 universal testing machine (Shimadzu Corporation, Kyoto, Japan). The tests were performed under displacement control at a loading rate of 0.005 mm/s, and loading continued until obvious failure occurred. The axial load, axial displacement, and stress–strain response were recorded simultaneously during testing. The peak strength, peak strain, elastic modulus, post-peak deformation, and final failure pattern of the specimens were obtained. During uniaxial compression, a MISTRAS PCI-2 acoustic emission system (MISTRAS Group, Princeton, NJ, USA) was used to simultaneously monitor the initiation, propagation, and coalescence of internal cracks in the specimens. Acoustic emission sensors were arranged on the specimen surface, and coupling agent was applied to improve the contact between the sensors and the specimens. Before testing, the operating condition of the sensors and acquisition channels was checked using a pencil-lead break test. During testing, the number of acoustic emission events, ring counts, signal energy, and amplitude were continuously recorded. The acoustic emission responses at different deformation stages were analyzed in combination with the stress–strain curves.
The energy evolution characteristics of the composite specimens were further analyzed based on the stress–strain curves obtained from the uniaxial compression tests. During loading, the total energy absorbed by the specimen from the external environment mainly consisted of releasable elastic strain energy and dissipated energy. Their energy conversion relationship is illustrated in Figure 3. The releasable elastic strain energy was mainly stored inside the specimen and could be released after the peak strength was reached. The dissipated energy was mainly associated with irreversible damage processes, including plastic deformation, crack propagation, particle breakage, and frictional sliding at the sandstone–CGFB interface. Therefore, energy evolution can reflect the damage accumulation and failure development of the composite specimens under cyclic water immersion from an energy perspective.
Figure 3.
Energy conversion relationship during uniaxial compression of the composite specimens.
The total input energy per unit volume can be expressed as:
Under uniaxial compression, the releasable elastic strain energy of the specimen can be approximately expressed as:
The dissipated energy was calculated as the difference between the total input energy and the releasable elastic strain energy:
where U is the total input energy per unit volume, kJ/m3; Ue is the releasable elastic strain energy per unit volume, kJ/m3; Ud is the dissipated energy per unit volume, kJ/m3; σ is the axial stress, MPa; ε is the axial strain; and E is the elastic modulus, MPa. By comparing the variations in U, Ue, and Ud under different numbers of cyclic water immersion, the effects of cyclic water immersion on the energy storage capacity, crack propagation process, and failure energy dissipation characteristics of the composite specimens were analyzed.
After the uniaxial compression tests, failed specimens were selected for SEM observation. Fragments from the CGFB-side fracture surfaces and regions near the sandstone–CGFB interface were examined to identify particle breakage, matrix loosening, interparticle gaps, particle-paste separation, and crack-like defects. For the quantitative image comparison, one selected SEM field at 1300× magnification was analyzed for each cyclic condition. The selected fields contained visible cemented matrix, particles, and particle–paste contact regions. The same magnification, analysis range, and image-processing criteria were applied to all four fields. Because only one field was quantified per condition, the resulting image parameter describes the selected post-failure fracture surface and does not represent a group mean or the overall pore structure of the specimens.
Three replicate specimens were tested for each cyclic condition. The individual UCS and E50 values were retained for statistical analysis. The results are expressed as the mean ± standard deviation, and the coefficient of variation was calculated to evaluate the within-group dispersion.
3. Results and Analysis
3.1. Stress–Strain Response of the Composite Specimens Under Cyclic Water Immersion
The uniaxial compression stress–strain curves of the composite specimens subjected to different numbers of cyclic water immersion are shown in Figure 4. In the figure, NC = 0, NC = 3, NC = 6, and NC = 10 represent the composite specimens subjected to 0, 3, 6, and 10 cycles of cyclic water immersion, respectively. Overall, the stress–strain curves of the composite specimens under different numbers of cyclic water immersion all experienced the stages of crack closure, elastic deformation, plastic deformation, and post-peak failure. However, obvious differences were observed in the curve shapes and peak load-bearing characteristics of the specimens subjected to different numbers of cycles.
Figure 4.
Uniaxial compression stress–strain curves of the composite specimens under different numbers of cyclic water immersion.
During the initial loading stage, the original pores, microcracks, and local defects at the sandstone–CGFB interface inside the specimens were gradually compacted, resulting in an obvious nonlinear response. As the axial stress increased, the specimens gradually entered the elastic deformation stage, and the stress–strain curves generally exhibited an approximately linear increase. After the peak stress was reached, the internal cracks further propagated and coalesced, and the curves entered the post-peak stage. As shown in Figure 5, with increasing numbers of cyclic water immersion, the slope of the pre-peak curves gradually decreased and the peak stress continuously declined, indicating that cyclic water immersion continuously reduced the deformation stiffness and load-bearing capacity of the specimens. Compared with the NC = 0 specimens, the NC = 3, NC = 6, and NC = 10 specimens exhibited more obvious initial compaction deformation. In particular, the NC = 10 specimens had a relatively longer compaction stage, consistent with a greater initial compaction of defects after repeated immersion–drying cycles. Consequently, more deformation was required during the initial loading stage to complete the compaction and readjustment of the internal structure. Meanwhile, with increasing numbers of cyclic water immersion, the post-peak curves of the composite specimens exhibited a more apparent gradual decreasing trend. This feature was particularly evident in the NC = 10 specimens, for which the post-peak stress decreased relatively slowly and a longer post-peak deformation stage was observed. This result indicates that cyclic water immersion caused the progressive accumulation of internal damage, while local failure and interfacial sliding became more fully developed. Thus, the specimens gradually changed from relatively concentrated post-peak instability to continuous deformation and progressive failure.
Figure 5.
Variations in the mechanical parameters of the composite specimens under different numbers of cyclic water immersion.
The uniaxial compression test results of all individual specimens subjected to different numbers of immersion–drying cycles are listed in Table 1. Three replicate specimens were tested for each condition, and the mean, standard deviation, and coefficient of variation were calculated to characterize the central tendency and within-group dispersion. Here, E50 is the secant modulus corresponding to 50% of the peak strength and is used to characterize the deformation stiffness of the composite specimens during the main loading stage. The mean UCS and E50 values, together with their standard-deviation error bars, are presented in Figure 5a and Figure 5b, respectively.
Table 1.
Individual uniaxial compression test results and statistical variations of the composite specimens under different numbers of immersion–drying cycles.
As shown in Table 1, the UCS results exhibited relatively low within-group dispersion, with coefficients of variation ranging from 1.74% to 5.61%. The coefficients of variation of E50 ranged from 10.98% to 20.89%, indicating greater specimen-to-specimen variability in deformation stiffness than in peak strength. Nevertheless, the reductions in the mean UCS and E50 with increasing cycle number were substantially greater than their respective within-group variations. One-way analysis of variance further showed that the number of immersion–drying cycles had a statistically significant effect on both UCS and E50 (p < 0.001). These results confirm that the observed degradation trends were not controlled by the response of a single specimen.
As shown in Figure 5a, the NC = 0 specimens had the highest average UCS of 4.78 MPa. With increasing number of cyclic water immersion, the average UCS of the composite specimens continuously decreased. The average UCS values of the NC = 3, NC = 6, and NC = 10 specimens decreased to 3.44, 2.56, and 1.70 MPa, respectively. Compared with the NC = 0 specimens, the average UCS values of the NC = 3, NC = 6, and NC = 10 specimens decreased by 28.03%, 46.44%, and 64.44%, respectively. The UCS trendline in Figure 5a also indicates that the compressive strength of the composite specimens decreased significantly with increasing numbers of cyclic water immersion. As shown in Figure 5b, E50 represents the secant modulus corresponding to 50% of the peak strength and can be used to reflect the deformation stiffness of the composite specimens during the main loading stage. The average E50 of the NC = 0 specimens was 579.63 MPa. After 3, 6, and 10 cycles of cyclic water immersion, the average E50 values decreased to 348.03, 189.79, and 125.08 MPa, respectively. Compared with the NC = 0 specimens, the average E50 values of the NC = 3, NC = 6, and NC = 10 specimens decreased by 39.96%, 67.26%, and 78.42%, respectively. The trendline in Figure 5b shows that E50 continuously decreased with increasing numbers of cyclic water immersion, and its reduction was considerably greater than that of the UCS.
Overall, cyclic water immersion had a stronger effect on the deformation stiffness of the composite specimens than on their peak strength. During cyclic water immersion, water repeatedly entered and exited the specimens, weakening the bonding between the cementitious materials and the coal gangue and fly ash particles in the CGFB. Moisture-induced deformation and drying shrinkage may also weaken particle–paste contacts and affect load transfer within the composite specimens. Therefore, more obvious compaction and nonlinear deformation could occur at relatively low stress levels, resulting in a rapid decrease in E50. On the other hand, cyclic water immersion also weakened the interfacial constraint and load-transfer capacity between the sandstone and CGFB, making the internal stress distribution of the composite specimens more nonuniform. As the pores and cracks inside the CGFB continued to develop, the overall load-bearing capacity of the composite specimens decreased accordingly, which was ultimately reflected by the continuous reduction in UCS. Because E50 mainly reflects the deformation stiffness during loading and is more sensitive to pore compaction, microcrack propagation, and interfacial deformation, its reduction was greater than that of the UCS. Overall, both the deformation stiffness and compressive load-bearing capacity decreased with increasing numbers of immersion–drying cycles, with a greater relative reduction in E50 than in UCS.
3.2. Energy Evolution Characteristics of the Composite Specimens Under Cyclic Water Immersion
Based on the energy calculation method described in Section 2.2, the evolution of the total energy, releasable elastic strain energy, and dissipated energy of the composite specimens during uniaxial compression under different numbers of cyclic water immersion is shown in Figure 6. Figure 6a–d corresponds to the NC = 0, NC = 3, NC = 6, and NC = 10 specimens, respectively. The total energy of all specimens continuously accumulated with increasing strain. The releasable elastic strain energy gradually increased during the pre-peak stage and reached a relatively high level near the peak stress. After entering the post-peak stage, the releasable elastic strain energy was gradually released, whereas the dissipated energy continued to increase. This indicates that during the pre-peak stage, the energy input into the specimens was mainly stored in the form of elastic strain energy. During the post-peak stage, a larger proportion of the input energy was dissipated as irreversible deformation and damage developed.
Figure 6.
Stress and energy evolution characteristics of the composite specimens under different numbers of cyclic water immersion.
With increasing numbers of cyclic water immersion, the total energy accumulated by the composite specimens at the peak state generally decreased. The total input energies at the peak stress of the NC = 0, NC = 3, NC = 6, and NC = 10 specimens were 23.93, 19.11, 16.46, and 13.01 kJ/m3, respectively. The value for the NC = 10 specimens was 45.62% lower than that for the NC = 0 specimens. This indicates that cyclic water immersion weakened the energy storage capacity of the composite specimens before instability, allowing peak failure to occur under a lower energy input. The peak releasable elastic strain energies were 13.65, 14.51, 13.09, and 9.07 kJ/m3, respectively. Except for a slight fluctuation in the NC = 3 specimens, the overall trend was decreasing. The NC = 10 specimens had the lowest peak releasable elastic strain energy, indicating a reduced capacity to store releasable elastic energy after repeated immersion–drying cycles.
To further compare the energy characteristics under different numbers of cyclic water immersion, the energy parameters at the peak state and test termination state are summarized in Table 2. It should be noted that the cumulative total energy at test termination was jointly affected by the post-peak residual load-bearing capacity, termination strain, and continuous deformation process. Therefore, it did not vary monotonically with the number of cycles. For example, although the cumulative total energy of the NC = 10 specimens at test termination was 40.03 kJ/m3, which was higher than the 25.84 kJ/m3 measured for the NC = 6 specimens; this was mainly related to their longer post-peak deformation stage and did not indicate a higher energy storage capacity. Therefore, when evaluating energy degradation caused by cyclic water immersion, greater attention should be paid to the total input energy and releasable elastic strain energy at the peak state.
Table 2.
Energy parameters of the composite specimens under different numbers of cyclic water immersion.
As shown in Table 2, with increasing numbers of cyclic water immersion, the peak strain of the composite specimens increased from 0.0098 to 0.0146, whereas the peak total energy continuously decreased. This indicates that instability occurred under a greater deformation, reflecting the continuous deterioration of the structural stiffness and pre-peak energy storage capacity of the specimens. The releasable elastic strain energy of the NC = 10 specimens at test termination was only 0.83 kJ/m3, indicating that most of the input energy during the post-peak stage had been converted into dissipated energy. The dissipated energy at test termination reached 39.19 kJ/m3, accounting for 97.9% of the total energy. This indicates that after 10 cycles of cyclic water immersion, the failure process of the composite specimens was dominated by irreversible damage dissipation. Combined with the mechanical results in Section 3.1, cyclic water immersion not only reduced the UCS and E50 of the composite specimens, but also significantly weakened their pre-peak energy storage capacity and promoted a stronger dissipation-dominated response during the post-peak stage.
3.3. Acoustic Emission Response and Damage Evolution of the Composite Specimens Under Cyclic Water Immersion
3.3.1. Evolution of AE Counts and Cumulative Counts
Acoustic emission signals can reflect the transient elastic wave release caused by crack closure, initiation, propagation, and coalescence in the composite specimens during loading. To analyze the damage evolution characteristics of the specimens under different numbers of cyclic water immersion, representative specimens from each group were selected, and their axial stress, acoustic emission counts, and cumulative counts were recorded, as shown in Figure 7. Figure 7a–d corresponds to the NC = 0, NC = 3, NC = 6, and NC = 10 specimens, respectively.
Figure 7.
Variations in axial stress, acoustic emission counts, and cumulative counts of the composite specimens under different numbers of cyclic water immersion.
As shown in Figure 7, the acoustic emission counts of the specimens under different numbers of cyclic water immersion exhibited clear stage-dependent characteristics, although differences existed in the active periods and signal distributions. During the initial loading stage, the NC = 0 specimen exhibited only a small number of discrete acoustic emission events. During the pre-peak stage, the overall signal remained relatively stable. After the peak was reached and the specimen entered the post-peak stage, the acoustic emission counts increased significantly, and the cumulative counts rose rapidly, indicating that internal cracks in this specimen mainly propagated and coalesced during the later loading stage. In contrast, the acoustic emission counts of the NC = 3 and NC = 6 specimens exhibited relatively frequent fluctuations during the pre-peak stage. Their cumulative counts continuously increased with loading, indicating that the original defects inside the specimens were more easily activated at lower stress levels after cyclic water immersion. Crack propagation gradually changed from concentrated development after the peak to continuous development before the peak. For the NC = 10 specimen, the acoustic emission counts were mainly concentrated during the initial loading and crack closure stages. Although the specimen continued to deform, the AE counts were generally low, and the growth rate of the cumulative counts gradually decreased. This indicates that after 10 cycles of cyclic water immersion, numerous pores, microcracks, and interfacial defects had already developed inside the specimen. During the initial loading stage, relatively sufficient compaction, friction, and local crack closure occurred. During subsequent loading, however, the structural integrity and load-bearing capacity had already been significantly reduced, making it difficult for the specimen to accumulate and release strong elastic energy in a concentrated manner. Overall, cyclic water immersion changed the temporal characteristics of acoustic emission activity. Crack activity gradually changed from concentrated release during the post-peak stage in the NC = 0 specimen to dispersed release during the early loading stage in specimens subjected to a higher number of cycles.
3.3.2. Evolution of AE Energy and Cumulative Energy
The variations in axial stress, acoustic emission energy, and cumulative acoustic emission energy of the composite specimens under different numbers of cyclic water immersion are shown in Figure 8. Acoustic emission energy reflects the energy of the recorded AE signals, whereas cumulative acoustic emission energy represents the sum of these signal energies during loading. As shown in Figure 8, the NC = 0 specimen exhibited only a small number of high-energy acoustic emission events during the initial loading stage, and the cumulative acoustic emission energy increased slowly during the pre-peak stage. After the peak was reached, acoustic emission energy fluctuated continuously as macroscopic cracks propagated and local failure intensified, while the cumulative acoustic emission energy increased rapidly. This indicates that the specimen without cyclic water immersion had relatively good integrity, allowing it to accumulate considerable deformation energy during the pre-peak stage and release it in a relatively concentrated manner during post-peak failure.
Figure 8.
Variations in axial stress, acoustic emission energy, and cumulative acoustic emission energy of the composite specimens under different numbers of cyclic water immersion.
With increasing numbers of cyclic water immersion, the acoustic emission energy events of the NC = 3 and NC = 6 specimens gradually extended into the pre-peak stage, and the cumulative acoustic emission energy exhibited a more sustained increase. This indicates that AE activity developed more continuously before the peak was reached. Several high-energy events occurred during the initial loading stage of the NC = 10 specimen, but its subsequent acoustic emission energy was generally low. The cumulative acoustic emission energy increased rapidly during the early stage and then gradually stabilized. This suggests that AE activity in the NC = 10 specimen was concentrated earlier in the loading process, with fewer high-energy signals recorded during subsequent loading.
It should be noted that cumulative acoustic emission energy reflects the intensity of elastic wave signals released by crack activity and is not the same physical quantity as the mechanical input energy, releasable elastic strain energy, and dissipated energy described in Section 3.2. The former is used to characterize internal crack activity and damage release, whereas the latter describes the overall energy conversion of the specimen under external loading. Their combined results indicate that cyclic water immersion weakened the pre-peak energy storage capacity of the composite specimens, caused internal defects to be activated earlier, and gradually changed damage evolution from concentrated release during the post-peak stage to dispersed release during the early loading stage. In subsequent analysis, RA-AF crack classification and b-value variations can be combined to further analyze the characteristics of tensile cracks, shear cracks, and damage localization under different numbers of cyclic water immersion.
3.3.3. RA-AF Characteristics of Crack Types
To further identify the crack types during the loading and failure processes of the composite specimens under cyclic water immersion, RA-AF parameters were used to classify the acoustic emission events. The RA value reflects the rise-time characteristics of the acoustic emission signal, whereas the AF value reflects its average frequency. Generally, the propagation of tensile cracks corresponds to a lower RA value and a higher AF value, whereas shear sliding or frictional failure corresponds to a higher RA value and a lower AF value. Therefore, RA-AF analysis can supplement the preceding acoustic emission count and energy evolution results from the perspective of crack types.
The RA and AF values of the i-th acoustic emission event were calculated using Equations (4) and (5), respectively:
where RTi is the rise time of the i-th acoustic emission event; Ai is the amplitude; Ci is the ring count; and Di is the duration. The RA value was calculated as the ratio of rise time to amplitude, whereas the AF value was calculated as the ratio of ring count to duration. A tensile crack generally produces a waveform with a short rise time and relatively high frequency and therefore exhibits a low RA value and a high AF value. In contrast, shear sliding and frictional failure generally produce a waveform with a longer rise time and lower frequency, corresponding to a high RA value and a low AF value. Based on the overall distribution characteristics of the valid AE events, the line AF = 20RA was adopted as the classification boundary and was applied consistently to all four cyclic groups. Events located above the boundary were classified as tensile-type events, whereas those below the boundary were classified as shear-type events. The same boundary was used for all groups to ensure that the variations in crack-type proportions were directly comparable.
The RA-AF scatter distributions and crack type proportions of the composite specimens under different numbers of cyclic water immersion are shown in Figure 9. The scatter points of all groups were generally concentrated in the low-RA region and gradually became more dispersed toward the high-RA region, indicating that acoustic emission activity during loading was mainly associated with microcrack initiation, tensile opening and propagation, and local sliding. Under different numbers of cyclic water immersion, the composite specimens all exhibited tensile-shear composite failure, although tensile-type acoustic emission events were dominant. The proportions of tensile-type acoustic emission events in the NC = 0 and NC = 3 specimens were 86.6% and 85.8%, respectively, whereas the proportions of shear-type acoustic emission events were 13.4% and 14.2%, respectively. Their distributions were relatively similar, with tensile-type events remaining dominant in both groups.
Figure 9.
RA-AF scatter distributions and crack type classification of the composite specimens under different numbers of cyclic water immersion.
When the number of cycles increased to NC = 6, the proportion of tensile-type acoustic emission events increased to 95.1%, while the proportion of shear-type events decreased to 4.9%, indicating that the internal cracks mainly propagated through opening at this stage. Combined with the preceding mechanical and energy evolution results, cyclic water immersion weakened the bonding within the CGFB matrix and at the sandstone–CGFB interface, making the original microdefects more prone to opening and propagation under axial loading. When the number of cycles further increased to NC = 10, the proportion of tensile-type acoustic emission events decreased to 78.8%, whereas the proportion of shear-type events increased to 21.2%, which was the highest among all groups. This indicates a greater relative contribution of shear-type AE events to the loading response at NC = 10. This result agrees with the earlier acoustic emission activity during the pre-peak stage, the continuous post-peak deformation, and the high proportion of energy dissipation observed in the NC = 10 specimens. These findings indicate that tensile-type events remained dominant across all groups, while the relative proportion of shear-type events was highest at NC = 10.
The RA-AF classification was further examined by comparison with the macroscopic failure morphology of the tested specimens. The NC = 0 and NC = 3 specimens were mainly characterized by axial splitting and longitudinal crack propagation, consistent with the dominance of tensile-type AE events, which accounted for 86.6% and 85.8% of the total classified events, respectively. At NC = 6, more pronounced longitudinal splitting was observed, corresponding to the highest tensile-type proportion of 95.1%. At NC = 10, the specimens exhibited a more complex failure pattern involving longitudinal cracking, particle displacement, local oblique cracking, and frictional sliding within the damaged CGFB region. This morphological transition was consistent with the increase in the shear-type AE proportion to 21.2%. Therefore, the observed failure patterns and the RA-AF classification independently showed consistent changes in the dominant fracture behavior.
3.3.4. Dynamic b-Value and Fracture-Scale Evolution
The dynamic b-value characterizes the relative proportions of acoustic emission events with different amplitudes and thus reflects the scale evolution of internal fracture activity in the specimens. A higher b-value indicates a higher proportion of low-amplitude and small-scale AE events, corresponding to the dispersed initiation and stable propagation of microcracks. A lower b-value indicates an increased proportion of high-amplitude events, reflecting intensified concentrated failure activities, such as large-scale crack propagation, local coalescence, and interfacial sliding. Therefore, a decrease in the b-value or fluctuations at a low level can generally be used to characterize the transition from dispersed damage to localized failure in the specimens.
The dynamic b-value was calculated according to the Gutenberg–Richter relationship:
where N is the cumulative number of AE events with an equivalent magnitude not lower than M, a is the intercept, and b is the negative slope of the fitted linear relationship. Because the amplitude recorded by the AE system was expressed in dB, the equivalent AE magnitude was defined as:
where AdB is the recorded AE amplitude. The acquisition threshold was 45 dB, corresponding to an equivalent magnitude of 2.25 under Equation (7). Accordingly, only events with amplitudes of at least 45 dB were included in the fitting. This threshold excludes events below the acquisition limit; it was not independently verified as the completeness magnitude.
log10N = a − bM
A sliding window containing 500 valid AE events was used to ensure that each regression contained a sufficient number of events, and the window was advanced by 100 events each time to retain the temporal resolution of the dynamic b-value evolution. The AE amplitudes were classified at intervals of 5 dB, corresponding to an equivalent magnitude interval of 0.25. The b-value obtained for each window was assigned to the occurrence time of the final event in that window.
Linear least-squares regression was performed using the magnitude-frequency data at or above the 45 dB acquisition threshold. The coefficient of determination, R2, was used to evaluate the goodness-of-fit:
where yi is the observed value of log10N, is the fitted value, and is the mean of the observed values. Only windows with R2 ≥ 0.90 were retained as valid b-value results. Confidence intervals and standard errors of individual b-value estimates were not calculated; therefore, the dynamic b-value curves were interpreted as comparative trends. The use of a fixed event window, overlapping step, 45 dB acquisition threshold, and goodness-of-fit criterion ensured that the b values obtained under different cyclic conditions were calculated using consistent statistical criteria.
The evolution of the AE amplitude and dynamic b-value of the composite specimens under different numbers of cyclic water immersion is shown in Figure 10. The b-value of the NC = 0 specimen fluctuated considerably during loading. Its increase from a relatively low level during the early stage indicates a rising proportion of lower-amplitude AE events within the valid analysis windows. Subsequently, the b-value decreased and fluctuated near the peak, indicating that the number of high-amplitude AE events increased and that internal damage gradually became concentrated in localized crack propagation and coalescence. Combined with the acoustic emission count and energy evolution results, the specimen without cyclic water immersion had a relatively strong energy storage capacity, and crack activity was more likely to be released in a concentrated manner near the peak and during the post-peak stage.
Figure 10.
Evolution of AE amplitude and dynamic b-value of the composite specimens under different numbers of cyclic water immersion.
The b-value of the NC = 3 specimen was mainly distributed around 1.4–1.5 and decreased to approximately 1.2 during the later loading stage. This indicates that crack propagation was dominated by small-scale activity during the early stage, whereas large-scale crack activity and local sliding gradually increased as the load-bearing capacity decreased. The b-value of the NC = 6 specimen generally ranged from 1.45 to 1.70 and exhibited a pattern of increase, decrease, and subsequent fluctuation. This reflects the alternating occurrence of microcrack propagation, local stress adjustment, and crack connection inside the specimen after cyclic water immersion. The valid b-value windows for this group were mainly concentrated in stages with relatively active AE activity. Therefore, its curve was more suitable for reflecting the evolution of the pre-peak fracture scale. The NC = 10 specimen exhibited a relatively low b-value during the early stage, followed by a rapid increase and maintenance at a relatively high level during subsequent loading. This indicates a relatively higher proportion of high-amplitude AE events in the valid early-stage windows; the b-value alone cannot identify whether the associated defects formed before or during loading. As loading continued, the specimen was mainly characterized by small-scale crack activity, particle adjustment, and interfacial frictional sliding, without the concentrated energy release observed in the NC = 0 specimen. This characteristic agrees with the earlier AE activity during the pre-peak stage, the continuous post-peak deformation, and the high proportion of dissipated energy observed in the NC = 10 specimen.
Overall, cyclic water immersion did not cause the dynamic b-value to vary monotonically with the number of cycles, but instead changed the temporal characteristics of fracture scale evolution in the composite specimens. The NC = 0 specimen exhibited relatively obvious fracture localization near the peak. The NC = 3 and NC = 6 specimens were characterized by alternating crack propagation and local stress adjustment. The NC = 10 specimen exhibited the coexistence of early defect activation and subsequent progressive damage. It should be noted that the b-value reflects the scale distribution of AE events, whereas the RA-AF parameters reflect crack types. The two parameters are complementary. The increased proportion of shear-type AE events in the NC = 10 specimen is not inconsistent with its relatively high b-value during the later stage. Thus, the later-stage b-value describes the relative amplitude distribution of AE events, while the RA-AF result describes their classified crack types; the two observations are not contradictory.
3.4. Mesoscopic Failure Characteristics and Fracture-Surface Morphology of the Composite Specimens
3.4.1. SEM Morphology of the CGFB-Side Fracture Surface
The deterioration of the macroscopic mechanical properties caused by cyclic water immersion was accompanied by changes in the post-failure fracture-surface morphology of the CGFB. To examine the mesoscopic characteristics of the composite specimens under different numbers of immersion–drying cycles, representative fragments from the CGFB-side fracture surfaces after uniaxial compression failure were selected for SEM observation. All images used for comparison were obtained at a magnification of 1300× with the same field width. This magnification provided a field containing coal gangue particles, cemented matrix regions, particle–paste contact regions, and fracture-surface defects, facilitating a consistent morphological comparison of the selected fields across the four cyclic conditions. The SEM observations focused on matrix continuity, particle embedment, interparticle gaps, particle-paste separation, and the distribution of open defects. The fracture morphologies of the NC = 0, NC = 3, NC = 6, and NC = 10 specimens are shown in Figure 11a, Figure 11b, Figure 11c and Figure 11d, respectively.
Figure 11.
SEM morphologies of the CGFB-side fracture surfaces of the composite specimens under different numbers of cyclic water immersion.
As shown in Figure 11a, the fracture surface of the specimen without cyclic water immersion generally maintained good matrix continuity. The cemented matrix was distributed relatively continuously between the particles, and most particles remained embedded in or surrounded by the matrix. Only a limited number of isolated interparticle gaps and open defects were observed. After 3 immersion–drying cycles, the particle boundaries became clearer, and the number of identifiable interparticle gaps increased locally, as shown in Figure 11b. Most of these defects remained isolated, while the surrounding cemented matrix retained relatively good continuity. This morphology indicates the initial loosening of the particle–paste contact regions. At NC = 6, the fracture surface became more heterogeneous, as shown in Figure 11c. The interparticle gaps were more developed than those at NC = 3, and adjacent open defects began to extend toward one another. The cemented matrix surrounding these defects exhibited a looser and more granular morphology, indicating progressive deterioration of the continuous particle-paste load-transfer structure. At NC = 10, prominent open defects accompanied by multiple surrounding interparticle gaps were observed in the selected field, as shown in Figure 11d. Several adjacent defects exhibited local connection, while the continuity of the cemented matrix and the degree of particle embedment were further reduced. Therefore, the fracture-surface morphology evolved from predominantly isolated interparticle gaps at NC = 3 to more developed and locally connected open defects at NC = 6 and NC = 10.
Overall, the selected CGFB-side fracture surfaces showed a relatively continuous matrix with well-embedded particles at NC = 0 and more visible interparticle gaps, a looser matrix, and locally connected open defects at higher cycle numbers. These fracture-surface observations are consistent with the reductions in E50, uniaxial compressive strength, and pre-peak releasable elastic strain energy described above.
3.4.2. Quantitative Characterization of Fracture-Surface Defects
To describe the fracture-surface characteristics in the selected SEM fields under different numbers of immersion–drying cycles, one image obtained at 1300× magnification was processed for each condition using a Python-based digital image-processing program. The procedure included grayscale conversion, brightness normalization, smoothing, binary segmentation, and connected-region screening. The scale bar and instrument-information regions were removed before analysis, and the same analysis range and processing criteria were applied to the four images. The segmented regions were overlaid on the corresponding original images for visual comparison with identifiable open pores and crack-like regions, as illustrated in Figure 12. The ratio of pixels identified as open pores and crack-like regions to the total number of pixels in the analysis region was defined as the apparent fracture-surface defect fraction. This parameter describes the final two-dimensional defect morphology within each selected post-failure image field. It may include pores and microcracks present before compression, as well as cracks opened or generated during compression. Because one field was analyzed per condition, the resulting values cannot establish the field-to-field or specimen-to-specimen variability or represent the overall mesoscopic damage of each cyclic group.
Figure 12.
Image-processing and verification procedure for a representative CGFB-side fracture surface.
The apparent fracture-surface defect fractions under different numbers of immersion–drying cycles are shown in Figure 13. The values for the selected fields at NC = 0, NC = 3, NC = 6, and NC = 10 were 21.23%, 23.68%, 29.77%, and 35.89%, respectively. Relative to the selected NC = 0 field, the values at NC = 3, NC = 6, and NC = 10 increased by approximately 11.5%, 40.2%, and 69.1%, respectively. The increases between adjacent selected fields were 2.45, 6.09, and 6.12 percentage points, respectively. These values represent the proportions of identifiable open pores and crack-like regions within the selected complete image fields. Because only one field was quantitatively analyzed for each condition, field-to-field and specimen-to-specimen variability could not be evaluated, and no standard deviations or error bars are reported. The values do not establish that any individual pore, including the prominent open region in the NC = 10 image, was formed exclusively during the immersion–drying cycles. The trend across the selected fields is consistent with the visible changes in matrix continuity and interparticle gaps in Figure 11, but its representativeness for the heterogeneous CGFB as a whole remains uncertain. This was considered together with the independently measured mechanical, energy, and AE responses when interpreting the degradation process.
Figure 13.
Apparent fracture-surface defect fractions in the selected CGFB-side SEM image fields under different numbers of immersion–drying cycles.
The SEM observations and digital image analysis show that as the number of cycles increased from 0 to 10, the selected CGFB-side fracture surfaces exhibited reduced matrix continuity, more developed interparticle gaps, and locally connected open defects. Correspondingly, the apparent fracture-surface defect fraction increased from 21.23% to 35.89%. This trend in the final fracture morphology is consistent with the reductions in E50, UCS, and pre-peak elastic energy storage capacity and with the earlier activation of AE events. The image-derived parameter is interpreted together with these independently measured results when discussing the degradation and progressive failure of the composite specimens.
4. Discussion
The degradation of sandstone–CGFB composites involves the progressive transfer of moisture-induced deformation and mesoscopic structural deterioration into macroscopic loss of load-bearing performance, as illustrated in Figure 14. During water immersion, water migrates through the accessible pores and particle–paste interfaces within the CGFB, resulting in matrix softening and local moisture-induced expansion. Because sandstone and CGFB differ in moisture sensitivity and deformation characteristics, their differential deformation generates local stress concentration within the composite structure. During the subsequent drying stage, moisture loss and matrix shrinkage increase the local tensile stress around particle–paste interfaces and existing defects, thereby promoting particle–paste interfacial debonding, pore opening, and the extension and coalescence of adjacent microcracks. With increasing numbers of immersion–drying cycles, these repeated expansion-shrinkage effects progressively weaken the continuous load-transfer paths within the CGFB. Under subsequent uniaxial compression, the accumulated defects undergo compaction, activation, propagation, and coalescence, accompanied by particle displacement and local shear sliding, eventually leading to progressive failure. As the number of cycles increases, the CGFB matrix gradually changes from a relatively continuous structure to a loose and porous structure. In the selected post-failure CGFB-side SEM fields, the apparent fracture-surface defect fraction increased from 21.23% to 35.89%. This observation is consistent with, but does not directly measure, changes in internal load transfer. As a result, the E50 and UCS of the composite specimens decreased by 78.42% and 64.44%, respectively, the peak total input energy decreased by 45.62%, and the peak strain continuously increased.
Figure 14.
Schematic illustration of moisture-induced deformation, mesoscopic deterioration, and progressive failure of sandstone–CGFB composite specimens during cyclic water immersion and subsequent uniaxial compression.
The reduction in structural integrity also changes the timing and types of fracture activity. AE activity gradually shifts from concentrated release near and after the peak in the specimens without cyclic water immersion to the early loading stage. During the intermediate cycling stage, the specimens mainly exhibited dispersed propagation of tensile cracks. At NC = 10, the shear-type AE proportion reached 21.2%, while the selected fracture surface showed locally connected open defects. The low early-stage b-value followed by an increase indicates a change in the relative amplitude distribution of AE events during loading. Therefore, cyclic water immersion gradually changes the composite specimens from a failure mode characterized by “continuous load transfer and concentrated cracking near the peak” to one characterized by “early defect activation, the coexistence of tensile propagation and shear sliding, and dissipation-dominated progressive failure”. Together, the fracture-surface observations, energy results, and mechanical response support a progressive deterioration of the composite specimens under repeated immersion–drying cycles.
The sandstone–CGFB specimens represent local roof-backfill composite units subjected to controlled immersion–drying cycles and subsequent axial compression. In a backfilled goaf, repeated water ingress and drainage may similarly change the moisture conditions within the backfill and near the roof-backfill contact. In the present tests, E50 decreased by 78.42% compared with a 64.44% reduction in UCS, while AE activity occurred earlier and the fracture response became more dispersed as the cycle number increased. These results indicate that stiffness, deformation, and AE activity can provide complementary information about the deterioration process. The quantitative SEM results, however, were obtained from one selected post-failure field per condition; their variability and representativeness for the overall CGFB structure remain undetermined. Further analysis of multiple fields and specimens, preferably supplemented by observations before compression, is needed to assess whether the image-derived trend extends to overall mesoscopic damage. For application to a specific backfilled goaf, the laboratory trends should also be interpreted in conjunction with the three-dimensional stress state, hydraulic gradients, seepage paths, structural dimensions, and loading history.
5. Conclusions
Sandstone–CGFB composite specimens subjected to different numbers of water immersion–drying cycles were investigated using uniaxial compression, energy analysis, AE monitoring, SEM observation, and digital image analysis. The main conclusions are as follows:
- (1)
- Cyclic water immersion significantly reduced the strength and stiffness of the composite specimens while increasing their deformation capacity. From NC = 0 to NC = 10, the mean UCS and E50 decreased by 64.44% and 78.42%, respectively, whereas the peak strain increased from 0.0098 to 0.0146. The greater reduction in E50 indicates that deformation stiffness was more sensitive to cyclic water immersion than peak strength.
- (2)
- The peak total input energy decreased from 23.93 to 13.01 kJ·m−3 as the cycle number increased. At NC = 10, dissipated energy accounted for 97.9% of the total input energy at test termination. Thus, cyclic water immersion reduced the pre-peak energy storage capacity and promoted a dissipation-dominated post-peak failure response.
- (3)
- AE activity shifted from concentrated release near and after the peak to earlier and more dispersed activation. Tensile-type AE events remained dominant and reached 95.1% at NC = 6, while the shear-type proportion increased to 21.2% at NC = 10. The dynamic b-value showed stage-dependent rather than monotonic variation, indicating changes in the relative amplitude distribution of AE events during loading.
- (4)
- The selected CGFB-side fracture surfaces changed from a relatively continuous cemented matrix with predominantly isolated interparticle gaps to a looser structure containing more developed and locally connected open defects. The apparent fracture-surface defect fraction increased from 21.23% to 35.89%. Together with the mechanical, energy, and AE results, these observations are consistent with progressive weakening of particle–paste bonding and load transfer under repeated immersion–drying cycles.
Author Contributions
H.H.: Methodology, Writing—original draft, Writing—review & editing. F.L.: Conceptualization, Writing—review & editing, funding acquisition. D.Y. and Q.X.: Writing—review & editing. X.Q. and L.C.: Supervision, Visualization. All authors have read and agreed to the published version of the manuscript.
Funding
This research was funded by the Open Fund Research Project, supported by the State Key Laboratory of Mining Response and Disaster Prevention and Control in Deep Coal Mines (Grant No. SKLMRDPC22KF01).
Informed Consent Statement
The authors have approved and consented to the publication of this manuscript.
Data Availability Statement
All data generated or analyzed during this study are included in the published article.
Conflicts of Interest
The authors declare that they have no known competing financial interests or personal relationships that could have appeared to influence the work reported in this study.
References
- Wu, C.; Huang, N.H.; Zhang, H.L.; Li, Z.J.; Zhu, D.P. The influence of 3D printed polymer with different materials and composition shapes on the flexural performance of cemented lithium feldspar tailings backfills. Constr. Build. Mater. 2025, 494, 143523. [Google Scholar] [CrossRef] [Scilit]
- Liu, C.Y.; Wang, B.W.; Kang, M.C.; Li, Q.L.; Yang, L. Mechanical behavior and failure mode of cemented tailings backfill with prefabricated fractures: Effect of widths and angles. Theor. Appl. Fract. Mech. 2025, 140, 105121. [Google Scholar] [CrossRef] [Scilit]
- Qiu, X.Y.; He, X.R.; Cao, R.H.; Qiu, H.J.; Shi, X.Z.; Gou, Y.G.; Li, X.Y.; Zhi, W. Study on the surface subsidence trend of fill mining in underground mines with different mining depths. Adv. Civ. Eng. 2024, 2024, 4407757. [Google Scholar] [CrossRef] [Scilit]
- Guo, Y.M.; Zhang, J.X.; Long, K.; Ma, J.Y.; Gao, Y.; Li, B.Y. Experimental study on CO2 sequestration capacity and mechanical characteristics evolution of solid wastes based carbon-negative backfill materials. Constr. Build. Mater. 2024, 440, 137457. [Google Scholar] [CrossRef] [Scilit]
- Zhu, T.Y.; Chen, Z.H.; Wang, Z.Y.; Cao, J.; Hao, J.S.; Zhou, Z.H. Experimental and DEM analyses of type I fracture characteristics of waste rock aggregate reinforced cemented tailing backfill. Theor. Appl. Fract. Mech. 2025, 135, 104764. [Google Scholar] [CrossRef] [Scilit]
- Zhu, X.J.; Guo, G.L.; Zha, J.F.; Chen, T.; Fang, Q.; Yang, X.Y. Surface dynamic subsidence prediction model of solid backfill mining. Environ. Earth Sci. 2016, 75, 1007. [Google Scholar] [CrossRef] [Scilit]
- Liu, W.Z.; Chen, J.T.; Guo, Z.P.; Yang, H.Z.; Xie, W.W.; Zhang, Y.D. Mechanical properties and damage evolution of cemented coal gangue-fly ash backfill under uniaxial compression: Effects of different curing temperatures. Constr. Build. Mater. 2021, 305, 124820. [Google Scholar] [CrossRef] [Scilit]
- Wu, D.; Deng, T.F.; Zhao, R.K. A coupled THMC modeling application of cemented coal gangue-fly ash backfill. Constr. Build. Mater. 2018, 158, 326–336. [Google Scholar] [CrossRef] [Scilit]
- Li, Z.X.; Yin, D.W.; Jiang, N.; Wang, F.; Ding, Y.S.; Li, F.X. Deformation and failure characteristics of bimaterial samples consisting of sandstone and cemented coal gangue-fly ash backfill under uniaxial loading. Minerals 2022, 12, 1546. [Google Scholar] [CrossRef] [Scilit]
- Hou, J.F.; Guo, Z.P.; Liu, W.Z.; Zhang, Y.X. Mechanical properties and meso-structure response of cemented gangue-fly ash backfill with cracks under seepage- stress coupling. Constr. Build. Mater. 2020, 250, 118863. [Google Scholar] [CrossRef] [Scilit]
- Wu, D.; Zhao, R.K.; Qu, C.L. Effect of curing temperature on mechanical performance and acoustic emission properties of cemented coal gangue-fly ash backfill. Geotech. Geol. Eng. 2019, 37, 3241–3253. [Google Scholar] [CrossRef] [Scilit]
- Hou, J.F.; Li, J.B.; Zhao, L.J. Experimental study on seepage-stress coupling failure characteristics and fracture fractal characteristics of cemented gangue-fly ash backfill with defects. Theor. Appl. Fract. Mech. 2022, 122, 103658. [Google Scholar] [CrossRef] [Scilit]
- Liu, W.Z.; Guo, Z.P.; Wang, C.; Niu, S.W. Physico-mechanical and microstructure properties of cemented coal Gangue-Fly ash backfill: Effects of curing temperature. Constr. Build. Mater. 2021, 299, 124011. [Google Scholar] [CrossRef] [Scilit]
- Qin, Z.F.; Jin, J.X.; Lü, X.L.; Zhang, X.L.; Chen, Y.Y.; Li, M.X.; Zuo, S.H.; Shi, J.Y. Insights into mechanical property and damage evaluation of a novel waste-based coal gangue-filled backfill. Constr. Build. Mater. 2023, 389, 131802. [Google Scholar] [CrossRef] [Scilit]
- Du, X.J.; Feng, G.R.; Zhang, M.; Wang, Z.H.; Liu, W.H. Influence of backfilling rate on the stability of the “backfilling body-immediate roof” cooperative bearing structure. Int. J. Min. Sci. Technol. 2022, 32, 1197–1206. [Google Scholar] [CrossRef] [Scilit]
- Chen, F.B.; Liu, J.G.; Zhang, X.W.; Wang, J.X.; Jiao, H.Z.; Yu, J.X. Review on the art of roof contacting in cemented waste backfill technology in a metal mine. Minerals 2022, 12, 721. [Google Scholar] [CrossRef] [Scilit]
- Hou, J.F.; Guo, Z.P.; Wen, Z.Y.; Li, S.Q. Acoustic emission characteristics and failure prediction of defective cemented gangue-fly ash backfill under seepage-stress coupling. Nondestruct. Test. Eval. 2024, 39, 662–686. [Google Scholar] [CrossRef] [Scilit]
- Feng, G.R.; Liu, W.H.; Du, X.J.; Wang, J.W.; Li, X.L.; Zheng, Y.X. Crack evolution characteristics of cemented-gangue-fly-ash backfill with different proportions of fly ash and cement. Constr. Build. Mater. 2023, 385, 131498. [Google Scholar] [CrossRef] [Scilit]
- Jin, J.X.; Li, M.X.; Liu, T.; Chen, Y.Y.; Qin, Z.F.; Liu, Q.; Liang, B.; Zhao, J.T.; Zuo, S.H. Insights into factors influencing coal gangue-filled backfill cemented by self-consolidating alkali-activated slag grouts. Constr. Build. Mater. 2023, 411, 134422. [Google Scholar] [CrossRef] [Scilit]
- Li, G.C.; Wang, Y.Z.; Chen, X.; Jiao, H.Z.; Zhu, G.D.; Fan, Z.Y.; Gao, M.F.; Xu, W.L.; Dong, F.; Yao, L.Y. Research on the mechanical properties and micro-evolution characteristics of coal gangue-based composite cementitious materials. Buildings 2025, 15, 3406. [Google Scholar] [CrossRef] [Scilit]
- Jin, J.X.; Liu, T.; Li, M.X.; Lv, T.H.; Zhang, S.; Zuo, S.H. Mechanical properties and compression damage characteristics of coal gangue-filled backfill cemented by fly ash modified self-consolidating grouts. Case Stud. Constr. Mater. 2025, 22, 04687. [Google Scholar] [CrossRef] [Scilit]
- Jin, J.X.; Qin, Z.F.; Lü, X.L.; Liu, T.; Zhang, G.S.; Shi, J.Y.; Zuo, S.H.; Li, D.Q. Rheology control of self-consolidating cement-tailings grout for the feasible use in coal gangue-filled backfill. Constr. Build. Mater. 2022, 316, 125836. [Google Scholar] [CrossRef] [Scilit]
- Liu, C.K.; Wang, H.J.; Xiao, B.L.; Nie, J.; Chen, T. Insight into the rheological property and flow resistance of cemented paste backfill slurry containing fly ash: Influence of multi-factor and RSM-based ratio optimization. Powder Technol. 2025, 467, 121563. [Google Scholar] [CrossRef] [Scilit]
- Su, X.L.; Zhang, C.P.; Zou, Z.X.; Wang, Y.L.; Lai, J.X.; Liu, T. Influence of water rock interaction on stability of tunnel engineering. Pol. J. Environ. Stud. 2025, 34, 535–548. [Google Scholar] [CrossRef] [Scilit] [PubMed]
- Mo, P.; Tang, Q.Z.; Luo, J.H.; Huang, H.F.; Yang, Q.; Chen, Y. Study on time-effect to the strength deterioration of carbonaceous mudstone under water-rock interaction. Matéria 2023, 28, e20230166. [Google Scholar] [CrossRef] [Scilit]
- Liu, S.Y.; Zhang, K.; Gao, J.; Yang, Y.M.; Bai, L.; Yan, J.Y. Research on temporal patterns of water-rock interaction in the coal mine underground reservoir based on the dynamic simulation test. ACS Omega 2023, 8, 13819–13832. [Google Scholar] [CrossRef] [Scilit] [PubMed]
- Wong, L.N.Y.; Maruvanchery, V.; Liu, G. Water effects on rock strength and stiffness degradation. Acta Geotech. 2016, 11, 713–737. [Google Scholar] [CrossRef] [Scilit]
- Tang, C.J.; Yao, Q.L.; Li, Z.Y.; Zhang, Y.; Ju, M.H. Experimental study of shear failure and crack propagation in water-bearing coal samples. Energy Sci. Eng. 2019, 7, 2193–2204. [Google Scholar] [CrossRef] [Scilit]
- Yin, X.M.; Huang, Y.J.; Lei, Y.J.; Li, Y.X.; Song, K.; Liu, X.Y. Response of the mechanical properties of impurity-bearing gypsum rocks with a porphyritic structure to long-term water immersion and softening mechanisms. Bull. Eng. Geol. Environ. 2024, 83, 148. [Google Scholar] [CrossRef] [Scilit]
- Su, Y.; Pan, S.; Li, H.F. Energy-based damage analysis of water-immersed gypsum rock under triaxial compression: Model development and case study. Geotech. Geol. Eng. 2025, 43, 365. [Google Scholar] [CrossRef] [Scilit]
- Chen, G.Q.; Li, T.B.; Guo, F.; Wang, Y.K. Brittle mechanical characteristics of hard rock exposed to moisture. Bull. Eng. Geol. Environ. 2017, 76, 219–230. [Google Scholar] [CrossRef] [Scilit]
- Chen, G.B.; Li, Y.; Li, T.; Zhang, G.H. Deterioration law of intermittent jointed sandstone mechanical properties under water-rock interaction. Acta Geophys. 2022, 70, 1923–1935. [Google Scholar] [CrossRef] [Scilit]
- Qiu, B.; Fan, L.F.; Du, X.L. Microstructure deterioration of sandstone under freeze-thaw cycles using CT technology: The effects of different water immersion conditions. J. Rock Mech. Geotech. Eng. 2025, 17, 1599–1611. [Google Scholar] [CrossRef] [Scilit]
- Hu, K.F.; Feng, Q.; Wang, X.T. Experimental research on mechanical property of phyllite tunnel surrounding rock under different moisture state. Geotech. Geol. Eng. 2017, 35, 303–311. [Google Scholar] [CrossRef] [Scilit]
- Yao, Q.L.; Wang, W.N.; Zhu, L.; Xia, Z.; Tang, C.J.; Wang, X.H. Effects of moisture conditions on mechanical properties and AE and IR characteristics in coal-rock combinations. Arab. J. Geosci. 2020, 13, 615. [Google Scholar] [CrossRef] [Scilit]
- Zhao, Z.H. Study on water-rock interaction mechanisms and mechanical behaviors of single rock fractures. Chin. J. Rock Mech. Eng. 2021, 40, 3063–3073. Available online: https://rockmech.whrsm.ac.cn/EN/10.13722/j.cnki.jrme.2021.0553 (accessed on 28 September 2026).
- Li, H.T.; Li, X.L.; Fu, J.H.; Zhu, N.Q.; Chen, D.Y.; Wang, Y.; Ding, S. Experimental study on compressive behavior and failure characteristics of imitation steel fiber concrete under uniaxial load. Constr. Build. Mater. 2023, 399, 132599. [Google Scholar] [CrossRef] [Scilit]
- Liu, S.M.; Sun, H.T.; Zhang, D.M.; Yang, K.; Li, X.L.; Wang, D.K.; Li, Y.N. Experimental study of effect of liquid nitrogen cold soaking on coal pore structure and fractal characteristics. Energy 2023, 275, 127470. [Google Scholar] [CrossRef] [Scilit]
- Li, X.L.; Wang, E.Y.; Li, Z.H.; Liu, Z.T.; Song, D.Z.; Qiu, L.M. Rock burst monitoring by integrated microseismic and electromagnetic radiation methods. Rock Mech. Rock Eng. 2016, 49, 4393–4406. [Google Scholar] [CrossRef] [Scilit]
- Li, X.L.; Chen, S.J.; Wang, E.Y.; Li, Z.H. Rockburst mechanism in coal rock with structural surface and the microseismic and electromagnetic radiation response. Eng. Fail. Anal. 2021, 124, 105396. [Google Scholar] [CrossRef] [Scilit]
- Li, X.L.; Han, R.H.; Liu, S.M.; Li, B.L.; Wan, N. Parameter optimization of coal seam hydraulic seepage enhancement measures based on principal component analysis. Rock Mech. Rock Eng. 2026. [Google Scholar] [CrossRef] [Scilit]
- Wang, W.; Gao, S.; Wu, H.; Chen, P.Y.; Xu, D.N.; Xu, H.Y.; Jing, M.X.; Sun, Q.; Chang, S.C.; Sun, Z.Z.; et al. Reverse Tesla valve modulated efficient water evaporation and cooling. Nat. Commun. 2026, 17, 8100. [Google Scholar] [CrossRef] [Scilit] [PubMed]
- Li, Q.G.; Ju, Y.W.; Gu, S.Y.; Wu, P.; Wu, L.N.; Xia, P.; Yu, K.; Gao, W.; Chang, X.X. Coalbed methane accumulation indicated by geochemical evidences from fracture-filling minerals in Huaibei coalfield, East China. Geochem. Int. 2022, 60, 52–66. [Google Scholar] [CrossRef] [Scilit]
- Yin, D.W.; Wang, F.; Zhang, J.C.; Li, F.X.; Zhu, C.; Feng, F. Experimental study on the short-term uniaxial creep characteristics of sandstone-coal composite samples. Minerals 2021, 11, 1398. [Google Scholar] [CrossRef] [Scilit]
- Li, C.T.; He, Y.L.; Sun, X.Y.; Fu, Y.P. Fracture evolution characteristics and deformation laws of overlying strata during the initial period of longwall mining: Case study. Sustainability 2023, 15, 8596. [Google Scholar] [CrossRef] [Scilit]
- Pei, Y.L.; Luo, J.; Ma, C.; Ma, P.; Lin, X.; Li, W.; Yan, J.P.; Sun, X.Y. Pollution characteristics and health risk assessment of fluoride and potentially toxic elements in coal mine water of Shanxi Province, North China: A comparative analysis of raw mine water and mine drainage. Toxics 2026, 14, 553. [Google Scholar] [CrossRef] [Scilit] [PubMed]
- Dong, F.X.; Peng, Z.; Sun, W.B.; Zhou, S.L.; Kong, L.J. Experimental research on the effect of water-rock interaction in filling media of fault structure. Geomech. Eng. 2021, 24, 471–478. [Google Scholar] [CrossRef]
- Duan, X.B.; Huang, Y.C.; Hao, Y.X.; Zhang, L. Research on the testing method for the rheological properties of large-particle gangue filling slurry. Processes 2025, 13, 789. [Google Scholar] [CrossRef] [Scilit]
- Zhang, X.; Zhu, S.T.; Yang, T.; Wang, Y.J.; Li, J.J.; Li, K.Q. The influence of coal gangue dosage and concentration on the properties and hydration mechanism of fly ash-based cemented filling materials. J. Clean. Prod. 2025, 492, 144903. [Google Scholar] [CrossRef] [Scilit]
- Huang, B.X.; Liu, J.W. The effect of loading rate on the behavior of samples composed of coal and rock. Int. J. Rock Mech. Min. Sci. 2013, 61, 23–30. [Google Scholar] [CrossRef] [Scilit]
- Liu, X.S.; Tan, Y.L.; Ning, J.G.; Lu, Y.W.; Gu, Q.H. Mechanical properties and damage constitutive model of coal in coal-rock combined body. Int. J. Rock Mech. Min. Sci. 2018, 110, 140–150. [Google Scholar] [CrossRef] [Scilit]
- Gu, X.B.; Guo, W.Y.; Zhang, C.G.; Zhang, X.; Guo, C.; Wang, C. Effect of interfacial angle on the mechanical behaviour and acoustic emission characteristics of coal–rock composite specimens. J. Mater. Res. Technol. 2022, 21, 1933–1943. [Google Scholar] [CrossRef] [Scilit]
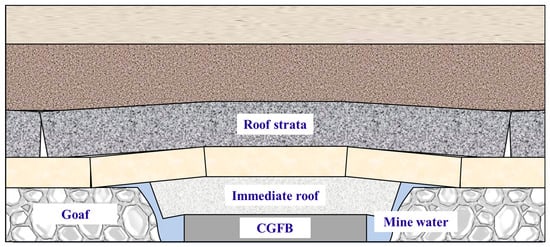
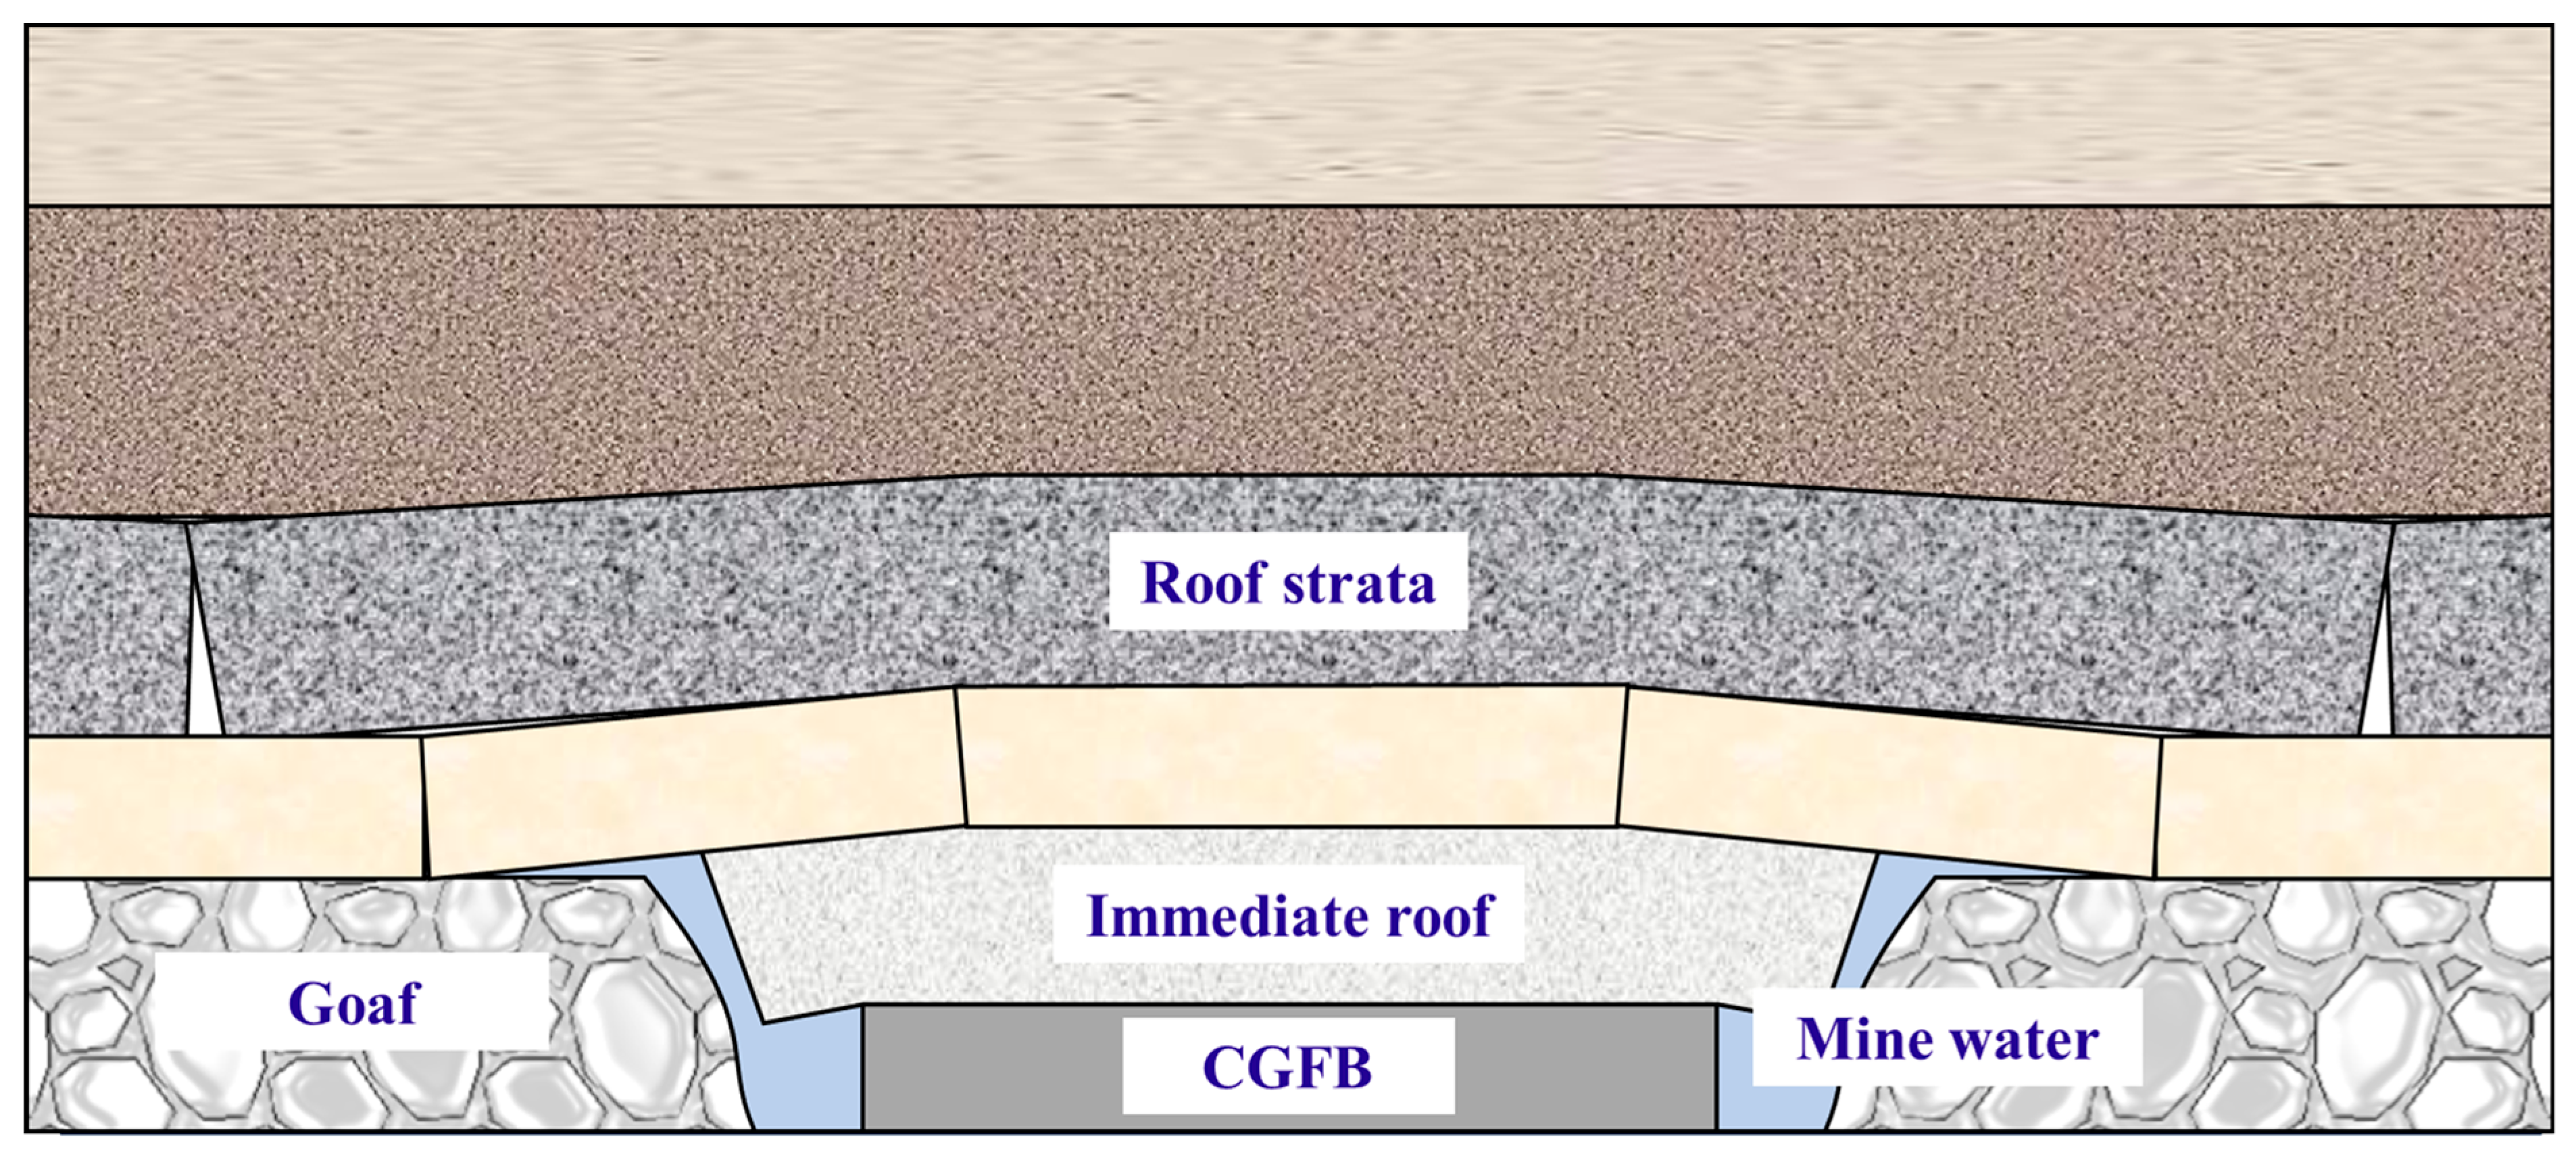
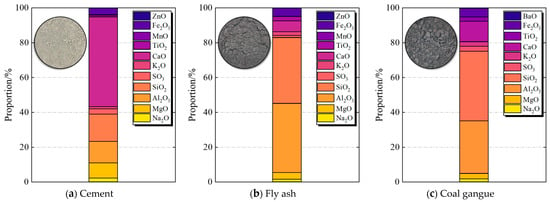
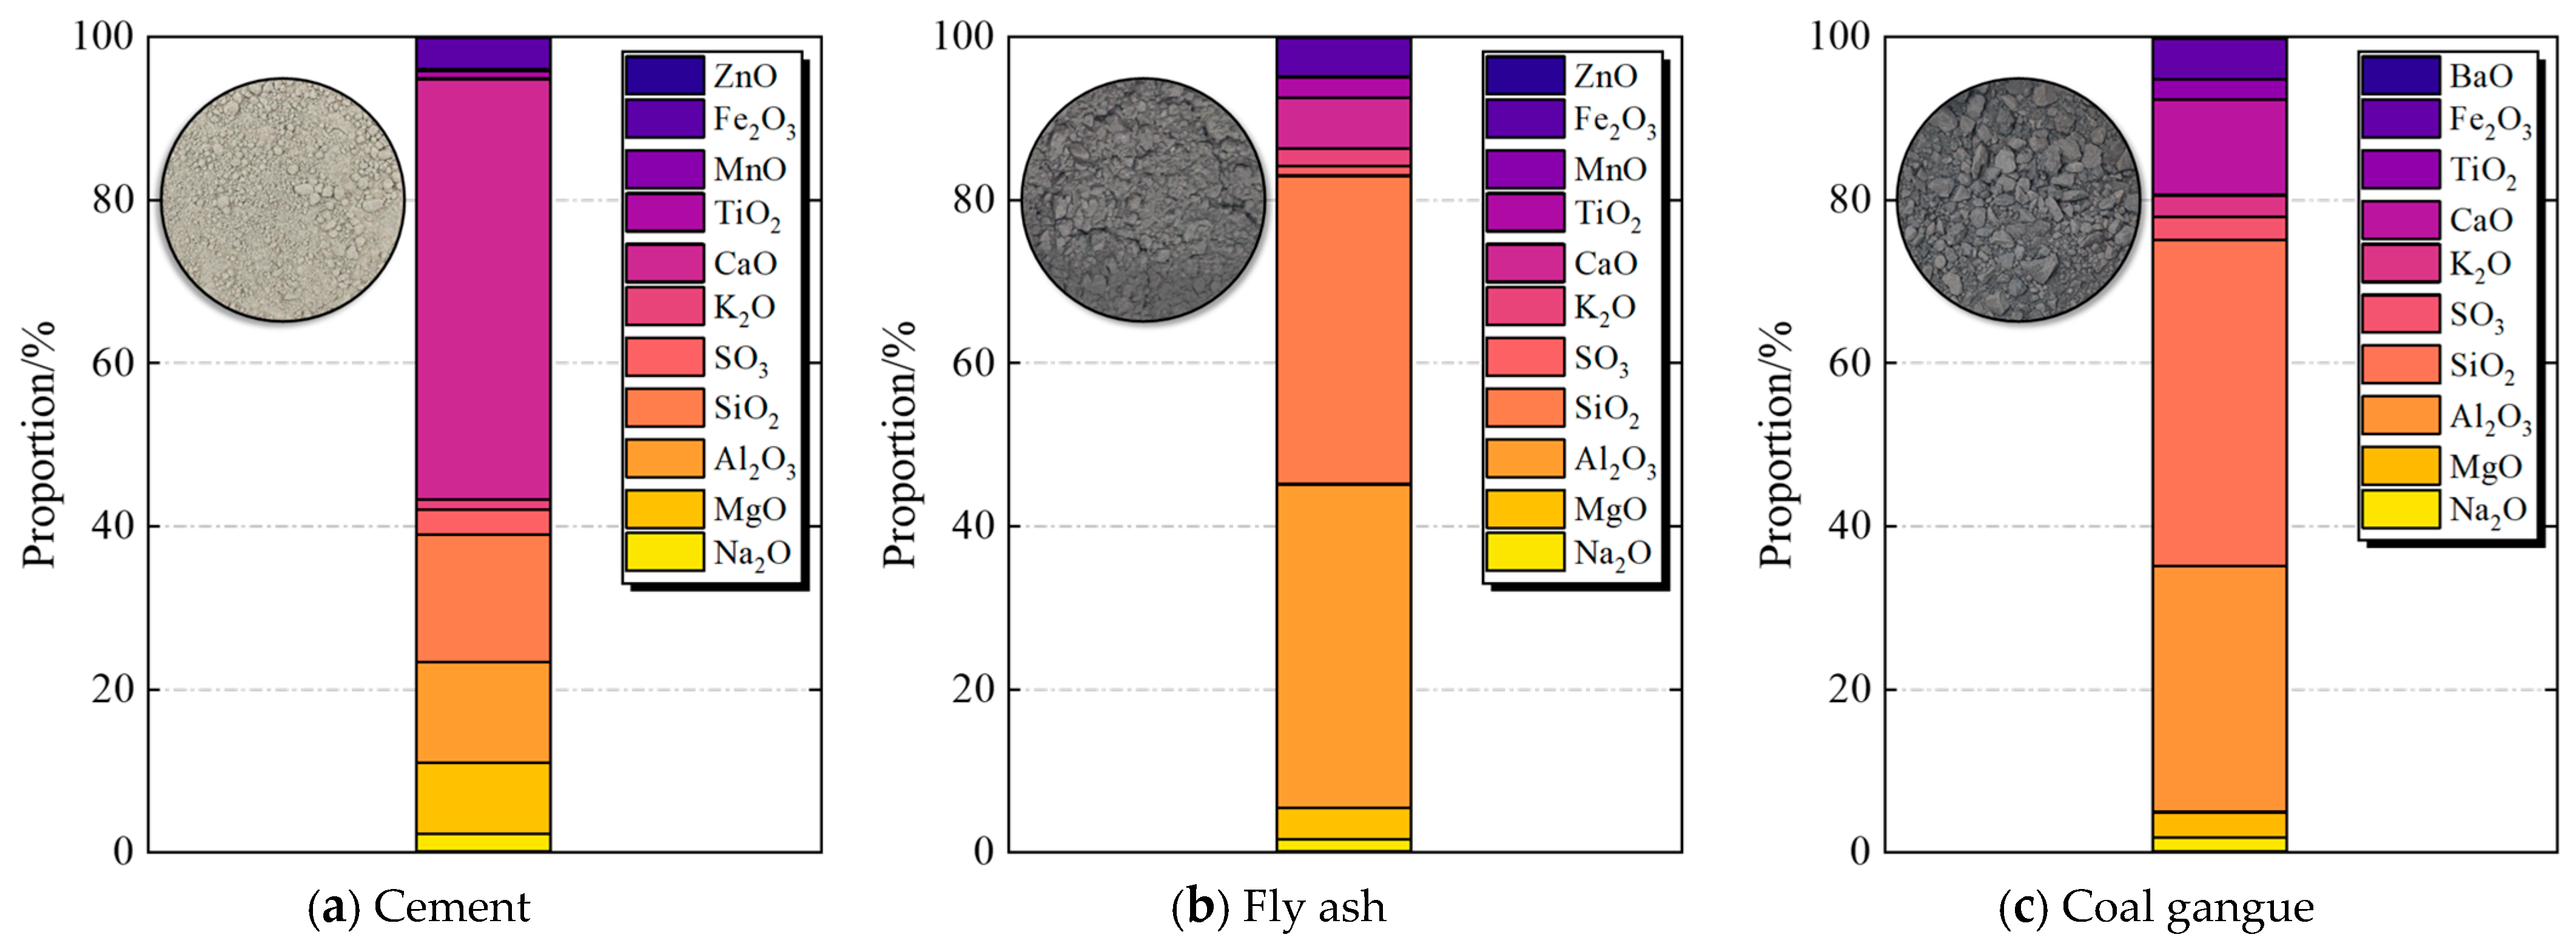
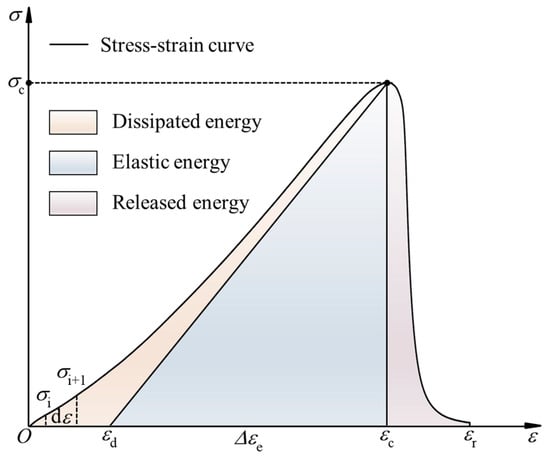
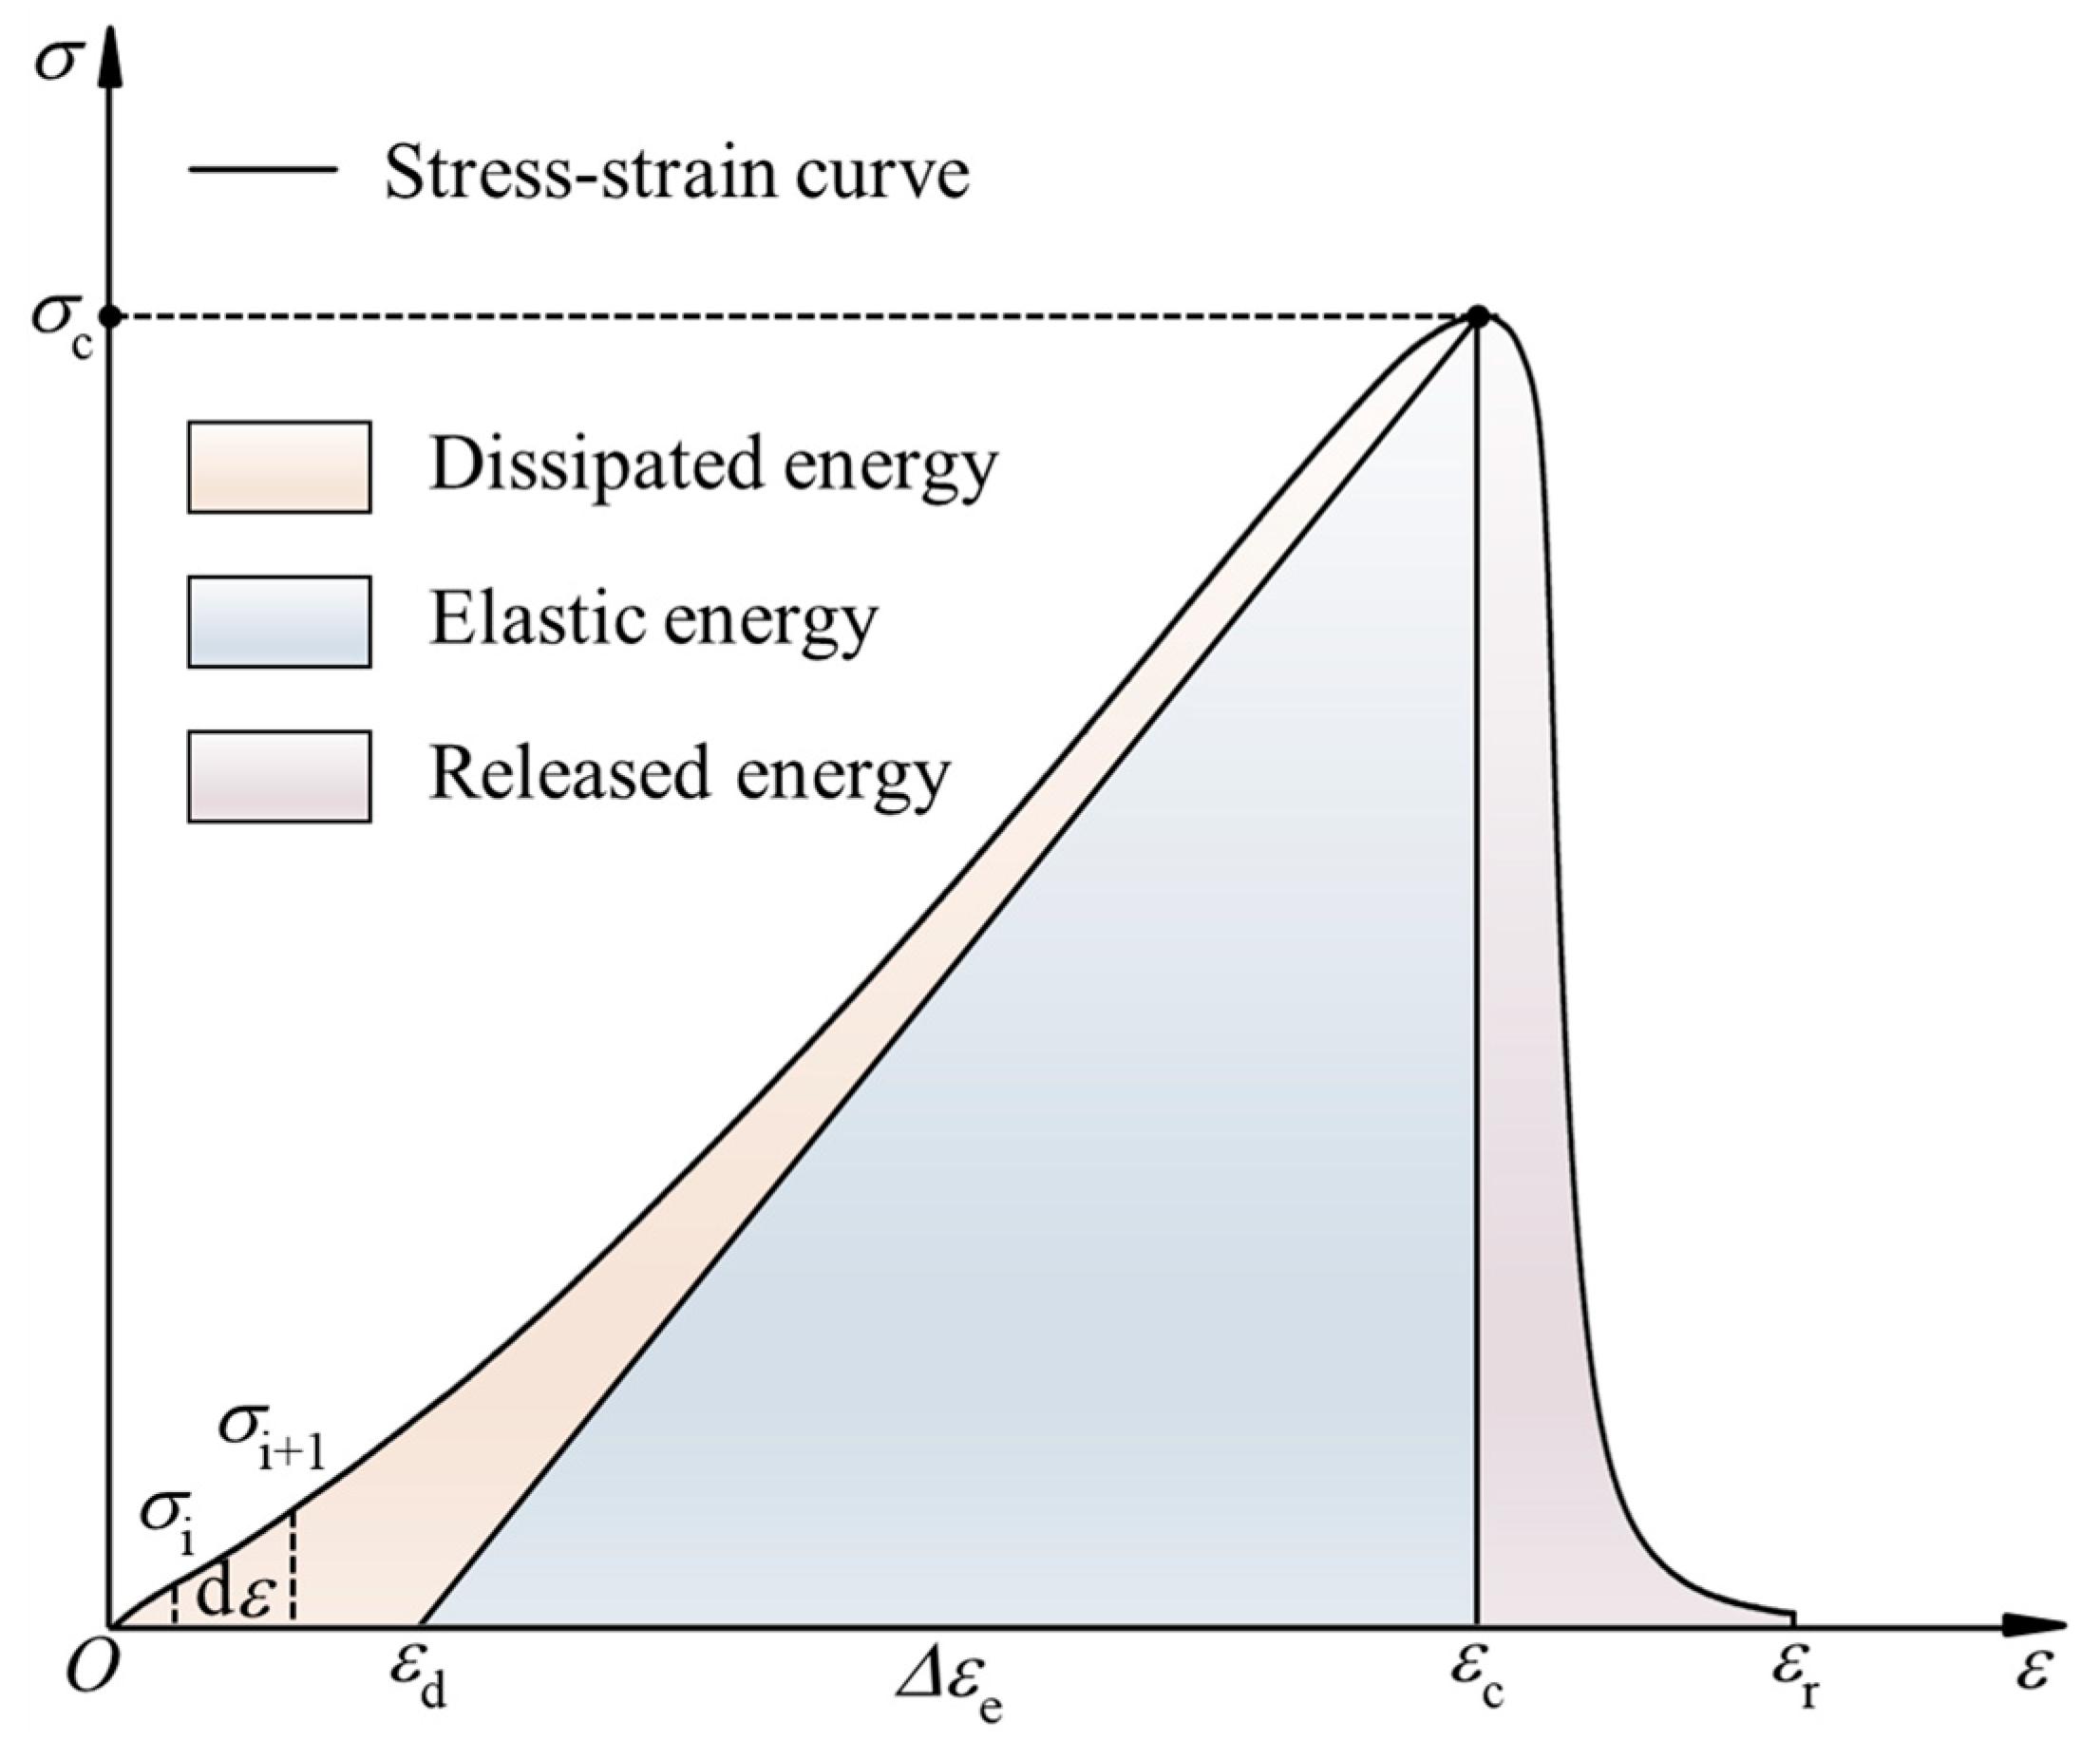
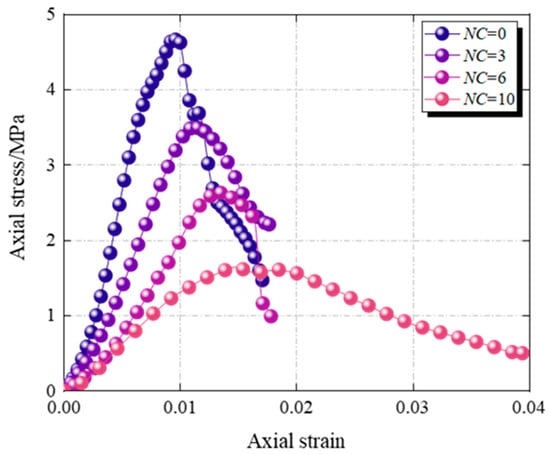
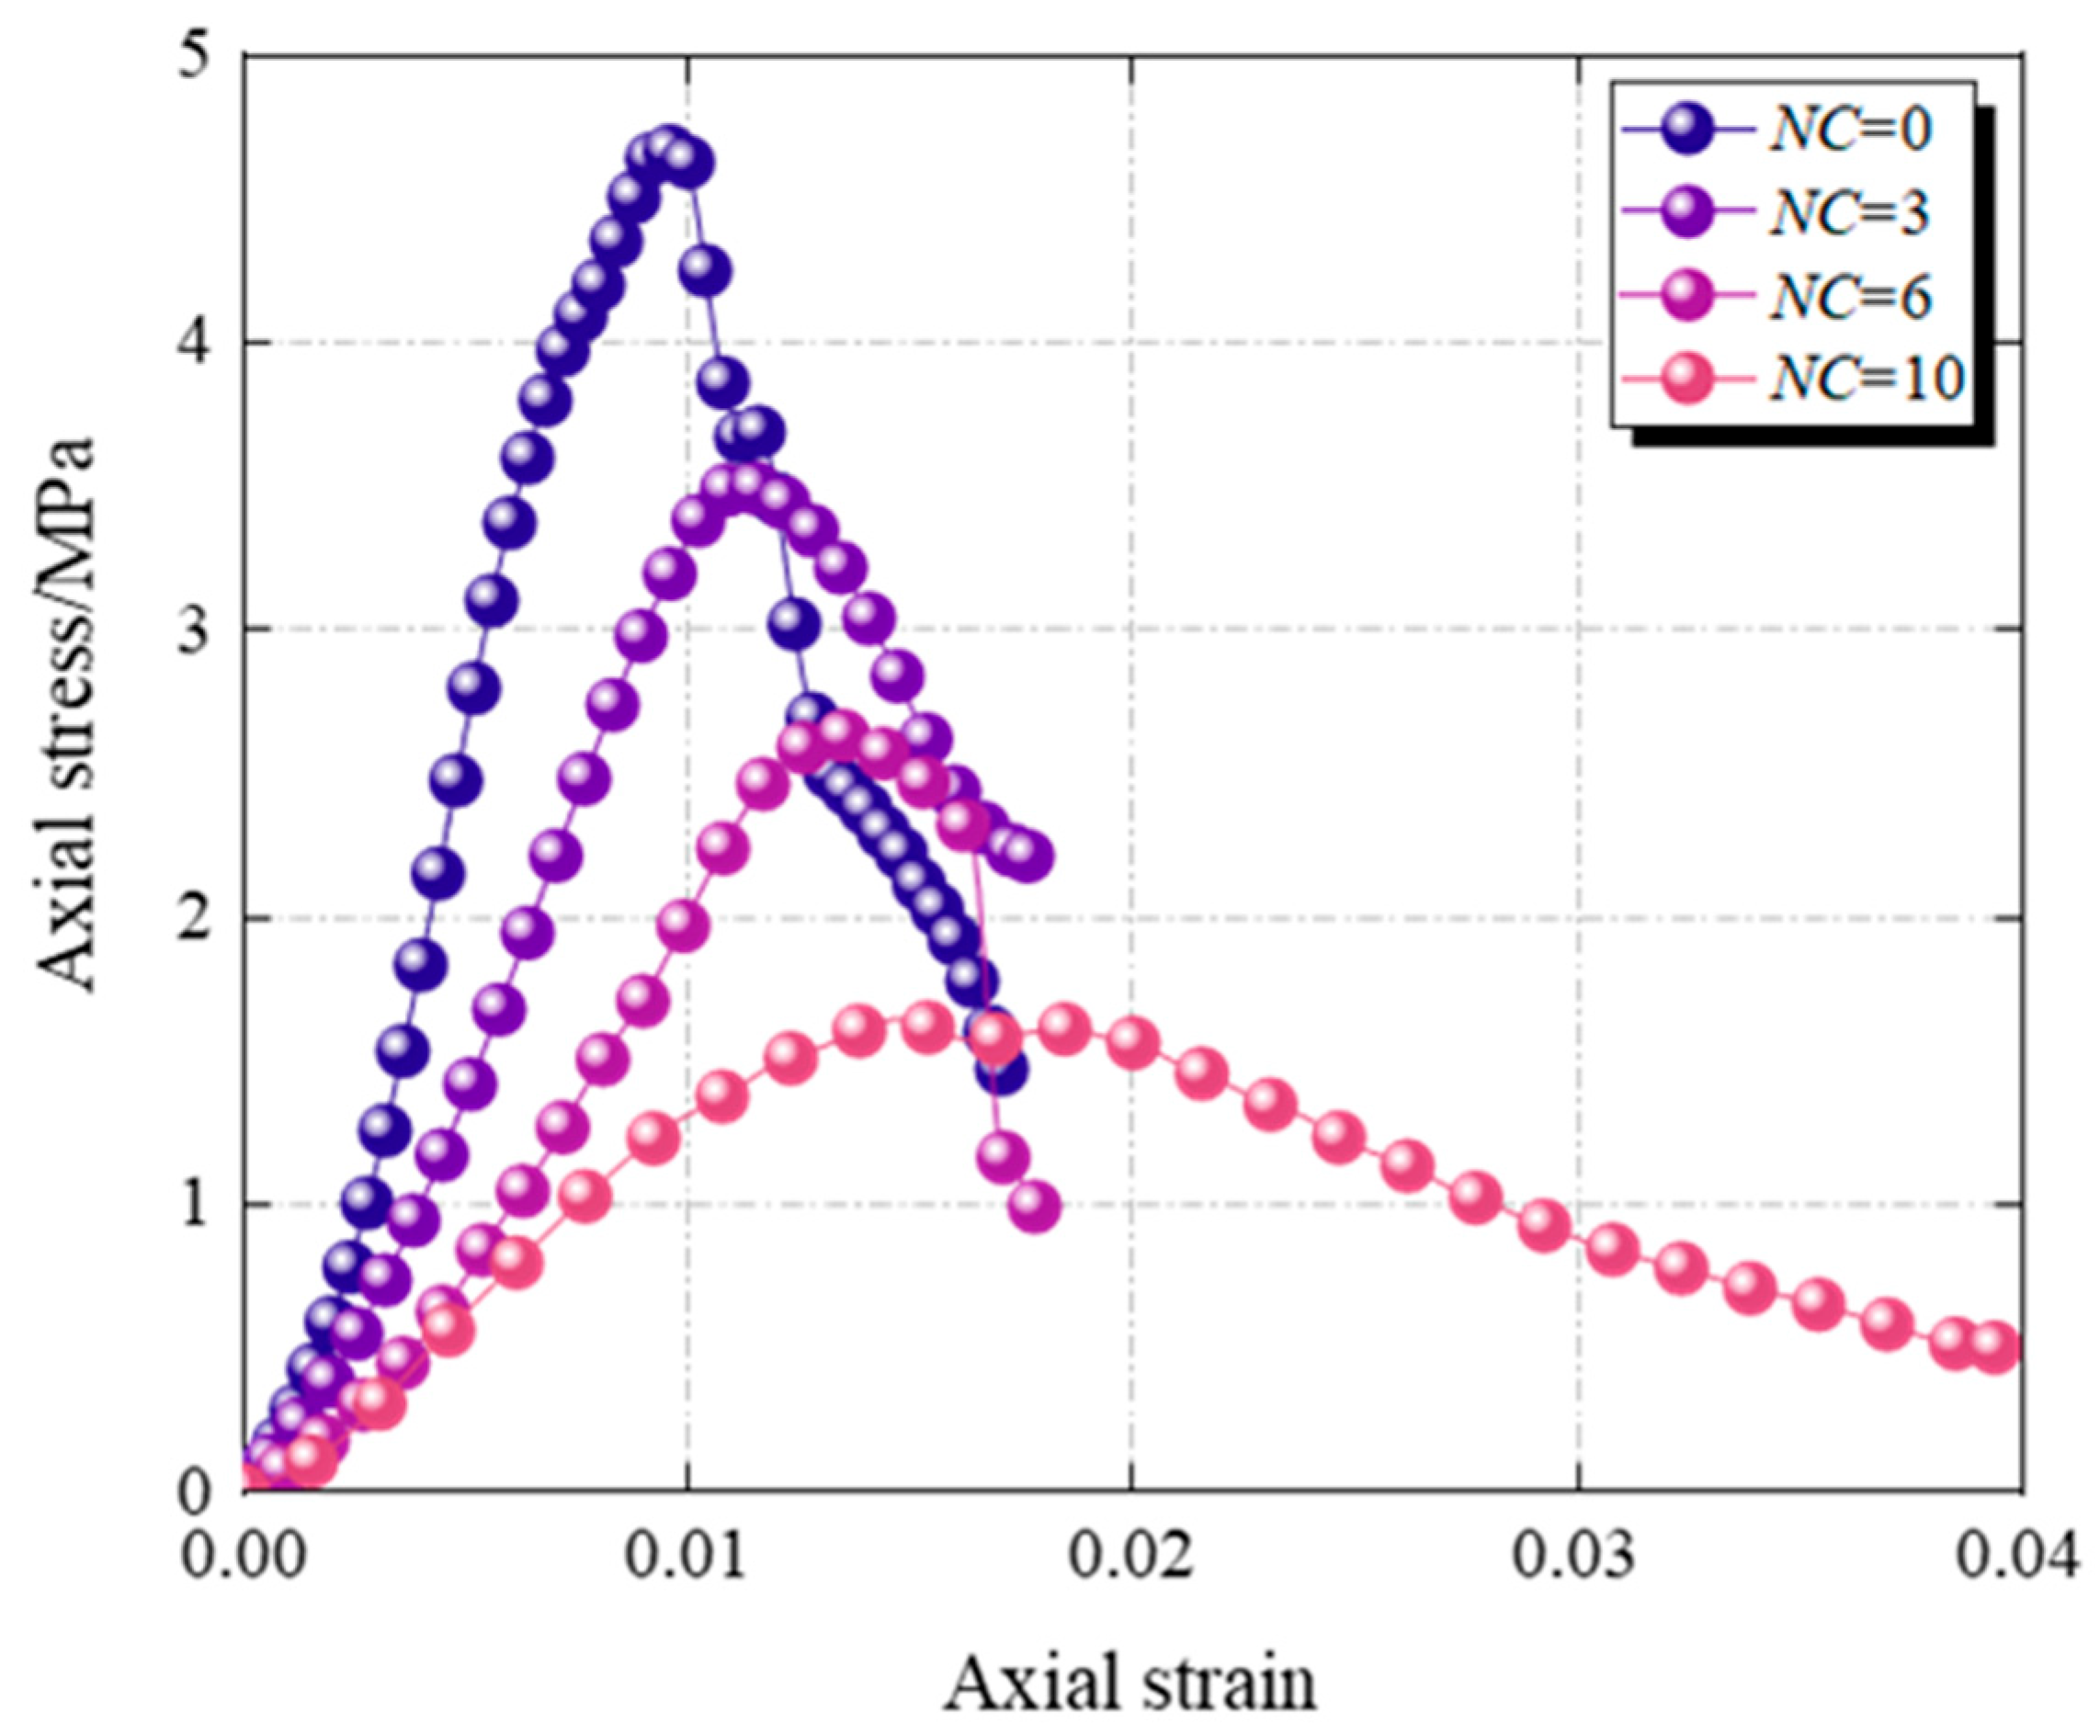
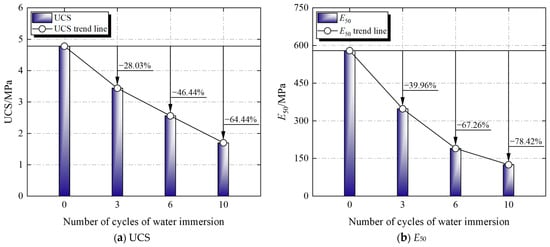
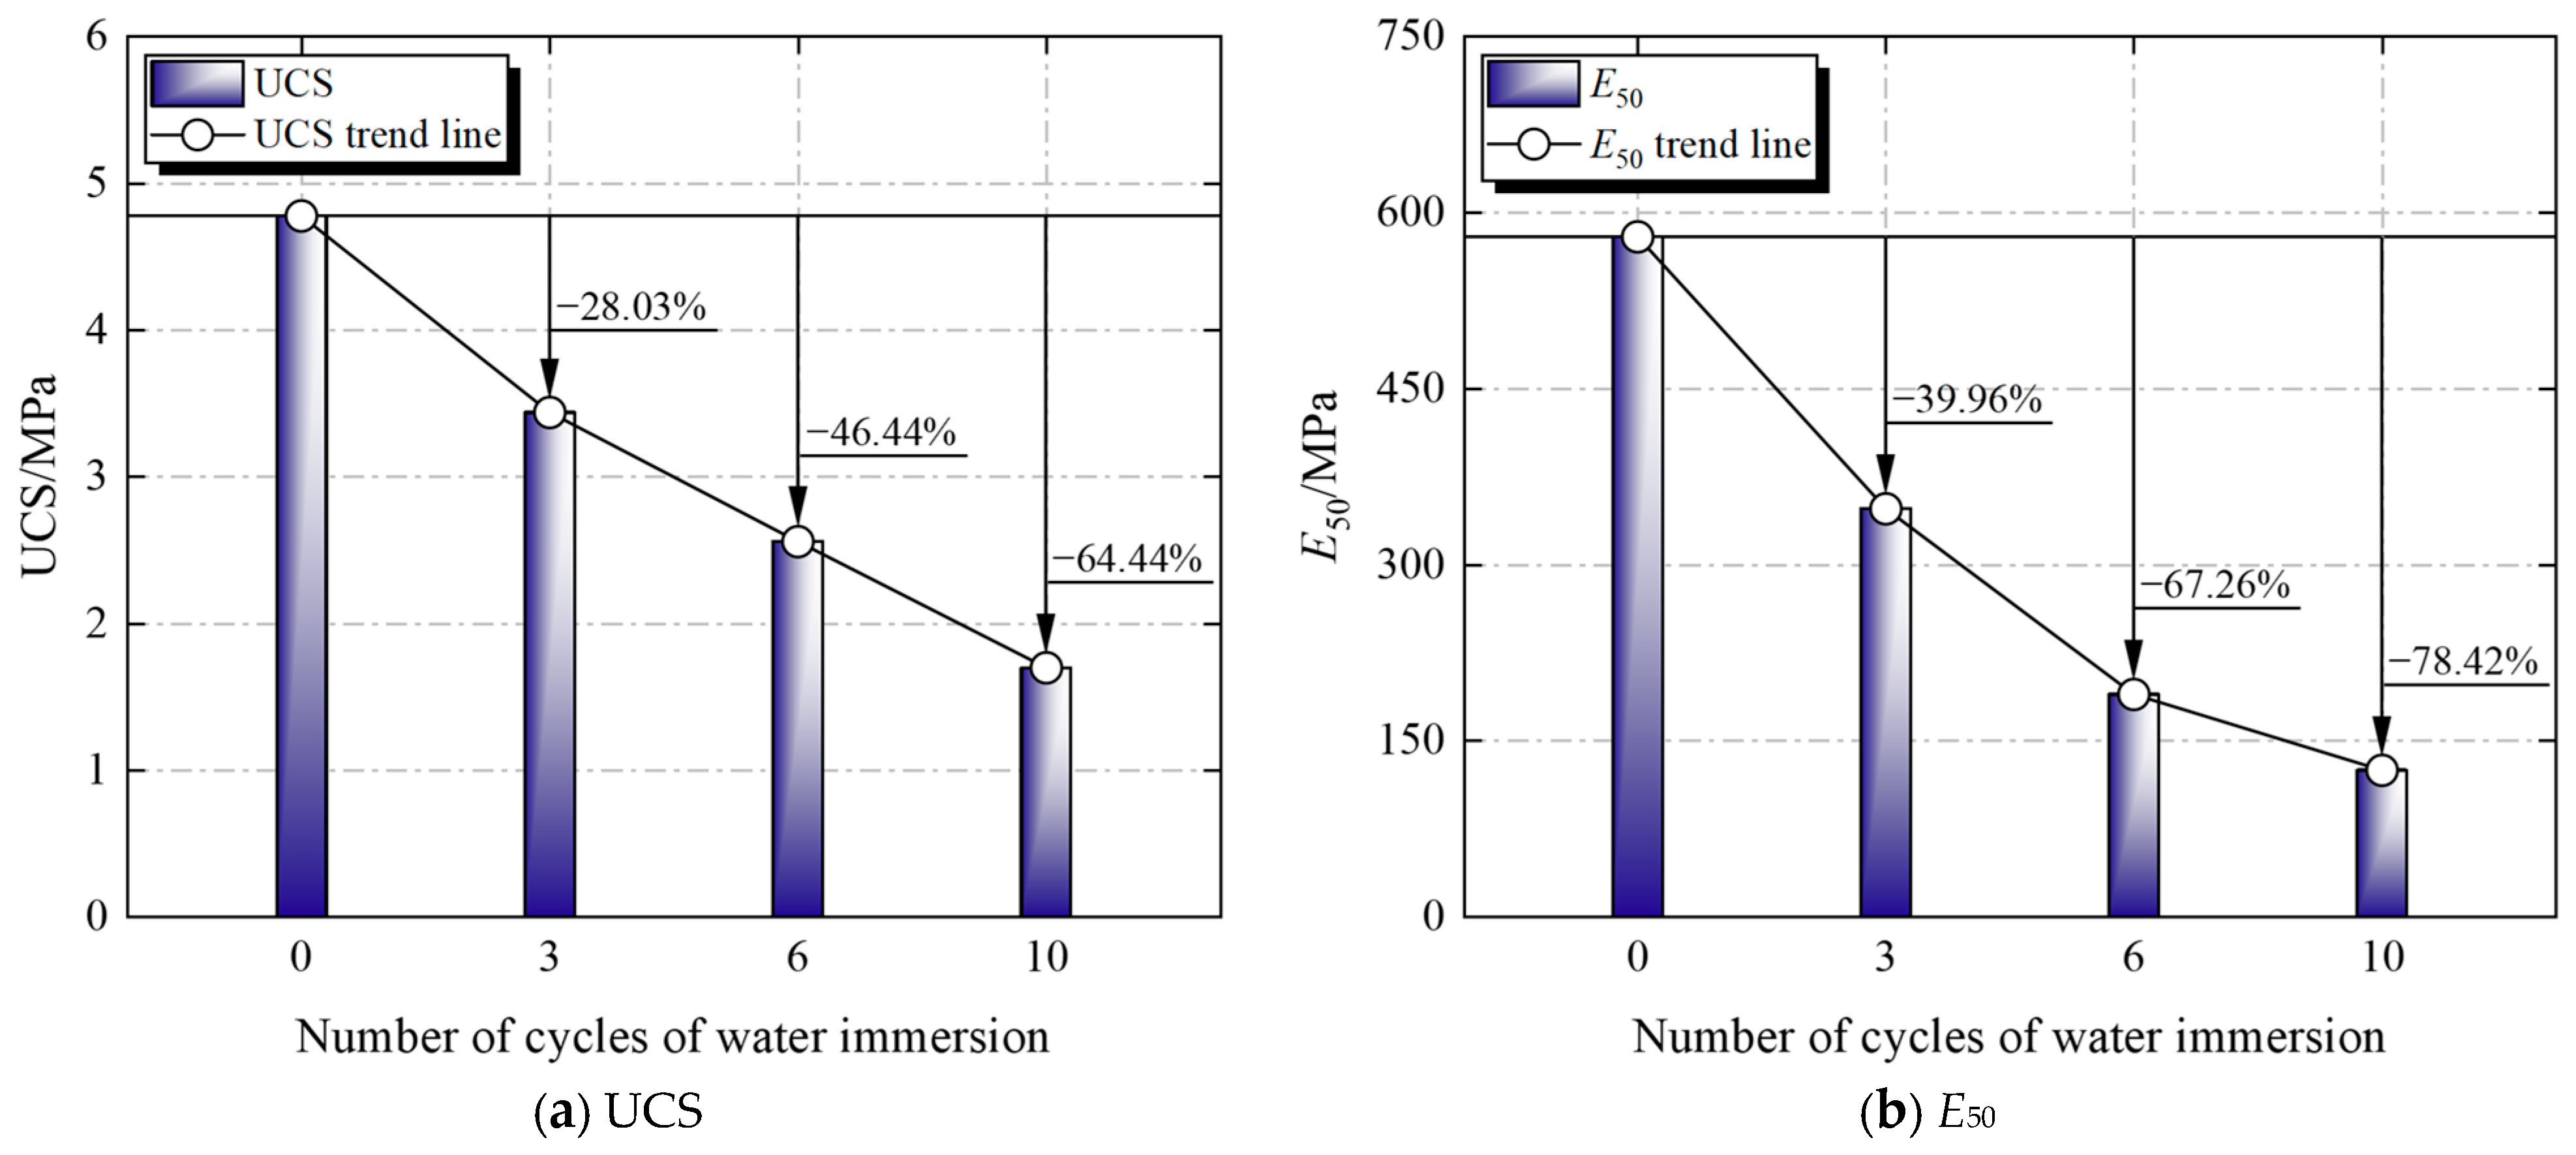
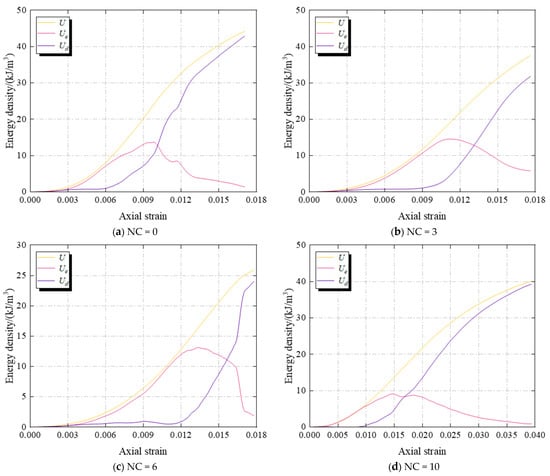
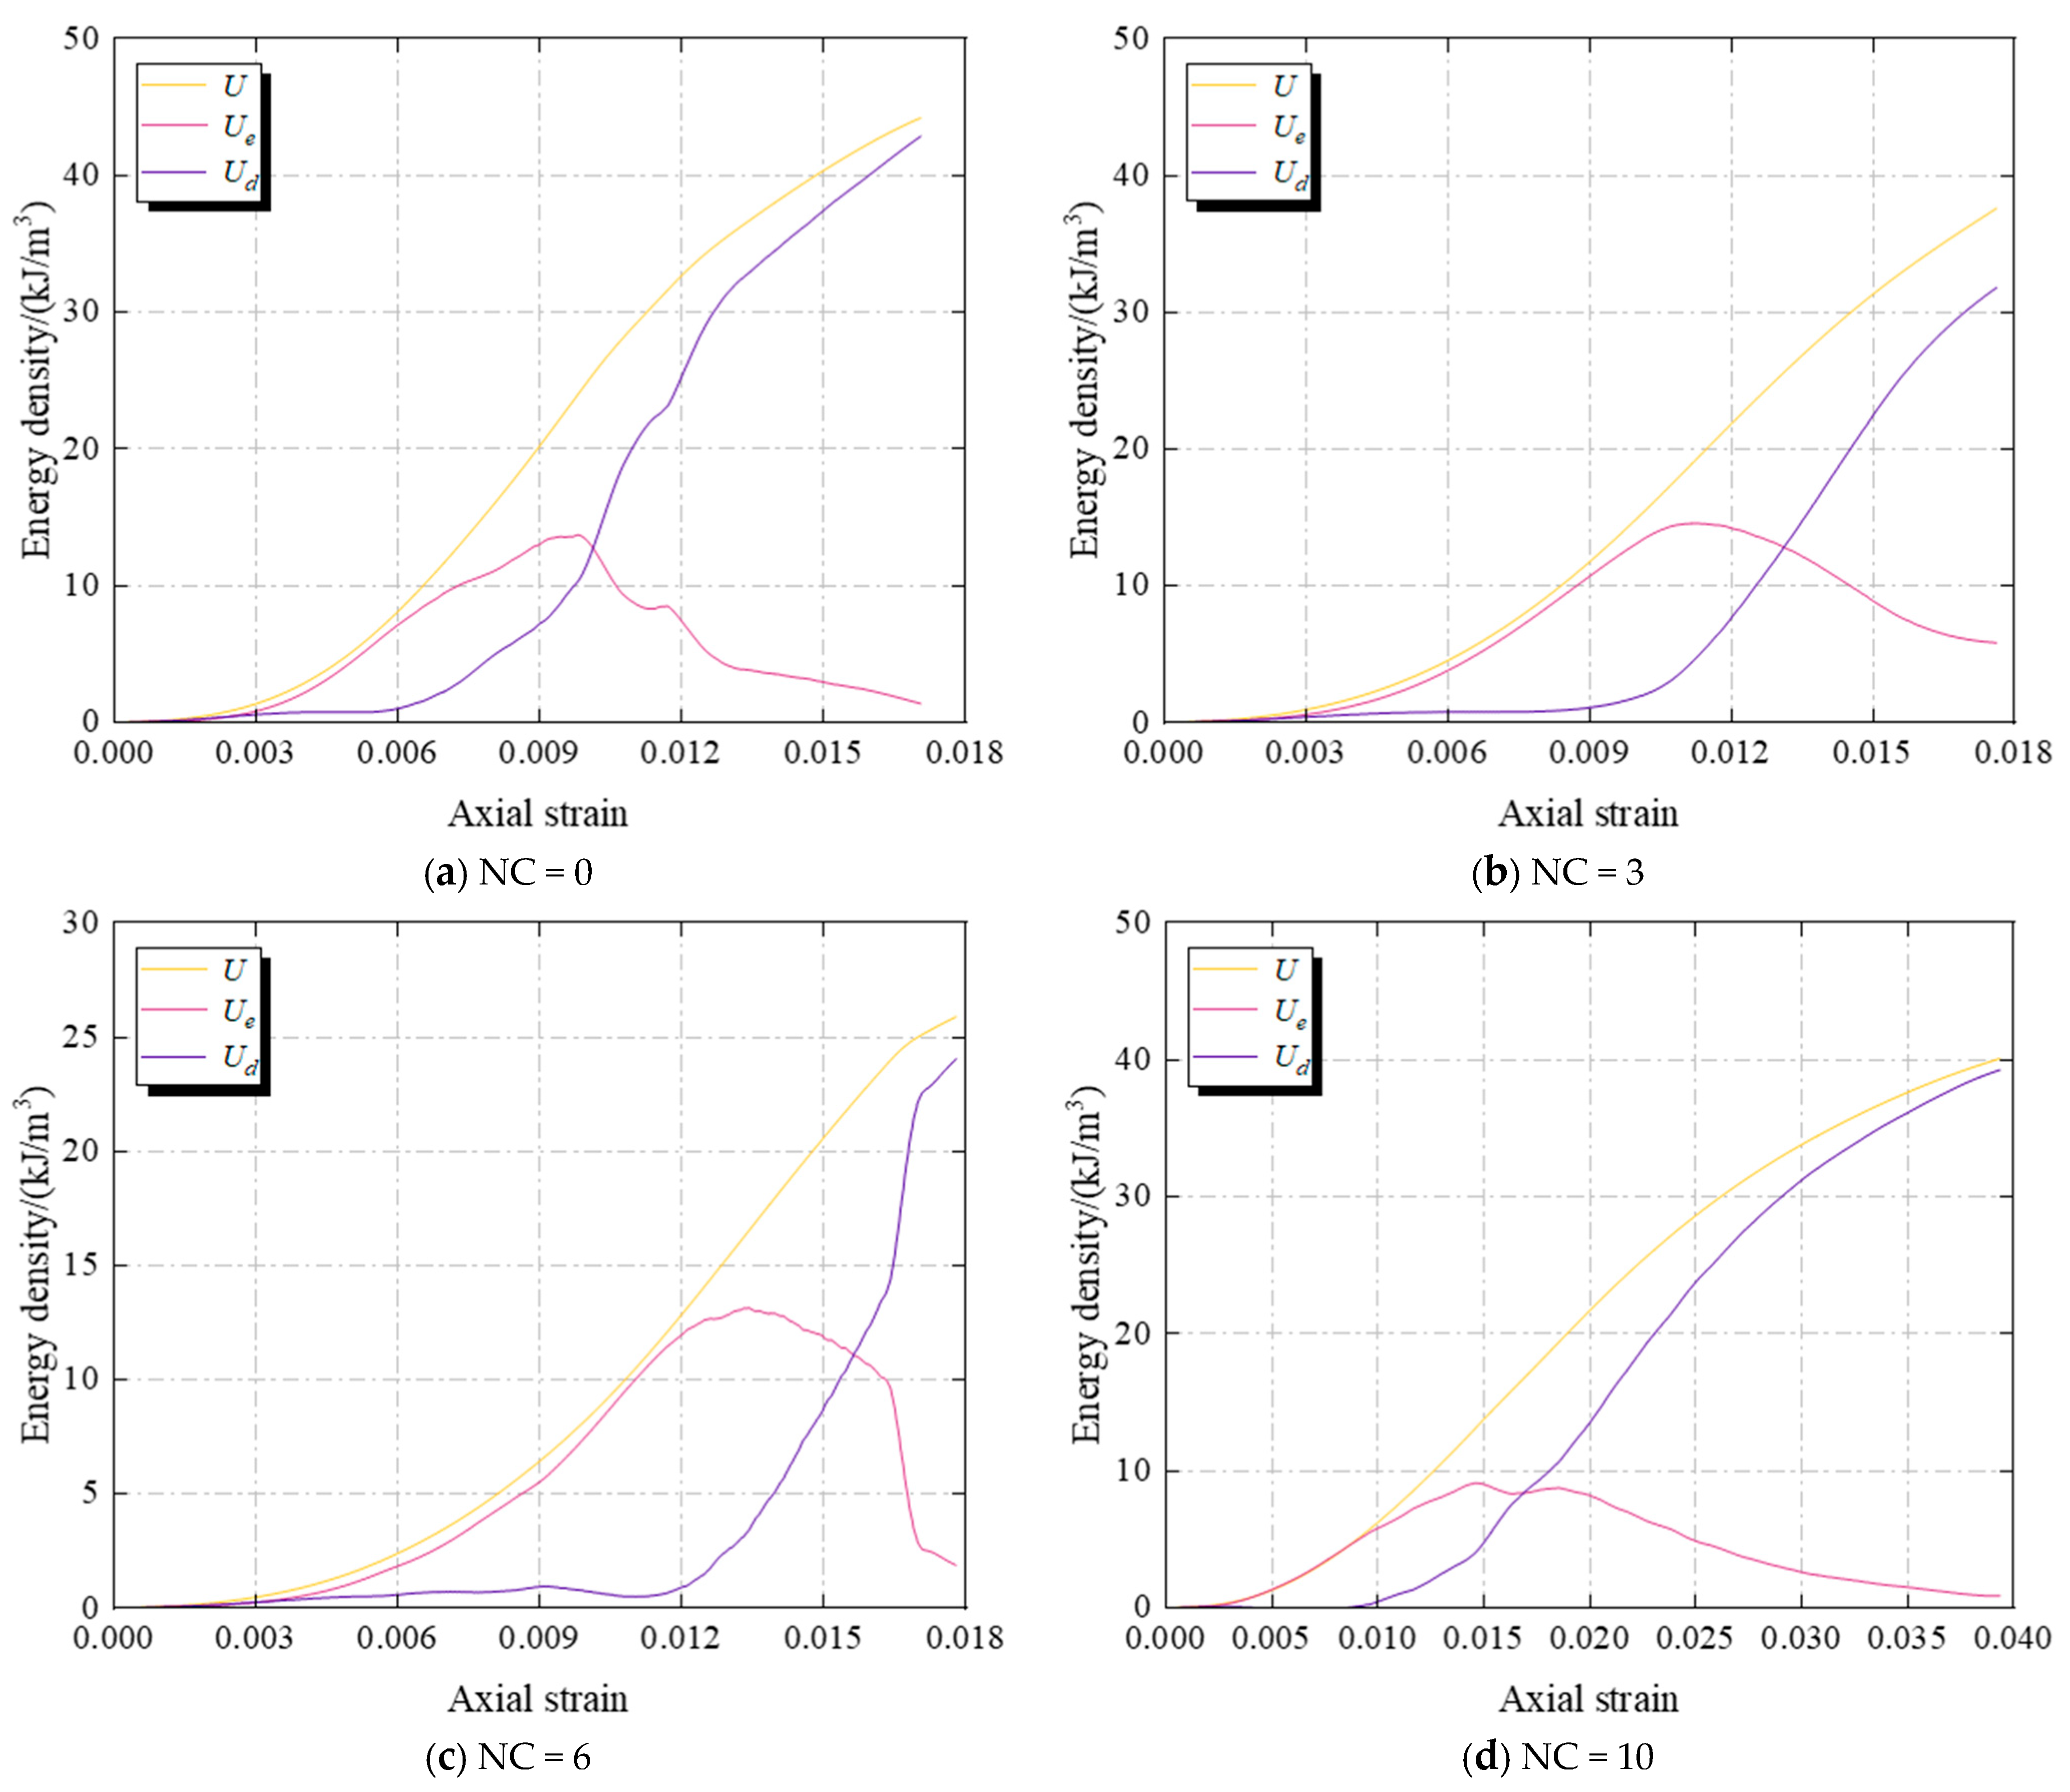
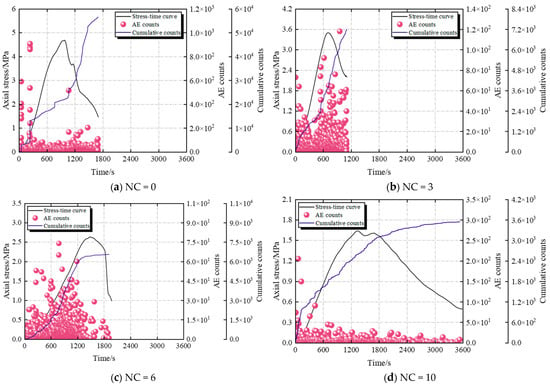
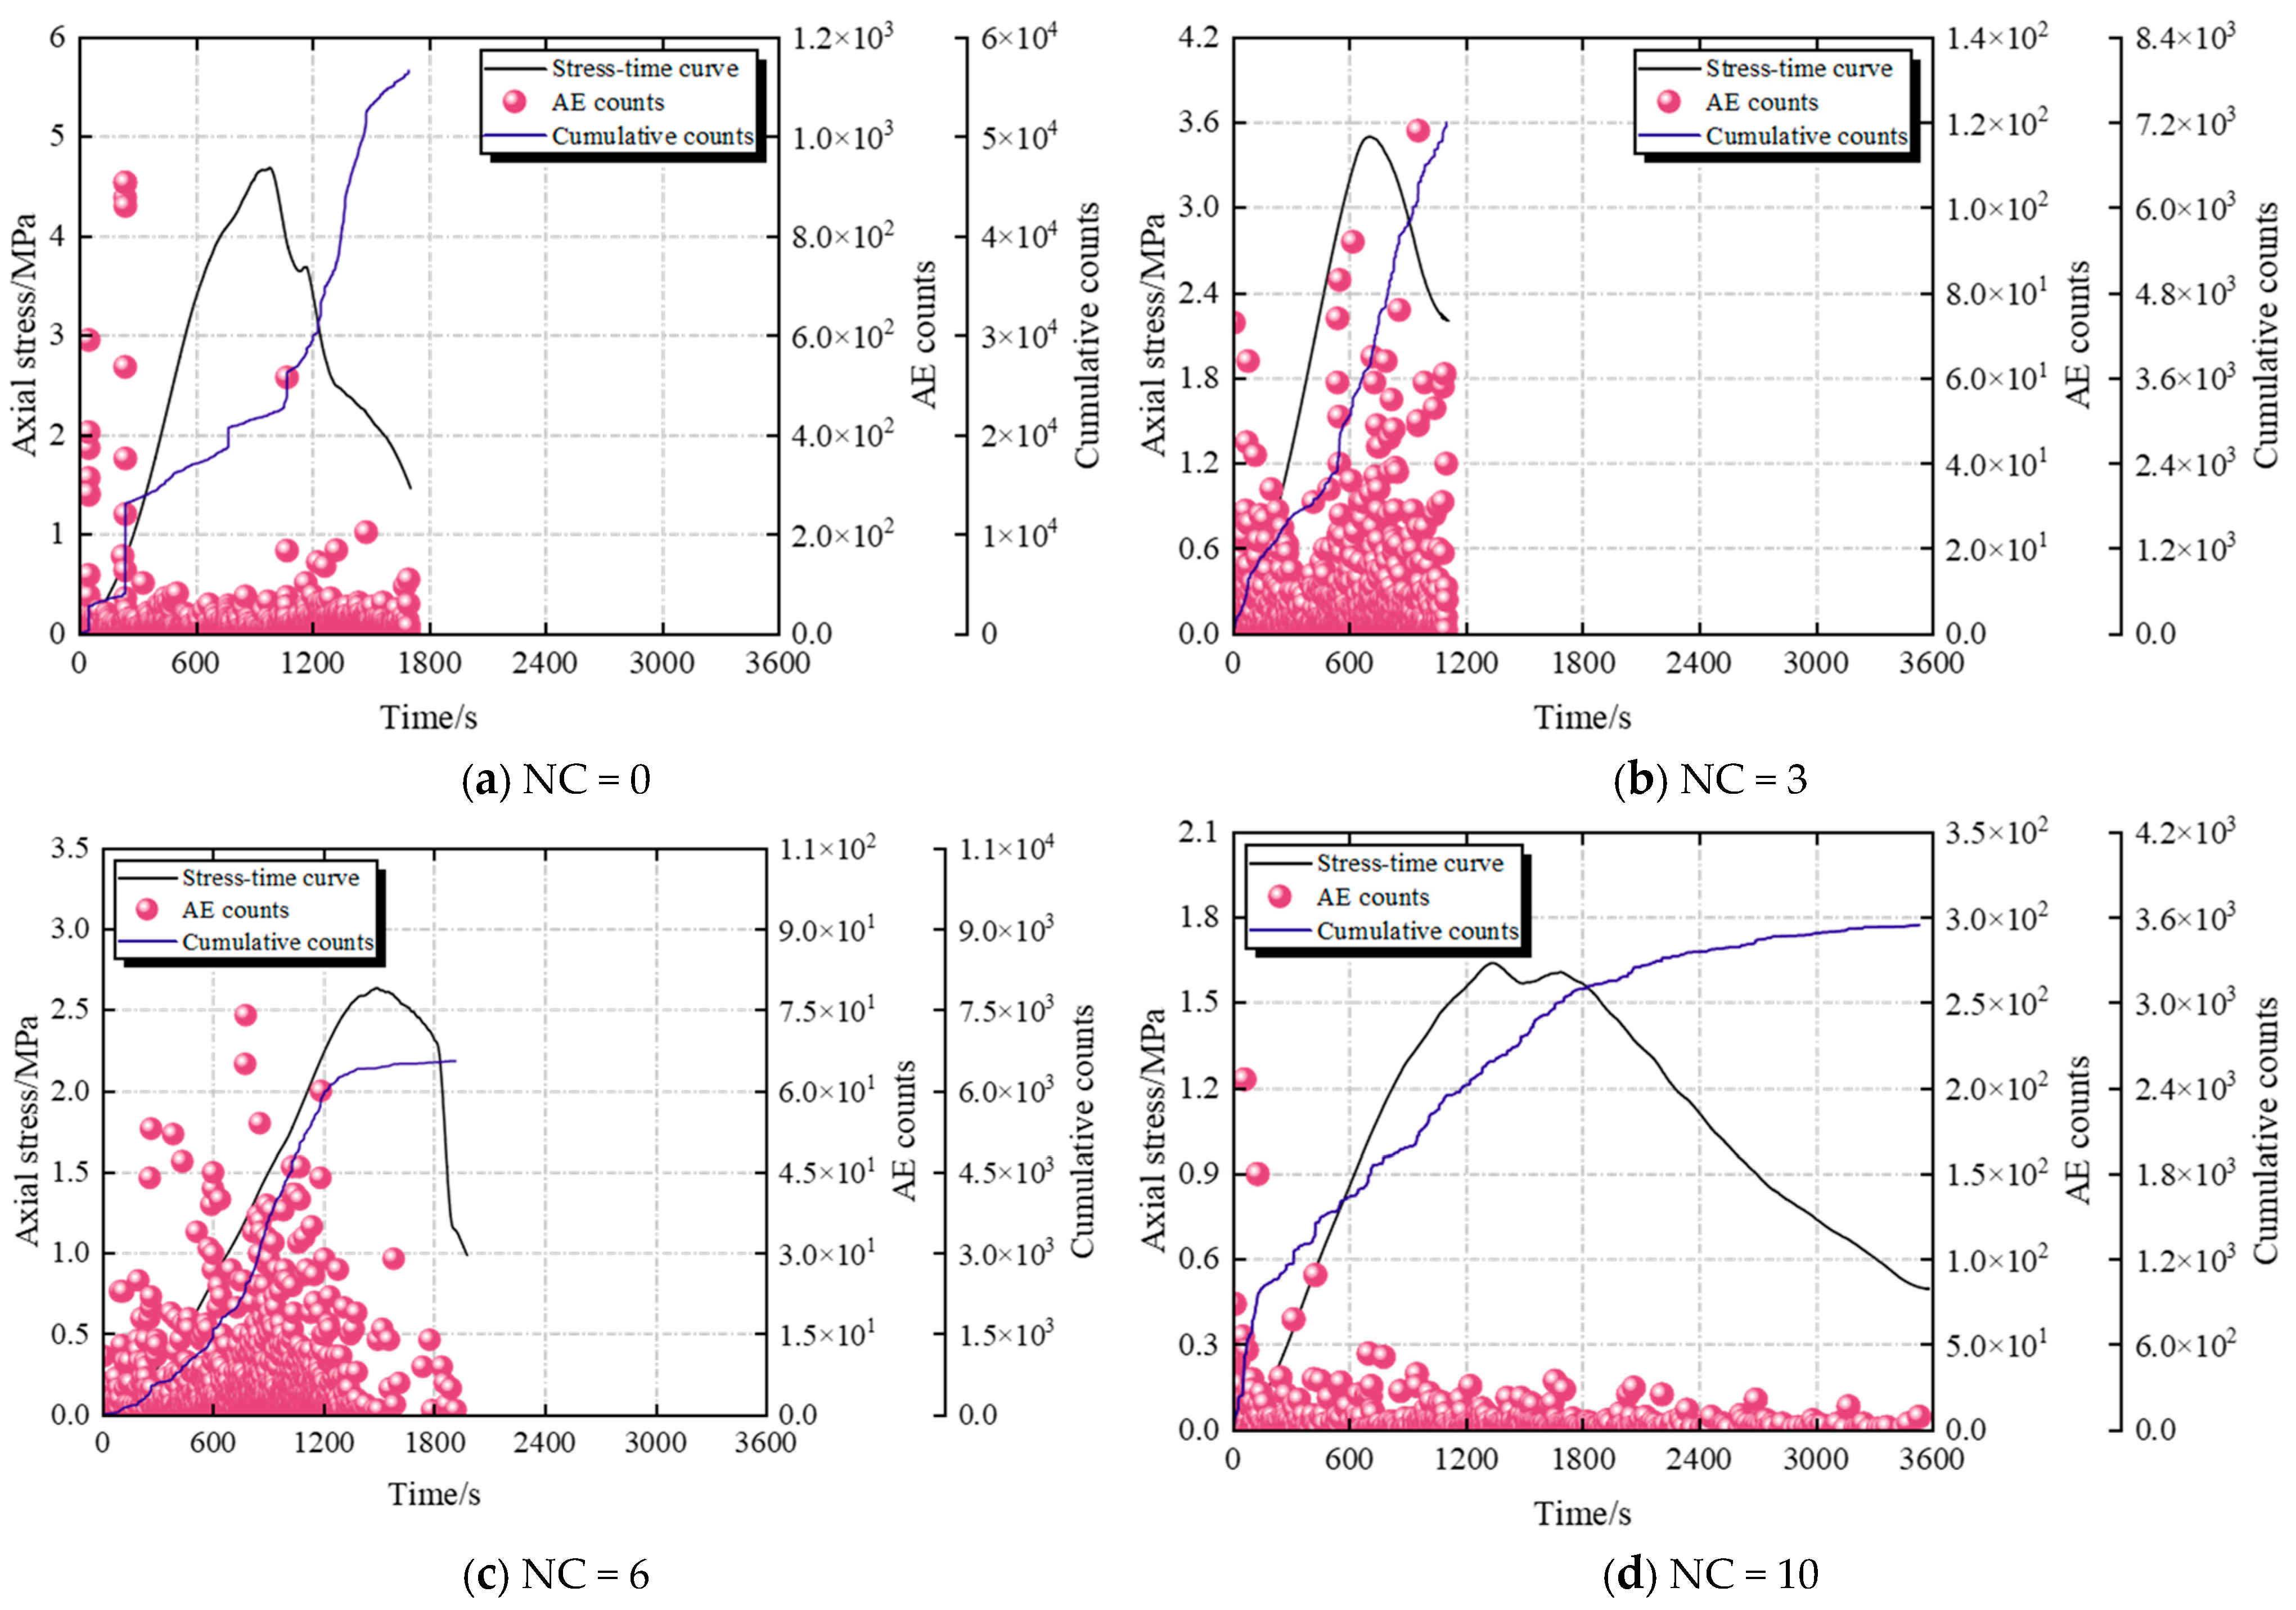
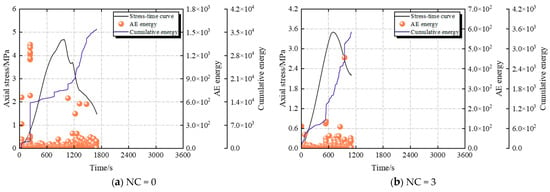
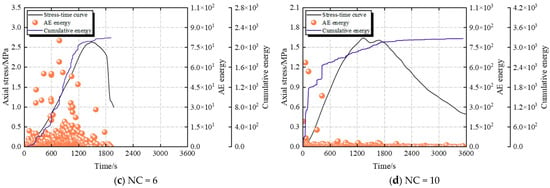
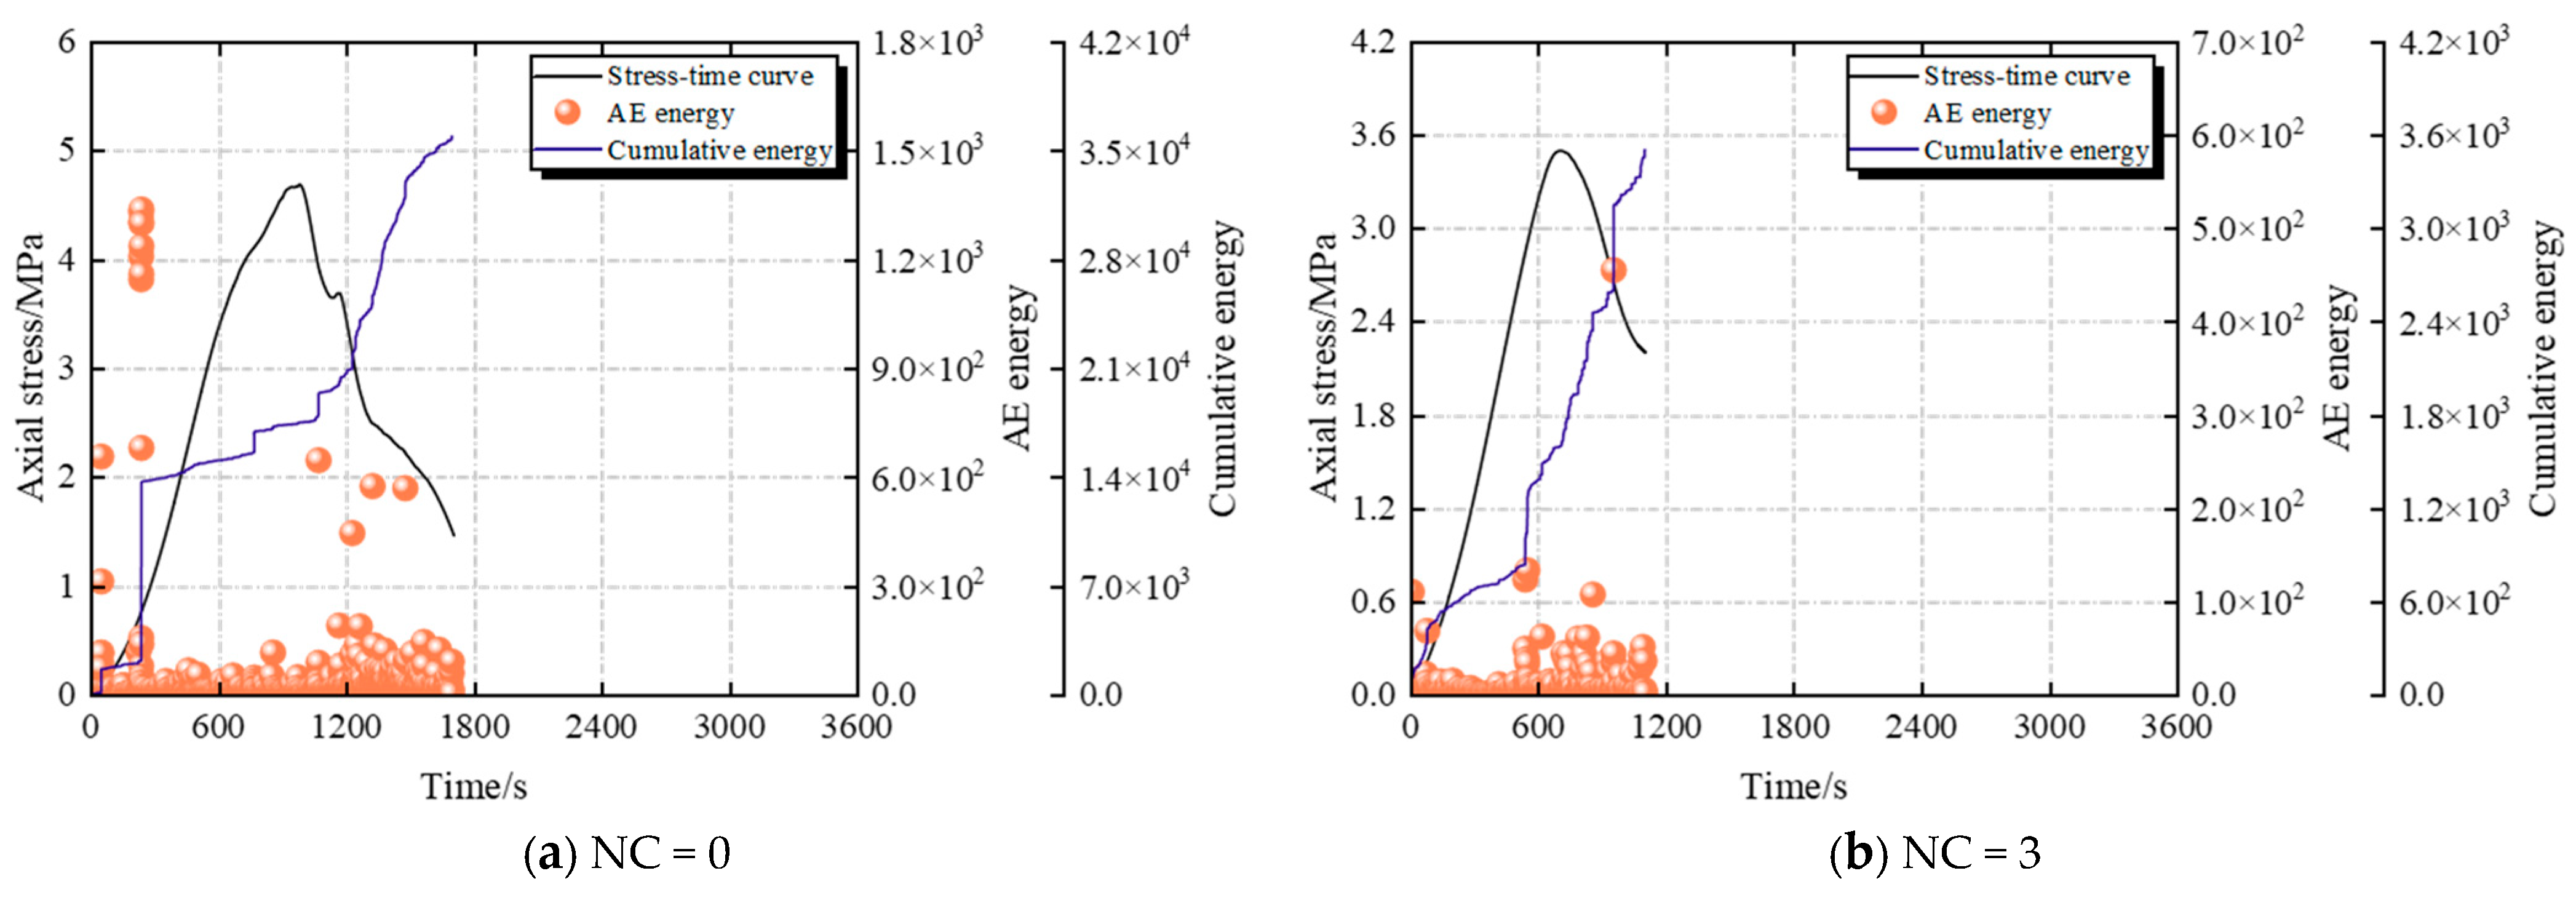
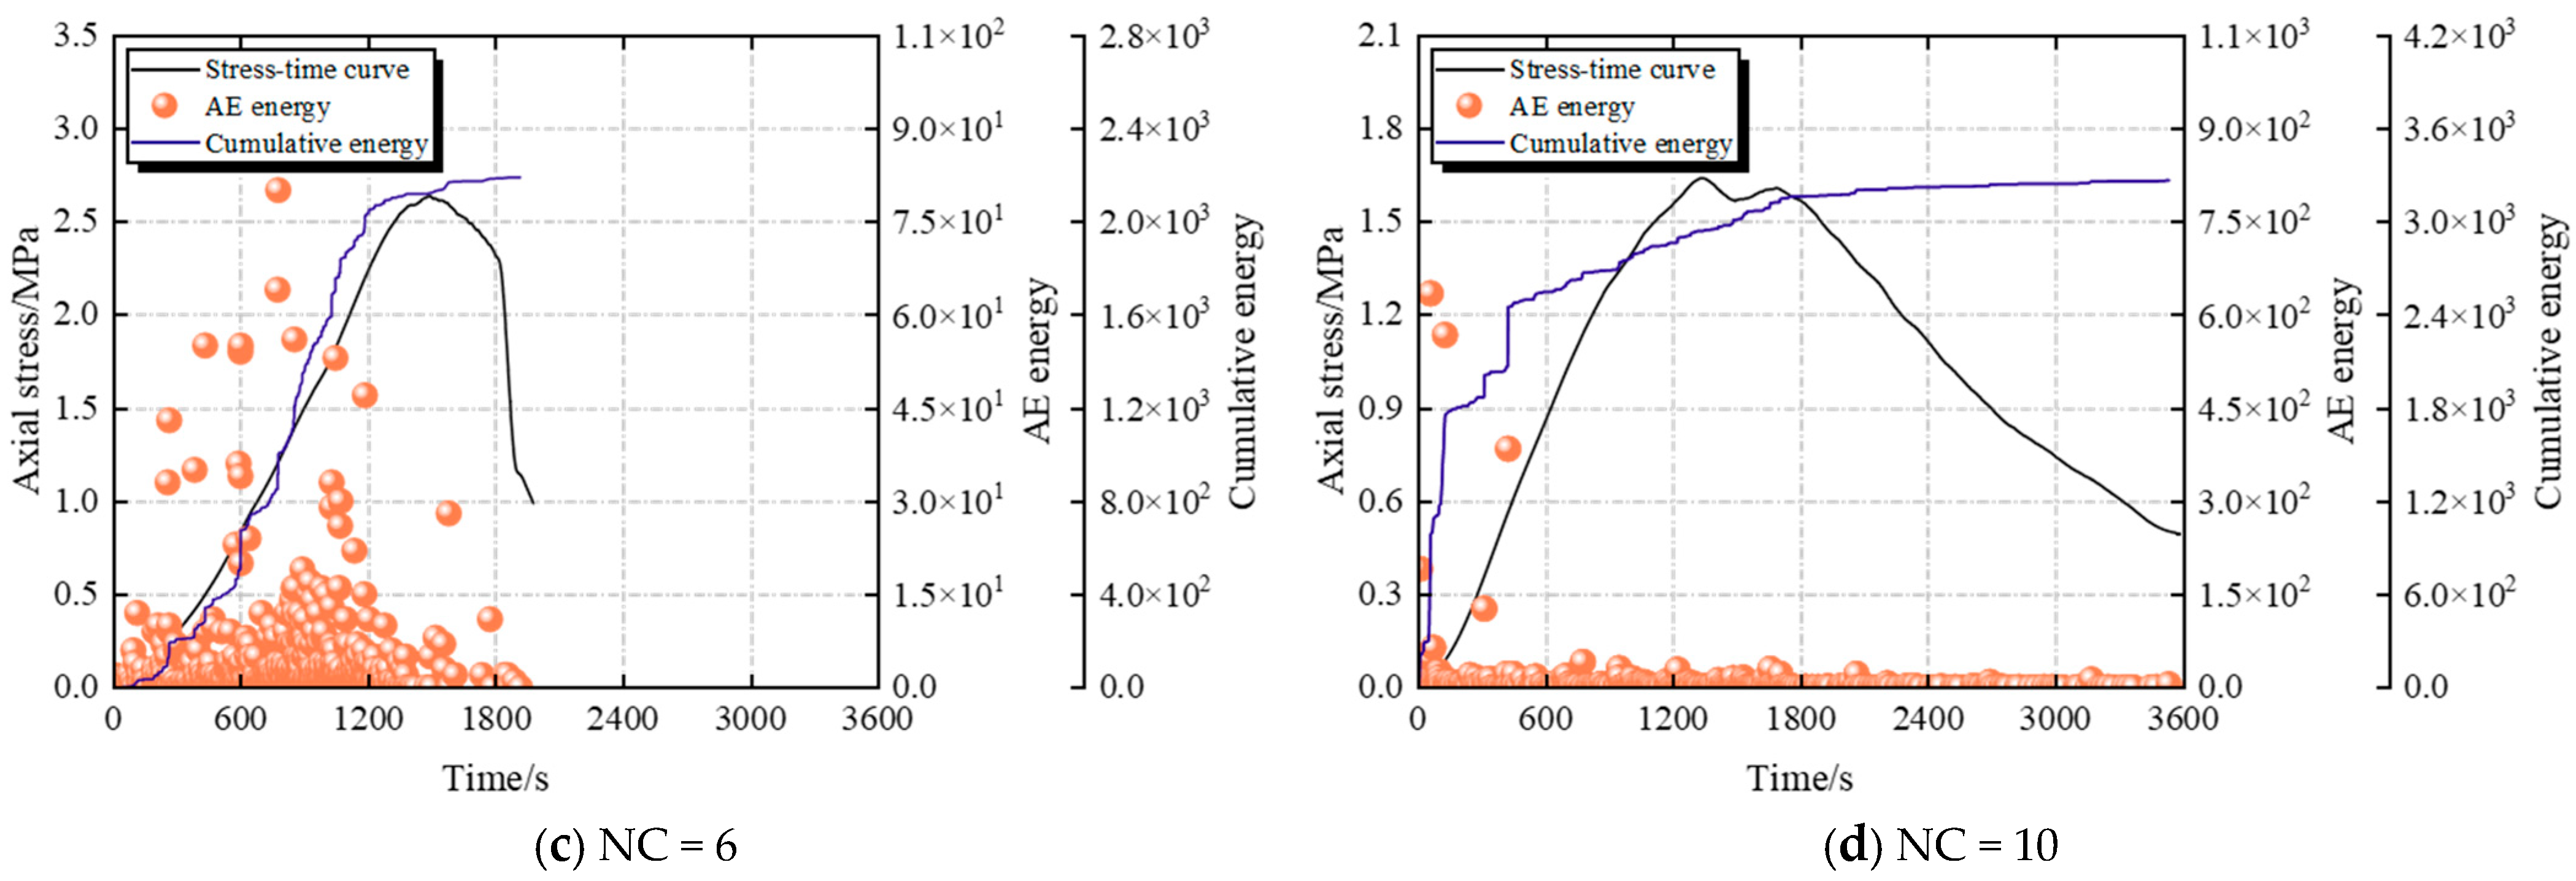
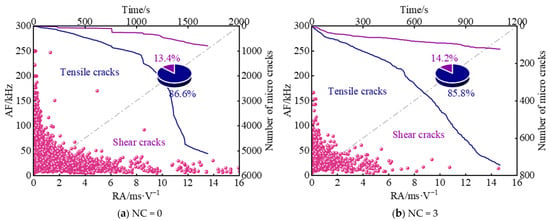
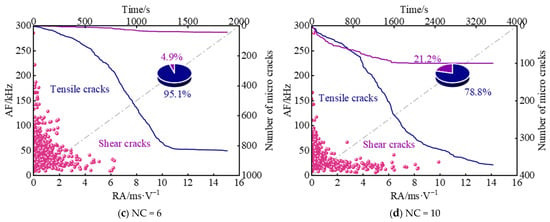
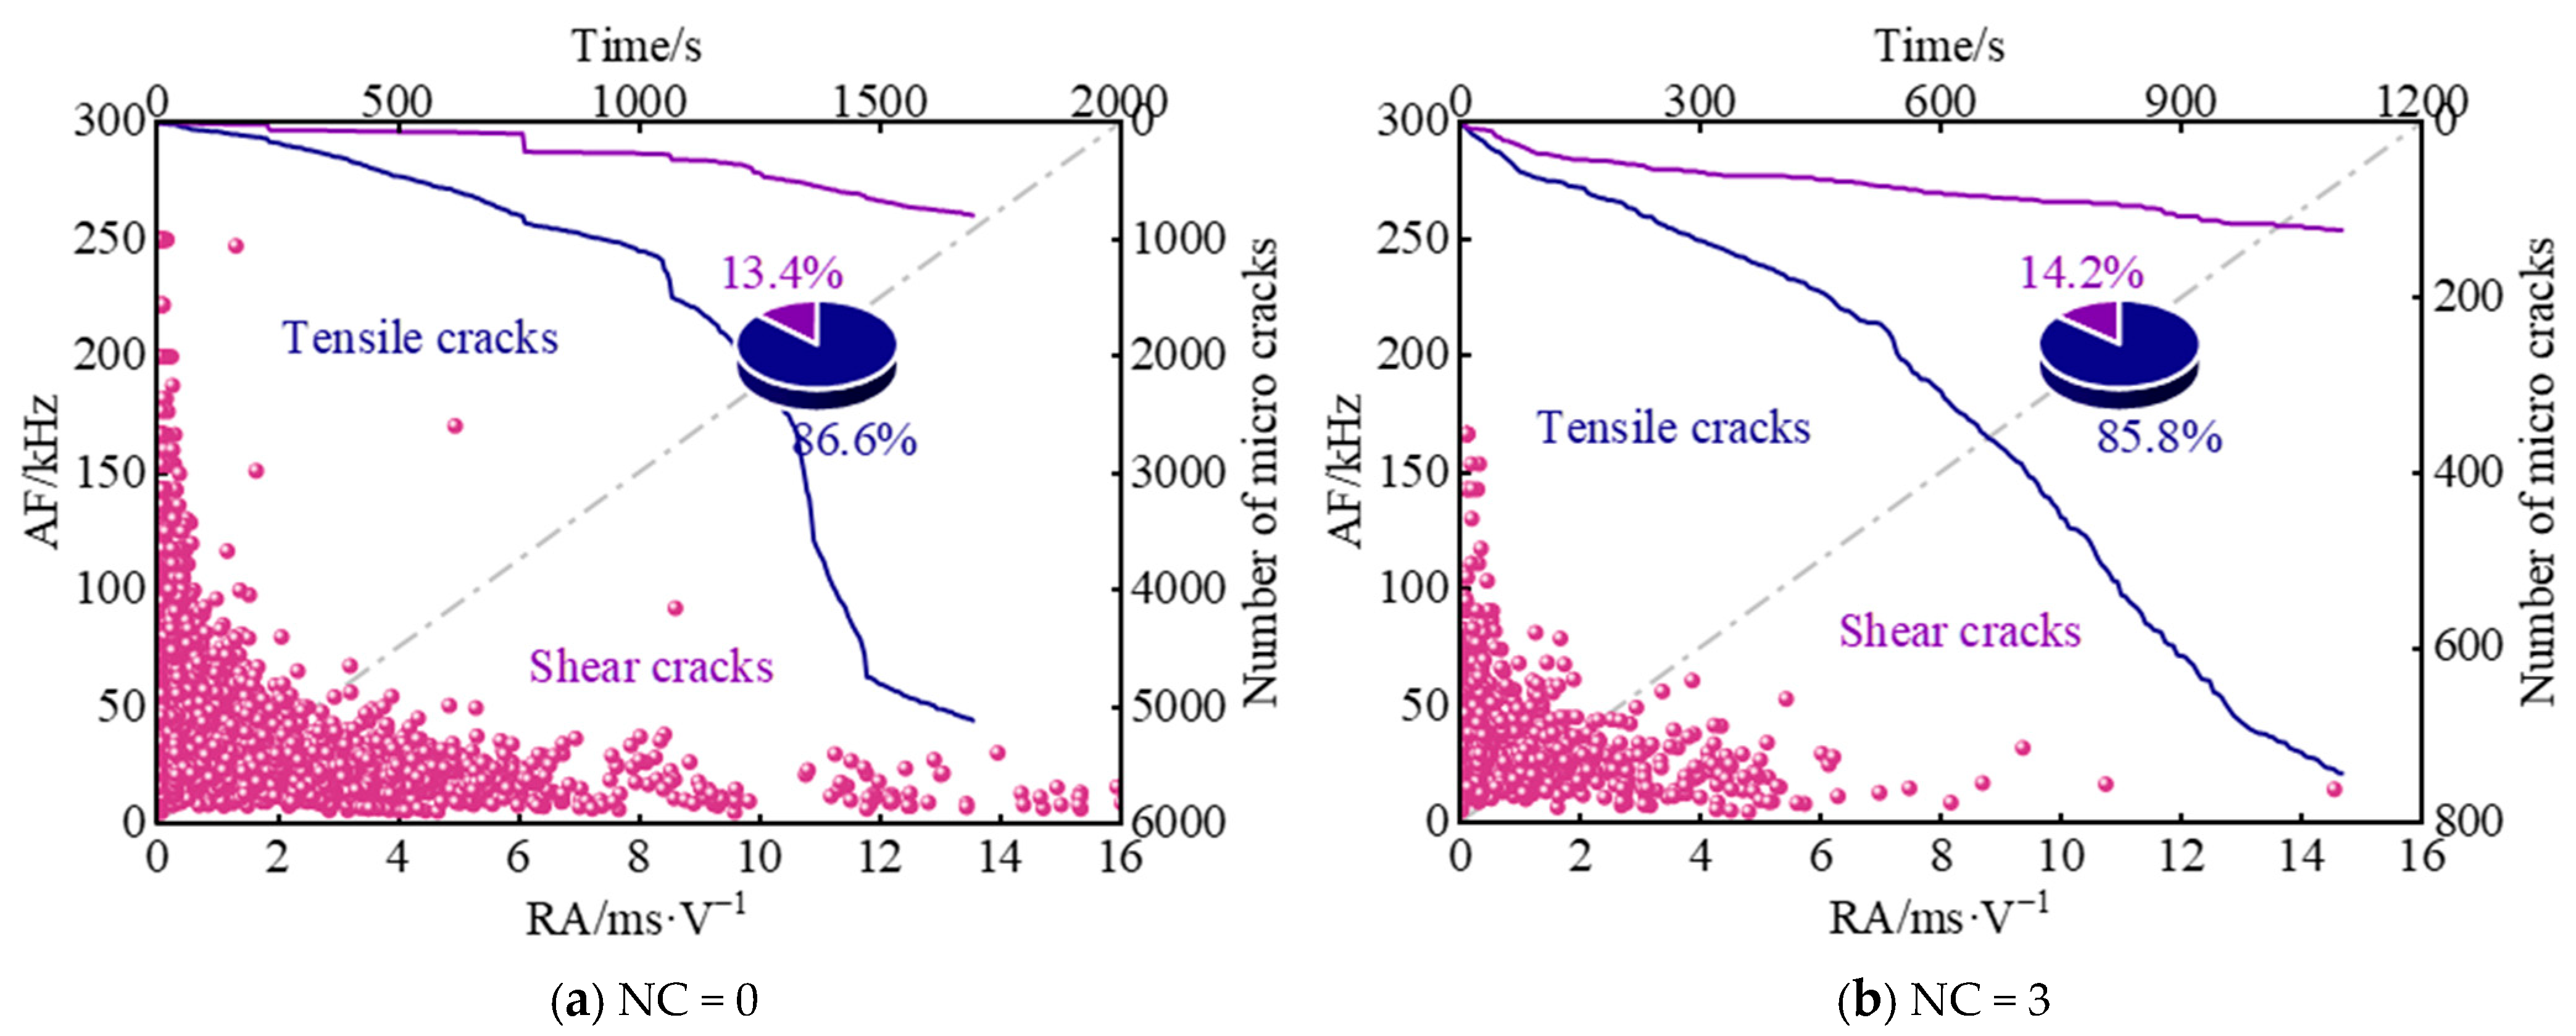
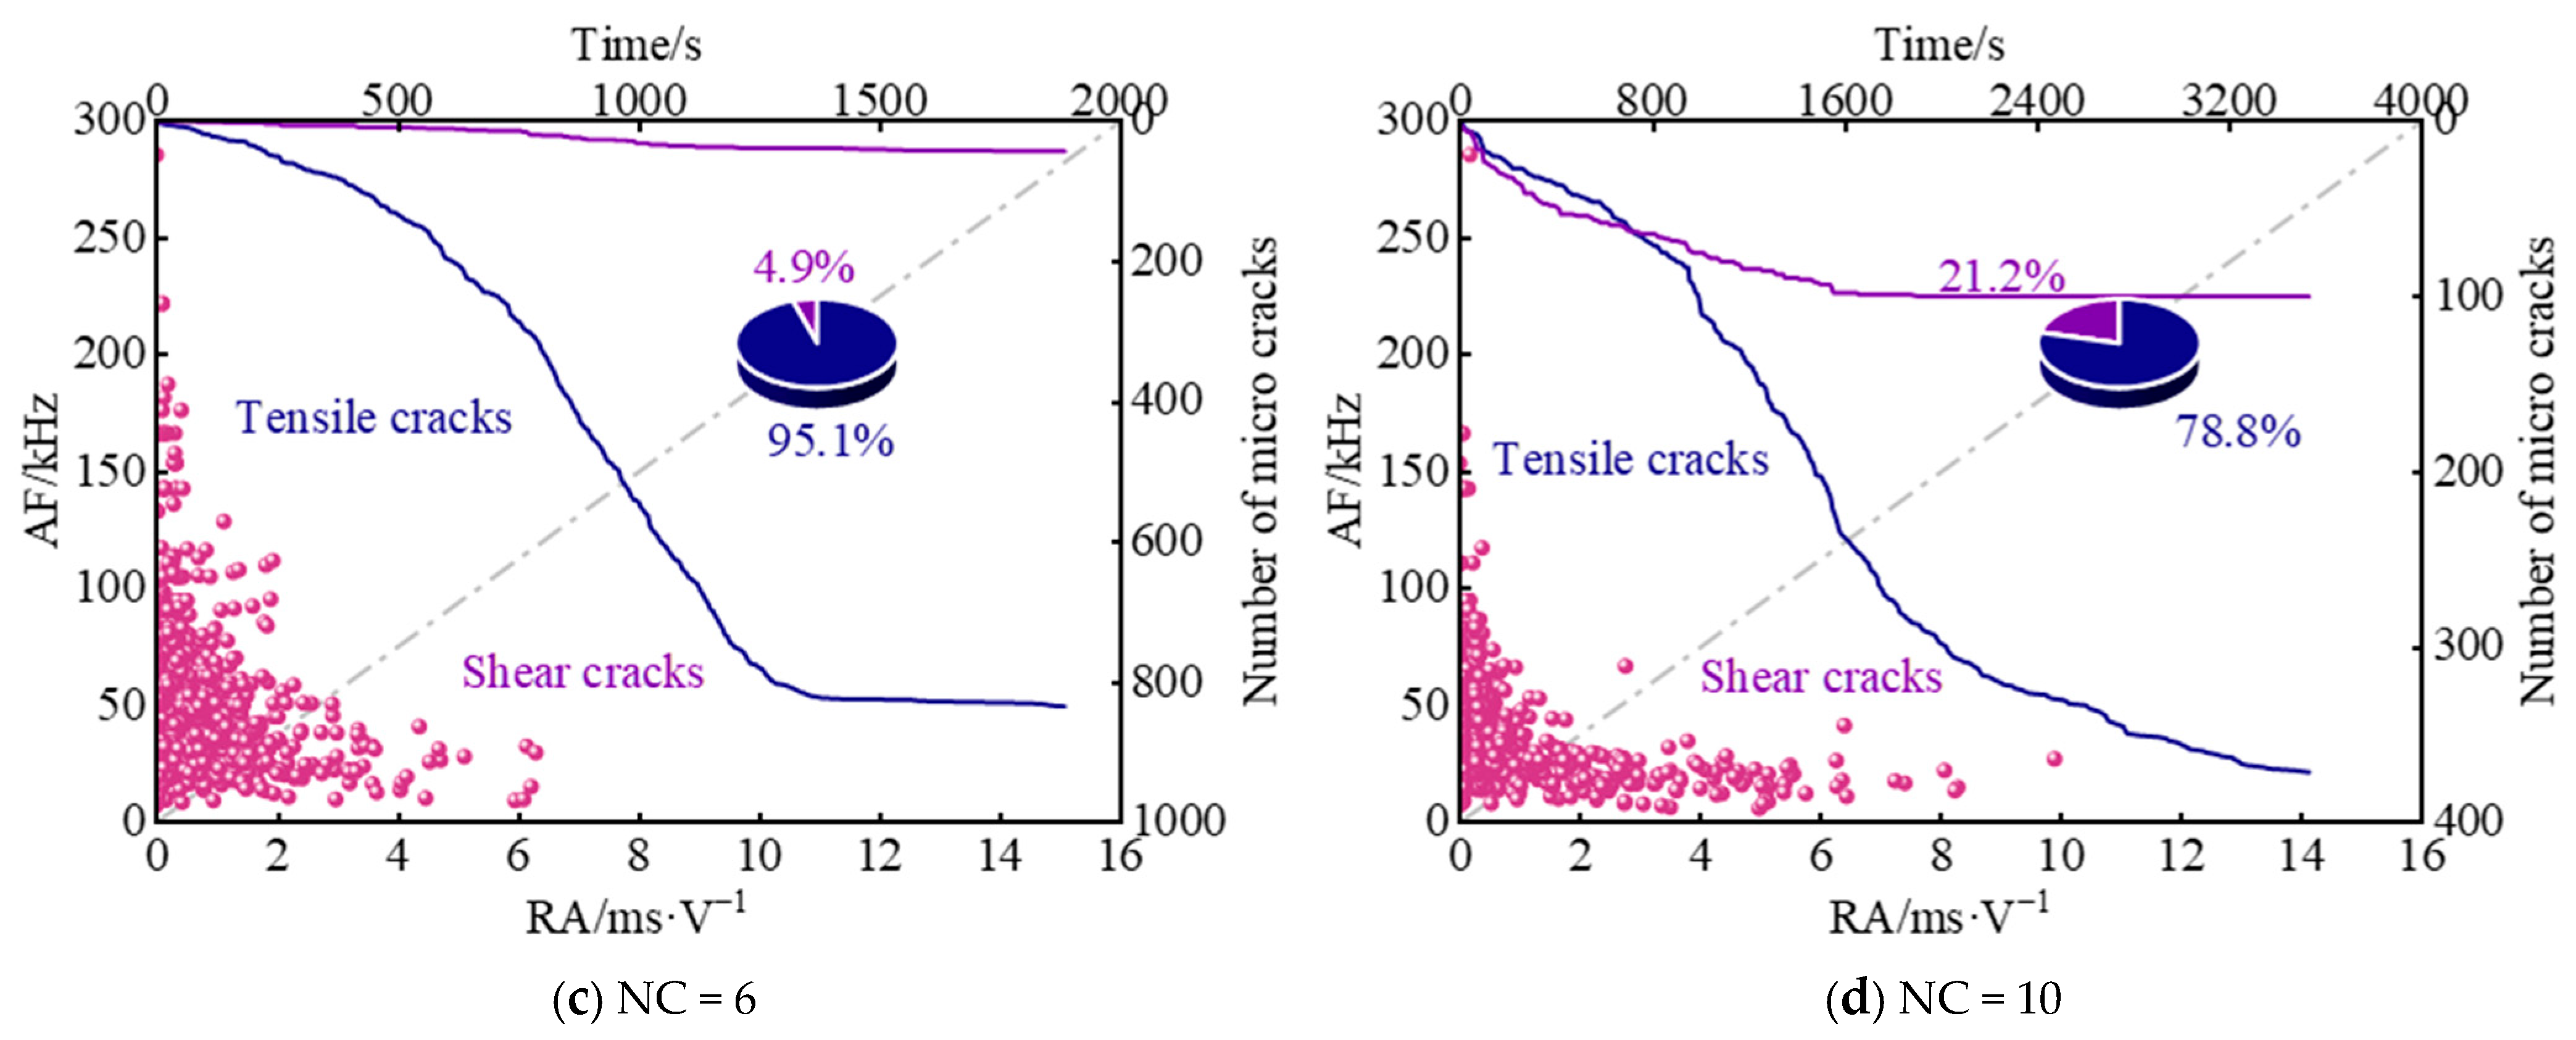
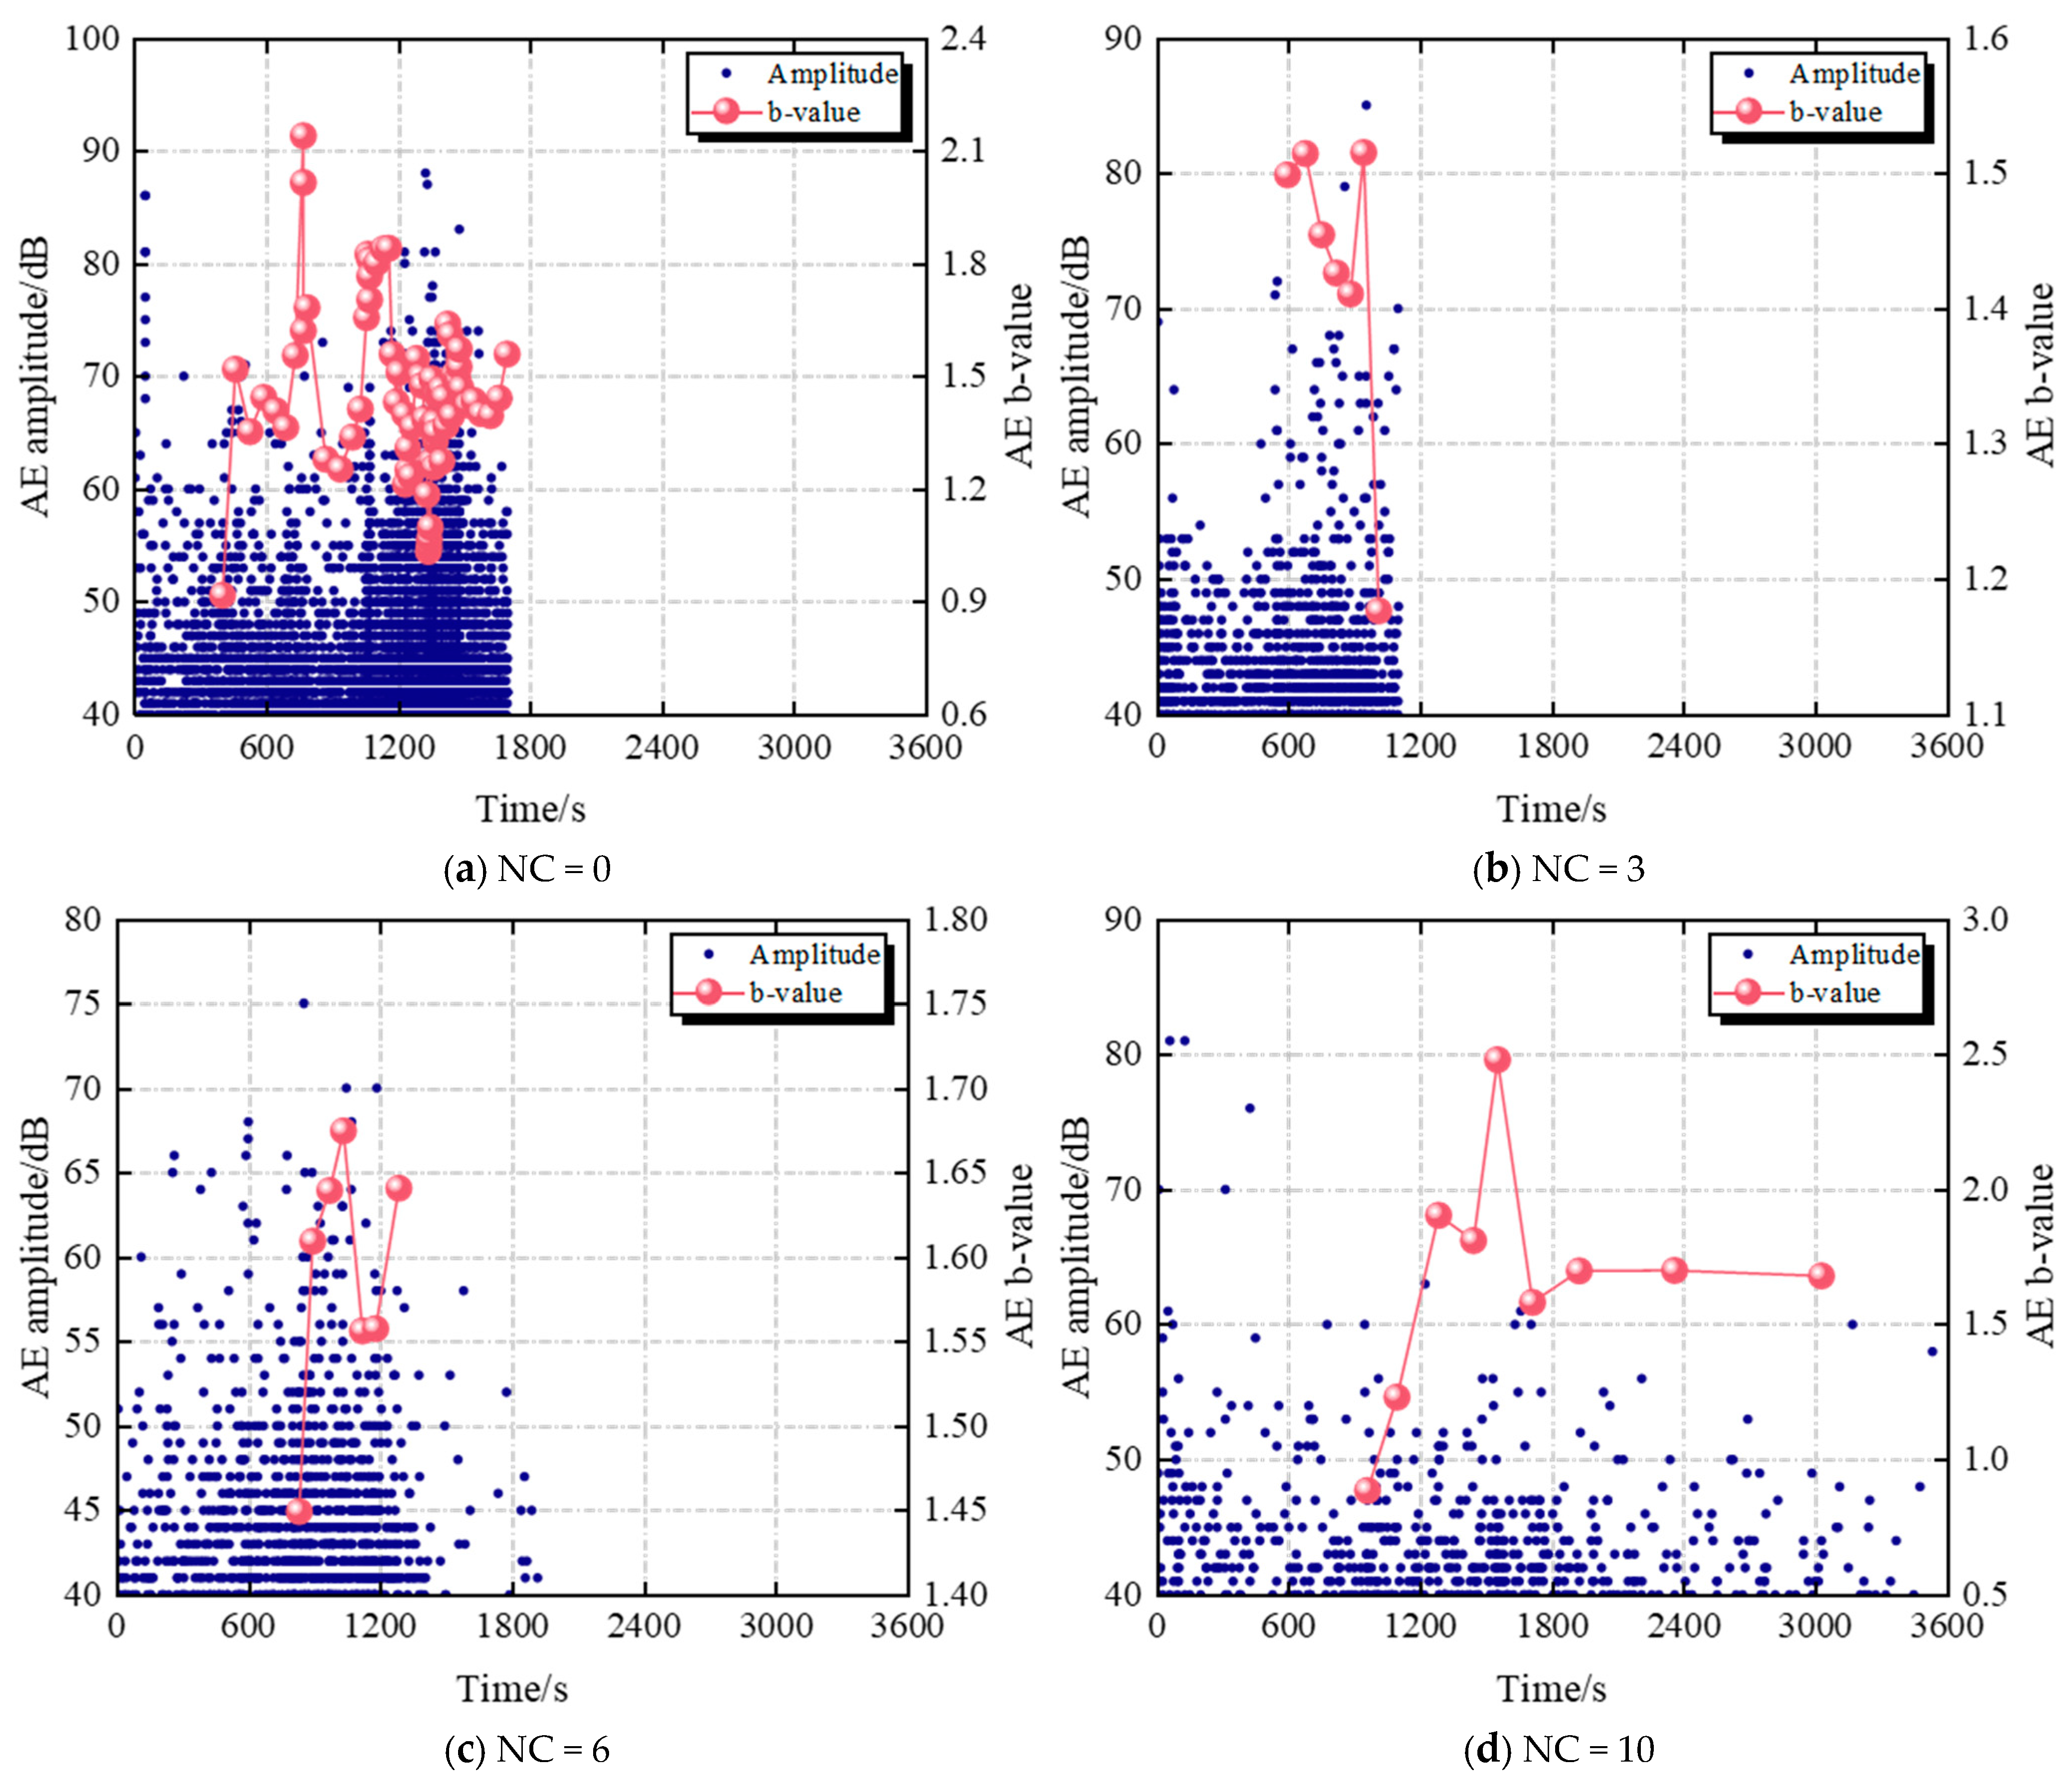
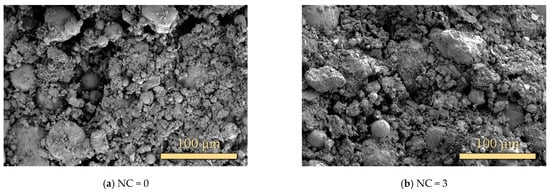
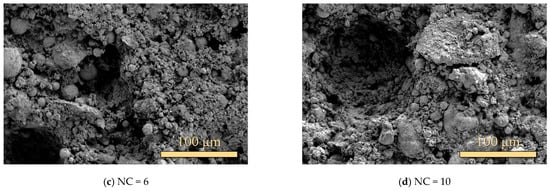
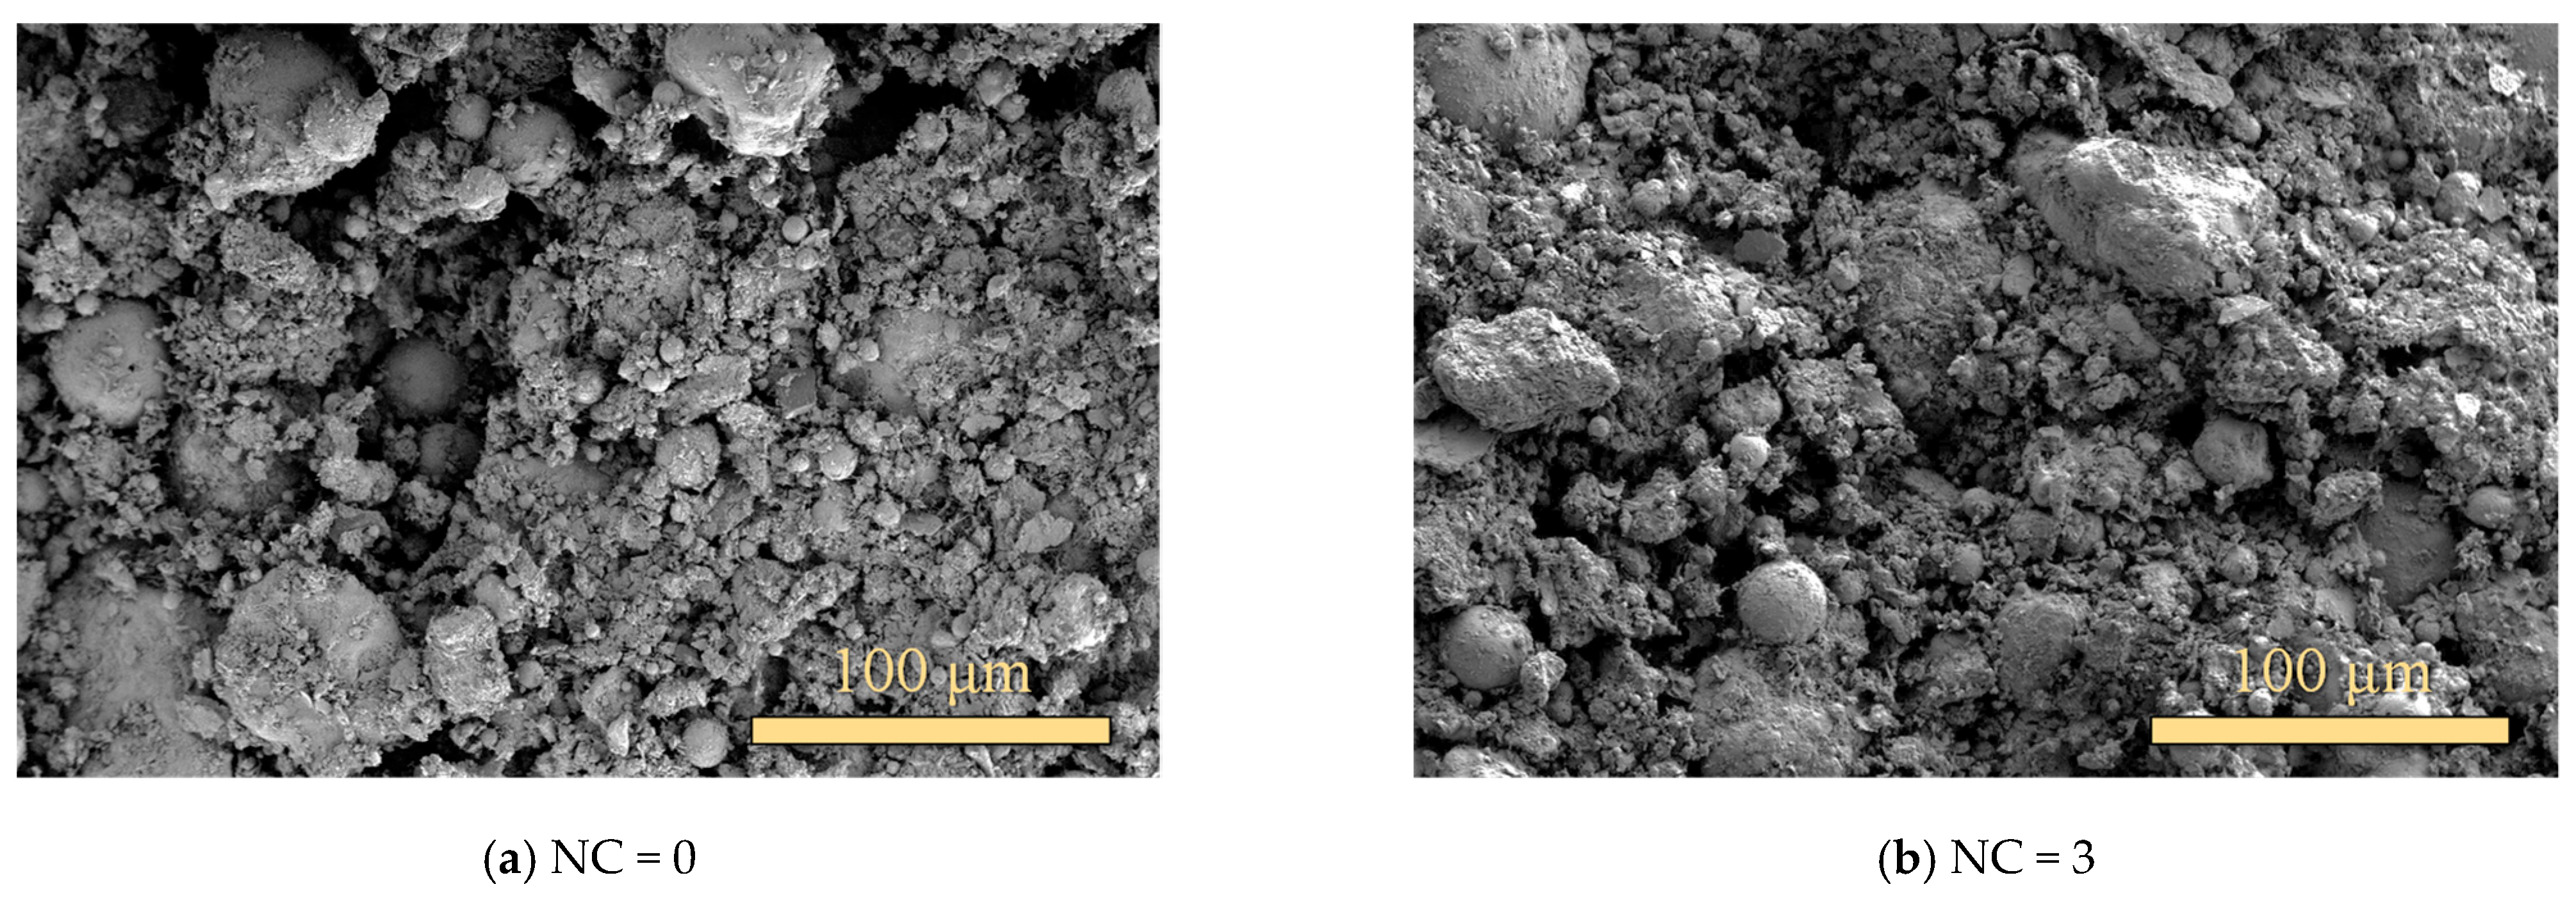
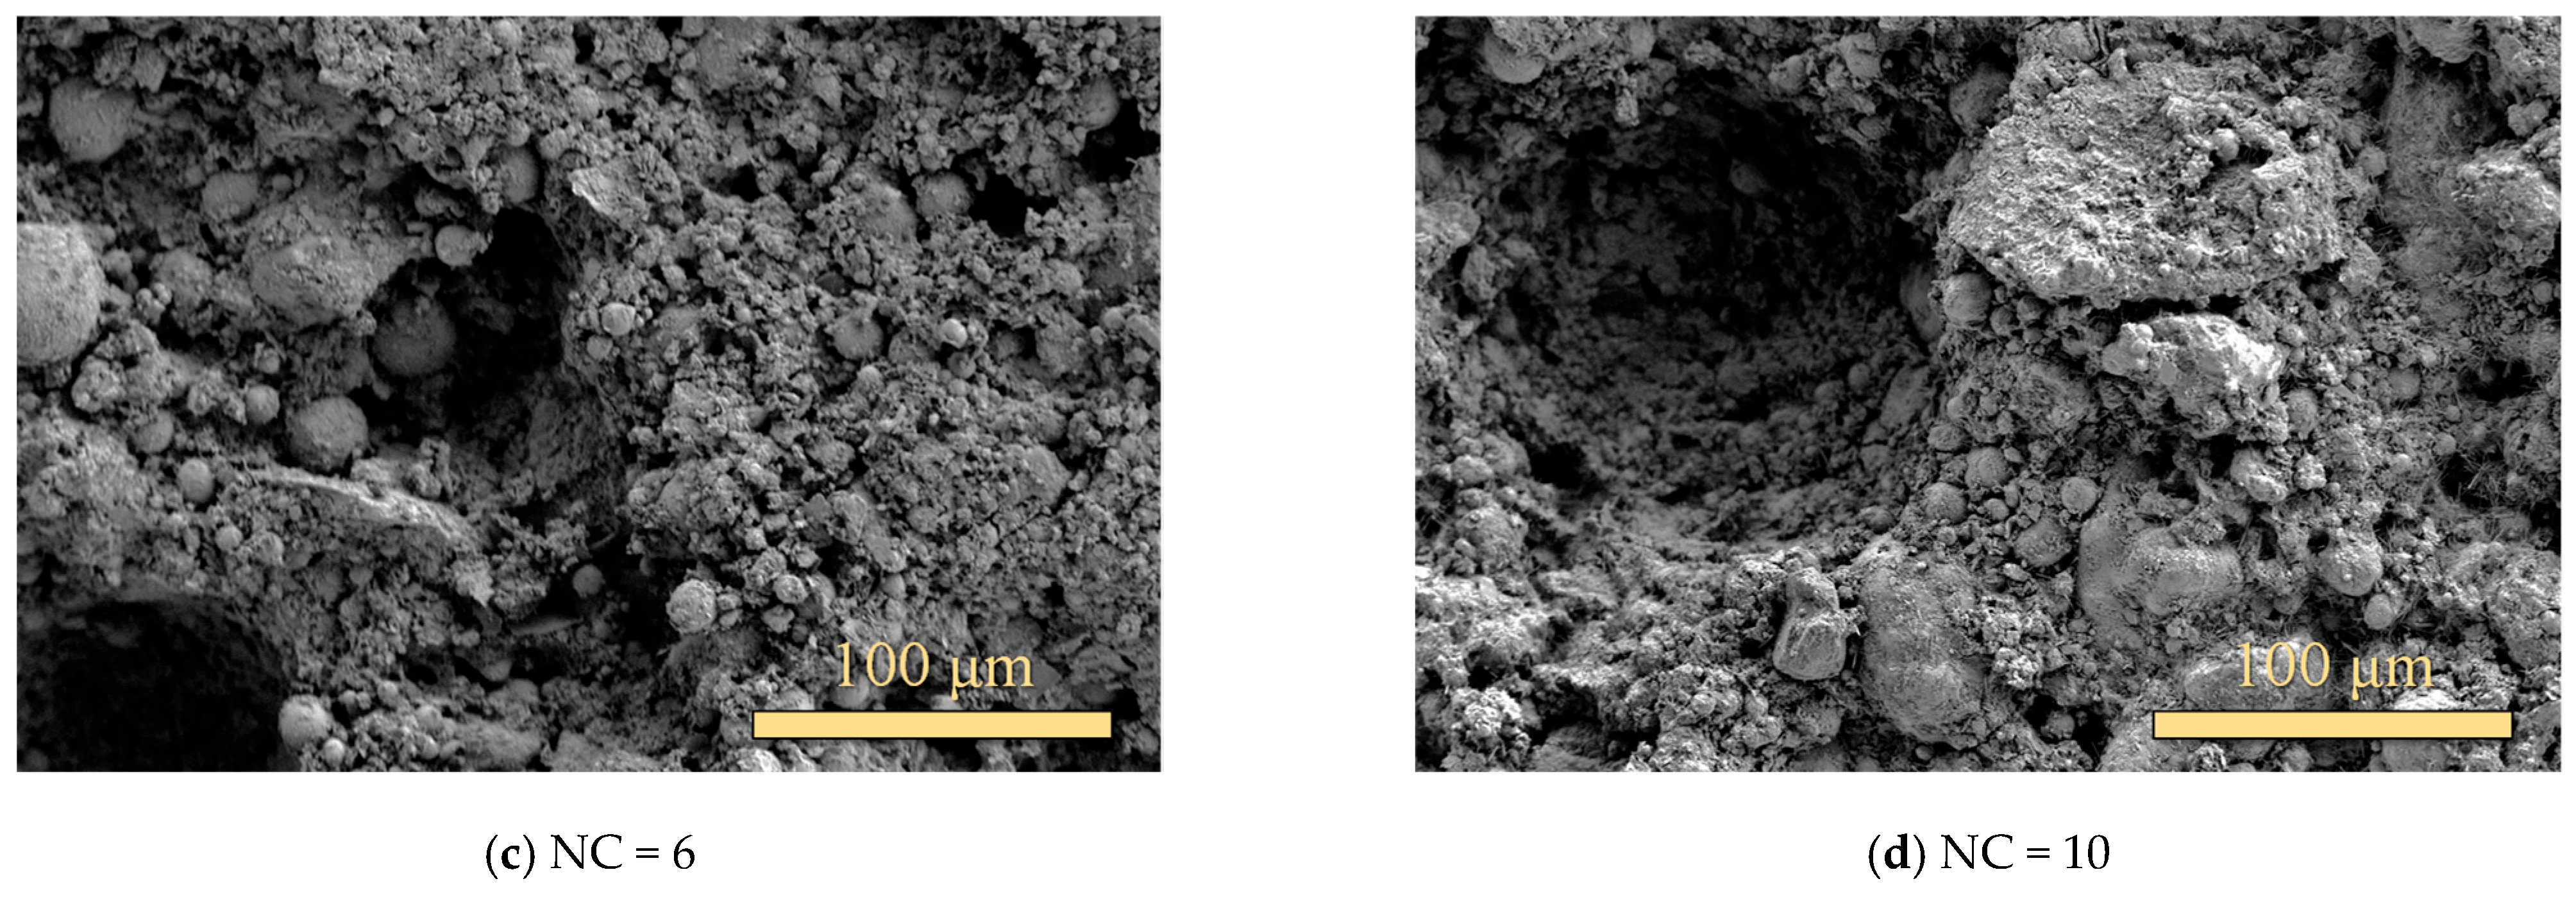
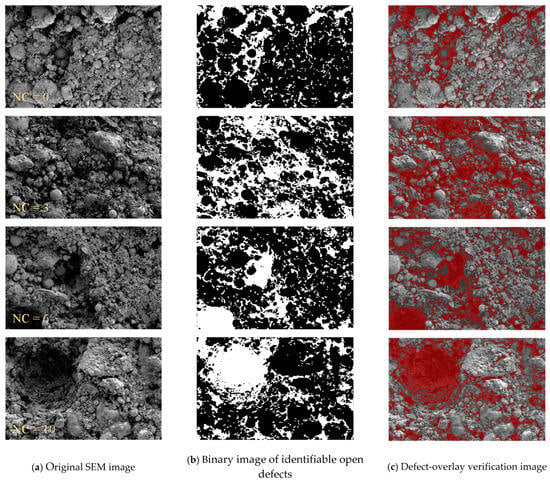
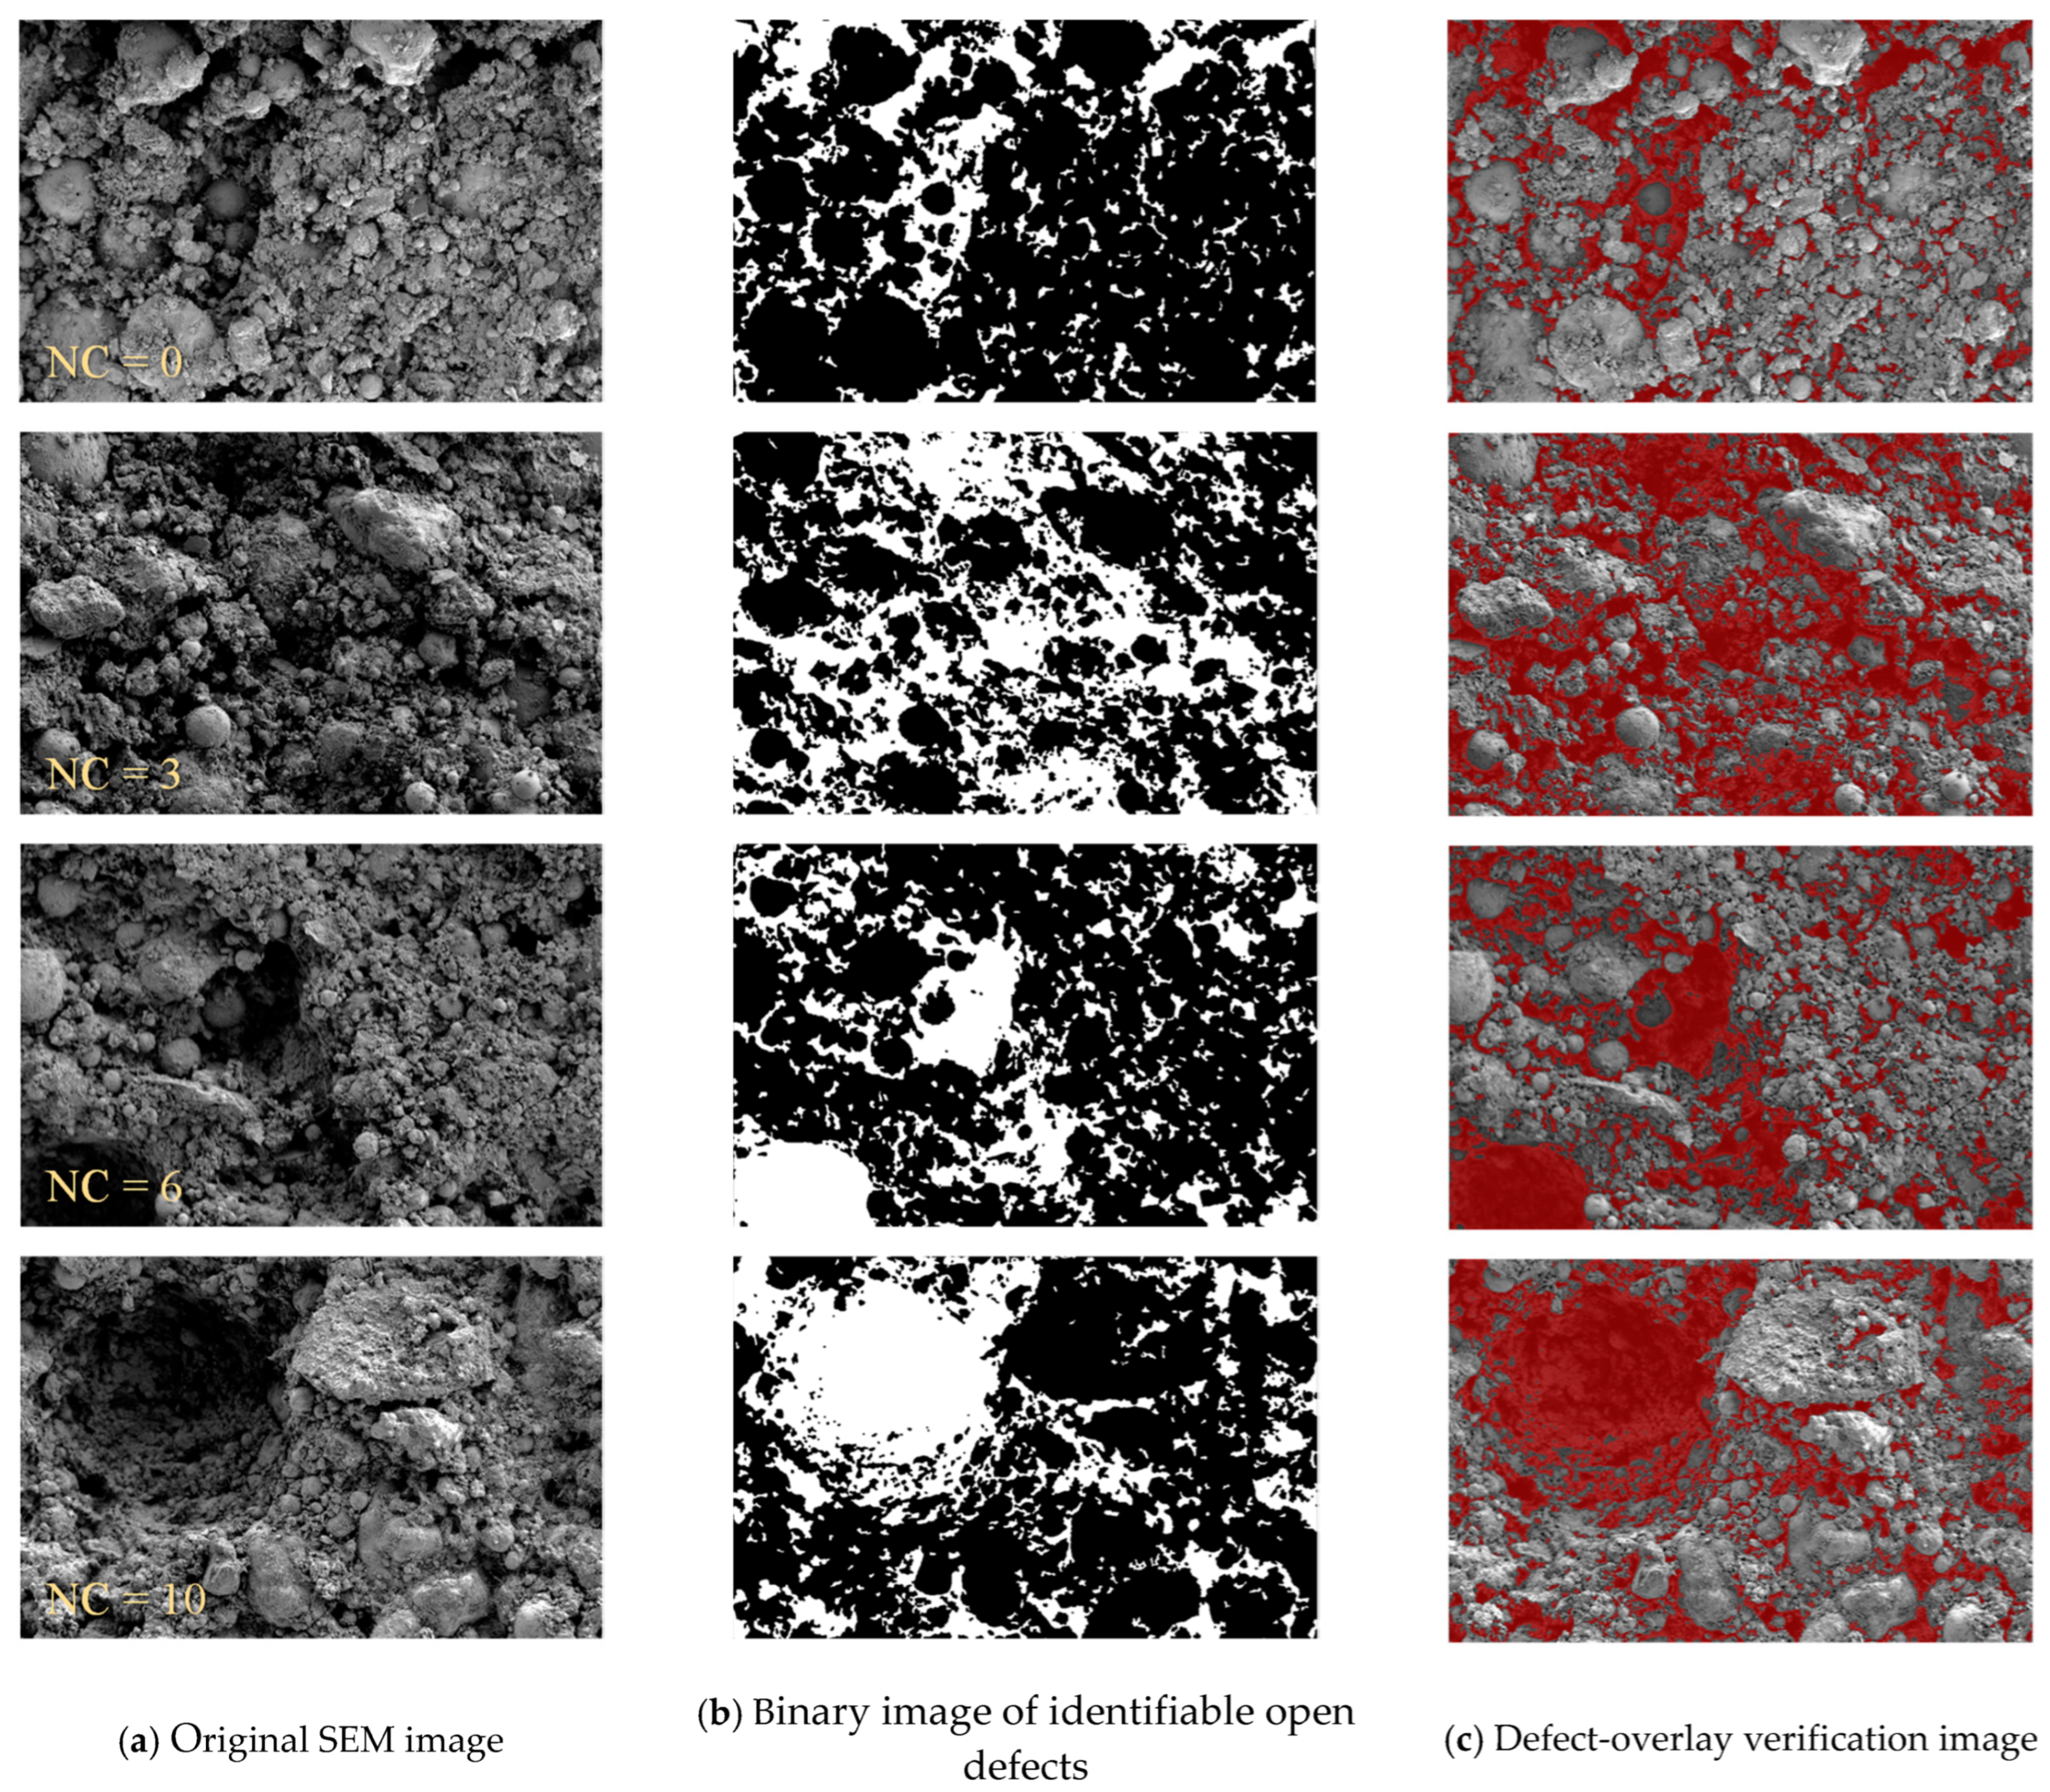
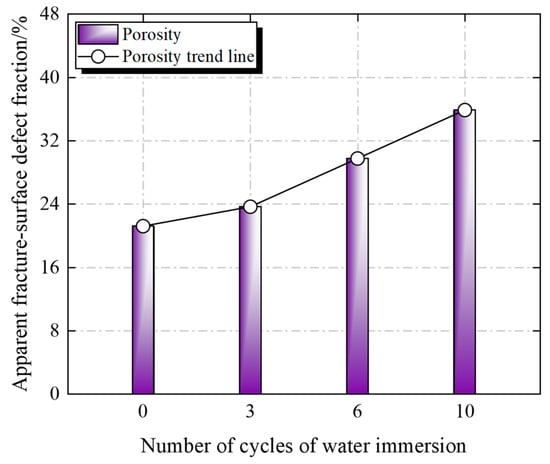
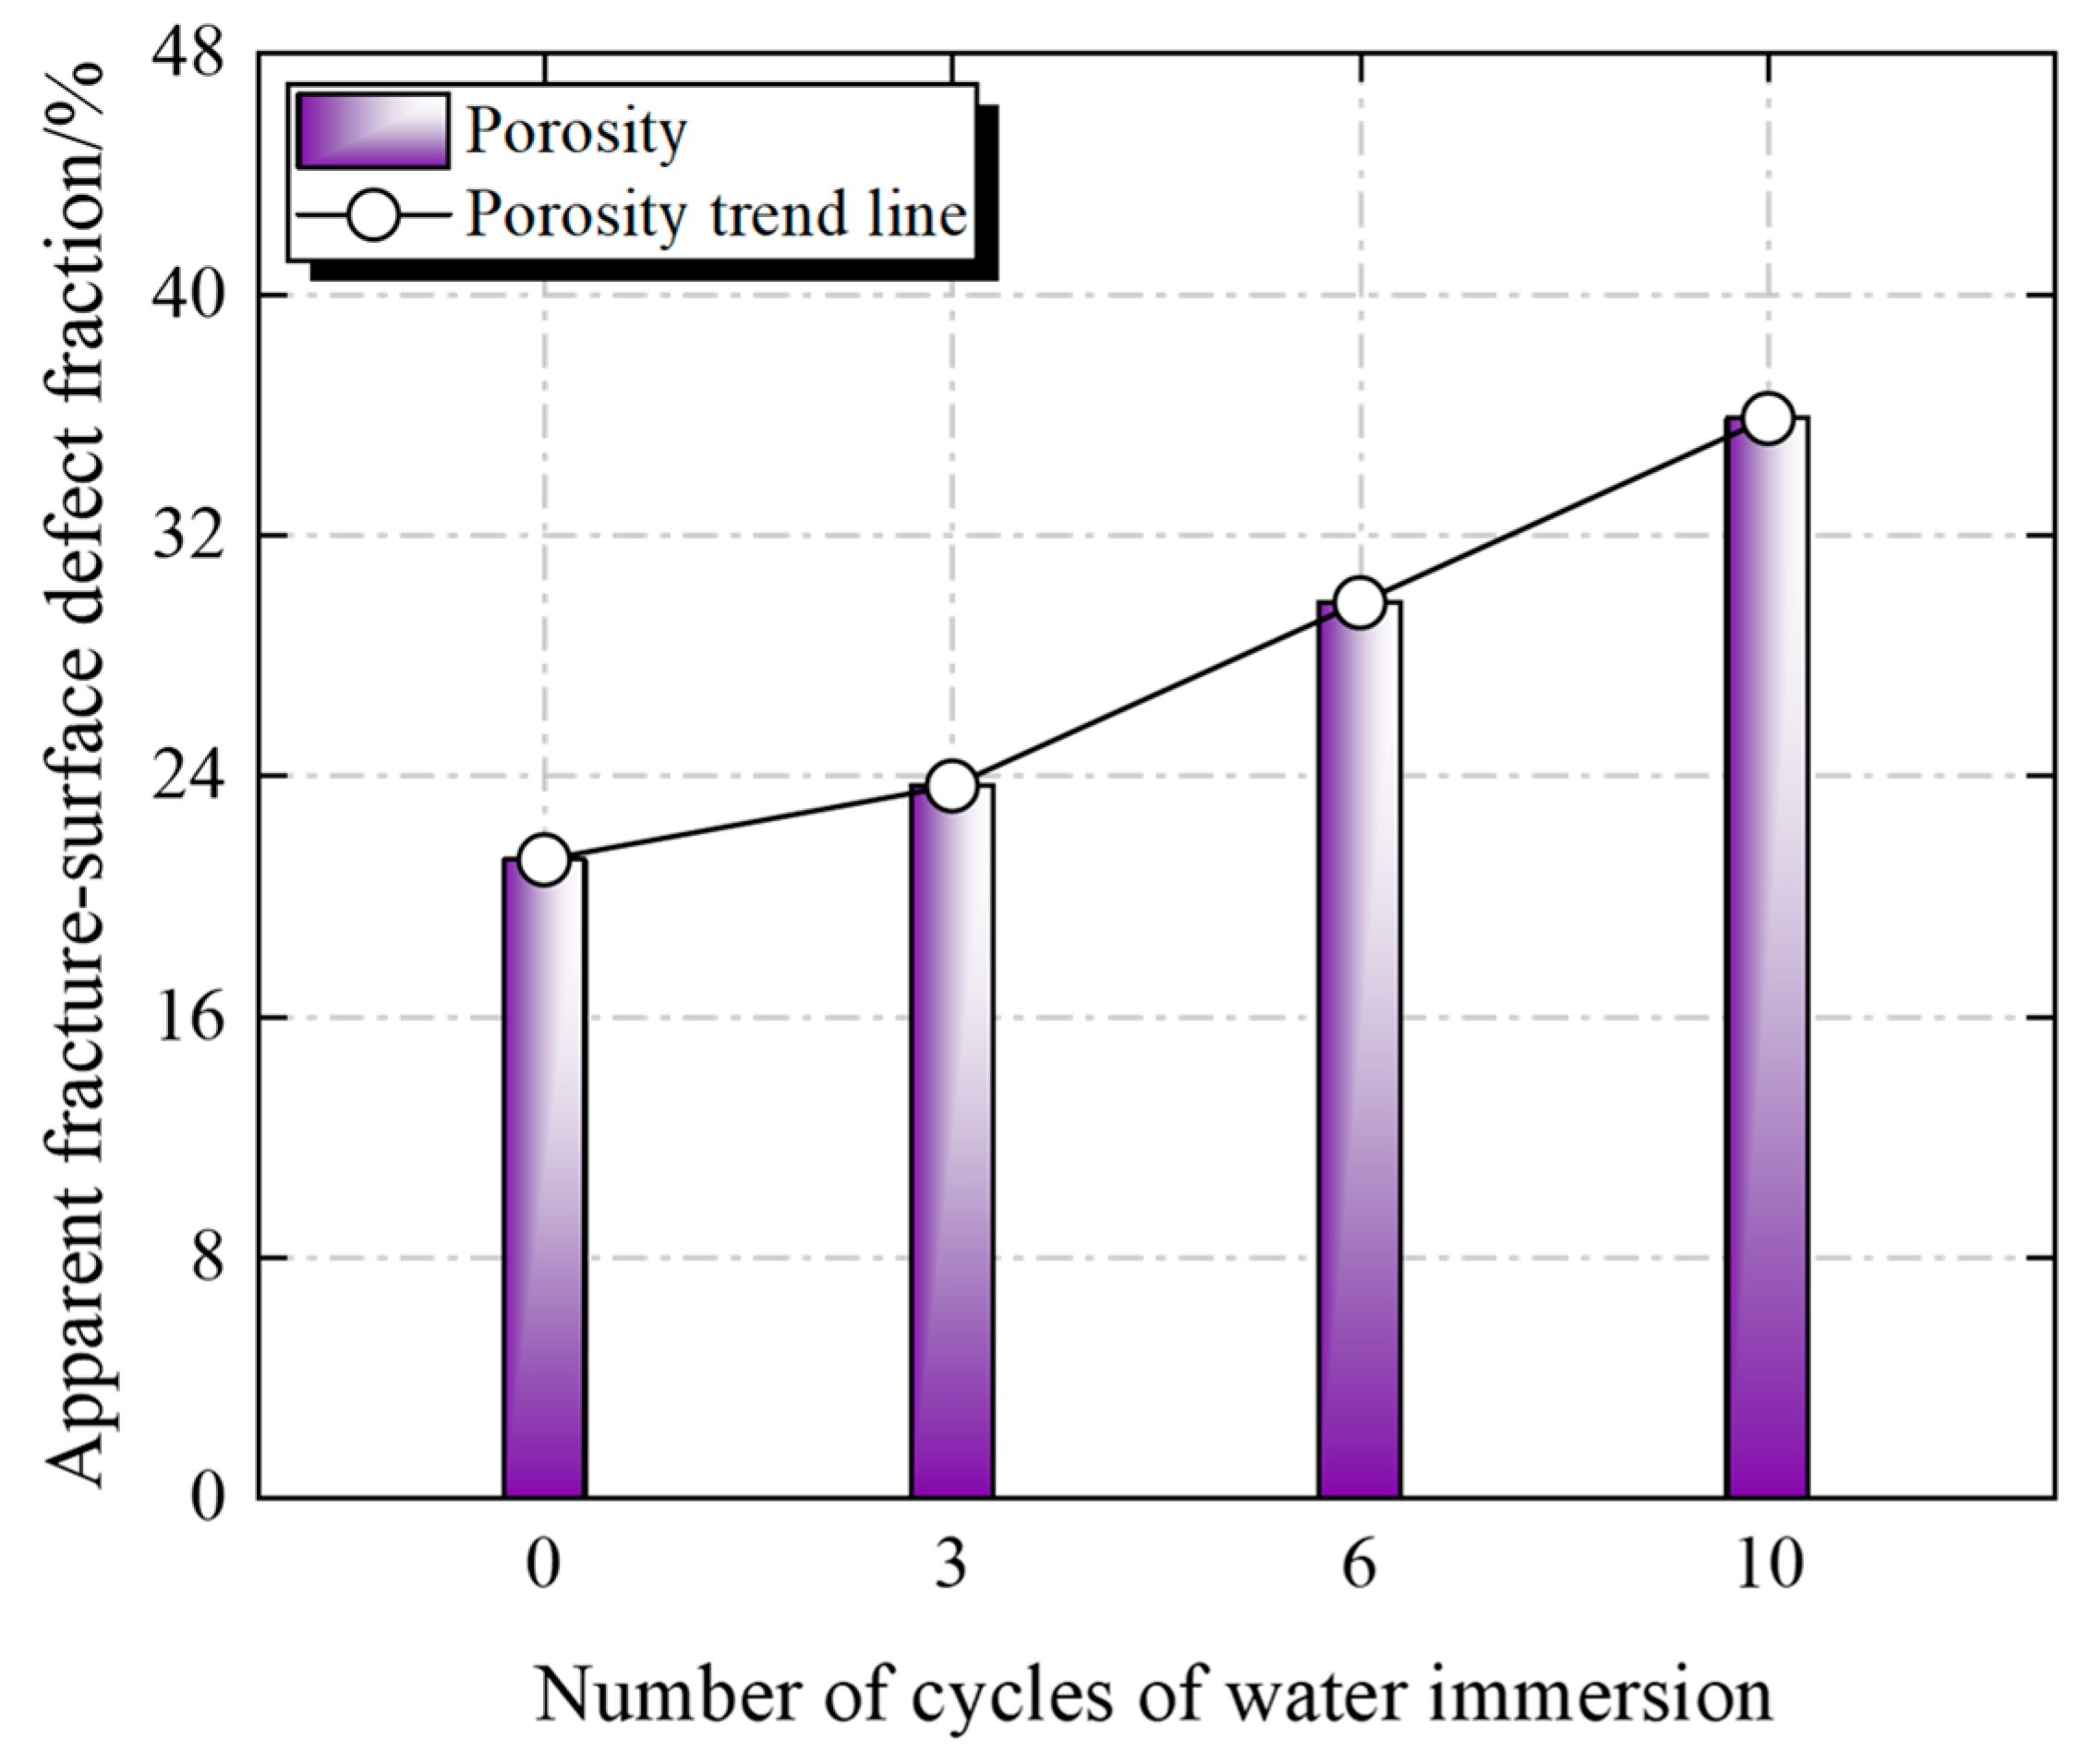
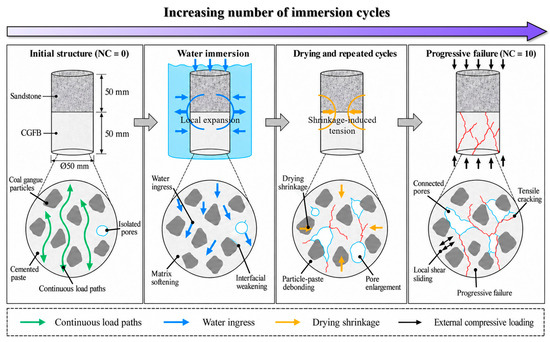
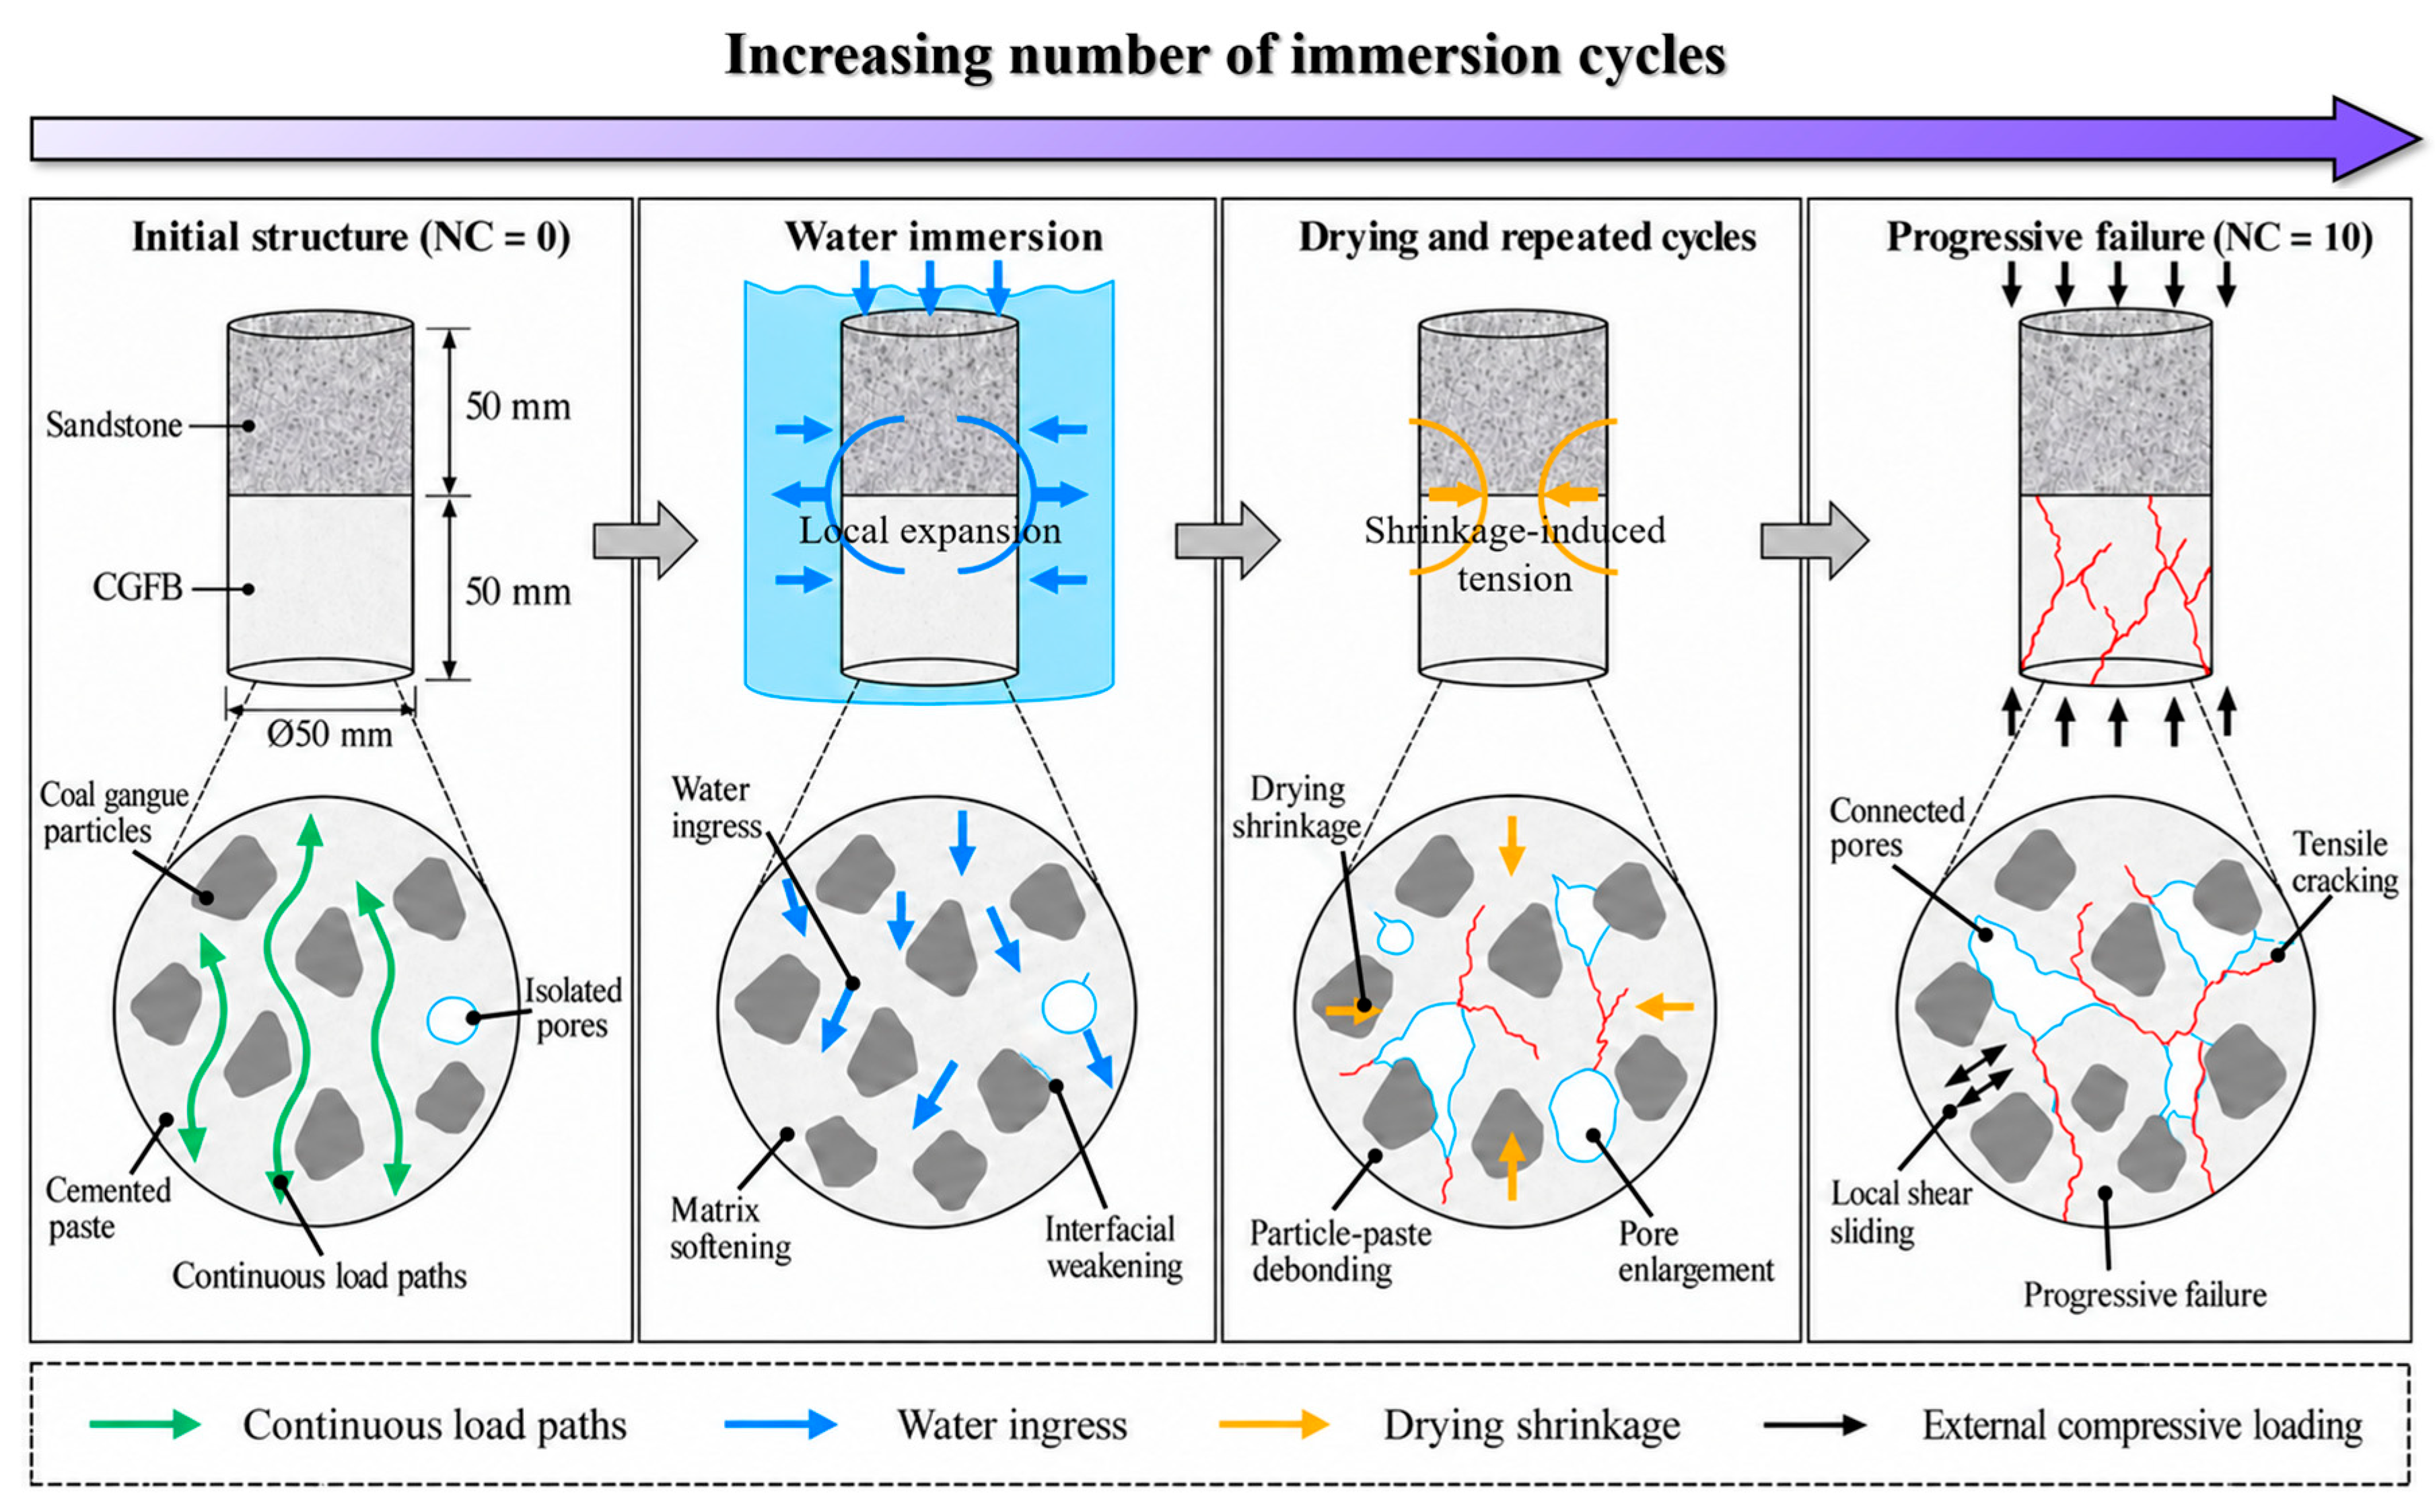

Disclaimer/Publisher’s Note: The statements, opinions and data contained in all publications are solely those of the individual author(s) and contributor(s) and not of MDPI and/or the editor(s). MDPI and/or the editor(s) disclaim responsibility for any injury to people or property resulting from any ideas, methods, instructions or products referred to in the content. |
© 2026 by the authors. Licensee MDPI, Basel, Switzerland. This article is an open access article distributed under the terms and conditions of the Creative Commons Attribution (CC BY) license.